Article

Mineral Physicochemistry Underlying Feature-Based Extraction of Mineral Abundance and Composition from Shortwave, Mid and Thermal Infrared Reflectance Spectra

Mineral Resources Commonwealth Scientific and Industrial Research Organisation (CSIRO), Kensington, WA 6151, Australia
*
Author to whom correspondence should be addressed.
Minerals 2021, 11(4), 347; https://doi.org/10.3390/min11040347
Submission received: 18 February 2021 / Revised: 19 March 2021 / Accepted: 22 March 2021 / Published: 26 March 2021

Abstract

:
Reflectance spectroscopy allows cost-effective and rapid mineral characterisation, addressing mineral exploration and mining challenges. Shortwave (SWIR), mid (MIR) and thermal (TIR) infrared reflectance spectra are collected in a wide range of environments and scales, with instrumentation ranging from spaceborne, airborne, field and drill core sensors to IR microscopy. However, interpretation of reflectance spectra is, due to the abundance of potential vibrational modes in mineral assemblages, non-trivial and requires a thorough understanding of the potential factors contributing to the reflectance spectra. In order to close the gap between understanding mineral-diagnostic absorption features and efficient interpretation of reflectance spectra, an up-to-date overview of major vibrational modes of rock-forming minerals in the SWIR, MIR and TIR is provided. A series of scripts are proposed that allow the extraction of the relative intensity or wavelength position of single absorption and other mineral-diagnostic features. Binary discrimination diagrams can assist in rapidly evaluating mineral assemblages, and relative abundance and chemical composition of key vector minerals, in hydrothermal ore deposits. The aim of this contribution is to make geologically relevant information more easily extractable from reflectance spectra, enabling the mineral resources and geoscience communities to realise the full potential of hyperspectral sensing technologies.

1. Introduction

Minerals produce diagnostic features across the visible and infrared part of the electromagnetic spectrum. Reflectance spectra measured from geological materials such as rocks and soils contain spectral signatures or “fingerprints” of their constituent minerals and other components and properties, from which can be derived information including mineral species, abundance, chemistry and crystallinity. As this contribution aims to summarise the absorption features of minerals independent of instrument specifications, the respective vibrational modes are described in the following wavelength ranges (Figure 1): (i) SWIR 1 = 1300 to 1850 nm, (ii) SWIR 2 = 1850 to 2600 nm, (iii) MIR = 2600 to 5500 nm and (iv) TIR = 5500 to 15,000 nm. The classification of these wavelength ranges is slightly different to the commonly used ones but is based on the clusters of vibrational modes related to the physicochemistry of minerals rather than instrument limitations and measurement constraints. The SWIR 1 is dominated by the first overtones of hydroxyl-related stretching fundamentals, whereas the OH combination bands of fundamental stretching and bending vibrations as well as CO3-related overtones and combinations of stretching fundamentals dominate the SWIR 2 (Figure 1; [1]). The MIR wavelength range features a multitude of hydroxyl-related stretching fundamentals as well as overtones and combinations of many fundamental vibrational modes of C-O, B-O, S-O, P-O and Si-O bonds, which occur in the TIR.
The relative intensity of the respective absorption features increases with the relative abundance of the respective bond causing the vibrational mode [1]. The full width at half minimum or maximum (FWHM) of absorption features increases with decreasing crystallinity of minerals, as the bond lengths vary more in poorly ordered crystal structures. In specific examples, such as kaolin group minerals, the relative intensity of single absorption bands is related to the crystallinity [2]. The estimation of kaolinite abundance and crystallinity is important for a variety of mineral deposit types, as its presence can reduce the value of bulk commodities (e.g., iron ore) or can be detrimental for ore processing (e.g., flotation and comminution in porphyry copper deposits). The wavelength position of an absorption feature in the SWIR to TIR predominantly relates to the chemical composition of a given mineral [3].
The above characteristics of absorption features—and, therefore, characteristics of minerals—can be extracted from reflectance spectra by means of band ratios or polynomial fitting. These methods can be applied to laboratory (e.g., Fourier Transform Infrared; FTIR), field (e.g., handheld spectrometers and portable FTIRs), drill core and airborne spectrometers (e.g., line profiler and imaging systems), as well as spaceborne instruments [4,5,6]. The major absorption features of rock-forming minerals across the SWIR to TIR wavelength ranges are summarised in Figure 1.
Reflectance spectroscopy has been successfully used in the resources sector and in earth and planetary science since the middle of the 20th century [7]. Farmer (1974) [8] provides an excellent summary of the infrared-active vibrational modes of rock-forming minerals, focusing on the fundamental vibrations of the respective bonds in the 2600 to 20,000 nm wavelength range (MIR to TIR). Many publications describe the absorption features of minerals in the visible near (VNIR) and SWIR wavelength ranges that are frequently collected by airborne and spaceborne sensors [1,4,9,10,11,12,13]. A comprehensive overview of the crystal field absorption of a wide range of minerals can be found in Burns (1993) [14].
A significant amount of excellent literature about the absorption features of rock-forming minerals uses the frequency space (i.e., cm−1) instead of wavelengths (e.g., nm or μm) [15,16]. For clarity, it was decided to provide most band assignments in this contribution in nm, which is the most commonly used unit in the mineral resources sector.
One of the major missed opportunities in applying reflectance spectroscopy in mineral exploration and mining has been a lack of appreciation of the fundamental spectroscopic and physicochemical processes causing observed absorption bands and their wavelength positions and shapes. In addition, there is a constant need to update “traditional” understandings as new data come to hand. This paper attempts to address these knowledge gaps and update current thinking to drive more robust applications—for example, of vector minerals—that potentially could have financial consequences. For example, the commonly used short-form, working acronyms of “AlOH”, “FeOH” and “MgOH” for groups of major absorption features centred at around 2200 nm, 2250 nm and 2350 nm, respectively, are overly simplistic and can be misleading, as the presence and wavelength position of each of these absorption features are controlled by a variety of cations potentially bonded to the OH-groups. Both the “FeOH” and “MgOH” absorptions are due to combinations of hydroxyl-related stretching and bending fundamentals, whereof the exact wavelength position can be controlled by the MgFe−1 exchange vector (e.g., in the case of chlorite; [17,18]). Furthermore, the ~2350-nm “MgOH” band overlaps significantly with 3ν3CO3 [19] (see Figure 1 for functional group notations), a prominent absorption feature of carbonates such as calcite in the SWIR, which is centred between 2300 nm and 2340 nm. Many other challenges, such as surface contaminants (e.g., sulphate crusts forming on stored drill core material), moisture content in sample material and measurement environment, as well as contaminated calibration panels, further complicate the interpretation of reflectance spectra. Carefully followed measurement procedures, well calibrated instruments and consideration of surface and environmental impacts on spectroscopic reflectance measurements are, therefore, indispensable [6].
The main aims of this paper are to (1) review the literature and provide an up-to-date overview of the major vibrational modes of rock-forming minerals that are active in the SWIR, MIR and TIR wavelength regions, and (2) provide a list of feature extraction scripts that can be used to trace them, including the theory behind the extraction method. The first part of this work focuses on absorption features that are displayed in the reflectance spectra of rock-forming minerals as well as indicator minerals important for the mineral resources sector. The second part of this contribution describes the underlying methods for extracting the relative intensity, wavelength position, FWHM or asymmetry, as well as the background removal that must be applied to reflectance spectra prior to using feature extraction scripts.
Figure 1. Reflectance spectra of major rock-forming minerals in the 380 to 14,500 nm wavelength region (26,315 to 690 cm−1) and wavelength coverage of commonly used hyperspectral proximal and remote sensing instruments modified after [6]: field spectrometers (e.g., FieldSpec/TerraSpec, Malvern Panalytical; SR-6500, Spectral Evolution), handheld FTIRs (e.g., Agilent 4300), drill core line profilometers (e.g., HyLogger3, [20]), drill core imaging instruments (e.g., HCI3/HCI4, Corescan Pty Ltd.; FENIX/OWL, Specim, Spectral Imaging Ltd.; HySpex SWIR-320m, Norsk Elektro Optikk), conveyor belt scanners (e.g., QualitySpec, Malvern Panalytical), VNIR-SWIR airborne hyperspectral sensor (e.g., HyMap, HyVista Corporation; CASI/SASI ITRES Research Ltd.; AVIRIS (NASA-JPL)); MIR/LWIR/TIR airborne hyperspectral (e.g., OWL, Specim, Spectral Imaging Ltd.; MASI/TASI ITRES Research Ltd.); spaceborne hyperspectral sensor (e.g., PRISMA, [21]; EnMAP, [22]). Top left reflectance spectra were collected using a FieldSpec3. Top middle and top right reflectance spectra were collected using an Agilent handheld FTIR. Minerals from top to bottom are: quartz (LB1; pulverised; Lucky Bay, Western Australia); albite (Z49149; granules; location unknown); kaolinite (KGa-1b; powder; Georgia, USA); dolomite (MT8327; granules; Thornwood, New York, USA); hematite (C1; powder; synthetic). Infrared functional groups: ν (pronounced nu)—fundamental stretching mode; 2ν/3ν—first/second overtone of fundamental stretching mode; δ (delta)—fundamental bending mode; ν + δ—combination band. Electronic absorptions: CFA—crystal field absorption; CTS—charge transfer absorption.
Minerals 11 00347 g001

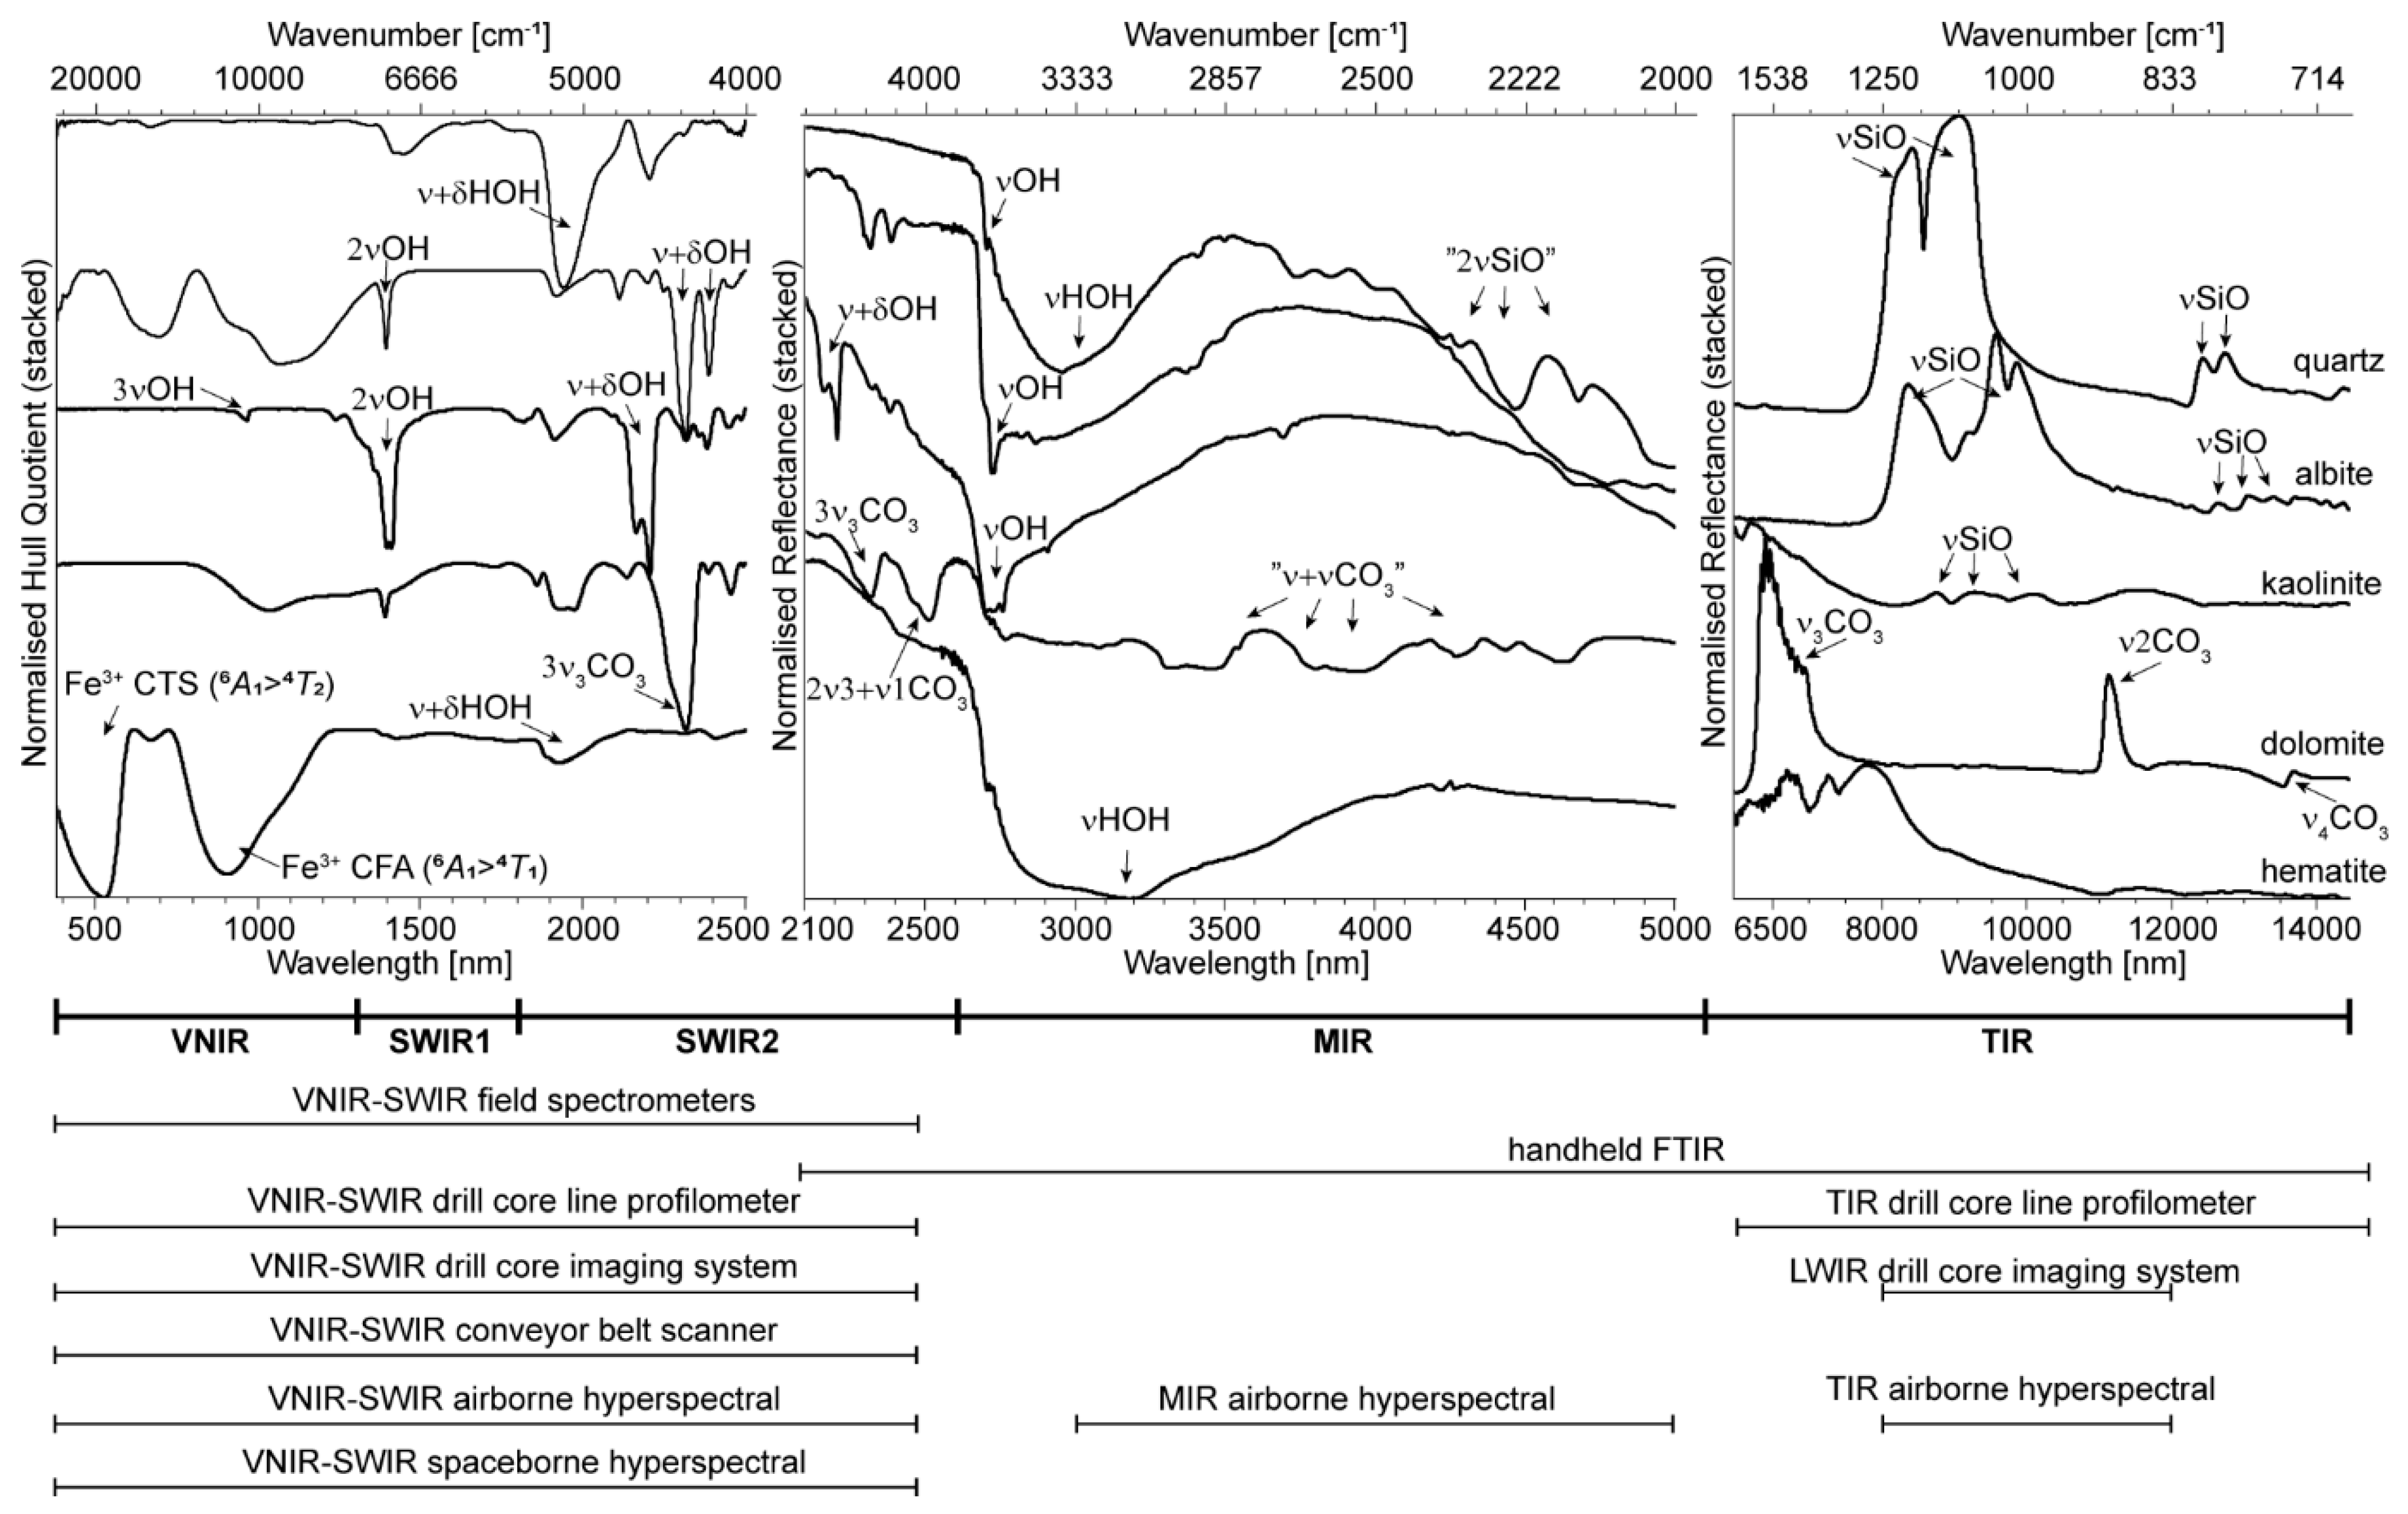
2. Mineral Diagnostic Features in Reflectance Spectra

Vibrational modes of minerals that contain various oxygen species can be observed in different domains of the SWIR to TIR wavelength ranges (e.g., quartz (SiO2), albite (NaAlSi3O8), kaolinite (Al2O32SiO2·H2O), dolomite (CaMg(CO3)2) and hematite (Fe2O3)). The main types of vibrational modes (i.e., infrared-active functional groups) in these rock-forming and common alteration minerals are due to fundamental stretching and bending vibrations (abbreviated as ν and δ, respectively) of O-H, N-H, C-O, B-O, S-O, P-O and Si-O bonds [23] (summarised in Figure 2), and their overtones (abbreviated, for example, as 2ν for the first overtone of a stretching fundamental) and combinations of fundamental stretching and bending vibrations (abbreviated as ν + δ).
Historically, reflectance spectroscopy applied to mineral resources exploration and mining was focused predominantly on the VNIR and SWIR wavelength regions due to the limitation of accessible and robust instruments [24] and, more recently, also in the TIR wavelength range as handheld and benchtop FTIR instruments have appeared on the market [6]. The definition of the wavelength ranges attributed to these different regions of interest was largely defined by specifications of the respective reflectance spectroscopic technologies. For example, the VNIR wavelength range was originally defined to comprise the 325 to 2500 nm wavelength range [9,13], which is one of the atmospheric windows where the absorption of solar radiation by atmospheric gases is restricted to relatively narrow wavelength ranges at around 1400 and 1900 nm. Subsequently, the SWIR wavelength range was introduced, comprising the longer wavelength range of the VNIR (1300 to 2500 nm) [24]. However, several vibrational modes are centred at the boundary between the instrument-guided wavelength range definitions, an example being the major carbonate-related absorption feature located at around 2500 nm, commonly observed in Ca-carbonates such as calcite and dolomite [19], as shown in Figure 1.
The scattering behaviour of materials varies in different parts of the infrared spectrum, and this partly depends on whether the surface of the analysed material is smooth relative to the wavelength of incident radiation (leading to specular reflection, also called surface scattering) or rough (leading to volume scattering plus surface scattering). For rough surfaces, Vincent and Hunt [25] defined specular reflectance as RS and volume reflectance as RV. The total reflectance RT can be expressed as the sum of RS and RV, where both components are dependent on (1) the angle of incidence of radiation with respect to the macroscopic surface normal (j), (2) the angle of observation with respect to the macroscopic surface normal (q), (3) the packing fraction (f), (4) the intrinsic index of refraction of the particulate medium (n), (5) the intrinsic absorption coefficient of the particulate medium (α), (6) the scattering coefficient of the particulate medium (s) and (7) the average grain size (d) [25]. In the case of currently commercially available field and drill core hyperspectral sensing instruments, j and q can be considered invariant and, therefore, as constant. Estimation of parameters f, n, α, s and d is inherently difficult at the common spatial resolution of field and drill core line profilometers, as, in most cases, a mineral assemblage must be assumed. Therefore, for this contribution, we assume that the intensity of an absorption band is correlated with the amount of the respective vibrational mode [1]. However, it should be noted that this correlation is not necessarily linear, as it is dependent on all the above variables. In reflectance spectra, the SWIR 1, SWIR 2 and MIR wavelength ranges are dominated by volume scattering processes, whereas surface scattering dominates in the TIR. Absorption bands in reflectance spectra are displayed as troughs if the respective mineral acts as a volume scatterer (e.g., in the SWIR in Figure 1). Reflectance peaks can be observed if the respective mineral is a surface scatterer (e.g., in the TIR in Figure 1). RS increases with the strength of the vibrational mode and when the extinction coefficient k is significantly larger than the refractive index n. Depending on their grain size, different minerals can have different scattering behaviours in the same wavelength range [25,26]. For example, a layer of clinging fines of kaolinite on quartz can result in absorption troughs superimposed on the expected strong quartz-related reststrahlen bands in the 9000-nm wavelength range, as volume scattering applies to the fine-grained kaolinite, whereas surface scattering applies to the underlying coarse-grained quartz.

2.1. SWIR 1 Functional Groups (1300 to 1850 nm)

The first overtones of fundamental stretching vibrations of hydroxyl groups (2νOH) in hydroxyl-bearing minerals are the predominant absorption features occurring in the 1300 to 1850 nm wavelength region (Table 1). All hydroxylated silicates and sulphates exhibit these absorptions. For example, in sheet silicates (e.g., kaolin group, white mica, talc, smectite, chlorite), 2νOH is mostly located between 1390 and 1445 nm. Kustov et al. [27] demonstrated in a study of zeolites that hydroxyl-related overtones can be more sensitive to the hydroxyl environment (i.e., the type of cations bonded to the OH group) than their fundamental stretching vibrations in the MIR wavelength range.
Overtones of fundamental vibrations should be located at double the frequency of the fundamental. However, due to the anharmonic character of vibrations, overtones of fundamental vibrations are located at a lower frequency (i.e., longer wavelength) than double the frequency of the fundamental vibration. The difference is described by the square of the anharmonicity constant C, which is around 171 cm−1 in the case of sheet silicates [28]. The wavelength position of the strongest absorption band depends on the cation bonded to the infrared-active OH group. This means that the wavelength position of the fundamental OH vibration (νOH) and its overtone (2νOH) increases with the electronegativity of the cation bonded to OH [29]. As a result, for example, Mg- or Al-rich sheet silicates absorb at shorter wavelengths when compared to Fe- or Ni-rich sheet silicates. The sheet silicate prehnite exhibits strong absorption at around 1477 nm, which is due to its comparably high content of ferric iron [30] and is therefore positioned at distinctly longer wavelengths when compared to other sheet silicates. On the other hand, Li-OH absorptions, which indicate the presence of Li-bearing hydroxylated silicates such as lepidolite, are positioned at comparably short wavelengths around 1390 nm [28,31].
The epidote series comprises a solid solution series ranging from clinozoisite (Ca2Al3Si3O12(OH)) to pistasite (Ca2Fe3+Al2Si3O12(OH)) as the two endmembers of the AlFe3+−1 solid solution. Each OH group in epidote is bonded to two M sites, which are occupied by varying amounts of Al and Fe3+. Hydroxylated sorosilicates of the epidote series are characterised by absorptions in the 1545 to 1563 nm wavelength range, which are also due to 2νOH. These absorption features can be readily separated from hydroxyl-related overtones in other minerals and do not overlap with atmospheric absorptions in the 1400-nm wavelength range, which pose a challenge in optical Earth observation data [32]. Roache et al. [33] used the wavelength position of 2νOH to track the AlFe−1 exchange vector in epidote series minerals in the context of Archean gold deposits in the Eastern Yilgarn Craton of Australia, separating the shorter-wavelength epidote (Fe-rich) from the longer-wavelength clinozoisite (Al-rich). It is noted that the latter hydroxyl-related absorptions do overlap with combinations of NH4-related fundamental stretching vibrations ν1 + ν3NH4, which occur, for example, in the ammonium-bearing feldspar buddingtonite [34].
Hydroxylated sulphates also display several absorptions in the SWIR 1 wavelength range. For example, alunite and jarosite are both characterised by strong absorption at around 1470 nm, which can be assigned to an overtone of the OH-related stretching fundamental or a combination band of the OH-related stretching fundamental and a first overtone of a H2O-related bending vibration (2δH2O) [35]. In the case of alunite, Bishop and Murad (2005) [35] described that a shift in the 1470-nm absorption feature to longer wavelengths is correlated with the increasing NaK−1 exchange vector. The relative amount of Na and K in alunites is correlated with the temperature of formation [36], and the wavelength position of the 1470 nm absorption was used by [37] to vector towards the intrusive centre of porphyry Cu-Au deposits. Sulphates display additional absorption features centred at 1750 nm, 1763 nm and 1849 nm for which wavelength positions are less susceptible to compositional changes but still are useful indicators of the presence of the respective sulphate species (Table 1) [35]. In drill core hyperspectral data, other surficial sulphates, such as epsomite, melanterite, goslarite and copiapite, are frequently observed in pyritic weathered zones and on the surfaces of oxidised samples and cores, especially in humid conditions.
The relative intensity of absorption features in the SWIR 1 wavelength region, which is related to vibrational modes, can be impacted by the presence of transition metals that cause strong electronic absorption features in the VNIR wavelength range (e.g., ferric and/or ferrous iron in iron oxides or carbonates). The reader is referred to Burns [14] for an overview of the respective absorption features related to transition metals. Additional electronic features can result from REE contained within, for example, phosphates, carbonates and silicates [38,39,40].
Table 1. SWIR 1-active vibrational modes commonly observed in rock-forming and alteration minerals, their wavelength positions (in nm) as well as the titles of scripts for extracting the relative intensity and wavelength position of the respective absorption features.
Mineral GroupMineral Species (Examples)Assignment of AbsorptionLower Limit (nm)Upper Limit (nm)LiteratureIntensity ScriptWavelength Script
sheet silicatekaolinite2νMnOH1392 to 1415[41]1400D1400W
sheet silicatemuscovite1406 to 1415[31]
sheet silicatelepidolite1387 to 1425[31]
sheet silicatetalc1392 to 1412[28]
sheet silicatesmectites1394 to 1445[28,42]
sheet silicatepalygorskite1386 to 1443[43]
sheet silicatechlorite1391 to 1415[44]
double chain silicatecalcic amphibole1392 to 1413[45]
sulphatejarosite2νMnOH, ν + 2δH2O1471[35]1480D1480W
sulphatealunite2νMnOH, ν + 2δH2O1473 (K-rich)1491 (Na-rich)[35]
sheet silicateprehnite2νM2OH1476 (Fe-rich)1478 (Mg-rich)[32]
sorosilicateepidote, clinozoisite, pistasite2νM2OH1545 (Fe-rich)1563 (Al-rich)[30,32,33]1550D1550W
NH4alunite, montmorillonite, buddingtonite, white micaν1 + ν3NH41520 to 1560[34]
sulphategypsumν + δOH/H2O and rotational fundamentals or δS-O overtones1751[46]1760D-
sulphatealuniteν + 2δMnOH1762 (Na-rich)1764 (K-rich)[35,37]1760W
sulphatejarositeν + 2δMnOH1849[35]1850D-
Note: Respective absorption bands can be present in minerals that are not listed in table. Lower and upper wavelength positions only given for absorption bands where related compositional changes are discussed in this study. Otherwise, an estimated central location is provided.

2.2. SWIR 2 Functional Groups (1850 to 2600 nm)

The two main origins of mineral-related absorption features in the SWIR 2 wavelength region (between 2000 and 2600 nm) are a) combinations (ν + δOH) of hydroxyl-related fundamental stretching (νOH) and bending vibrations (δOH), and b) combinations (e.g., 2ν3 + ν1 CO3; Table 2) or overtones (e.g., 3ν3CO3; Table 2) of carbonate-related fundamental stretching vibrations. Notwithstanding, combinations and overtones of other infrared functional groups can also occur in the SWIR 2. For instance, NH4-bearing minerals, such as buddingtonite, display a diagnostic absorption feature between 2020 and 2120 nm (Table 2) [34]. The respective fundamental vibrations are located in the TIR (described in the Section on TIR Functional Groups). Felzer et al. [47] postulated that the depth of the 2120-nm absorption is linearly related to the concentration of NH4 in buddingtonite from Cuprite, Nevada, highlighting the potential for quantitative reflectance spectroscopy after calibration with results obtained from geochemical analysis.
Di- and tri-octahedral sheet silicates represent a major group of rock-forming minerals that show diagnostic absorption features in the SWIR 2. Sheet silicates can be separated into five major groups, based on their layer structure:
  • di-octahedral 1:1 phyllosilicate (“7 Å phase”): e.g., kaolinite;
  • tri-octahedral 2:1 phyllosilicate (“9 Å phase”): e.g., talc;
  • di-octahedral 2:1 phyllosilicate (“10 Å phase”): e.g., muscovite, phengite, celadonite;
  • tri-octahedral 2:1 phyllosilicate (“10 Å phase”): e.g., biotite;
  • tri-octahedral 2:1:1 phyllosilicate (“14 Å phase”): e.g., chlorite.
This separation is partially adopted from Meunier (2005) [52], who summarises four principal layer types of phyllosilicates according to the 1/1, 2/1 and 2/1/1 patterns and the basal spacings (i.e., 7 Å, 9 Å, 10 Å, 14 Å). Meunier (2005) [52] extended the four principal layer types by considering the number of octahedral sites filled in the respective phyllosilicates, which carries important information about the contained infrared functional groups. The resulting five different layer types and the multiple combinations of the respective types in interlayered sheet silicates can lead to a large variety of absorption bands in the SWIR 1 and 2. Only the combination bands related to the main functional groups of the di- and tri-octahedral phyllosilicates in the SWIR 2 are discussed here.
Kaolin group minerals, as the main representatives of the dioctahedral “7 Å phases”, show a characteristic doublet consisting of a major feature fixed at around 2209 nm associated with a secondary feature at around 2160 nm (Table 2) [41]. This doublet can be decomposed into four absorption bands, with the three short-wavelength bands (2159 nm, 2169 nm, 2194 nm) related to stretching vibration of the outer hydroxyl groups (ν + δAl2OHi, i.e., hydroxyl groups bond to the tetrahedral layer) and the major long-wavelength band (2209 nm) related to stretching vibration of the inner hydroxyl group (ν + δAl2OHo) [41]. Changes in the shape of this characteristic doublet are related to changes in the structure and crystallinity of the kaolin group mineral [53]. Kaolin can also display a weak to medium absorption feature at 2238 nm related to ν + δ (AlFe3+)2OH, where its intensity increases with increasing ferric iron content [54]. Other combination bands in kaolin group minerals are located at around 2330 nm and 2380 nm, overlapping with the absorption features of carbonates, amphiboles and talc.
Di-octahedral 2:1 sheet silicates (“10 Å phase”) comprise the large group of white micas (e.g., paragonite, muscovite, phengite, celadonite) as well as Al-bearing smectites (e.g., montmorillonite). The dominant absorption feature of these AlOH-bearing sheet silicates at around 2200 nm is due to ν + δAl2OH (Table 2). The octahedral Al can be exchanged with Fe2+ or Mg, and the related charge imbalance is compensated by exchange of the tetrahedral Al with Si. Changes in the Tschermak exchange vector (AlVIAlIV(Fe,Mg)VI−1SiIV−1) are reflected in shifts in this absorption feature [3,55,56,57], which shifts to longer wavelengths with increasing replacement of AlVI by divalent cations (Figure 3). It should be noted that interlayer cations in mica (Figure 3) have no influence on the position of the combination features [58]. Therefore, the separation of Na micas (e.g., paragonite) from Na-void micas (e.g., muscovite) by means of SWIR 2 reflectance spectra is not possible. Smectites show the same shift in the major absorption at around 2200 nm [55], with beidellite representing the Al-rich smectites and montmorillonite representing the Al-poor smectites. However, smectites and mica-like minerals of the same octahedral composition show a different location of the OH absorption bands, located at shorter wavelengths (ca. 2200 nm) for smectites and longer wavelengths (ca. 2220 nm) for illite [53,58]. In sheet silicates that incorporate significant amounts of F, such as lepidolite, the 2200-nm absorption feature shifts to longer wavelengths and shallows as OH is replaced by F [31]. A second diagnostic absorption feature of white micas is located at 2350 nm (Figure 3), which is absent in smectites and can therefore be used to differentiate the two mineral groups. This absorption feature becomes more prominent with increasing content of Fe2+ or Mg. A third diagnostic absorption feature of white mica occurs near 2450 nm, which is, due to low signal-to-noise ratio, difficult to identify in reflectance spectra acquired using commercially available VNIR-SWIR spectrometers (example spectrometers given in Figure 1).
Di-octahedral 2:1 sheet silicates such as muscovite have, in contrast to the tri-octahedral 2:1 phyllosilicates (e.g., biotite), a vacant third cation site. Both tri-octahedral 2:1 sheet silicates (“10 Å phase”) and tri-octahedral 2:1:1 sheet silicates (“14 Å phase”), such as chlorites, show characteristic absorption features at around 2250 nm and 2340 nm (Table 2). In chlorites, the ν + δ(Mg,Fe2+)2OH (interlayer OH related vibrations = brucite-layer) shifts from around 2248 nm to 2261 nm [50,59] from the clinochlore to the chamosite endmember, respectively. Moreover, the ν + δ(Mg, Fe2+)3OH (inner OH of 2:1 talc layer) at around 2350 nm can shift according to the MgFe−1 exchange vector. In practice, it is observed that shifts in the 2248–2261 nm wavelength range (brucite layer) are larger and less conflicted by other minerals than the +/− 2350-nm talc layer [57].
Talc belongs to the group of tri-octahedral 2:1 sheet silicates (“9 Å phase”). The general composition of talc can be expressed as Si4O10M3(OH)2 with a Mg-only occupation of the M-sites in the talc sensu stricto endmember and replacement of Mg by Fe2+ in minnesotaite [60]. In pure talc, a characteristic doublet can be observed in the 2320-nm wavelength region (Table 2) that comprises the combination of the stretching in the MIR at 2720 nm [28] with the bending fundamentals in the TIR at 15,384 nm and at 14,492 nm, respectively. The two resulting absorption bands are located at 2300 and 2279 nm, respectively, overlapping with the Mg-rich endmembers of the actinolite and hornblende series, due to their structural similarity. Additionally, the third major absorption band of talc, located at around 2380 nm (ν + δ(M)3OH), overlaps with Mg-rich amphiboles such as tremolite. To separate talc from these amphiboles, a weak triple absorption feature (at 2077 nm, 2127 nm and 2172 nm) characteristic of talc can be used.
Major SWIR absorption features of amphiboles occur in the 2320-nm and 2380-nm wavelength regions, overlapping with di- and tri-octahedral phyllosilicates containing Fe3+, as well as talc and kaolinite (Table 2). The general formula of calcic amphibole is A(M4)2(M1)2(M3)1(M2)2(T1)4(T2)4O22(OH)2, with the major cations occupying the respective sites being: A = Na, K; M4 = Ca, Mn, Li; M1 = Mg, Fe2+; M2 = Fe3+, Al, Ti; M3 = Mg, Fe2+; T1 and T2 = Si, Al, Ti (oxidation state only given for iron for clarity). In calcic amphiboles of the actinolite and hornblende series, the main absorption feature at 2320 nm can be decomposed into eight absorption bands, which are due to combinations of hydroxyl stretching fundamentals ranging from 2723 nm (νMg3OH) to 2759 nm (νFe2+3OH), with two major fundamental bending vibrations located at 14,492 nm (690 cm−1) and 15,384 nm (650 cm−1) [45]. A doublet around 2320 nm can be observed in Mg-rich endmembers of the actinolite series (i.e., tremolite), whereas actinolite of an intermediate Mg# (Mg/(Mg + Fe)) shows a broad feature in the same wavelength range. The second main absorption feature of amphiboles in the SWIR 2 is located at around 2380 nm, which is possibly related to the combination of the main hydroxyl stretching fundamentals with a bending vibration at 19,047 nm (525 cm−1). The location of these two major absorption features is mainly related to the relative abundance of Mg and Fe2+ occupying the M1 and M3 sites, as these are the only cation sites connected to the OH group responsible for the respective absorption bands [45]. The M2 and M4 sites, as well as the 12-fold coordinated A position, do not have an impact on the location of the major absorption feature that could be measured with field or drill core hyperspectral reflectance spectrometers. Therefore, detectable differences between the actinolite series and the hornblende series cannot be expected. Only the Mg# (or replacement of Mg or Fe2+ by other cations on the M1 and M3 sites) results in a clear shift or different shape of the main absorption features of amphiboles in the 2280 to 2420 nm wavelength range. Preliminary, unpublished studies on cummingtonite and riebeckite suggest the possibility of separating the actinolite and hornblende series from Fe-Mn-Mg amphiboles and alkali amphiboles, respectively.
Strong absorption features of hydroxylated sorosilicates of the epidote group in the SWIR 2 are located at around 2250 nm and 2340 nm, respectively (Table 2) [30,32]. As with all hydroxylated mineral groups, absorption features of epidote in the SWIR 2 represent combinations of fundamental stretching and bending vibrations located in the TIR. Importantly, both SWIR 2 absorption features significantly overlap with commonly co-occurring mineral groups, such as chlorite [61] and biotite. However, in epidote, the relative intensity of the 2350-nm absorption feature is much stronger than the relative intensity of the absorption in the 2250-nm wavelength region, when compared to chlorite. In addition, the wavelength position of the absorption feature in the 2250-nm wavelength region is at distinctly longer wavelengths when compared to the “longest-wavelength chlorite” (i.e., 2267 nm in epidote versus 2263 nm in chlorite). The longer-wavelength position is due to the fact that, in epidote, Al and Fe3+ are bonded to OH, whereas in chlorite, Mg and Fe2+ are the main cations bonded to OH.
Hydroxylated cyclosilicates of the tourmaline series display major absorption at around 2174 nm, 2204 nm, 2256 nm, 2302 nm and 2390 nm (Table 2) [49]. Due to the large compositional variations of the tourmaline group, the relative intensity and wavelength position of these absorptions can differ considerably between different tourmaline mineral species. Bierwirth [62] reported a distinct correlation between the absorption feature at 2359 nm, which shifted to 2375 nm as the MgO wt.% decreased from 11% to 0%. Importantly, this wavelength shift can be detected in hyperspectral remote sensing imagery and be used for exploring for base and precious metal ore deposits [62].
Another major mineral group that contains hydroxyl groups and subsequently displays major absorption features in the SWIR 2 comprises hydroxyl-bearing sulphates. Alunite is characterised by a broad absorption feature at around 2160 nm [35], which overlaps with absorptions arising from kaolin and pyrophyllite. Jarosite shows strong hydroxyl-related combination bands at ~2212 nm and 2263 nm [35], which overlap with the absorption features of di-octahedral and tri-octahedral sheet silicates, respectively. Gypsum shows strong absorption features at around 2170 nm, 2220 nm, 2280 nm and 2430 nm [46]. In the transition zone between the SWIR 2 and MIR wavelength ranges, sulphates display medium to strong S-O-related overtones (e.g., jarosite: 2503 nm, 2606 nm, 2623 nm; alunite: 2517 nm) [35].
Carbonates show several diagnostic absorption features in the SWIR 2, which all show changes in location and shape, mainly depending on the amount of Mg, Fe and Mn replacing Ca. A composition space of major carbonate minerals is shown in Figure 4. The main diagnostic absorption feature in the SWIR 2 wavelength range that is accessible with commercially available field spectrometers (3ν3CO3; for summary, see [19]) is located between 2300 nm and 2340 nm and shows a characteristic left-hand asymmetry (Figure 1). This asymmetry points to a secondary, less intense absorption band located on the short-wavelength limb of the same feature, probably centred in the 2230–2275 nm wavelength region. With increasing amounts of Mg and Fe, the 3ν3CO3 shifts to shorter wavelengths (Figure 4) [19]. The 3ν3CO3 feature and its secondary associated feature can be mimicked, for example, by a mineral mixture comprising materials featuring ν + δ[Al,Fe3+]/[Mg,Fe2+]2OH (e.g., di- and trioctahedral phyllosilicates) and ν + δ [Mg,Fe2+]3OH (e.g., amphiboles). A second, equally diagnostic absorption feature for carbonates is located beyond the SWIR 2 wavelength range accessible with commercially available field spectrometers but can be detected by means of laboratory and handheld FTIR spectrometers. This carbonate-related absorption can be assigned to 2ν3+1CO3 [19] and shifts from 2541 nm in calcite to 2505 nm in Mg-rich carbonates, synchronously with 3ν3CO3. Two more diagnostic absorption features in calcite are located at around 1990 nm (medium intensity) and 1870 nm (weak intensity), respectively. These two absorption features always appear as pairs in carbonates and, though decreasing in intensity with increasing Mg or Fe content, they also display a shift to shorter wavelengths with increasing replacement of Ca by Mg and Fe. Due to their overlap with the major OH/H2O feature at around 1900 nm, these features can be obliterated but are found to be very useful when the true nature of a left-hand absorption feature in the 2340-nm region is questionable.

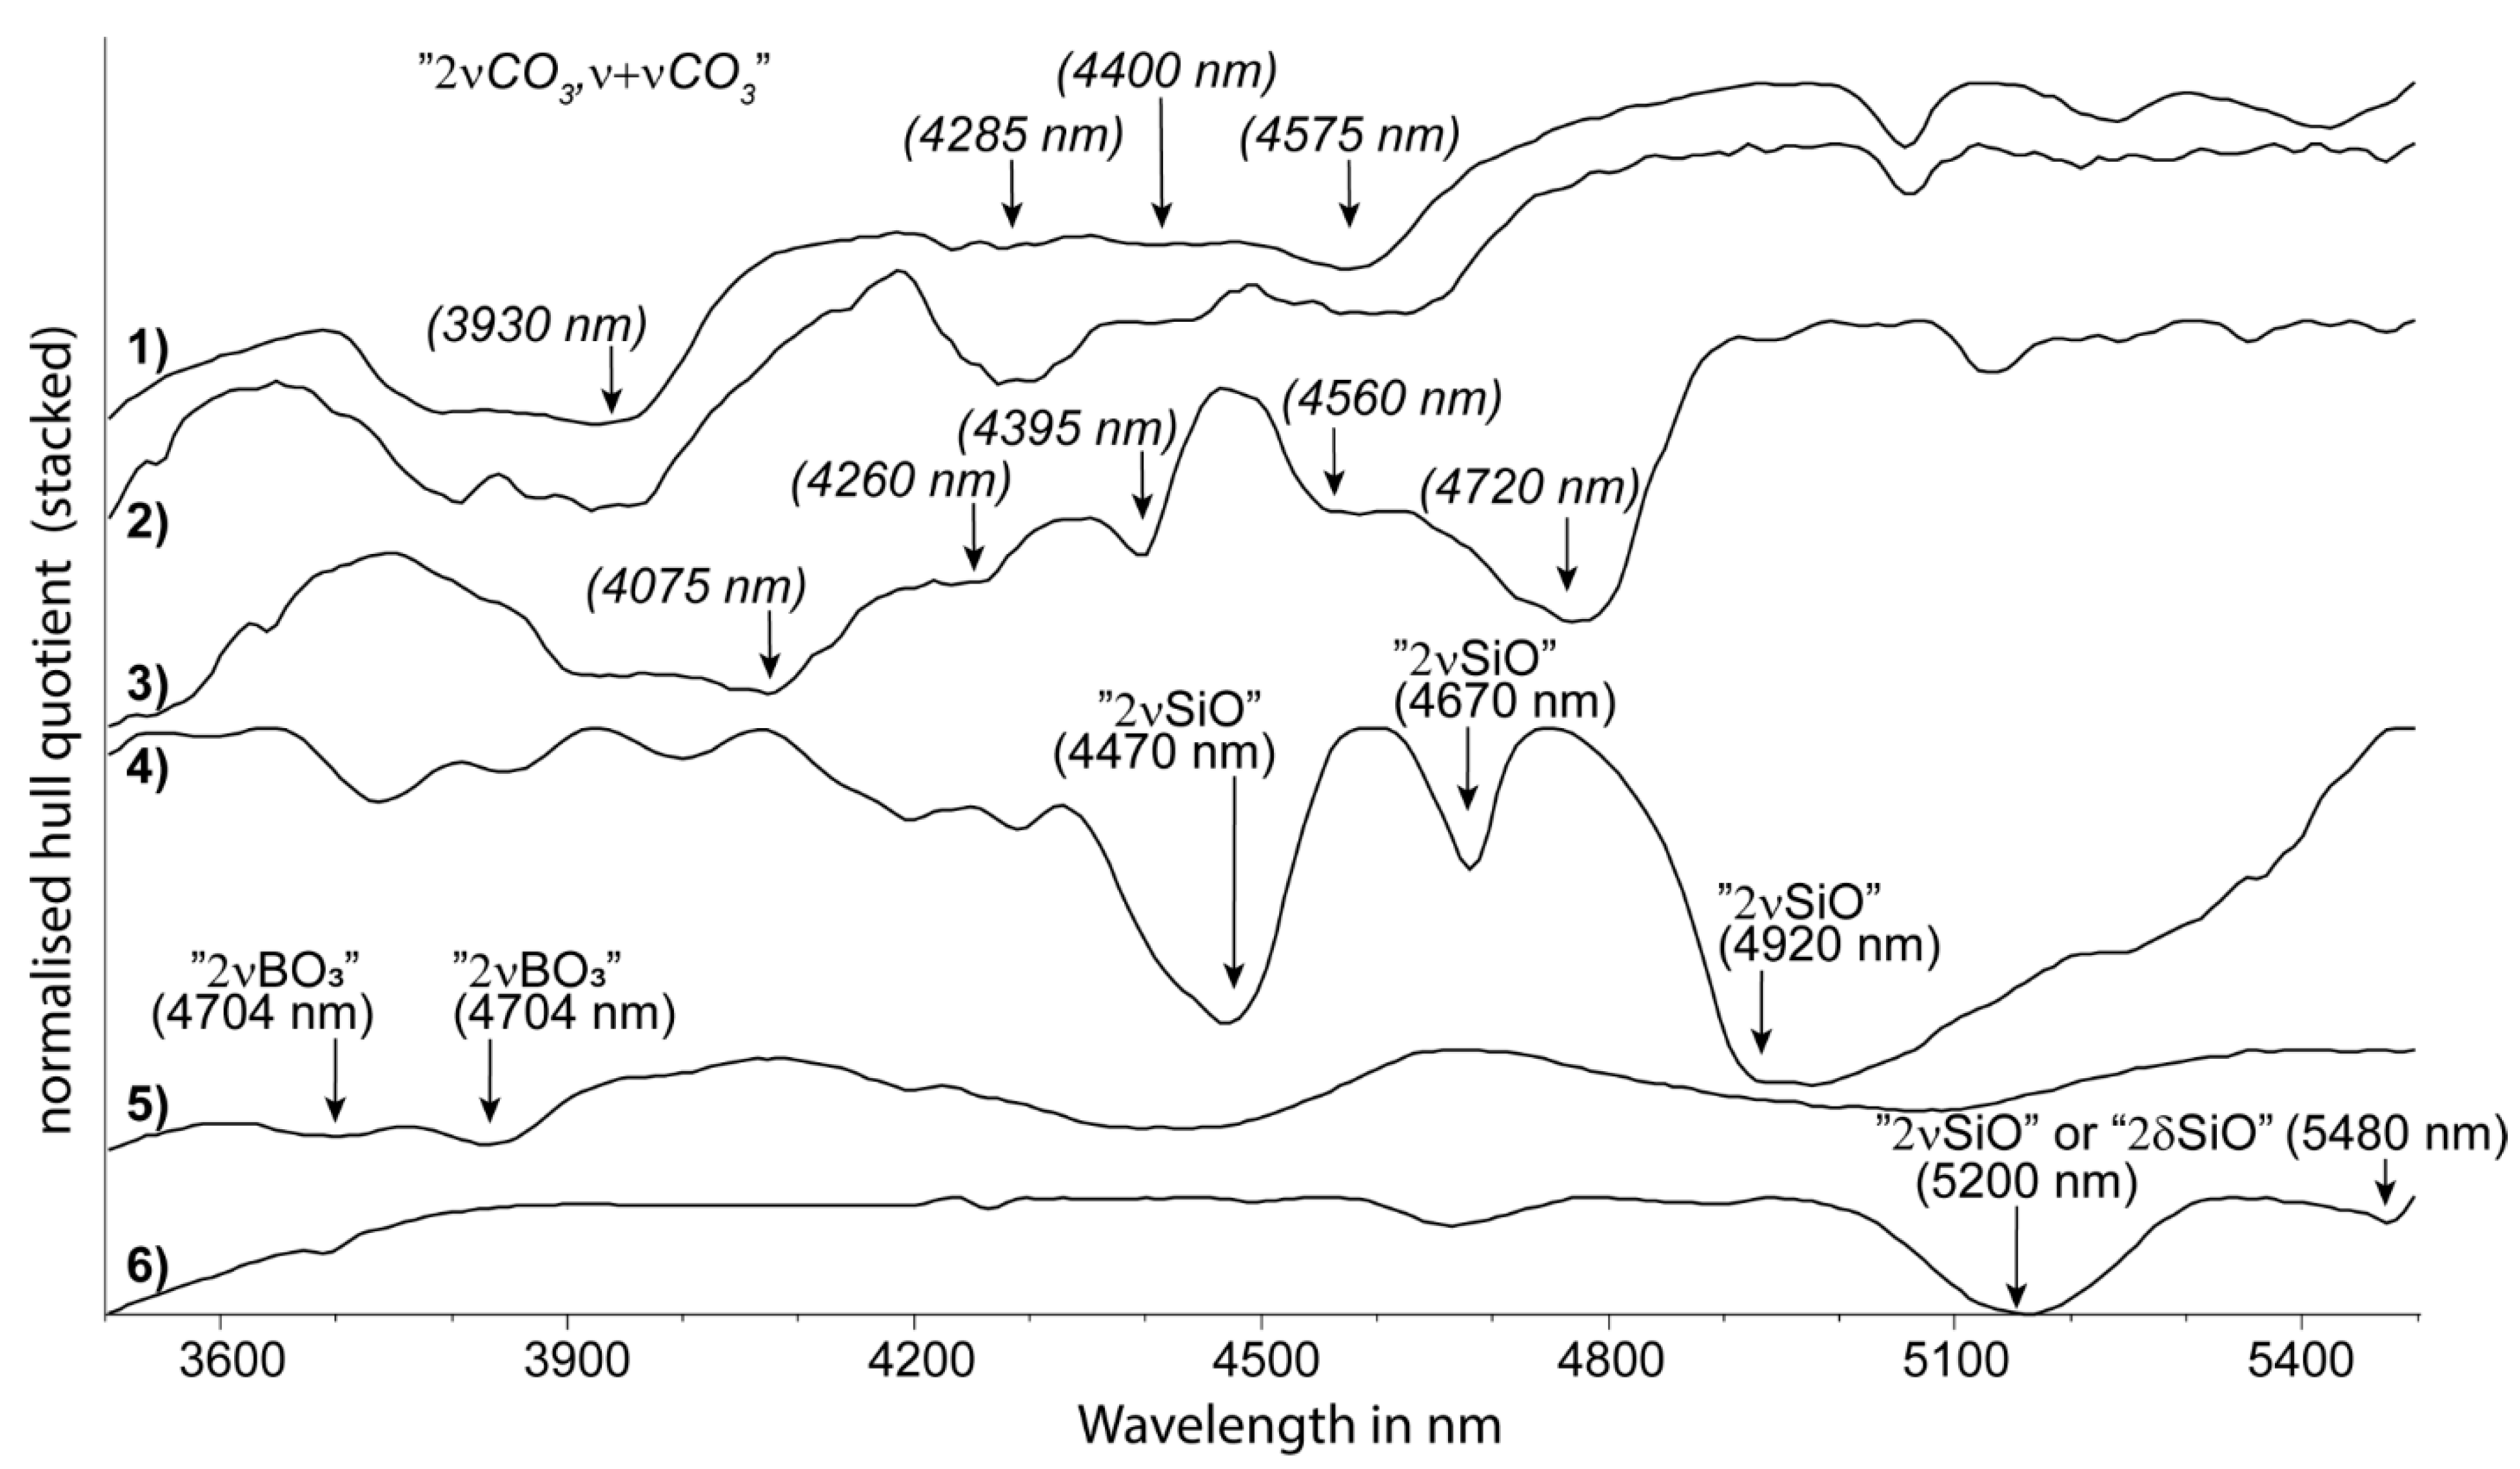
2.3. MIR Functional Groups (2600 to 5500 nm)

The MIR wavelength range comprises the fundamental stretching vibrations of O-H bonds (νOH), which occur in hydroxylated mineral groups, such as di- and tri-octahedral sheet silicates (e.g., micas, smectites, kaolin group, chlorite), amphiboles, tourmalines and metal oxides/hydroxides (e.g., gibbsite, goethite). Many absorption bands are possible between 2667 and 5000 nm [23,65], although, in most natural samples, νOH is located in between 2675 and 2890 nm (Table 3). A notable exception is hydroxyl-bearing iron oxides, which absorb between 3113 and 3131 nm [66]. The number and wavelength position of hydroxyl-related stretching fundamentals depend on the bond length and the hydrogen bonding that occurs in the respective OH group, which in turn is controlled by its location in the crystal structure and the respective cation environment of the hydroxyl group. For example, kaolin group minerals exhibit four hydroxyl-related stretching environments, three of which are assigned to the outer OH group (ν + δOHo in Figure 5) and one to the inner OH group (ν + δOHi in Figure 5) [41]. In the case of amphiboles of the actinolite series, four major absorption bands can be observed [67]. The wavelength position of these absorption bands is mainly controlled by the Mg/(Mg + Fe). All three cation sites bonded to the hydroxyl group producing the shortest-wavelength absorption band (2723 nm) are occupied by Mg. Cation site occupation for the other three absorption bands at 2733 nm, 2744 nm and 2759 nm is MgMgFe, MgFeFe and FeFeFe, respectively.
O-H stretching vibrations of water molecules (nH-O-H) produce comparatively broad absorption features (i.e., characterised by a large FWHM), which are located between 2732 and 3571 nm [23,65,74]. The water-related broad absorption is typically the strongest absorption feature in the MIR and often overlaps significantly with other hydroxyl groups (νOH; Table 3). Therefore, a high abundance of molecular water will impact significantly on the ability to resolve the other hydroxyl-related stretching vibrations characteristic of a wide range of minerals. Al-smectites, such as montmorillonite, can incorporate different interlayer cations, impacting on the wavelength position of nH-O-H. With increasing polarising power (charge/radius) of the interlayer cation (i.e., K+, Na+, Ca2+, Mg2+), the wavelength position of nH-O-H increases from 2946 nm to 2987 nm [73].
Borosilicates, such as tourmaline, exhibit absorptions at around 3704 nm and 3811 nm (Table 3; Figure 6), which have not yet been described in detail in the literature and are tentatively assigned to overtones of the fundamental B-O stretching vibrations (νBO3). These are in addition to the well-known hydroxyl-related stretching fundamentals of tourmaline in the 2675 nm to 2890 nm wavelength region [49,72].
Carbonates are another group of minerals that have absorption bands in the MIR region that are not necessarily attributed to the OH functional group. When carbonates occur in mixtures with di-/tri-octahedral sheet silicates, etc., their recognition and compositional information in the SWIR 2 wavelength region can be easily compromised. Importantly, however, this is less so in the MIR. Several distinct absorption features in the 3300 to 4800 nm wavelength region (Figure 1) can be observed in the MIR reflectance spectra of carbonates, such as ankerite, calcite, dolomite, magnesite, siderite and witherite. Carbonate-related absorption features are tentatively assigned to the first overtone (2νCO3) or combinations (ν + νCO3) of the various CO3-related stretching fundamentals described by [76,77]. The wavelength position of the major overtone at around 3960 nm correlates with compositional changes in the carbonates (Figure 6). A further benefit of this MIR region for detecting carbonates is that it is less sensitive to very fine grain size effects (clinging fines, etc.) that can distort carbonate peaks in the TIR (described later).
Reflectance spectra between 4000 and 6000 nm are located at the transition from the volume-scattering-dominated wavelength range to the surface-scattering-dominated wavelength range and are heavily impacted by grain size variations [26]. Overtones and combination bands of fundamental absorptions located in the TIR can be expected in this wavelength range, but related publications are scarce. Yitagescu et al. [78] reported the MIR wavelength positions of diagnostic absorption features of montmorillonite (~5100 nm, ~5400 nm), illite (~4670 nm, 5560 nm) and kaolinite (~5200 nm, ~5500 nm). Bishop and Murad [35] described strong absorption features in sulphates (e.g., jarosite) at around 4960 and 5099 nm, which they attributed to 2ν3(SO4)2− and 2δ(OH).
Igisu et al. [75] reported four absorption features in the 4000 to 6000 nm wavelength range of transmission spectra as “Si-O bonds”. Based on comparison with the fundamental Si-O stretching vibrations (νSi-O), absorptions at 4470 nm, 4670 nm and 4920 nm (Figure 6) are assigned to first overtones (2νSiO) of the primary quartz reststrahlen bands in the TIR. Kaolin group minerals show three strong absorptions at 5200 nm, 5480 nm and 6100 nm (Figure 6), which could represent, like quartz, the first overtones of the fundamental Si-O stretching vibrations or first overtones of hydroxyl-related bending fundamentals (δOH). Farmer (1974) [8] assigned the strong absorption centred at around 6100 nm to overlapping vibrations of structural hydroxyl groups and water molecules. Carbonates display several absorptions in the same wavelength range, which show considerable wavelength shifts depending on the carbonate composition, such as the major absorption at around 4560 nm in magnesite shifting to 4720 nm in witherite (Figure 6). Phosphates are characterised by absorptions at 4805 nm and 4995 nm, which are tentatively assigned to 2ν3PO4.

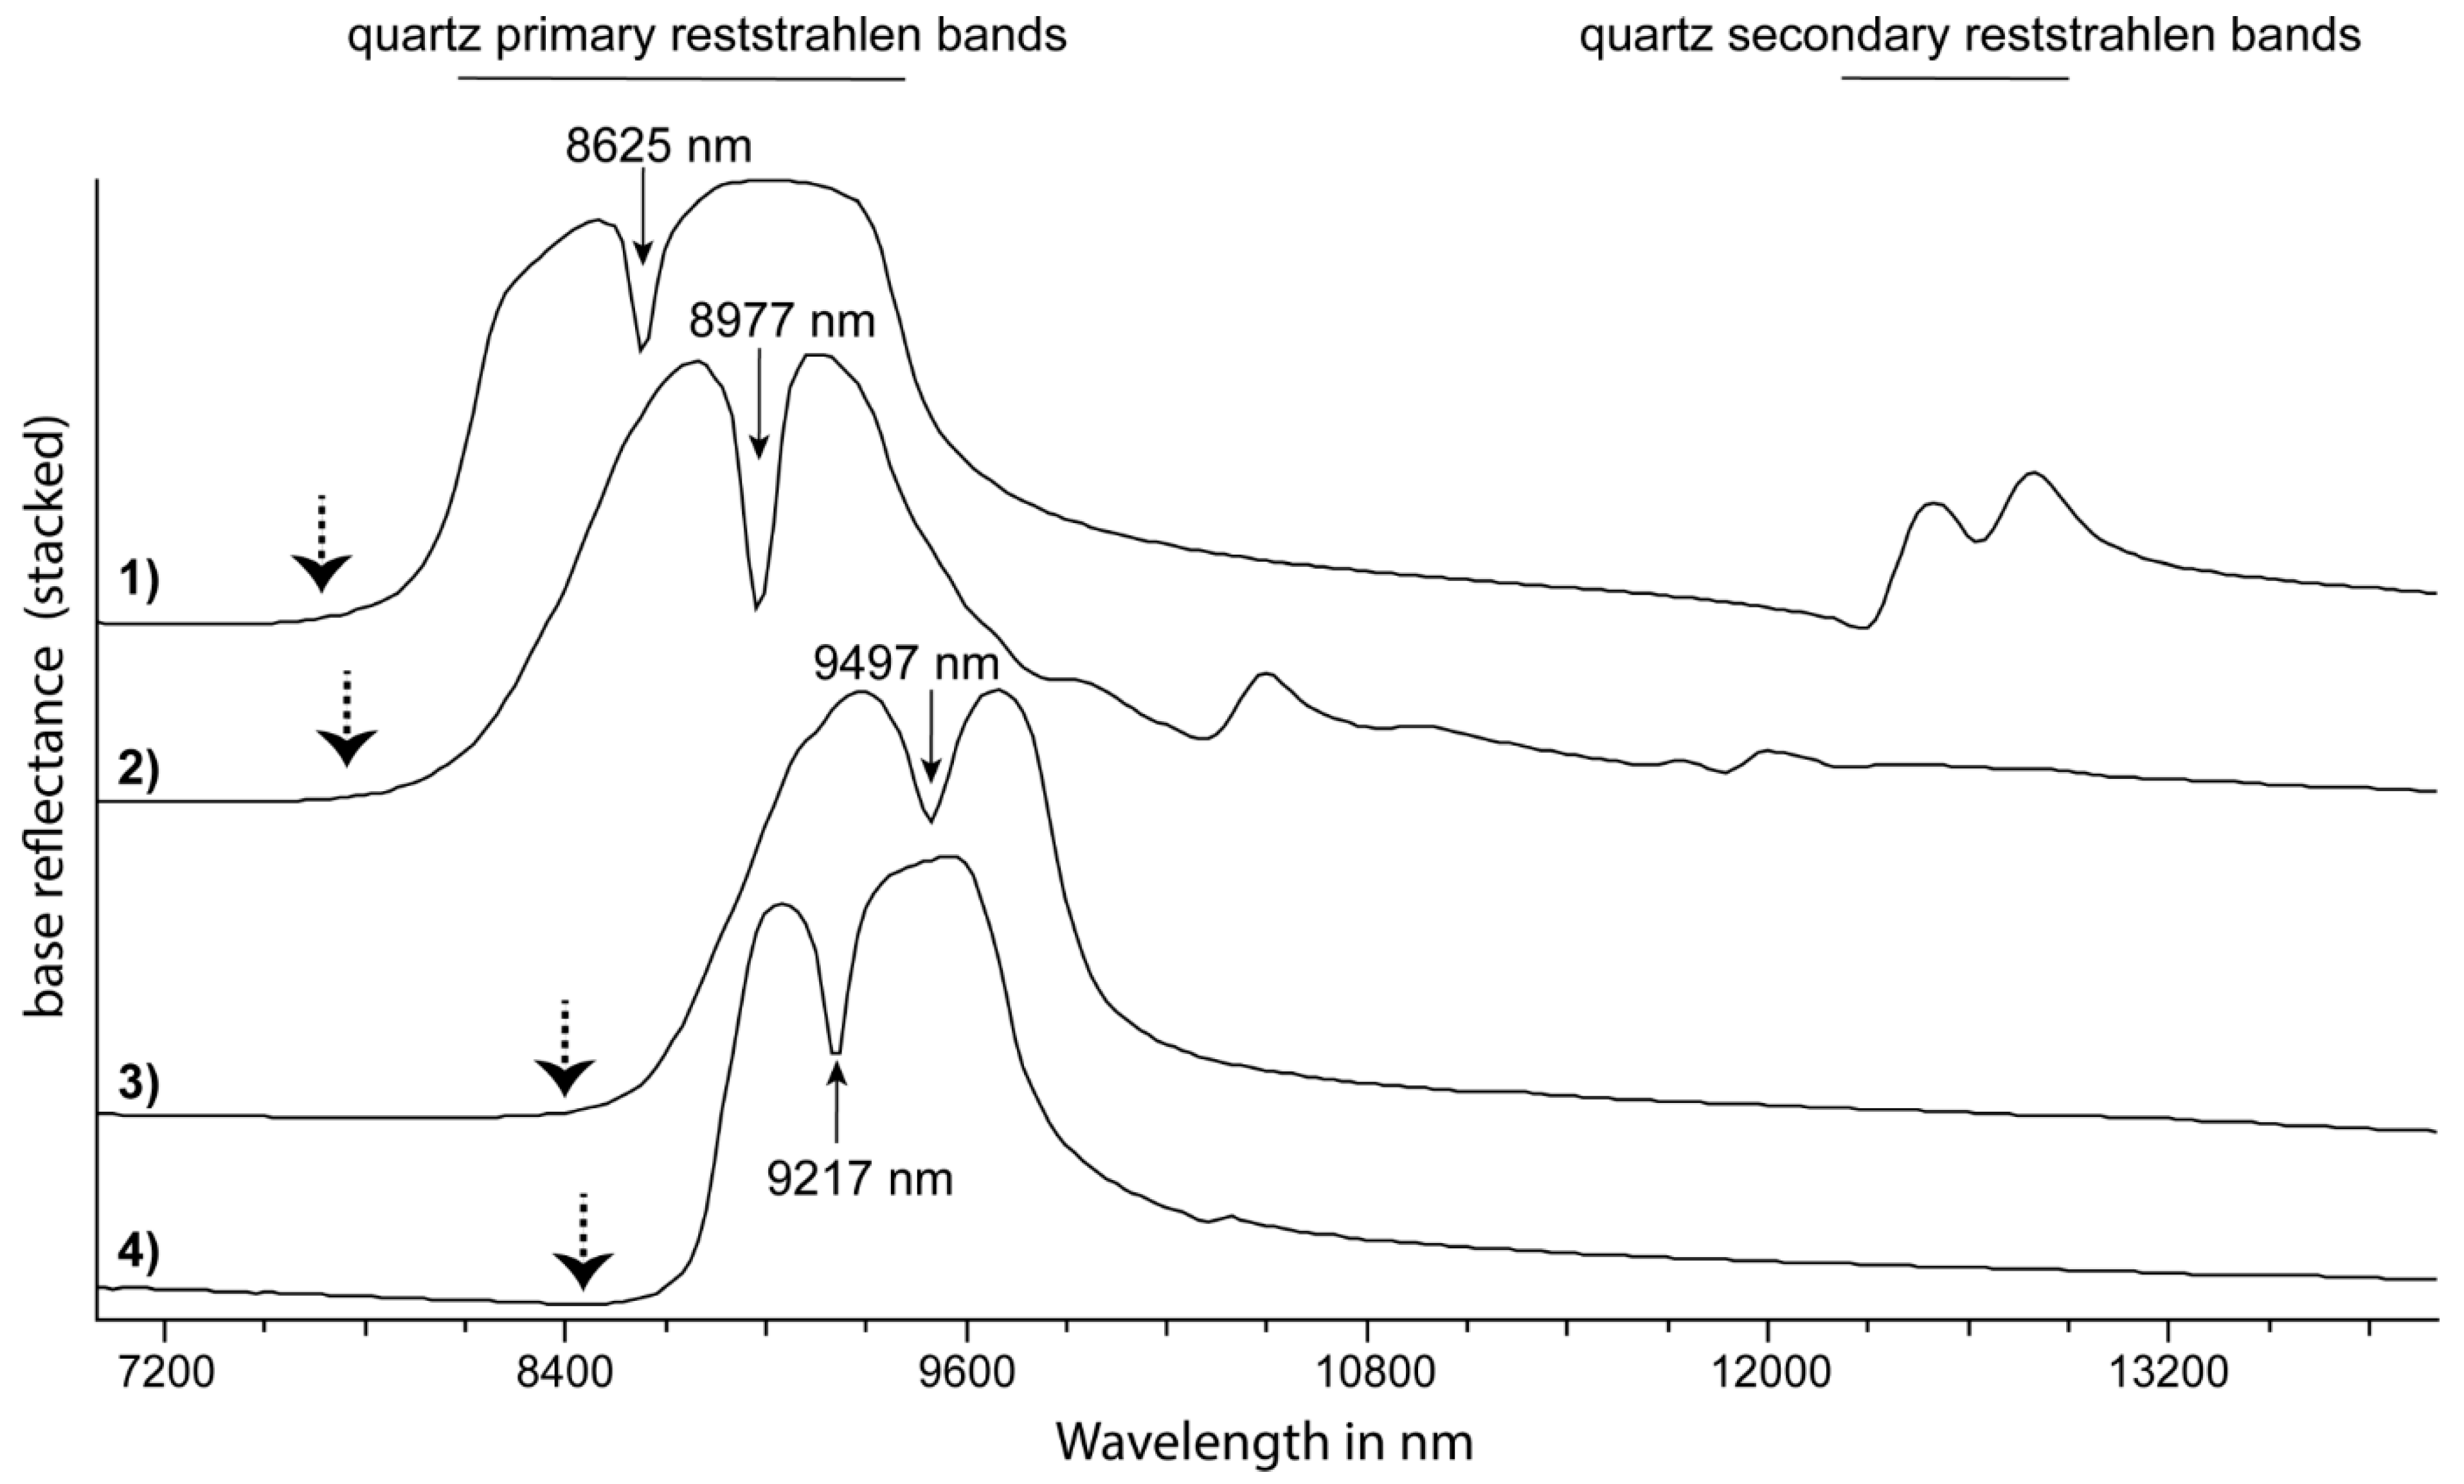
2.4. TIR Functional Groups (5500 to 15,000 nm)

The TIR wavelength region between 5500 and 15,000 nm comprises the largest range of infrared active functional groups. In contrast to the SWIR and MIR wavelength regions in which the volume component of reflection (RV) prevails, specular reflection (RS) is the dominant type of reflection that occurs in a large part of the TIR wavelength range. This section briefly summarises the Si-O-related vibrational modes of common minerals, followed by a description of other important TIR-active anion (e.g., BO33−, CO32−, SO42−, PO43−) and hydroxyl-related vibrations. In addition, other features that are not directly due to vibrational modes of minerals but evident in TIR reflectance spectra are discussed. The impact of grain size and porosity on reflectance spectra is discussed further below in a separate section.
The fundamental stretching vibrations of silicates (νSiO; e.g., [7]) give rise to the most intense features that can be observed in the TIR wavelength region in reflectance spectra (Table 4). The strongest group of reflection peaks (also called reststrahlen bands, [79]) can produce a relatively “simple”, M-shaped signature in the reflectance spectra of less physicochemically complex silicates, such as quartz. These primary reststrahlen bands of quartz are located at 8150 nm, 8600 nm and 9330 nm (Figure 7; [80]). A corresponding group of less intense fundamental stretching vibrations (i.e., secondary reststrahlen bands) of quartz are located at around 12,550 nm (Figure 7; [80]). However, silicates such as feldspars comprise a wide range of possible chemical compositions (i.e., K versus Na versus Ca; c.f. [81]), structural variations (monoclinic versus triclinic) or polymorphs (i.e., feldspars with a “high” structural state and disordered Al:Si distribution versus feldspars of “low” structural state and ordered Al:Si distribution). These silicates display a wide range of “shapes” in reflectance spectral signatures, characterised by different relative intensities of the reflectance peaks. As the ratio of Si to O decreases (such as from quartz to feldspars to sheet silicates to chain silicates to orthosilicates), the wavelength position of the reststrahlen band shifts to longer wavelengths [82,83]. This systematic change has led to the development of the felsic–mafic index, which is frequently used to map different rock types in planetary spectroscopy [84] and drill core reflectance spectra [20].
Tourmaline-series minerals (e.g., elbaite, dravite, schorl) contain additional diagnostic features in the 7300 to 8000 nm wavelength range, which are attributed to the borate stretching vibration (νBO) and are located between the major reststrahlen bands of carbonates and quartz at around 6500 nm and 8250 nm, respectively. The peak caused by the B-O bond occurs in a range devoid of any other significant absorption features of rock-forming or alteration minerals, which makes it ideal for detecting tourmaline. Features at around 7391 nm and 7968 nm in schorl are related to the asymmetric stretching fundamental of B-O (νasBO3; [87]). The major feature at ~7968 nm shows a significant wavelength shift across a range of tourmaline species sampled from different locations (schorl type 1: 7968 nm; schorl type 2: 8097 nm; rubellite: 7782 nm; dravite: 7622 nm; elbaite type 1: 7874 nm; elbaite type 2: 7692 nm; [87] and references therein).
Carbonate minerals show strong features at around 6500 nm, 11,300 nm and 14,000 nm (Table 1; e.g., [7]), which can be assigned to the ν2 out-of-plane bend, ν3 asymmetric stretch and ν4 in-plane bend of the CO3 anion [101]. The wavelength position of each of these absorption features depends on the cation bonded to the CO3 anion [7]. Green and Schodlok [76] used the wavelength position of the feature at around 11,300 nm and a trough to the shorter-wavelength side of the 14,000-nm feature to identify the chemical composition of carbonates in drill core hyperspectral reflectance spectra.
Sulphate anions produce a distinct set of features in the TIR, which can be assigned to ν3SO4, ν4SO4 and ν1SO4 [35,88,89]. Three or more features in major sulphates including alunite, anhydrite, barite, gypsum and jarosite are attributed to ν3SO4, the majority of which are located between 8400 nm and 9000 nm (Table 4). The vibrational mode ν1SO4 of these minerals is located between 9700 nm and 10,200 nm. Anhydrite shows a characteristic feature at 14,780 nm (ν4SO4; [89]). Bishop and Murad [35] described a significant wavelength shift in some of the ν3SO4 features between sodic and potassic alunite or sodic and potassic jarosite (up to 140 nm and up to 76 nm, respectively). It should be noted that while alunite, jarosite and gypsum can be recognised in the SWIR 1 and SWIR 2 regions, only the TIR region permits the recognition of anhydrite and barite.
Apatite, the most commonly occurring phosphate, is characterised by major features at 9160 nm and 9620 nm [94] that are both due to the asymmetric stretching of PO4asPO4; Table 1). TIR-active vibrational modes of other phosphates, including monazite and xenotime, are described in Clavier et al. [95]. The PO43− anion is readily substituted by AsO43− and VO43− and the respective absorption features are summarised in Adler (1964) [94], who also described the shift in the major TIR features to longer wavelengths with occupation of X in XO43− by P5+, As5+ and V5+ (i.e., with increasing mass and ionic radius of the respective element).
Hydroxyl-related fundamental bending vibrations (δOH), which occur in all hydroxylated minerals, can occur over a large wavelength range between 8000 and 20,000 nm [23] and are, for this reason, not included in Table 4. A summary of the wavelength positions of δOH in clay minerals can be found in Madejová and Komadel [98] and for sulphates in Bishop and Murad [35]. Often, band assignments of hydroxyl bending fundamentals are discussed controversially in the literature, mainly due to overlaps with Si-O valence vibrations (e.g., for sorosilicates, see [102]).
In addition to the diagnostic absorption features of the various mineral groups discussed above, other “features” can be used to infer minerals from TIR reflectance spectra. One of these is the Christiansen frequency, which was defined as “the frequency of maximum transmission in air of a powder film of given thickness and particle size distribution” [103] and corresponds in TIR reflectance spectra to the reflectance minimum at the short-wavelength side of the primary reststrahlen peaks (Figure 7). Corresponding with the type of silicate and wavelength position of the respective primary reststrahlen bands, the Christiansen frequency shifts can be used in the same way as the earlier described felsic–mafic index to identify different igneous rock types [84] and mineral groups [93] and even estimate the SiO2 wt. % [104].
In the case of fine-grained samples, a broad transparency peak occurs and the wavelength position shifts with the changing mineral composition [84]. The transparency peak of reflectance spectra acquired from fine-grained quartz is located at around 11,000 nm [103].
Selected anisotropic minerals, such as quartz, talc and apatite, display an additional characteristic feature in reflectance spectra that separates the primary reststrahlen bands into two regions, producing an “M-shaped” spectral signature. In the transmission spectra of quartz, Spitzer and Kleinmann (1961) [80] attributed this minimum to the close proximity of “a sharp weak resonance … to a strong resonance at longer wavelength so as to fall within the high reflectivity band of the latter”. In the case of quartz, the absorption band of weak resonance is located at 8598 nm (resonance strength of 4πρ = 0.01, with ρ = oscillator strength) and the absorption band of strong resonance is located at 9328 nm (resonance strength of 4pr = 0.67) (Figure 7). In drill core reflectance spectra, Cudahy et al. [85] used the depth of this feature relative to the height of the neighbouring features (i.e., primary reststrahlen bands) to infer the relative abundance of quartz. The same feature can be observed in other anisotropic minerals (Figure 7) and is labelled Resonance Strength Contrast (RSC) in this study.
Figure 7. TIR reflectance spectra of (from top to bottom) quartz (1), pyrophyllite (2), talc (3) and apatite (4). Highlighted are the wavelength positions of respective Resonance Strength Contrast (RSC) features in nm as well as the wavelength range of the primary and secondary reststrahlen bands of quartz (the latter indicated by horizontal lines at the top of the figure). The wavelength position of the Christiansen minimum in each of the reflectance spectra is indicated by a dotted arrow. Reflectance spectra are sourced from the CSIRO’s The Spectral Geologist (TSGTM) software TIR spectral reference library [93].
Minerals 11 00347 g007

3. Feature Extraction

The relative intensity, wavelength position, FWHM and asymmetry of absorption features are useful parameters that can be extracted from hyperspectral reflectance spectra and these have been traditionally used for estimating relative mineral abundance, tracking mineral chemistry and determining crystallinity, amongst other applications. The low spectral resolution of most commercially available field, drill core and remote sensing instruments (when compared to laboratory FTIR spectrometers) only allows, in most cases, the visualisation of absorption features that may comprise several absorption bands. For example, the broad absorption feature of calcic amphiboles in the 2280 to 2340 nm wavelength region comprises up to eight single absorption bands, each of them due to the combination of hydroxyl-related stretching and bending fundamentals [45]. A noticeable exception is the hydroxyl-related absorption features in kaolinite at 2159 and 2209 nm (Table 2), which are well resolved in field and drill core hyperspectral reflectance spectra and represent the combinations of fundamental stretching vibrations at 2705 nm and 2761 nm, respectively, with bending fundamentals at longer wavelengths (Table 3; [41]). Therefore, parameters such as the wavelength position, FWHM and asymmetry are an attempt to capture the more subtle differences in the relative intensities of single absorption bands, which form the resulting shape of the composite absorption feature. Nevertheless, single feature extraction scripts describing the respective absorption feature parameters have been successfully used in mineral exploration and mining applications (e.g., [4,105,106]). Many case studies provide examples for combining single feature extraction scripts into multiple feature extraction scripts (MFEM; [5]) to determine, for example, white mica abundance and white mica composition (e.g., [4,107,108]), kaolin crystallinity [105,109] or mineral assemblage classes [5].
A multitude of methods have been proposed to determine the respective absorption feature parameters from hyperspectral reflectance spectra, ranging from simple band ratios (e.g., [107,108]) to polynomial fitting (e.g., [110]), calculation of first or second derivatives (e.g., [44,111]) or Gaussian deconvolution (e.g., [112]). The underlying method of the single feature extraction scripts presented in this contribution is based on the simple quadratic method (SQM; [112,113]). SQM was originally designed to estimate the wavelength position of absorption features in reflectance spectra, achieving an RMSE of ± 3.8 nm in the SWIR 2 wavelength region. SQM was developed for reflectance spectra collected with hyperspectral instruments where sampling intervals ranged between 2 and 18 nm. This method, in principle, is applicable to all types of hyperspectral reflectance spectra that are collected by the majority of commercially available field spectrometers, drill core sensors, airborne sensors (e.g., HyMap, HyVista Corporation; AVIRIS, NASA/JPL) and even some non-commercial spaceborne sensors (e.g., PRISMA, ASI; Hyperion, NASA/JPL). A major advantage of SQM is that the accuracy of extracting the wavelength position of a targeted absorption feature is largely independent of the number of bands collected in a 2–18-nm interval and independent of the position of the collected bands within this interval. Another advantage of SQM is that it relies on very few bands and, therefore, is computationally inexpensive, in contrast to computationally expensive methods such as those relying on Gaussian deconvolution. It can, however, be influenced by noisy reflectance spectra, which can lead to a misidentification of the spectral signal. In such cases, it is best to first evaluate the quality of the reflectance spectra from which features will be extracted. If they are found to be noisy, the SQM can be extended to encompass a broader number of spectral bands [113,114].
Scripts discussed in this paper were developed and evaluated in The Spectral Geologist software (TSG; Version 8.0.7.4, CSIRO, Perth, WA, Australia, https://research.csiro.au/thespectralgeologist, accessed on 18 February 2021) but can be readily used in, for example, ENVI or calculated using routines in Python, such as the SQM to determine the wavelength position of an absorption feature [112].

3.1. Single Feature Extraction Scripts—SWIR and MIR

Reflectance spectra comprise absorption features due to the respective minerals in the field of view but also to background absorption, or continuum [1,115], which can cause a wavelength shift and, therefore, a misrepresentation of the vibrational modes causing the absorptions. Prior to extracting the relative intensity or wavelength position of a given feature, the continuum (i.e., background) must be removed to normalise the reflectance spectra. Causes of background or continuum shapes and slopes appear to have been poorly studied but include such effects as water, grain size and other mineral spectral characteristics outside the wavelength range being studied. The presented single feature extraction scripts, which build on previous work by Cudahy et al. [4], amongst others, are applied to reflectance spectra. The continuum is removed in the SWIR by division of the reflectance spectrum by the continuum [115], instead of by subtraction, which is applied in the case of apparent absorbance spectra.
Single feature extraction scripts in the volume-scattering-dominated wavelength ranges of the SWIR 1, SWIR 2 and MIR are summarised in Table 5. The underlying vibrational modes and, therefore, the mineral groups that can be characterised using the respective script are listed in Table 1, Table 2 and Table 3, respectively. In the wavelength range dominated by volume scattering, absorption features in reflectance spectra are represented by troughs. The relative intensity (i.e., depth) of an absorption feature is correlated with the relative abundance of the respective absorber [115] and labelled by the centre wavelength position followed by D (for “depth”). For example, to calculate the relative absorption depth of the 2250-nm absorption (“2250D” in Table 5), which is characteristic for minerals including chlorite, biotite and epidote, the continuum is removed between 2230 nm and 2280 nm, after which the depth is determined using a three-band polynomial fit around the band with the lowest reflectance. The wavelength range considered for the local continuum removal encompasses the wavelength range in which the target minerals are typically absorbing (i.e., 2248 to 2268 nm). A feature depth threshold should be applied to prevent mapping features that result from, for example, a low signal-to-noise ratio or low reflectance values associated with minerals such as biotite or samples with high organic content. The set threshold value depends on the investigated mineral assemblage and quality of the reflectance spectra. Single feature extraction scripts for determination of the wavelength position of absorption features are labelled by the centre wavelength position followed by W (for “wavelength”). For example, to calculate the wavelength position of the 2250-nm absorption minimum (“2250W” in Table 5), the continuum is removed between 2230 nm and 2280 nm, after which a three-band polynomial is fit around the band with the lowest reflectance. The feature wavelength scripts should only be applied where an appropriate threshold has been applied to the respective feature depth script (e.g., 2250W where 2250D > 0.005; [105]).

3.2. Binary Discrimination Diagrams—SWIR

The relative intensities of the absorption features calculated by means of single feature extraction scripts can be plotted in binary discrimination diagrams (for example, in the TSG software) in order to identify clusters of predominant mineral species or mineral groups (e.g., [105,118]). Three examples of commonly used binary discrimination diagrams are discussed here, using (1) a collection of reflectance spectra of powder samples that were validated using quantitative X-ray diffraction (QXRD; [119]), and (2) drill core hyperspectral datasets made available by AuScope’s National Virtual Core Library infrastructure program (https://www.auscope.org.au/nvcl, accessed on 18 February 2021) and described in Wells et al. [117], Burley et al. [120] and Moltzen et al. [121].
The first example describes the application of single feature extraction scripts for characterising the presence and compositional variations of hydroxylated sulphate minerals (Figure 8a–c). The relative intensities of the absorption features centred at 1480 nm (“1480D”) and 1760 nm (“1760D”), respectively, are used in the binary discrimination diagram displayed in Figure 8a,b to assist in the differentiation of hydroxylated sulphates and identify compositional changes in some of the respective sulphate mineral species. Jarosite and alunite are characterised by strong absorption at around 1480 nm, but only alunite shows a distinct absorption feature at 1780 nm (Table 1). The latter absorption shifts from 1473 nm in K-rich alunite to 1491 nm in Na-rich alunite [35]. The relative amount of Na and K in alunites has been correlated with the temperature of formation [36]. Chang et al. [37] tracked the wavelength position of the 1480-nm absorption to vector towards the intrusive centre of porphyry Cu-Au deposits. Figure 8b shows an example of HyLogger reflectance spectra of drill core MOD4 presented in Wells et al. [117], who identified potential pathways for hydrothermal fluids in drill cores from the Northern Capricorn Orogen (Western Australia). The binary discrimination diagram is coloured by the wavelength position of the 1480-nm absorption (“1480W”), which clearly identifies the two trends of the “shorter-wavelength” potassic alunite (green sample points in Figure 8b) and the “longer-wavelength” sodic alunite (red sample points in Figure 8b). Example reflectance spectra of Na-alunite (1), K-alunite (2) and jarosite (3) are shown in Figure 8c. Both examples highlight the significance of using the relative intensity and wavelength position of certain absorption features for improving the understanding of hydrothermal, potentially base and/or precious ore-forming mineral systems.
The second example focuses on the discrimination of Al-bearing sheet silicate species from each other, but also from other, often associated minerals (e.g., chlorite) (Figure 8d–f). SWIR 2 reflectance spectra are very sensitive to the absorption features of the three major Al-bearing hydroxylated sheet silicates of the kaolin, white mica and Al-smectite groups. Each of these show a strong absorption feature centred at around 2200 nm (Table 2). In the case of kaolinite, this major absorption is located at 2209 nm and is accompanied by moderate to weak absorption at 2159 nm [41]. In white micas and Al-smectites, the wavelength position of the major absorption shifts from 2185 nm to 2215 nm with increasing replacement of octahedrally and tetrahedrally coordinated Al by Fe2+ or Mg, and Si, respectively (“Tschermak exchange”; [3]). In contrast to Al-smectites, white micas show another major absorption between 2348 and 2366 nm, which also shifts according to the Tschermak exchange. Sonntag et al. [105] used a simple binary discrimination diagram where the relative intensities of the 2160 and 2340 nm absorption features are plotted against each other for samples containing a prominent 2200-nm absorption feature to identify the main Al-bearing sheet silicates present in a given dataset. Reference samples plotted in such a diagram (Figure 8d) show that the top left cluster corresponds to white-mica rich samples (yellow sample points), whereas the vertical cluster highlights non- (or low) aluminium minerals (e.g., chlorite, epidote; green samples). The two distinct clusters to the right highlight kaolin group minerals (bright red) and pyrophyllite (dark red). Due to their distinct and broad absorption at around 2160 nm, alunites are also separated in this binary discrimination diagram (khaki samples). The trends of the major respective clusters are highlighted by grey arrows in Figure 8d,e.
Hyperspectral reflectance spectra collected of drill core ACDCH from the Currowong Hills in NSW (Australia) are used to highlight the potential for identifying the main SWIR-active mineral phases by means of the 2160D/2350D binary discrimination diagram (Figure 8e). Figure 8e is coloured by the relative intensity of the absorption feature at around 2200 nm (“2200D”, increasing intensity from blue to red) to highlight hydroxylated Al-bearing sheet silicates. Although the value ranges of the 2160D/2350D ratios for each of the mineral clusters are not the same, such as in the case of the reference samples (Figure 8d), the respective mineral groups are clearly separated. Representative spectra of the epidote (1), chlorite (2), white mica (3), kaolinite (4), pyrophyllite (5) and alunite (6) are displayed in Figure 8f. In Figure 8f, the reflectance spectra are ordered in such a way that they can be used to vector towards base or precious metal occurrences, beginning with epidote and chlorite as classic representatives of propylitic alteration, to white mica representing sericitic alteration, kaolinite representing argillic alteration and finally reaching the centre of the mineral system marked by pyrophyllite and alunite.
Tri-octahedral sheet silicates of the dark micas (e.g., biotite, phlogopite) produce absorption features at 2250 nm, 2350 nm and 2380 nm and, therefore, significantly overlap with the spectral signatures of other commonly associated minerals such as chlorite (for comprehensive review, see [18]). The identification of dark mica group minerals is furthermore hindered by a typically low reflectance in the SWIR 2 wavelength range. Burley et al. [120] used a binary discrimination diagram to identify potential biotite-bearing samples amongst commonly associated chlorite, amphibole and talc by plotting the relative intensity of the absorption features centred at 2350 nm against the 2250-nm absorption feature (2380D and 2250D, Figure 8g,h), coloured by the wavelength position of the 2320-nm absorption feature (230W). The three respective absorption features present in chlorite, epidote, biotite, amphibole and/or talc (Figure 8i) can be used to discriminate chlorite-dominated reflectance spectra (yellow cluster at high 2250D values) from epidote-dominated (green cluster at high 2250D values), biotite-dominated (green cluster at intermediate 2250D and 2380D values) and amphibole and/or talc-dominated (blue clusters at intermediate to low 2250D and high 2380D values) reflectance spectra. The trends of the respective clusters are highlighted by grey arrows in Figure 8g,h.

3.3. Single Feature Extraction Scripts and Binary Discrimination Diagrams—TIR

Given that surface scattering dominates in the TIR wavelength range, the strongest spectral features in TIR reflectance spectra that are diagnostic for a wide range of minerals are represented by peaks. Single feature extraction scripts in the TIR are summarised in Table 6, which also references previous publications that discuss the application of TIR-based feature extraction scripts for mineral characterisation (e.g., [76,85,91,109]). The underlying vibrational modes and, therefore, the mineral groups that can be characterised using the respective script are listed in Table 4.
The relative intensity of a feature in the TIR (i.e., peak height) is labelled by the centre wavelength position added by P (for “peak”). For example, to calculate the relative height of the garnet-related absorption at around 11,100 nm (band B according to [122] shown in Figure 9; “11100P” in Table 6), a three-band polynomial is fitted around the band with the highest reflectance between 10,800 nm and 11,300 nm. The wavelength position of the same feature is labelled “11100PW” (“W” for “wavelength”). In TIR reflectance spectra, the temperature difference between the sample and the background ΔT (i.e., thermal background) must be considered and removed by applying a ΔT correction [20]. Laukamp et al. [91] applied the 11100P script (“Garnet abundance index TIR parameter ‘B’”) to drill core hyperspectral reflectance spectra collected from drill core and coarse reject samples to estimate the abundance of garnet at the skarn-hosted Cu-Zn-Mo deposit of Antamina (Peru). A comparison of 11100P with garnet abundance (volume %) identified by Particle Mineral Analysis (PMA) data derived from Quantitative Evaluation of Minerals by Scanning Electron Microscopy (QEMSCAN, [123]) shows a good correlation, with an RMSE of 12.7 (Figure 9a). The wavelength position of the same feature at around 11,100 nm (band B), as with other diagnostic TIR features of garnet, shifted according to changes in the garnet composition ([122]; Figure 9c). Plotting the wavelength position of feature B versus garnet feature T (trough between bands B and C; [91]) in a binary discrimination diagram enabled the discrimination of different garnet species (Figure 9b; [91]). Representative reflectance spectra in Figure 9 show a compositional change from grossular (reflectance spectrum ID1956) to andradite (ID1863) and the respective compositional intermediate compositions in the ugrandite solid solution series. Using coarse reject sample material, Laukamp et al. [91] demonstrated that the wavelength position of the 11,100-nm (B) and the 11,300 nm feature (T) can be measured using the respective wavelength scripts (i.e., 11,100PW and 11,300DW) independently of the grain size of the analysed sample material. However, an increasing transparency peak (at around 11,000 nm; [103]), associated with fine-grained quartz, for example, will impact on the relative intensity of the respective garnet-related absorption features and the ability to infer the relative abundance of garnet.
In addition to the features in the TIR, the relative intensity of the RSC (which was described in Section 2.4) can be used to aid mineral characterisation and even estimate the relative abundance of minerals such as quartz (8625D, Table 6; [85,91]). A comparison of the 8625D values with QEMSCAN-derived quartz abundance at the skarn-hosted Cu-Zn-Mo deposit of Antamina, Peru [91] results in an RMSE of 6.4 volume % for estimating the quartz abundance (Figure 9d). A comparison of the quartz abundance values derived from QEMSCAN and estimated by means of the 8625D script with the XRF-derived SiO2 content [91] highlights two major trends of different geochemical composition (Figure 9d). The trend comprising the highest SiO2 values is dominated by quartz and/or carbonate (dotted reflectance spectra in Figure 9f). Reflectance spectra showing high amounts of garnet and quartz (ID1564; ID1884) show lower SiO2 values when compared to samples of the former trend, which show similar QEMSCAN-derived quartz abundance. To further improve the estimation of quartz abundance based on 8625D, these two clusters would have to be considered separately.
Another method for estimating the quartz abundance based on TIR reflectance values is the band ratio of the reflectance at 8250 nm (R8250) divided by the reflectance at 7400 nm (R7400). Cudahy et al. [85] applied this band ratio for estimating the relative quartz abundance in the Archean Au deposit of St Ives (Eastern Yilgarn Craton, Western Australia). When comparing R8250/R7400 to the QEMSCAN-derived quartz abundance from Antamina [91], a clear correlation was achieved for quartz content for values of less than 25% (Figure 9e). In the case of higher QEMSCAN-derived quartz values, the band ratio was insufficient for the estimation of the quartz abundance. However, it should be noted that the above evaluation of both the garnet and quartz scripts depends on the quality of the QEMSCAN data. Moreover, as with all other scripts that are used for inferring the relative abundance or composition of minerals from TIR reflectance spectra, it is recommended to consider background effects, such as the temperature difference between the sample and the background ΔT (i.e., thermal background) [20].

3.4. Impact of Grain Size Variations on SWIR, MIR and TIR Scripts

The impact of grain size on the SWIR, MIR and TIR reflectance spectra of minerals and mineral assemblages has been previously observed by many [7,25,26,103]. For example, the relative intensity of the νSiO vibration is both grain-size- and porosity-dependent [7]. Coarse-grained quartz at 75-to-250-mm powder size, for example, shows a strong spectral contrast with well-resolved reststrahlen bands, which are dampened in the 0–75-μm size fraction [26]. When reducing the grain size of the analysed material (i.e., the particle diameter d), the IR radiation interacts with more interfaces, which decreases the magnitude of RS. At the same time, a decrease in d leads to an increase in RV. Therefore, features will decrease with decreasing grain size and, in some minerals, such as calcite, switch from peaks when surface scattering dominates to troughs when volume scattering dominates at fine grain size [25]. The particle size at which the switch occurs depends on the type of mineral along with the strength of the vibrational mode and the wavelength position of the respective absorption.
Understanding the grain-size-related changes in the infrared spectral signatures is crucial for accurate mineral characterisation and quantification by means of feature extraction scripts. A set of quartz–kaolinite mixtures [124] using eleven different quartz grain size fractions (>38 to 1000 μm) and a kaolinite standard KGa-1b (<2 μm) was used to demonstrate (1) the changes in quartz reflectance spectral signatures over the MIR and TIR wavelength regions and their impact on single feature extraction scripts, and (2) the impact of grain size variations of quartz on the estimation of kaolinite content from SWIR, MIR to TIR spectral signatures. The reflectance spectra spanning the 2000 to 16,000 nm wavelength range were obtained on the mineral mixtures using an FTIR spectrometer equipped with an integrating sphere sampling accessory [124].
The band ratio of the reflectance at 8250 nm (R8250) divided by the reflectance at 7400 nm (R7400) is calculated for different quartz grain sizes in the quartz–kaolinite mixtures (Figure 10a). Using the finest-grained quartz (i.e., >38 μm), the R8250/R7400 increased linearly with increasing quartz abundance in the quartz–kaolinite mixtures, except for the pure quartz sample, where the applied band ratio almost doubles (Figure 10a). An increasing quartz grain size results in an increasing deviation from this linear correlation. TIR spectral signatures of quartz–kaolinite mixtures show that kaolinite heavily overlaps with the primary reststrahlen bands of quartz. However, only the longer-wavelength part of the primary reststrahlen band of quartz is heavily overprinted by a kaolinite-related absorption, whereas the shorter reststrahlen band decreases in overall intensity with increasing kaolinite content. For comparison, the intensity of the RSC feature of quartz at 8625 nm increases linearly with quartz abundance in the quartz–kaolinite mineral mixtures when the 250-μm quartz grain size fraction is used (Figure 10b). Decreasing the quartz grain size in the mixture with kaolinite results in a parabolic correlation between 8625D values and quartz abundance. Quartz grain sizes at 500 μm and 1000 μm show only weak to no correlation. Figure 10c shows the relationship between the relative depth of the quartz-related MIR absorption feature at around 4470 nm (4470D), tentatively assigned to 2νSiO, and the quartz abundance in the quartz–kaolinite mixtures. In this case, the 90-μm quartz grain size shows a linear correlation between the quartz abundance and the single feature extraction script 4470D.
Hydroxyl-related combination bands of kaolinite in the SWIR 2 at 2160 and 2206 nm (Table 2) and in the MIR at around 2705 and 2761 nm (Table 3) are commonly used for estimating kaolinite abundance. The nominally anhydrous quartz does not produce any absorptions that overlap with the stretching fundamentals in the MIR or the hydroxyl-related combination bands in the SWIR 2. However, as demonstrated by the plot showing the relative intensity of the 2200-nm absorption depth (Figure 10d), a specific range of quartz grain sizes has a substantial impact on the intensity of these kaolinite-related absorptions, with finer grain sizes having the least effect and grain size ranges between 125 and 1000 μm having the largest impact [124]. The intensity of the 2200-nm absorption feature in kaolinite increases almost linearly with increasing kaolinite abundance in quartz–kaolinite mixtures where the quartz grain size is >38 μm (Figure 10d). At quartz grain sizes between 180 and 1000 μm, 2200D shows almost no changes. When comparing the relative intensity of 2νSiO in kaolinite at around 5480 nm (Table 3) with the kaolinite abundance, mixtures using a 180-μm quartz grain size show a linear correlation (Figure 10e). As in the case of absorption features related to hydroxyls, coarser quartz grain sizes dampen this correlation. When considering quartz grain sizes of less than 150 mm, 5480D decreases rapidly with decreasing kaolinite abundance, reaching the lowest value in the 40/60 quartz–kaolinite mixtures and increasing again in samples with less than 30% kaolinite. The relative intensity of the kaolinite-related feature at around 9500 nm (Table 4) decreases steeply and linearly at small quartz grain sizes in the quartz–kaolinite mixtures (Figure 10f). With increasing quartz grain size, the correlation between 9500P and kaolinite abundance becomes less obvious. The here described impact of grain size variations of quartz on reflectance spectra of quartz–kaolinite mixtures highlights the importance of taking the components of mineral assemblages and their respective grain size ranges into account when applying single (and multiple) feature extraction scripts.

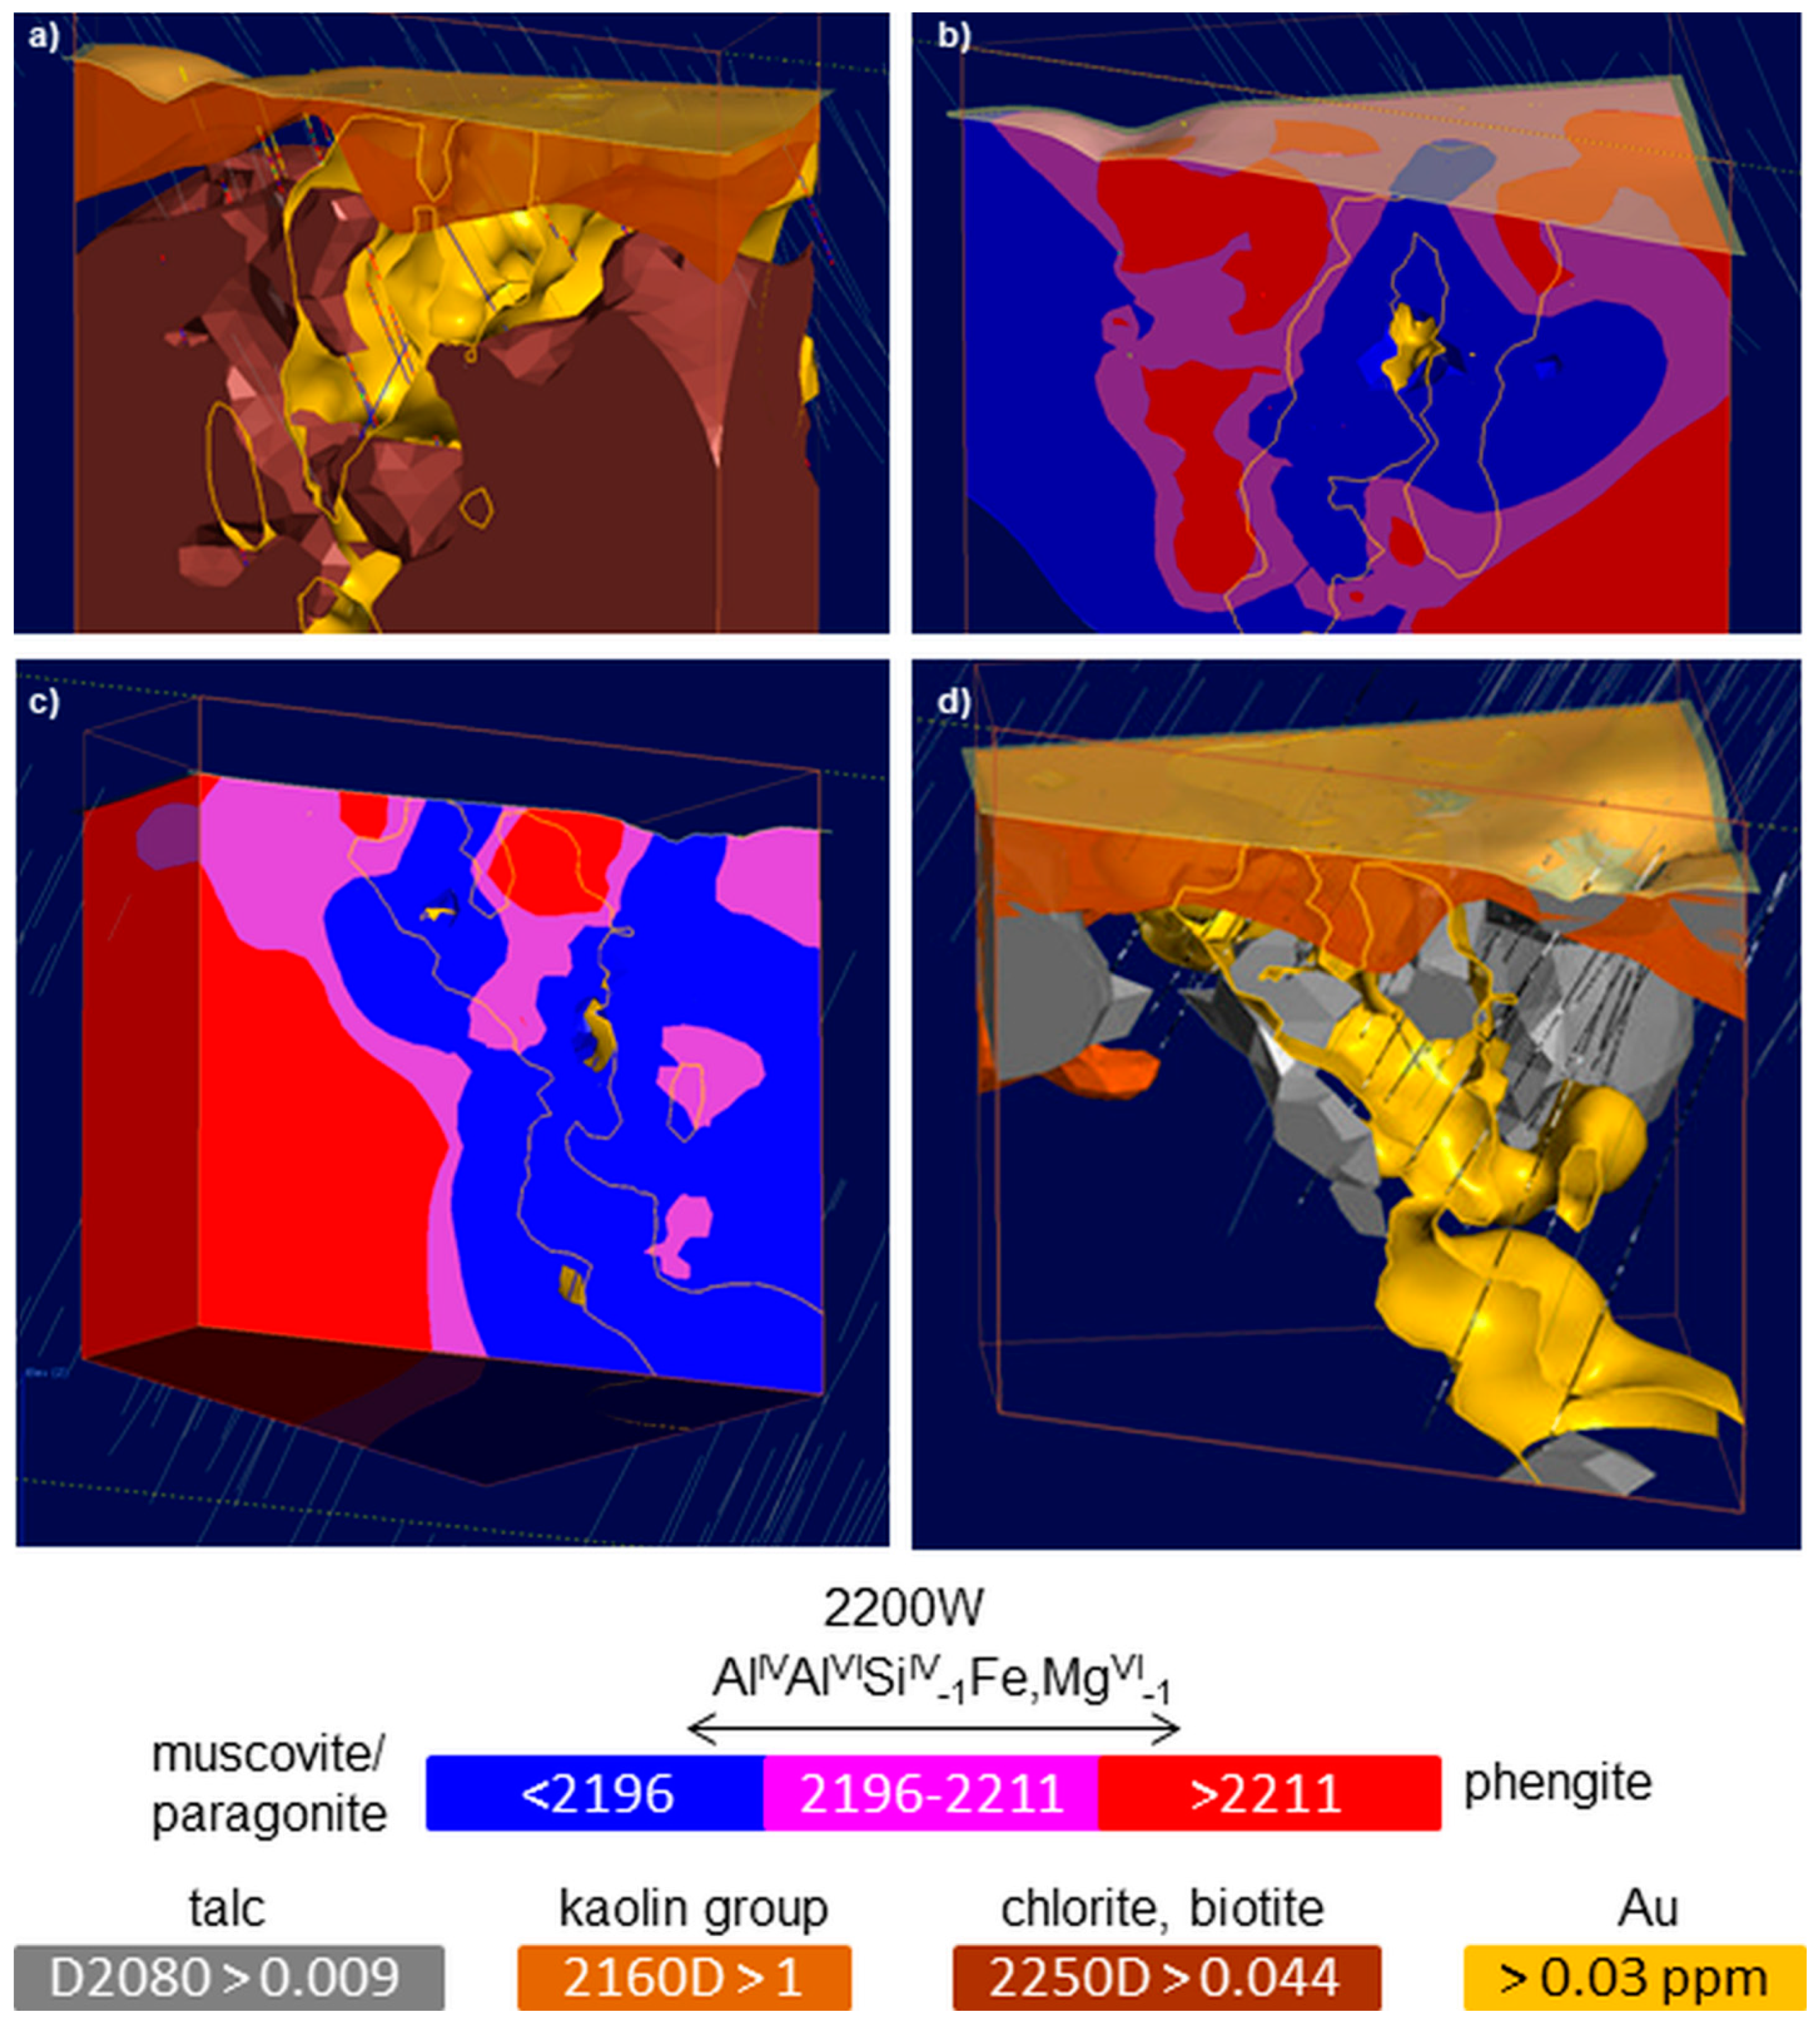
3.5. 3D Mineral Mapping

Mapping of the mineral footprints of base and precious metal deposits is often hindered by substantial weathering profiles developed atop buried mineralisation. Understanding the mineralogical and geochemical trends in the weathering profile can be crucial for enabling successful exploration. The presented single feature extraction scripts can be applied to a wide range of hyperspectral proximal and remote reflectance data, enabling the integration of surface and subsurface data in three-dimensional mineral maps that aid mineral exploration and resource characterisation. For example, Haest et al. [107,108] extracted quantitative mineralogy from airborne and drill core hyperspectral data covering the Rocklea Dome channel iron deposit (Western Australia), by calibrating the feature extraction scripts with X-ray fluorescence (XRF) measurements. Mineral abundance estimates from airborne hyperspectral data were corrected for vegetation cover and validated against hyperspectral data collected with a field spectrometer on the ground. Integration of the VNIR-SWIR reflectance spectroscopy-based map of transported sediments, with drill core mineralogy, into one seamless 3D mineral model helped to improve (1) the determination of the channel–basement contact by means of an absorption-feature-based kaolin crystallinity index, (2) the delineation of the resource by adding continuous iron (oxyhydr-)oxide abundance data at the surface to sparse data points at depth collected along the drill strings, and (3) the characterisation of channel iron ore and potential penalty minerals (i.e., clays) by better mapping the mineralogical zones within the ore body, such as clay horizons interlayered with high-grade channel iron ore horizons.
Another example for the integration of different hyperspectral datasets was described by Laukamp et al. [125], who combined drill core hyperspectral and geochemical data in a 3D mineralogical/geochemical model that allowed an evaluation of which footprints, associated with gold mineralisation hosted by greenstones in the Bulong area of the Eastern Goldfields (Western Australia), could be discovered at the surface. Greenstones of the Bulong mafic–ultramafic sequence comprise komatiitic rocks of mesocumulate and orthocumulate character, as well as dunites within a sequence of high-Mg basalts [126]. The peridotitic, layered sills are represented by thick sections of serpentinised, olivine-rich cumulates that are capped by thin altered pyroxenites and norites [127]. The ultramafic rocks are completely serpentinised and affected by local talc–carbonate alteration in association with transverse shears and lithologic contacts [126]. Lithologies in the study area have undergone several phases of alteration, including (1) alteration pre-dating gold deposition (e.g., serpentinisation), (2) alteration coeval with gold deposition (e.g., potassic alteration), and (3) weathering. Primary mineral assemblages have been largely obliterated and subsequent metamorphism and hydrothermal alteration has led to mineral assemblages dominated by hydroxylated silicates (e.g., amphiboles, chlorites, dark micas, serpentine, talc, white micas), carbonates, feldspars (e.g., albite, anorthite), quartz, iron oxides, sulphides and spinel phases (e.g., chromite, magnetite). Intensive weathering had a substantial impact on the mineral assemblages. Depending on the original composition of the bedrock and the intensity/type of hydrothermal alteration, feldspars, amphiboles, dark micas and chlorites were replaced by an assemblage of kaolin group minerals (including Fe-rich kaolinites) and Fe-Mg sheet silicates (e.g., chlorite and serpentine to vermiculite). Of the alteration minerals, white micas and talc are more stable in the regolith profile and are present at detectable quantities at the surface.
A suite of single and multiple feature extraction scripts for the characterisation of regolith and outcropping/covered prospective lithologies, as well as identification of mineral footprints associated with known and potential gold mineralisation, were generated from drill core reflectance spectra (“HyLogger3” and “HCI3”; Corescan Pty Ltd., Perth, WA, Australia). The geochemical data obtained with portable XRF (“pXRF”; Olympus Innov-X 50 kV Delta, Tokyo, Japan) were compared with the HyLogger3 reflectance spectra. Selected single feature extraction scripts (e.g., 2250D; Table 2) produced from the HyLogger3 and HCI3-derived subsurface data were combined to create 3D mineral surfaces (Figure 11) in 3D modelling software package LeapfrogTM (version, SEEQUENT, Christchurch, New Zealand, http://www.leapfrog3d.com, accessed on 18 February 2021).
Based on the hyperspectral drill core data, the ultramafic and mafic rocks show large mineralogical variability. Two major populations of the ultramafic rocks are characterised by high biotite–chlorite contents (brown shell in Figure 11a based on 2250D > 0.044) and high talc contents (grey shell in Figure 11d based on 2080D > 0.009), respectively. In contrast, mafic rocks are almost devoid of talc but contain more amphiboles. Three-dimensional models of the biotite–chlorite and talc inferred from the 2250-nm and 2080-nm absorption features, respectively, clearly show that talc–carbonate alteration occurs proximal to gold, whereas biotite–chlorite is distal (Figure 11a,d). The large population of ultramafic rocks affected by talc–carbonate alteration is also evident in the TIR reflectance spectra collected using HyLogger3. Au values are higher in mafic rocks when compared to ultramafic rocks. The white mica composition changes from Al-rich white mica (e.g., muscovite) proximal to Au mineralisation to Al-poor white mica (e.g., phengite) distal to Au mineralisation. The Tschermak exchange in white micas (AlVIAlIV(Fe,Mg)VI−1SiIV−1; [3]) has been reported in numerous studies of hydrothermally altered mineral systems [106,128,129].
The depth variations in the regolith atop mafic and ultramafic rocks can be mapped from the presence of kaolinite, inferred from the 2160D (Table 2) values larger than 1 (orange shell in Figure 11a,d). The regolith can contain kaolinite with or without iron, where a small absorption feature located at around 2240 nm, in combination with the major kaolinite-related features at 2160 and 2200 nm, indicates Fe-rich kaolinite (Table 2). A cluster of gold-bearing samples is associated with Fe-rich kaolinite in saprolitic mafic rocks. Weathered ultramafic rocks do not contain elevated amounts of gold. Importantly, the biotite–chlorite mineral footprint does not continue through the regolith to the surface (Figure 11a), whereas the talc mineral signature (Figure 11d) and the white mica compositional changes do (Figure 11b,c). This has significant implications for the use of airborne hyperspectral reflectance spectra for mapping mineral footprints associated with base and/or precious metals. In the Bulong area, airborne hyperspectral data (“HyMap”; HyVista Corporation) confirmed the presence of phengitic white micas distal to the gold mineralisation. However, due to issues with vegetation and related overlapping absorptions with talc and carbonate, talc–carbonate alteration could not be found in the airborne hyperspectral data.

4. Conclusions

This paper presents detailed explanations of the source spectroscopic and physicochemical processes giving rise to specific absorption features and their chemical meaning and value. A large range of rock-forming and alteration minerals display diagnostic spectral signatures over the SWIR 1, SWIR 2, MIR and TIR wavelength ranges, which can be used for determining the presence and relative abundance of mineral groups and mineral species and their physicochemical variations. However, different minerals produce absorption features in specific wavelength regions. It is, therefore, important to choose a spectrometer that covers the wavelength region in which the mineral assemblage of interest produces diagnostic features.
Although the vibrational modes underlying the respective absorption bands are well documented and understood for the majority of rock-forming and alteration minerals, there are significant gaps in knowledge with respect to absorption bands appearing in the longer-wavelength range of the MIR (i.e., 3500 to 5500 nm), particularly in the case of overtones of major TIR-active vibrational modes (e.g., 2νSiO in nominally anhydrous silicates). Furthermore, various complex scattering behaviours occur in the MIR wavelength region (i.e., from dominantly volume scattering in the shorter-wavelength MIR to dominantly surface scattering in the TIR), and this can make mineral quantification a significant challenge. More work on spectral reference libraries and research on the complex scattering behaviours of mixed mineral assemblages and the resulting impact in mineral diagnostic absorption features are required.
In addition, most currently commercially available instruments collecting reflectance spectra in the SWIR operate at a spectral resolution at which the single absorption bands are “lumped” together in broad absorption features. For example, the wavelength “shifts” of hydroxyl-related absorption features associated with differences in chemical composition of the respective mineral species are, in fact, due to changes in the relative intensity of single absorption bands, each of them corresponding to a specific vibrational mode with its specific cation environment. Furthermore, previously published assignments of absorption features (e.g., “FeOH” of the 2250-nm absorption and “MgOH” of the 2350-nm absorption) have led to a misinterpretation of the physicochemical significance of the absorption features. The aim of this contribution is to clarify these fundamental issues in hyperspectral sensing data interpretation and empower the user with the full suite of mineralogical information contained within reflectance spectra. Spectrometers with higher spectral resolution (e.g., Spectral Evolution’s oreXpert field portable UV-VIS-NIR spectrometer, Haverhill, MA, USA) than most of the currently available commercial instrumentation will improve the understanding of mineral diagnostic absorption features in the SWIR.
Single (and multiple) feature extraction scripts have been used routinely in the mineral resources sector to extract the relative intensity, wavelength position, FWHM and asymmetry to infer from reflectance spectra the mineral assemblage and differences in chemical composition and crystallinity. The presented single feature extraction scripts have all been developed based on the same underlying method (i.e., SQM and hull/background removal) and can be easily applied in common software packages used for the interpretation of hyperspectral reflectance spectra.
Single feature extraction scripts are only one method amongst many for mineral characterisation by means of reflectance spectroscopy. An advantage of feature extraction scripts is that the presence of minerals can be successfully inferred from the reflectance spectra acquired from material of different grain sizes. The application of spectral libraries in hyperspectral reflectance spectra collected from material of varying grain sizes is compromised by the associated significant changes in scattering behaviour and additional features that are not directly related to the respective vibrational modes (e.g., transparency feature). This paper highlights that single feature extraction scripts applied to SWIR 1, SWIR 2, MIR and TIR reflectance spectra can be used to determine the relative intensity and therefore the relative abundance of a large range of minerals. However, better results for estimating mineral abundance can be achieved when the mineral assemblage and the grain size of the respective components are considered (e.g., the kaolinite abundance when the quartz grain size is considered). The interpretation of hyperspectral reflectance spectra using the described single feature extraction scripts also needs to take mixed mineral assemblages and potentially overlapping absorption features into account. The application of feature extraction scripts to mineral groups that produce complex spectral signatures, such as feldspars in the TIR wavelength region, where compositional variability and the orientation of single crystals play a significant role (e.g., [130]), poses a challenge, and other data processing routines, such as mineral matching methods, may provide better results. The choice of spectrometer is dependent on the mineral assemblage of interest and so is the choice of processing methods.

Author Contributions

Conceptualisation, C.L.; methodology, C.L., A.R. and I.C.L.; software, A.R. and N.F.; validation, C.L., I.C.L. and M.L.; investigation, C.L., M.L., J.S., B.P., H.L., I.C.L., E.R. and A.R.; data curation, C.L., M.L., B.P. and I.C.L.; writing—original draft preparation, C.L.; writing—review and editing, M.L., J.S., B.P., H.L., I.C.L. and A.R.; visualisation, C.L. and J.S.; supervision, C.L. All authors have read and agreed to the published version of the manuscript.

Funding

This research received no external funding.

Institutional Review Board Statement

Not applicable.

Informed Consent Statement

Not applicable.

Data Availability Statement

HyLogger3 drill core data used in this contribution were collected in the frame of the National Virtual Core Library project and are available from AuScope’s Discovery Portal (http://portal.auscope.org.au/), accessed on 22 March 2021.

Acknowledgments

First and foremost, Carsten Laukamp would like to thank Tom Cudahy (C3DMM), who inspired this work. Peter Mason (formerly CSIRO), supported by Jon Huntington, Sasha Pontual, and Andy Green, is thanked for making the world of spectral sensing accessible to geologists via the TSG software. The Geological Survey of Western Australia and the Geological Survey of New South Wales are thanked for collecting HyLoggerTM data of drill cores MOD4 (Ashburton Basin, WA, Australia), MFED029 (Fisher East nickel sulphide project, WA, Australia), ACDCH (Currowong Hills, NSW, Australia) under the auspices of the National Virtual Core Library project, funded by AuScope under the Australian Government’s NCRIS scheme. Andy Green, Rob Hewson, and Jon Huntington are thanked for commenting on early versions of the manuscript. We thank the reviewers for many helpful comments and suggestions. TSG is a registered trademark of the CSIRO.

Conflicts of Interest

The authors declare no conflict of interest.

References

  1. Clark, R.N.; King, T.V.V.; Klejwa, M.; Swayze, G.A.; Vergo, N. High Spectral Resolution Reflectance Spectroscopy of Minerals. J. Geophys. Res. 1990, 95, 12653. [Google Scholar] [CrossRef] [Green Version]
  2. Murray, H.H. Correlation of Paper-Coating Quality with Degree of Crystal Perfection of Kaolinite. Clays Clay Miner. 1955, 4, 31–40. [Google Scholar] [CrossRef]
  3. Vedder, W.; McDonald, R.S. Vibrations of the OH Ions in Muscovite. J. Chem. Phys. 1963, 38, 1583–1590. [Google Scholar] [CrossRef]
  4. Cudahy, T.; Jones, M.; Thomas, M.; Laukamp, C.; Caccetta, M.; Hewson, R.; Rodger, A.; Verrall, M. Next Generation Mineral Mapping: Queensland Airborne HyMap and Satellite ASTER Surveys 2006–2008; CSIRO Report P2007/364; CSIRO: Canberra, Australia, 2008; p. 161. [Google Scholar]
  5. Laukamp, C.; Cudahy, T.; Caccetta, M.; Chia, J.; Gessner, K.; Haest, M.; Liu, Y.C.; Rodger, A. The Uses, Abuses and Opportunities for Hyperspectral Technologies and Derived Geoscience Information; AIG Bulletin: Crows Nest, NSW, Ausatralia, 2010; Volume 51, pp. 73–76. [Google Scholar]
  6. Laukamp, C.; LeGras, M.; Lau, I.C. Hyperspectral Proximal Sensing Instruments and Their Applications for Exploration through Cover. In Portable Spectroscopy and Spectrometry 2: Applications; Crocombe, R., Ed.; Wiley: Hoboken, NJ, USA, 2021. [Google Scholar]
  7. Lyon, R.J.P. Stanford Research Institute; United States; National Aeronautics and Space Administration. In Evaluation of Infrared Spectrophotometry for Compositional Analysis of Lunar and Planetary Soils; National Aeronautics and Space Administration: Washington, DC, USA, 1963. [Google Scholar]
  8. The Layer Silicates. The Infrared Spectra of Minerals; Farmer, V.C., Ed.; Mineralogical Society of Great Britain and Ireland: London, UK, 1974; pp. 331–363. [Google Scholar] [CrossRef]
  9. Hunt, G.R. Spectral Signatures in Particulate Minerals in the Visible and near Infrared. GEOPHYSICS 1977, 42, 501–513. [Google Scholar] [CrossRef] [Green Version]
  10. Cudahy, T.; Caccetta, M.; Thomas, M.; Hewson, R.; Abrams, M.; Kato, M.; Kashimura, O.; Ninomiya, Y.; Yamaguchi, Y.; Collings, S.; et al. Satellite-Derived Mineral Mapping and Monitoring of Weathering, Deposition and Erosion. Sci. Rep. 2016, 6, 23702. [Google Scholar] [CrossRef] [PubMed]
  11. Laukamp, C.; Cudahy, T.; Thomas, M.; Jones, M.; Cleverley, J.S.; Oliver, N.H.S. Hydrothermal Mineral Alteration Patterns in the Mount Isa Inlier Revealed by Airborne Hyperspectral Data. Aust. J. Earth Sci. 2011, 58, 917–936. [Google Scholar] [CrossRef]
  12. Van Ruitenbeek, F.J.A.; Debba, P.; van der Meer, F.D.; Cudahy, T.; van der Meijde, M.; Hale, M. Mapping White Micas and Their Absorption Wavelengths Using Hyperspectral Band Ratios. Remote Sens. Environ. 2006, 102, 211–222. [Google Scholar] [CrossRef]
  13. Van der Meer, F.D.; van der Werff, H.M.A.; van Ruitenbeek, F.J.A.; Hecker, C.A.; Bakker, W.H.; Noomen, M.F.; van der Meijde, M.; Carranza, E.J.M.; de Smeth, J.B.; Woldai, T. Multi- and Hyperspectral Geologic Remote Sensing: A Review. Int. J. Appl. Earth Obs. Geoinf. 2012, 14, 112–128. [Google Scholar] [CrossRef]
  14. Burns, R.G. Mineralogical Applications of Crystal Field Theory, 2nd ed.; Cambridge University Press: Cambridge, UK, 1993. [Google Scholar] [CrossRef] [Green Version]
  15. Chukanov, N.V. Infrared Spectra of Mineral Species: Extended Library, 1st ed.; Springer Geochemistry/Mineralogy; Springer Netherlands: Imprint; Springer: Dordrecht, The Netherlands, 2014. [Google Scholar] [CrossRef]
  16. Povarennykh, A.S. The Use of Infrared Spectra for the Determination of Minerals. Am. Miner. 1978, 63, 956–959. [Google Scholar]
  17. McLeod, R.L.; Gabell, A.R.; Green, A.A.; Gardavsky, V. Chlorite Infrared Spectral Data as Proximity Indicators of Volcanogenic Massive Sulphide Mineralisation; Pascal and Francis: Gold Coast, Australia, 1987. [Google Scholar]
  18. Lypaczewski, P.; Rivard, B. Estimating the Mg# and AlVI Content of Biotite and Chlorite from Shortwave Infrared Reflectance Spectroscopy: Predictive Equations and Recommendations for Their Use. Int. J. Appl. Earth Obs. Geoinf. 2018, 68, 116–126. [Google Scholar] [CrossRef]
  19. Gaffey, S.J. Spectral Reflectance of Carbonate Minerals in the Visible and near Infrared (0.35–2.55 Microns); Calcite, Aragonite, and Dolomite. Am. Miner. 1986, 71, 151–162. [Google Scholar]
  20. Schodlok, M.C.; Whitbourn, L.; Huntington, J.; Mason, P.; Green, A.; Berman, M.; Coward, D.; Connor, P.; Wright, W.; Jolivet, M.; et al. HyLogger-3, a Visible to Shortwave and Thermal Infrared Reflectance Spectrometer System for Drill Core Logging: Functional Description. Aust. J. Earth Sci. 2016, 63, 929–940. [Google Scholar] [CrossRef]
  21. Loizzo, R.; Guarini, R.; Longo, F.; Scopa, T.; Formaro, R.; Facchinetti, C.; Varacalli, G. Prisma: The Italian Hyperspectral Mission. In Proceedings of the IGARSS 2018-2018 IEEE International Geoscience and Remote Sensing Symposium, Valencia, Spain, 22–27 July 2018; pp. 175–178. [Google Scholar]
  22. Kaufmann, H.; Segl, K.; Guanter, L.; Hofer, S.; Foerster, K.P.; Stuffler, T.; Mueller, A.; Richter, R.; Bach, H.; Hostert, P.; et al. Environmental Mapping and Analysis Program (EnMAP)—Recent Advances and Status. In Proceedings of the IGARSS 2008-2008 IEEE International Geoscience and Remote Sensing Symposium, Boston, MA, USA, 7–11 July 2008; pp. 109–112. [Google Scholar]
  23. Moenke, H.H.W. Vibrational Spectra and the Crystal-Chemical Classification of Minerals. In The Infrared Spectra of Minerals; Farmer, V.C., Ed.; Mineralogical Society of Great Britain and Ireland: Londan, UK, 1974; pp. 111–118. [Google Scholar] [CrossRef]
  24. Agar, R.A. REMOTE SENSING: Geoscan Airborne Multi-Spectral Scanners as Exploration Tools for Western Australian Diamond and Gold Deposits. ASEG Ext. Abstr. 1994, 1994, 433–448. [Google Scholar] [CrossRef]
  25. Vincent, R.K.; Hunt, G.R. Infrared Reflectance from Mat Surfaces. Appl. Opt. 1968, 7, 53. [Google Scholar] [CrossRef]
  26. Salisbury, J.W.; Wald, A. The Role of Volume Scattering in Reducing Spectral Contrast of Reststrahlen Bands in Spectra of Powdered Minerals. Icarus 1992, 96, 121–128. [Google Scholar] [CrossRef]
  27. Kustov, L. Spectra of Hydroxyl Groups in Zeolites in the Near-Infrared Region. J. Catal. 1981, 72, 149–159. [Google Scholar] [CrossRef]
  28. Petit, S.; Martin, F.; Wiewiora, A.; De Parseval, P.; Decarreau, A. Crystal-Chemistry of Talc: A near Infrared (NIR) Spectroscopy Study. Am. Miner. 2004, 89, 319–326. [Google Scholar] [CrossRef]
  29. Strens, R.G.J. The Common Chain, Ribbon, and Ring Silicates. In The Infrared Spectra of Minerals; Farmer, V.C., Ed.; Mineralogical Society of Great Britain and Ireland: Londan, UK, 1974; pp. 305–330. [Google Scholar] [CrossRef]
  30. Langer, K.; Raith, M. Infrared Spectra of Al-Fe(III)-Epidotes and Zoisites, Ca2(Al1-p Fe3+p)Al2O(OH)[Si2O7][SiO4]. Am. Miner. 1974, 59, 1249–1258. [Google Scholar]
  31. LeGras, M.; Laukamp, C.; Lau, I.; Mason, P. NVCL Spectral Reference Library—Phyllosilicates Part 2: Micas; CSIRO Report EP183095; CSIRO: Canberra, Australia, 2018. [Google Scholar]
  32. White, A.J.R.; Laukamp, C.; Stokes, M.A.; Legras, M.; Pejcic, B. Vibrational Spectroscopy of Epidote, Pumpellyite and Prehnite Applied to Low-Grade Regional Metabasites. Geochem. Explor. Environ. Anal. 2017, 17, 315–333. [Google Scholar] [CrossRef]
  33. Roache, T.J.; Walshe, J.L.; Huntington, J.F.; Quigley, M.A.; Yang, K.; Bil, B.W.; Blake, K.L.; Hyvärinen, T. Epidote–Clinozoisite as a Hyperspectral Tool in Exploration for Archean Gold. Aust. J. Earth Sci. 2011, 58, 813–822. [Google Scholar] [CrossRef]
  34. Krohn, M.D.; Altaner, S.P. Near-infrared Detection of Ammonium Minerals. GEOPHYSICS 1987, 52, 924–930. [Google Scholar] [CrossRef]
  35. Bishop, J.L.; Murad, E. The Visible and Infrared Spectral Properties of Jarosite and Alunite. Am. Miner. 2005, 90, 1100–1107. [Google Scholar] [CrossRef]
  36. Stoffregen, R.E.; Cygan, G.L. An Experimental Study of Na-K Exchange between Alunite and Aqueous Sulfate Solutions. Am. Miner. 1990, 75, 209–220. [Google Scholar]
  37. Chang, Z.; Hedenquist, J.W.; White, N.C.; Cooke, D.R.; Roach, M.; Deyell, C.L.; Garcia, J.; Gemmell, J.B.; McKnight, S.; Cuison, A.L. Exploration Tools for Linked Porphyry and Epithermal Deposits: Example from the Mankayan Intrusion-Centered Cu-Au District, Luzon, Philippines*. Econ. Geol. 2011, 106, 1365–1398. [Google Scholar] [CrossRef] [Green Version]
  38. Turner, D.J.; Rivard, B.; Groat, L.A. Visible and Short-Wave Infrared Reflectance Spectroscopy of REE Fluorocarbonates. Am. Miner. 2014, 99, 1335–1346. [Google Scholar] [CrossRef]
  39. Turner, D.J.; Rivard, B.; Groat, L.A. Visible and Short-Wave Infrared Reflectance Spectroscopy of REE Phosphate Minerals. Am. Miner. 2016, 101, 2264–2278. [Google Scholar] [CrossRef]
  40. Turner, D.J.; Rivard, B.; Groat, L.A. Visible and Short-Wave Infrared Reflectance Spectroscopy of Selected REE-Bearing Silicate Minerals. Am. Miner. 2018, 103, 927–943. [Google Scholar] [CrossRef]
  41. Frost, R.L.; Johansson, U. Combination Bands in the Infrared Spectroscopy of Kaolins—A Drift Spectroscopic Study. Clays Clay Miner. 1998, 46, 466–477. [Google Scholar] [CrossRef]
  42. Bishop, J.; Madejová, J.; Komadel, P.; Fröschl, H. The Influence of Structural Fe, Al and Mg on the Infrared OH Bands in Spectra of Dioctahedral Smectites. Clay Miner. 2002, 37, 607–616. [Google Scholar] [CrossRef]
  43. Gionis, V. On the Structure of Palygorskite by Mid- and near-Infrared Spectroscopy. Am. Miner. 2006, 91, 1125–1133. [Google Scholar] [CrossRef]
  44. Mathian, M.; Hebert, B.; Baron, F.; Petit, S.; Lescuyer, J.-L.; Furic, R.; Beaufort, D. Identifying the Phyllosilicate Minerals of Hypogene Ore Deposits in Lateritic Saprolites Using the Near-IR Spectroscopy Second Derivative Methodology. J. Geochem. Explor. 2018, 186, 298–314. [Google Scholar] [CrossRef]
  45. Laukamp, C.; Termin, K.A.; Pejcic, B.; Haest, M.; Cudahy, T. Vibrational Spectroscopy of Calcic Amphiboles—Applications for Exploration and Mining. Eur. J. Miner. 2012, 24, 863–878. [Google Scholar] [CrossRef]
  46. Cloutis, E.; Hawthorne, F.; Mertzman, S.; Krenn, K.; Craig, M.; Marcino, D.; Methot, M.; Strong, J.; Mustard, J.; Blaney, D. Detection and Discrimination of Sulfate Minerals Using Reflectance Spectroscopy. Icarus 2006, 184, 121–157. [Google Scholar] [CrossRef]
  47. Felzer, B.; Hauff, P.; Goetz, A.F.H. Quantitative Reflectance Spectroscopy of Buddingtonite from the Cuprite Mining District, Nevada. J. Geophys. Res. Solid Earth 1994, 99, 2887–2895. [Google Scholar] [CrossRef]
  48. Zhang, M.; Wang, L.; Hirai, S.; Redfern, S.A.T.; Salje, E.K.H. Dehydroxylation and CO2 Incorporation in Annealed Mica (Sericite): An Infrared Spectroscopic Study. Am. Miner. 2005, 90, 173–180. [Google Scholar] [CrossRef]
  49. Reddy, B.J.; Frost, R.L.; Martens, W.N.; Wain, D.L.; Kloprogge, J.T. Spectroscopic Characterization of Mn-Rich Tourmalines. Vib. Spectrosc. 2007, 44, 42–49. [Google Scholar] [CrossRef] [Green Version]
  50. Bishop, J.L.; Lane, M.D.; Dyar, M.D.; Brown, A.J. Reflectance and Emission Spectroscopy Study of Four Groups of Phyllosilicates: Smectites, Kaolinite-Serpentines, Chlorites and Micas. Clay Miner. 2008, 43, 35–54. [Google Scholar] [CrossRef]
  51. Ruan, H.D.; Frost, R.L.; Kloprogge, J.T. Application of Near-Infrared Spectroscopy to the Study of Alumina Phases. Appl. Spectrosc. 2001, 55, 190–196. [Google Scholar] [CrossRef]
  52. Meunier, A. Clays; Springer: Berlin/Heidelberg, Germany; New York, NY, USA, 2010. [Google Scholar]
  53. Crowley, J.K. Near-Infrared Reflectance Spectra of Mixtures of Kaolin-Group Minerals: Use in Clay Mineral Studies. Clays Clay Miner. 1988, 36, 310–316. [Google Scholar] [CrossRef]
  54. Petit, S. Characterization of Octahedral Substitutions in Kaolinites Using Near Infrared Spectroscopy. Clays Clay Miner. 1999, 47, 103–108. [Google Scholar] [CrossRef]
  55. Post, J.L.; Noble, P.N. The Near-Infrared Combination Band Frequencies of Dioctahedral Smectites, Micas, and Illites. Clays Clay Miner. 1993, 41, 639–644. [Google Scholar] [CrossRef]
  56. Huntington, J.F.; Cudahy, T.J.; Yang, K.; Scott, K.M.; Mason, P.; Gray, D.J.; Berman, M.; Bischoff, L.; Reston, M.S.; Mauger, A.J. Mineral Mapping with Field Spectroscopy for Exploration; CSIRO Exploration and Mining Report 419R AMIRA Project, P435; CSIRO: Canberra, Australia, 1999; p. 45. [Google Scholar]
  57. Scott, K.M.; Yang, K. Spectral Reflectance Studies of White Micas; CSIRO Report 439R AMIRA Project P435; CSIRO: Canberra, Australia, 1997; p. 35. [Google Scholar]
  58. Martínez-Alonso, S.; Rustad, J.R.; Goetz, A.F.H. Ab Initio Quantum Mechanical Modeling of Infrared Vibrational Frequencies of the OH Group in Dioctahedral Phyllosilicates. Part I: Methods, Results and Comparison to Experimental Data. Am. Miner. 2002, 87, 1215–1223. [Google Scholar] [CrossRef]
  59. Tuddenham, W.M.; Lyon, R.J.P. Relation of Infrared Spectra and Chemical Analysis for Some Chlorites and Related Minerals. Anal. Chem. 1959, 31, 377–380. [Google Scholar] [CrossRef]
  60. Stubican, V.; Roy, R. Infrared Spectra of Layer-Structure Silicates. J. Am. Ceram. Soc. 1961, 44, 625–627. [Google Scholar] [CrossRef]
  61. Doublier, M.P.; Roache, T.; Potel, S.; Laukamp, C. Short-Wavelength Infrared Spectroscopy of Chlorite Can Be Used to Determine Very Low Metamorphic Grades. Eur. J. Miner. 2012, 24, 891–902. [Google Scholar] [CrossRef]
  62. Bierwirth, P.N. Laboratory and Imaging Spectroscopy of Tourmaline—A Tool for Mineral Exploration. In Proceedings of the 14th Australasian Remote Sensing & Photogrammetry Conference, Darwin, Australia, 27 September 2008. [Google Scholar]
  63. Spear, F.S. Metamorphic Phase Equilibria and Pressure-Temperature-Time Paths, 2nd ed.; Monograph/Mineralogical Society of America; Mineralogical Society of America: Washington, DC, USA, 1995. [Google Scholar]
  64. Gaffey, S.J. Spectral Reflectance of Carbonate Minerals and Rocks in the Visible and Near Infrared (0.35 to 2.55 MUM) and Its Applications in Carbonate Petrology; University of Hawaii: Honolulu, HI, USA, 1984. [Google Scholar]
  65. Moenke, H.H.W. Silica, the Three-Dimensional Silicates, Borosilicates and Beryllium Silicates. In The Infrared Spectra of Minerals; Farmer, V.C., Ed.; Mineralogical Society of Great Britain and Ireland: Londan, UK, 1974; pp. 365–382. [Google Scholar] [CrossRef]
  66. Ruan, H.D.; Frost, R.L.; Kloprogge, J.T. The Behavior of Hydroxyl Units of Synthetic Goethite and Its Dehydroxylated Product Hematite. Spectrochim. Acta A Mol. Biomol. Spectrosc. 2001, 57, 2575–2586. [Google Scholar] [CrossRef]
  67. Burns, R.G.; Strens, R.G.J. Infrared Study of the Hydroxyl Bands in Clinoamphiboles. Science 1966, 153, 890–892. [Google Scholar] [CrossRef]
  68. Robert, J.L.; Kodama, H. Generalization of the Correlations between Hydroxyl-Stretching Wavenumbers and Composition of Micas in the System K2O-Mg2O-Al2O3-SiO2-H2O: A Single Model for Trioctahedral and Dioctahedral Micas. Am. J. Sci. 1988, 288, 196–212. [Google Scholar]
  69. Besson, G. Refined Relationships between Chemical Composition of Dioctahedral Fine-Grained Mica Minerals and Their Infrared Spectra within the OH Stretching Region. Part I: Identification of the OH Stretching Bands. Clays Clay Miner. 1997, 45, 158–169. [Google Scholar] [CrossRef]
  70. Besson, G. Refined Relationships between Chemical Composition of Dioctahedral Fine-Grained Micaceous Minerals and Their Infrared Spectra within the OH Stretching Region. Part II: The Main Factors Affecting OH Vibrations and Quantitative Analysis. Clays Clay Miner. 1997, 45, 170–183. [Google Scholar] [CrossRef]
  71. Makreski, P.; Jovanovski, G.; Gajović, A. Minerals from Macedonia. Vib. Spectrosc. 2006, 40, 98–109. [Google Scholar] [CrossRef]
  72. Gonzalez-Carreño, T.; Fernandez, M.; Sanz, J. Infrared and Electron Microprobe Analysis of Tourmalines. Phys. Chem. Miner. 1988, 15, 452–460. [Google Scholar] [CrossRef]
  73. Madejová, J. FTIR Techniques in Clay Mineral Studies. Vib. Spectrosc. 2003, 31, 1–10. [Google Scholar] [CrossRef]
  74. Aines, R.D.; Rossman, G.R. Water in Minerals? A Peak in the Infrared. J. Geophys. Res. Solid Earth 1984, 89, 4059–4071. [Google Scholar] [CrossRef]
  75. Igisu, M.; Ueno, Y.; Shimojima, M.; Nakashima, S.; Awramik, S.M.; Ohta, H.; Maruyama, S. Micro-FTIR Spectroscopic Signatures of Bacterial Lipids in Proterozoic Microfossils. Precambrian Res. 2009, 173, 19–26. [Google Scholar] [CrossRef]
  76. Green, D.; Schodlok, M. Characterisation of Carbonate Minerals from Hyperspectral TIR Scanning Using Features at 14,000 and 11,300 Nm. Aust. J. Earth Sci. 2016, 63, 951–957. [Google Scholar] [CrossRef]
  77. Chester, R.; Elderfield, H. The Application of Infra-Red Absorption Spectroscopy to Carbonate Mineralogy. Sedimentology 1967, 9, 5–21. [Google Scholar] [CrossRef]
  78. Yitagesu, F.A.; van der Meer, F.; van der Werff, H.; Hecker, C. Spectral Characteristics of Clay Minerals in the 2.5–14 μm Wavelength Region. Appl. Clay Sci. 2011, 53, 581–591. [Google Scholar] [CrossRef]
  79. Rubens, H.; Nichols, E.F. Versuche mit Wärmestrahlen von grosser Wellenlänge. Ann. Phys. Chem. 1897, 296, 418–462. [Google Scholar] [CrossRef] [Green Version]
  80. Spitzer, W.G.; Kleinman, D.A. Infrared Lattice Bands of Quartz. Phys. Rev. 1961, 121, 1324–1335. [Google Scholar] [CrossRef]
  81. Thompson, C.S.; Wadsworth, M.E. Determination of the Composition of Plagio-Clase Feldspars by Means of Infrared Spectroscopy. Am. Miner. 1957, 42, 334–341. [Google Scholar]
  82. Vincent, R.K.; Rowan, L.C.; Gillespie, R.E.; Knapp, C. Thermal-Infrared Spectra and Chemical Analyses of Twenty-Six Igneous Rock Samples. Remote Sens. Environ. 1975, 4, 199–209. [Google Scholar] [CrossRef]
  83. Walter, L.S.; Salisbury, J.W. Spectral Characterization of Igneous Rocks in the 8- to 12-Μm Region. J. Geophys. Res. 1989, 94, 9203. [Google Scholar] [CrossRef]
  84. Salisbury, J.W.; Walter, L.S. Thermal Infrared (2.5–13.5 Μm) Spectroscopic Remote Sensing of Igneous Rock Types on Particulate Planetary Surfaces. J. Geophys. Res. 1989, 94, 9192. [Google Scholar] [CrossRef]
  85. Cudahy, T.; Hewson, R.; Caccetta, M.; Roache, A.; Whitbourn, L.; Connor, P.; Coward, D.; Mason, P.; Yang, K.; Huntington, J.; et al. Drill Core Logging of Plagioclase Feldspar Composition and Other Minerals Associated with Archean Gold Mineralization at Kambalda, Western Australia, Using a Bidirectional Thermal Infrared Reflectance System. Remote Sens. Spectr. Geol. 2009, 223–235. [Google Scholar] [CrossRef]
  86. Harlov, D.E.; Andrut, M.; Pöter, B. Characterisation of Buddingtonite (NH4)[AlSi3O8] and ND4 -Buddingtonite (ND4)[AlSi3O8] Using IR Spectroscopy and Rietveld Refinement of XRD Spectra. Phys. Chem. Miner. 2001, 28, 188–198. [Google Scholar] [CrossRef]
  87. Makreski, P.; Jovanovski, G. Minerals from Macedonia. Spectrochim. Acta A Mol. Biomol. Spectrosc. 2009, 73, 460–467. [Google Scholar] [CrossRef]
  88. Lane, M.D. Mid-Infrared Emission Spectroscopy of Sulfate and Sulfate-Bearing Minerals. Am. Miner. 2007, 92, 1–18. [Google Scholar] [CrossRef]
  89. Adler, H.H.; Kerr, P.F. Variations in Infrared Spectra, Molecular Symmetry and Site Symmetry of Sulfate Minerals. Am. Miner. 1965, 50, 132–147. [Google Scholar]
  90. Mauger, A.J.; Ehrig, K.; Kontonikas-Charos, A.; Ciobanu, C.L.; Cook, N.J.; Kamenetsky, V.S. Alteration at the Olympic Dam IOCG–U Deposit: Insights into Distal to Proximal Feldspar and Phyllosilicate Chemistry from Infrared Reflectance Spectroscopy. Aust. J. Earth Sci. 2016, 63, 959–972. [Google Scholar] [CrossRef]
  91. Laukamp, C.; LeGras, M.; Montenegro, V.; Windle, S.; McFarlane, A.J. Grandite-Based Resource Characterisation of the Skarn-Hosted Cu-Zn-Mo Deposit of Antamina, Peru. Miner. Depos. 2021. [Google Scholar] [CrossRef]
  92. LeGras, M.; Laukamp, C. NVCL Spectral Reference Library—Pyroxenes and Pyroxenoids; CSIRO Report EP184276; CSIRO: Canberra, Australia, 2019. [Google Scholar]
  93. Schodlok, M.C.; Green, A.; Huntington, J. A Reference Library of Thermal Infrared Mineral Reflectance Spectra for the HyLogger-3 Drill Core Logging System. Aust. J. Earth Sci. 2016, 63, 941–949. [Google Scholar] [CrossRef]
  94. Adler, H.H. Infrared Spectra of Phosphate Minerals: Symmetry and Substitutional Effects in the Pyromorphite Series. Am. Miner. 1964, 49, 1002–1015. [Google Scholar]
  95. Clavier, N.; Mesbah, A.; Szenknect, S.; Dacheux, N. Monazite, Rhabdophane, Xenotime & Churchite: Vibrational Spectroscopy of Gadolinium Phosphate Polymorphs. Spectrochim. Acta A Mol. Biomol. Spectrosc. 2018, 205, 85–94. [Google Scholar] [CrossRef]
  96. Kloprogge, J.T.; Frost, R.L. Thermal Decomposition of Ferrian Chamosite: An Infrared Emission Spectroscopic Study. Contrib. Miner. Pet. 2000, 138, 59–67. [Google Scholar] [CrossRef]
  97. Hamilton, V.E. Thermal Infrared (Vibrational) Spectroscopy of Mg–Fe Olivines: A Review and Applications to Determining the Composition of Planetary Surfaces. Geochemistry 2010, 70, 7–33. [Google Scholar] [CrossRef]
  98. Madejová, J.; Komadel, P. Baseline Studies of the Clay Minerals Society Source Clays: Infrared Methods. Clays Clay Miner. 2001, 49, 410–432. [Google Scholar] [CrossRef]
  99. Panikorovskii, T.; Chukanov, N.; Rusakov, V.; Shilovskikh, V.; Mazur, A.; Balassone, G.; Ivanyuk, G.; Krivovichev, S. Vesuvianite from the Somma-Vesuvius Complex: New Data and Revised Formula. Minerals 2017, 7, 248. [Google Scholar] [CrossRef] [Green Version]
  100. McAloon, B.P.; Hofmeister, A.M. Single-Crystal IR Spectroscopy of Grossular-Andradite Garnets. Am. Miner. 1995, 80, 1145–1156. [Google Scholar] [CrossRef]
  101. Lane, M.D.; Christensen, P.R. Thermal Infrared Emission Spectroscopy of Anhydrous Carbonates. J. Geophys. Res. Planets 1997, 102, 25581–25592. [Google Scholar] [CrossRef]
  102. Liebscher, A. Spectroscopy of Epidote Minerals. Rev. Miner. Geochem. 2004, 56, 125–170. [Google Scholar] [CrossRef]
  103. Conel, J.E. Infrared Emissivities of Silicates: Experimental Results and a Cloudy Atmosphere Model of Spectral Emission from Condensed Particulate Mediums. J. Geophys. Res. 1969, 74, 1614–1634. [Google Scholar] [CrossRef]
  104. Hook, S.J.; Dmochowski, J.E.; Howard, K.A.; Rowan, L.C.; Karlstrom, K.E.; Stock, J.M. Mapp. ing Variations in Weight Percent Silica Measured from Multispectral Thermal Infrared Imagery—Examples from the Hiller Mountains, Nevada, USA and Tres Virgenes-La Reforma, Baja California Sur, Mexico. Remote Sens. Environ. 2005, 95, 273–289. [Google Scholar] [CrossRef]
  105. Sonntag, I.; Laukamp, C.; Hagemann, S.G. Low Potassium Hydrothermal Alteration in Low Sulfidation Epithermal Systems as Detected by IRS and XRD: An Example from the Co–O Mine, Eastern Mindanao, Philippines. Ore Geol. Rev. 2012, 45, 47–60. [Google Scholar] [CrossRef]
  106. Van Ruitenbeek, F.J.A.; Bakker, W.H.; van der Werff, H.M.A.; Zegers, T.E.; Oosthoek, J.H.P.; Omer, Z.A.; Marsh, S.H.; van der Meer, F.D. Mapping the Wavelength Position of Deepest Absorption Features to Explore Mineral Diversity in Hyperspectral Images. Planet. Space Sci. 2014, 101, 108–117. [Google Scholar] [CrossRef]
  107. Haest, M.; Cudahy, T.; Laukamp, C.; Gregory, S. Quantitative Mineralogy from Infrared Spectroscopic Data. I. Validation of Mineral Abundance and Composition Scripts at the Rocklea Channel Iron Deposit in Western Australia. Econ. Geol. 2012, 107, 209–228. [Google Scholar] [CrossRef]
  108. Haest, M.; Cudahy, T.; Laukamp, C.; Gregory, S. Quantitative Mineralogy from Infrared Spectroscopic Data. II. Three-Dimensional Mineralogical Characterization of the Rocklea Channel Iron Deposit, Western Australia. Econ. Geol. 2012, 107, 229–249. [Google Scholar] [CrossRef]
  109. Lampinen, H.M.; Laukamp, C.; Occhipinti, S.A.; Hardy, L. Mineral Footprints of the Paleoproterozoic Sediment-Hosted Abra Pb-Zn-Cu-Au Deposit Capricorn Orogen, Western Australia. Ore Geol. Rev. 2019, 104, 436–461. [Google Scholar] [CrossRef]
  110. Yang, K.; Browne, P.R.L.; Huntington, J.F.; Walshe, J.L. Characterising the Hydrothermal Alteration of the Broadlands–Ohaaki Geothermal System, New Zealand, Using Short-Wave Infrared Spectroscopy. J. Volcanol. Geotherm. Res. 2001, 106, 53–65. [Google Scholar] [CrossRef]
  111. Sunshine, J.M.; Pieters, C.M.; Pratt, S.F. Deconvolution of Mineral Absorption Bands: An Improved Approach. J. Geophys. Res. 1990, 95, 6955. [Google Scholar] [CrossRef] [Green Version]
  112. Rodger, A.; Fabris, A.; Laukamp, C. Feature Extraction and Clustering of Hyperspectral Drill Core Measurements to Assess Potential Lithological and Alteration Boundaries. Minerals 2021, 11, 136. [Google Scholar] [CrossRef]
  113. Rodger, A.; Laukamp, C.; Haest, M.; Cudahy, T. A Simple Quadratic Method of Absorption Feature Wavelength Estimation in Continuum Removed Spectra. Remote Sens. Environ. 2012, 118, 273–283. [Google Scholar] [CrossRef]
  114. Oliphant, T.E. Python for Scientific Computing. Comput. Sci. Eng. 2007, 9, 10–20. [Google Scholar] [CrossRef] [Green Version]
  115. Clark, R.N.; Roush, T.L. Reflectance Spectroscopy: Quantitative Analysis Techniques for Remote Sensing Applications. J. Geophys. Res. Solid Earth 1984, 89, 6329–6340. [Google Scholar] [CrossRef]
  116. Doublier, M.P.; Roache, A.; Potel, S. Geological Survey of Western Australia. App. lication of SWIR Spectroscopy in Very Low-Grade Metamorphic Environments: A Comparison with XRD Methods; Geological Survey of Western Australia: East Perth, Australia, 2010. [Google Scholar]
  117. Wells, M.; Laukamp, C.; Hancock, E. Reflectance Spectroscopic Characterisation of Mineral Alteration Footprints Associated with Sediment-Hosted Gold Mineralisation at Mt Olympus (Ashburton Basin, Western Australia). Aust. J. Earth Sci. 2016, 63, 987–1002. [Google Scholar] [CrossRef]
  118. Simpson, M.P.; Rae, A.J. Short-Wave Infrared (SWIR) Reflectance Spectrometric Characterisation of Clays from Geothermal Systems of the Taupō Volcanic Zone, New Zealand. Geothermics 2018, 73, 74–90. [Google Scholar] [CrossRef]
  119. LeGras, M.; Laukamp, C.; Pejcic, B.; Shelton, T.; Lau, I.; Stromberg, J. MIR Spectral Library, 2021. CSIRO Data Access Portal. Available online: https://data.csiro.au/collections/collection/CIcsiro:49193 (accessed on 18 February 2021).
  120. Burley, L.L.; Barnes, S.J.; Laukamp, C.; Mole, D.R.; Le Vaillant, M.; Fiorentini, M.L. Rapid Mineralogical and Geochemical Characterisation of the Fisher East Nickel Sulphide Prospects, Western Australia, Using Hyperspectral and PXRF Data. Ore Geol. Rev. 2017, 90, 371–387. [Google Scholar] [CrossRef]
  121. Moltzen, J. HyLoggerTM Results from Chips; A RoXplorer® Pilot Study: Hobart, Australia, 2021; p. 1. [Google Scholar]
  122. Geiger, C.A.; Winkler, B.; Langer, K. Infrared Spectra of Synthetic Almandine–Grossular and Almandine–Pyrope Garnet Solid Solutions: Evidence for Equivalent Site Behaviour. Miner. Mag. 1989, 53, 231–237. [Google Scholar] [CrossRef] [Green Version]
  123. Sutherland, D.N.; Gottlieb, P. Application of Automated Quantitative Mineralogy in Mineral Processing. Miner. Eng. 1991, 4, 753–762. [Google Scholar] [CrossRef]
  124. Laukamp, C.; Lau, I.C.; Stolf, M.; Green, A.A. Impact of Grain Size Variations of Quartz on Estimation of Kaolinite Content from Infrared Spectral Signatures; IMA 2018, 13.-17.08.2018, Melbourne; CSIRO: Clayton, Australia, 2018. [Google Scholar]
  125. Laukamp, C.; White, A.J.R.; Rodger, A.; Gum, J.; Metelka, V.; Lau, I.C.; Gordon, G.; Fonteneau, L. Mapping Mineral Footprints Associated with Gold in the Bulong Area, Western Australai, Using Airborne and Drill Core Hyper-Spectral and Geochemcial Data; IGARSS 2018, 23-27.07.2018; CSIRO: Clayton, Australia, 2018; p. 4. [Google Scholar]
  126. Elias, M. Lateritic Nickel Mineralization of the Yilgarn Craton. Soc. Econ. Geol. Spec. Publ. 2006, 13, 195–210. [Google Scholar]
  127. Elias, M.; Donaldson, M.J.; Giorgetta, N.E. Geology, Mineralogy, and Chemistry of Lateritic Nickel-Cobalt Deposits near Kalgoorlie, Western Australia. Econ. Geol. 1981, 76, 1775–1783. [Google Scholar] [CrossRef]
  128. Duke, E.F. Near Infrared Spectra of Muscovite, TschermaCSIRk Substitution, and Metamorphic Reaction Progress: Implications for Remote Sensing. Geology 1994, 22, 621–624. [Google Scholar] [CrossRef]
  129. Laukamp, C.; Salama, W.; González-Álvarez, I. Proximal and Remote Spectroscopic Characterisation of Regolith in the Albany–Fraser Orogen (Western Australia). Ore Geol. Rev. 2016, 73, 540–554. [Google Scholar] [CrossRef]
  130. Tappert, M.C.; Rivard, B.; Tappert, R.; Feng, J. Using reflectance spectroscopy to estimate the orientation of quartz crystals in rocks. Can. Miner. 2013, 51, 405–413. [Google Scholar] [CrossRef]
Figure 2. Wavelength ranges (nm) of atomic groups in minerals containing oxygen and ammonium. Fundamental stretching and bending vibrations after [23]. Wavelength ranges of combination and first overtones are calculated from the fundamental vibrations but do not consider anharmonicity factors and should, therefore, be used only as a rough guide to indicate where the respective infrared functional groups absorb.
Minerals 11 00347 g002
Figure 3. Mineral space of mica-like di-octahedral 2:1 phyllosilicates (“10 Å phases”). Locations of major absorption features in italic (values from [50,58] and own studies). The grey triangles indicate the approximate boundaries of the solvus between potassic and sodic di-octahedral micas.
Minerals 11 00347 g003
Figure 4. Composition space of major carbonates showing exchange vectors that relate to endmembers of these minerals (modified after [63]). Locations of the 3ν3CO3 absorption feature of selected minerals are given in italics (values from [19,64]).
Minerals 11 00347 g004
Figure 5. Kaolinite crystal structure and OH band assignments [41].
Minerals 11 00347 g005
Figure 6. Reflectance spectra of (from top to bottom) magnesite (1), dolomite (2), witherite (3), quartz (4), tourmaline (5) and kaolinite (6). Highlighted are diagnostic absorption features and tentative band assignments (band assignments of carbonates in italic).
Minerals 11 00347 g006
Figure 8. Binary discrimination diagrams plotting SWIR 1- and SWIR 2-based single feature scripts applied to a reference mineral collection (a,d,g) and case studies. Case study examples (b,e,h) are coloured by a third single feature extraction script (Table 5). Reflectance spectra (c,f,i) identify the following minerals: (1) Na-alunite, (2) K-alunite, (3) jarosite, (4) epidote, (5) chlorite + white mica, (6) white mica, (7) kaolinite, (8) pyrophyllite, (9) alunite, (10) chlorite, (11) epidote, (12) biotite, (13) talc.
Minerals 11 00347 g008
Figure 9. Comparison of TIR-based scripts applied to hyperspectral reflectance spectra (x-axes) with QEMSCAN-derived garnet and quartz abundance (y-axes; volume %) derived from coarse reject samples of the Antamina deposit in Peru [91]: (a) Peak height of the 11,100-nm absorption feature B of garnet (“11,100P”; x-axis) plotted against the QEMSCAN-derived garnet content (y-axis); (b) Garnet composition index B (“11,100PW”; x-axis) plotted against Garnet composition index T (“11,300DW” y-axis), based on wavelength position of garnet-related features B and T; (c) Representative TIR reflectance spectra highlighted in (a,b), showing different relative amounts of garnet as well as different wavelength positions of the main garnet-related TIR features B, C, D and T; (d) Relative intensity of the quartz RSC at 8625 nm (x-axis) plotted against the QEMSCAN-derived quartz content (y-axis), coloured by the XRD-derived SiO2-content; (e) Band ratio of R8250 divided by R7400 (x-axis) plotted against the QEMSCAN-derived quartz content (y-axis), coloured by the XRD-derived SiO2 content; (f) Representative TIR reflectance spectra highlighted in (d,e), showing different relative amounts of quartz and garnet: dotted lines—quartz as major component, hashed lines—quartz/garnet mixtures, solid line—garnet-dominated reflectance spectrum.
Minerals 11 00347 g009
Figure 10. Top: MIR and TIR scalars for inferring quartz abundance (y-axis) plotted against the quartz abundance in quartz–kaolinite mixtures, coloured by grain size of quartz in mm [124]: (a) R8250/R7400; (b) 8625D; (c) 4470D. Bottom: SWIR, MIR and TIR scalars for inferring kaolinite abundance (y-axis) plotted against the kaolinite abundance (KGa (wt%) in quartz–kaolinite mixtures, coloured by grain size of quartz in μm [124]: (d) 2200D (ν + δOH); (e) 5480D (2νSiO); (f) 9500P (νSiO).
Minerals 11 00347 g010
Figure 11. Bulong 3D mineral map: 3D visualisation of biotite/chlorite content (brown volume; 2250D > 0.044) and kaolin content (orange volume; 2160D > 1) in (a), white mica compositional changes (2200W) as volumes in (b) and (c) and talc content (grey volume; 2080D > 0.009) in (d). Au surfaces in all images in yellow (>0.03 ppm). View in (a) to NE (slice trends NW–SE), view in (bd) to SW (slice trends SE–NW).
Minerals 11 00347 g011
Table 2. SWIR 2-active vibrational modes commonly observed in rock-forming and alteration minerals, their wavelength positions (in nm) as well as the titles of scripts for extracting the relative intensity and wavelength position of the respective absorption features.
Mineral GroupMineral Species (Examples)Assignment of AbsorptionLower Limit (nm)Upper Limit (nm)LiteratureIntensity ScriptWavelength Script
talctalcν + δM3OH2080[45]2080D-
NH4alunite, montmorillonite, buddingtonite, white micaν1 + ν4NH42020 to 2120[34]--
di-oct. sheet silicatekaolin groupν + δM2OHo2159[41]2160D-
di-oct. sheet silicatepyrophylliteν + δMnOH2166[48]
sulphatealuniteν + δMnOH2172[35]-
cyclosilicatetourmalineν + δMnOH2174[49]
di-oct. sheet silicatekaolin groupν + δM2OHi2209[41]2200D2200W
di-oct. sheet silicatemuscovite, phengite, paragoniteν + δ(M)2OH2185 ([VI]Al-rich)2215 ([VI]Al-poor)[3]
cyclosilicatetourmalineν + δMnOH2204[49]
sulphatejarositeν + δMnOH2212[35]
di-oct. sheet silicateprehniteν + δMnOH22353), 2280, 2333, 2358, 2384[32]
tri-oct. sheet silicateclinochlore, chamosite, ripidoliteν + δM2OH2248 (Mg-rich)2261 (Fe2+-rich)[17,50]2250D2250W
tri-oct. sheet silicatebiotite, annite, phlogopite (only when AlVI is present)ν + δM2OH2248 (Mg-rich)2259 (Fe2+-rich)[18,31,50]
sorosilicateepidote groupν + δMnOH2250[32]
cyclosilicatetourmalineν + δMnOH2256[49]
sulphatejarositeν + δMnOH2263[35]
hydroxidegibbsiteν + δMnOH2268[51]
talctalcν + δM3OH2279[45]2290D2290W
tri-oct. sheet silicateFe-smectiteν + δM2OH22882317[50]
talctalcν + δM3OH2300[45]
cyclosilicatetourmalineν + δMnOH2302[49]
Ca-amphiboletremolite, actinoliteν + δMg3OH2296 (Mg-rich)2318 (Fe2+-rich)[45]
Ca-amphiboletremolite, actinoliteν + δMg3OH2318 (Mg-rich)2338 (Fe2+-rich)[45]
carbonateankerite, calcite, dolomite, magnesite, siderite3n3CO32300 (Mg-rich)2340 (Ca only)[19]2320D2320W
chloriteclinochlore, chamosite, ripidoliteν + δMg3OH2331 (Mg-rich)2358 (Fe2+-rich)[50]2340D2340W
di-oct. sheet silicatemuscovite, phengite, paragoniteν + δMg3OH2348 ([VI]Al-rich)2366 ([VI]Al-poor)[50]
tri-oct. sheet silicatebiotite, annite, phlogopiteν + δM2OH2320 (Mg-rich)2350 (Fe2+-rich)[18,31]
sorosilicateepidote groupν + δM2OH2340[32]
cyclosilicatetourmalineν + δMnOH2359 (ca. 5% to 11% MgO)2375 (0% MgO)[49]--
tri-oct. sheet silicatebiotite, annite, phlogopiteν + δM2OH2377 (Mg-rich)2390 (Fe2+-rich)[18,31]2390D2390W
talctalcν + δMg3OH2380[45]
Ca-amphiboletremolite, actinoliteν + δMg3OH2382 (Mg-rich)2406 (Fe2+-rich)[45]
carbonateankerite, calcite, dolomite, magnesite, siderite2ν3 + ν12505 (Mg-rich)2541 (Ca only)[19]--
Note: Respective absorption bands can be present in minerals that are not listed in table. Lower and upper wavelength positions only given for absorption bands where related compositional changes are discussed in this study. Otherwise, an estimated central location is provided. Diagnostic absorption of prehnite at 2235 nm is in the wavelength range covered by the 2200D intensity script (for details, see Section on feature extraction). ν3CO3—asymmetric stretch of CO3.
Table 3. MIR-active vibrational modes commonly observed in rock-forming and alteration minerals, their wavelength positions (in nm) as well as the titles of scripts for extracting the relative intensity and wavelength position of the respective absorption features.
Mineral GroupMineral Species (Examples)Assignment of AbsorptionLower Limit (nm)Upper Limit (nm)LiteratureIntensity ScriptWavelength Script
all hydroxylated mineralsνOH26675000[23,65]--
di-oct. sheet silicatekaolin groupνOH2705, 2725, 2738, 2761[41]2830D2830W
di-oct. sheet silicatewhite micaνOH2677, 2762, 2775, 2799, 2807[58]
tri-oct. sheet silicatedark micaνOH2668, 2677, 2680[68]
di-/tri-oct. sheet silicatewhite and dark micasνOH2810 (Mg-rich)2853 (Fe2+-rich)[69,70]
double chain silicateamphiboleνOH2723 (Mg-rich)2759 (Fe2+-rich)[67,71]
cyclosilicatetourmalineνOH2675 to 2890[49,72]
iron oxidesgoethiteνH-O-H28992903[66]--
di-oct. sheet silicateAl-smectitesνH-O-H2946 (Mg-rich)2987 (K-rich)[73]--
all H2O-bearing mineralsνH-O-H3000[74]3000D-
iron oxidesνOH31133131[66]--
cyclosilicatetourmaline2νBO33704unpublished--
cyclosilicatetourmaline2νBO33811unpublished3800D3800W
carbonatecarbonate2νCO3, ν + νCO339304150unpublished4000D4000W
tectosilicatequartz2νSiO4470unpublished (inferred from [75])4470D-
tectosilicatequartz2νSiO4670unpublished (inferred from [75])--
phosphate3(PO4)4805unpublished--
tectosilicatequartz2νSiO4920unpublished--
sulphatejarosite3(SO4)2−, 2d (OH)4960[35]4500D4500W
sulphatejarosite2ν3(SO4)2−, 2δ(OH)5099[35]--
tectosilicatequartz2νSiO5330unpublished5330D-
di-oct. sheet silicatekaolin group2νSiO5480unpublished5480D-
Note: Respective absorption bands can be present in minerals that are not listed in table. Lower and upper wavelength positions only given for absorption bands where related compositional changes are discussed in this study. Otherwise, an estimated central location is provided. White mica includes illite and sericite.
Table 4. TIR-active vibrational modes commonly observed in rock-forming and alteration minerals, their wavelength positions (in nm) as well as the titles of scripts for extracting the relative intensity and wavelength position of the respective absorption features.
Mineral GroupMineral Species (Examples)Assignment of AbsorptionLower Limit (nm)Upper Limit (nm)LiteratureIntensity ScriptWavelength Script
carbonateankerite, calcite, dolomite, magnesite, sideriteν3 asymmetric stretch CO36405R to 6598R[76,85]6500P-
NH4 (multiple minerals) NH bending6993* to 7400*[86]--
cyclosilicatetourmaline (schorl)νas(BO3)7391*[87]7400P-
cyclosilicatetourmaline (schorl)νas(BO3)7968* (7880 to 7995)[87]--
sulphatealunite, jarositeν3SO47899E, 8197E[88]--
sulphatejarosite, barite, alunite, anhydriteν3SO4all*: 8439, 8480 to 8540, 8576, 8650[35,88,89]--
sulphateanhydrite, barite, alunite, jarositeν3SO4all*: 8920, 8930 to 8980, 8969, 8993[88,89]--
tectosilicatequartzνSiO8496R (8598*)[80,85]R8250/R7400-
tectosilicatequartzνSiO9074R (9328*)[80,85]--
tectosilicatequartz“quartz RSC feature”8625R[85]8625D-
tectosilicateK-feldspar (orthoclase)νSiO8739R[90]--
single chain silicatepyroxene (diopside)νSiO8960 to 9100[91,92]9000P9000PW
phosphateapatiteνas(PO4)9050R (9160*)[93,94,95]-
phosphateapatite“apatite RSC feature”9210Runpublished9200D-
phosphateapatiteνas(PO4)9550R (9620*)[93,94,95]
tri-oct. sheet silicatetalcνSiO9280R[8,93]
tri-oct. sheet silicatetalc“talc RSC feature”9470Runpublished9470D-
tri-oct. sheet silicatetalcνSiO9680R[8,93]
di-oct. sheet silicatemuscoviteνSiO9130R[31]--
tri-oct. sheet silicatebiotite, phlogopiteνSiO9200R[31]--
tri-oct. sheet silicateripidolite (clinochlore)νSiO9217* to 9225*[96]--
single chain silicatepyroxene (diopside)νSiO9290 to 9390[92]minorminor
nesosilicatesolivine (Fo#91 to Fo#0)νSiO9337 to 9852[97]tbdtbd
sulphatejarosite, bariteν3SO4all*: 9217, 9230 to 9260[35,89]--
sulphatealunite, jarosite, bariteν1SO4all*: 9737, 9940, 10150 to 10180[88,89]--
di-oct. sheet silicatemuscoviteνSiO9600R[31]--
di-oct. sheet silicatemontmorillonite (+- mica)νSiO9600* to 9710*[98]
tri-oct. sheet silicatebiotite, phlogopiteνSiO9780R to 9800R[31]
di-oct. sheet silicatekaoliniteνSiO9074*, 9681*, 9891*[98]
tectosilicateK-feldspar (orthoclase)νSiO9558R[90]
tectosilicateplagioclase feldsparsνSiO9660R[85]9660P9660P/9920P
tectosilicateplagioclase feldsparsνSiO9920R[85]9920P
nesosilicatesvesuvianiteνSiO in Si2O7 group9900R[91,99]9900P-
nesosilicatesolivine (Fo#91 to Fo#0)νSiO10,121R to 10,537R[97]minorminor
nesosilicatesolivine (Fo#91 to Fo#0)nSiO10,515R to 11,099R[97]tbdtbd
di-oct. sheet silicatekaolin groupδOH10,661*[98]--
single chain silicatepyroxene (diopside)νSiO10,850R[92]minorminor
di-oct. sheet silicatekaolin groupδOH10,929*[98]--
nesosilicatesgrandite seriesνSi-O in SiO4 group (“B”)10,953R to 11,368R[91,100]11,100P11,100PW
carbonateankerite, calcite, dolomite, magnesite, sideriteν2 out-of-plane bend CO311,058R to 11,372R[76,85]-11,300PW
nesosilicatesgrandite seriesgrandite feature “T”11,250R to 11,600R[91]11,300D11,300DW
single chain silicatepyroxene (enstatite)νSiO11,470R to 11,570R[92]-11,500PW
carbonateankerite, calcite, dolomite, magnesite, sideriteν4 in-plane bend CO3 (trough!)13,200R to 14,000R[76]-14,000DW
sulphateanhydriten4SO414,780*[89]--
Note: Respective absorption bands can be present in minerals that are not listed in table. Lower and upper wavelength positions only given for absorption bands where related compositional changes are discussed in this study. Otherwise, an estimated central location is provided. E—emissivity; R—reflectance; *—transmission, tbd—to be determined.
Table 5. Single feature extraction scripts in the volume-scattering-dominated wavelength ranges of SWIR 1, SWIR 2 and MIR. The columns, from left to right, list (1) the label of the singular feature extraction script for determining the relative intensity of an absorption feature centred at around that wavelength range; (2) label of wavelength script as per column 1; (3) wavelength range in which the respective absorption feature occurs; (4) wavelength range used for the single feature extraction scripts; (5) references; (6) mineral types for which the respective single feature extraction script can be applied.
Depth ScriptWavelength Scriptwvl Range of Mineral-Related Absorptionswvl Range for Continuum RemovalLiterature Examples for Applying the Respective Scripts (or Using the Respective Absorption Features) to Investigate Respective Geological EnvironmentsApplicable to Mineral Group
--fromtofromto--
1400D1400W1387144513501450[116]OH-bearing
1480D1480W1471149114401520[32,37,117]sulphate, prehnite
1550D1550W1520156315101610[33]epidote
1760D1760W1751176417301790[117]sulphate
1850D-184918201880[47]NH4
2080D-208020602100[45]talc
2160D-2159216621382179[107]kaolin, pyrophyllite
2200D2200W2185221521202245[106]Al-bearing sheetsilicate
2250D2250W2248226822302280[17,105]biotite, chlorite, epidote
2290D2290W2279233822702320[108]FeMg-clays, amphibole, talc
2320D2320W2300234022952345[45]amphibole, carbonate
2350D2350W2320236623102370[18]chlorite, micas, epidote
2390D2390W2377240623752435[45]amphibole, annite, talc
2830D2830W2677289027702890this contributionOH-bearing
3000D-300026503900this contributionH2O
4000D4000W3930415038004200this contributioncarbonate
4470D-447043504550this contributionquartz
4500D4500W4570485040905040this contributionsulphate
4500D4500W4625477040905040this contributioncarbonate
5330D-533052105450this contributionquartz
5480D-548053805580this contributionkaolin
Table 6. Single feature extraction scripts in the surface-scattering-dominated wavelength ranges of the TIR. The columns, from left to right, list (1) the label of the singular feature extraction script for determining the relative intensity of a spectral feature centred at around that wavelength range (P = peak height; D = depth); (2) label of wavelength script as per column 1; (3) wavelength range in which the respective spectral feature occurs (see Table 4 for details of respective vibrational modes); (4) wavelength range used for the single feature extraction scripts; (5) references; (6) mineral types for which the respective single feature extraction script can be applied. R8250/R7400* describes a band ratio of the maximum reflectance at 8250 nm ± 20 nm divided by the minimum reflectance value at 7400 nm ± 50 nm. 9660P/9920P^ is a ratio of the two respective singular feature extraction scripts.
Depth ScriptWavelength Scriptwvl Range of Mineral-Related Absorptionswvl Range for Continuum RemovalLiterature Examples for Applying the Respective Scripts (or Using the Respective Absorption Features) to Investigate Respective Geological EnvironmentsApplicable to Mineral Group
--fromtofromto--
6500P-6405659863006700[76,109]carbonate
7400P-739172007550this contributiontourmaline
R8250/R7400*--73508270[85]quartz
8625D-862585658705[85,109]quartz
9000P9000PW9337985286509350[91]pyroxene, pyroxenoid
9660P-966094009780[85]feldspar
9920P-9920980010,150[85]feldspar
9660P/9920P^---10,150[85]feldspar
9900P-9900950010,200[91]vesuvianite
11100P11,100PW10,95311,36810,85011,300[91]garnet
-11,300PW11,05811,37210,90011,800[76,91,109]carbonate
-11,300DW11,25011,60011,20011,600[91]garnet
-11,500PW11,47011,570980011,650[92]pyroxene
-14,000DW13,20014,00013,00014,000[62,73,76,91,99,109]carbonate
Publisher’s Note: MDPI stays neutral with regard to jurisdictional claims in published maps and institutional affiliations.

