Article

Maghemite in Brazilian Iron Ores: Quantification of the Magnetite-Maghemite Isomorphic Series by Χ-ray Diffraction and the Rietveld Method, and Confirmation by Independent Methods

by
Renata Hiraga
1,2,*,
Otávio da Fonseca Martins Gomes
2,3 and
Reiner Neumann
2,3
1
Postgraduate Program in Geology, Universidade Federal do Rio de Janeiro, Rio de Janeiro 21941-916, Brazil
2
Centre for Mineral Technology (CETEM), Rio de Janeiro 21941-908, Brazil
3
Postgraduate Program in Geosciences, National Museum, Universidade Federal do Rio de Janeiro, Rio de Janeiro 20940-040, Brazil
*
Author to whom correspondence should be addressed.
Minerals 2021, 11(4), 346; https://doi.org/10.3390/min11040346
Submission received: 6 February 2021 / Revised: 21 March 2021 / Accepted: 23 March 2021 / Published: 26 March 2021
(This article belongs to the Special Issue The Rietveld Method in Geomaterials Characterisation)

Abstract

:
Maghemite (γ-Fe2O3) is a mineral formed from magnetite oxidation at low temperatures, an intermediate metastable term of the magnetite to hematite oxidation and could be mixed with both. It has magnetic susceptibility similar to magnetite, crystal structure close to magnetite with which it forms a solid solution, while compositionally it equals hematite. Maghemite is thus easily misidentified as magnetite by Χ-ray diffraction and/or as hematite by spot chemical analysis in iron ore characterization routines. Nonstoichiometric magnetite could be quantified in samples of Brazilian soils and iron ores by the Rietveld method using a constrained refinement of the Χ-ray patterns. The results were confirmed by reflected light microscopy and Raman spectroscopy, thus qualitatively validating the method. Χ-ray diffraction with the refinement of the isomorphic substitution of Fe2+ by Fe3+ along the magnetite-maghemite solid solution could help to suitably characterize maghemite in iron ores, allowing for the evaluation of its ultimate influence on mineral processing, as its effect on surface and breakage properties.

1. Introduction

Iron ore concentrates and pellets are a major export product of Brazil. Its mineralogy is generally simple, the main iron-bearing minerals being hematite and magnetite in the Carajás (state of Pará, northern Brazil) ore, and hematite with goethite in very variable amounts and rare magnetite in the ones from the Quadrilátero Ferrífero (state of Minas Gerais, southeast of Brazil), as well as diverse gangue minerals [1,2].
The conversion of magnetite to hematite or goethite may pass through the metastable isostructural phase maghemite [3,4], which generally leads to the coexistence with a product called nonstoichiometric magnetite [5] consisting of a solid solution with varying atomic ratios of Fe2+:Fe3+. Magnetite can have a range of oxidation states dependent upon the amount of structural Fe2+, which can be discussed quantitatively as the magnetite stoichiometry (χ = Fe2+/Fe3+, atoms). For magnetite with an ideal Fe2+ content (assuming the Fe3O4 formula), the mineral phase is known as stoichiometric magnetite (χ = 0.50). As magnetite becomes oxidized, the Fe2+/Fe3+ ratio decreases (χ < 0.50), with this form denoted as nonstoichiometric or partially oxidized magnetite. When the iron is completely oxidized (χ = 0), it is maghemite (γ-Fe2O3) [6].
Magnetite has an inverse spinel structure, and its space group is F d 3 ¯ m [7]. Magnetite and maghemite differ by the presence of vacancies in the maghemite structure to compensate the oxidation state of up to 8/3 of the 24 Fe atoms in the cubic unit cell of magnetite. The distribution of the Fe3+ ions and the vacancies is random at the beginning, thus keeping the magnetite’s space group. However, experimental [8] and theoretical [9] work proved the vacancies to order in the octahedral sites, to a minimum electrostatic energy state of the crystal. Due to increased ordering of the Fe3+ ions and the vacancies, the symmetry of the structure of maghemite is reduced by a tetragonal distortion, first to cubic P 4 3 32   space group and finally a tetragonal symmetry with space group P 4 1 2 1 2 by assuming a superstructure with a tripled cell along the c axis to a unit cell with composition ( F e 3 + ) 8 [ F e 5 / 6 3 + 1 / 6 ] 16 O 32 (round and square brackets for tetrahedral and octahedral coordination, respectively [9]). This decreasing in the symmetry accounts for the “additional peaks” observed by Gorski and Scherer [6], although, as pointed out by the authors, they have very low intensity for their samples, which could be attributed to incipient ordering. Ordering with consequent loss of symmetry might be a slow process in natural samples, and might not affect very small particles, although this is still controversial [9,10].
The oxidation and transformation from magnetite to maghemite might affect several properties of the mineral, including breakage and surface properties that could have implications for ore beneficiation operations and subsequent steelmaking processes [11]. The anomalous floatability of hematite reported and attributed by Montes el al. [12] to “superficial heterogeneity and chemical impurities” is thus probably related to the hematite actually being maghemite, as the authors describe. The correct identification and quantification of these minerals is therefore essential to determine the ore textures and surface properties. In addition to benefits for steel industry [13], the accurate identification of maghemite also can help in the reconstruction of mineralization processes in BIFs (banded iron formation) and other iron ore deposits. The magnetite-hematite oxidation can occur in two ways: supergenic enrichment that comprise successive oxidations of the primary mineral and originating goethite and a metastable phase such as maghemite (or nonstoichiometric magnetite) [14]. The second way is through metamorphism and deformation, when magnetite oxidizes directly to hematite, without originating, or at least not preserving, maghemite [15,16]. The temperature is another influential factor in maghemite genesis. In high temperatures (over 600 °C), the transformation is direct to hematite. On the other hand, in lower temperatures, the oxidation products of magnetite are dependent on its origins. In natural magnetite samples, when oxidized between 200 °C and 500 °C, the final product are grains constituted of a preserved core of magnetite with the surface covered by hematite layers [15].
Due to their similar crystal structures, maghemite (γ-Fe2O3) and magnetite (Fe3O4) display almost identical Χ-ray diffraction (ΧRD) signatures, hindering their differentiation by this method [17]. In addition, they have similar magnetic susceptibilities [18] and maghemite is a polymorph of hematite; it is thus easily misinterpreted as magnetite or hematite by most mineralogical methods, and it is believed that maghemite may be misidentified as magnetite and/or hematite in iron ore characterization routines.
Some methods based on different analytical techniques have been developed to distinguish magnetite from maghemite, but they still present considerable limitations. Mössbauer spectroscopy is an important analytical technique for the iron oxides, but there are serious limitations to differentiate magnetite, maghemite and nonstoichiometric magnetite at room temperature [19]. Even below 125 K, small crystal size also precludes significant conclusions, worsened if contaminants replace Fe in the lattices [20,21]. Electron backscatter diffraction (EBSD) analysis performed with high magnification in a scanning electron microscope (SEM) might reveal the (very similar) structure and crystal orientation at the nanometer scale and possibly could be used to identify maghemite [22]. Mapping an area that is representative of a sample for quantitative purposes at such high magnification, however, would demand a huge analysis time, and is therefore not feasible. Another (relatively) new technique for that scope is the Χ-Ray absorption near edge spectroscopy (ΧANES), which could be an efficient method to quantify magnetite and maghemite. ΧANES must be operated in transmission mode, as in fluorescence mode the self-absorption effects could to misinterpretations [23]. This is not an easily accessible technique, however.
Several methods applied for the mineral and textural characterization of iron ores have been proposed [24], and optical reflected light image analysis is among the most powerful ones [25,26,27]. However, it is still rare that any of those considers maghemite. Moreover, all the methods described above are biased to some extent.
Neumann and Medeiros [5] suggested that the degree of isomorphic substitution in Fe-oxide ores through the oxidation of Fe+2 to Fe+3 in the magnetite–maghemite solid solution can be quantified using the method proposed by Gorski and Scherer [6] by using ΧRD and the Rietveld method. The differentiation of magnetite and maghemite in Χ-ray diffractograms is qualitatively difficult, since both have a very similar crystal structure and thus share most of the peaks, while low intensity diagnostic peaks may not be observed when the amount of maghemite is subordinate to that of magnetite (or other minerals) in the sample. However, the oxidation of magnetite, being transformed into maghemite, can be calculated by the Rietveld method refinement, which can deal with the superposition of peaks. The method implemented by Neumann and Medeiros [5] is based on the difference in the scattering coefficient between atoms of bivalent and trivalent iron and vacancies, constrained by the linear variation of the size of the crystallographic axis a of the cubic unit cell, as determined by Gorski and Scherer [6], establishing a relationship with χ (chi, stoichiometric ratio of Fe2+/Fe3+) equal to a = 0.1094 χ + 8.3424.
The development of a microstructural technique for the identification of maghemite by one of the already most commonly used analytical tools ‒ ΧRD, would open the possibility of adding maghemite to the characterization of iron ores.
But in light of all the mentioned difficulties, this study’s approach is to first apply this proposal to samples that, according to the published literature, typically contain maghemite. Initially, samples of soils were probed, and a red latosol (oxisol) was selected, as the presence of maghemite in these soils is widely documented, particularly when they are derived from basalts. In addition, this material is readily available, occurring in several regions of Brazil, particularly in the southeast, the south, as well as the center-west of Brazil [28]. Iron ore samples from Quadrilátero Ferrífero were also tested, as some authors [29,30] describe maghemite and mostly nonstoichiometric magnetite in itabirite rocks and iron ore in different localities of this region. After validation of this analytical technique through reflected light microscopy and Raman spectroscopy coupled to a light microscope (Raman microprobe), it was applied to Brazilian iron ores samples in a second step, following the same methodology.

2. Materials and Methods

2.1. Materials

This work was carried out in two stages, using the same method, respectively, with:
(i)
3 soil samples (Guaíra, Ilha Grande, Mato Grosso) and 3 samples from the Quadrilátero Ferrífero (Guanhães, Guanhães 2, Espinhaço);
(ii)
10 iron ore samples from each, the northern (N4WN) and southern (N4WS) segments of the N4W iron ore mine in Carajás. Although all were analyzed, only three for each segment are presented, as the results are similar for each segment.

2.2. Methods

The samples were concentrated with a ferrite (Alnico V) magnet. The ferromagnetic fractions were homogenized and 4 g and 1 g of each were split with a rotary sampler for ΧRD analysis and for making a polished section, respectively.
For ΧRD analysis, the samples were ground in a McCrone Micronizing Mill (Retsch/Verder Group, Haan, Germany) with agate grinding media and 15 mL of water, for 10 min. The suspensions of ground samples were discharged into PTFE Petri dishes and dried overnight at 60 °C. Several pure magnetite samples have also been tested for maghemite, and no oxidation was recorded for them, thus the sample preparation is not influencing the mineralogy. After drying, the samples were gently reground with an agate mortar and pestle, and backloaded into sample holders, in order to reduce preferential orientation, and analyzed with a D4 Endeavor Χ-ray diffractometer (Bruker-AXS, Karlsruhe, Germany), using Ni-filtered CoKα radiation at 40 kV and 40 mA. Measurements were done through a position sensitive LynxEye detector, from 5 to 105° 2θ with 0.02° steps, 1 s per step. The total accumulation time over the ~190 active detector sensors was 184 s/step, and the analyses took around 1.5 h for every sample, to ensure high counts were available for the refinement.
Quantitative analyzes were performed by refinement of the total multiphase spectrum method, (the Rietveld method) with a fundamental parameters approach [31], using the Bruker-AΧS Diffrac.Topas 5.0 software. Background was automatically calculated by a 6th order polynomial, and a fixed seven-line Kα plus an intensity-refined kβ emission profile (after [32]) was adopted, as some Co kβ radiation can still be detected by the detector. The Χ-ray optics was accurately described, as required by the fundamental parameters approach, and sample displacement and sample absorption were the only allowed corrections. Lorentz Polarization was fixed at zero. The crystal structure files of the phases were sourced from the Bruker-AΧS Structure Database, and kaolinite from ICSD (Inorganic Crystal Structure Database, Leibniz-Institut für Informationsinfrastruktur—FIZ, Karlsruhe, Germany), and the original reference could mostly be traced back. The structures from the Bruker-AΧS Structure Database have a correspondent phase in the ICDD database, which is presented in Table 1 together with similar options from the COD 2011 database [33] when the reference from ICDD does not supply a structure, and the cell parameters with the range allowed for refinement. Goethite, hematite and magnetite–maghemite structures were modified to adjust for mixed crystals as described in the references. Equivalent anisotropic Debye-Waller thermal factors were used for all phases. The Diffrac.Topas algorithm does not require refinement strategy, all variables are fitted simultaneously from the original inputs, including the structure-related ones. These were cell dimensions and angles as appropriate, preferred orientation by the March-Dolasse model if necessary, site occupancy as described in the references in Table 1, and the scale factor from which the quantitative phase analysis is derived. Only for magnetite, the position of the oxygen atom was allowed to be refined; the iron atoms occupy special positions that are fixed, and for the other minerals positions are not refined for quantification. The full fitting procedure takes just seconds, and all the output can be checked (visually and numbers) without accepting the results, meaning the input file keeps the original content to allow for further modifications to be added (or taken out) to the input for the next run, like allowing for preferred orientation. The Diffrac.Topas software also calculates the errors for the refinement, but these refer to the mathematical operation, and are not a real assessment of quantification uncertainty. These errors were always below 0.4%. The measured and calculated diffraction patterns for the output of the refinement were trimmed at the beginning and the end for better visualization of the fit, but no relevant reflection was cut off: talc and kaolinite 001 peaks at 9.37 Å (~10.9° 2θ) and 7.17 Å (~14.3° 2θ) respectively are at the lowest angle, and can be observed in the figures.
Considering the ordering of vacancies coupled to symmetry lowering, as discussed, our magnetite–maghemite solid solution approach was also compared to the Rietveld method phase quantification results using the structures of stoichiometric magnetite and maghemite, the latter using both cubic and tetragonal structures (cubic P 4 3 32   and tetragonal P 4 1 2 1 2 space groups, respectively).
The 1 g samples were cold-mounted in epoxy resin, ground and polished to a mirror finish. The polished blocks (mounts) were analyzed on a reflected light microscope (Zeiss Axioimager M2.m) and Raman microprobe. A LabRam 800HR spectrometer (Horiba Jobin-Yvon, Longjumeau, France) coupled to an Olympus BΧ-41 microscope was employed, using a 632.8 nm excitation laser with neutral density filters to reduce the laser power to 0.7 mW in order to avoid oxidation [54]. Even reducing the laser power, the spectra had to be measured quickly, for three accumulations of 2 s each, since the decrease in the intensity of the maghemite diagnostic vibrations was observed for longer measurement times.
The polished sections have also been analyzed by scanning electron microscopy coupled to an energy dispersive X-ray fluorescence spectrometer (SEM/EDS, FEI Quanta 400 with a Quantax 800 EDS (Bruker Nano, Berlin, Germany) and a XFlash 6|60 detector. As mentioned, electron beam spot analyzes are not able to separate hematite from maghemite, while backscattered electron images cannot separate them from magnetite [55]. However, this could ensure that, besides minor Al in the soil samples (and mostly in goethite), no other elements but Fe and O were detected.

3. Results and Discussions

3.1. First Stage

At a first stage of this study, six samples (three soil samples and three iron ore samples from the Quadrilátero Ferrífero) that were supposed to bear maghemite were analyzed by XRD and the Rietveld method. Based on the results obtained for each sample, some were analyzed by optical microscopy aiming to find a sample where maghemite could be easily viewed (with larger domains of it, for example) and to confirm its identification by Raman spectroscopy.

3.1.1. Iron Ore Samples from Quadrilátero Ferrífero
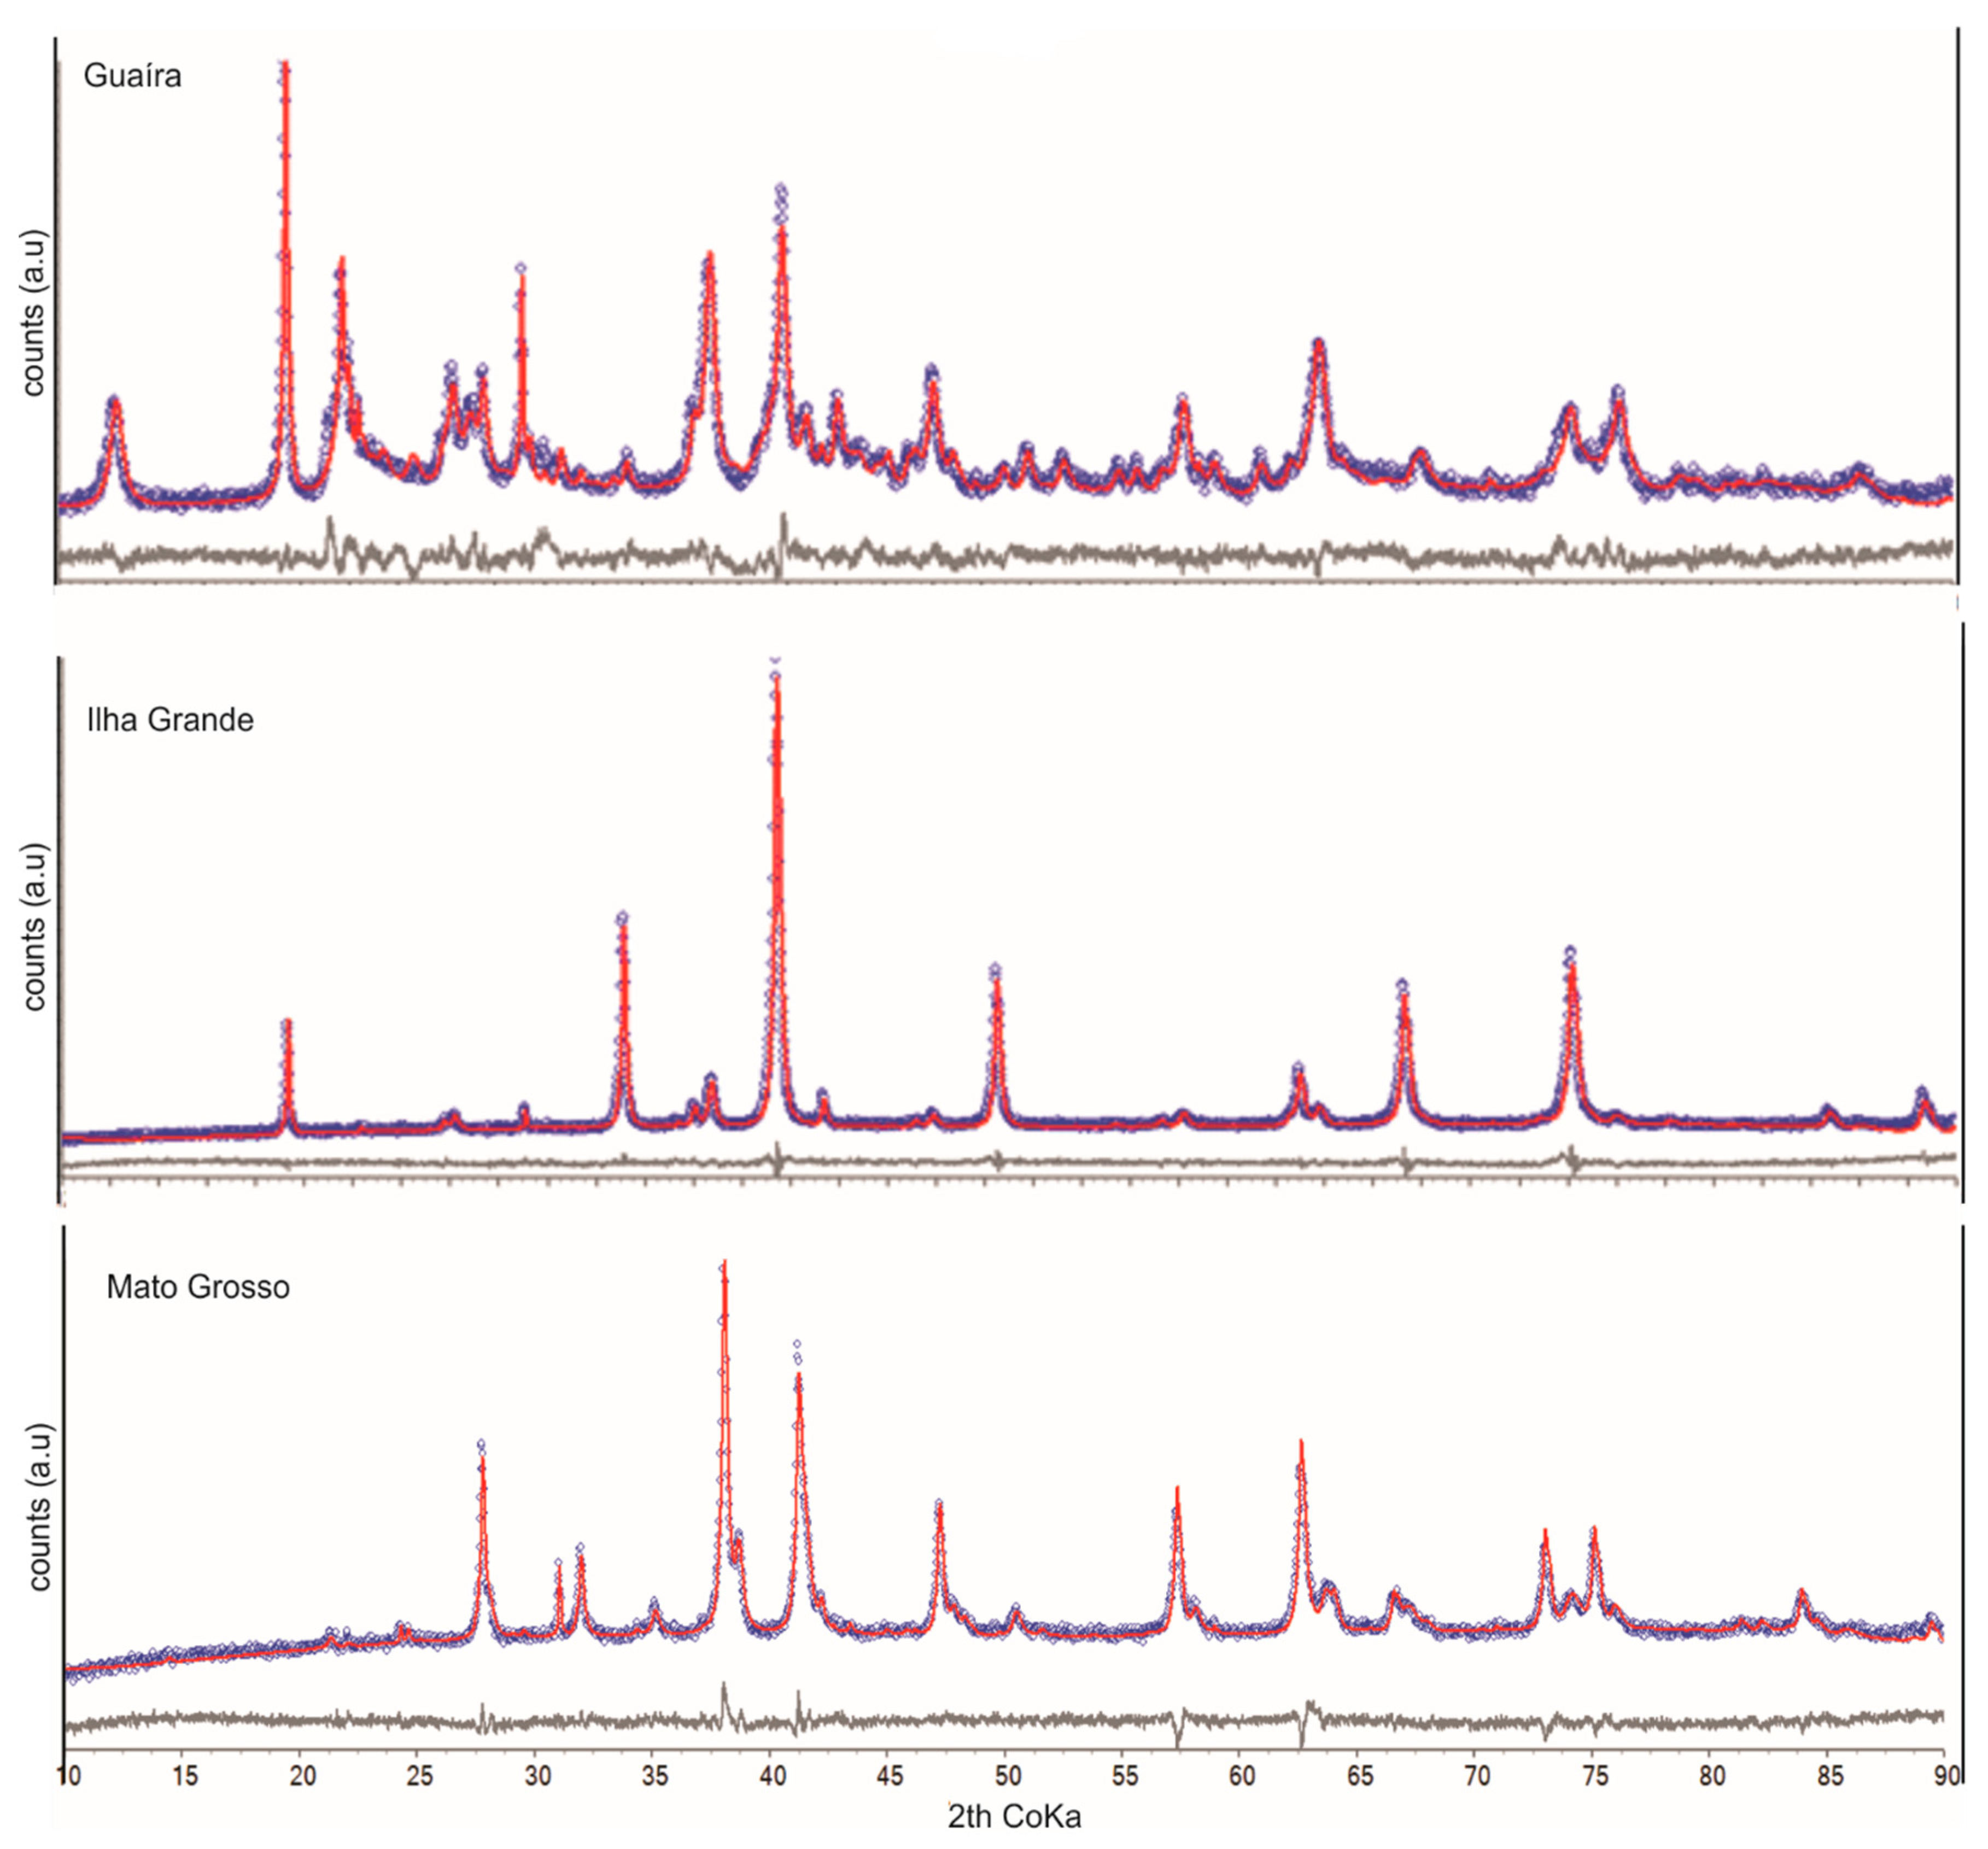
The quantitative mineralogical analysis by the Rietveld method shows all the iron ores to contain hematite, magnetite/maghemite, and quartz. Ilmenite and talc were detected only in the Guanhães sample. Table 2 shows the weight percentages of each mineral in the samples, the refined occupancy for the indicated sites and the figures of merit for each refinement: weighted profile R-factor (RWP) and goodness-of-fit (GOF), which is the RWP/Rexp ratio, the latter the expected R factor [56]. The lattice parameter a for the magnetite–maghemite solid solution has also been recorded. The fit for all samples is excellent, both from the R-factors and from visual inspection of measured and calculated patterns, and the residue (Figure 1).
The Guanhães 2 sample shows a high magnetite grade, which has the maximum value of χ = 0.5 (Table 2), meaning that in this sample the magnetite is stoichiometric. These samples also bear hematite with very low Al. The Guanhães and Espinhaço samples (χ = 0.091 and 0.372, respectively) are intermediate, indicating that their magnetite is partially transformed to isostructural maghemite. Due to these intermediate values of χ, these samples were analyzed by reflected light microscopy aiming at the identification of maghemite, but none could be identified. Besides reflected light microscopy, several random spots assayed by Raman spectroscopy did not succeed in identifying any maghemite or intermediate phase between magnetite and maghemite. Both low grades and eventually very small domains with this mineralogy could be responsible for it being overseen.

3.1.2. Soil Samples

The diffraction patterns of the Rietveld quantitative phase analysis for the soil samples are shown in Figure 2, displaying a more varied mineralogy, as shown in Table 3.
The abundant magnetite from the Ilha Grande soils is stoichiometric, with χ = 0.500. The one from the Mato Grosso soil sample is close to stoichiometry, with χ = 0.458, i.e., less than 10% of the Fe2+ has been replaced by Fe3+. Its hematite is also substituted, with 4.6% Al replacing Fe, and almost 18% hydroxyl replacing oxygen. On the other hand, Guaíra shows χ = 0, indicating maghemite as the only ferromagnetic phase, as well as strongly Al-substituted hematite and goethite.
Based on the ΧRD results, specifically χ values, the Guaíra sample was further assessed by reflected light microscopy. The sample is very porous and heterogeneous, with variables size and shapes of the grains, which range from subhedral to oval. Intergrowth of iron oxides such as hematite, magnetite, maghemite and goethite is common. Ilmenite can sometimes be present. Martite is very abundant and occasionally can be surrounded by goethite with an ovoid form. Typical maghemite (with bluish gray color) was observed in the grains where this textures of martitization (hematite replacing magnetite) were dominant.
Raman spectroscopy corroborated maghemite in the sample, and allowed for nonstoichiometric magnetite detection as well. Figure 3 shows a typical Guaíra soil martite particle, measuring about 20 µm, euhedral and with intergrowth of various oxides, mostly hematite pseudomorphs maintaining the magnetite habit. In this particle, hematite (Raman vibrations at 225, 293, 415, 500, 618 cm−1) and probably ilmenite (225, 390, 678 cm−1) were observed at points 1 and 2, respectively; nonstoichiometric magnetite spectra, with diagnostic bands close to 675 cm−1 at points 3 and 4; and spectra of maghemite with the doublet 667–720 cm−1 [57,58] were obtained from points 5 and 6. Point 6 is probably a mixture of maghemite and goethite (243, 293, 385, 399, 470, 543 cm−1), which is a frequently observed association. According to van der Weerd et al. [59] and Muralha et al. [60], the increase in the oxidation state in nonstoichiometric magnetite can change the main vibration from 665–670 cm−1 to higher values.

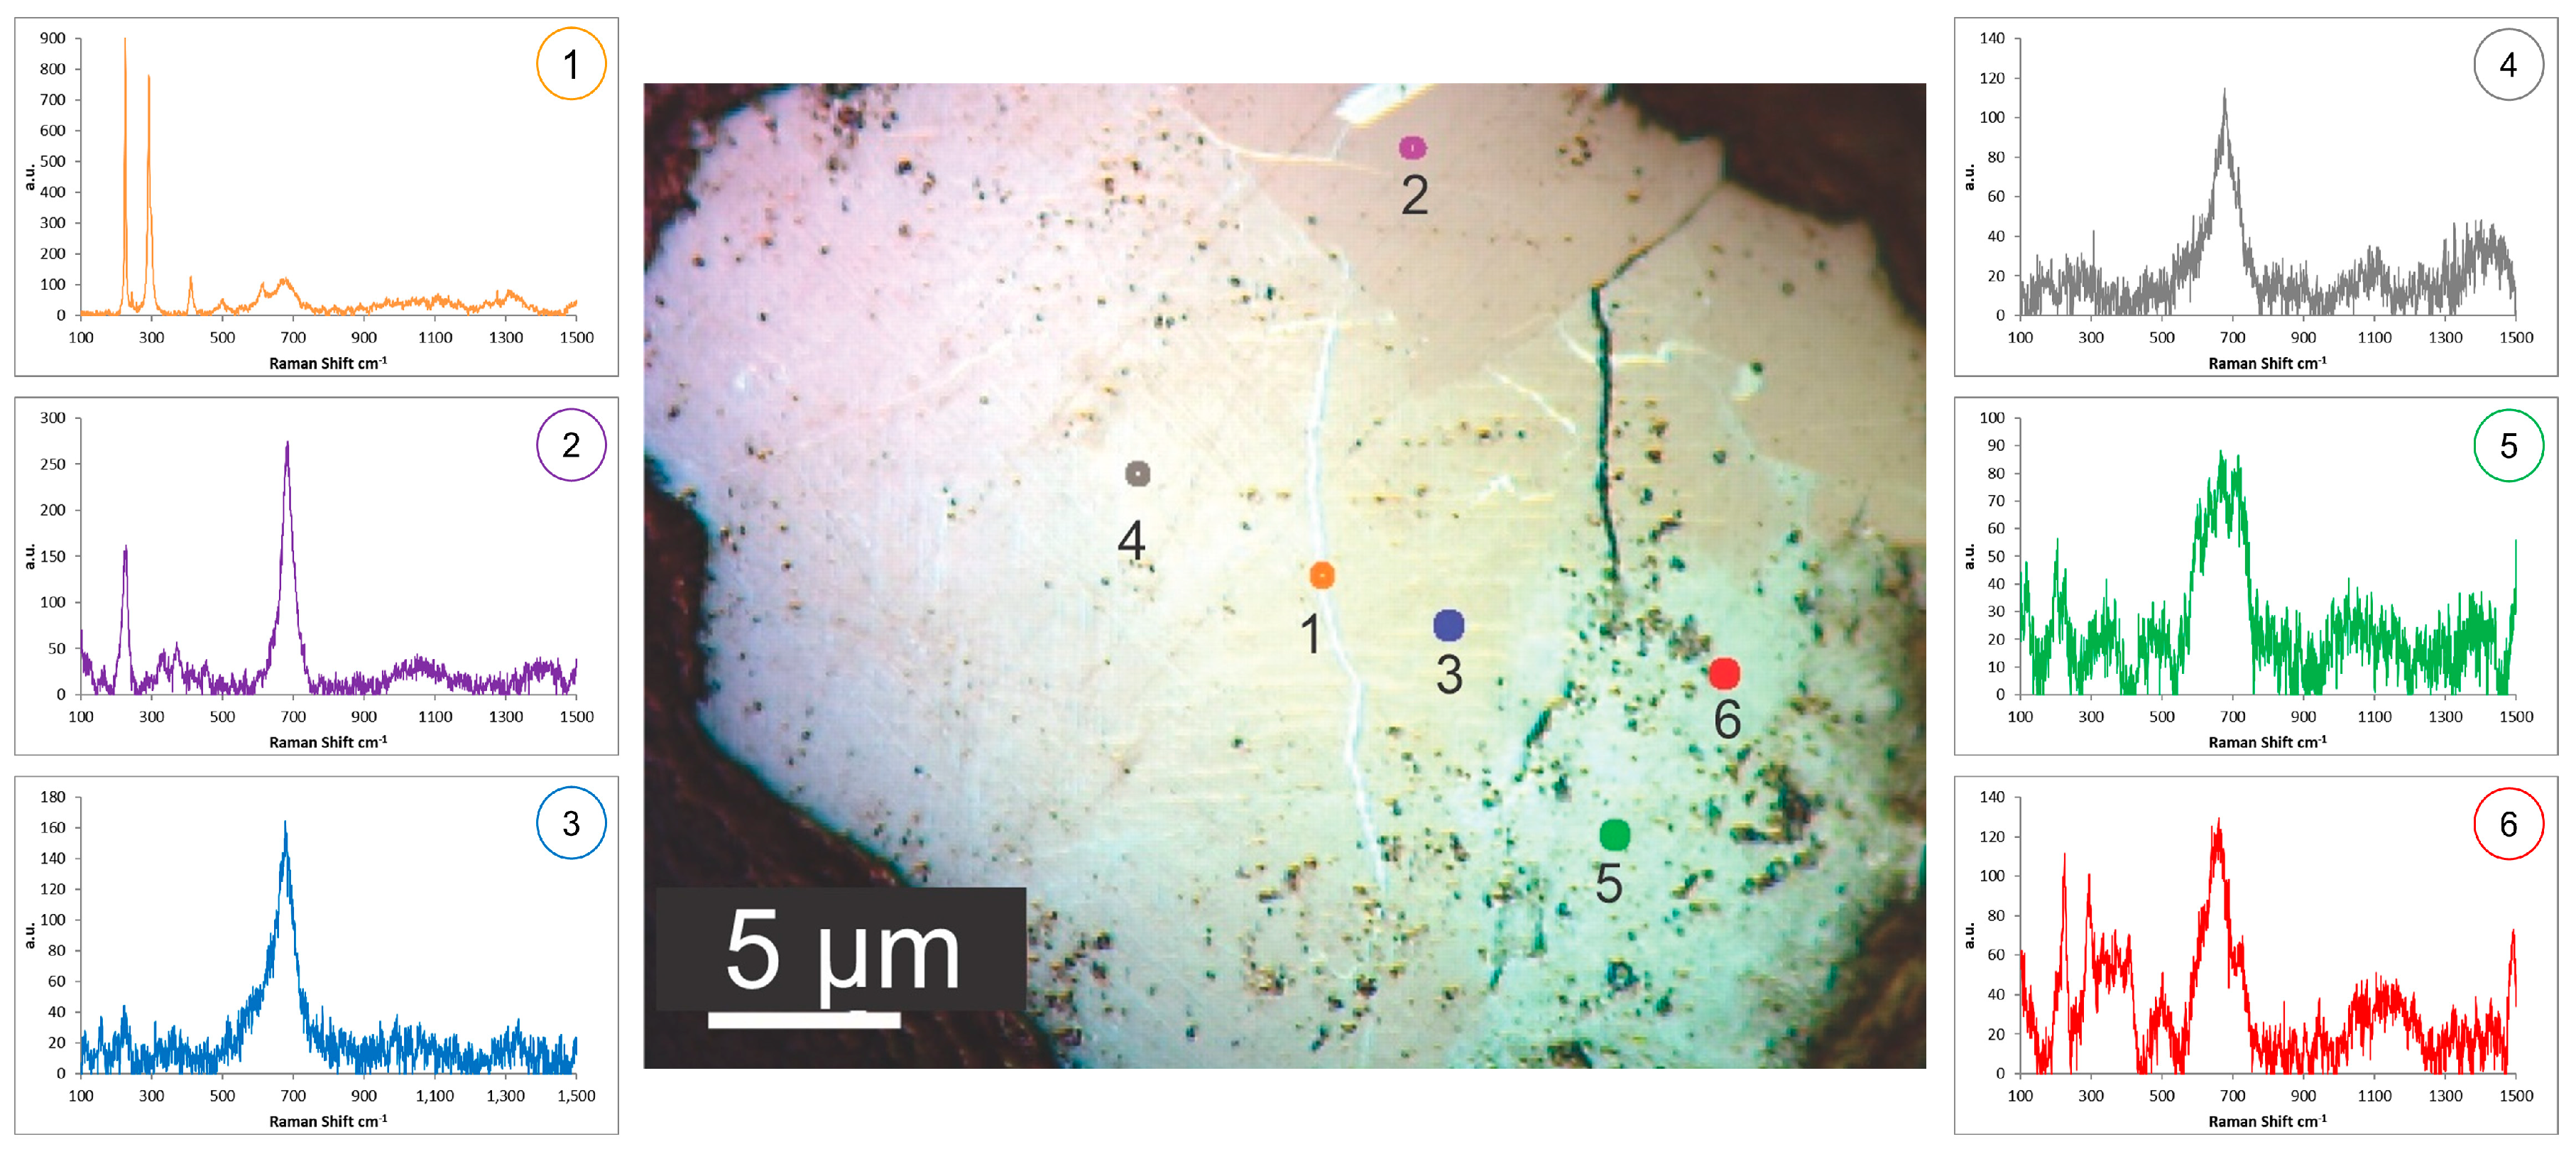
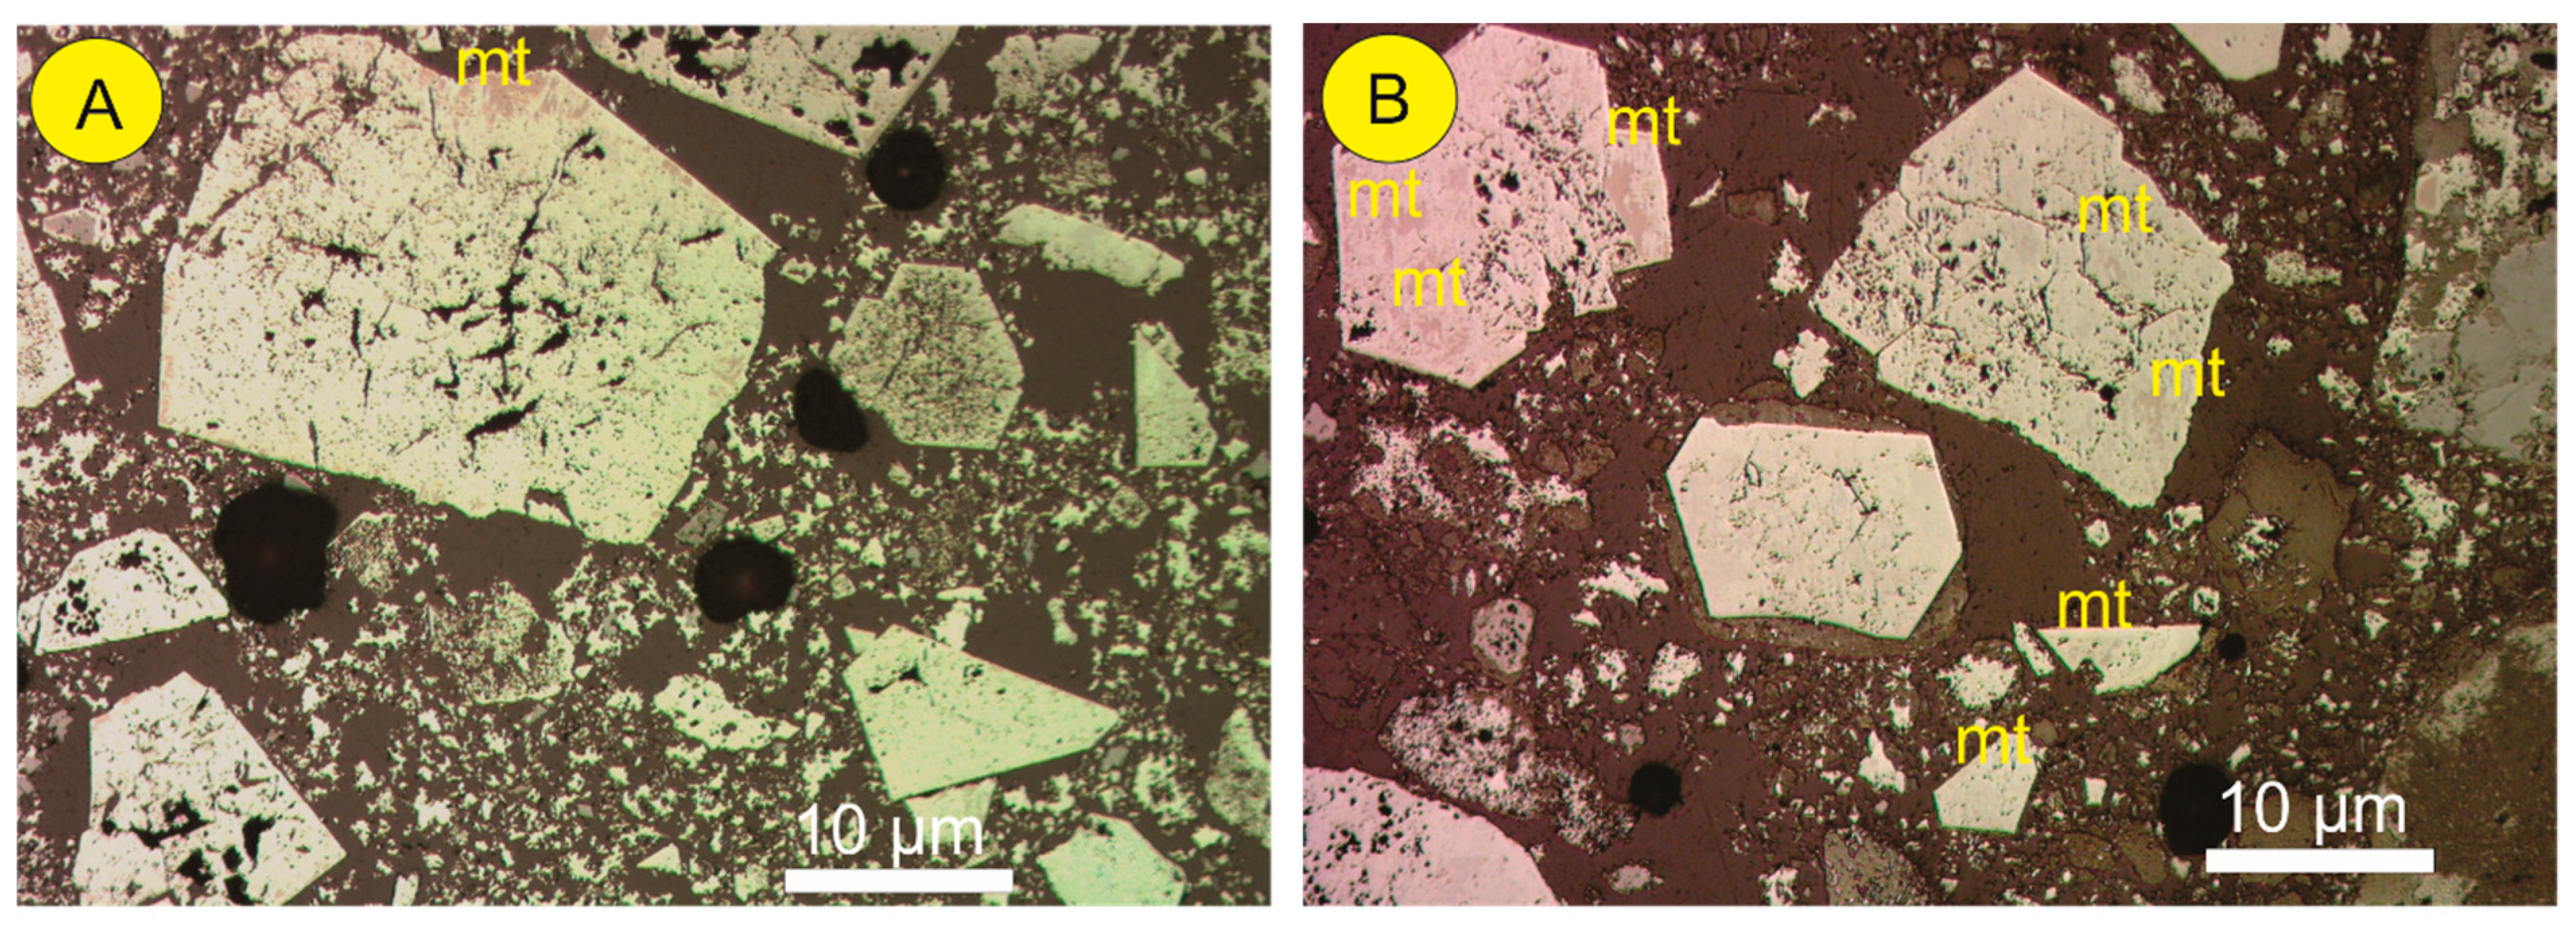
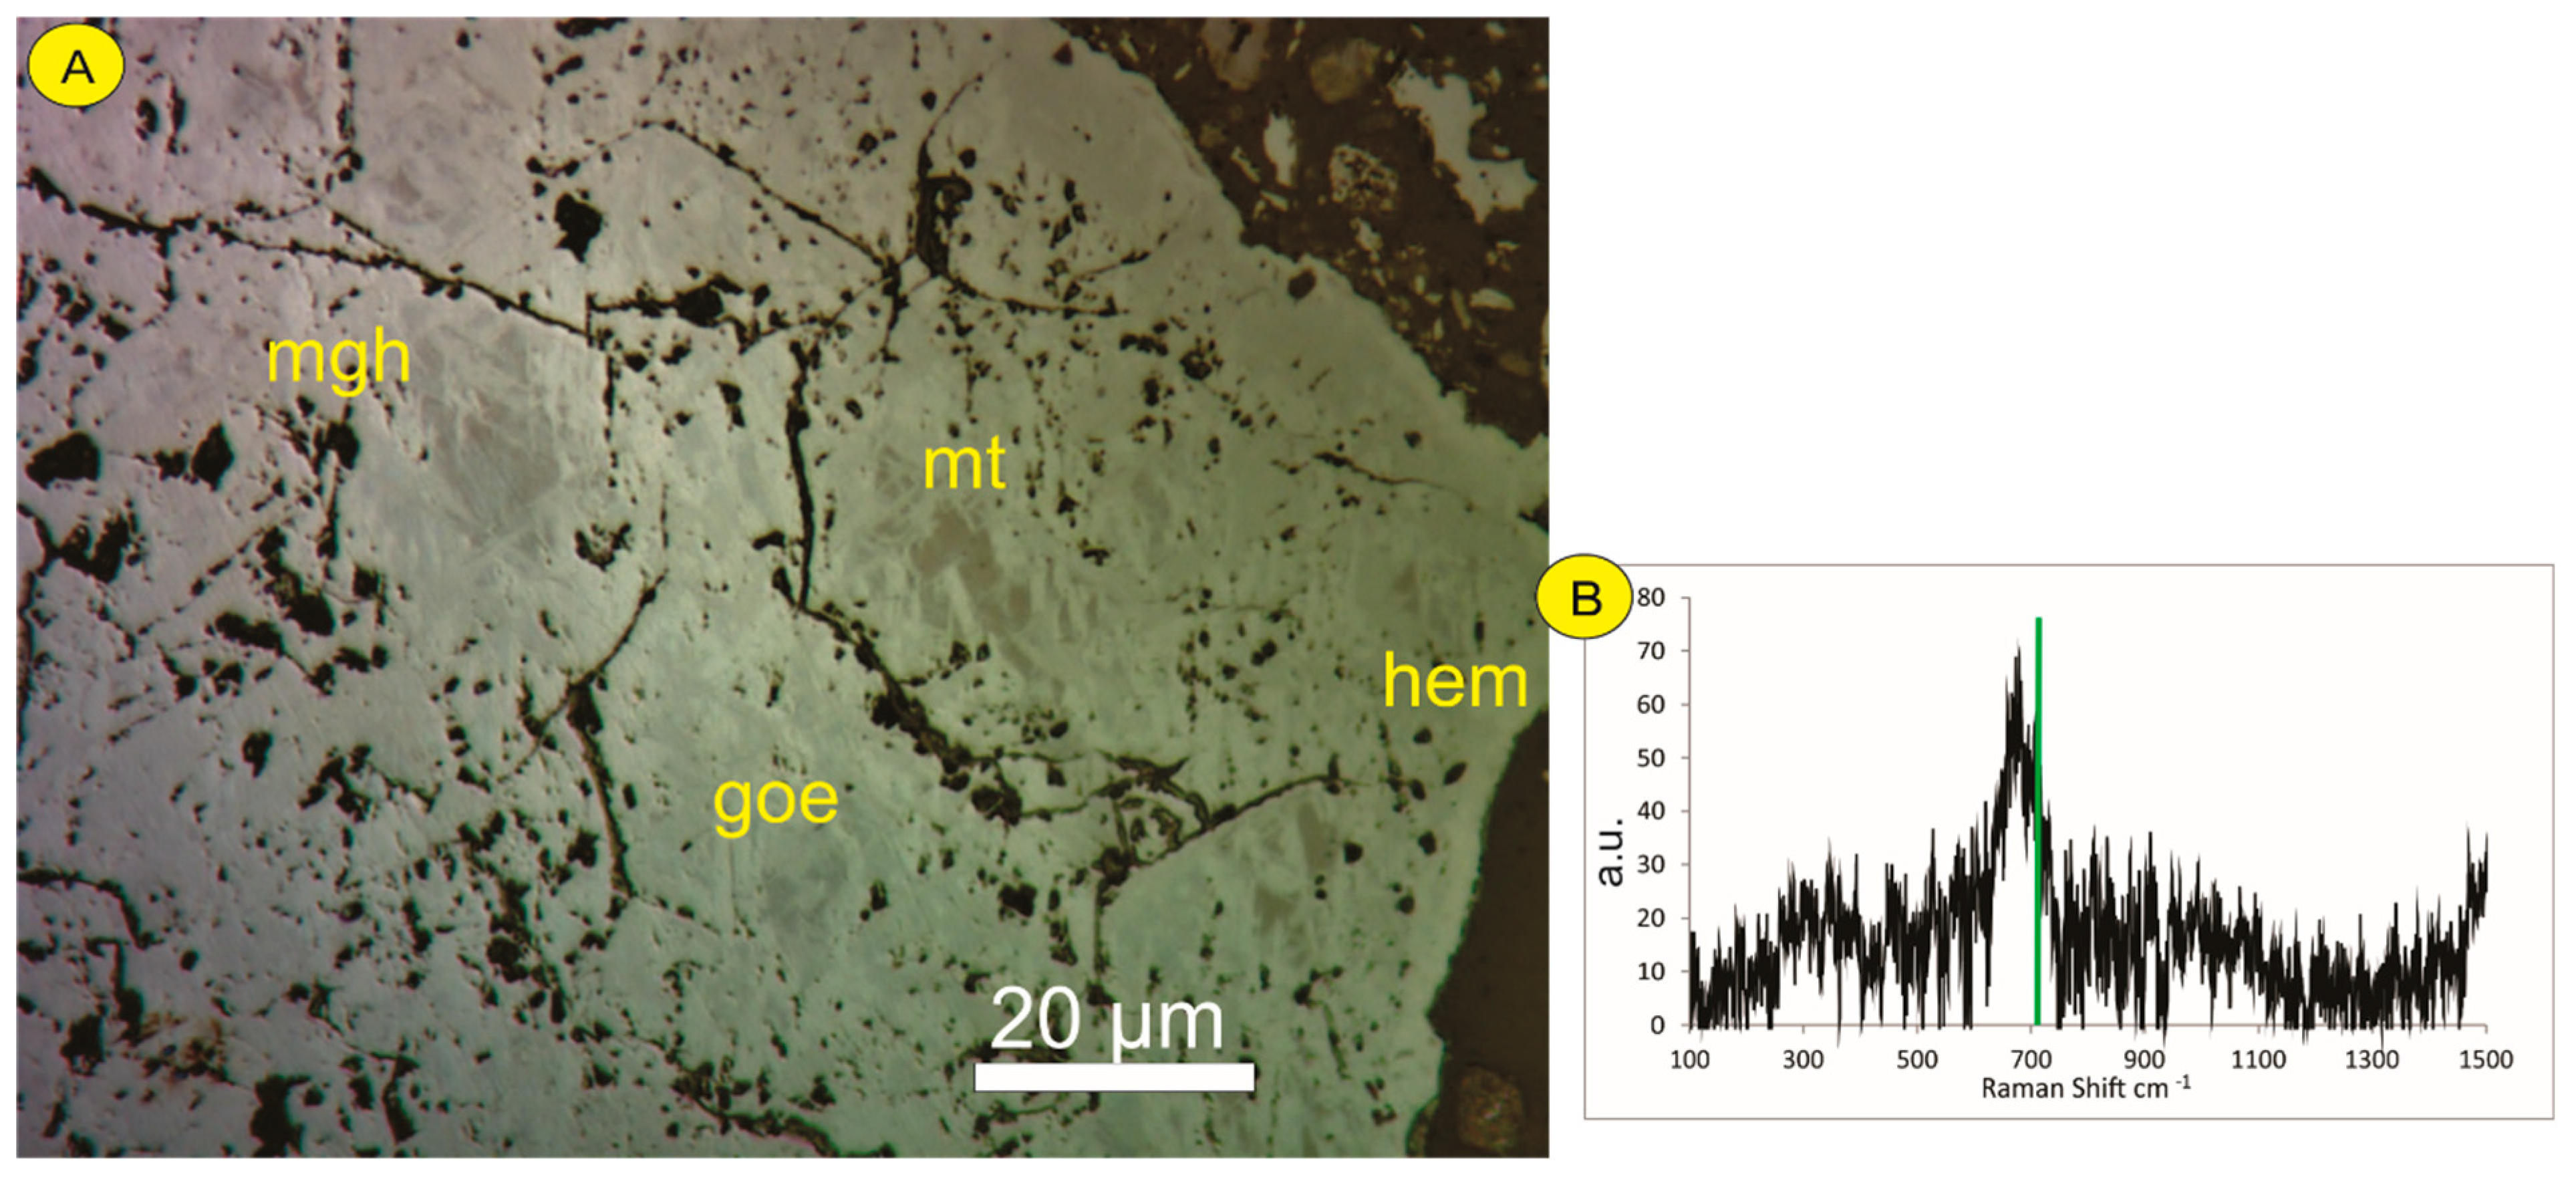
3.2. Second Stage—Iron Ore from Carajás

Table 4 presents the quantitative analysis by the Rietveld method of representative samples from mines N4WN (AM-01A, AM-01B and AM-01H) and N4WS (AM-02A, AM-02C and AM-02J) in Carajás. The mineralogy comprises hematite, goethite, magnetite/maghemite, and minor quartz, kaolinite and gibbsite. While the main ferromagnetic phase in N4WN has an oxidation state close to that of maghemite (χ = 0.052, 0.049, and 0.062), in mine N4WS its oxidation state is closer to that of magnetite (χ = 0.431, 0.373, and 0.404). In fact, the 10 diffraction patterns for each mine are similar to each other, thus only one for each mine (N4WN and N4WS) is shown in Figure 4.
Reflected light microscopy analysis revealed that in the N4WN polished section the magnetite domains (pinkish gray) are very scarce, in contrast to N4WS, where these domains are more common (Figure 5A,B). It agrees with the Rietveld analysis, as in the N4WN samples the predominant magnetic phase is maghemite, with χ values close to zero. The identification of maghemite under a reflected light microscope is a difficult and laborious task, as there is no consensus on its characteristics, especially its color, which may be described in the literature [61,62,63] as light gray, bluish gray, white to bluish gray, bluish white, lilac, pinkish brown, and brownish gray. Meurant [64] developed an empirical color scale to determine the oxidation stage of the magnetite in which the stoichiometric magnetite is pinkish gray, turning brownish pink as its degree of oxidation increases, until it becomes light blue when completely transformed into maghemite. Morris [14], based on the observation of samples from the Hamersley deposits, BIFs from Brazil and Liberia, stated instead that, in practice, iron ores generally exhibit their oxidized magnetic phases with a brownish pink color, and the bluish colors, typically found in the literature, are observed only in some samples. Therefore, either inferred magnetite domains (pinkish gray), nonstoichiometric magnetite (also pinkish gray) or maghemite domains (bluish gray) in the grains should be verified by other analytical techniques, such as Raman spectroscopy, which has a sub-µm to µm spatial resolution matching the reflected light observations.
The N4WS samples are composed mostly by hematite grains, many of them the product of magnetite oxidation that is also abundant in these samples. Quantitatively, this corroborates the results of the analysis by the Rietveld method shown in Table 4. Several stages of transition from magnetite to hematite can be observed under reflected light, ranging from a slight change only at the edges of the magnetite grains until grains of former euhedral magnetite completely replaced by hematite, martite is a commonly observed texture. Goethite is common at the edges of hematite grains, and this association between martitic hematite and microporous goethite forming mixed particles is frequent in several Brazilian iron ores, as described by Santos and Brandao [65]. Maghemite, although not very abundant, has a bluish gray color and generally occurs in hematite grains close to remnants of magnetite and/or nonstoichiometric magnetite, as confirmed by Raman spectroscopy. Figure 6A and Figure 7A show images of N4WS hematite grains in which magnetite and maghemite are pointed out, along with Raman spectra of maghemite obtained in the respective samples (Figure 6B and Figure 7B). It illustrates how difficult it is to differentiate between magnetite (pinkish gray) and maghemite (bluish gray) in bright field images from reflected light microscopy.
Samples from the N4WN mine are very porous and hematite is also the predominant mineral. There are rare occurrences of pinkish gray magnetite, in line with the low grades of magnetite and the low values of χ, tending to maghemite (Table 4). Magnetite is mainly interspersed with hematite (Figure 8A), showing the magnetite-hematite oxidation reaction, and suggesting that it is actually a nonstoichiometric magnetite. Unlike N4WS samples, martite is rarely observed. Figure 8 presents an image of an N4WN hematite grain in which a maghemite domain is identified by its Raman spectrum. Unlike N4WS samples, bluish gray maghemite is scarce in N4WN samples. However, this may be due to the fact that the supposed domains of the solid magnetite-maghemite solution are thinner than the spatial resolution of the used optical microscope, but it can still be detected by Raman spectroscopy as illustrated in Figure 8B.

3.3. Solid Solution Compared to Separate Phases

As already discussed, due to their similar structure, magnetite and maghemite cannot be distinguished by Χ-ray diffraction (ΧRD) both in natural samples [17] and in synthetic samples [66,67]. As the vacancy ordering might promote loss of symmetry, thus evolving to slightly different structures, we have compared our results generated through a continuous solid solution from magnetite to maghemite, to the results using the structures of stoichiometric magnetite and maghemite, both cubic and tetragonal (cubic P 4 3 32   and tetragonal P 4 1 2 1 2 space groups, respectively), as detailed in Table 1. Table 5 shows these results for the most relevant soil and Quarilátero Ferrífero iron ore samples (Guaíra and Espinhaço), while Table 6 displays the ones from both Carajás domains, N4W N and S; both also list the cell parameters and figures of merit.
The (Guaíra) soil sample bears 4.5% of the magnetic phase when measured as a solid solution, which points to maghemite (χ = 0). Refining stoichiometric magnetite together with cubic and tetragonal maghemite, this amounts to a total of 6.9%, a higher grade, mostly by lowering the hematite and ilmenite grades. No stoichiometric magnetite would be expected in the sample, but the analysis assayed 0.5% of it. The cubic maghemite is more abundant than the tetragonal one, but it is significant. The mass-balance for the magnetic phases, however, with just 7.2% of the magnetic minerals being magnetite, results in an equivalent χ = 0.04, which is quite comparable to maghemite only as determined using the solid solution.
The Espinhaço ore from Quadrilátero Ferrífero resulted in 4.8% of non-stoichiometric magnetite, with an intermediate value of χ = 0.372. By measuring stoichiometric magnetite and cubic and tetragonal maghemite, the total magnetic phases were close to 4.5%, with predominant magnetite (3.6%) and only traces of the tetragonal maghemite. Mass-balance for the ferromagnetic phases reveal 81.8% of them to be magnetite, and an equivalent χ = 0.409, again close to the former value.
For the N4WN samples (the results for all the 10 samples are very close), non-stoichiometric magnetite amount to 4.4% of the sample, and the χ = 0.052 value places it close to maghemite. The quantification of the separate stoichiometric magnetic phases magnetite and cubic and tetragonal maghemite totalize 5.2%, largely dominated by the cubic maghemite. Magnetite accounts for only 3.8% of the ferromagnetic minerals, which would correspond to an overall equivalent χ = 0.019. Although this is less than the figure calculated by the solid solution, it again agrees well with a low magnetite content and the overall observations, either under the reflected light microscope or Raman microprobe, which did not detect pure maghemite, but rather nonstoichiometric magnetite associated to it.
The N4WS sample bears 3.2% nonstoichiometric magnetite, with a χ = 0.404 closer to magnetite than to maghemite. Using the stoichiometric phases, the total is very close, 3.4%, and magnetite dominates de ferromagnetic minerals with 2.2%; the tetragonal maghemite is a trace. Magnetite thus accounts for 64.7% of the magnetic phases, with an equivalent χ = 0.324. This means an intermediate composition in terms of the magnetic iron oxides, and is completely adherent to what was calculated using the solid solution approach.

4. Conclusions

Maghemite (γ-Fe2O3) is a metastable phase in the transformation from magnetite to hematite. The identification of nonstoichiometric magnetite, down to completely oxidized maghemite, is not an easy task and is not included in most mineralogical characterization routines. Chemically maghemite is identical to the coexisting hematite, therefore electron beam methods as electron energy or wavelength dispersive spectroscopy fail to recognize it. The very similar magnetic susceptibility of both minerals (k ≈ 3000 × 10−3 [68]) also precludes its identification by this property. Mössbauer spectroscopy at room temperature faces serious limitations to properly distinguish maghemite form often coexisting hematite, magnetite, and goethite, and even in a thermostat [69]. Reflected light microscopy bright field images might separate the mineral by its bluish hues, mostly in martite, which is a texture witnessing transformation from magnetite to hematite as well. However, quite often the maghemite domains are fine, below the resolution of optical microscopes, and might be dispersed in a hematite matrix when martite is not recognized any more. Maghemite can be identified by Raman spectroscopy, however, even if not visible under the microscope and below the spatial resolution of the laser beam (~1 µm), by its diagnostic vibration at 720 cm−1.
The method proposed by Neumann and Medeiros [5] for the identification and quantification of nonstoichiometric magnetite while quantifying the whole mineralogic assembly using ΧRD and the Rietveld method could be tested with maghemite-rich soils, and successfully applied to iron ores. ΧRD is not affected (within limits) by small crystal domains, overcoming the limitations of the image-based methods. As ΧRD demands a finely ground sample, adequate sampling procedures may be used, ensuring its representativity, among other advantages. The approach by constrained refinement placing the mineral’s composition along the magnetite–maghemite solid solution and quantifying it simultaneously was also tested against the refinement using stoichiometric phases (magnetite, cubic and tetragonal maghemite), and allowed for quite similar results, as would be expected. Only one sample, a red latosoil from Guaíra, revealed significant tetragonal maghemite, while the iron ores from Quadrilátero and Carajás carried predominant cubic maghemite. This might be due to the origins of maghemite in the samples, as for the soil it is supposed to derive from fires converting goethite to maghemite [10], and in the iron ores it is an intermediary, metastable phase from the oxidation of magnetite, which ultimately tends to recrystallize to hematite.
Samples from the N4WN and N4WS mines of Carajás (northern Brazil) particularly proved to be interesting from this point of view. While samples from N4WS bear nonstoichiometric magnetite with limited oxidation (χ from 0.37 to 0.43), at N4WN it is close to maghemite, with χ varying from 0.05 to 0.07. For both sample groups, however, nonstoichiometric magnetite to maghemite could be confirmed by Raman spectroscopy.
There is an ample discussion about the reconstruction of mineralization processes in BIF and other iron ores deposits. In Carajás, the most accepted model [1,70] proposes that both hypogene and supergene fluids are involved in deposit genesis. However, the availability of studies approaching supergenic enrichment within this model are still scarce, and most recent work describes only hypogenic iron mineralization. According to Morris [10] maghemite and nonstoichiometric magnetite (called “kenomagnetite”) only will be preserved by supergenic enrichment. The easy and fast determination of the oxidation rate along the magnetite–maghemite solid solution could open new possibilities for genetic studies not only in Carajás, but also in other iron ore deposits of the world.
The correct identification and quantification of these minerals should also allow for more objective research on its implications for ore beneficiation, as surface properties and breakage properties should be affected. ΧRD and the refinement by the Rietveld method could thus overcome the inability to easily detect and quantify nonstoichiometric magnetite and maghemite that has so far precluded the fair evaluation of its effect on iron ore processing.

Author Contributions

Conceptualization, O.d.F.M.G. and R.N.; Methodology, O.d.F.M.G. and R.N.; Validation, R.H.; Formal Analysis, R.H.; Investigation, R.H.; Writing—Original Draft Preparation, R.H.; Writing—Review and Editing, O.d.F.M.G. and R.N.; Supervision, O.d.F.M.G. and R.N.; Project Administration, O.d.F.M.G. and R.N.; Funding Acquisition, O.d.F.M.G. and R.N. All authors have read and agreed to the published version of the manuscript.

Funding

This research was funded by the Brazilian funding agencies CNPq, Finep, ANP and FAPERJ. OFM Gomes and R Neumann acknowledge financial support by CNPq (grants 309301/2017-3 and 315472/2018-9, respectively)

Acknowledgments

The authors are grateful for the support of Brazilian funding agencies CNPq, Finep, ANP and FAPERJ; also thank Carlos Rosière (UFMG), Wenceslau G. Teixeira (Embrapa Solos, RJ) and Frederico Q.G. Goes (Vale S.A.) for donating the samples. RHiraga thanks MCTI and CNPq for a DTI scholarship under the PCI program. Comments and suggestions of two anonymous referees greatly improved the paper.

Conflicts of Interest

The authors declare no conflict of interest.

References

  1. Rosière, C.A.; Baars, F.J.; Seoane, J.C.S.; Lobato, L.M.; Da Silva, L.L.; De Souza, S.R.C.; Mendes, G.E. Structure and iron mineralisation of the Carajás Province. Appl. Earth Sci. 2006, 115, 126–133. [Google Scholar] [CrossRef]
  2. Clout, J.M.F.; Manuel, J.R. Mineralogical, chemical, and physical characteristics of iron ore. In Iron Ore: Mineralogy, Processing and Environmental Issues; Liu, L., Ed.; Woodhead Publishing: Sawston, Cambridge, UK, 2015; pp. 45–84. [Google Scholar]
  3. Gallagher, K.J.; Feitknecht, W.; Mannweiler, U. Mechanism of Oxidation of Magnetite to γ-Fe2O3. Nat. Cell Biol. 1968, 217, 1118–1121. [Google Scholar] [CrossRef]
  4. Walter, A.-V.; Nahon, D.; Flicoteaux, R.; Girard, J.; Melfi, A. Behaviour of major and trace elements and fractionation of REE under tropical weathering of a typical apatite-rich carbonatite from Brazil. Earth Planet. Sci. Lett. 1995, 136, 591–602. [Google Scholar] [CrossRef]
  5. Neumann, R.; Medeiros, E.B. Comprehensive mineralogical and technological characterisation of the Araxá (SE Brazil) complex REE (Nb-P) ore, and the fate of its processing. Int. J. Miner. Process. 2015, 144, 1–10. [Google Scholar] [CrossRef]
  6. Gorski, C.A.; Scherer, M.M. Determination of nanoparticulate magnetite stoichiometry by Mossbauer spectroscopy, acidic dissolution, and powder X-ray diffraction: A critical review. Am. Miner. 2010, 95, 1017–1026. [Google Scholar] [CrossRef]
  7. Bosi, F.; Biagioni, C.; Pasero, M. Nomenclature and classification of the spinel supergroup. Eur. J. Miner. 2019, 31, 183–192. [Google Scholar] [CrossRef] [Green Version]
  8. Greaves, C. A powder neutron diffraction investigation of vacancy ordering and covalence in γ-Fe2O3. J. Solid State Chem. 1983, 49, 325–333. [Google Scholar] [CrossRef]
  9. Grau-Crespo, R.; Al-Baitai, A.Y.; Saadoune, I.; De Leeuw, N.H. Vacancy ordering and electronic structure of γ-Fe2O3(maghemite): A theoretical investigation. J. Physics Condens. Matter 2010, 22, 255401. [Google Scholar] [CrossRef] [Green Version]
  10. Cornell, R.M.; Schwertmann, U. The Iron Oxides: Structure, Properties, Reactions, Occurrences and Uses, 2nd ed.; Wiley-VCH: Weinheim, Germany, 2003; pp. 9–94. [Google Scholar] [CrossRef]
  11. D’Abreu, J.C.; Nunes, E.A.; Antonello, L.L. Maghemite occurence in LD steel mill residues. In Proceedings of the 55th Anual Congress of ABM, Rio de Janeiro, Brazil, 24–28 July 2000. (In Portuguese). [Google Scholar]
  12. Montes, S.; Montes Atenas, G.; Valero, E. How fine particles on hematite mineral ultimately define the mineral surface charge and the overall floatability behaviour. J. South. Afr. Inst. Min. Metall. 2007, 107, 689–695. [Google Scholar]
  13. De Villiers, J.P.R.; Lu, L. ΧRD analysis and evaluation of iron ores and sinters. In Iron Ore: Mineralogy, Processing and Environmental Issues; Lu, L., Ed.; Woodhead Publishing: Sawston, Cambridge, UK, 2015; pp. 85–100. [Google Scholar]
  14. Morris, R.C. Supergene Alteration of Banded Iron-Formation. In Iron-Formation Facts and Problems; Trendall, A.F., Morris, R.C., Eds.; Developments in Precambrian Geology; Elsevier: Amsterdam, The Netherlands, 1983; Volume 6, pp. 513–534. [Google Scholar]
  15. Colombo, U.; Gazzarrini, F.; Lanzavecchia, G.; Sironi, G.; Brewer, J.H.; Allgeier, D.L. Magnetite Oxidation: A Proposed Mechanism. Science 1965, 147, 1033. [Google Scholar] [CrossRef] [PubMed]
  16. Lagoeiro, L.E. Transformation of magnetite to hematite and its influence on the dissolution of iron oxide minerals. J. Metamorph. Geol. 2004, 16, 415–423. [Google Scholar] [CrossRef]
  17. Brown, G. Associated minerals. In Crystal Structures of Clay Minerals and their Χ-ray Identification; Brindley, G.W., Brown, G., Eds.; Mineralogical Society of Great Britain and Ireland: London, UK, 1980; Chapter 6; Volume 5, pp. 361–407. [Google Scholar] [CrossRef] [Green Version]
  18. Cullity, B.D.; Graham, C.D. Introduction to Magnetic Materials; John Wiley & Son: Hoboken, NJ, USA, 2009. [Google Scholar]
  19. Vandenberghe, R.; Barrero, C.; Da Costa, G.; Van San, E.; De Grave, E. Mössbauer characterization of iron oxides and (oxy)hydroxides: The present state of the art. Hyperfine Interact. 2000, 126, 247–259. [Google Scholar] [CrossRef]
  20. Roca, A.G.; Marco, J.F.; Morales, M.D.P.; Serna, C.J. Effect of Nature and Particle Size on Properties of Uniform Magnetite and Maghemite Nanoparticles. J. Phys. Chem. C 2007, 111, 18577–18584. [Google Scholar] [CrossRef]
  21. Doriguetto, A.C.; Fernandes, N.G.; Persiano, A.I.C.; Filho, E.N.; Grenèche, J.M.; Fabris, J.D. Characterization of a natural magnetite. Phys. Chem. Miner. 2003, 30, 249–255. [Google Scholar] [CrossRef]
  22. Barbosa, P.F.; Lagoeiro, L. Crystallographic texture of the magnetite-hematite transformation: Evidence for topotactic relationships in natural samples from Quadrilatero Ferrifero, Brazil. Am. Miner. 2009, 95, 118–125. [Google Scholar] [CrossRef]
  23. Espinosa, A.; Serrano, A.; Llavona, A.; De La Morena, J.J.; Abuin, M.; Figuerola, A.; Pellegrino, T.; Fernández, J.F.; Garcia-Hernandez, M.; Castro, G.R.; et al. On the discrimination between magnetite and maghemite by XANES measurements in fluorescence mode. Meas. Sci. Technol. 2011, 23, 015602. [Google Scholar] [CrossRef]
  24. Ramanaidou, B.; Wells, M.; Belton, D.; Verrall, M.; Ryan, C. Mineralogical and Microchemical Methods for the Characterization of High-Grade Banded Iron Formation-Derived Iron Ore. Soc. Econ. Geol. Rev. 2008, 15, 129–156. [Google Scholar] [CrossRef]
  25. Donskoi, E.; Poliakov, A.; Manuel, J.R. Automated optical image analysis of natural and sintered iron ore. In Iron Ore: Mineralogy, Processing and Environmental Issues; Lu, L., Ed.; Woodhead Publishing: Sawston, Cambridge, UK, 2015; pp. 101–159. [Google Scholar]
  26. Donskoi, E.; Manuel, J.R.; Hapugoda, S.; Poliakov, A.; Raynlyn, T.; Austin, P.; Peterson, M. Automated optical image analysis of goethitic iron ores. Miner. Process. Extr. Met. 2020, 1–11. [Google Scholar] [CrossRef]
  27. Iglesias, J.C.Á.; Augusto, K.S.; Gomes, O.D.F.M.; Domingues, A.L.A.; Vieira, M.B.; Casagrande, C.; Paciornik, S. Automatic characterization of iron ore by digital microscopy and image analysis. J. Mater. Res. Technol. 2018, 7, 376–380. [Google Scholar] [CrossRef]
  28. Kerr, J.C. Latossolos do Brasil: Uma revisão. Geonomos 1997, 5, 17–40. [Google Scholar] [CrossRef]
  29. Rosiere, C.A.; Chemale, F., Jr. Itabiritos e minérios de ferro de alto teor do Quadrilátero Ferrífero—Uma visão geral e discussão. Geonomos 2000, 8, 27–42. [Google Scholar] [CrossRef] [Green Version]
  30. Varajão, C.A.C.; Salgado, A.A.R.; Varajão, A.F.D.C.; Braucher, R.; Colin, F.; Árias, N.H., Jr. Estudo da evolução da paisagem do quadrilátero ferrífero (Minas Gerais, Brasil) por meio da mensuração das taxas de erosão (10be) e da pedogênese. Rev. Bras. Ciência Solo 2009, 33, 1409–1425. [Google Scholar] [CrossRef]
  31. Cheary, R.W.; Coelho, A. A fundamental parameters approach to X-ray line-profile fitting. J. Appl. Crystallogr. 1992, 25, 109–121. [Google Scholar] [CrossRef]
  32. Hölzer, G.; Fritsch, M.; Deutsch, M.; Härtwig, J.; Förster, E. Kα1,2andKβ1,3x-ray emission lines of the3dtransition metals. Phys. Rev. A 1997, 56, 4554–4568. [Google Scholar] [CrossRef]
  33. Gražulis, S.; Chateigner, D.; Downs, R.T.; Yokochi, A.T.; Quiros, M.; Lutterotti, L.; Manakova, E.; Butkus, J.; Moeck, P.; Le Bail, A. Crystallography Open Database—An open-access collection of crystal structures. J. Appl. Crystallogr. 2009, 42, 726–729. [Google Scholar] [CrossRef]
  34. Neder, R.B.; Burghammer, M.; Grasl, T.; Schulz, H.; Bram, A.; Fiedler, S. Refinement of the Kaolinite Structure from Single-Crystal Synchrotron Data. Clays Clay Miner. 1999, 47, 487–494. [Google Scholar] [CrossRef]
  35. Morris, M.C.; McMurdie, H.F.; Evans, E.H.; Paretzkin, B.; Parker, H.S.; Panagiotopoulos, N.C. Standard Χ-ray Diffraction Powder Patterns; NBS: Washington, DC, USA, 1981; Section 18; p. 106. [Google Scholar]
  36. Antao, S.M.; Hassan, I.; Wang, J.; Lee, P.L.; Toby, B.H. State-of-the-art high-resolution powder x-ray diffraction (HRPXRD) illustrated with Rietveld structure refinement of quartz, sodalite, tremolite, and meionite. Can. Mineral. 2008, 46, 1501–1509. [Google Scholar] [CrossRef]
  37. Harrison, R.K.; Aitkenhead, N.; Young, B.R.; Dagger, P.F. Goethite from Hindlow, Derbyshire. Bull. Geol. Surv. Great Britain 1975, 52, 51–54. [Google Scholar]
  38. Knorr, K.; Neumann, R. Advances in Quantitative Χ-Ray Mineralogy: Miχed Crystals in Bauχite. In Proceedings of the 10th International Congress for Applied Mineralogy; Broekmans, M.A.T.M., Ed.; Springer: Berlin/Heidelberg, Germany, 2012; pp. 377–384. [Google Scholar]
  39. Sadykov, V.A.; Isupova, L.A.; Tsybulya, S.V.; Cherepanova, S.V.; Litvak, G.S.; Burgina, E.B.; Kustova, G.N.; Kolomiichuk, V.N.; Ivanov, V.P.; Paukshtis, E.A.; et al. Effect of Mechanical Activation on the Real Structure and Reactivity of Iron (III) Oχide with Corundum-Type Structure. J. Solid State Chem. 1996, 123, 191–202. [Google Scholar] [CrossRef]
  40. Neumann, R.; Avelar, A.N.; Da Costa, G.M. Refinement of the isomorphic substitutions in goethite and hematite by the Rietveld method, and relevance to bauxite characterisation and processing. Miner. Eng. 2014, 55, 80–86. [Google Scholar] [CrossRef]
  41. Della Giusta, A.; Princivalle, F.; Carbonin, S. Crystal structure and cation distribution in some natural magnetites. Miner. Pet. 1987, 37, 315–321. [Google Scholar] [CrossRef]
  42. Gatta, G.D.; Kantor, I.; Ballaran, T.B.; Dubrovinsky, L.; McCammon, C. Effect of non-hydrostatic conditions on the elastic behaviour of magnetite: An in situ single-crystal X-ray diffraction study. Phys. Chem. Miner. 2007, 34, 627–635. [Google Scholar] [CrossRef]
  43. Cisar, A.; Poulsen, K. Grant-in-Aid, JCPDS-ICDD. In ICDD; Dow Chemical Company: Freeport, TX, USA, 1979; pp. 18–33. [Google Scholar]
  44. Saalfeld, H.; Wedde, M. Refinement of the crystal structure of gibbsite, Al(OH)3. Z. Krist. 1974, 139, 129–135. [Google Scholar] [CrossRef]
  45. Morris, M.C.; McMurdie, H.F.; Evans, E.H.; Paretzkin, B.; de Groot, J.H.; Weeks, B.S.; Newberry, R.J. Standard Χ-ray Diffraction Powder Patterns; NBS: Washington, DC, USA, 1978; Section 15; p. 199. [Google Scholar]
  46. Wechsler, B.A.; Prewitt, C.T. Crystal structure of ilmenite (FeTiO3) at high temperature and high pressure room temperature after heating. Am. Mineral. 1984, 69, 176–185. [Google Scholar] [CrossRef]
  47. Perdikatsis, B.; Burzlaff, H. Strukturverfeinerung am Talk Mg3[(OH)2Si4O10]. Z. Krist. Cryst. Mater. 1981, 156, 177–186. [Google Scholar] [CrossRef]
  48. Baur, W.H.; Khan, A.A. Rutile-type compounds. IV. SiO2, GeO2 and a comparison with other rutile-type structures. Acta Crystallographica Section B 1971, 27, 2133–2139. [Google Scholar] [CrossRef]
  49. Restori, R.; Schwarzenbach, D.; Schneider, J.R. Charge density in rutile, TiO2. Acta Crystallogr. Sect. B 1987, 43, 251–257. [Google Scholar] [CrossRef]
  50. Howard, C.J.; Sabine, T.M.; Dickson, F. Structural and thermal parameters for rutile and anatase. Acta Crystallogr. Sect. B 1991, 47, 462–468. [Google Scholar] [CrossRef] [Green Version]
  51. Wyckoff, R.W.G. Crystal Structures, 2nd ed.; Interscience Publishers: New York, NY, USA, 1963; pp. 239–444. [Google Scholar]
  52. Taylor, M.; Brown, G.E. High-temperature structural study of the P21/a →A2/a phase transition in synthetic titanite, CaTiSiO5. Am. Mineral. 1976, 61, 435–447. [Google Scholar]
  53. Pecharroman, C.; Gonzalez-Carreno, T.; Iglesias, J.E. The infrared dielectric properties of maghemite, gamma-Fe2O3, from reflectance measurement on pressed powders. Phys. Chem. Miner. 1995, 22, 21–29. [Google Scholar] [CrossRef]
  54. De Faria, D.L.; Venâncio Silva, S.; De Oliveira, M.T. Raman microspectroscopy of some iron oxides and oxyhydroxides. J. Raman Spectrosc. 1997, 28, 873–878. [Google Scholar] [CrossRef]
  55. Gomes, O.F.M.; Paciornik, S. Multimodal Microscopy for Ore Characterization. In Scanning Electron Microscopy; Kazmiruk, V., Ed.; IntechOpen: London, UK, 2012; pp. 313–334. [Google Scholar]
  56. Toby, B.H. R factors in Rietveld analysis: How good is good enough? Powder Diffr. 2006, 21, 67–70. [Google Scholar] [CrossRef] [Green Version]
  57. Ohtsuka, T.; Kubo, K.; Sato, N. Raman Spectroscopy of Thin Corrosion Films on Iron at 100 to 150 C in Air. Corrosion 1986, 42, 476–481. [Google Scholar] [CrossRef]
  58. Legodi, M.; De Waal, D. The preparation of magnetite, goethite, hematite and maghemite of pigment quality from mill scale iron waste. Dye. Pigment. 2007, 74, 161–168. [Google Scholar] [CrossRef]
  59. Van der Weerd, J.; Rehren, T.; Firth, S.; Clark, R.J.H. Identification of iron oxide impurities in earliest industrial-scale processed platinum. Mat. Charact. 2004, 53, 63–70. [Google Scholar] [CrossRef]
  60. Muralha, V.S.F.; Rehren, T.; Clark, R.J.H. Characterization of an iron smelting slag from Zimbabwe by Raman microscopy and electron beam analysis. J. Raman Spectrosc. 2011, 42, 2077–2084. [Google Scholar] [CrossRef]
  61. Anthony, J.W.; Bideaux, R.A.; Bladh, K.W.; Nichols, M.C. (Eds.) Handbook of Mineralogy [Homepage on the Internet]; Mineralogical Society of America: Chantilly, VA, USA, 2004; Available online: http://www.handbookofmineralogy.org/ (accessed on 7 December 2020).
  62. Pracejus, B. (Ed.) The Ore Minerals Under the Microscope: An Optical Guide; Elsevier: Amsterdam, The Netherlands, 2008; pp. 648–650. [Google Scholar]
  63. Neumann, U. Guide for the Microscopical Identification of Ore and Gangue Minerals; Tübingen University Press: Tübingen, Germany, 2019. [Google Scholar]
  64. Meurant, G. Regional Studies and Specific Deposits; Elsevier: Amsterdam, The Netherlands, 2012; pp. 102–115. [Google Scholar]
  65. Santos, L.D.; Brandão, P.R.G. LM, SEM and EDS study of microstructure of Brazilian iron ores. Microsc. Anal. 2005, 19, 17–19. [Google Scholar]
  66. Demortière, A.; Panissod, P.; Pichon, B.P.; Pourroy, G.; Guillon, D.; Donnio, B.; Bégin-Colin, S. Size-dependent properties of magnetic iron oxidenanocrystals. Nanoscale 2011, 3, 225–232. [Google Scholar] [CrossRef]
  67. Morales, M.P.; Veintemillas-Verdaguer, S.; Montero, M.I.; Serna, C.J.; Roig, A.; Casas, L.; Martínez, B.; Sandiumenge, F. Surface and Internal Spin Canting in γ-Fe2O3Nanoparticles. Chem. Mater. 1999, 11, 3058–3064. [Google Scholar] [CrossRef]
  68. Hunt, C.P.; Moskowitz, B.M.; Banerjee, S.K. Magnetic Properties of Rocks and Minerals. In Rock Physics & Phase Relations: A Handbook of Physical Constants; Ahrens, T.J., Ed.; American Geophysical Union: Washington, DC, USA, 1995; pp. 189–204. [Google Scholar]
  69. Da Costa, G.; De Grave, E.; Vandenberghe, R. Mössbauer studies of magnetite and Al-substituted maghemites. Hyperfine Interactions 1998, 117, 207–243. [Google Scholar] [CrossRef]
  70. Lobato, L.M.; Rosière, C.A.; Silva, R.C.F.; Zucchetti, M.; Baars, F.J.; Seoane, J.C.S.; Rios, F.J.; Pimentel, M.; Mendes, G.E.; Monteiro, A.M. A mineralização hidrotermal de ferro da Província Mineral de Carajás—Controle estrutural e contexto na evolução metalogenética da província. In Caracterização de Depósitos Minerais em Distritos Mineiros da Amazônia; Marini, O.J., Queiroz, E.T.D., Ramos, B.W., Eds.; DNPM/CTMineral/FINEP/ADIMB: Brasília, Brazil, 2005; pp. 25–92. [Google Scholar]
Figure 1. Rietveld method refinement results for the iron ore samples from Quadrilátero Ferrífero. Measured and calculated patterns as blue circles and red line, respectively, residue as the respective gray line at the bottom.
Minerals 11 00346 g001
Figure 2. Rietveld method refinement results for the soil samples. Measured and calculated patterns as blue circles and red lines, respectively, residue as the gray line at the bottom.
Minerals 11 00346 g002
Figure 3. Guaíra soil particle observed by reflected light microscopy, and Raman spectra with diagnostic vibrations of (1) hematite (225, 293, 415, 500, 618 cm−1); (2) ilmenite (225, 390, 670 cm−1); (3,4) nonstoichiometric magnetite (675 cm−1); (5) maghemite (667, 720 cm−1); (6) maghemite and goethite intergrowth (243, 293, 385, 399, 470, 547 cm−1).
Minerals 11 00346 g003
Figure 4. Rietveld method refinement results for the Carajás N4WN and N4WS samples. Measured and calculated patterns as blue circles and red lines, respectively, residue as the gray line at the bottom.
Minerals 11 00346 g004
Figure 5. (A) N4WN polished section exhibiting predominance of hematite (light gray) grains and few magnetite domains (mt, pinkish gray); (B) N4WS polished section, here the magnetite domains (mt, pinkish gray) are more abundant than in N4WN.
Minerals 11 00346 g005
Figure 6. (A) N4WS hematite grain observed by reflected light microscopy in bright field mode: hematite (hem, light gray), maghemite (mgh, bluish gray), magnetite (mt, pinkish gray) and goethite (goe, dark gray); (B) Raman spectrum of maghemite with marker at the diagnostic vibration at 720 cm−1, measured at the mgh domain in (A).
Minerals 11 00346 g006
Figure 7. (A) Reflected light microscopy bright field image of a N4WS grain with intergrowth of hematite (hem, light gray), maghemite (mgh, bluish gray), magnetite (mt, pinkish gray), and goethite (goe, dark gray); (B) Raman spectrum of maghemite with marker at the diagnostic vibration at 720 cm−1, measured at the mgh domain in (A).
Minerals 11 00346 g007
Figure 8. (A) Reflected light microscopy bright field image of a small domain of nonstoichiometric magnetite in a hematite grain from a sample from the N4WN mine; (B) Raman spectrum of nonstoichiometric magnetite and the diagnostic maghemite vibration at 720 cm−1, measured at the mgh domain in (A); maghemite domain is probably below the microscope’s resolution, but is still detected by the spectrometer.
Minerals 11 00346 g008
Table 1. Crystal structures used for the refinement.
MineralDatabase and Code UsedReferenceCell Parameters (Å) and Range
KaoliniteICSD, kaolinite 87771Neder et al. (1999) [34]a-5.1560 (5.1200–5.2000)
b-8.9450 (8.9000–8.9900)
c-7.4050 (7.3800–7.4500)
QuartzBruker, quartz
ICDD 331161
COD 2011 9013321
Morris et al. (1981) [35]
Antao et al. (2008) [36]
a-4.9120 (4.9000–4.9350)
b = a
c-5.4040 (5.3800–5.4500)
Goethite, AlModified from Bruker goethite
ICDD 290713
Harrison et al. (1975) [37], modified by [38]a-9.9600 (9.9000–10.0000)
b-3.0230 (2.9800–3.0700)
c-4.6050 (4.5500–4.6500)
Hematite, Al, OHModified from Bruker hematite
ICDD 330664
Sadykov et al. (1996) [39], modified by [40]a-5.0370 (5.0100–5.0700)
b = a
c-13.7710 (13.7000–13.8300)
Magnetite, nonstoich.Modified from Bruker magnetite
ICDD 190629
COD 2011 9010939
Della Giusta et al. (1987) [41], modified by [5]
Gatta et al. [42]
a-8.3950 (8.3200–8.4700)
b = a
c = a
GibbsiteBruker, gibbsite
ICDD 330018
COD 2011 9008237
Cisar & Paulsen (1979) [43]
Saafeld et al. [44]
a-8.6850 (8.6000–8.7500)
b-5.0770 (5.0000–5.2000)
c-9.7360 (9.6000–9.8000)
IlmeniteBruker, ilmenite
ICDD 290733
COD 2011 9000911
Morris et al. (1978) [45]
Wechsler et al. [46]
a-5.0870 (5.0370–5.1390)
b = a
c-14.0840 (13.9440–14.2260)
TalcBruker, talc
ICDD 190770
Perdikatsis & Burzlaff (1981) [47]a-5.2930 (5.2400–5.3460)
b-9.1790 (9.0870–9.2710)
c-9.4690 (9.3740–9.5640)
RutileBruker, rutile
ICDD 211276
COD 2011 9007531
Restori et al. (1987) [48]
Baur et al. (1971) [49]
a-4.5940 (4.5600–4.6400)
b = a
c-2.9600 (2.9500–2.9700)
AnataseBruker, anatase
ICDD 211272
COD 2011 9009086
Howard et al. (1991) [50]
Wyckoff et al. (1963) [51]
a-3.7820 (3.6800–3.8800)
b = a
c-9.5140 (9.3000–9.6000)
TitaniteBruker, titanite
ICDD 250177
Taylor & Brown (1976) [52]a-7.4550 (7.3810–7.5300)
b-8.7140 (8.6270–8.8010)
c-7.0680 (6.9970–7.1390)
Cubic maghemiteBruker maghemite
ICDD 391346
Bruker a = 8.3460 (8.2800–8.4100)
b = a
c = a
Tetragonal maghemiteICSD 172906Jorgensen, J.E et al. [53]a = 8.3320 (8.2800–8.4100)
b = a
c = 25.113 (24.8400–25.2300)
Table 2. Rietveld quantitative phase analysis, substitutions, and magnetite stoichiometry (χ) for iron ores from the Quadrilátero Ferrífero.
Mineral (wt%)Quadrilátero Ferrífero
GuanhãesGuanhães 2Espinhaço
Hematite(-Al)70.111.793.7
Ilmenite14.6--
Quartz3.80.71.6
Nonstoichiometric
magnetite
0.487.64.8
Talc2.1--
Substitutions (mol)
Fe3+ hematite0.9800.9880.981
Al3+ hematite0.0090.0000.002
OH hematite0.0310.0540.051
χ magnetite0.0910.5000.372
a magnetite (Å)8.35238.39718.3831
RWP2.212.693.06
GOF2.202.623.01
Table 3. Rietveld quantitative phase analysis, substitutions, and magnetite stoichiometry (χ) for the soils.
Mineral (wt%) Soil
GuaíraIlha GrandeMato Grosso
Hematite(-Al)38.79.518.4
Kaolinite10.1--
Gibbsite32.6--
Ilmenite4.63.561.7
Anatase3.8-0.4
Quartz3.00.72.1
Nonstoichiometric
magnetite
4.586.39.9
Titanite0.9--
Goethite-(Al)1.9-1.2
Rutile--6.4
Substitutions (mol)
Fe3+ hematite0.8680.9770.895
Al3+ hematite0.1150.0080.046
OH hematite0.0490.040.176
Al goethite0.236-0.358
χ magnetite0.0000.5000.458
a magnetite (Å)8.34248.39718.3925
RWP2.572.202.43
GOF1.852.061.70
Table 4. Rietveld quantitative phase analysis, substitutions, and magnetite stoichiometry (χ) for iron ores from Carajás.
Mineral (wt%) N4WN N4WS
AM-01AAM-01BAM-01HAM-02AAM-02BAM-02E
Kaolinite0.60.20.40.30.40.3
Quartz0.70.70.70.50.30.5
Goethite-Al6.16.36.017.918.018.6
Hematite-Al88.288.388.277.577.777.0
Nonstoichiometric magnetite4.54.54.63.43.23.2
Gibbsite0.00.00.00.40.40.4
Substitutions (mol)
Fe3+ hematite0.9730.9730.9710.9640.9620.963
Al3+ hematite0.0050.0050.0060.0050.0090.007
OH hematite0.0680.0660.0690.0940.0870.089
Al goethite0.0070.0080.0120.0320.0350.034
χ magnetite0.0490.0490.0620.4310.3730.404
a magnetite (Å)8.34778.34788.34928.38958.38328.3866
RWP1.841.841.831.751.861.83
GOF1.771.781.781.681.801.76
Table 5. Rietveld method quantitative phase analysis, comparing the magnetite–maghemite solid solution approach with the refinement using stoichiometric magnetite, cubic maghemite and tetragonal maghemite structures, for a soil (Guaíra) and a Quadrilátero Ferrífero iron ore (Espinhaço) sample.
Mineral (wt%)GuaíraEspinhaço
Stoichiometric Magnetite and MaghemiteMagnetite-Maghemite Solid SolutionStoichiometric Magnetite and MaghemiteMagnetite-Maghemite Solid Solution
Kaolinite10.510.1
Quartz3.03.01.61.6
Goethite(-Al)2.31.9
Hematite(-Al)37.538.793.493.7
Nonstoichiometric Magnetite 4.5 4.8
Gibbsite32.532.6
Magnetite0.5 3.6
Titanite0.60.9
Anatase3.73.8
Maghemite (tetragonal)2.4 0.1
Ilmenite4.14.6
Maghemite (cubic)3.0 0.8
Substitutions (mol)
Fe3+ hematite0.8880.8680.9810.981
Al3+ hematite0.1060.1150.0020.002
OH hematite0.0180.0490.0500.051
Al goethite0.2390.236
χ magnetite 0.000 0.372
a nonstoichiometric magnetite (Å) 8.3424 8.3831
a maghemite cubic (Å)8.331 8.353
a magnetite (Å)8.437 8.395
a maghemite_tetr. (Å)8.280 8.280
c maghemite_tetr. (Å)25.076 24.843
RWP2.542.573.063.06
GOF1.821.853.013.01
Table 6. Rietveld method quantitative phase analysis, comparing the magnetite-maghemite solid solution approach with the refinement using stoichiometric magnetite, cubic maghemite and tetragonal maghemite structures, for the iron ores from Carajás.
Mineral (wt%)N4WN-AN4WS-E
Stoichiometric Magnetite and MaghemiteMagnetite-Maghemite Solid SolutionStoichiometric Magnetite and MaghemiteMagnetite-Maghemite Solid Solution
Kaolinite0.50.60.30.3
Quartz0.70.70.50.5
Goethite(-Al)6.16.118.718.6
Hematite(-Al)87.388.276.977.0
Nonstoichiometric Magnetite 4.5 3.2
Gibbsite 0.10.4
Magnetite0.2 2.2
Maghemite (tetragonal)1.1 0.1
Maghemite (cubic)4.0 1.1
Substitutions (mol)
Fe3+ hematite0.9720.9730.9640.963
Al3+ hematite0.0050.0050.0070.007
OH hematite0.0730.0670.0880.089
Al goethite0.0680.0080.0340.034
χ magnetite 0.049 0.404
a nonstoichiometric magnetite (Å) 8.3477 8.3866
a maghemite cubic (Å)8.347 8.356
a magnetite (Å)8.418 8.401
a maghemite_tetr. (Å)8.293 8.280
c maghemite_tetr. (Å)25.035 24.840
RWP1.811.841.811.83
GOF1.751.771.741.76
Publisher’s Note: MDPI stays neutral with regard to jurisdictional claims in published maps and institutional affiliations.

