Article

Gel Formation at the Front of Expanding Calcium Bentonites

1
British Geological Survey, Keyworth, Nottinghamshire NG12 5GG, UK
2
Svensk Kärnbränslehantering AB (SKB), Brahegatan 47, 10240 Stockholm, Sweden
*
Author to whom correspondence should be addressed.
Minerals 2021, 11(2), 215; https://doi.org/10.3390/min11020215
Submission received: 20 November 2020 / Revised: 3 February 2021 / Accepted: 8 February 2021 / Published: 20 February 2021

Abstract

:
The removal of potentially harmful radioactive waste from the anthroposphere will require disposal in geological repositories, the designs of which often favour the inclusion of a clay backfill or engineered barrier around the waste. Bentonite is often proposed as this engineered barrier and understanding its long-term performance and behaviour is vital in establishing the safety case for its usage. There are many different compositions of bentonite that exist and much research has focussed on the properties and behaviour of both sodium (Na) and calcium (Ca) bentonites. This study focusses on the results of a swelling test on Bulgarian Ca bentonite that showed an unusual gel formation at the expanding front, unobserved in previous tests of this type using the sodium bentonite MX80. The Bulgarian Ca bentonite was able to swell to completely fill an internal void space over the duration of the test, with a thin gel layer present on one end of the sample. The properties of the gel, along with the rest of the bulk sample, have been investigated using ESEM, EXDA and XRD analyses and the formation mechanism has been attributed to the migration of nanoparticulate smectite through a more silica-rich matrix of the bentonite substrate. The migration of smectite clay out of the bulk of the sample has important implications for bentonite erosion where this engineered barrier interacts with flowing groundwater in repository host rocks.

1. Introduction

Geological disposal of intermediate and high level hazardous waste in an especially constructed repository is the favoured choice for the long-term removal of radioactive material from the anthroposphere [1,2,3]. The repository designs often include a number of different natural and engineered barriers to prevent the waste from contaminating the environment (e.g., [1,4,5]). Bentonite is commonly included as the clay backfill or engineered barrier in these designs [6,7,8] because of its low permeability, high swelling capacity and self-sealing properties [9,10,11,12]. Many different compositions of bentonite exist, and much research has been focussed on the properties and behaviour of sodium (Na) and calcium (Ca) bentonites [13,14,15,16,17,18,19]. Within Europe to date, more focus has been turned towards the sodium bentonites for example the MX80 [20] and Turkish Resadiye [21] bentonites. However, numerous nations [22,23,24] are still considering the use of a Ca bentonite at different dry densities in their radioactive waste disposal concepts, because of a natural availability (e.g., Fourges Clay, Černý Vrch deposit).
Studies have looked at the differences in performance between these two types of bentonite. Marcial et al. [25] have investigated the water retention, permeability and compression characteristics, and Ben Rhaïem et al. [26] have looked at pore size distribution, hydration and swelling capacity. The studies demonstrated that the Ca-bentonite had fewer small pores, and a larger void ratio at higher compressional stresses than the Na-bentonite, with Marcial et al. [25] attributing the higher void ratios of the Ca-bentonite to the larger size of the Ca 2 + cation. Their results [25] were consistent with the observations of Tessier [27] and Ben Rhaïem et al. [26], who documented the removal of water molecules from calcium smectites at high suction pressures (>5 MPa). Ben Rhaïem et al. [26] also suggested that the reduced number of smaller pores in the Ca-bentonite led to a decrease in both the hydration and swelling capacity compared to Na-bentonites. This is congruous with the slightly higher water permeability values derived from consolidation curves for the Ca-bentonite, and observed using a constant head procedure [25]. However, for void ratios (e) of 1, the permeabilities of the Ca-bentonites tested (the natural Fourges bentonite, and the non-Na-activated equivalent of the FoCa7 clay) were on the order of 10 12 to 10 13 and close to the values obtained for the other Na-bentonites in their study (Na-Kunigel and Na-Ca MX80).
The formation of bentonite gels from the suspension of low clay concentrations (of a few weight %) in water has long had useful applications in drilling, pharmaceuticals and paper manufacture, amongst other industries [28]. These gels are held together by electrostatic and van der Waals forces and have been found to have a pseudoplastic rheological behaviour. When the gels have clay particles in a sufficient concentration, the interactions between the particles gives the gel a yield stress which causes thixotropic behaviour, whilst concentrations below a threshold will result in soft-elastic behaviour, both of which can be represented by the Bingham Model [28,29]. In radioactive waste repository design, bentonite gels have not been considered because the dry densities of the clay backfill and engineered barriers are intended to be significantly higher than the low clay percentages required for gel formation. However, the disposal concepts frequently incorporate the engineered barrier as a series of stacked individual blocks [4,30,31,32], which will introduce void spaces between the blocks and at their edge next to the host rock [33]. The high swelling capacity of the bentonite barrier and the availability of water will cause the clay to swell to fill these spaces, removing their ability to transmit fluids and effectively sealing the waste away from the environment. Studies have looked at the material behaviour at ambient and elevated temperatures, examining the swelling capacity [9,10,11,34] and swelling (or suction) pressure, both at steady-state and over time [33,35,36,37,38,39,40,41,42,43,44,45,46,47,48]. The most recent studies [47,48] have investigated the development and evolution of swelling pressure within the barrier, looking at a case where the void space is nearly equivalent in size to that of the clay material. These large void spaces are especially likely to occur at the edges of the engineered barrier [33], where the availability of water is also likely to be high as it migrates away from the waste canister and heat source (e.g., [49]). Moreover, at the outer edge of the barrier where the bentonite abuts the host rock formation, the presence of fractures and fluid-filled pathways may provide an additional opportunity for the barrier to expand. Should these fractures contain flowing groundwater, there is a significant concern that the bentonite may erode, gradually reducing the effectiveness of the barrier [1,50,51].
In this paper we present the results of an experimental swelling pressure development test conducted on Bulgarian Ca bentonite where the formation of a gel was observed at the swelling front of the clay. The results of this test are compared against analyses made on an MX80 bentonite sample that has undergone a similar test history but does not show the gel formation. The formation of a gel is an unusual observation and this segregation of the sample into a hydrated bentonite with a gel layer has implications for the mechanical properties and behaviour of the material within the repository, and for the erosion of bentonites into fluid-filled fractures in the host rock.

2. Materials and Methods

A Bulgarian Ca bentonite was used for the laboratory experimentation presented in this study. The material was supplied as a granular powder by Imerys (sourced by Svensk Kärnbränslehantering AB) and was compacted to form test samples. The powder had been previously analysed and found to contain 82.6 wt.% montmorillonite, 6.4 wt.% cristobalite, 6.3 wt.% mica/illite and 4.0 wt.% calcite, as well as <1 wt.% gypsum and tridymite, and the bulk material had a cation exchange capacity (CEC) of 79.4 (cmol(+)/kg) [52]. In the study by Svenson et al. [52], the material is termed Bulgaria 2018 20 tonnes batch. The powder was mixed with a specified quantity of water using a dispersing spray bottle and pallete knife to ensure that the mixture was as homogenous as possible. The mixture was then compacted axially with a ram at 80 MPa to produce a 100% saturated cylindrical sample with a target dry density of 1700 kg/m 3 and a diameter of 60 mm (Table 1). The sample was turned down using a machine lathe to precisely fit the testing apparatus. A figure (Figure S1) and description of the testing apparatus are included in the Supplementary Materials.
The apparatus was instrumented with 5 load cells (3 radial and 2 axial) to measure the stress distribution in the sample and 12 radial pore pressure transducers. The apparatus tubework was sequentially flushed with distilled water (the test fluid) through each available port to remove any residual air before being connected together and the apparatus calibrated. The calibration for each of the sensors was compared against the laboratory standard, providing a linear least squares regression which was used to apply a correction to the measured data from that sensor. This calibration, in increasing and decreasing increments, also allowed the hysteresis in the apparatus to be quantified. The sample installation took place immediately after the apparatus had been flushed and calibrated to minimise any drying of the sample. Distilled water was used as the test fluid in two Teledyne ISCO 260 D Series high-precision syringe pumps that supplied a porewater pressure of 4500 kPa to each end of the apparatus and were used to control and monitor the flow into and out of the sample. Distilled water was also used to fill the remaining void space inside the vessel after the sample had been inserted and pushed to the left-hand end of the vessel. After the sample had been inserted and porewater pressure had been applied to both ends of the sample, the porewater pressure was held constant and no hydraulic gradient was applied to the sample. The position of the syringe pumps was determined by an optically encoded disc with increments equivalent to a volume change of 16.63 nL. Both were controlled by a single digital control unit connected to a microprocessor within the pump piston that could monitor and adjust the rate of rotation of the encoded disc using a geared worm drive and a DC motor connected to the piston assembly. As such, the pumps could run in either continuous flow or constant pressure modes. The testing procedure was designed to minimise possible pump errors, because although the volumetric control system for each pump was factory calibrated, laboratory calibration of the volumetric data was not practical with the available equipment. FieldPoint™ and cRIO logging hardware combined with the LabVIEW™ data acquisition software (National Instruments Corporation, Austin, TX, USA) were used to record the total stress, pore pressures and pump flow rates at intervals of 2 min, providing detailed time series information. The total testing duration was 101.7 days, which was long enough to ensure that the swelling response of the clay was observed [47,48].
Once the swelling response had reached an asymptote, the test was terminated and the sample was carefully and incrementally removed from the vessel using a hydraulic jack. As the sample was removed from the vessel, it was sliced into ∼10 mm thick slices using a sharp blade; 11 slices were obtained. Each of these 11 slices was then cut in half along its horizontal midplane to provide a top half (pieces A to K) and bottom half (pieces AA to KK) that could be separately analysed to quantify differences in the post-test sample that might be attributable to gravitational effects. Slicing the sample in this manner also allowed the moisture content of the sample to be quantified at intervals along the final sample length. The slices were weighed immediately after removal and were then dried in an oven at 105 C for 48 h to provide the moisture content information.
After drying, two half slices of the final sample were taken for detailed petrographic and microchemical characterisation by scanning electron microscopy (SEM) (piece AA from slice 1 and piece BB from slice 2). These slices were taken from the end of the sample that was originally sited next to the internal void space. High-resolution secondary electron (SE) images were recorded using an FEI Quanta 600 environmental scanning electron microscope (ESEM). This was equipped with an Oxford Instruments INCA Energy 450 energy-dispersive X-ray microanalysis (EDXA) system, with a 50 mm 2 Peltier-cooled silicon drift detector (SSD) calibrated using pure metal, metal oxide and mineral standards. EDXA spectra were processed and interpreted using the Oxford Energy INCA Suite software package (Version 4.15 Issue 18d + SP3, 2009), and used to provide microchemical characterisation and aid mineralogical identification during SEM observation. Freshly broken pieces (∼5–10 mm in size) were taken from each sample slice, representing slice surfaces and a cross-section surface, and mounted onto 10 mm diameter aluminium SEM stubs using Leit-C conductive carbon cement. To limit further drying and damage to the microfabric during sample preparation and SEM observation, the uncoated sample surfaces were examined directly in the ESEM instrument under a water vapour atmosphere of 130 Pa (variable pressure mode). SE images were recorded using the bespoke FEI large field secondary electron detector, using electron beam accelerating voltages of 10–20 kV and beam probe currents of 0.25–1.25 nA, at a working distance of 10 mm.
In addition, half of each sample slice was hand-crushed in a pestle and mortar and half of the crushate was ball-milled to a fine powder for whole-rock X-ray diffraction (XRD) and 2-ethoxyethanol (EGME) surface area analyses. The same set of tests was also run on a sample of MX80 bentonite that had experienced the same experimental history (the Test 4 sample from Harrington et al. [47]), to provide a reference for comparison with the Bulgarian Ca bentonite. To provide a finer and uniform particle-size for powder XRD analysis, a 2.7 g portion of each sample was micronised under acetone for 10 min with 10% (0.3 g) corundum (American Elements—PN:AL-OY-03-P). The addition of an internal standard allowed the validation and quantification of the results and also the detection of any amorphous species present in the samples. Corundum was selected because its principal XRD peaks are suitably remote from those produced by most of the phases present in the samples. The micronised samples were then dried at 55 C, disaggregated and back-loaded into standard stainless steel sample holders for analysis. To separate a fine fraction for clay mineral XRD analysis, portions of the crushed samples were dispersed in distilled water using a reciprocal shaker combined with ultrasound treatment. The suspensions were then sieved on 63 μ m and the <63 μ m material placed in a measuring cylinder and allowed to stand. No deflocculant was added to ensure preservation of the interlayer cation chemistry of the samples. After a time period determined from Stokes’ Law, a nominal <2 μ m fraction was removed and dried at 55 C. Approximately 100 mg of the <2 μ m material was then re-suspended in a minimum of distilled water and pipetted onto a ceramic tile in a vacuum apparatus to produce an oriented mount, and allowed to air-dry overnight.
XRD analysis was carried out using a PANalytical X’Pert Pro series diffractometer equipped with a cobalt-target tube, X’Celerator detector and operated at 45 kV and 40 mA. The micronised powder samples were scanned from 4.5–85 2 θ at 2.06 2 θ /minute. Diffraction data were initially analysed using PANalytical X’Pert HighScore Plus version 4.9 software coupled to the latest version of the International Centre for Diffraction Data (ICDD) database. Following identification of the mineral species present in the samples, mineral quantification was achieved using the Rietveld refinement technique (e.g., [53]) using SiroQuant v4 software. This method avoids the need to produce synthetic mixtures and involves the least squares fitting of measured to calculated XRD profiles using a crystal structure databank. Errors for the quoted mineral concentrations calculated from synthetic mixtures of minerals, are better than ±1% for concentrations >50 wt.%, ±5% for concentrations between 50 and 20 wt.% and ±10% for concentrations <10 wt.% [54]. Where a phase was detected but its concentration was indicated to be below 0.5%, it was assigned a value of <0.5%, since the error associated with quantification at such low levels becomes too large. The <2 μ m oriented mounts were scanned from 2–40 2 θ at 1.02 2 θ /minute after air-drying, after glycol-solvation and after heating to 550 C for 2 h. Total surface area determinations were carried out using the 2-ethoxyethanol (ethylene glycol monoethyl ether, EGME) adsorption method [55]. Briefly, the method is based on the formation of a monolayer of EGME molecules on the clay surface under vacuum. Errors for the surface area values are ±3%. The Bulgarian Ca bentonite sample data were compared against the same set of analyses conducted on the sliced sample of MX80 bentonite used in Test 4 presented in Harrington et al. [47]. This sample was analysed for comparison because it was manufactured to the same sample size and dry density, had undergone the same experimental procedure and was removed from the test vessel and dried in the same manner as the Bulgarian Ca bentonite sample.

3. Results

3.1. Development of Swelling and Pore Pressure

Over the duration of the test period, the test sample swelled from its original length (Table 1) to completely fill the internal dimensions of the test vessel (48.3% increase in size). The swelling pressure recorded over this period showed an evolving picture of material swelling occurring at different locations within the test vessel at different times during the test (Figure 1). The swelling pressure development was both spatially and temporally complicated, but there were patterns to the behaviour observed. At early times, a rapid rise in the swelling pressure was recorded on the axial A1 sensor, where the sample was originally sited at the start of the test (Figure 1A). The swelling pressure recorded by radial load cells R2 and R3 also quickly increased at the start of the test, both of which were sited next to the clay at the start of the test. Load cell R3 was located on the sample midplane (for precise sensor locations, please see Figure S1), and as such, although it was in contact with the sample, it was close to the starting internal void space. As soon as the test was started, the water was able to infiltrate into the sample from both ends. As a result that the radial R3 load cell on the vessel midplane was closer to the right-hand end of the sample than the radial R2 sensor was to the left-hand end, swelling pressures were seen on the R3 sensor before the R2 sensor (Figure 1B). However, because the clay then expanded rightwards (i.e., towards the R4 sensor) filling the internal void space, the maximum swelling pressure observed on sensor R3 was lower than the pressure seen on sensor R2. This is because the density of clay situated next to the R2 sensor remained higher for longer as the sample could not expand equally towards the left. Load cell R4 at the start of the test was located adjacent to the distilled water filling the internal void space. This was the same for the axial A5 load cell, which was located in the right hand end-closure of the test vessel. With time, as the sample started to swell to fill the internal fluid-filled void, the swelling pressure recorded by these last two sensors gradually increased, although the swelling pressures remained low (below 1 MPa) (Figure 1). By the end of the test, the swelling pressures measured by sensors A1, R2 and R3 had decreased to an approximate asymptote, whilst the swelling pressures measured by sensors R4 and A5 had increased to give values in a similar range. By the time the test was terminated at 101.7 days, a variance in the range of recorded swelling pressures from the different sensors still existed (∼600 kPa), although given how slowly they were evolving at this stage in the test, it is unclear how long it would have taken for the pressures to completely converge.
This pattern of sample expansion corresponding with the swelling pressure changes was consistent with the data recorded by the pore pressure transducers over the three arrays along the length of the test vessel (Figure 1). The pore pressure recorded by the 4 transducers (PT13-16) that were sited in line with the internal void immediately recorded the applied pore pressure of 4500 kPa. As the water percolated into the sample both from the voidage and the filter at the left-hand end of the sample, a pore pressure increase was seen. This occurred first on the transducers (PT5, PT10-12), which were on the midplane of the vessel. The pore pressure data showed that the water did not percolate into the sample in an even manner and did not arrive at each of the transducers in a given array at the same time. There was as much as 15 days difference in the arrival times, observed as a change in the recorded pore pressure (Figure 1). An overview of the swelling and pore pressure data is also available from Harrington et al. [47], where the swelling and pore pressure data from this test have been compared to tests conducted using a different composition of bentonite and in a vertical orientation.

3.2. Post-Test Moisture Contents

The moisture content of the post-test sample was determined at increments along its final length by slicing the sample across its long-axis into ∼10 mm pieces (slices 1–11). The slices were also divided into a top (pieces A to K) and bottom (pieces AA to KK) half to ascertain whether gravity altered the moisture content through the sample. Samples were weighed initially, then placed in an oven to dry at 105 for 48 h; the samples were then reweighed to calculate the moisture content (Figure 2). The moisture content changed along the length of the sample, with the lowest moisture contents recorded at the end of the sample furthest away from the starting internal void space. The moisture contents at the right hand end of the final sample were significantly higher (4–6 times larger). Here, the sample took in the distilled water filling the initial void space and expanded to fill the entire cavity. The moisture content data supported the pore pressure observations and showed that the distilled water did not penetrate evenly through the test sample (Figure 1C,D). That the moisture contents were different along the length of the sample at the end of the test also showed that the sample had not fully homogenised in the 102 days of testing.
Minor differences were observed between the moisture content of the top and bottom halves of the oven-dried slices (Figure 2A). These differences were most notable at the right-hand end of the sample, where the sample had the highest moisture contents. The measurement of moisture content made at the far right-hand end showed that the top half of the slice had a moisture content that was 150% of the moisture content of the bottom half. This provided some evidence of gravitational settling of clay particles at the right-hand end of the sample, presumably made possible by the high moisture contents and the lack of redistribution of water evenly through the sample during the test period. The dry density of each slice was calculated using the moisture content value, a specific gravity of 2.77 and a saturation of 1. The dry density profiles along the sample length for the two halves of each slice showed the same trend as the moisture contents (Figure 2B), and were calculated in the range 0.29–1.08 kg/m 3 . This indicated that, despite placing a small swelling pressure on the entire surface area of the interior of the vessel, the post-test sample was very pastelike and only semi-solid. Using an exponential fit to the moisture content data from each half of the sample, the continuous difference in moisture content and calculated dry density between the two halves along the length of the sample could be plotted (Figure 2, black dashed line). This clearly showed that the only significant difference in the moisture content and dry density between the two halves occurred at the extreme right-hand end of the sample.

3.3. Gel Formation

As well as having a much higher moisture content, the right-most slice of the post-test sample was interesting because it showed that a layer of extremely fine clay particles formed on the advancing face of the right-hand end of the sample. As the sample swelled sideways through the internal fluid-filled void space, this collection of much smaller clay particles formed a gel ∼5 mm thick at the very front of the sample (Figure 3). Whilst it is not possible to draw firm conclusions from a single test study, this gel formation appears to be a unique feature of using a Ca bentonite in this type of swelling test, as it has not been observed in any of the same tests using sodium bentonites [47,48]. Clearly, further work is required to establish the conditions required for its formation and understand why it has not been seen in the same type of test using MX80.

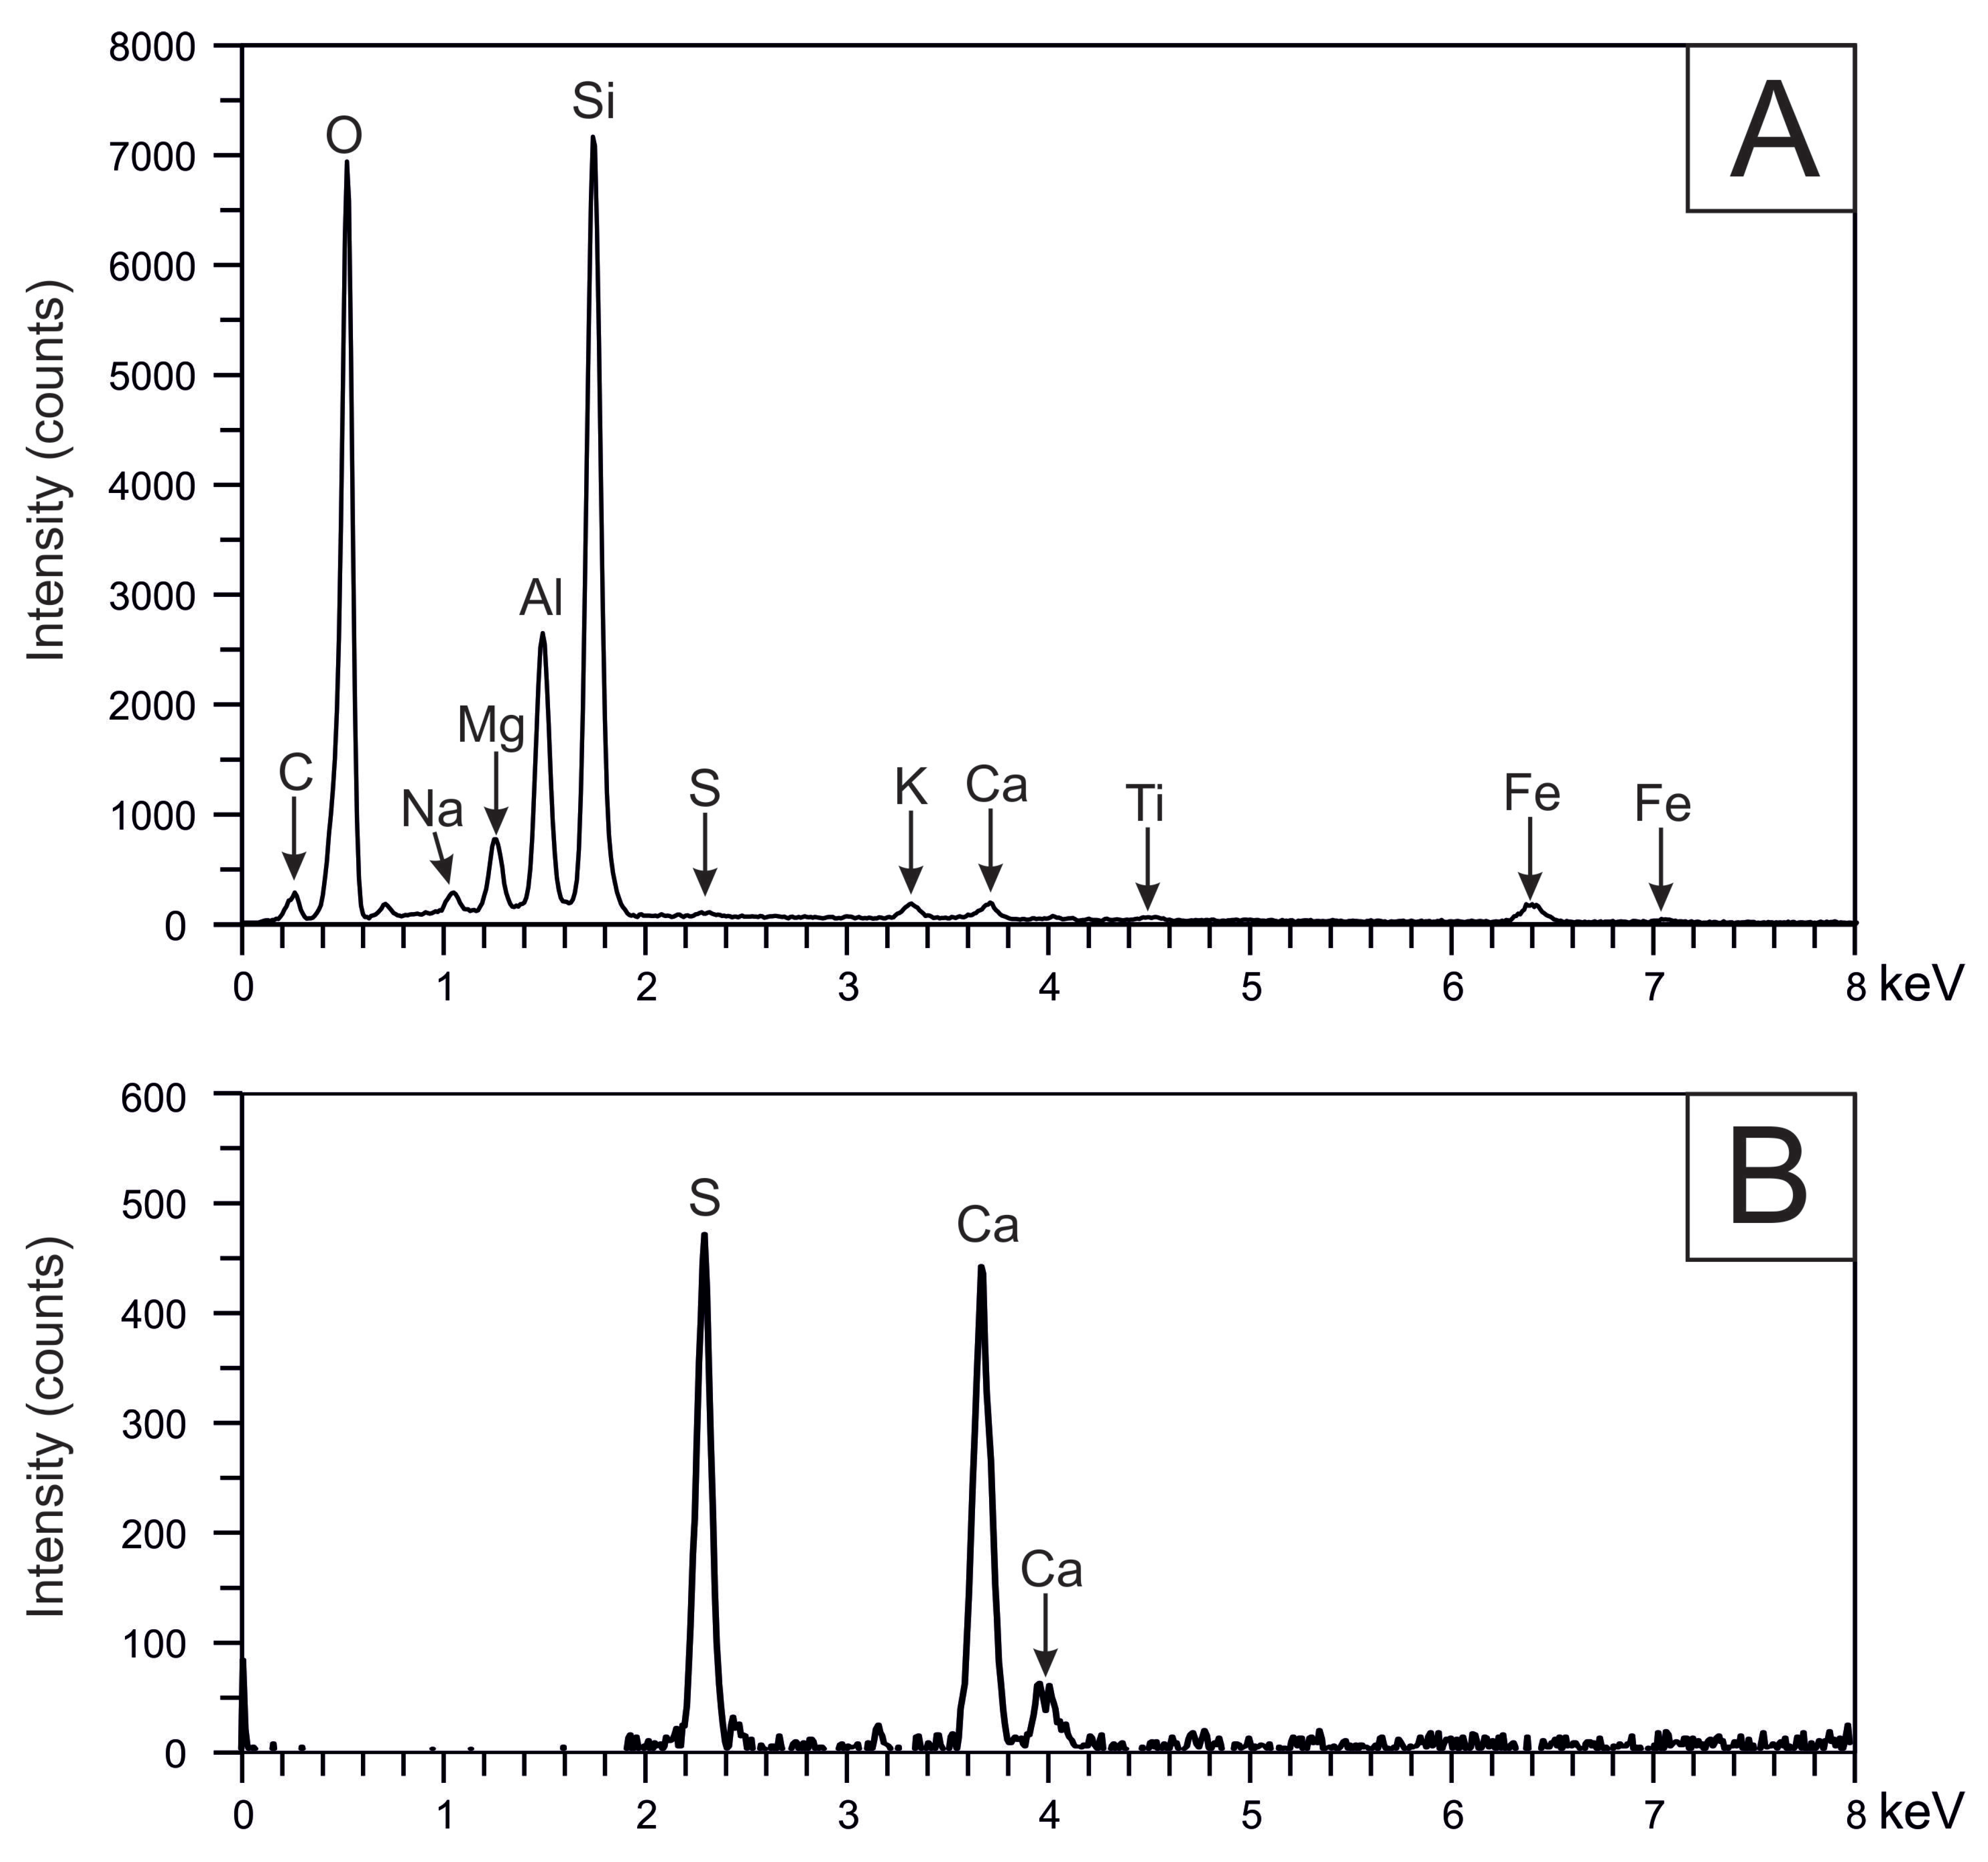
3.3.1. Petrographic and Microchemical Analysis

The dried post-test bentonite sample was imaged under an ESEM to provide a more detailed picture of the processes that had occurred at the front face of the swelling material. ESEM imaging was carried out on the bottom halves of the first two slices removed from the apparatus (Figure 4); this was the material closest to the right hand end of the vessel at the end of the test period. The bottom halves of two slices (AA the rightmost end of the sample, and BB the slice behind the rightmost piece) were chosen for imaging under ESEM because both of these slices had a slight paler discolouration of the bentonite within the bottom section of the slice. The discolouration was only evident in the first two slices and was more pronounced in the first slice (slice 1 piece AA) than the second (slice 2 piece BB). The slices had already been dried to provide post-test moisture content information before examining under the ESEM, so there were some initial differences between the two slices associated with the oven drying of the material (Figure 4). Slice 1 piece AA had a moisture content of nearly 200% compared to the ∼125% of slice 2 piece BB, which affected the amount of contraction of the sample as it dried. Visual inspection of the front face of slice 1 piece AA showed a smooth surface with very little cracking except for two large cracks in the bottom edge of the slice, making the surface appear as though it was covered by a skin (Figure 4). The rear side however showed deep cracks from top to bottom of the slice that had opened by up to 5 mm (Figure 4). Both sides of slice 1 piece AA showed that the material was extremely fine grained. The surface of both sides of slice 2 piece BB looked much more grainy with larger particles of the original clay matrix clearly visible on both sides of the slice (Figure 4). The cracking on the front face of slice 2 piece BB was more prevalent than slice 1 piece AA, but individually the cracks had opened a smaller amount than those evident on the rear of slice 1 piece AA.
Detailed SEM observations of the gel formed on the external end of slice 1 piece AA revealed that although the outer surface of the gel was smooth and featureless, fractured cross-sections through the gel displayed a very finely-laminated fabric (Figure 5A). The laminae were extremely thin (typically <10 μ m thick), and showed significant distortion, parting and spalling between the layers, as a result of shrinkage, caused by water-loss during drying. In addition, the gel laminae displayed a highly wrinkled skin texture (Figure 5B–D), again indicative of shrinkage due to loss of a significant volume of water consistent with the very high measured moisture content (described earlier). Although the gel displayed a wrinkled texture, the material was extremely fine grained and very uniform (Figure 5D); the bulk of the material was clearly nanoparticulate with a particle size well below the resolution of the SE imaging (i.e., much finer than 50 nm). In contrast, the compacted bentonite substrate surface immediately beneath the gel layer was notably much coarser, with clearly discernable close-packed grains of aggregate clasts of partially expanded bentonite, and minor quartz, feldspar, calcite and gypsum, within a clay-gel matrix (Figure 5E). These particles ranged in size from 5 to 200 μ m in diameter. Irregular sigmoidal shrinkage cracks were common around the grain boundaries. Similarly, the bentonite in slice 2 piece BB was much coarser than the gel layer on the outer surface of slice 1. However, whilst aggregate particles of bentonite and minor quartz, feldspar, gypsum and calcite could be discerned, they were less obvious than in the bentonite substrate immediately beneath the gel in slice 1 piece AA (Figure 5F). Grain boundary shrinkage cracks were also relatively uncommon in slice 2 piece BB compared to the bentonite substrate in slice 1 piece AA.
EDXA spectra recorded from the gel layer (slice 1) were consistent with that expected from a montmorillonite, comprising: major Si, Al, O and subordinate Mg, Na, Ca, Fe (Figure 6A). Traces of Ti and S were also detected in most analyses. Rare microcrystals (<2 μ m) and microcrystalline aggregates (up to 50 μ m) were occasionally observed within the gel under high magnification SE imaging (Figure 5B,C). EDXA spectra (processed to strip the background X-ray signal from the host gel) clearly identified this trace phase to be Ca-S-rich (Figure 6B), and it therefore most likely represented microcrystalline gypsum. It is unclear whether this gypsum nucleated within the gel phase during the experiment, or precipitated from the porewater solution during the post-experimental drying of the sample.
Although fully-quantitative EDXA was not possible, semi-quantitative estimates of the composition of the smectitic gel and clay matrix in the background bentonite were obtained from suitably orientated surfaces. EDXA analytical totals were very low for the gel (typically 20–30 wt.%) indicative of a very high degree of microporosity (void space) included within the electron probe volume of this material, and which was consistent with the very high water content determined from slice 1 piece AA. Higher and more variable analytical totals (25–80 wt.%) were obtained from the bentonite clay matrix but again were low due to the high water content and/or nanoporosity. Semi-quantitative EDXA data obtained from the gel and bentonite substrate from slice 1 piece AA, and the bentonite from slice 2 piece BB are summarised in Figure 7 and Figure 8, and more detailed background data are provided in Tables S1 and S2. The EDXA data processing assumes all Fe was present as Fe 3 + (the most common valence state in smectite), and O was calculated on the basis of the oxide stoichiometry (note: H 2 O and OH are not determined by EDXA). As a result of the very low and variable analytical totals, the analyses have been normalised to 100 wt.% to enable comparison of the data.
Figure 7 illustrates the chemical variation between the gel and the immediately underlying bentonite, presented as a triplot of the molar ratios of [Si]: [total Al, Fe, Mg, Ti]: [total N, K, Ca]. The data clearly showed that there was a difference between the composition of the gel formed on the external surface of slice 1 piece AA and the clay matrix of the background bentonite in slice 2 piece BB. The EDXA data for the gel clustered tightly with little variation, and lay close to a composition compatible with a dioctahedral smectite composition, suggesting that it corresponded to a virtually pure smectite gel. In contrast, the EDXA data from the background bentonite (slice 2 piece BB) and bentonite substrate (slice 1 piece AA) varied significantly, lying on a mixing line between the smectite composition and a much more silica-rich material. Published X-ray diffraction data [52] showed that the original bentonite contained a significant amount of amorphous or poorly crystalline silica minerals (including >6 wt.% cristobalite and tridymite). Together with the ESEM observations, the EDXA data in Figure 6 suggest the gel in slice 1 piece AA may have represented very fine smectite that has been physically mobilised and has migrated from the bentonite matrix exposed in the end surface of the core, leaving a more silica-rich residual matrix in the substrate beneath.
Figure 8 shows the variation in the composition of the gel (slice 1 piece AA) and background bentonite (slice 2 piece BB) determined by EDXA presented as a molar ratio plot of Ca:Na:K, which will be largely attributable to the interlayer cation component in the smectite. These data have been corrected to allow for any contribution of Ca from the potentially small amounts of CaSO 4 (gypsum) detected by EDXA (seen in the Supplementary Materials Tables S1 and S2). The analyses of the gel and clay matrix of the background bentonite (Figure 8) showed a large scatter of data points, with some degree of overlap. Overall, however, the data appeared to suggest that the smectite gel was lower in Ca and higher in Na/K than the smectite in the background bentonite. The precipitation of Ca as gypsum within the gel may have played a part in this by reducing the Ca:(Na,K) ratio in solution in the pore fluid within the gel.

3.3.2. Surface Area Determinations

The surface area analysis was conducted on slices 1–11 pieces A-K (top halves of the 11 slices) (Table 2). Pieces B-K had a mean surface area of 590 m 2 /g (Figure 9A). Slice 1 piece A had a relatively higher surface area of 629 m 2 /g. Slice 9 piece I had an anomalously low surface area of 530 m 2 /g. In isolation, this suggested that the smectite concentration in the gel (slice 1 piece A) was higher (by ∼5%) than in the rest of the Ca-bentonite. Pure smectite has a surface area of ∼800 m 2 /g. Unsurprisingly, therefore these samples with their high smectite content produced high surface areas in the range 530–704 m 2 /g. In the equivalent experiment using MX80 rather than Bulgarian Ca bentonite (Test 4 from [47]), slices 4–13 (the majority of the sample) had a mean surface area of 695 m 2 /g (Figure 9B). Slices 3 to 1 had sequentially lower surface areas of 663 m 2 /g, 659 m 2 /g and 631 m 2 /g, respectively. In isolation, this suggested that the smectite concentration in MX80 slices 1–3 were between ∼4–8% lower than in the rest of the MX80 slices.

3.3.3. <2 μ m and Whole-Rock XRD Analysis

Four of the Bulgarian Ca bentonite and MX80 slices were used for <2 μ m oriented-mount XRD analysis (Table 2, Figure 10). These were from the top halves of the post-test samples. The analyses suggest that the clay mineral assemblages of both the Bulgarian Ca bentonite and MX80 are principally composed of a smectite-group mineral, dioctahedral (on the basis of its d060 spacing from whole-rock analysis) and most likely to be a montmorillonite. Small quantities of illite were also detected in all of the Bulgarian Ca bentonite slices analysed. The d001 spacing provided an indication of the interlayer cation chemistry of the smectite mineral. In general terms, an air-dry d001 spacing of ∼14.5–15 Å would indicate a predominance of divalent (Ca/Mg) interlayer cations and a double layer of water molecules, while a ∼12.5 Å would indicate a predominance of monovalent (Na/K) interlayer cations and a single water layer. The air-dry d001 spacing for the montmorillonite in the Bulgarian Ca bentonite pieces B, F and K were in the range ∼14.5–15.4 Å, confirming a predominance of divalent interlayer cations (Ca/Mg). However, the significantly smaller d001 spacing measured for piece A of 13.3 Å would suggest an approximately equal mix of divalent (Ca/Mg) and monovalent (Na/K) interlayer cations. The air-dry d001 spacing for the montmorillonite in the MX80 bentonite was consistently 12.7 ± 0.2 Å suggesting an approximately uniform monovalent (Na, K) interlayer cation chemistry.
The width of XRD peaks (e.g., full width at half maximum height, FWHM) can be used to assess the crystallite size distribution of mineral species, with broader peaks indicating smaller crystallite sizes and sharper peaks indicating larger crystallite sizes. For the Bulgarian Ca bentonite, the mean FWHM of the smectite air-dry 001 peak was ∼2.23 2 θ but slice A had a broader FWHM of 2.95 2 θ . This suggested that the smectite in piece A had a smaller crystallite-size distribution compared to the general Bulgarian Ca bentonite. The MX80 slices showed a mean FWHM of ∼2.24 ± 0.1 2 θ for the smectite air-dry 001 peak which suggested a generally similar crystallite size distribution for all the subsamples. It should be noted that the measurements in the present study were sub-optimal since they were made on potentially mixed-interlayer cation smectite species, with no control on the ambient humidity.
Like the <2 μ m oriented-mount XRD analysis, whole-rock XRD analysis was carried out on 4 of the Bulgarian Ca bentonite and MX80 slices (Table 2). The analyses showed that both the Bulgarian Ca bentonite and MX80 test samples were essentially homogeneous, with no significant variation in smectite content along their length. For the Bulgarian Ca bentonite, there was a small increase in the amount of quartz observed in slice 1 piece A compared to the measured amounts throughout the remainder of the sample. In comparison, the MX80 sample showed a very slight decrease in the quartz content at the equivalent end of the test sample (slice 1). However, the compositional differences between the slices were small. In addition, whilst the EDXA analyses were conducted separately on the gel and the substrate as discrete entities beneath within slice 1 piece AA, the surface area and XRD measurements were made on the whole of slice 1 piece A together, and therefore represent the average values across the slice.

4. Discussion

The test results presented in this study show that the formation of a gel at the front of an expanding Ca bentonite can occur under the specific conditions of an ambient temperature, zero hydraulic gradient, large sample to void ratio and free access to water at the expanding bentonite face. In this study, the sample swelling took place slowly; the pore pressure data (Figure 1C,D) showed that the sample took at least 30 days to swell to fill the initial void space in the experimental set up. This was consistent with the swelling pressure data (Figure 1A); these data indicated that the peaks in swelling pressure that occurred on the axial and radial load cells sited next to the sample at the start of the test (Axial 1 and Radial 2), had dropped and asymptoted to constant values that were consistent with all of the sensors on the vessel, between days 30 and 45 of the test. At the end of the test period, the material had expanded to fully fill the initial void space, with a ∼5 mm thick very fine grained gel at the front end of the sample. Observations made by the ESEM showed that the gel that formed on the external surface of slice 1 (i.e., the very front of the expanding sample) was extremely fine grained (<50 nm) and uniform, with the particle size well below the resolution of the SEM instrument (Figure 5D). This is consistent with the high surface area value (629 m 2 /g) obtained for slice 1 piece A, which was significantly larger (∼7%) than the average background Bulgarian Ca bentonite. In isolation this suggests a higher smectite content; this is consistent with the ESEM-EDXA observations, which indicate the gel layer had a composition that was very close to the composition expected for a pure smectite (Figure 6). However, a higher surface area might also be the result of a finer overall particle size, which is consistent with the significantly broader d001 diffraction peak for smectite (FWHM = 2.95 2 θ in slice 1 piece A compared to FWHM = ∼2.23 2 θ in the background Bulgarian Ca bentonite) suggesting that gel smectite has a smaller crystallite size than the background bentonite. Both the increased surface area and the indication of a finer crystallite size concurs with the ESEM-EDXA observations that the gel is very fine grained and nanoparticulate, whereas the smectite in the substrate and background bentonite is much coarser grained and granular (slice 2 piece BB; Figure 5E,F). The ESEM-EDXA observations also showed that the bentonite substrate composition was much richer in silica (Figure 7), and demonstrated highly variable silica contents further away from the gel (slice 2 piece BB). Furthermore, the air-dried XRD d001 diffraction peak spacing difference between the gel and the smectite in the background bentonite suggests that the smectite in the gel has significantly more monovalent (Na/K) interlayer cations than the background bentonite, which is predominantly divalent (Ca/Mg) interlayer cations. This confirms the observations from EDXA that show that smectite in the gel and the residual substrate in slice 1 piece AA have significantly higher Na/K than that expected from previous characterisation of the Bulgarian Ca bentonites [52]. A finer sampling discrimination was conducted for the ESEM-EDXA, whereby discrimination was made in slice 1 piece A between the outer gel coating and the residual silica-rich substrate; these data further suggest that the outer gel is even more Na/K rich than the smectite remaining in the residual substrate. This is an interesting finding, which implies that there is a difference in the exchangeable cation component between the two parts of slice 1. The reason for this remains unclear but possibly the precipitation of Ca as gypsum within the gel may have played a part in this by reducing the Ca:(Na,K) ratio in solution in the pore fluid within the gel, and thereby enhancing the exchange of Na/K for Ca.
The presence of higher concentrations of monovalent Na and K cations in the gel is consistent with the results of Missana et al. [56] who found that colloid detachment was preferentially favoured by Na compared to Ca. It should be noted however, that the absolute quantities of Na and K measured here are low and close to the detection limits, indicating that there could be additional noise in these data. The Missana et al. [56] experiments suspended 1 g/L of a bulk material (fifteen different clays including the MX80, FEBEX and three Czech bentonites were used) in deionised water and centrifuged the suspension to obtain particle sizes <1 μ m. These colloids were dried and the particle quantities measured by gravimetry. The results showed that the Ca bentonites produced a significantly smaller colloid fraction compared to the Na bentonites (e.g., Ca-MX80 53 ± 7 ppm, Na-MX80 600 ± 50 ppm), and that whilst the Na and Na-Ca mixed clays showed a positive relationship between colloid formation and starting smectite content, the Ca clays colloid formation was invariant with smectite content [56]. The smectite content of the Ca bentonite used in this study and in the MX80 of the bentonites tested in the same way in previous studies [47,48] was very similar (∼83 wt.%), and below that of the MX80 tested by Missana et al. [56] (89 wt.%). The lower smectite contents of the materials tested in these studies (this study and [47,48]) are closer to the values measured for the Czech bentonite samples (e.g., Rokle-S65: 78 wt.% smectite), which produced a much smaller quantity of colloidal material (153 ± 19 ppm), possibly explaining why a gel was not observed in the tests using MX80 [47,48].
The formation of a gel is unusual and has not been previously observed in swelling tests of this type incorporating a large initial void space [47,48], although the tests presented in these studies were conducted using an MX80 bentonite rather than a Ca bentonite composition. Together, the ESEM and EDXA observations suggest that during hydration and expansion of the bentonite, very fine (nanoparticulate) smectite effectively migrated from the bentonite matrix towards the front of the expanding sample, forming a layer between the sample and the void space; here it formed an extremely hydrous gel. This flushing of the smectite minerals towards the front has acted as a mechanical sieve and purified the smectite into this layer. The loss of the smectite from the bentonite matrix left a more silica-rich residual substrate, which appeared to be less mobile. The ESEM and EDXA observations also indicated that the fine grained silica and other components in the bentonite that formed the substrate did not migrate during the bentonite expansion. However, the whole-rock (i.e., whole-sample) XRD results contradict the ESEM-EDXA and surface area results by indicating that there is slightly more quartz in slice 1 piece A than in the background Bulgarian Ca bentonite. One possible reconciliation may lie in the degree of the subsampling undertaken during analysis of slice 1 between the two approaches. In the ESEM-EDXA case, discrimination is drawn between the actual nanoparticulate gel and the substrate immediately beneath, on which the gel was observed to rest. The ESEM-EDXA analysed these separately, showing that the outer gel layer was chemically consistent with a nearly pure smectite, whereas in contrast, the immediately-underlying residual substrate was notably less smectitic and very silica-rich. The XRD analysis by contrast represents the whole of slice 1 piece A and does not discriminate between the two fabric layers within the slice (Figure 3); the apparent difference between the XRD and ESEM-EDXA results may simply arise from this.
When compacted bentonite is hydrated, it swells and expands into available void spaces. In the case of this experiment, the bentonite was able to expand into the water-filled void space in the test cell. The chemistry of the system has a significant effect on the swelling and dispersion behaviour; porewaters with low ionic strength and a low concentration of divalent cations (e.g., Ca 2 + ) promote peptisation (deflocculation) of smectite and encourage the separation of individual smectite layers, which can lead to spontaneous colloid formation [57,58,59]. This experiment used deionised water as the saturating fluid, and this would be expected to encourage deflocculation of the smectite during hydration and swelling. As no hydraulic gradient was applied during the experiment, diffusion must have been the driving force for any colloid release and migration (cf. Kallay et al. [60], as cited by Alonso et al. [51]) from the bentonite matrix to give rise to the formation of the gel at the end of the test sample. Previous studies [51,56] have shown that the nature of interlayer cation strongly influences the smectite colloid generation. The predominance of more hydrated ions in the interlayer cation site (such as Na + ) leads to the disaggregation of clay platelets and formation of smaller tactoids (liquid-crystal colloidal phase) with higher electrophoretic mobilities. In contrast, Ca 2 + is a more strongly binding cation producing a tighter, more compact smectite structure, which favours the formation of larger aggregates and lower colloid detachment and mobility. Interestingly, both the XRD analyses and the ESEM-EDXA observations of the gel formed from the bentonite during this experiment suggested that it was relatively Na/K-rich compared to the smectite in the background matrix of the bentonite. Although the reason for this apparent compositional difference is not clear, the extremely fine nanoparticulate (<50 nm) nature of this material is consistent with formation of a Na-rich colloidal smectite. Whilst the ESEM observations indicated that the nanoparticulate material imaged in slice 1 piece A was extremely fine-grained and uniform, because the resolution of the ESEM was 50 nm, it is not possible to discount both micro- and mesoporosity existing in the sample that could take up water in addition to the interlayer water.
There was very little change in the moisture content along the majority of the length of the sample (Figure 2A), except in the three slices (1, 2 and 3) that were from the end of the sample that had been adjacent to the void space at the start of the test. In these slices, especially slice 1 where the gel was located, the moisture contents were markedly higher; this corresponded with a very low dry density measurement for the sample in this same region (Figure 2B). It should also be noted that the moisture content measurement for slice 1 incorporated both the gel layer (approximately half the thickness of the slice) and the more silica-rich residual substrate underneath (Figure 3). The specific moisture content of the gel layer alone is not known. However, given the fine-grained nature of the gel and the large cracks and wrinkled texture of the material post-drying, it is likely that the moisture content of the gel layer alone would have been much higher; the residual substrate is likely to have had a moisture content closer to the value obtained for slice 2. The averaged moisture content of the gel and the residual substrate together are therefore likely to be lower than the moisture content of the gel alone. The liquid limit for Ca bentonites is reported to be lower than for Na bentonites, but within the range 150–600% (determined using the Casagrande method for a variety of commercial Ca bentonites) [61]. The measured moisture content for slice 1 was 307% indicating that the moisture content could have been much higher whilst the sample still demonstrated plastic behaviour.
As would be expected in a repository, the void space in the experiment was finite; it is not expected therefore that this mechanical separation of the smectite could continue indefinitely because, whilst it continues to contain smectite minerals, the matrix would also expand filling the void space and competing against the migration of the smectite to the expanding front of the material. In addition, the measured stresses (Figure 1A) reached an asymptote indicating that the gel layer was stable and further homogenisation or segregation would not occur mechanically. Whether chemical processes could lead to homogenisation or continued formation of the gel layer, it is not possible to say from the analysis presented. It is possible that previous studies using MX80 bentonite [47,48] have not seen this gel layer formation because the expansion of the matrix took place more quickly than it did in the Bulgarian Ca bentonite in this study. Figure 7 in Harrington et al. [47] suggests that the swelling pressures have asymptoted by approximately day 35 for the MX80 (Test 4) and day 40 for the Bulgarian Ca bentonite (Test 5), although the data are noisy and the other tests presented (in a vertical rather than horizontal orientation) show asymptotes in the stress data much later. The cumulative inflow of distilled water into the Bulgarian Ca bentonite however is much larger than in any of the MX80 tests presented by Harrington et al. [47]. Without the presence of a hydraulic gradient across the sample, this could be attributed to a lower starting saturation of the Bulgarian Ca bentonite compared to the MX80, although the saturations are reported as close to 100% and the dry densities all 1.7 g/cm 3 . For bentonites that contain a lower smectite content and where material expansion upon contact with water can be expected to take place more slowly, a larger gel layer may be able to form, subject to the smectite content also being high enough to supply the nanoparticulate material to migrate. A decrease of only 5 wt.% in the smectite content has been seen to substantially increase the hydraulic conductivity and decrease the swelling pressures of bentonites [52]. Previous XRD analysis of the Bulgarian Ca bentonite has found that it has a smectite (montmorillonite) content of 82.6 wt.% [52], whilst the MX80 Wyoming bentonite used in the swelling studies [47,48] has been analysed to contain 85.43% montmorillonite [62], which may in part explain the lack of gel formation seen in the tests using MX80 bentonite, due to the differences between these materials in terms of their swelling capacity.
This mechanism of gel formation has important implications for bentonites being used as barriers where the material has free access to flowing water, as might occur within fractures in the host rock. This gel formation shows that bentonite in contact with an open void containing water will expand and the fine grained and swelling smectite minerals may migrate towards the expanding face of the bentonite. If the water in the voidage is moving, the smecite leaving the silica matrix could erode and eventually all the smectite would be lost from the matrix. The high swelling capacity and low permeability of the smectite minerals provide the sealing ability of the bentonite as a barrier to flow, and thus the loss of the smectite content will severely impact the performance of the barrier. For how long this process may continue in the presence of flowing water cannot be predicted from the results presented here, however they may be showing a snapshot of the process that is initiating bentonite erosion in voidages. Bentonite erosion is considered to be one of the main processes leading to mass loss, which could deleteriously affect the ability of the bentonite to perform as a barrier [1,50,51]. It is also thought that the erosion of colloids (<1 μ m fluid-suspended clay particles) could provide a mechanism for radionuclide transport [63,64,65]. The data presented in this study seem to suggest that smectite particles can be chemically flushed through the bentonite matrix to form a gel with a particle size below 50 nm, and that this could occur with free access to water. It is important to note that the test was conducted using distilled water as the fluid in the void space and the test fluid. Distilled water is likely to have been more aggressive in terms of cation dissolution than a groundwater composition might have been expected to be on the test sample, and additional cations may have dissolved into the test fluid. Indeed, bentonite erosion is considered to be more likely to occur when non-saline groundwaters, and waters with a low ionic strength, interact with the bentonite barrier around the wasteform [58,66]. In addition, clay colloid dispersion is likely to be maximised by the use of a test fluid that does not contain any salts [56], suggesting that the test fluid will have exacerbated the formation of the gel layer. Regardless of the testing fluid, some exchange with the hydroxyl ions in the water that interacted with the bentonite would have been expected, and in situ, the extent would be dictated by the type of groundwater present. In the UK, where Ca bentonites are being considered for use as the engineered barrier for the geological disposal of high heat generating radioactive waste, there is a variety of different groundwaters that the engineered barrier might encounter. Groundwater chemistry is dependent on the reactions that have taken place between the groundwater and the host rock it is flowing through [67]. It is also controlled by the soils and unsaturated substrate that it passes through on the way to the saturated zone beneath. Thus, depending on the location and geology, the groundwater hardness and salinity will be different [67]. In addition, the depth of a repository and the proximity to the coastline will also control the groundwater chemistry present. The type of groundwater present and the composition of the bentonite chosen in radioactive waste repository designs will thus have an effect on the performance and behaviour of the barrier. Bentonite erosion is an important topic of research for the safety assessment of radioactive waste repositories. Previous work has investigated both experimentally (e.g., [58,59,66,68,69,70]) and numerically ( e.g., [71]) the expansion of a range of bentonites [51,72] into fractures filled with flowing groundwater. These studies have found that whilst accessory minerals may prevent the loss of material, bentonite barriers with high smectite concentrations are likely to erode given the expected fluid compositions and flowrates [58]. Whilst only one test has been undertaken here, the data suggest that a process of physical separation and mobilisation of smectite from the bentonite matrix occurs during hydration and expansion; further work using relevant fluid and bentonite compositions is required to elucidate the mechanisms behind these processes more clearly, as these results may have important implications for understanding the erosion of bentonite in contact with moving groundwater.

5. Conclusions

The results of this study have shown that a Ca bentonite in contact with a fluid-filled void space is able to form a gel layer at the expanding front, which comprises smectite particles with diameters <50 nm. This gel layer also has a significantly higher moisture content than the rest of the test sample. This is an unusual observation, and has not previously been observed in experimental tests of this type [47,48]. ESEM and EDXA analyses have shown that the gel layer itself is composed of pure smectite, whilst the residual substrate beneath the gel is enriched in silica. The surface area analysis supports the ESEM-EXDA data showing a higher surface area value for the slice containing the gel. The <2 μ m XRD analysis and EDXA data also both show an increase in monovalent Na and K cations in the slice containing the gel. The whole-rock XRD data do not show a change in the amount of smectite in slice 1 piece A, but this is likely due to the averaging of the slice 1 piece A data. Together the observations are supportive of a chemically driven flushing mechanism occurring towards the front of the bentonite sample during expansion, whereby the very fine grained smectite is carried through a silica matrix to be deposited in a layer at the front of the sample. This finding has important implications for the erosion of bentonite in radioactive waste repositories, where the bentonite barrier material between the cannister and the host rock encounters fractures filled with flowing groundwater. Under these circumstances, expansion of the bentonite into the fracture would occur and the fine grained smectite particles would be expected to be removed from the front of the expanding bentonite by the flowing groundwater. This process could gradually deplete the barrier of the smectite content, adversely affecting its performance by reducing the swelling capacity and increasing the permeability.

Supplementary Materials

The following are available online at https://www.mdpi.com/2075-163X/11/2/215/s1, Figure S1: Testing apparatus. Table S1: EDXA analyses (weight % element). Table S2: EDXA analyses (molar % ions).

Author Contributions

The individual contributions to this paper are as follows. Conceptualization and methodology, K.A.D. and J.F.H.; validation, K.A.D., J.F.H. and P.S.; investigation and formal analysis, K.A.D., J.F.H., A.E.M., S.J.K. and I.M.; resources, P.S.; data curation, K.A.D., J.F.H., S.J.K. and I.M.; writing—original draft preparation, K.A.D., J.F.H., A.E.M. and S.J.K.; writing—review and editing, all authors; visualization, K.A.D. and A.E.M.; supervision, J.F.H. and P.S.; project administration, J.F.H.; funding acquisition, J.F.H. and P.S. All authors have read and agreed to the published version of the manuscript.

Funding

This research was funded by the European Commission Bentonite Mechanical Evolution (BEACON) project, with grant number 745942. The APC was funded by Svensk Kärnbränslehantering AB.

Institutional Review Board Statement

Not applicable.

Informed Consent Statement

Not applicable.

Data Availability Statement

The data used in this study is available from the authors upon request.

Acknowledgments

The authors acknowledge SKB for the supply of the material used in this study. Simon Holyoake is thanked for his assistance with the instrumentation of the experimental apparatus. Humphrey Wallis and Wayne Leman are acknowledged for the design and manufacture of the experimental apparatus. The authors thank Andrew Wiseall of the British Geological Survey for his helpful reviews of an earlier version of this manuscript. This paper is published with the permission of the Director of the British Geological Survey, part of United Kingdom Research and Innovation (UKRI).

Conflicts of Interest

The authors declare no conflict of interest. The funders had no role in the design of the study; in the collection, analyses, or interpretation of data; in the writing of the manuscript, or in the decision to publish the results.

Sample Availability

The test sample used in this study was specifically manufactured for testing, and was destructively tested to obtain information about the post-test moisture content and for the SEM, EDXA, surface area and XRD analyses. However, the powder used for the sample manufacture is available from the authors upon request.

References

  1. Sellin, P.; Leupin, O.X. The use of clay as an engineered barrier in radioactive waste management—A review. Clays Clay Mineral. 2013, 61, 477–498. [Google Scholar] [CrossRef]
  2. Johansson, E.; Siren, T.; Kemppainen, K. Onkalo—Underground Rock Characterization Facility for In-Situ Testing for Nuclear Waste Disposal. In Proceedings of the 13th ISRM International Congress of Rock Mechanics, Montreal, QC, Canada, 10–13 May 2015. [Google Scholar]
  3. WIPP. Waste Isolation Pilot Plant; U.S. Department of Energy; 2019. Available online: https://wipp.energy.gov/wipp-site.asp (accessed on 15 February 2021).
  4. Andra. Référentiel des Matériaux d’un Stockage de Déchets à Haute Activité et à Vie Longue—Tome 4: Les Matériaux à Base D’argilites Excavées et Remaniées; Technical Report CRPASCM040015B; Agence nationale pour la gestion des déchets radioactifs (ANDRA): Châtenay-Malabry, France, 2005. [Google Scholar]
  5. Liu, L. Permeability and expansibility of sodium bentonite in dilute solutions. Colloids Surfaces A Physicochem. Eng. Asp. 2010, 358, 68–78. [Google Scholar] [CrossRef]
  6. Pusch, R. The Buffer and Backfill Handbook, Part 1: Definitions, Basic Relationships, and Laboratory Methods; Technical Report TR-02-20; Svensk Kärnbränslehantering AB (SKB): Stockholm, Sweden, 2002. [Google Scholar]
  7. Wersin, P.; Johnson, L.H.; McKinley, I.G. Performance of the bentonite barrier at temperatures beyond 100: A critical review. Phys. Chem. Earth 2007, 32, 780–788. [Google Scholar] [CrossRef]
  8. Gens, A.; Valleján, B.; Zandarín, M.T.; Sánchez, M. Homogenization in clay barriers and seals: Two case studies. J. Rock Mech. Geotech. Eng. 2013, 5, 191–199. [Google Scholar] [CrossRef] [Green Version]
  9. Deniau, I.; Devol-Brown, I.; Derenne, S.; Behar, F.; Largeau, C. Comparison of the bulk geochemical features and thermal reactivity of kerogens from Mol (Boom Clay), Bure (Callovo-Oxfordian argillite) and Tournemire (Toarcian shales) underground research laboratories. Sci. Total Environ. 2008, 389, 475–485. [Google Scholar] [CrossRef] [PubMed]
  10. Villar, M.V.; Lloret, A. Influence of dry density and water content on the swelling of a compacted bentonite. Appl. Clay Sci. 2008, 39, 38–49. [Google Scholar] [CrossRef]
  11. Zheng, L.; Rutqvist, J.; Birkholzer, J.T.; Liu, H.H. On the impact of temperatures up to 200 C in clay repositories with bentonite engineer barrier systems: A study with coupled thermal, hydrological, chemical, and mechanical modelling. Eng. Geol. 2015, 197, 278–295. [Google Scholar] [CrossRef] [Green Version]
  12. Daniels, K.A.; Harrington, J.F.; Zihms, S.G.; Wiseall, A.C. Bentonite Permeability at Elevated Temperature. Geosciences 2017, 7. [Google Scholar] [CrossRef] [Green Version]
  13. SKB. Final Storage of Spent Nuclear Fuel—KBS-3; Technical Report Art716-1; Svensk Kärnbränslehantering AB (SKB): Stockholm, Sweden, 1983. [Google Scholar]
  14. NAGRA. Project Gewahr 1985, Nuclear Waste Management in Switzerland: Feasibility Studies and Safety Analysis; Technical Report NAGRA-NTB-85-09; Nationale Genossenschaft für die Lagerung Radioaktiver Abfälle (NAGRA): Baden, Switzerland, 1985. [Google Scholar]
  15. Coulon, H.; Lajudie, A.; Debrabant, P.; Atabek, R.; Jordia, M.; Jehan, R. Choice of French clays as engineered barrier components for waste disposal. Sci. Basis Nucl. Waste Manag. 1987, 10, 813–824. [Google Scholar] [CrossRef]
  16. Linares, J. Spanish Research Activities in Thefield of Backfilling and Sealing: A Pre-Liminary Study of Some Spanish Sedimentary (Madrid Basin) and Hydrothermal (Almeria) Bentonite; Technical Report. In Proceedings of the NEA/CEC Workshop on Sealing of RadioactiveWaste Repositories, Paris, France, 9–19 June 1989. [Google Scholar]
  17. Vieno, T.; Hautojarvi, A.; Koskinen, L.; Nordman, H. TVO-92 Safety Analysis of Spent Fuel Disposal; Technical Report VTJ-92-33E; VTT Technical Research Centre of Finland: Espoo, Finland, 1992. [Google Scholar]
  18. Villar, M.V. Thermo-Hydro-Mechanical Characterisation of a Bentonite from Cabo de Gata: A Study Applied to the Use of Bentonite as Sealing Material in High Level Radioactive Waste Repositories; Technical Report 01/2002; ENRESA: Madrid, Spain, 2002. [Google Scholar]
  19. Villar, M.V.; Iglesias, R.J.; García-Siñeriz, J.L. State of the in situ Febex test (GTS, Switzerland) after 18 years: A heterogeneous bentonite barrier. Environ. Geotech. 2020, 7, 147–159. [Google Scholar] [CrossRef]
  20. Pusch, R. The Microstructure of MX-80 Clay with Respect to Its Bulk Physical Properties under Different Environmental Conditions; Technical Report TR-01-08; Svensk Kärnbränslehantering AB (SKB): Stockholm, Sweden, 2001. [Google Scholar]
  21. Tabak, A.; Afsin, B.; Caglar, B.; Koksal, E. Characterization and pillaring of a Turkish bentonite (Resadiye). J. Colloid Interface Sci. 2007, 313, 5–11. [Google Scholar] [CrossRef] [PubMed]
  22. Coulon, H. Proprietes Physico-Chimiques des Sediments Argileux Francais: Application au Stockage des Dechets Radioactifs. Ph.D. Thesis, University of Lille, Lille, France, 1987. [Google Scholar]
  23. Sun, H.; Mašín, D.; Boháč, J. Experimental characterization of retention properties and microstructure of the Czech bentonite B75. In Proceedings of the 19th International Conference on Soil Mechanics and Geotechnical Engineering, Seoul, Korea, 17–21 September 2017. [Google Scholar]
  24. Tessier, D.; Dardaine, M.; Beaumont, A.; Jaumet, A.M. Swelling pressure and microstructure of an activated swelling clay with temperature. Clay Miner. 1998, 33, 255–267. [Google Scholar] [CrossRef]
  25. Marcial, D.; Delage, P.; Cui, Y.J. On the high stress compression of bentonites. Can. Geotech. J. 2002, 39, 812–820. [Google Scholar] [CrossRef]
  26. Ben Rhaïem, H.; Pons, C.H.; Tessier, D. Factors Affecting the Microstructure of Smectites. Role of Cations and History of Applied Stresses; Technical Report; The Clay Mineral Society: Denver, CO, USA, 1987; pp. 292–297. [Google Scholar]
  27. Tessier, D. Etude Expérimentale de L’organisation des Matériaux Argileux. Ph.D. Thesis, Institut National de la Recherche Agronomique (INRA), Versailles, France, 1984. [Google Scholar]
  28. Chafe, N.P.; de Bruyn, J.R. Drag and relaxation in a bentonite clay suspension. J. Non Newton. Fluid Mech. 2005, 131, 44–52. [Google Scholar] [CrossRef]
  29. Whorlow, R.W. Rheological Techniques; Ellis Horwood: New York, NY, USA, 1992. [Google Scholar]
  30. Martin, P.L.; Barcala, J.M.; Huertas, F. Large-scale and long-term coupled thermo-hydro-mechanic experiments with bentonite: The febex mock-up test. J. Iber. Geol. 2006, 32, 259–282. [Google Scholar]
  31. Juvankoski, M. Description of Basic Design for Buffer; Posiva Technical Report 2009-131; Posiva: Eurajoki, Finland, 2010. [Google Scholar]
  32. Wang, Q.; Tang, A.M.; Cui, Y.J.; Delage, P.; Barnichon, J.D.; Ye, W.M. The effects of technological voids on the hydro-mechanical behaviour of compacted bentonite–sand mixture. Soils Found. 2013, 53, 232–245. [Google Scholar] [CrossRef]
  33. Komine, H. Simplified evaluation for swelling characteristics of bentonites. Eng. Geol. 2004, 71, 265–279. [Google Scholar] [CrossRef]
  34. Cuevas, J.; Villar, M.V.; Martın, M.; Cobena, J.; Leguey, S. Thermo-hydraulic gradients on bentonite: Distribution of soluble salts, microstructure and modification of the hydraulic and mechanical behaviour. Appl. Clay Sci. 2002, 22, 25–38. [Google Scholar] [CrossRef]
  35. Thomson, S.; Ali, P. A Laboratory Study of the Swelling Properties of Sodium and Calcium Modifications of Lake Edmon Clay. In Proceedings of the 2nd International Conference on Expansive Soils; Texas A and M University: College Station, TX, USA, 1969; pp. 256–262. [Google Scholar]
  36. Westsik, J.H.; Bray, L.A.; Hodges, F.N.; Wheelwright, E.J. Permeability, swelling and radionuclide retardation properties of candidate backfill materials. In Scientific Basis for Nuclear Waste Management IV, Symposium D; Cambridge University Press: Cambridge, UK, 1981; Volume 6, p. 329. [Google Scholar] [CrossRef]
  37. Börgesson, L.; Pusch, R. Rheological Properties of a Calcium Smectite; Technical Report TR-87-31; Svensk Kärnbränslehantering AB (SKB): Stockholm, Sweden, 1987. [Google Scholar]
  38. Börgesson, L.; Hokmark, H.; Karnland, O. Rheological Properties of a Sodium Smectite Clay; Technical Report TR-88-30; Svensk Kärnbränslehantering AB (SKB): Stockholm, Sweden, 1988. [Google Scholar]
  39. Gens, A.; Alonso, E. A framework for the behaviour of unsaturated clay. Can. Geotech. J. 1992, 29, 1013–1032. [Google Scholar] [CrossRef]
  40. Komine, H.; Ogata, N. Simplified evaluation for swelling characteristics of bentonites. Can. Geotech. J. 1994, 31, 478–490. [Google Scholar] [CrossRef]
  41. Delage, P.; Howat, M.D.; Cui, Y.J. The relationship between suction and swelling properties in a heavily compacted unsaturated clay. Eng. Geol. 1998, 50, 31–48. [Google Scholar] [CrossRef]
  42. Cui, Y.J.; Yahia-Aissa, M.; Delage, P. A model for the volume change behaviour of heavily compacted swelling clays. Eng. Geol. 2002, 64, 233–250. [Google Scholar] [CrossRef]
  43. Karnland, O.; Muurinen, A.; Karlsson, F. Bentonite Swelling Pressure in NaCl Solutions: Experimentally Determined Data and Model Calculations. In Advances in Understanding Engineered Clay Barriers, Proceedings of the International Symposium on Large Scale Field Tests in Granite, Sitges, Barcelona, Spain, 12–14 November 2003; Eduardo, E.A., Alberto, L., Eds.; CRC Press: Boca Raton, FL, USA, 2005. [Google Scholar]
  44. Xie, M.; Moog, H.C.; Kolditz, O. Geochemical Effects on Swelling Pressure of Highly Compacted Bentonite: Experiments and Model Analysis. In Theoretical and Numerical Unsaturated Soil Mechanics; Springer Proceedings in Physics 113 Series; Springer: Berlin/Heidelberg, Germany, 2007. [Google Scholar]
  45. Jönsson, B.; Kesson, T.; Jönsson, B.; Meehdi, S.; Janiak, J.; Wallenberg, R. Structure and Forces in Bentonite MX-80; Technical Report TR-09-06; Svensk Kärnbränslehantering AB (SKB): Stockholm, Sweden, 2009. [Google Scholar]
  46. Lee, J.O.; Lim, J.G.; Kang, I.M.; Kwon, S. Swelling pressures of compacted Ca-bentonite. Eng. Geol. 2012, 129–130, 20–26. [Google Scholar] [CrossRef]
  47. Harrington, J.F.; Daniels, K.A.; Wiseall, A.C.; Sellin, P. Bentonite homogenisation during the closure of repository voids. Int. J. Rock Mech. Min. Sci. 2020, 136, 104535. [Google Scholar] [CrossRef]
  48. Daniels, K.A.; Harrington, J.F.; Sellin, P.; Norris, S. Closing repository void spaces using bentonite: Does heat make a difference? Appl. Clay Sci. 2021. [Google Scholar]
  49. Tripathy, S.; Thomas, H.R.; Stratos, P. Response of Compacted Bentonites to Thermal and Thermo-Hydraulic Loadings at High Temperatures. Geosciences 2017, 7. [Google Scholar] [CrossRef] [Green Version]
  50. Missana, T.; Alonso, U.; Albarran, N.; Garcia-Gutierrez, M.; Cormenzana, J.L. Analysis of colloids erosion from the bentonite barrier of a high level radioactive waste repository and implications in safety assessment. Phys. Chem. Earth 2011, 36, 1607–1615. [Google Scholar] [CrossRef]
  51. Alonso, U.; Missana, T.; Fernandez, A.M.; Garcia-Gutierrez, M. Erosion behaviour of raw bentonites under compacted and confined conditions: Relevance of smectite content and clay/water interactions. Appl. Geochem. 2018, 94, 11–20. [Google Scholar] [CrossRef]
  52. Svensson, D.; Eriksson, P.; Johannesson, L.E.; Lundgren, C.; Bladström, T. Developing Strategies and Methods for Material Control of Bentonite for a High Level Radioactive Waste Repository; Technical Report TR-19-25; Svensk Kärnbränslehantering AB (SKB): Stockholm, Sweden, 2019. [Google Scholar]
  53. Snyder, R.L.; Bish, D.L. Quantitative analysis. In Modern Powder Diffraction, Reviews in Mineralogy; Bish, D.L., Post, J.E., Eds.; Mineralogical Society of America: Chantilly, VA, USA, 1989; Volume 20, Chapter 5; pp. 101–144. [Google Scholar]
  54. Kemp, S.; Smith, F.; Wagner, D.; Mounteney, I.; Bell, C.; Milne, C.; Gowing, C.; Pottas, T. An improved approach to characterise potash-bearing evaporite deposits, evidenced in North Yorkshire, U.K. Eng. Geol. 2016, 111, 719–742. [Google Scholar] [CrossRef] [Green Version]
  55. Carter, D.L.; Heilman, M.D.; Gonzalez, F.L. Ethylene glycol monoethyl ether for determining surface area of silicate minerals. Soil Sci. 1965, 100, 356–360. [Google Scholar] [CrossRef] [Green Version]
  56. Missana, T.; Alonso, U.; Fernandez, A.M.; García-Gutiérrez, M. Colloidal properties of different smectite clays: Significance for the bentonite barrier erosion and radionuclide transport in radioactive waste repositories. Appl. Geochem. 2018, 97, 157–166. [Google Scholar] [CrossRef]
  57. Sen, T.; Khilar, K. Review on subsurface colloids and colloid-associated contaminant transport in saturated porous media. Adv. Colloid Interface Sci. 2006, 119, 71–96. [Google Scholar] [CrossRef]
  58. Neretnieks, I.; Liu, L.; Moreno, L. Mechanisms and Models for Bentonite Erosion; Technical Report TR-09-35; Svensk Kärnbränslehantering AB (SKB): Stockholm, Sweden, 2009. [Google Scholar]
  59. Birgersson, M.; Hedström, M.; Karnland, O. Sol formation ability of Ca/Na-montmorillonite at low ionic strength. Phys. Chem. Earth 2011, 36, 1572–1579. [Google Scholar] [CrossRef]
  60. Kallay, N.; Barouch, E.; Matijević, E. Diffusional detachment of colloidal particles from solid/solution interfaces. Adv. Colloid Interface Sci. 1987, 27, 1–42. [Google Scholar] [CrossRef]
  61. Inglethorpe, S.D.J.; Morgan, D.J.; Highley, D.E.; Bloodworth, A.J. Industrial Minerals Laboratory Manual: Bentonite; Technical Report WG-93-20; British Geological Survey: Nottingham, UK, 1993. [Google Scholar]
  62. Svensson, D.; Lundgren, C.; Johannesson, L.E.; Norrfors, K. Developing Strategies for Acquisition and Control of Bentonite for a High Level Radioactive Waste Repository; Technical Report TR-16-14; Svensk Kärnbränslehantering AB (SKB): Stockholm, Sweden, 2017. [Google Scholar]
  63. Ryan, J.N.; Elimelech, M. Review: Colloid mobilization and transport in groundwater. Colloids Surf. A Physicochem. Eng. Asp. 1996, 107, 1–56. [Google Scholar] [CrossRef]
  64. Missana, T.; Alonso, U.; García-Gutiérrez, M.; Mingarro, M. Role of bentonite colloids on europium and plutonium migration in a granite fracture. Appl. Geochem. 2008, 23, 1484–1497. [Google Scholar] [CrossRef]
  65. Schaefer, T.; Huber, F.; Seher, H.; Missana, T.; Alonso, U.; Kumke, M.; Eidner, S.; Claret, F.; Enzmann, F. Nanoparticles and their influence on radionuclide mobility in deep geological formations. Appl. Geochem. 2012, 27, 390–403. [Google Scholar] [CrossRef]
  66. Baik, M.H.; Cho, W.J.; Hahn, P.S. Erosion of bentonite particles at the interface of a compacted bentonite and a fractured granite. Eng. Geol. 2007, 91, 229–239. [Google Scholar] [CrossRef]
  67. Edmunds, W.M.; Shand, P.; Hart, P.; Ward, R.S. The natural (baseline) quality of groundwater: A UK pilot study. Sci. Total Environ. 2003, 310, 25–35. [Google Scholar] [CrossRef] [Green Version]
  68. Kurosawa, S.; Kato, H.; Ueta, S.; Yokoyama, K.; Fujihara, H. Erosion Properties and Dispersion-Flocculation Behavior of Bentonite Particles; (Symposium QQ—Scientific Basis for Nuclear Waste Management XXII); Cambridge University Press: Cambridge, UK, 1999; Volume 556, p. 679. [Google Scholar] [CrossRef]
  69. Jansson, M. Bentonite Erosion Laboratory Studies; Technical Report TR-09-33; Svensk Kärnbränslehantering AB (SKB): Stockholm, Sweden, 2009. [Google Scholar]
  70. Albarran, N.; Degueldre, C.; Missana, T.; Alonso, U.; Garcia-Gutierrez, M.; Lopez, T. Size distribution analysis of colloid generated from compacted bentonite in low ionic strength aqueous solutions. Appl. Clay Sci. 2014, 95, 284–293. [Google Scholar] [CrossRef]
  71. Birgersson, M.; Börgesson, L.; Hedström, M.; Karnland, O.; Nilsson, U. Bentonite Erosion Final Report; Technical Report TR-09-34; Svensk Kärnbränslehantering AB (SKB): Stockholm, Sweden, 2009. [Google Scholar]
  72. Fernández, A.M.; Missana, T.; Alonso, U.; Rey, J.J.; Sánchez-Ledesma, D.M.; Melón, A.; Robredo, L.M. Characterisation of Different Bentonites in the Context of BELBAR Project (Bentonite Erosion: Effects on the Long Term Performance of the Engineered Barrier and Radionuclide Transport); Technical Report; CIEMAT: Madrid, Spain, 2017. [Google Scholar]
Figure 1. (A) Swelling pressures recorded on all sensors over the duration of the test, and (B) over the first 10 days. (C) Pore pressures recorded on all transducers over the duration of the test, and (D) over the first 45 days.
Minerals 11 00215 g001
Figure 2. (A) Moisture contents and (B) dry densities along the length of the post-test sample. The moisture content has increased and the dry density has decreased at all points along the length of the sample from the starting values.
Minerals 11 00215 g002
Figure 3. (A,B) The right-hand end of the sample being extruded from the test vessel. (C) Cross-section through the gel showing the top and bottom halves of the first sample slice.
Minerals 11 00215 g003
Figure 4. Front and rear views of the dried post-test sample slices 1 (piece AA) and 2 (piece BB) (bottom halves).
Minerals 11 00215 g004
Figure 5. Secondary electron (SE) images of the bottom half of the post-test sample (slice 1 piece AA and slice 2 piece BB). (A) Finely-laminated smectitic gel layer resting on bentonite substrate in slice 1 piece AA. Parting of the lamination is visible in the gel layer. (B) “Wrinkled skin” texture caused by drying and shrinkage of the smectitic gel from slice 1 piece AA. A lenticular aggregate of microcrystalline gypsum (arrowed) can be seen to nucleate within the gel. (C) SE image of the smectitic gel layer (slice 1 piece AA), showing higher-resolution detail of the “wrinkled skin” texture. Tiny microcrystals of gypsum (arrowed) can be seen within the gel (slice 1 piece AA). (D) Higher magnification SE image of the extremely fine and uniform nature of the gel on slice 1 piece AA, within which no discrete clay particles can be resolved under the SEM. (E) SE image illustrating the relatively coarse, granular fabric of the bentonite substrate immediately beneath the gel layer (slice 1 piece AA). Subrounded, partially-hydrated bentonite aggregate grains within a fine, smectite-rich clay matrix are clearly discernable. A discrete grain of gypsum (arrowed) is also shown. Fine, sigmoidal grain boundary microfractures are evident. (F) Typical compacted bentonite fabric from slice 2 piece BB, showing close-packed bentonite aggregate grains within tight clay matrix.
Minerals 11 00215 g005
Figure 6. (A) Typical energy-dispersive X-ray microanalysis (EDXA) spectrum of the hydrous gel formed on the external surface of slice 1 piece AA. (B) Residual processed EDXA spectrum (after subtraction of background from the host gel matrix), indicative of calcium sulphate, recorded from the microcrystalline secondary phase that nucleated within the hydrous gel on the external surface of slice 1 piece AA.
Minerals 11 00215 g006
Figure 7. Molar ratio triplot of [Si] : [total Al, Fe, Mg, Ti] : [total N, K, Ca] from EDXA, illustrating the compositional variations between the hydrous gel (field A) and gel substrate (field B) from slice 1 piece AA, and background bentonite matrix (field C) from slice 2 piece BB. ’Ideal’ montmorillonite stoichiometry is shown for comparison.
Minerals 11 00215 g007
Figure 8. Molar ratio triplot for Ca-Na-K from EDXA. The EDXA illustrates the compositional variations of the hydrous gel and gel substrate (slice 1 piece AA) and background bentonite matrix (slice 2 piece BB). Note: these data have been corrected to allow for the potential contribution of Ca from the presence of minor amounts of gypsum detected during EDXA.
Minerals 11 00215 g008
Figure 9. Surface area data for (A) the Bulgarian Ca bentonite and (B) the MX80 slices of the post-test samples. For both materials, the post-test samples were sliced into ∼10 mm slices, and each of these was subdivided into a top and bottom half. The top-half data are presented for both samples.
Minerals 11 00215 g009
Figure 10. (A) Whole-rock powder XRD traces for selected Ca-bentonite subsamples showing the similarity of the traces and the diagnostic dioctahedral smectite d060 peak spacing at 1.495 Å. The lower part of the figure shows the extracted peak positions and intensities (shown orange) compared to similar data for the identified International Centre for Diffraction Data (ICDD) mineral standards. (B) <2 μ m ethylene glycol-solvated oriented mount XRD traces for the same selected Ca-bentonite subsamples showing the very similar positions of the smectite peak positions (labelled with their appropriate 00l and d spacing in Å).
Minerals 11 00215 g010
Table 1. Sample geotechnical parameters. The sample pre-test dimensions were measured using digital calipers and can be considered accurate to the nearest 0.1 mm. The sample weight is accurate to the nearest 0.01 g.
CompositionSample Length (mm)Void Length (mm)Sample Diameter (mm)Sample Weight (g)Bulk Density (kg/m 3 )Moisture ContentFluid Pressure (kPa)Test Duration (Days)
Bulgarian Ca bentonite64.9751.0359.76368.322021.160.15254500101.7
Table 2. Surface area, <2 μ m oriented and whole-rock powder XRD data. Analyses have been carried out on the Bulgarian Ca bentonite sample as well as a comparable MX80 sample (Test 4) from Harrington et al. [47]. The piece of each slice used is given in brackets in column 2. ’Mica’ indicates undifferentiated mica species possibly including muscovite, biotite, illite, illite/smectite.
<2 μ m
SurfaceOriented XRDWhole-Rock Powder XRD
BentoniteSliceAread001 Smectite’Mica’QuartzCalciteCristo-Total
TypeNo.(m 2 /g)(Å)FWHM Balite
Ca1 (A)62913.282.9577.815.11.74.11.2100.0
2 (B)59814.502.3577.215.40.84.81.8100.0
3 (C)570
4 (D)591
5 (E)605
6 (F)59715.381.9877.414.7<0.55.81.7100.0
7 (G)609
8 (H)617
9 (I)530
10 (J)573
11 (K)60614.472.3677.915.0<0.55.01.7100.0
MX80163112.612.1377.017.24.01.5<0.5100.0
265912.622.2978.416.83.61.3<0.5100.0
3663
4700
5691
6690
768712.912.2677.715.84.81.2<0.5100.0
8689
9697
10704
11703
12704
1368212.872.2777.416.54.51.10.5100.0
Publisher’s Note: MDPI stays neutral with regard to jurisdictional claims in published maps and institutional affiliations.

