Article

Raman and Photoluminescence Mapping of Gem Materials

Gemological Institute of America, Carlsbad, CA 92008, USA
*
Author to whom correspondence should be addressed.
Minerals 2021, 11(2), 177; https://doi.org/10.3390/min11020177
Submission received: 12 January 2021 / Revised: 28 January 2021 / Accepted: 1 February 2021 / Published: 8 February 2021
(This article belongs to the Special Issue Gemstone Analysis by Spectroscopy and Microscopy)

Abstract

:
Raman and photoluminescence (PL) mapping is a non-destructive method which allows gemologists and scientists to evaluate the spatial distributions of defects within a gem; it can also provide a method to quickly distinguish different species within a composite gem. This article provides a summary of this relatively new technology and its instrumentation. Additionally, we provide a compilation of new data for various applications on several gemstones. Spatial differences within diamonds can be explored using PL mapping, such as radiation stains observed on the rough surface of natural green diamonds. Raman mapping has proven useful in distinguishing between omphacite and jadeite within a composite of these two minerals, identifying various tourmaline species within a heterogeneous mixture, and determining the calcium carbonate polymorphs in pearls. Additionally, it has potential to be useful for country-of-origin determination in blue sapphires and micro-inclusion analysis. As new avenues of research are explored, more applications for gem materials will inevitably be discovered.

1. Introduction

Gemological laboratories rely on non-destructive analytical techniques that are generally based on optical methods such as absorption spectroscopy along with Raman and photoluminescence (PL) spectroscopy. PL and Raman spectroscopy, as used for gemstones, is a microscope-assisted analytical technique in which a material is illuminated with laser light and the resulting emission is measured with a high-resolution spectrometer.
PL spectroscopy has become an indispensable tool used by major gemological laboratories to distinguish treated and lab-grown diamonds from their natural counterparts [1,2]. Within diamond, the presence, and thus the detection, of various defects differs with its growth history along with any subsequent treatment. PL spectroscopy can detect these features even at concentrations lower than 10 ppb [3]. Raman spectroscopy has proven vital for a host of other gemstones as well to aid in their identification [4,5,6,7].
Raman and PL mapping is a logical extension of these methods in which spectra can be collected quickly and automatically across an area instead of a single point (or the sample manually moved to collect multiple spectra across a sample). These mapping techniques have become possible in the past few years as the technology for the necessary instrumentation has improved. Therefore, Raman and PL mapping have become ideal methods to analyze the spatial differences in these diamonds and similar diamonds that are distinguished by distinct growth regions. This new instrumentation automatically collects hundreds to thousands of spectra across a sample and has provided several new, exciting research opportunities and identification avenues in recent years.
This article provides a brief account of investigations across a broad range of research and identification interests for a wide array of different gemstones. It offers an indication of the variety of research possibilities across the breadth of the gemological world.

2. Materials and Methods

Generally, Raman/PL mapping is used to show the distribution of the peak intensity associated with the concentration of an optical defect; however, other data such as peak position or peak width can be plotted instead, depending on the application. A Raman/PL mapping microscope can collect thousands of spectra in a raster pattern (Figure 1) and record a spectrum at each point. The collection area on the gem’s surface for each individual spectrum can be quite small (<1 µm2) or quite large (>1000 µm2) if needed to accommodate time constraints or a very weak emission signal. The spectral data (typically a user-specified peak selected from the spectrum) are then interpolated to produce a map of a defect’s distribution. With standard data collection, a single location (represented by the green circle) is chosen for data collection which generally serves as a proxy for an entire sample (although a researcher can collect from multiple spots on a sample to gauge the heterogeneity). With mapping spectroscopy, the data collection is automated such that data from the entire surface may be collected and stitched together, yielding a much greater and more complete image of the defects within the sample and generally offering thousands of collected spectra instead of a single spectrum.
Some of the considerations that we encountered during the process of data collection included balancing the collection time against data quality, mitigating the effects of internal reflections, and ensuring that the plane of data collection is properly leveled.
Most gemstones cannot be cooled to liquid nitrogen temperatures to optimize the results from PL spectroscopy. Diamonds are the exception as they have a low thermal expansion coefficient and extremely high thermal conductivity, so they can be cooled to low temperatures. Other gems, if cooled, have a much higher risk of fracture. For example, the coefficient of thermal expansion of corundum is five times greater [9] and the thermal conductivity is at least 65 times lower than diamond [10].
Therefore, since diamonds can be cooled, PL maps are typically conducted with the stone immersed in liquid nitrogen (−196 °C), although using a cryostat is also a possibility. PL peaks of various defects in diamond tend to be sharper, and thus appear more intense, at liquid nitrogen temperatures [11,12]. With our current experimental setup, the possible time window before nitrogen boil-off is limited to around 10 min, which is achieved by choosing an exposure time, collection area, and pixel size such that the collection is within that time frame. For Raman and PL spectroscopy conducted for other gemstones at room temperature, there are generally not the same time constraints and, if feasible, maps can be collected over many hours.
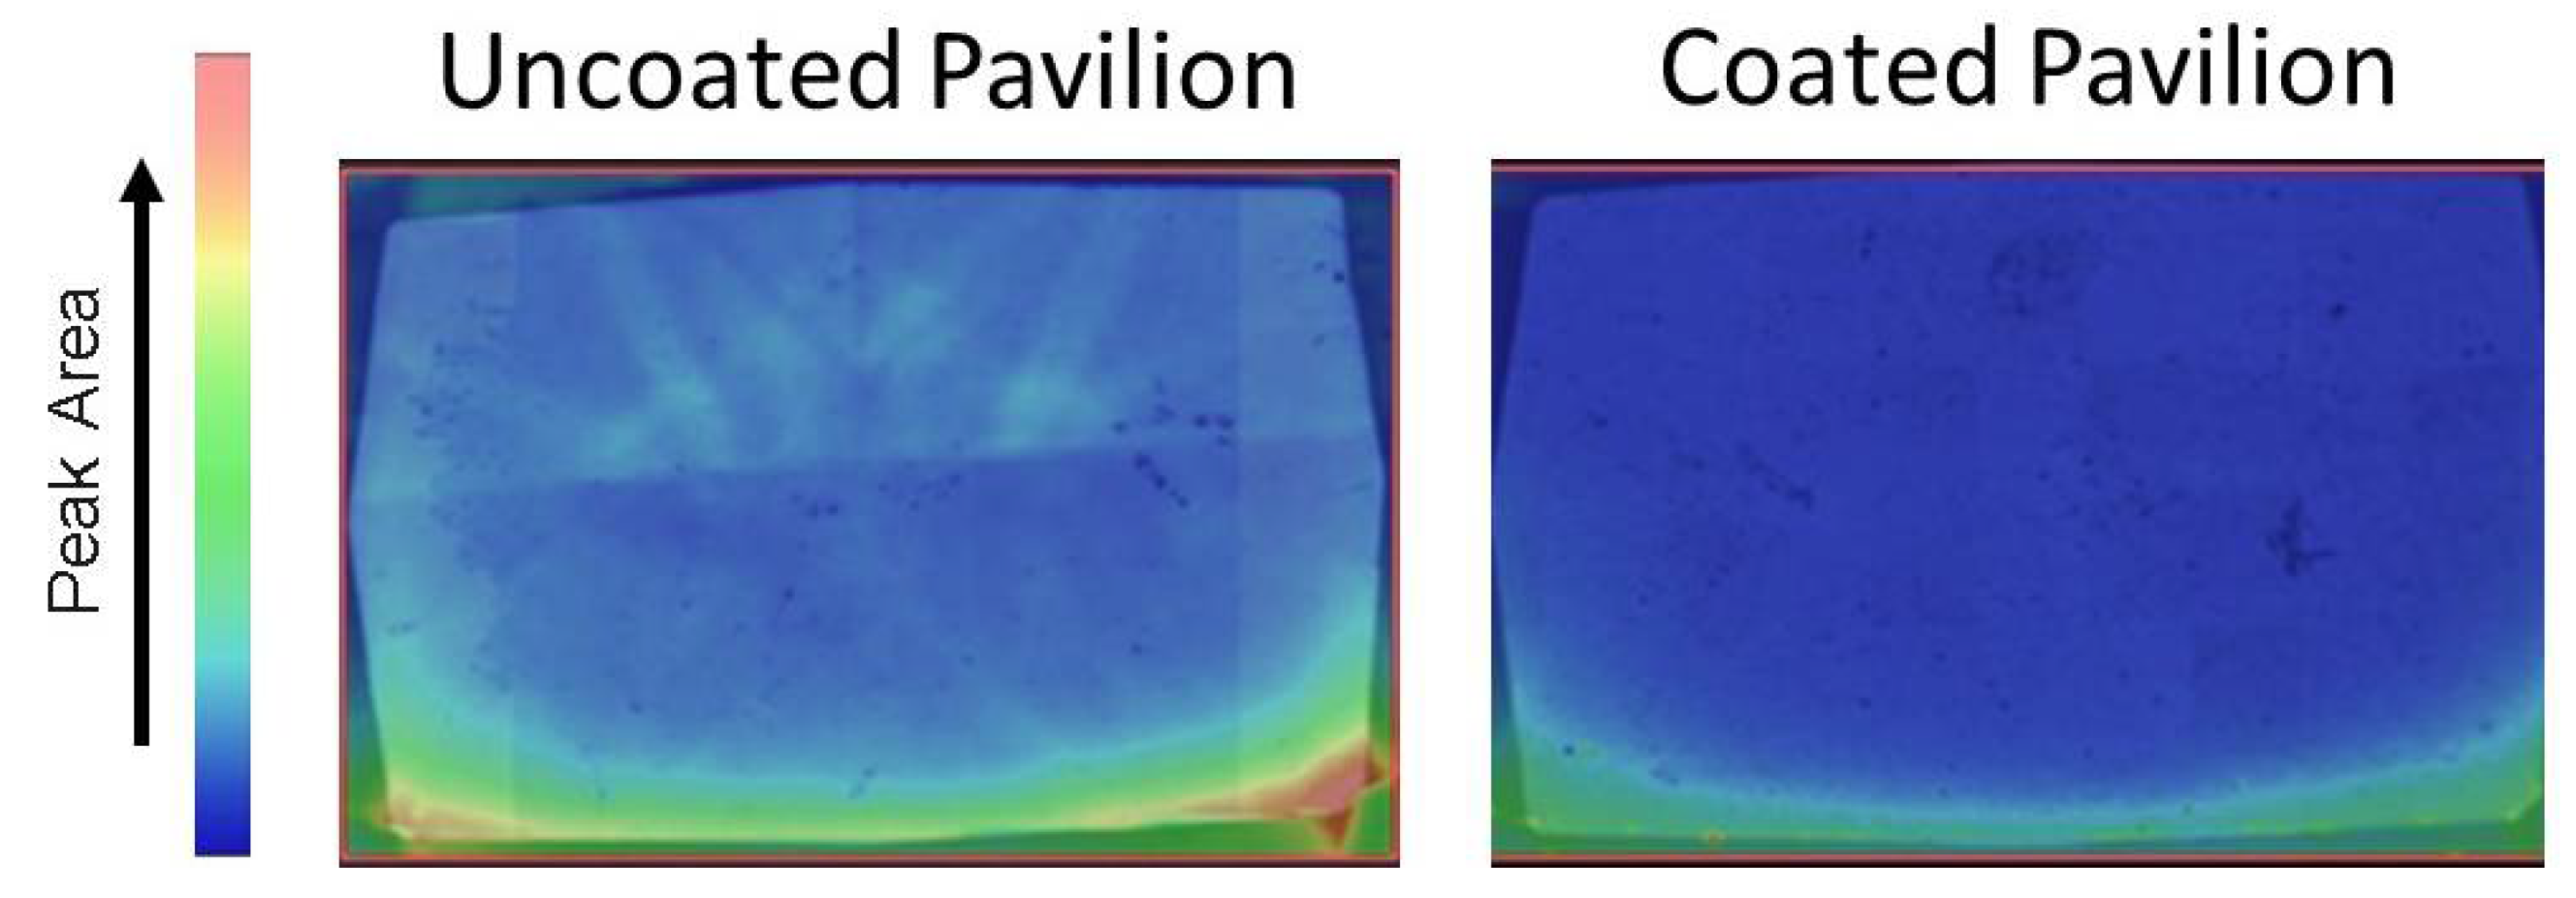
Additionally, better results are obtained for diamond samples if, prior to mapping, a temporary coating of Pelco colloidal graphite is painted onto the bottom side of the sample. This coating can reduce the amount of light reflecting off other facets and returning to the table (Figure 2). This coating is easily removed after testing with ethanol. This step is generally not used with other gemstones.
While some researchers prefer to collect PL/Raman mapping data from flat plate samples only, this article relates data for several gemological applications and research studies that were obtained from faceted or rough samples. All the mapping studies discussed here and used in prior studies at the Gemological Institute of America (GIA) (e.g., [8,13,14,15]) were performed using a Thermo Scientific DXRxi Raman imaging microscope (Madison, WI, USA) with 455, 532, 633, and 780 nm laser excitation wavelengths. The DXRxi has an Olympus optical microscope and an Andor Technology Newton 970 electron-multiplying charge-coupled device (EMCCD). An Olympus (either 10×; NA = 0.25 or 20×; NA = 0.40) objective lens was used. The DXRxi uses a continuously moving, variable speed sample stage driven by linear magnetic motors.
The stage movement is synchronized with the EMCCD detector so that the repeatability of spectra collection at the intended location positions is within 100 nm [8]. The data were processed using Thermo Scientific’s OMNICxi analysis software package, and baseline-corrected peak area profiles were used to produce the observed PL maps. The spectral data can also be exported to external software. The user is able to define whether the data are collected in confocal or standard mode, along with the pixel size (size along one edge of the collection area square), number of scans, collection time per spectrum (typically << 1 s), and the specific collection area (typically after a visual image of the sample has been collected by the instrument).
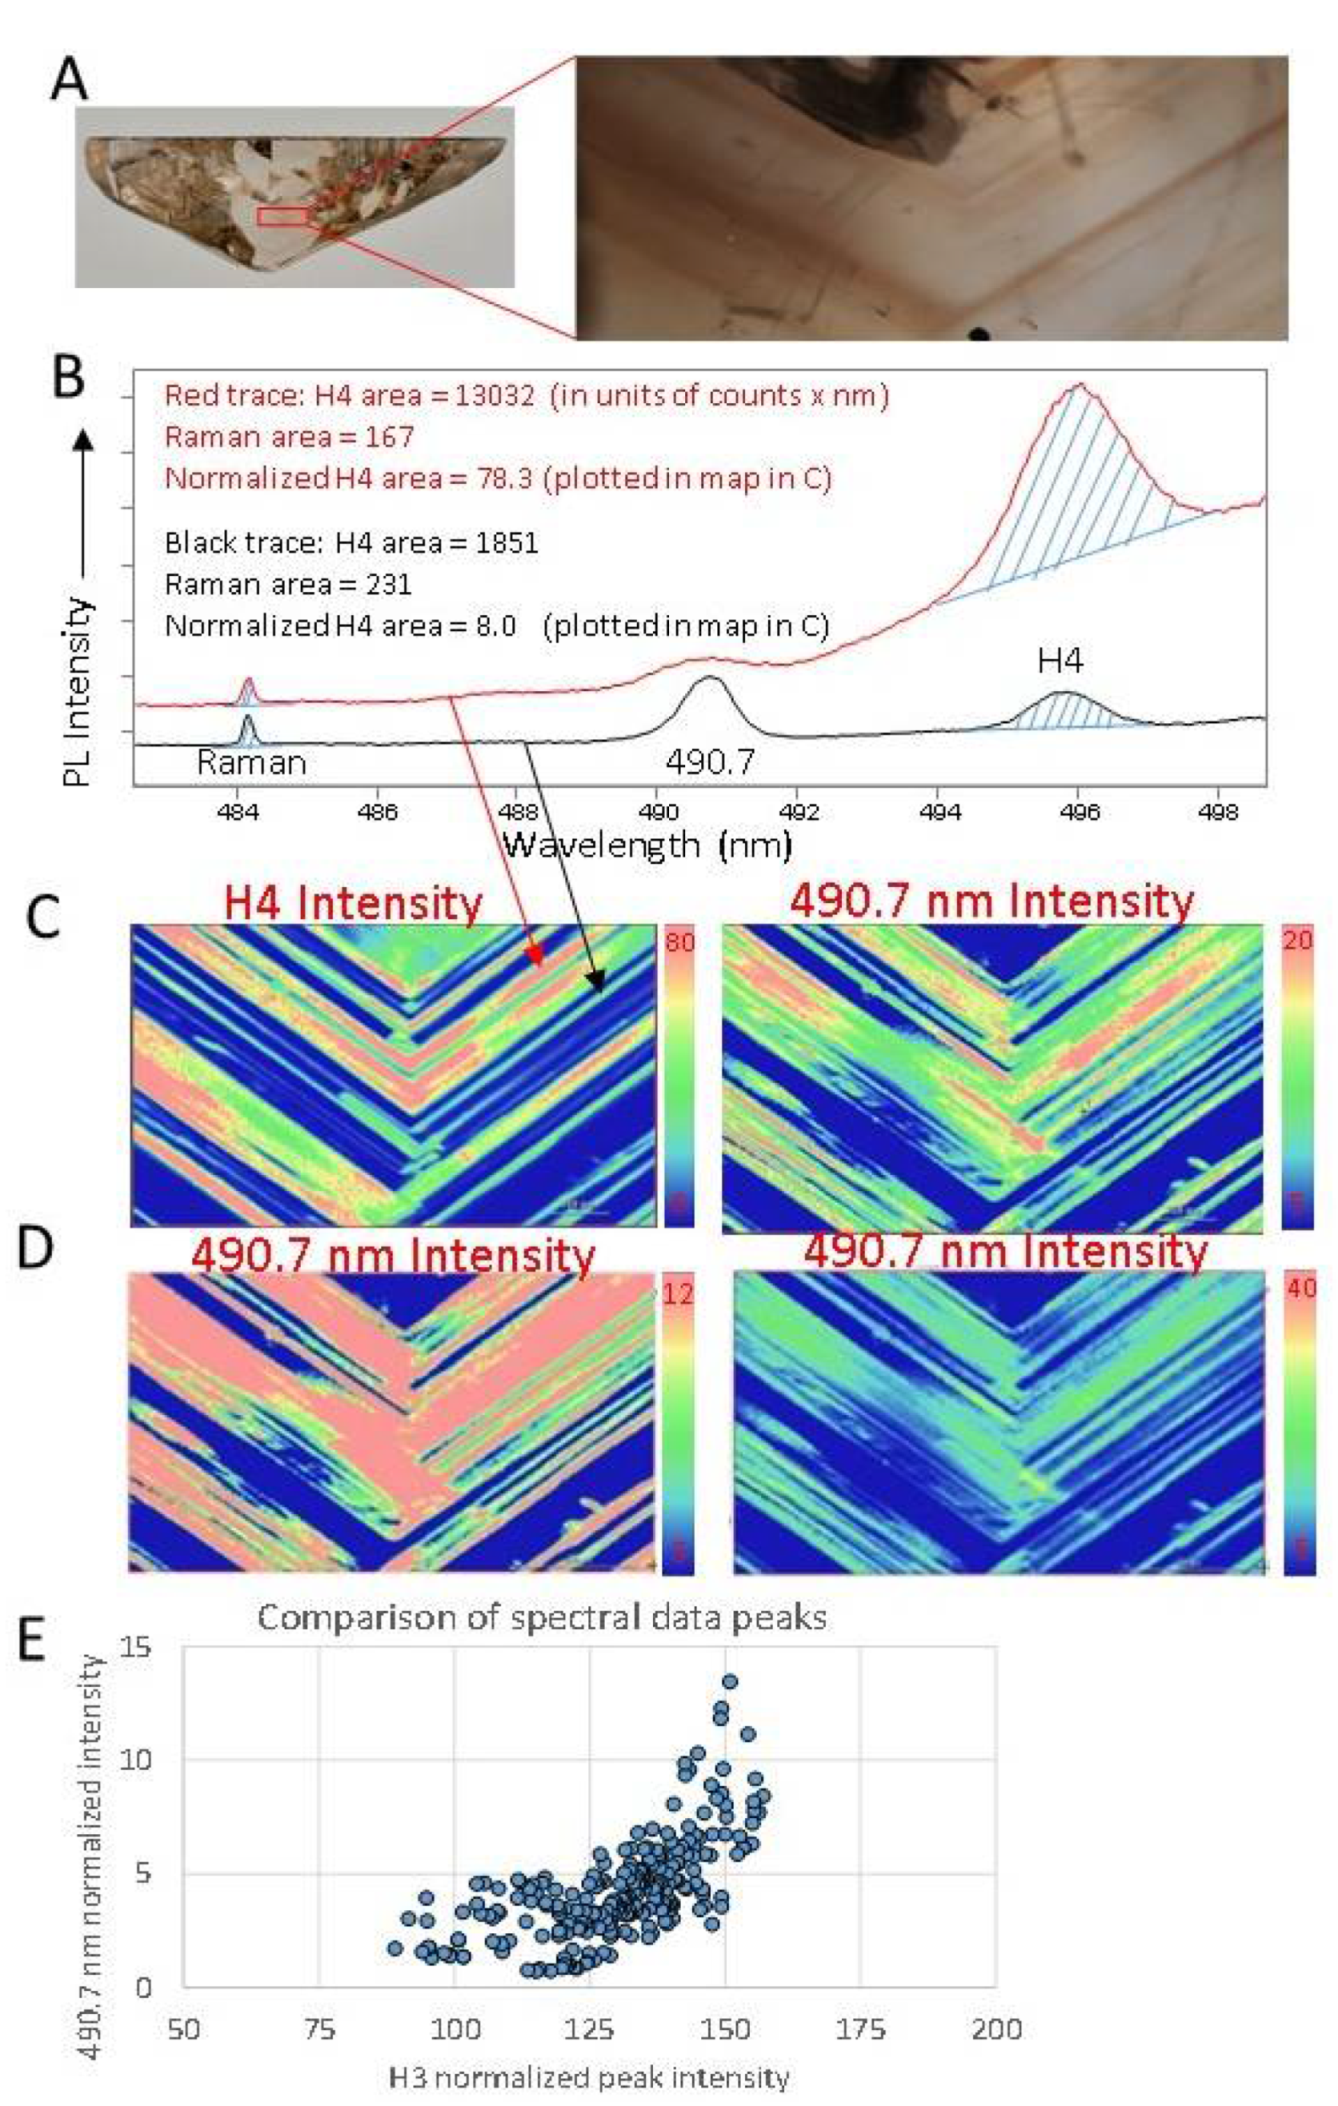
The collection of thousands of spectra requires the researcher to be able to process the data in a meaningful way for interpretation. The collected data are often visualized using false color maps of specific peaks or spectral features. As means of illustration, a full complement of data is shown for a diamond with pronounced brown graining (Figure 3A). This diamond was immersed in liquid nitrogen and PL maps, each with thousands of spectra (Figure 3B), were collected with all available lasers. False color maps could be generated for each of the detected defects (e.g., Figure 3C). A few features detected within the spectra are plotted here, such as normalized peak area intensity of the H4 defect [N4V2]0 at 495.9 and at 490.7 nm—an uncharacterized feature often seen in natural diamonds [16], particularly in brown type Ia diamonds, where it often occurs in conjunction with H4 [17]. As standard practice with diamond samples, the calculated area of the peak area is ratioed to the peak area of the diamond Raman peak, providing an internal normalization of the peak areas. Therefore, care is taken to ensure that these peaks are unsaturated across the collection area; see Figure 3B. Also seen is the full width at half-maximum—the peak width of the H3 defect [NVN]0 at 503.2 nm illustrating that several types of spectral features can be chronicled and evaluated. The data can also be exported to other software for additional analysis of the possible interrelationships between defects (Figure 3E).
Another important consideration is proper data presentation and taking care that the false color maps accurately represent the data. Depending on the limits chosen, the range of data can be perceived very differently by the reader (compare Figure 3C, right with Figure 3D). Additionally, the rainbow color palette is commonly used in many software programs (including the one accompanying the OMNICxi used in these studies), but it can be problematic as the information can be perceived quite differently if reproduced in gray-scale or observed by individuals with color vision deficiencies [18]. With that in mind, we have modified the color palette used in these Raman/PL maps to account for such issues facing false color maps.
With all the advances in instrumentation in recent years, Raman and PL maps can be created in a few minutes and create the ability to evaluate the distribution of defects and optical features in gemstones.

3. Distinction between Raman Shift and Photoluminescence

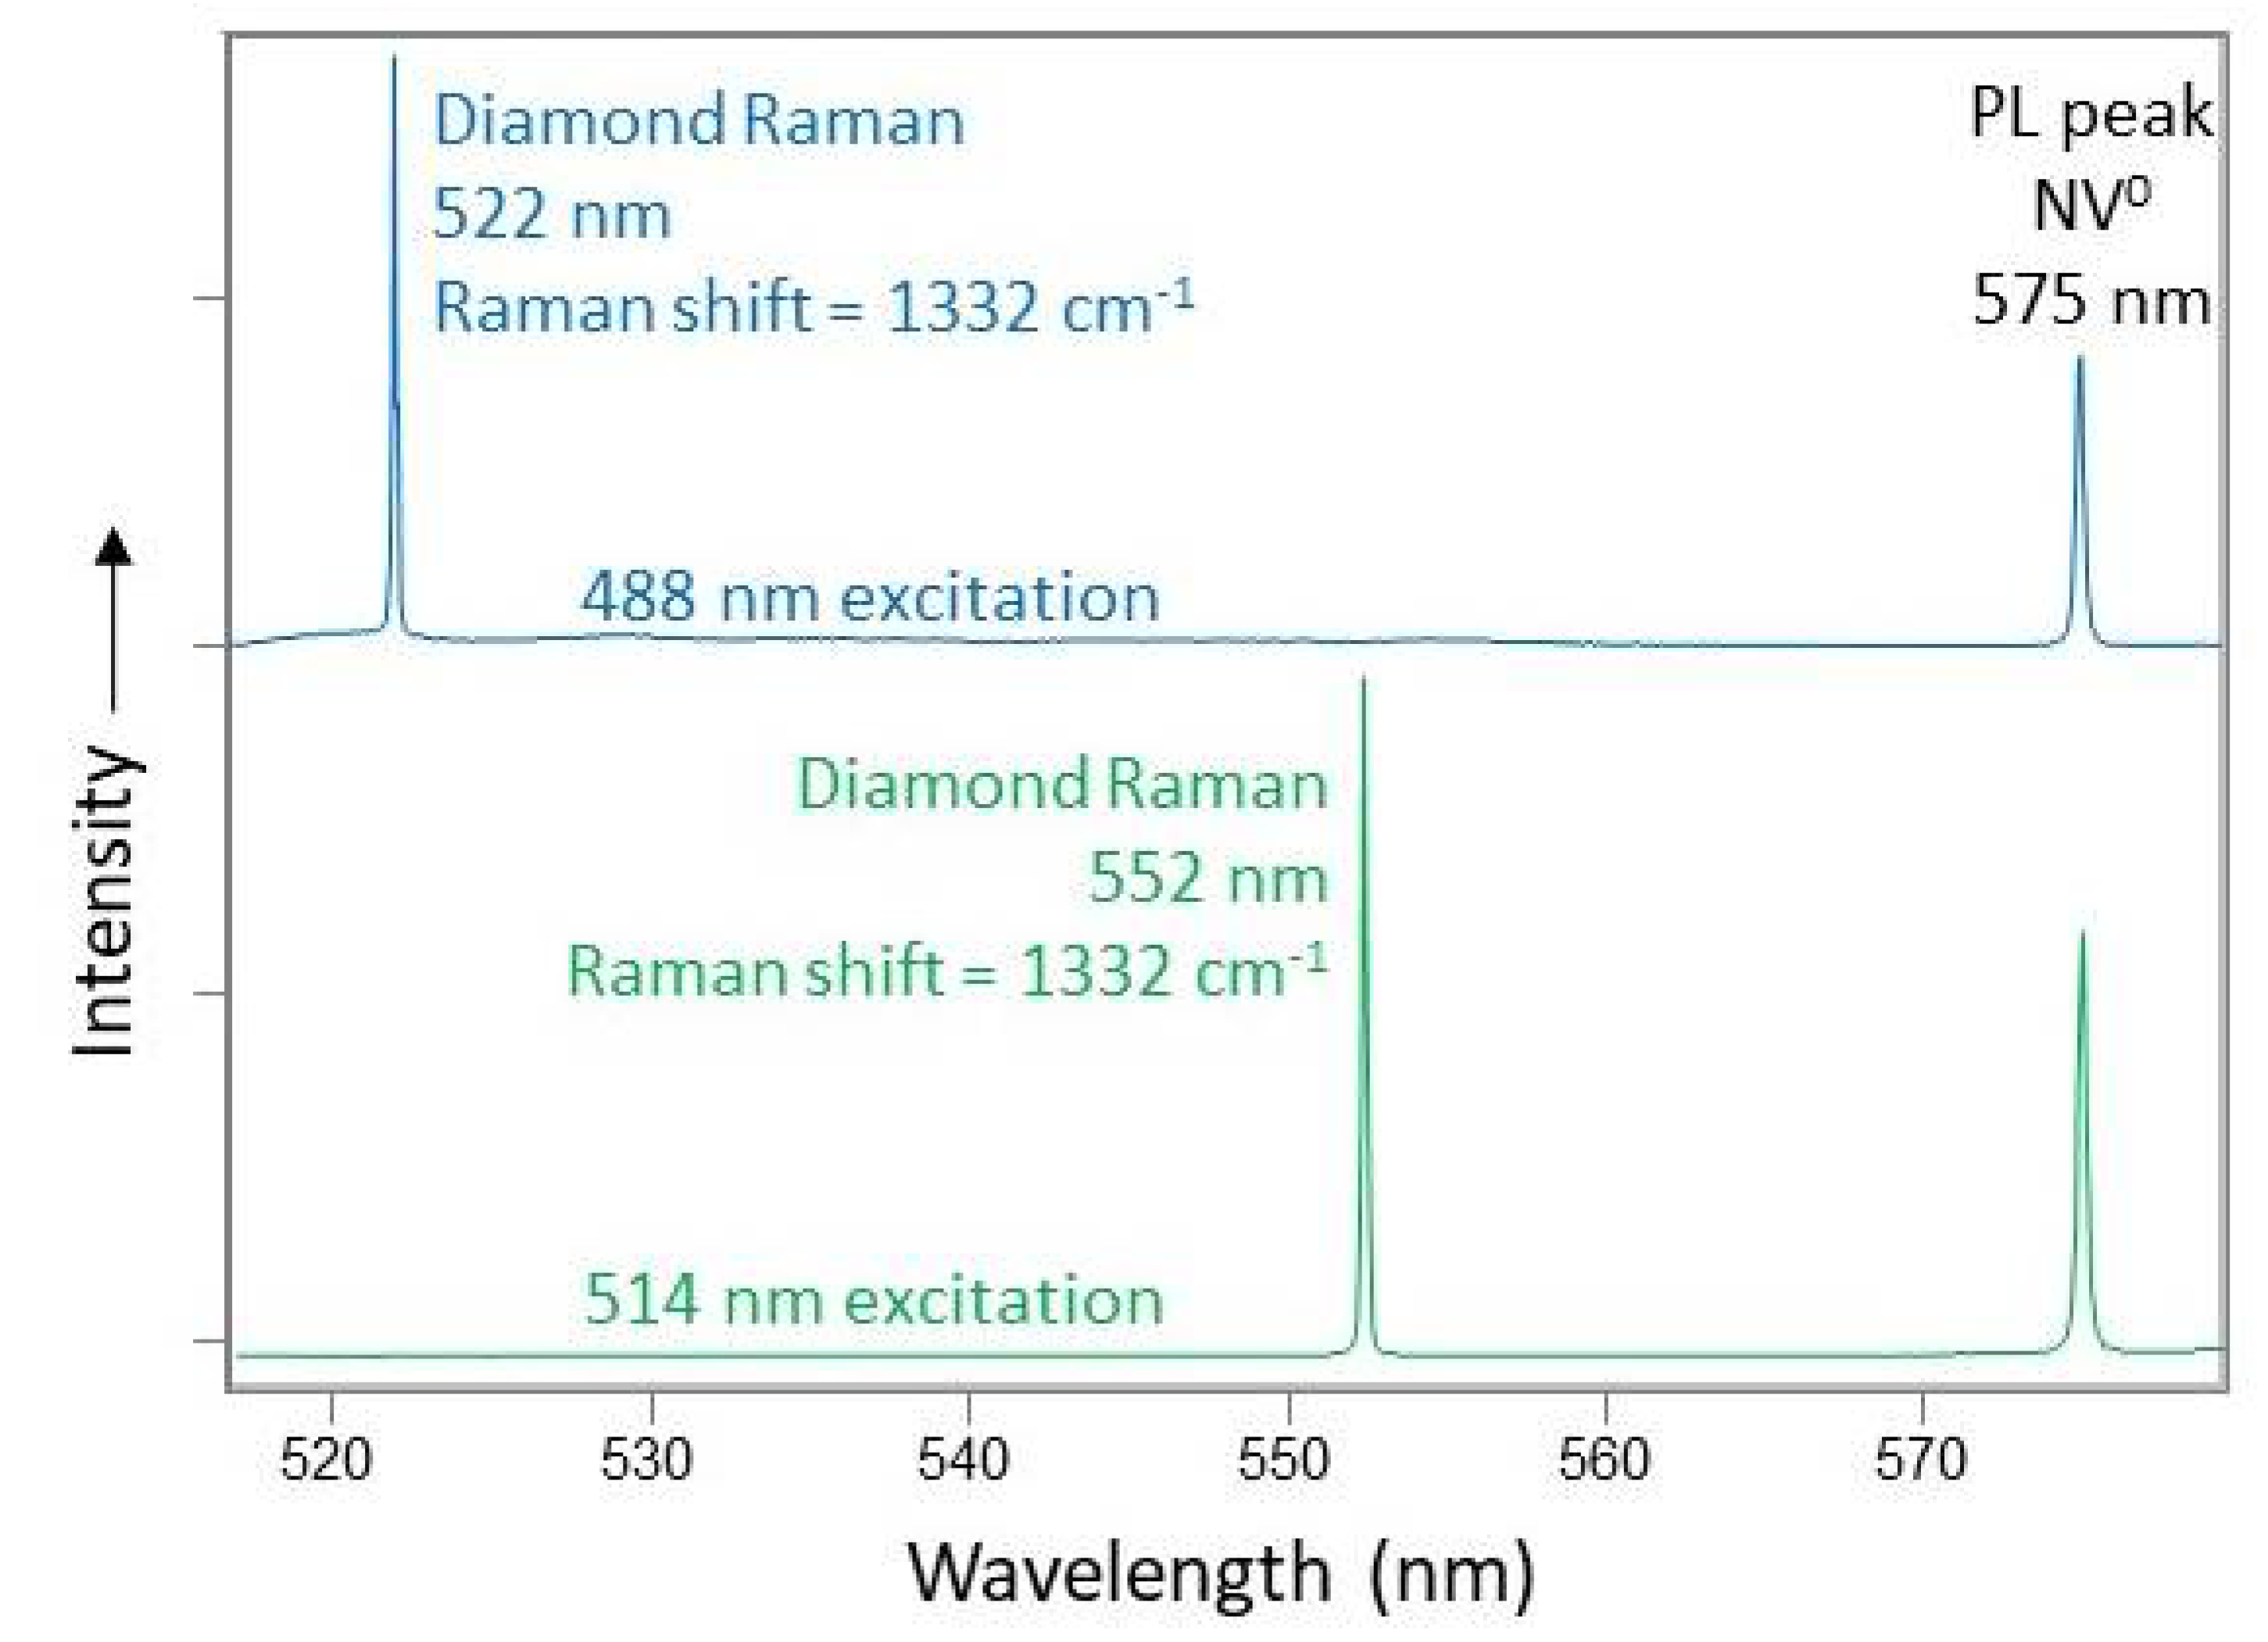
In this article, we will describe mapping of both Raman spectra and PL spectra so we wanted to provide a brief distinction between these two measurements as they are collected with this same instrumentation. PL and Raman peaks are detected with the same instrumentation, and both types of peaks appear in the same spectra [12]. Luminescence peaks are emitted at a consistent energy (or wavelength) from a material. For example, the chromium-related fluorescence peaks in ruby occur at 693 and 694 nm; the luminescence will not shift to a different wavelength if a different light source is used [11].
In contrast, Raman peaks have a constant energy difference from their excitation source. The source laser interacts with the molecular vibrations within the gem, which produces a change when the light is re-emitted by the gem [19]. Raman spectroscopy measures the energy shift caused by these molecular interactions, which occurs in only one in 100 million photons.
While PL peaks have fixed energies and wavelengths (typically given in nanometers in the gemological literature), Raman shift values are usually reported in units of wavenumbers, cm–1, and the wavelength of the laser set as the “zero” wavenumber position. In Raman spectra, the reported values are relative to the excitation source and are generally labeled as Raman shift values. When Raman peaks are shown in a PL spectrum, the wavelength position is dependent on the excitation frequency while the PL peaks are independent (Figure 4).

4. PL and Raman Mapping of Natural Diamonds with Color Zoning

4.1. Natural Pink Diamond

PL mapping has shown research potential regarding natural diamonds, particularly in those that show spatial differences in their color. One such example is type Ia pink diamond [20], in which the color is concentrated into thin lamellae (Figure 5A). These pink lamellae can be seen within a microscope and explored in more depth with mapping spectroscopy [13]. These colored lamellae are caused by natural plastic deformation, oriented along the (111) crystallographic planes, and create a broad absorption band centered at ~550 nm. There is also a corresponding emission band at 600–750 nm [13]. Since much about the 550 nm absorption band in natural pink diamonds is unknown, studying the 600–750 nm emission band provides opportunities to learn more about pink diamonds.
In pink diamonds that are type IaA>B, the pink color is typically only seen within the lamellae, which are very straight and parallel [20,21]. Similarly, the normalized integrated intensity of the ~600–750 nm emission band (area underneath the emission band normalized using the diamond Raman peak) qualitatively corresponds with the saturation of pink color (Figure 5B,C). With PL mapping of these diamonds, the ~600–750 nm emission band is not detected outside of the lamella and has calculated areas of near zero. In contrast, within the lamellae, the emission band is comparatively quite large.

4.2. Natural Diamonds from Marange with Hydrogen Clouds

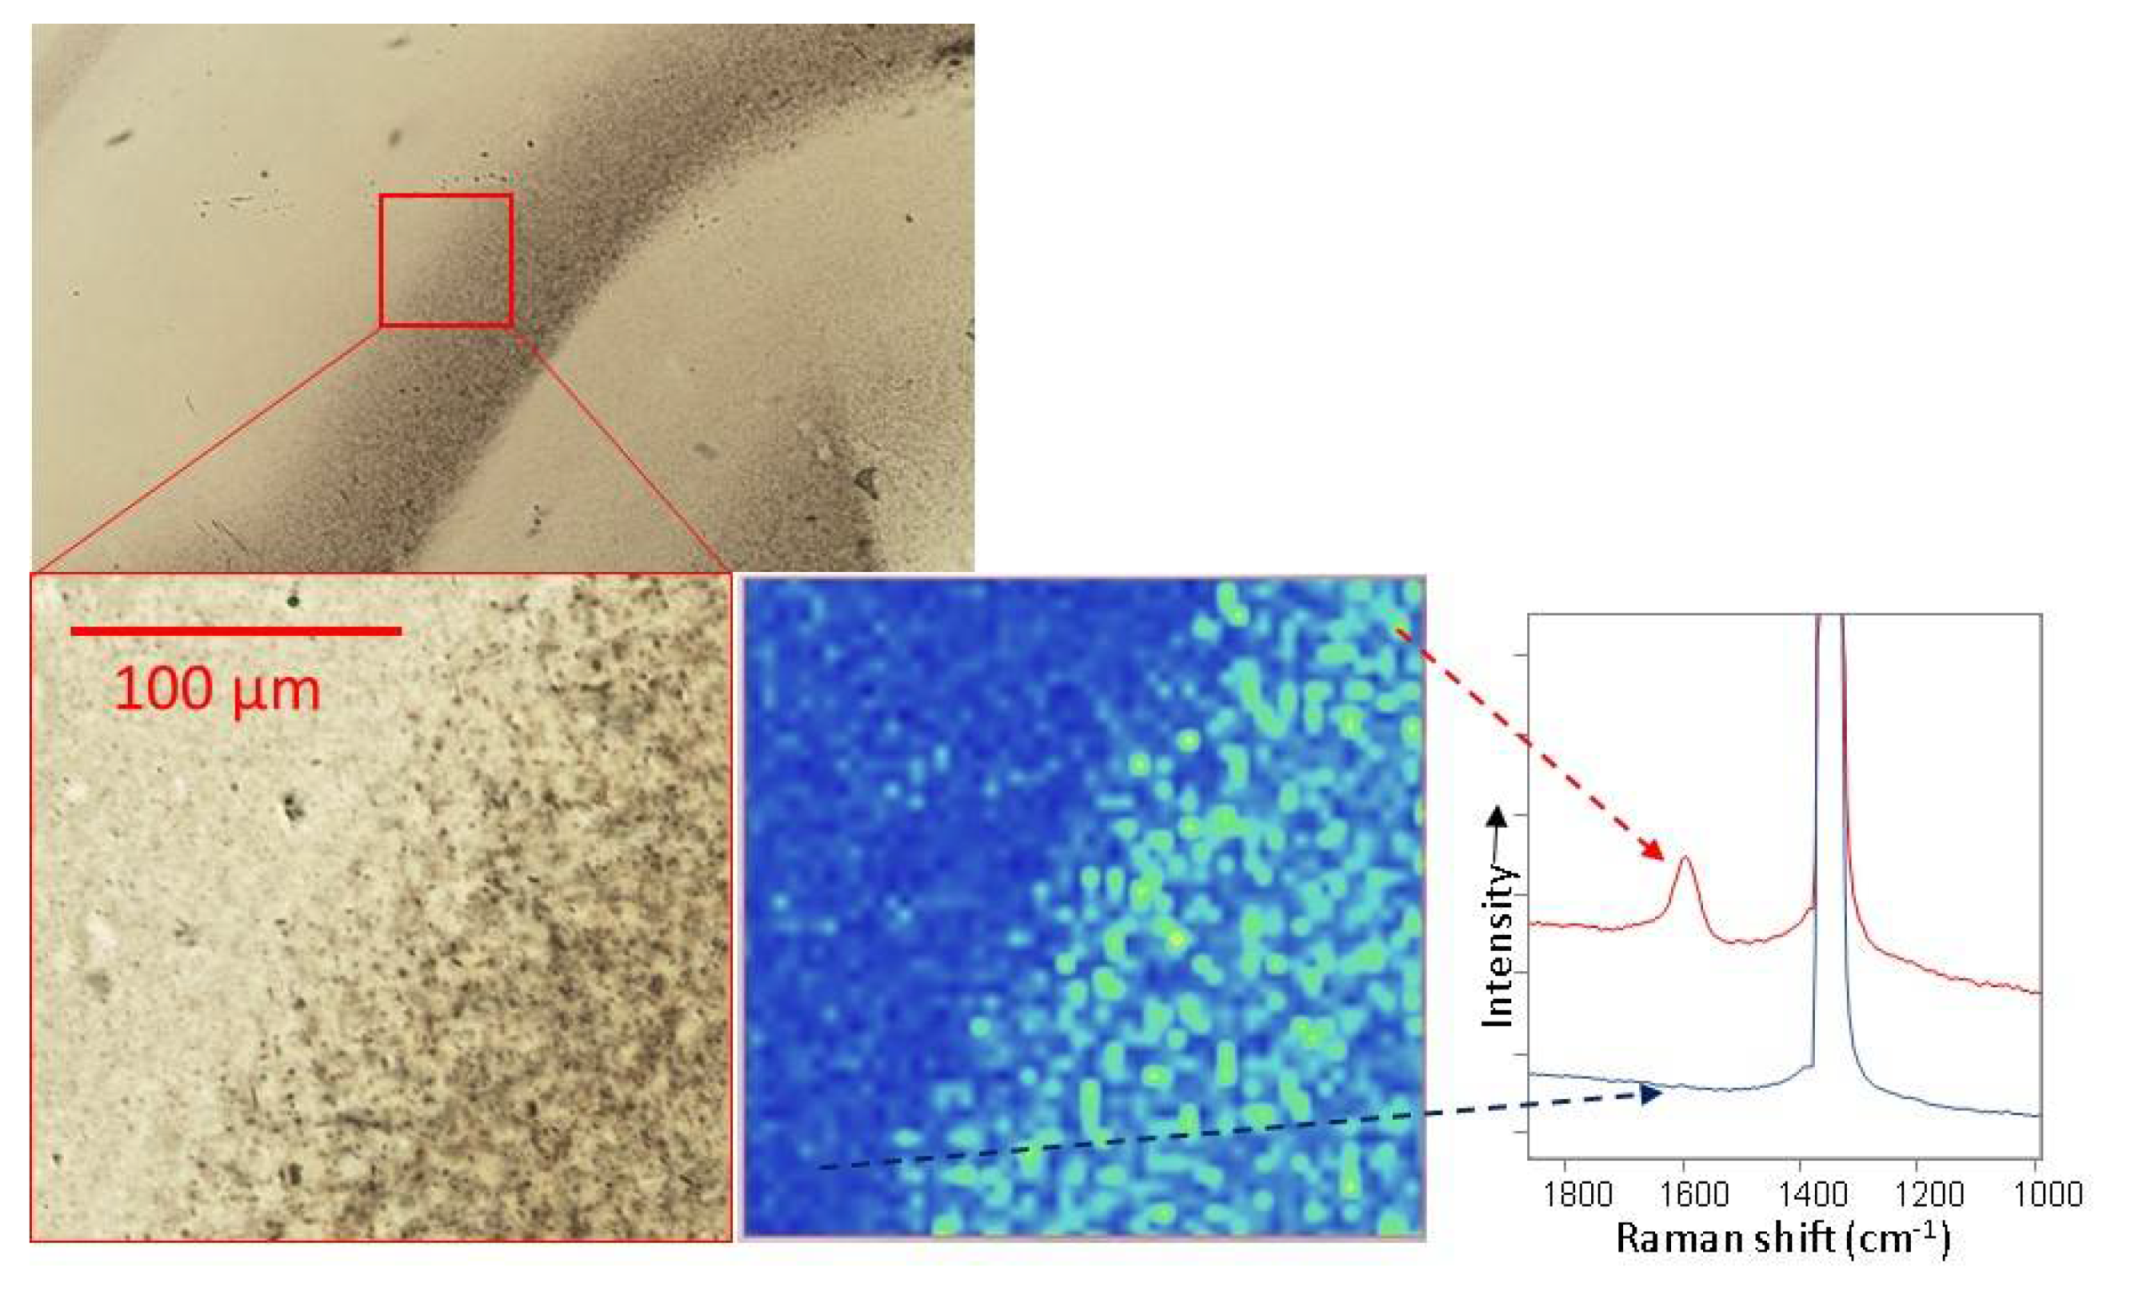
Another example of mapping on color-zoned natural diamonds is those from the Marange alluvial deposit in Zimbabwe. This is a consistent source of mixed-habit type IaAB diamonds that contain cuboid (grayish) and octahedral (colorless) sectors [23,24]. In these diamonds, Raman mapping can be used to establish that the gray color is due to graphite micro-inclusions (Figure 6; [24,25,26]) along with the presence of CH4 [24]. In addition to Raman mapping, PL mapping of these regions also confirmed the incorporation of other defects including a variety of nickel-related centers, such as the S3 defect and PL peaks at 694 and 700 nm [23].

5. Naturally Irradiated Diamond

Diamond is among the most valued and desired of gemstones and when they occur with vibrant colors such as red, blue, or green, their value skyrockets due to the geological rarity of the unique conditions required to produce the atomic structural defects responsible for those colors. Unlike most colored diamonds, many green diamonds obtain their color in a secondary fashion as they are exposed to direct contact with radioactive minerals and fluids in the shallow parts of the Earth’s crust after they have been transported up from the mantle where they crystallized. Very commonly with natural radiation exposure comes the presence of small areas of intense alpha particle radiation damage on the surface of diamonds. These green- or brown-colored patches, termed “radiation stains” by gemologists, usually penetrate only a few tens of microns into the diamond surface (i.e., the stopping distance of alpha particles in diamond). While many natural diamond crystals show a few of these radiation stains, only a rare few are exposed to enough radiation damage to produce internal color zoning (beta or gamma radiation-related) in addition to the surficial stains [27]. These rare stones produce some of the world’s most famous and valuable green diamonds, including the 40.70 carat Dresden Green [28,29].
PL analysis of diamond is an important tool in identifying many types of defects and treatments in gem diamonds. In addition to the naturally irradiated diamonds described here, PL mapping can also be helpful for analyzing the spatial effects of laboratory irradiation, such as depth penetration of the irradiation and its effect on PL-active defects [14,30]. The surficial contact with radioactive fluids or mineral grains often creates distinct spatial differences in PL defects related to natural irradiation. These green radiation stains have also been shown to turn to brown when heated to moderate temperatures (~500 °C [31,32]) and, occasionally, green and brown radiation stains are seen on the same diamond. PL mapping has helped elucidate the differences between adjacent green and brown radiation stains [33]. Several useful examples of PL on naturally irradiated diamond are recounted here.

5.1. PL Mapping to Determine Penetration Depth of Radiation

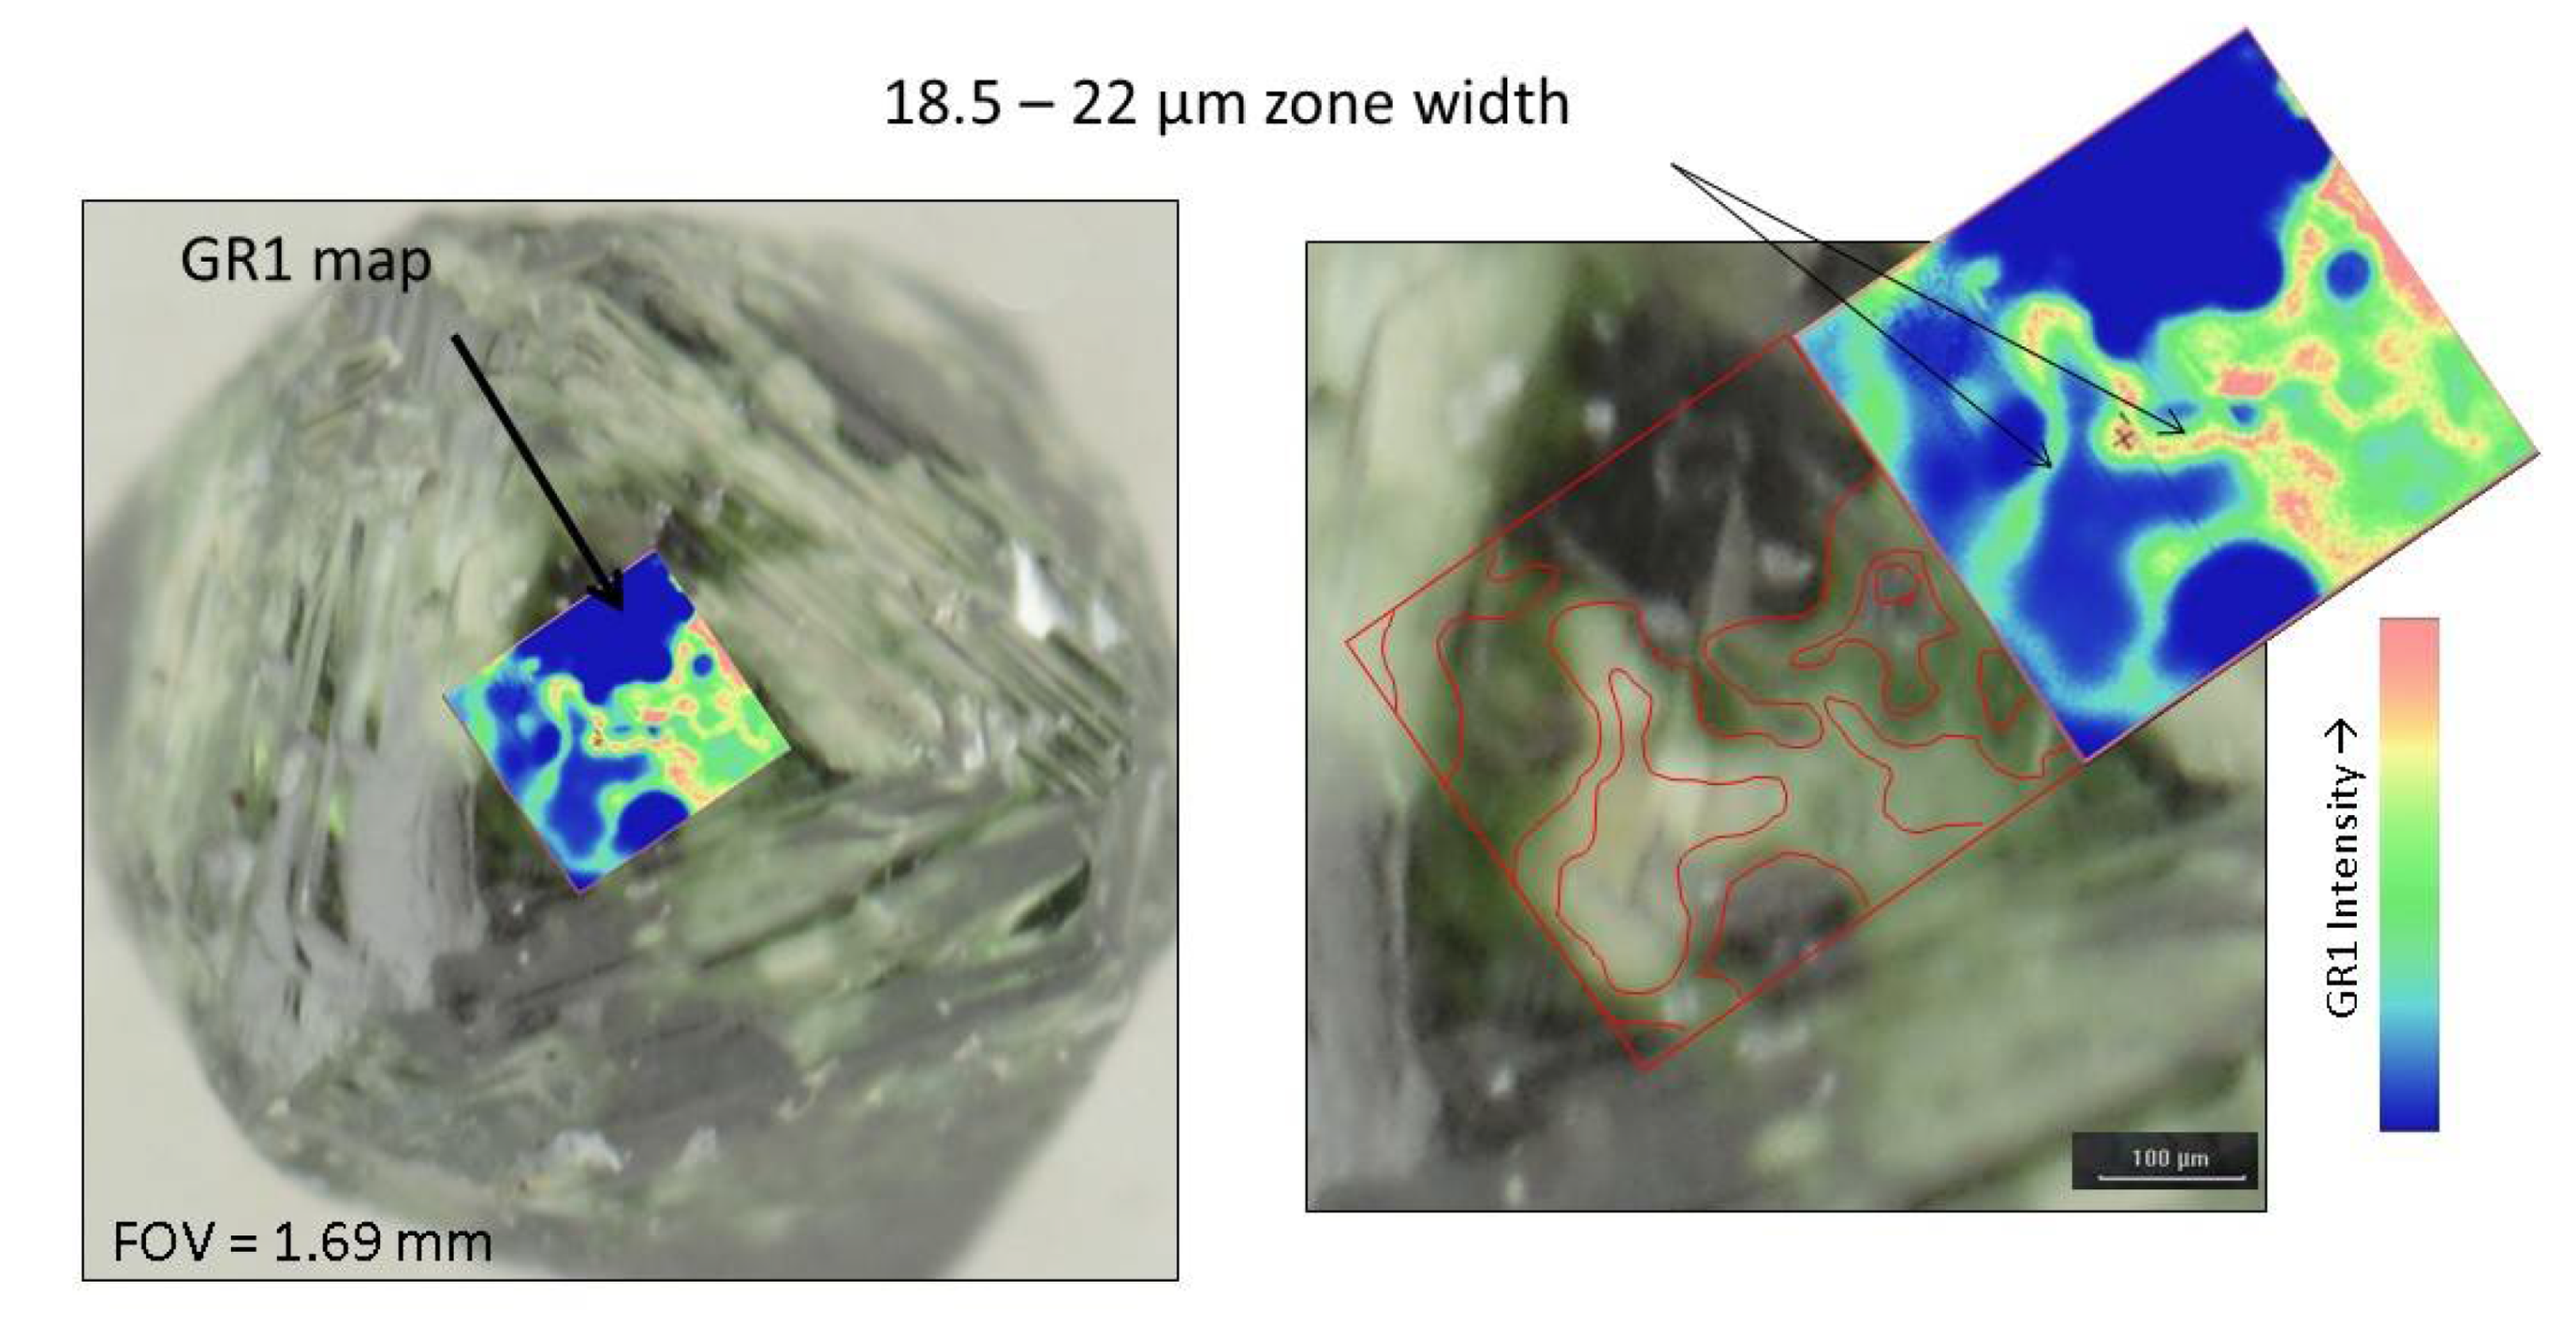
One such method to monitor the spatial variations is by monitoring vacancy defects introduced by natural radiation. PL mapping of natural diamonds with radiation stains allows us to see the distribution of vacancy defects (GR1; [V0], ZPL = 741 nm) relative to the stains to better understand the impact of natural geological processes. Interestingly, PL mapping shows that heavily irradiated areas that have dark green radiation stains on a diamond surface, themselves, have little to no GR1 emission (Figure 7). This is likely due to the severe damaging of the diamond atomic lattice at the spot of most intense radiation dose, rather than an absence of vacancies. Adjacent to the radiation stains, mapping shows narrow regions showing elevated concentrations of GR1 defects. These regions range in width from 18.5 to 22 µm that coincide with a lighter green in color; this observation is consistent with the penetration depth for alpha irradiation [31,32].
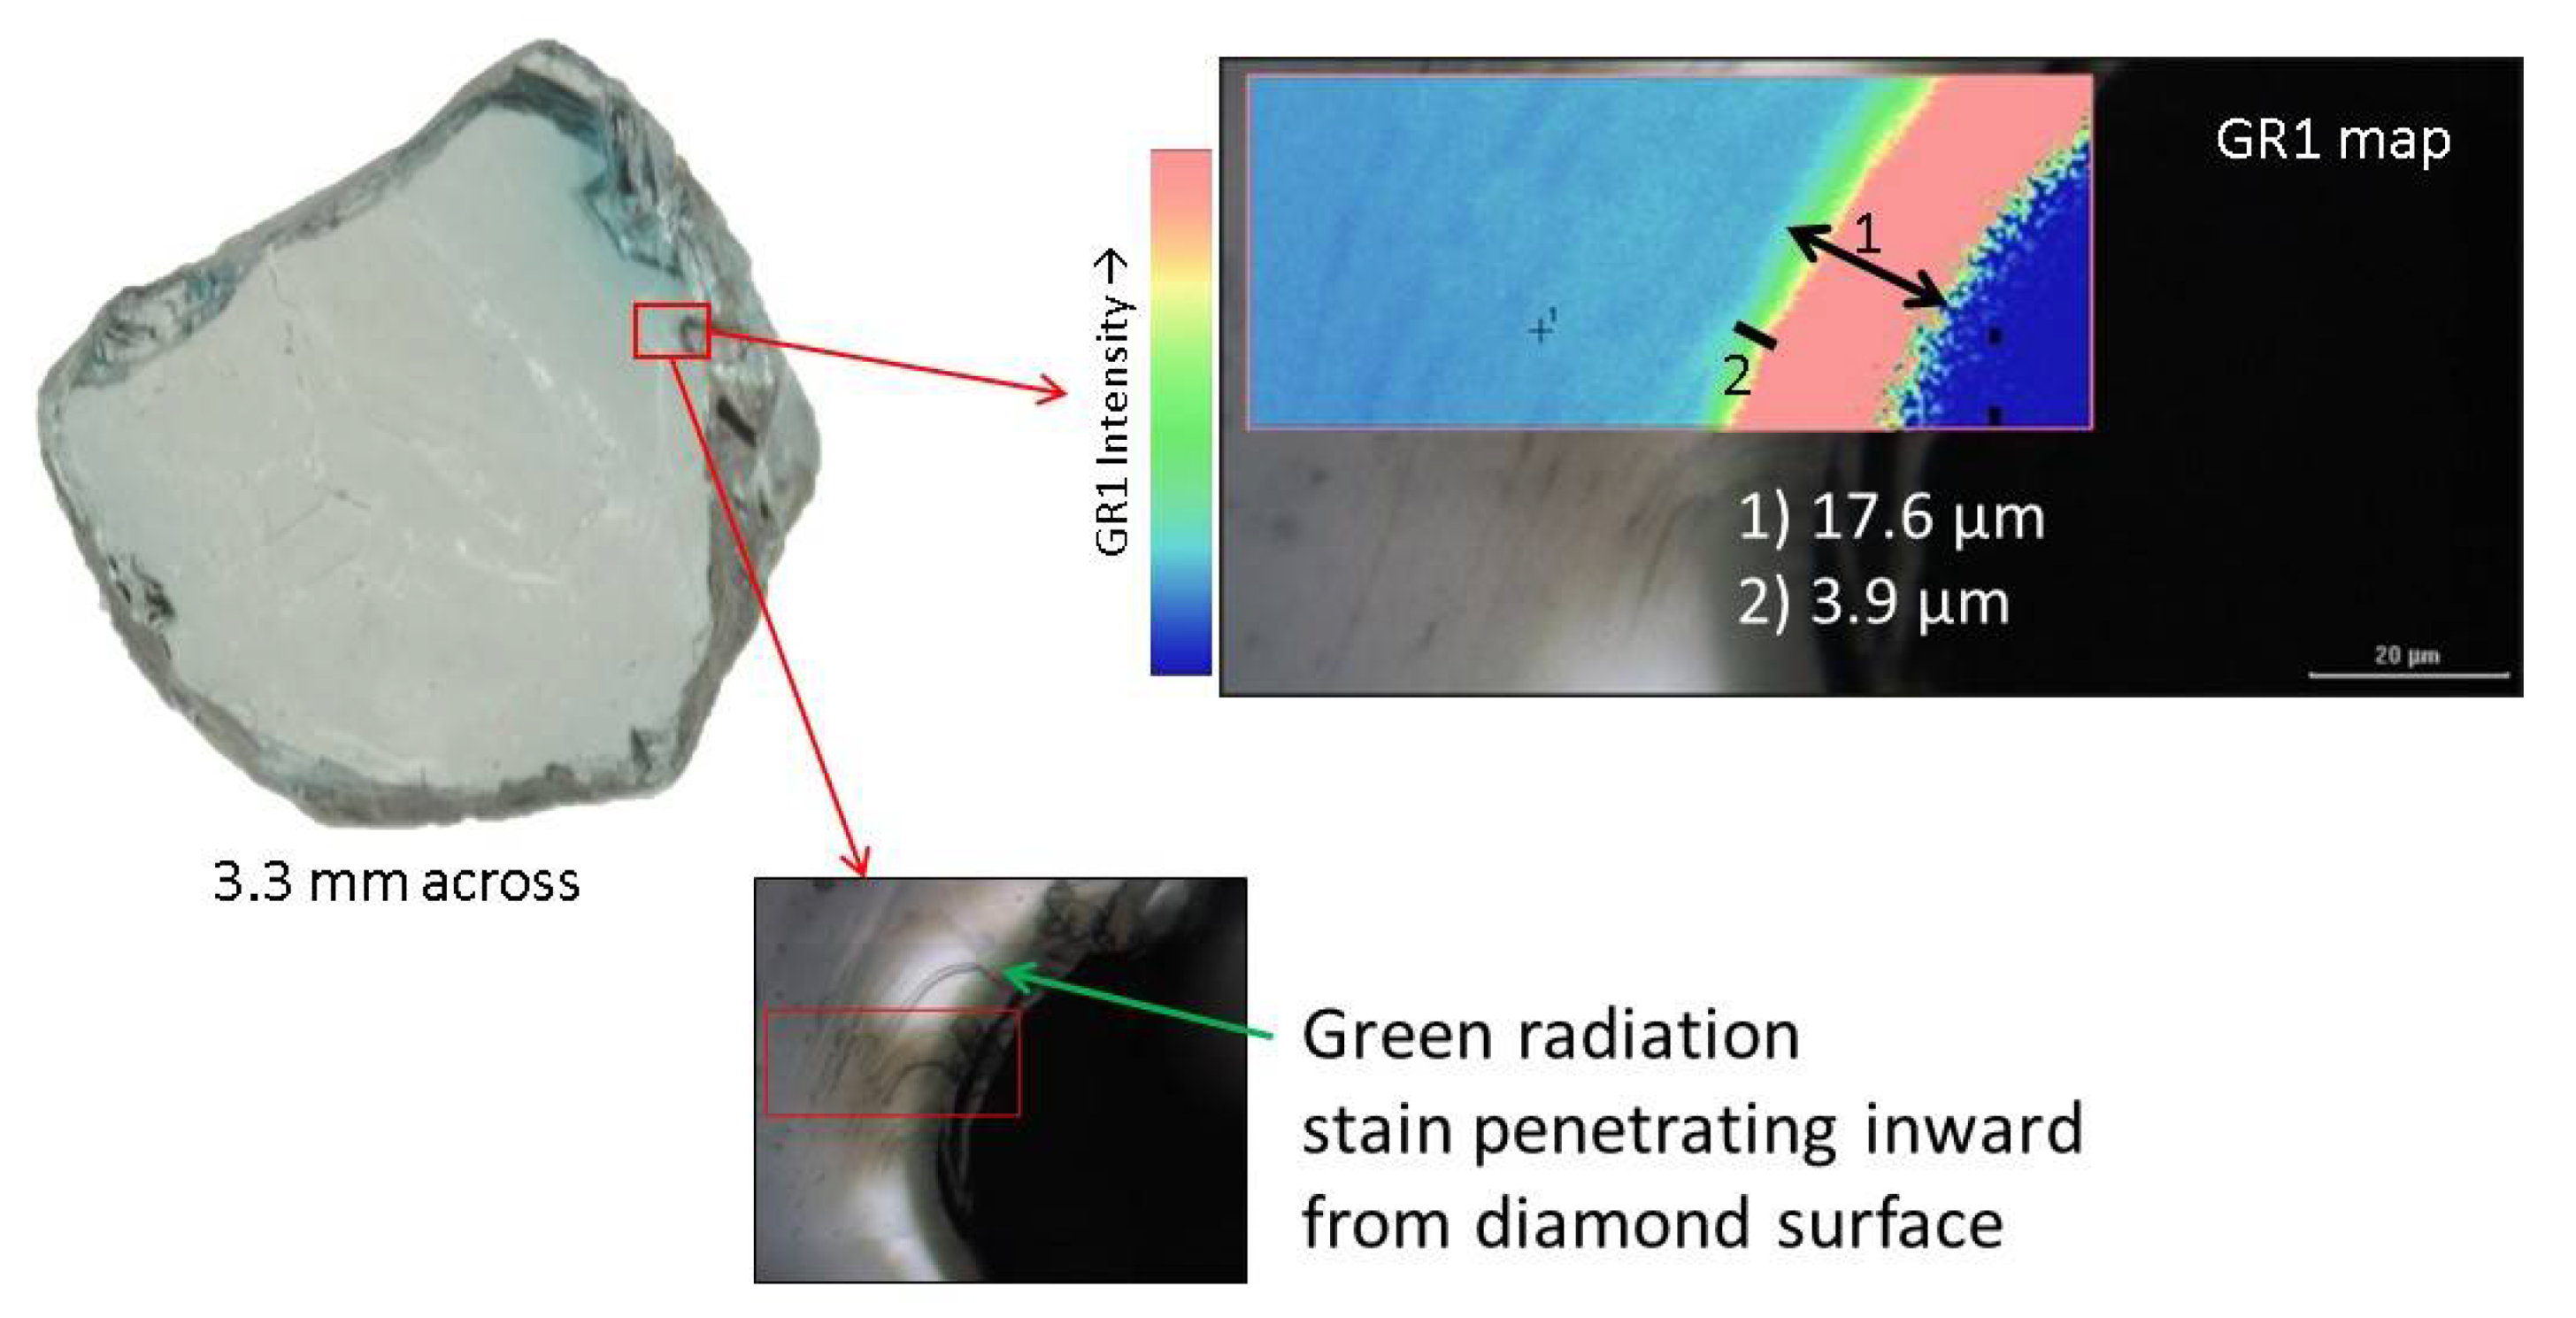
In addition to a narrow vacancy distribution lateral to radiation stains, the depth penetration within a diamond is similar. From a cleaved diamond sample with radiation damage and green stains at the surface, the depth penetration of both the stains and resulting color zonation can clearly be seen (Figure 8). It is difficult to obtain a cross-section of a diamond sample like this without laser cutting and polishing. Radiation-related defects in diamond are very sensitive to temperature and the inadvertent heating associated with cutting processes can often modify the defects. Using a cleaved sample ensured that the defects remained intact. Raman mapping of GR1 along the edge of the cleaved sample showed two distinct zones; the one closest to the stain measured 17.6 µm and a narrower transitional zone was 3.9 µm. Together, the two zones totaled 21.5 µm, which is consistent with the penetration of alpha damage in diamond that was also seen in Figure 7 for the surface of a natural diamond.
Through PL mapping, the lateral and depth distributions of vacancy defects in naturally irradiated diamonds with green radiation stains are both shown to comprise ~20 µm narrow regions adjacent to the stains, supporting the idea that the stains are a product of alpha irradiation. This type of analysis helps us to better understand that diamond defects are often not uniformly distributed and can be directly attributed to visible natural features.
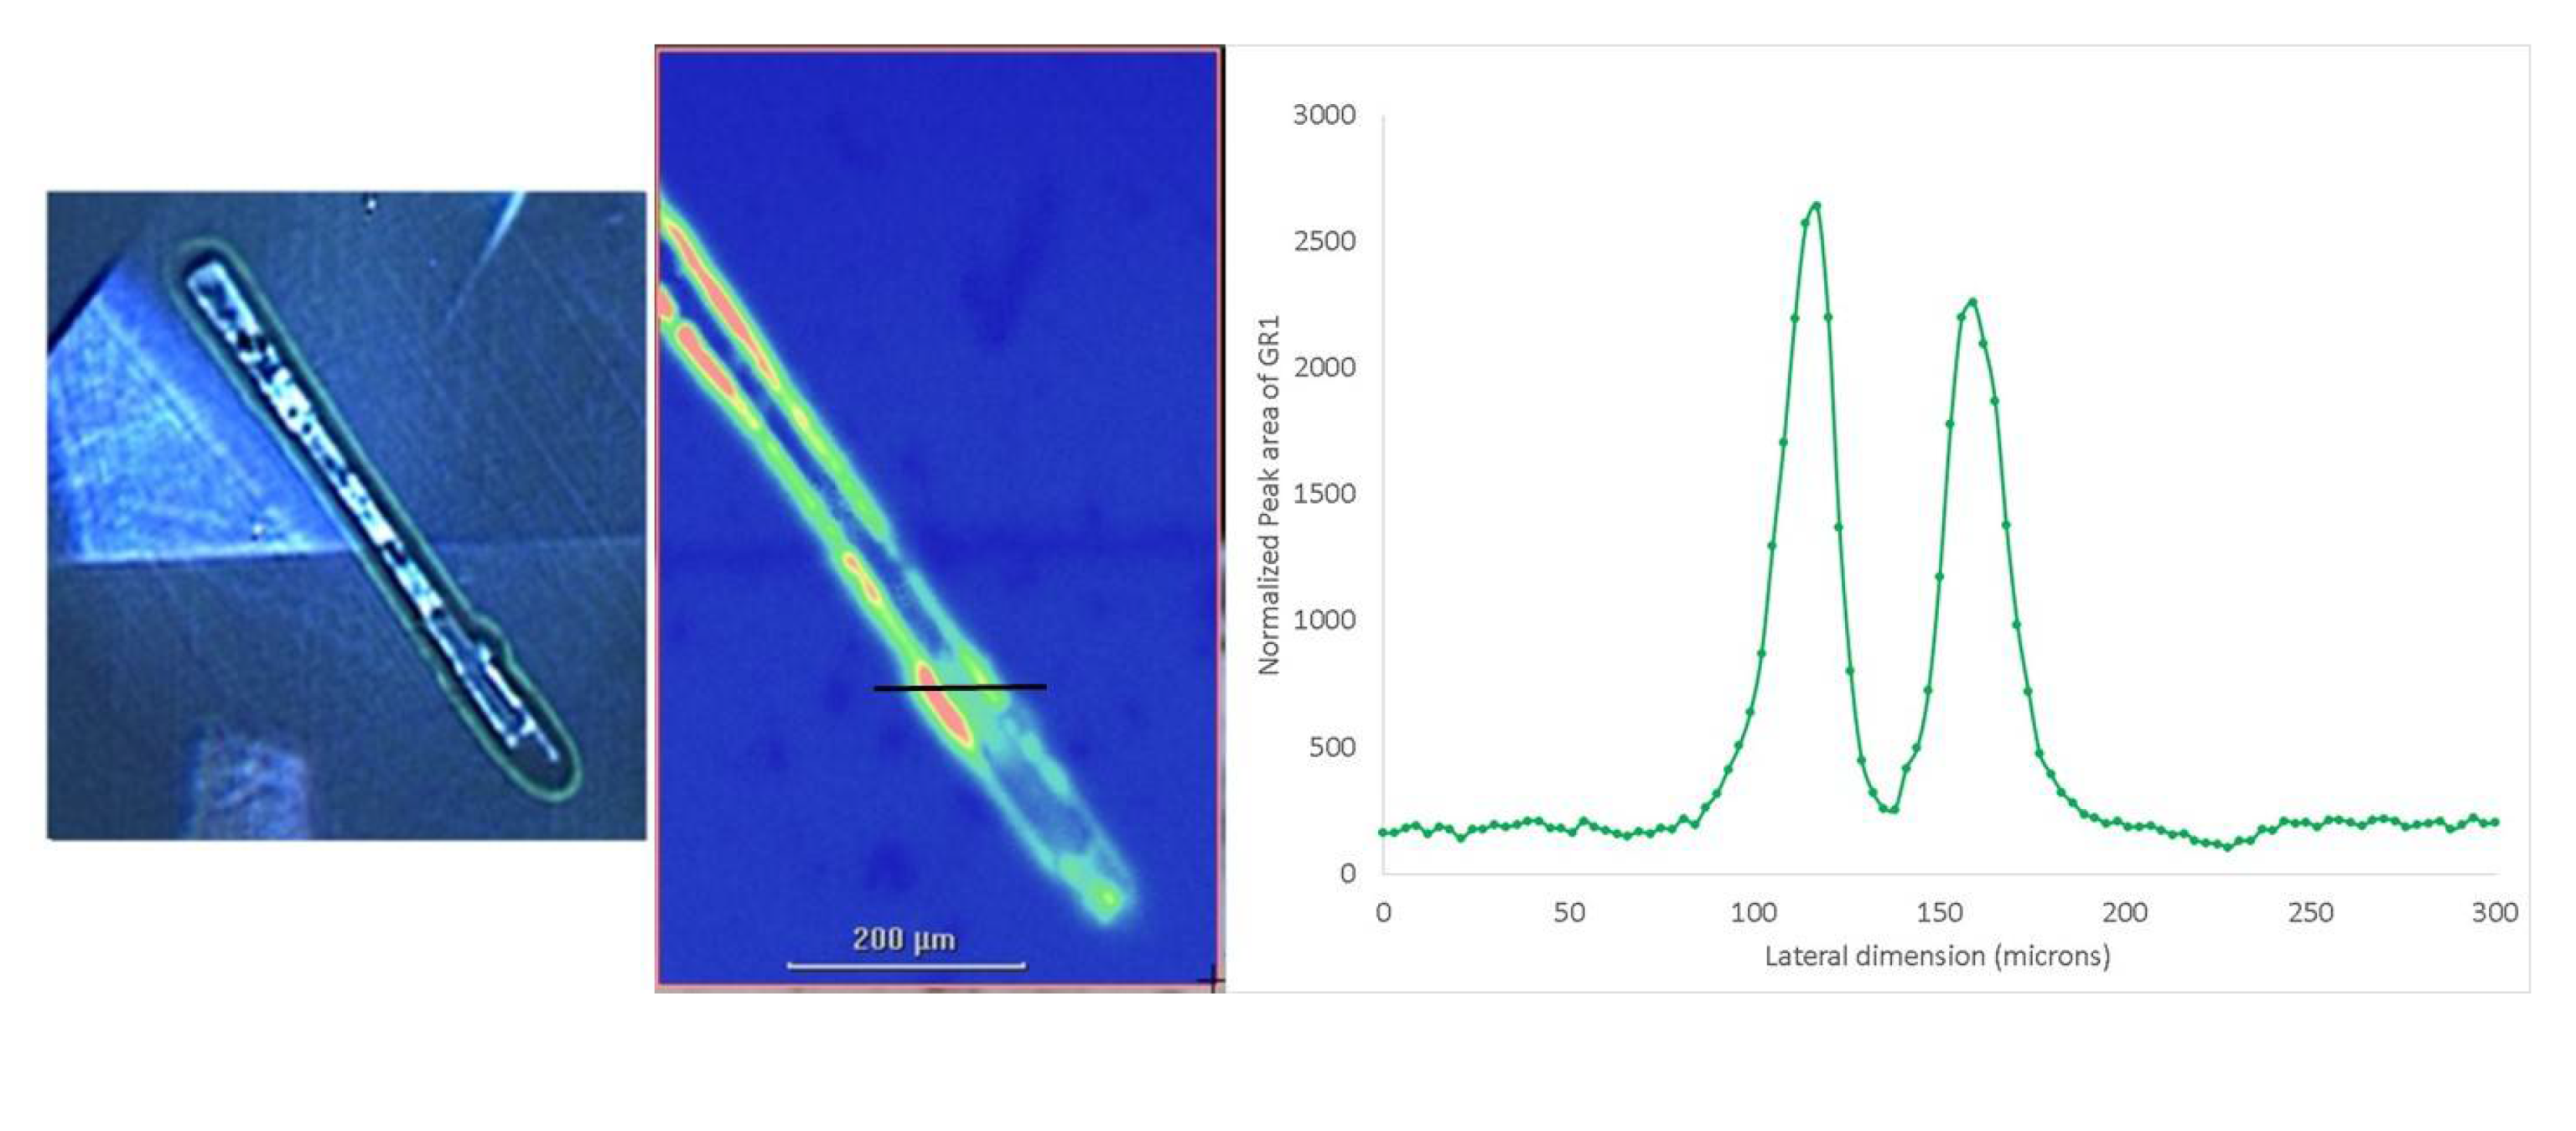
Another example of PL mapping aiding in the analysis of natural-irradiation related features was a faceted diamond that showed green fluorescence around the rim of some cavities present in the diamond [34]. Figure 9 shows that, while in the Earth’s crust, the diamond was exposed to radioactive fluids, particularly in etch channels now in the form of cavities on the table and crown facets. These were first noticed from fluorescence imaging that revealed green halos around these cavities. Although these isolated areas of fluorescence around the cavities indicated that they had likely been filled with a radioactive fluid, there was none of the greenish color or radiation staining that would likely accompany higher radiation doses.
PL mapping of one of the cavities showed much higher intensities of the nitrogen-vacancy centers and the GR1. The extent of the fluorescence halos and the elevated GR1 is approximately 30 μm; again, this is consistent with the penetration depth of alpha radiation.

5.2. PL Mapping Provides Clues to Unusual Origin Story

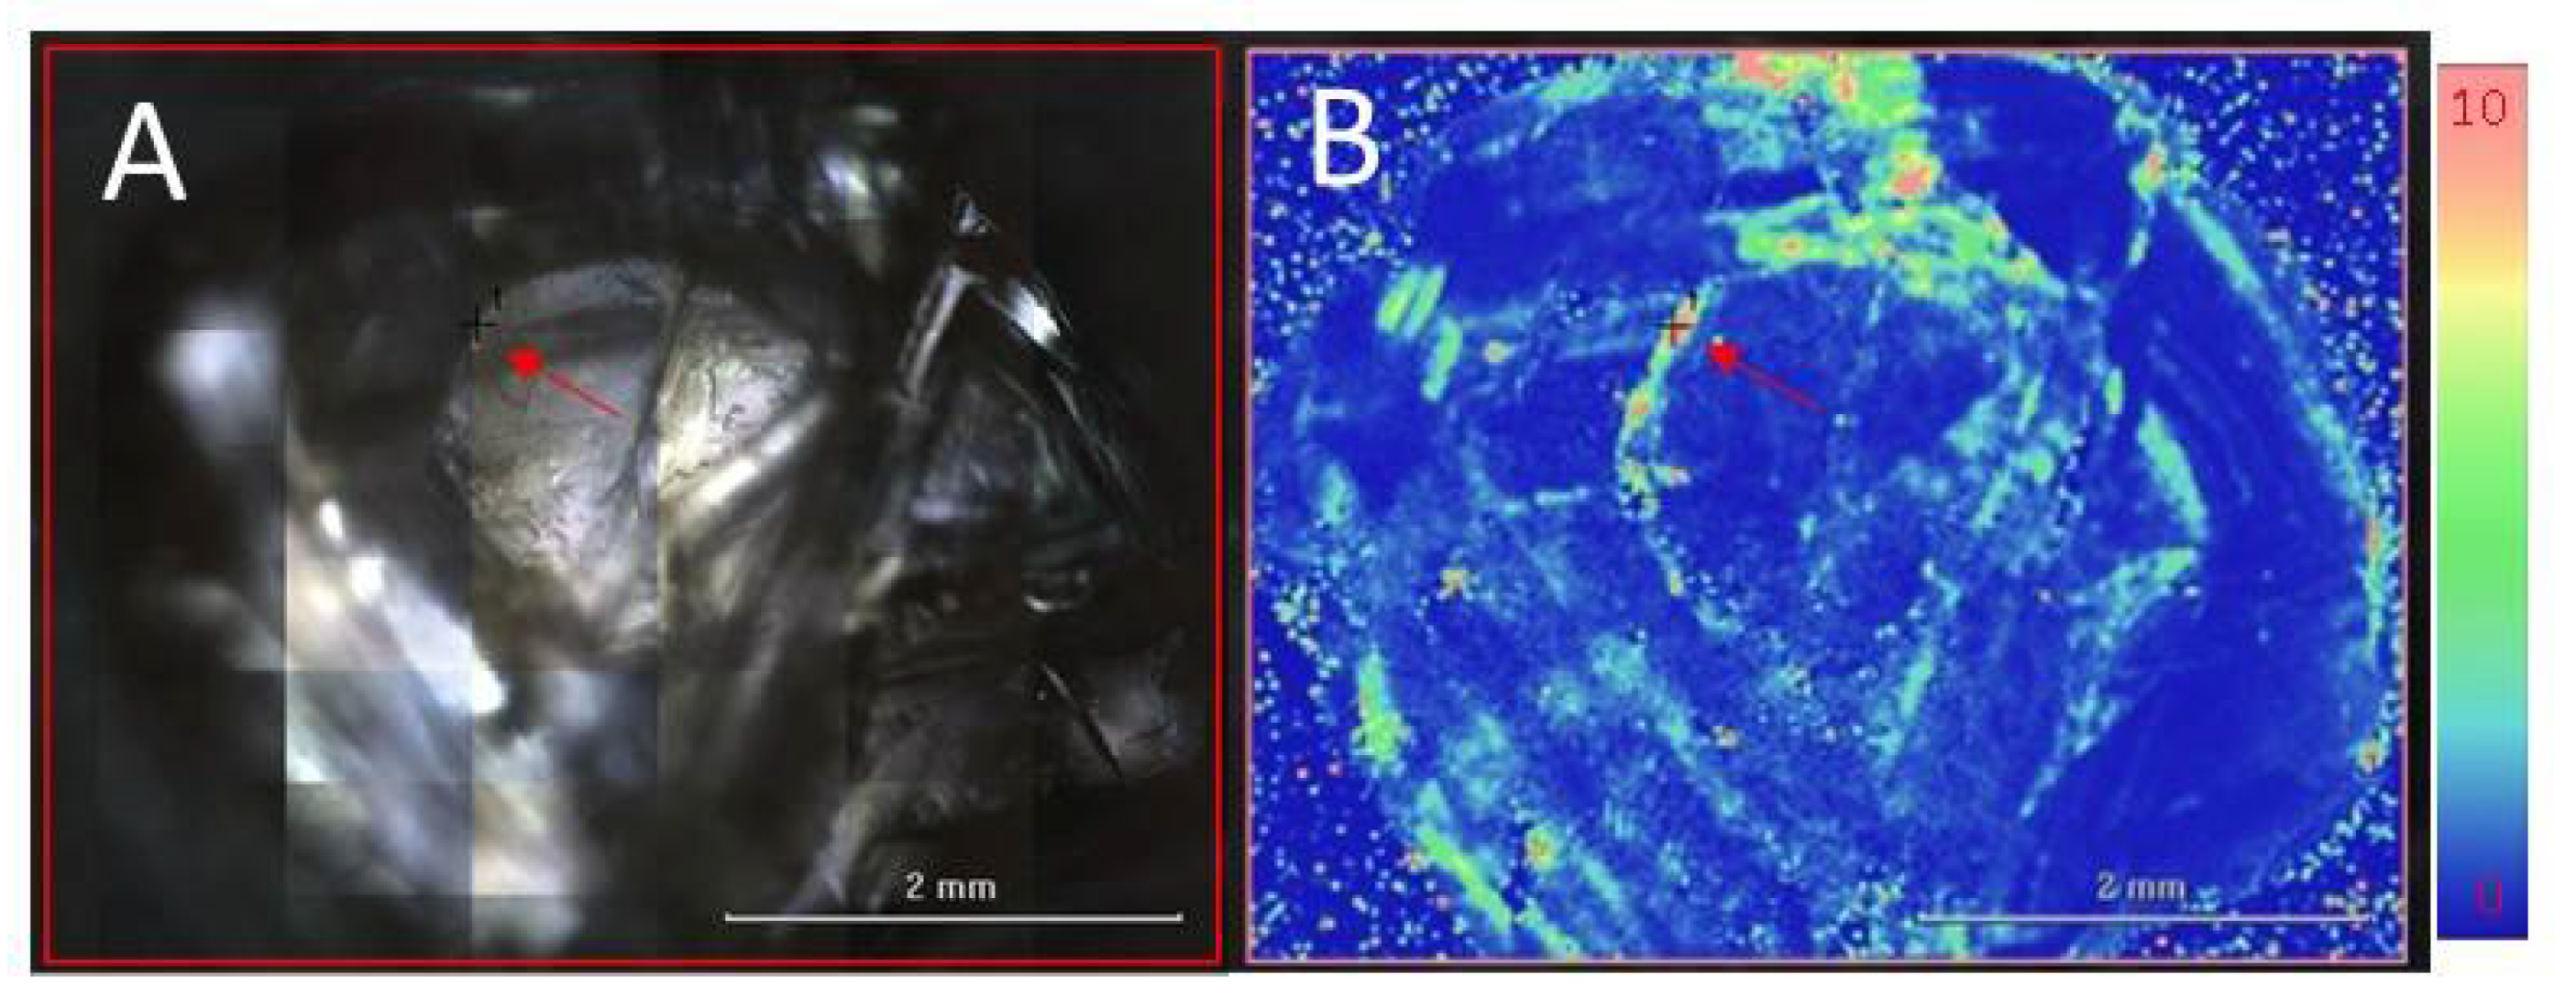
The “Matryoshka” diamond is a 0.62 ct greenish rough diamond with a freely moving diamond trapped inside [35]. The exterior and interior diamonds both showed visual evidence of radiation stains and these observations were confirmed by PL mapping using 633 nm excitation and plotting the GR1 feature [V0] at 741.2 nm. Figure 10A shows a visual camera mosaic generated by the mapping instrument, indicating the internal diamond in focus and the external diamond out of focus. The PL maps were collected in confocal mode to best distinguish the PL spectra from the inner and outer diamond. Figure 10B shows the PL map of the GR1 defect. It shows generally a higher intensity of GR1 in the outer diamond, yet shows some high GR1 emission detected in some portions of the inner diamond (indicated by red arrow in Figure 10). This confirms that radioactive fluids penetrated inside the cavity and came into physical contact with the internal diamond crystal. This type of analysis would have been far more difficult to achieve with standard PL spectroscopy.

6. Inclusion Analysis within Natural Diamonds

Diamonds, and their associated inclusions, can provide fascinating new discoveries of new minerals [36]. Diamond inclusions can provide windows into the Earth’s lithospheric and sub-lithospheric mantle, providing us with insight into the processes and compositions of what is below us. With the proper equipment and procedures, these diamond inclusions can be analyzed and identified.
Raman spectroscopy is widely used in the identification of diamond inclusions; Raman spectroscopy is generally the best method to identify non-surface-reaching inclusions and has been used to discover a number of different inclusions, such as inclusions formed in superdeep environments [37] or inclusions with different paragenetic origins [38].
Diamond inclusions can exhibit many different features that make them difficult to identify. They can contain several different minerals, can come in various sizes (from a few microns to about a millimeter), and they can contain coatings that make them practically impossible to identify. The proper instrumentation and data collection method is especially crucial for identifying diamond inclusions.
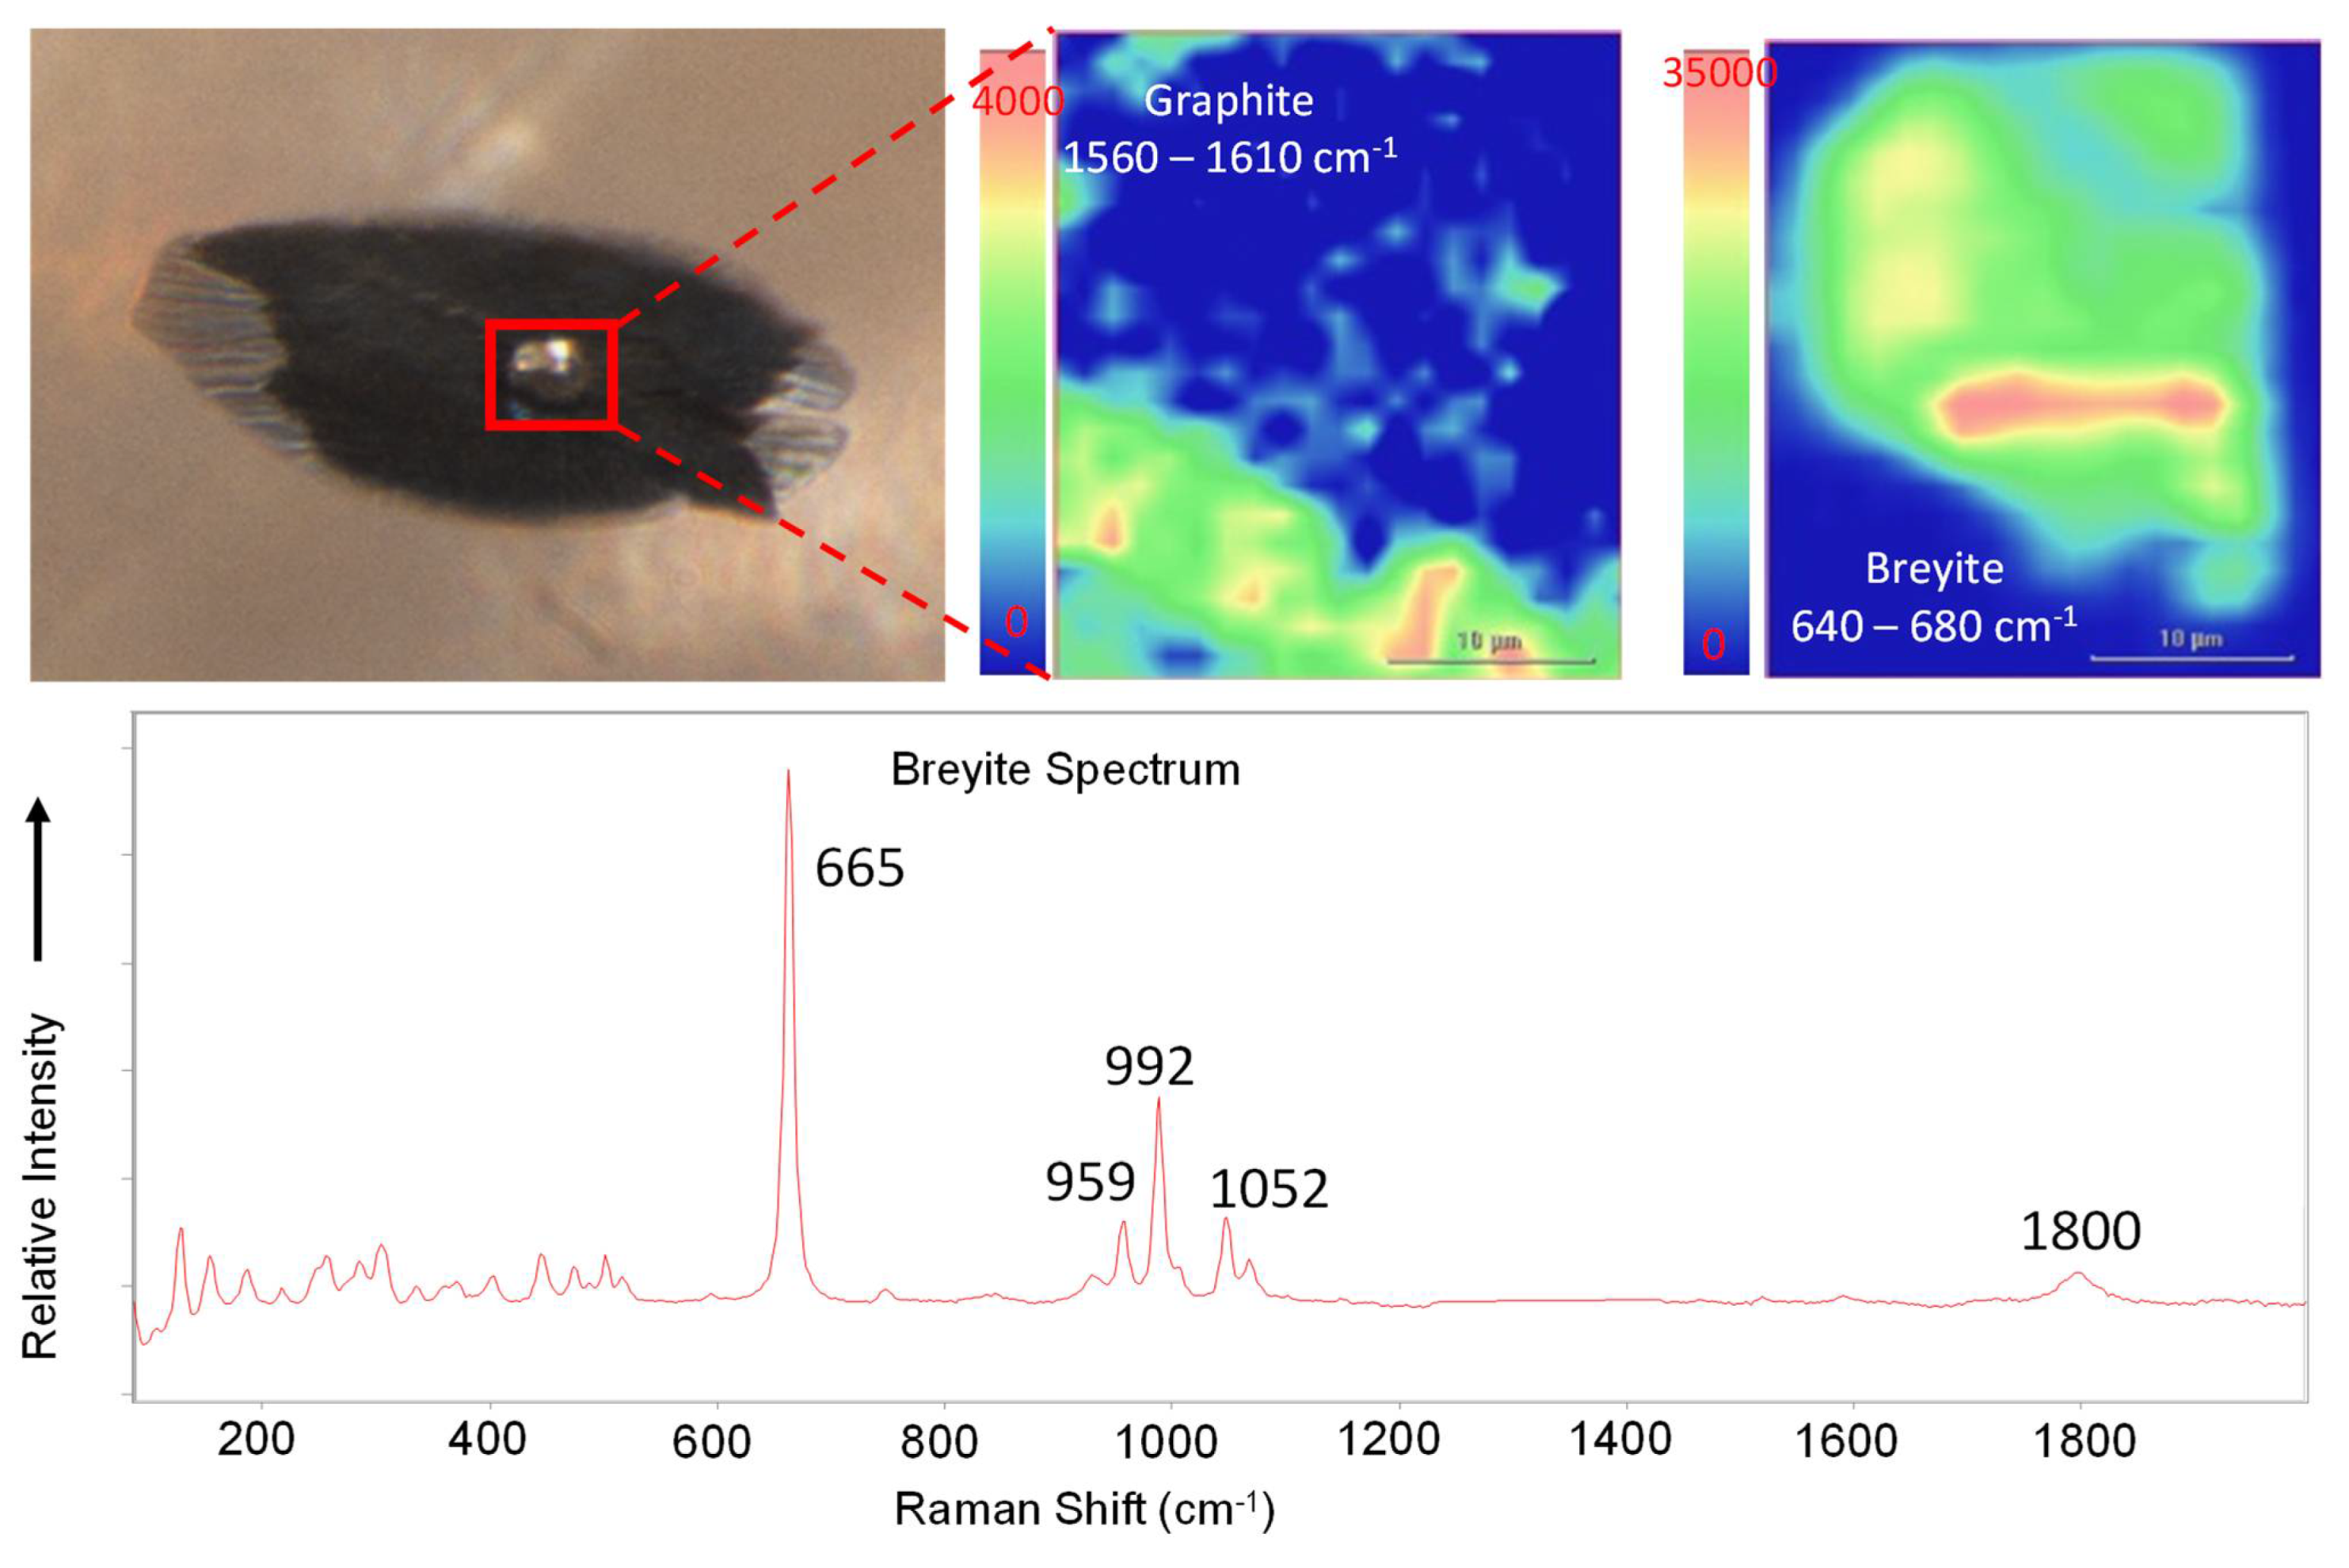
Raman mapping is an efficient method for identifying very small inclusions or inclusions with multiple mineral assemblages. Figure 11 shows an inclusion in a type IIa pink diamond with a graphitized rosette stress fracture around it, with the inclusions mainly being a semi-transparent color. With Raman mapping, this inclusion was identified as mineral breyite (CaSiO3) along with a pronounced graphitic halo. Since inclusions such as breyite have yet to be found in known lithospheric diamonds, it has been inferred that these diamonds likely have a sub-lithospheric origin at depths of around 360 to 750 km [13].
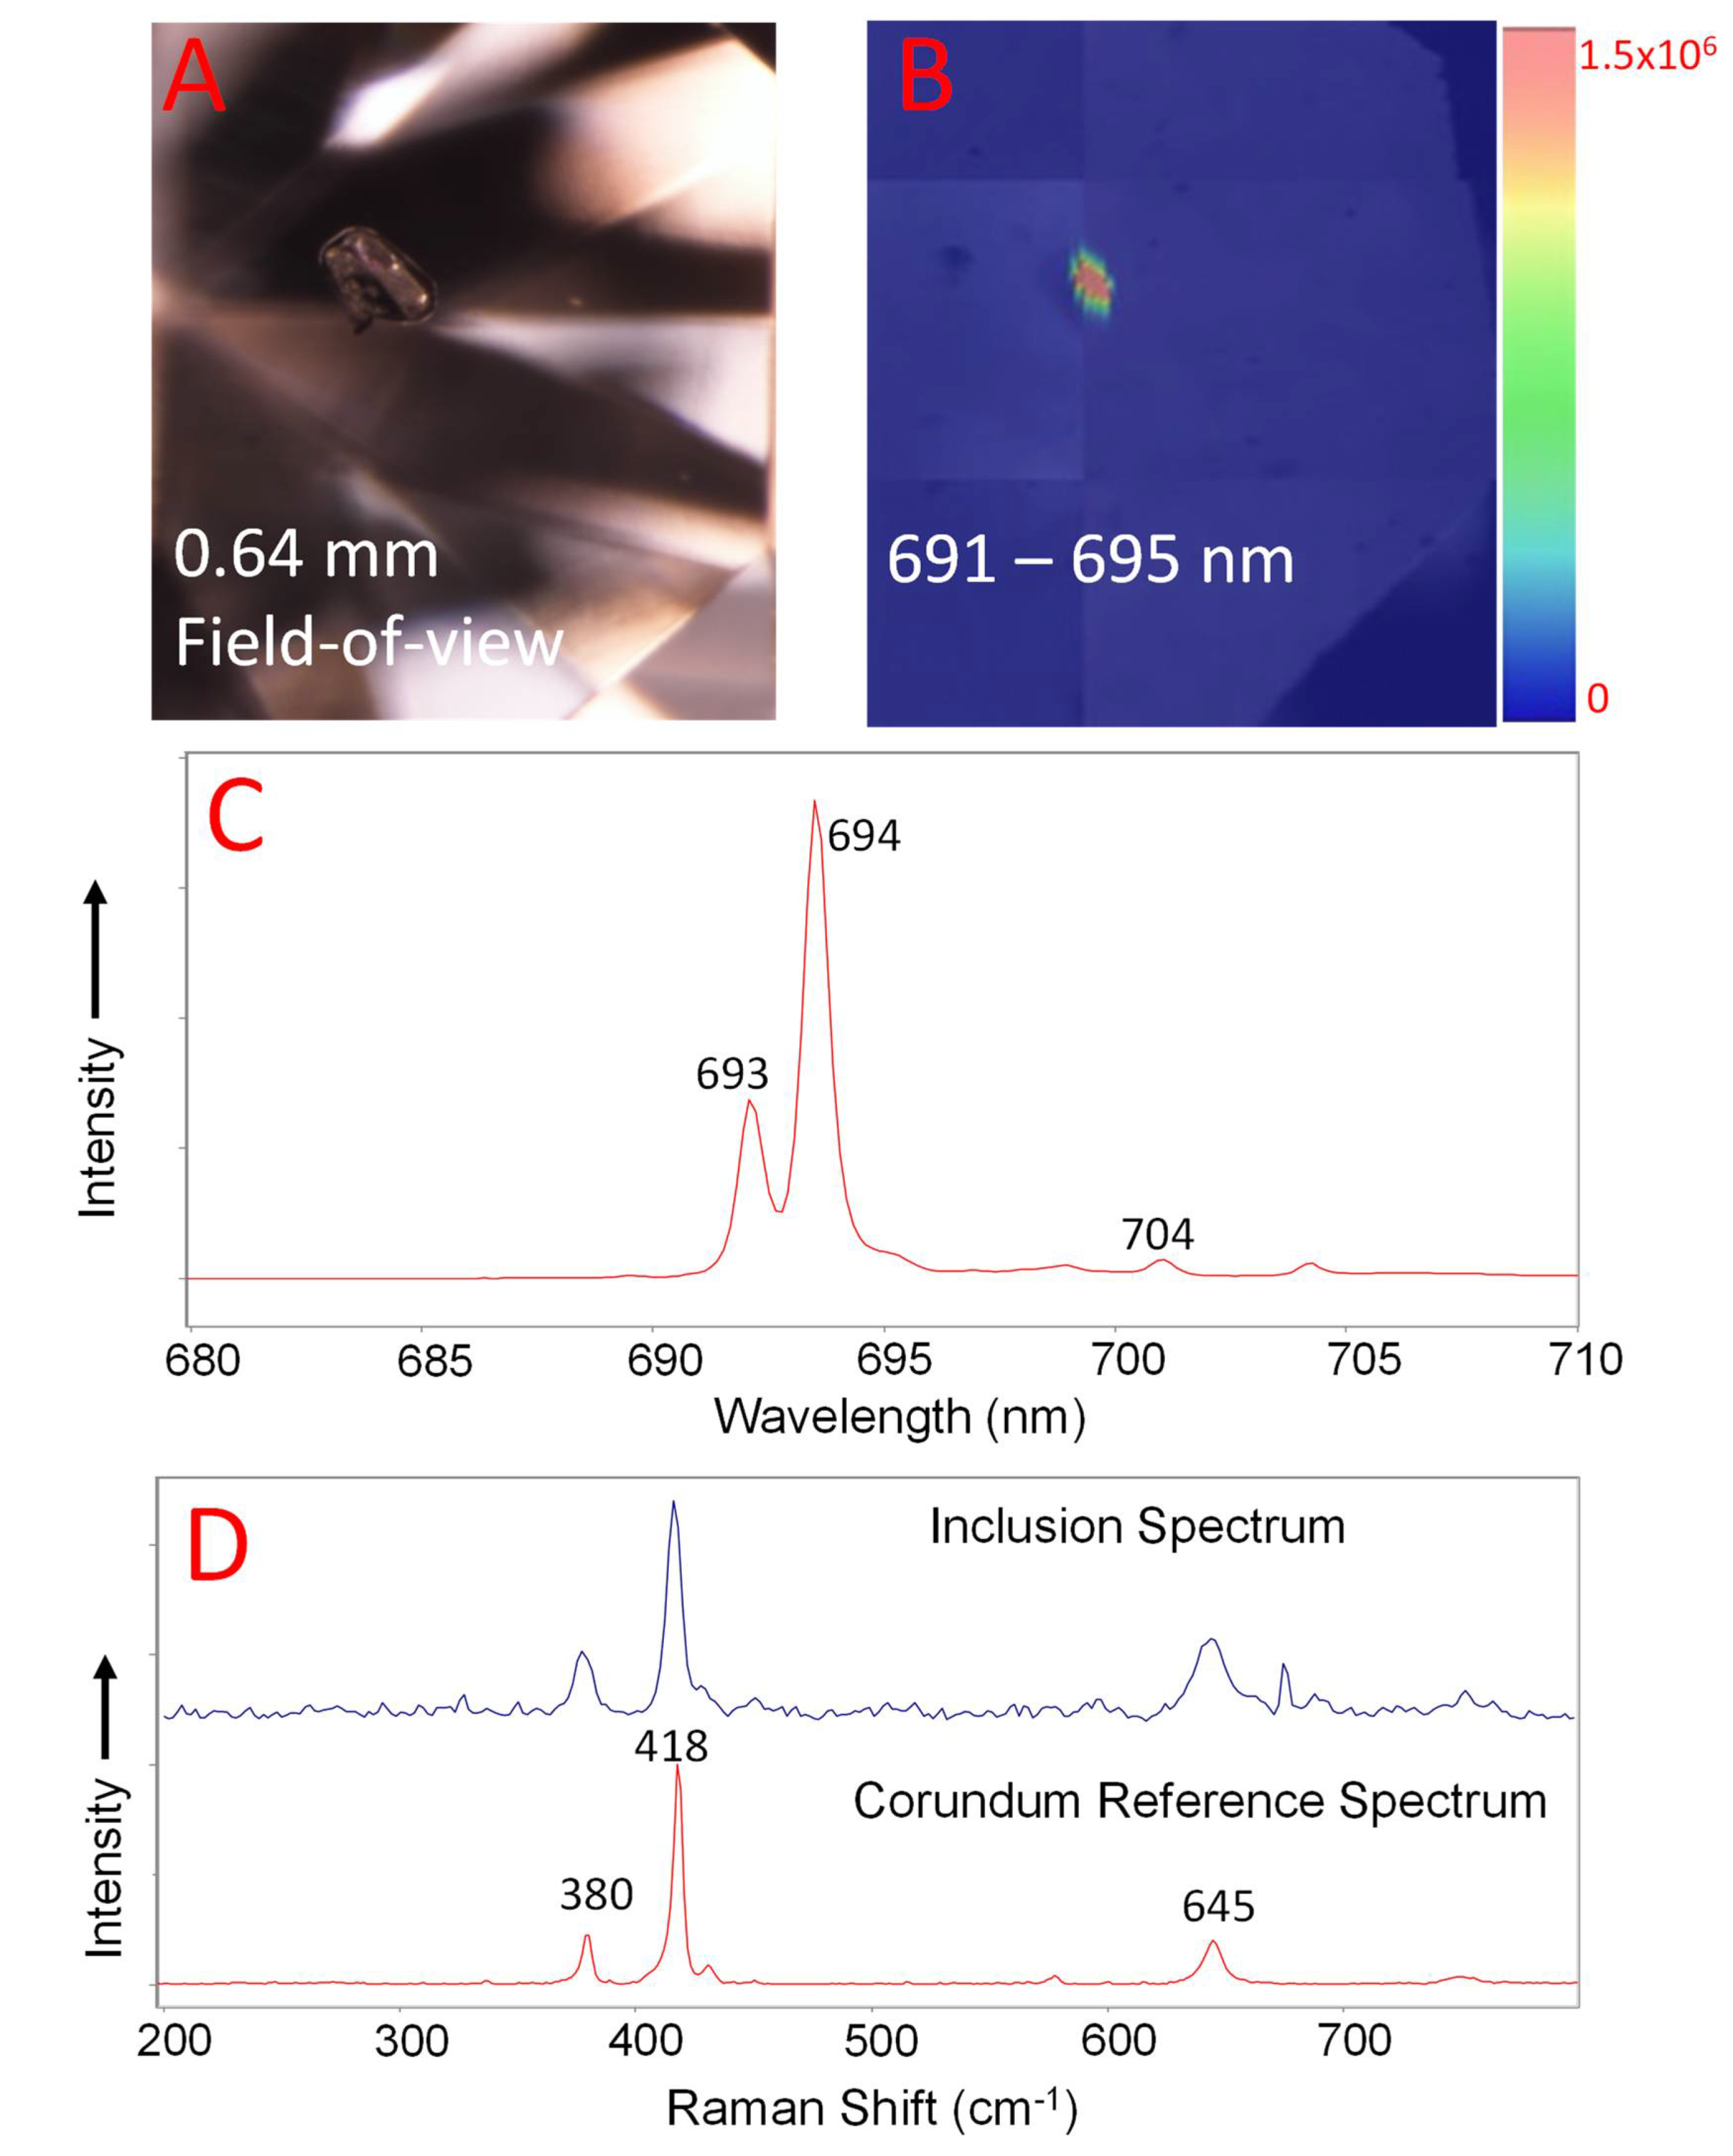
Photoluminescence mapping of another diamond showed chromium-related peaks at 693 and 694 nm, which were present at distinct positions. The specific locations of the chromium emission correlated to inclusions within the diamond (Figure 12). Raman spectroscopy identified numerous corundum inclusions ranging from 0.18 (Figure 12) to 0.07 mm in size. By viewing the inclusions with a diffuser plate, a pale pink color was observed through some of the inclusions. Compiling all this evidence, it was clear that the inclusions were corundum, either ruby or pink sapphire, in this gem-quality diamond. To our knowledge, these inclusions are the second occurrence of chromium-rich corundum (ruby or pink sapphire) found in a natural gem diamond [39].
Whether gemologists are searching for rare corundum inclusions in gem quality diamonds or finding inclusions that originated from the sub-lithosphere, using a Raman imaging microscope can be a great tool for diamond inclusion identification.

7. PL Mapping of Laboratory-Grown Diamonds

7.1. HPHT-Grown Diamonds

In the 1990s, DeBeers developed the DiamondView fluorescence imaging microscope (using ultra-shortwave excitation of ~225 nm) to distinguish HPHT-grown diamonds from their natural counterparts [40]. The basis for the DiamondView was that the growth morphology for HPHT synthetics is quite different from naturally grown diamonds. The distinct growth structure is vividly recorded within the fluorescence as the different growth sectors allowed for varying incorporation of the defects (Figure 13A). This difference in impurity concentration also revealed the outlines of the growth sectors. This underlying mechanism has also proven useful to study HPHT-grown diamonds by PL mapping (Figure 13B,C), which allows quantitative comparison of the detected defects and the ability to study the trends between them (Figure 13D). Thus, far more detailed analyses of the interrelationships of various defects are now possible.

7.2. CVD-Grown Diamonds

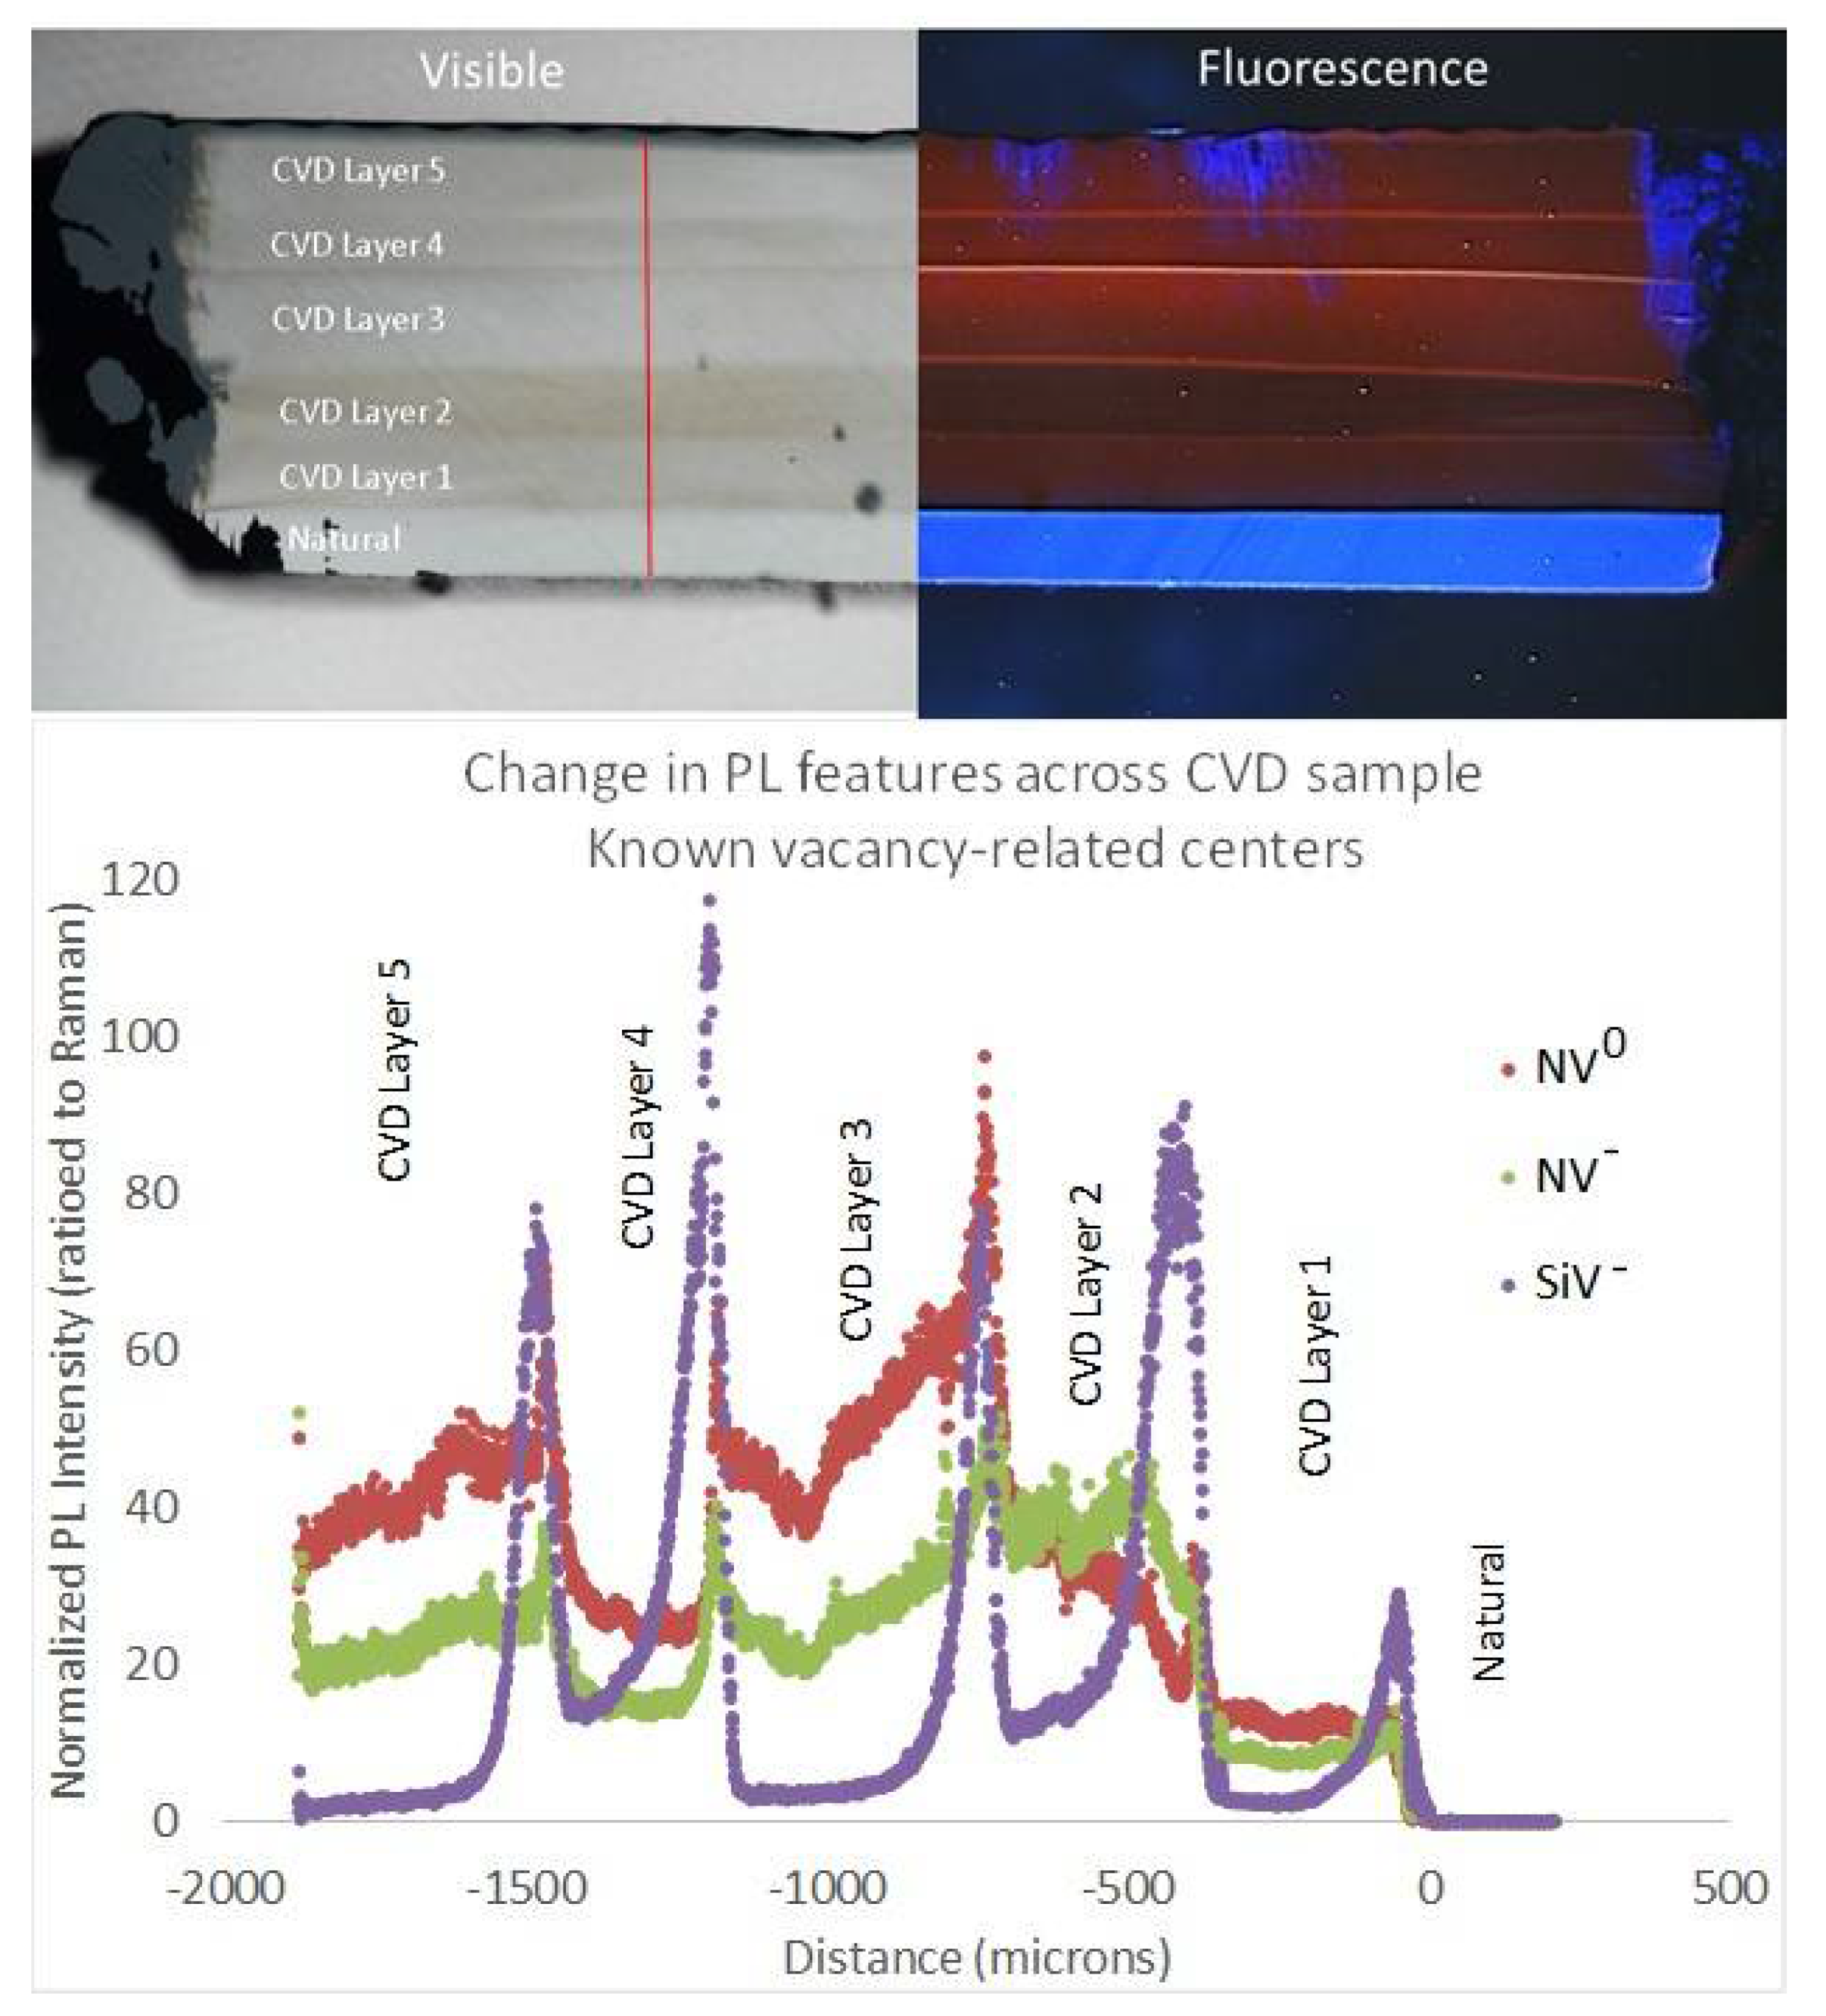
PL mapping has also proven useful for synthetic diamonds grown by the chemical vapor deposition (CVD) method; it has been helpful not only for identifying CVD-grown diamonds [41], but also to perform more fundamental research on the growth process. For example, with a DiamondView microscope, we can often and easily see a growth interface that indicates a stop/start growth event in CVD-grown diamonds. The fluorescence at that growth interface is often distinct and different from the fluorescence seen within the bulk of the CVD growth. PL mapping analyzed in greater detail the defects that are detected within that interface and how those compare with the bulk of the CVD growth layer (Figure 14). These maps show a number of differences between the layers and an increased concentration of vacancy-related defects at the interfaces that decreases with growth time within each layer.

8. Blue Sapphire: Geographic Origin Determination

Over the last few decades, geographic origin determination has become a major motivating force in gemological research. As the gem and jewelry industry has migrated towards using a gem’s geographic origin as a factor in determining value, they have relied on gemological laboratories to determine origin based on gemological, physical, and chemical properties. However, as the number of economically important gem deposits has increased in modern times, so has the overlap in properties of stones from geographically distinct deposits.
The problem can be particularly acute in the case of metamorphic blue sapphires such as those found in Sri Lanka, Myanmar, Indian Kashmir, and Madagascar [42]. There exists significant overlap in the trace element profiles for sapphires from these deposits; therefore, the gemologist must rely largely on microscopic observations in order to conclude a stone’s geographic origin. The most common inclusions observed in the microscope are fine particles of rutile that are often crystallographically aligned with the corundum host and called “silk” by the gemologist. Studying differences in the pattern of his “silk” and comparing against references stones with known provenance can often help to determine a stone’s geographic origin.
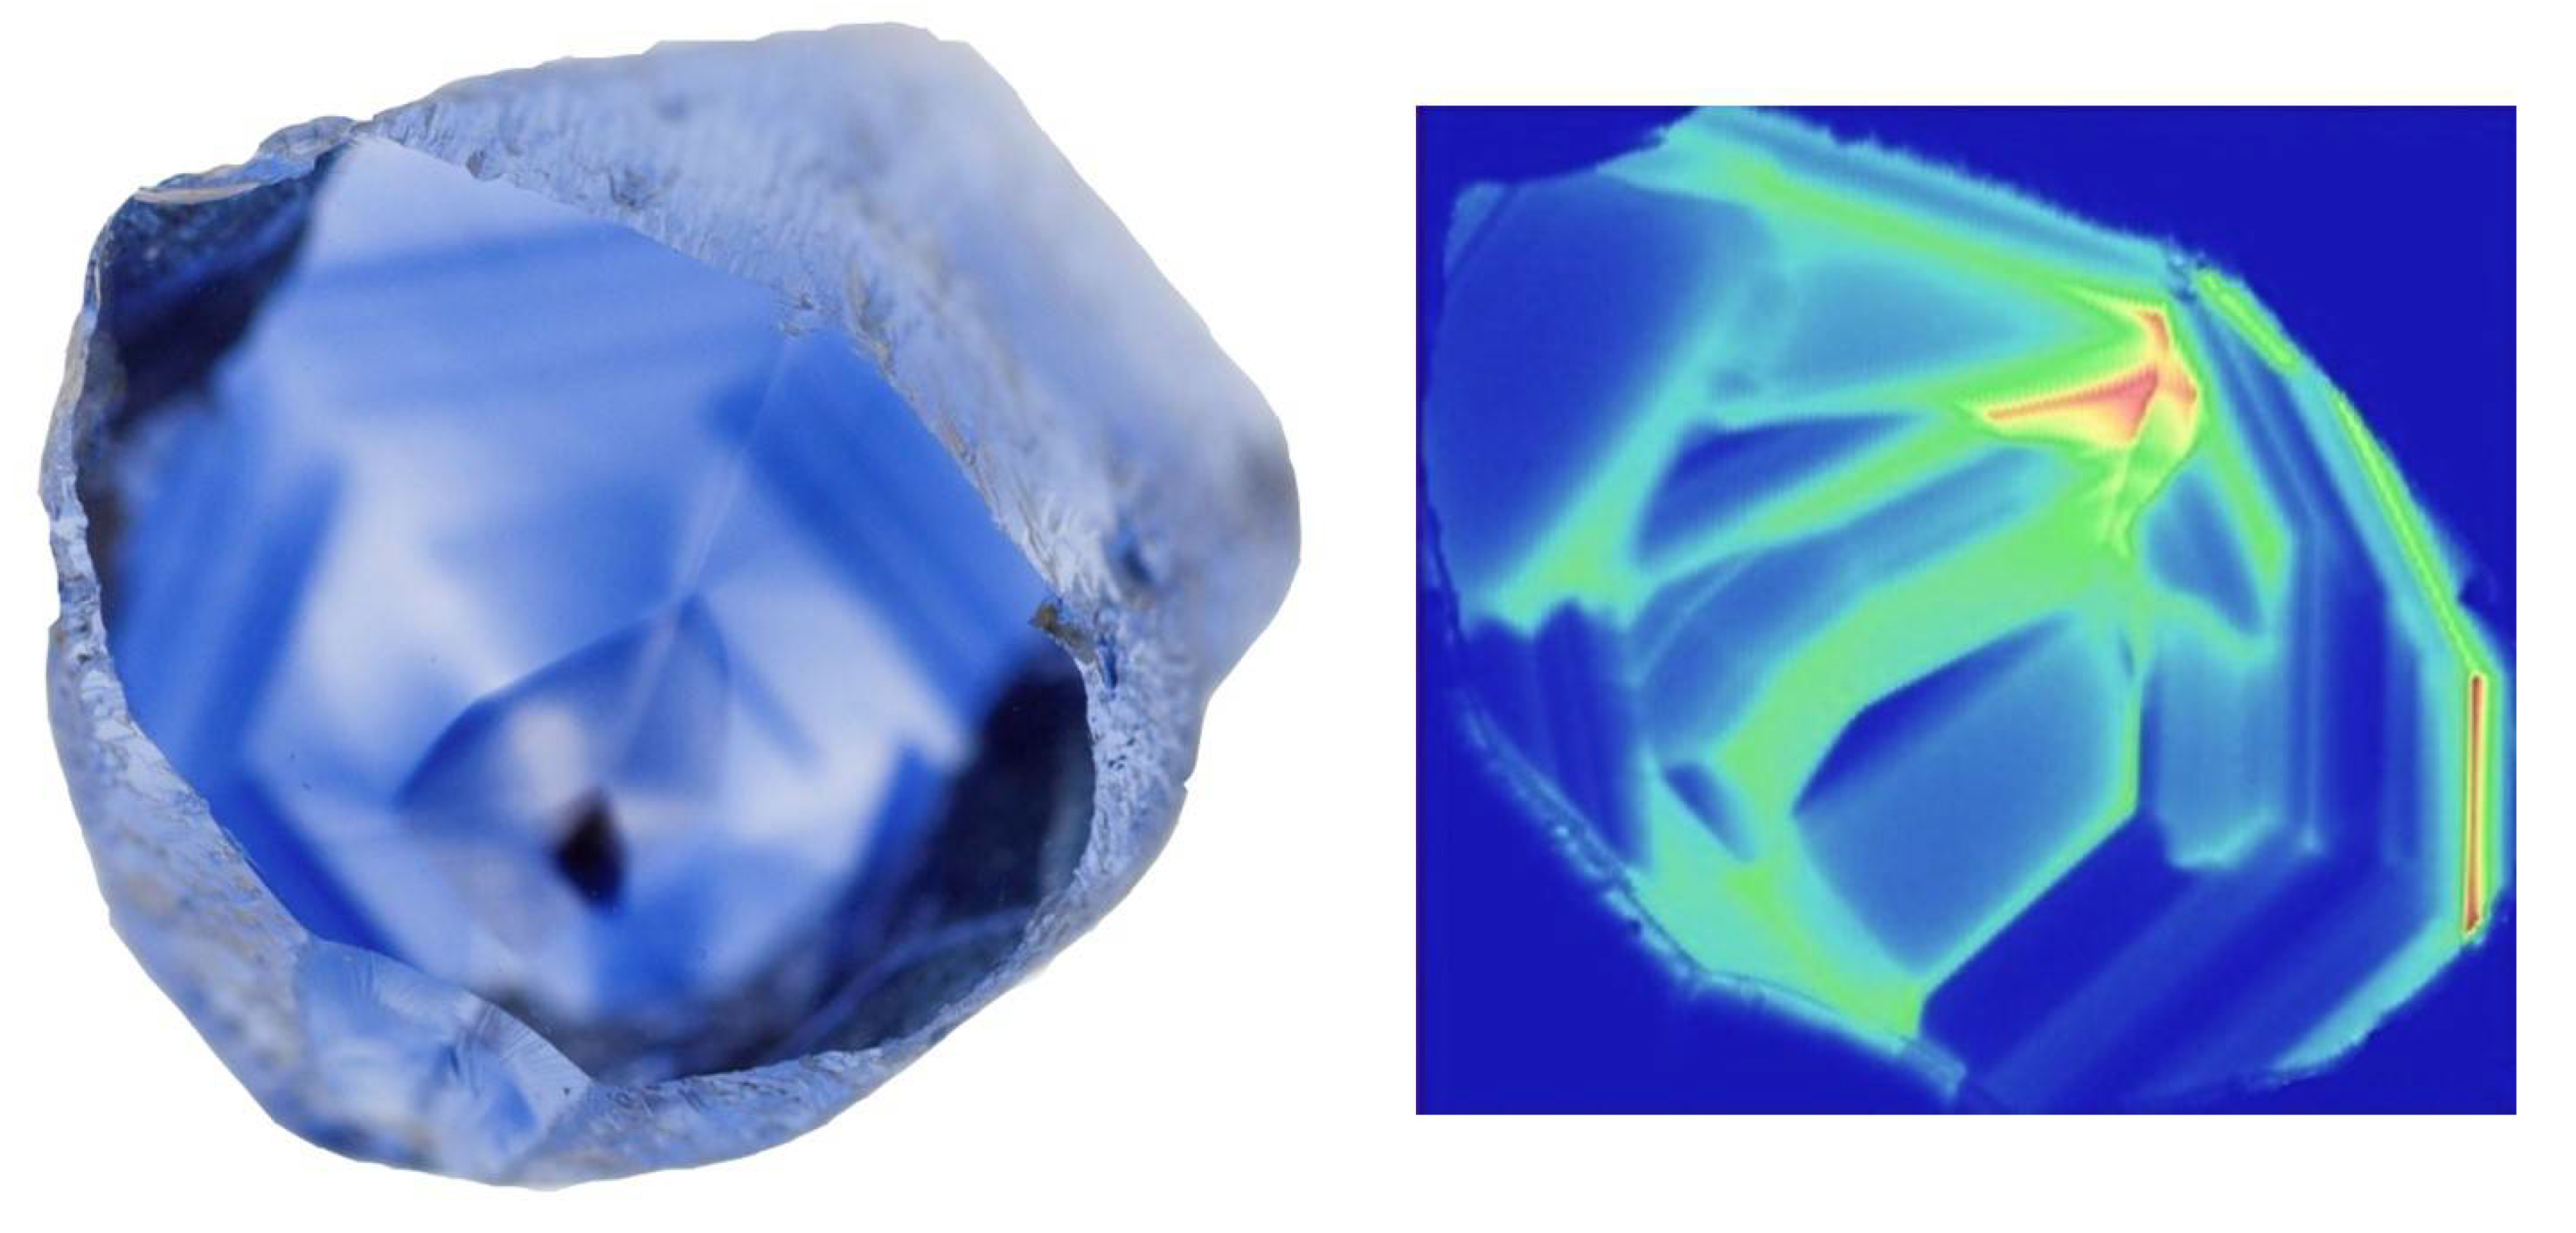
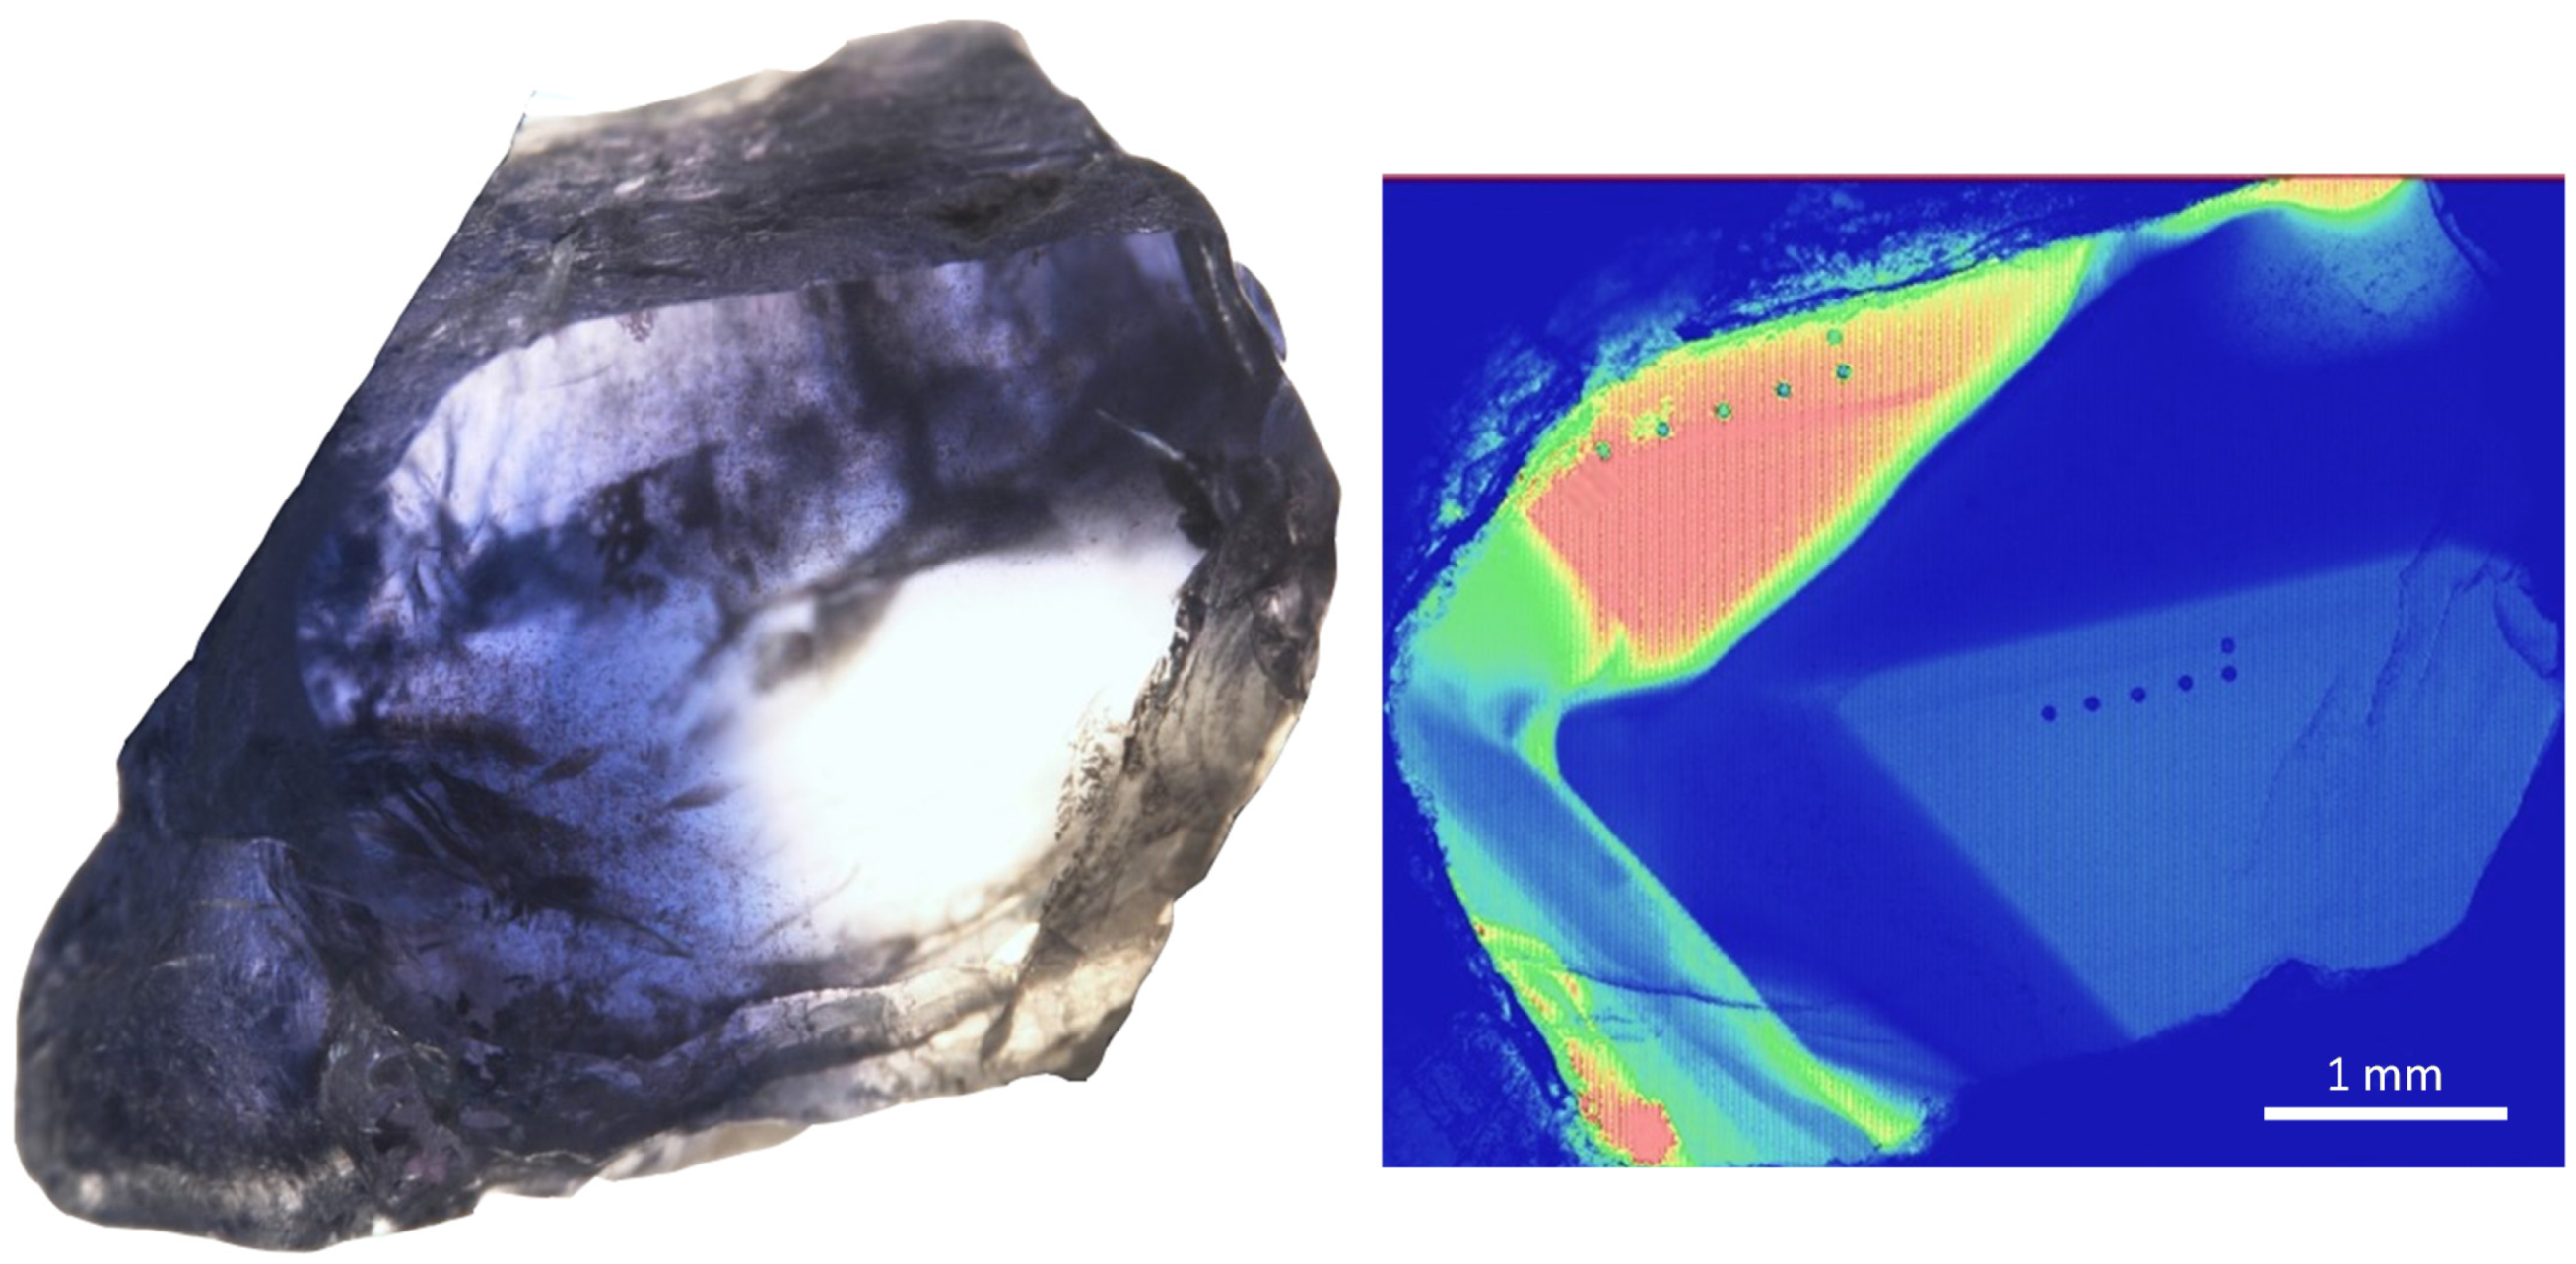
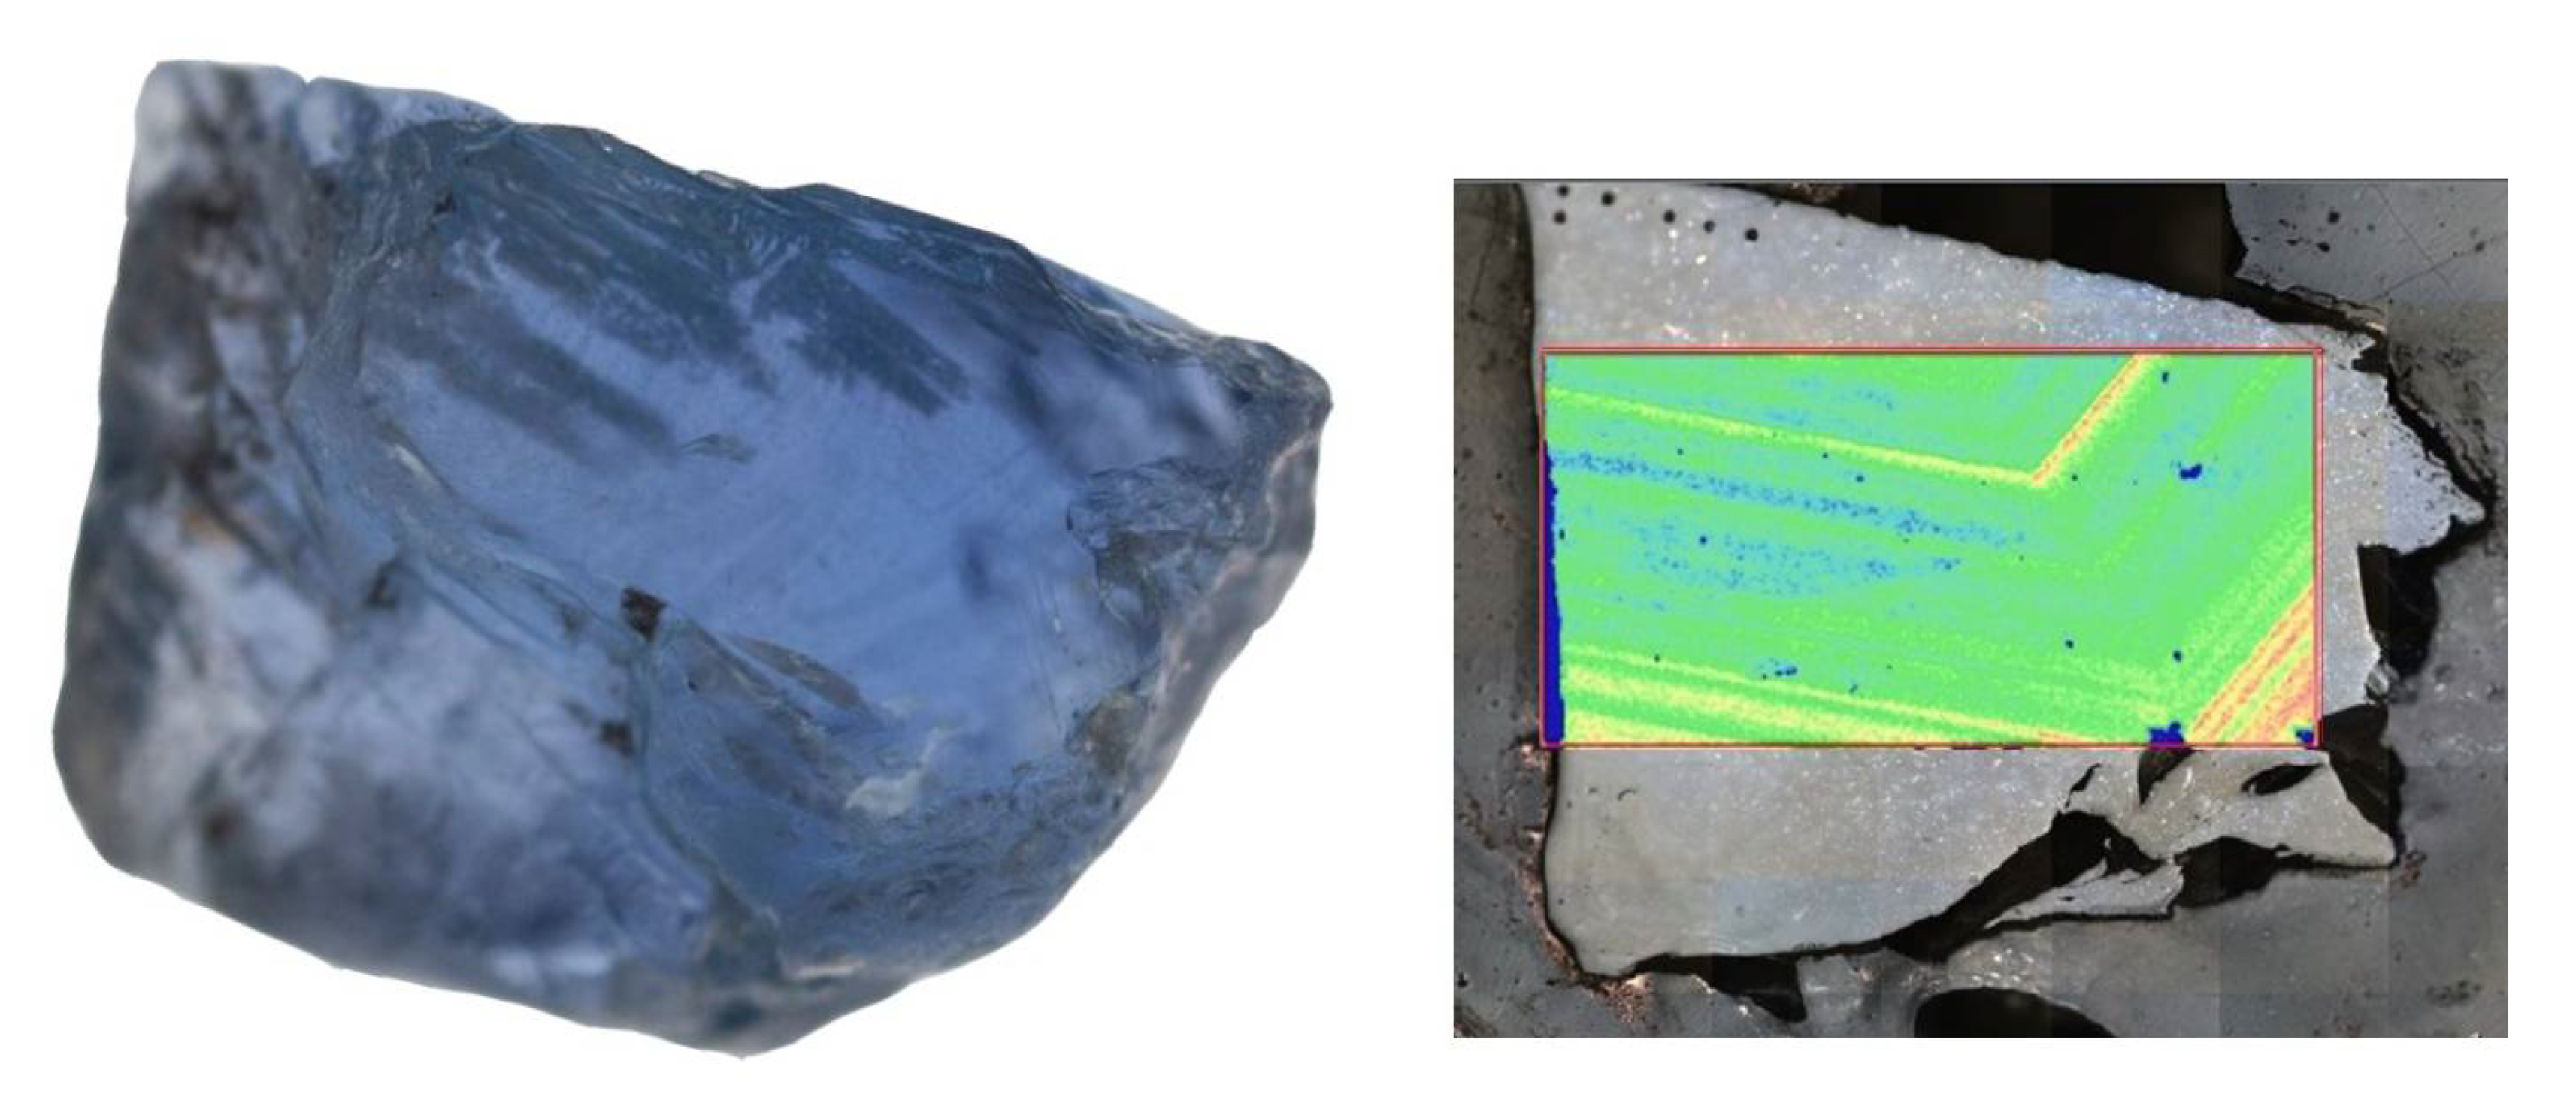
Another feature that can aid in this endeavor is the presence/absence of color zoning. Sapphires from Madagascar or Sri Lanka may show dramatic color zoning with alternating blue and colorless zones constrained to follow specific crystallographic planes and can track the crystal growth history of the gems. The blue color is derived from absorption of red light through an intervalence charge transfer between Fe2+ and Ti4+ sitting on adjacent octahedral sites in the corundum structure [43]; therefore, the oscillatory zoning indicates differences in the chemical environment during growth involving not only iron (Fe) and titanium (Ti) but also potentially magnesium (Mg) and silicon (Si) [44]. In Madagascar and Sri Lankan sapphires, the color zoning usually occurs with very sharp boundaries between blue and colorless zones and generally follows a hexagonal pattern when looking down the c-axis (Figure 15). On the other hand, Burmese sapphires often have very homogeneous blue coloration, or at most, they may show color zoning with diffuse boundaries between blue and colorless zones, where the blue gradually transitions into colorless (Figure 16). In this case, the color zoning preserves information about the unique geological forces that created these gems and can be used to help determine a stone’s geographic origin.
Using color zoning to provide information on geographic origin is essentially using information about the spatial distribution of trace elements, specifically Fe and Ti in the case of sapphires. Hypothetically, having the ability to map out distributions of any trace elements in corundum may also provide additional information that could provide a unique fingerprint leading back to a stone’s geographic origin. Trace element mapping with laser ablation–inductively coupled plasma–mass spectrometry (LA-ICP-MS) has been performed on gem corundum before (e.g., [45]), but the LA-ICP-MS mapping method is time-intensive and destructive. Another option is to use PL mapping to look for variations in the intensity of the Cr3+ luminescence peaks centered at 692.9 and 694.3 nm (see, for example, Figure 12C) in order to map out variation in chromium (Cr) concentrations within a single crystal. PL mapping has been used before to delineate the crystal growth history of rubies and blue sapphires from Yogo Gulch, Montana [15,46]. Of particular note is that the distribution of Cr in Yogo sapphires can reveal complicated growth patterns that would not be visible in these sapphires that otherwise show homogeneous distribution of color and other trace elements. For whatever reason, Cr often seems to become incorporated very differently in corundum than the other trace elements (e.g., [47]). PL maps were produced for the sharply blue-zoned Madagascar sapphire in Figure 15 and the diffuse-zoned Burmese sapphire in Figure 16. In both cases, the Cr-distribution identified by PL mapping correlates well with the observed color zoning. In some cases, however, PL mapping can shed light on crystal growth patterns that do not show up through observation of color zoning (Figure 17).
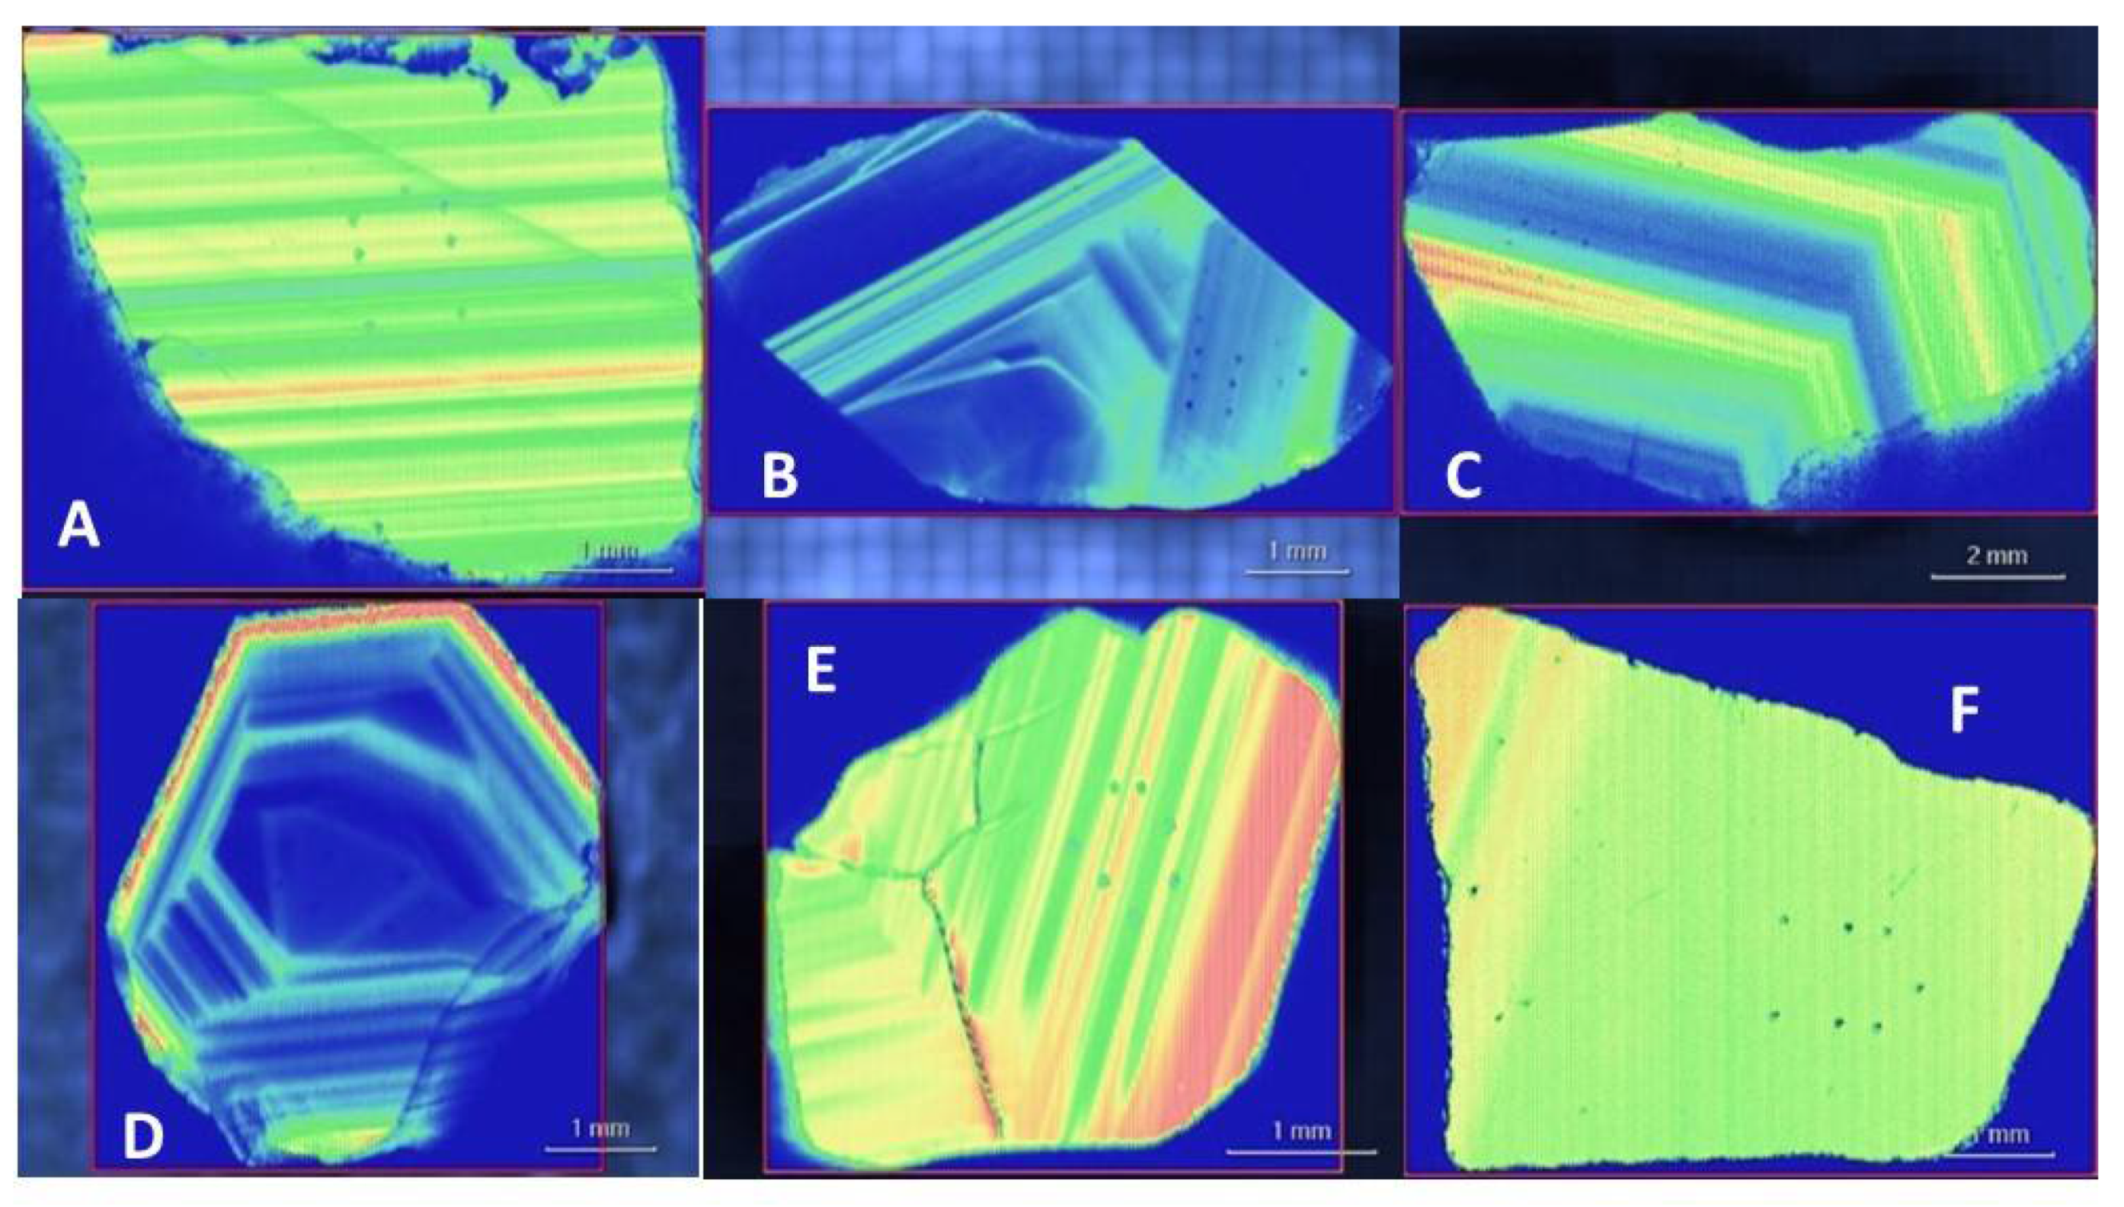
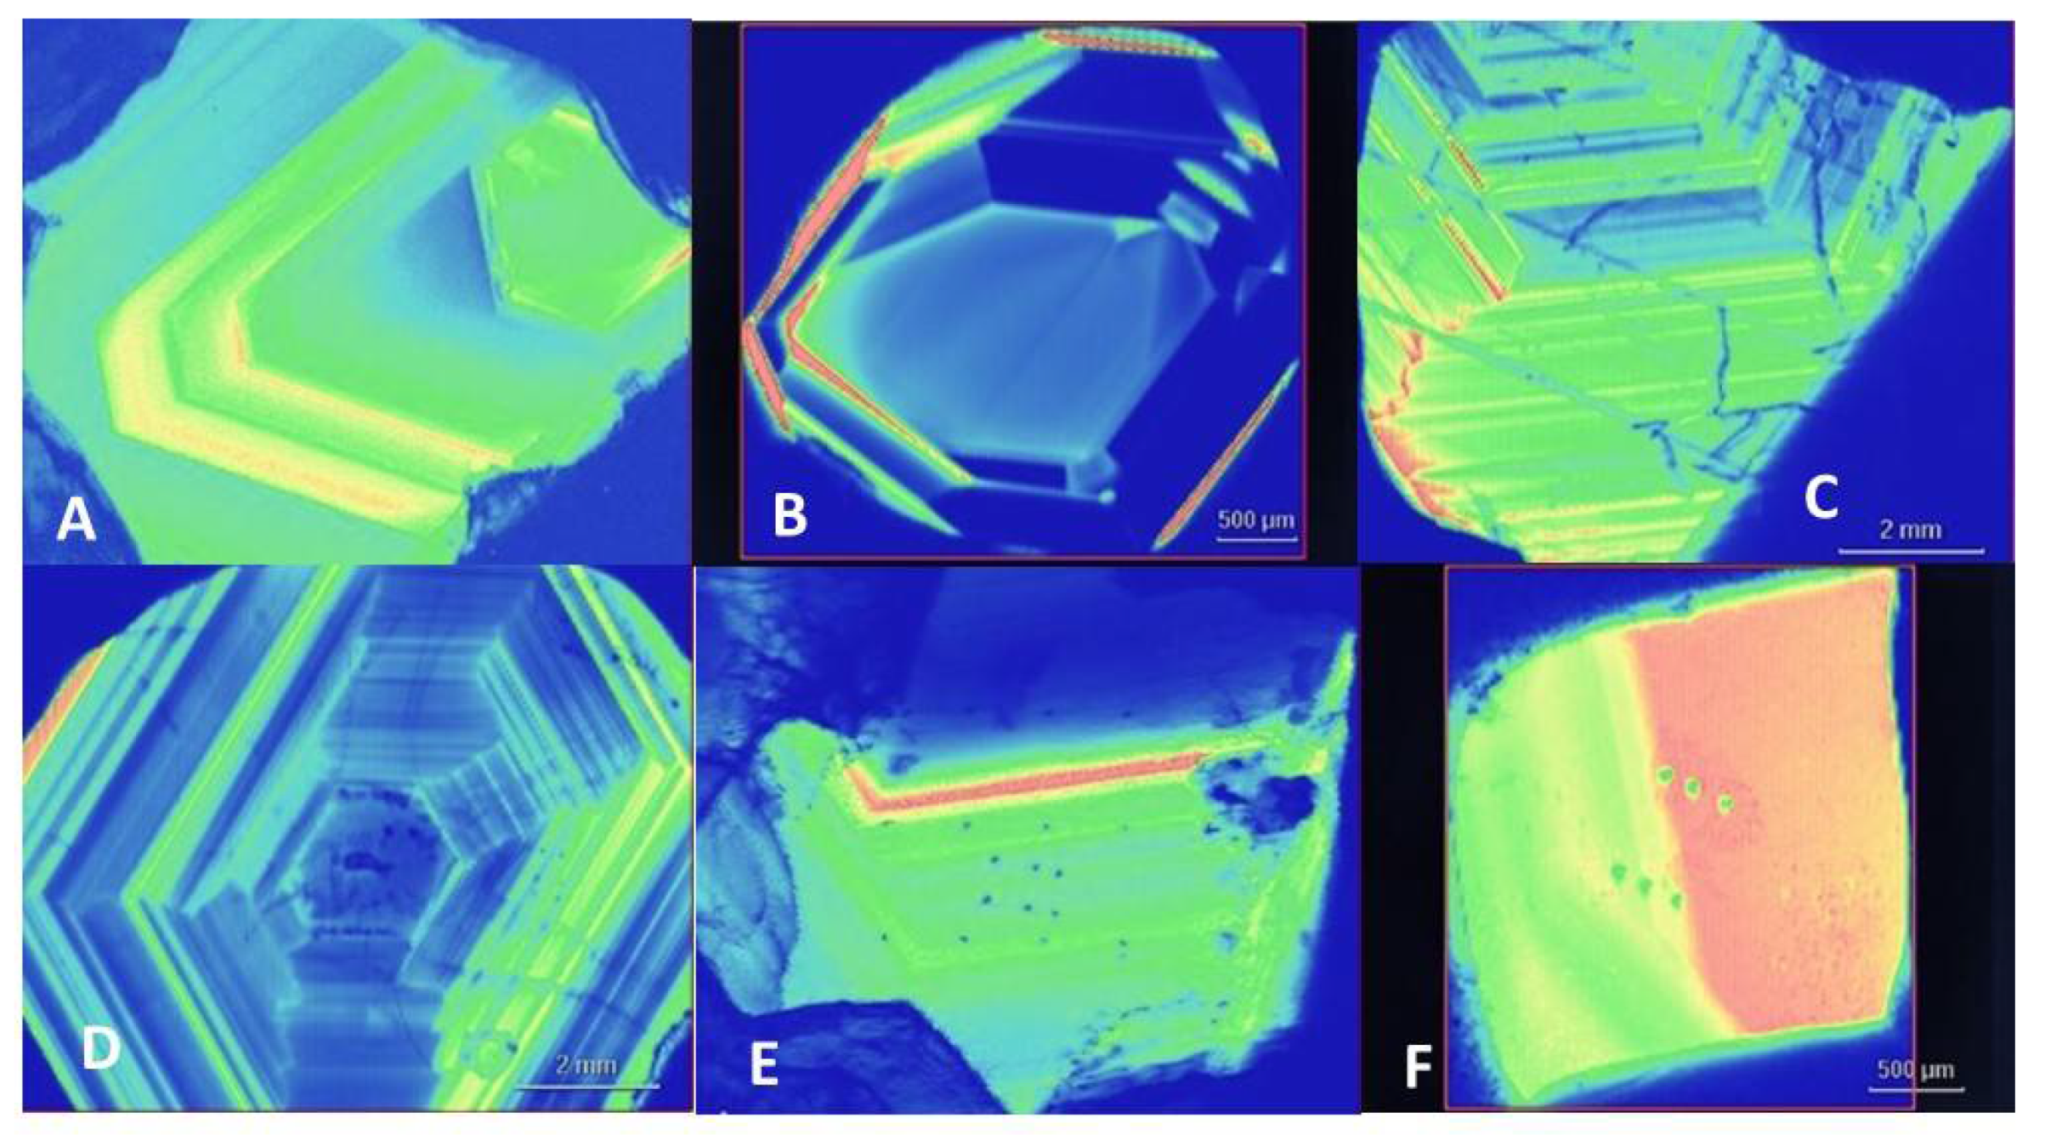
Sapphires from Madagascar, Sri Lanka, and Burma were included in this preliminary study to determine if PL mapping of Cr3+ luminescence can aid in geographic origin determination of metamorphic blue sapphires. The sapphires studied here were all cut as wafers with the corundum c-axis perpendicular to the polished faces in order to keep the orientation consistent for this initial work. Several representative examples of Cr-distribution maps for each locale are shown in Figure 18, Figure 19 and Figure 20. In general, the Cr maps seem to follow the same general trends seen with color zoning in these stones, with sharp, dramatic Cr-zoning being common in Sri Lankan and Madagascar sapphires and generally subtler Cr-zoning being more common in Burmese sapphires. Observation of angular, hexagonal banding is more common in Madagascar and Sri Lankan sapphires. Notably, the cores of several of these sapphires seem to show complex initial growth patterns involving growth along more than one crystal form involving more than one set of planes (Figure 18B,D and Figure 19B). However, Burmese sapphires are more likely to have homogeneous distributions of Cr (Figure 20A) or bands of Cr enrichment with diffuse boundaries (Figure 20B,C). Less commonly, Burmese sapphires may show Cr-enriched bands with sharper boundaries (Figure 20D).
However, these generalizations do not cover the full range of possibilities for Cr maps seen for these deposits. For instance, some Burmese sapphires will occasionally show distinct angular banding in their Cr distribution maps. The Cr maps for the Burmese sapphires in Figure 17 and Figure 20D,F appear to be nearly indistinguishable from those shown for Madagascar or Sri Lankan sapphires in Figure 18A,C and Figure 19E. Additionally, some Sri Lankan and Madagascar sapphires will show only diffuse zones of Cr enrichment, as in Figure 18F and Figure 19F, which may not be distinguishable from the typical patterns seen for Burmese sapphires. However, the more complex growth patterns seen in some Sri Lankan and Madagascar sapphires which deviate from the strict angular banding with hexagonal geometry (Figure 18B,D,E and Figure 19A–D) have never been seen in Burmese sapphires. Observation of this type of growth through PL mapping could be useful to exclude Burma as a possible origin for some challenging cases of origin determination. Further work is needed to more clearly delineate how and when PL mapping can be useful for geographic origin determination of metamorphic blue sapphires. Future research should also focus on the potential use of PL mapping for geographic origin determination of basalt-related blue sapphires as well as rubies.

9. Raman Mapping of Tourmaline for Species Classification

In gemology, LA-ICP-MS has been used to analyze both major and trace elements of gem quality tourmaline for geographic origin determination [49,50] and species classification [51]. The localized analytical technique produces a representative composition of the gemstone, and thus, species identification, if the sample is chemically homogeneous. However, many tourmaline gems are zoned and information may be missed if the tourmaline is chemically heterogeneous. Raman mapping can be used as an alternative method to chemically characterize the sample at a small scale and resolve this issue.
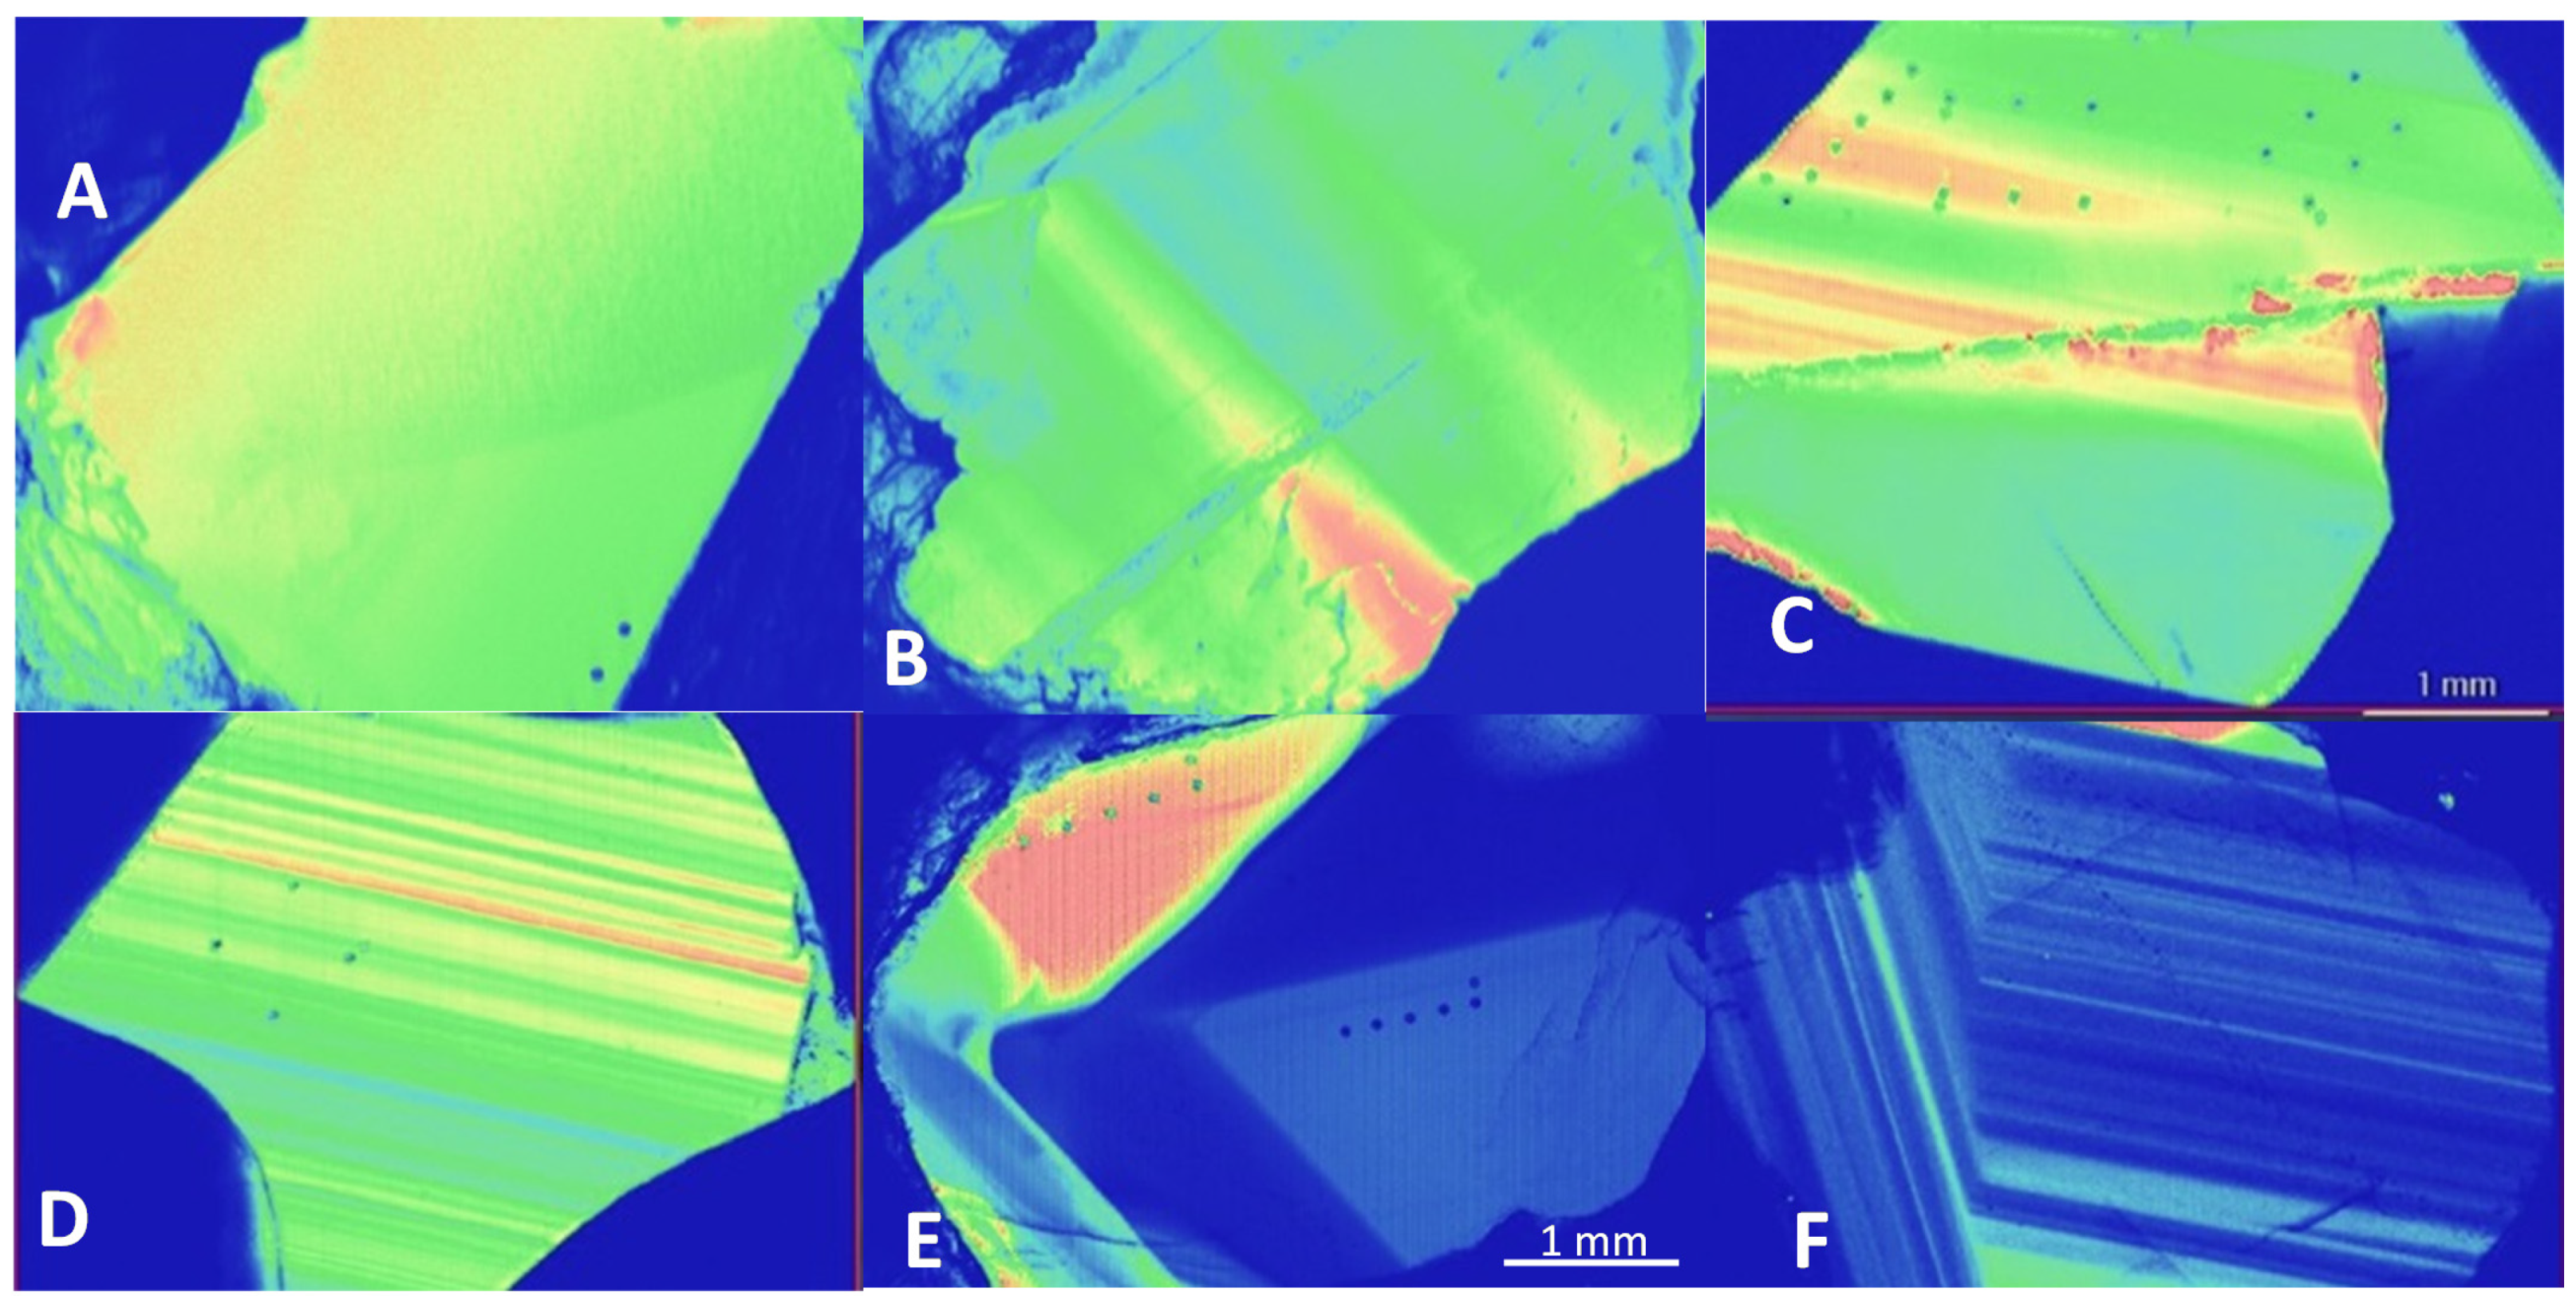
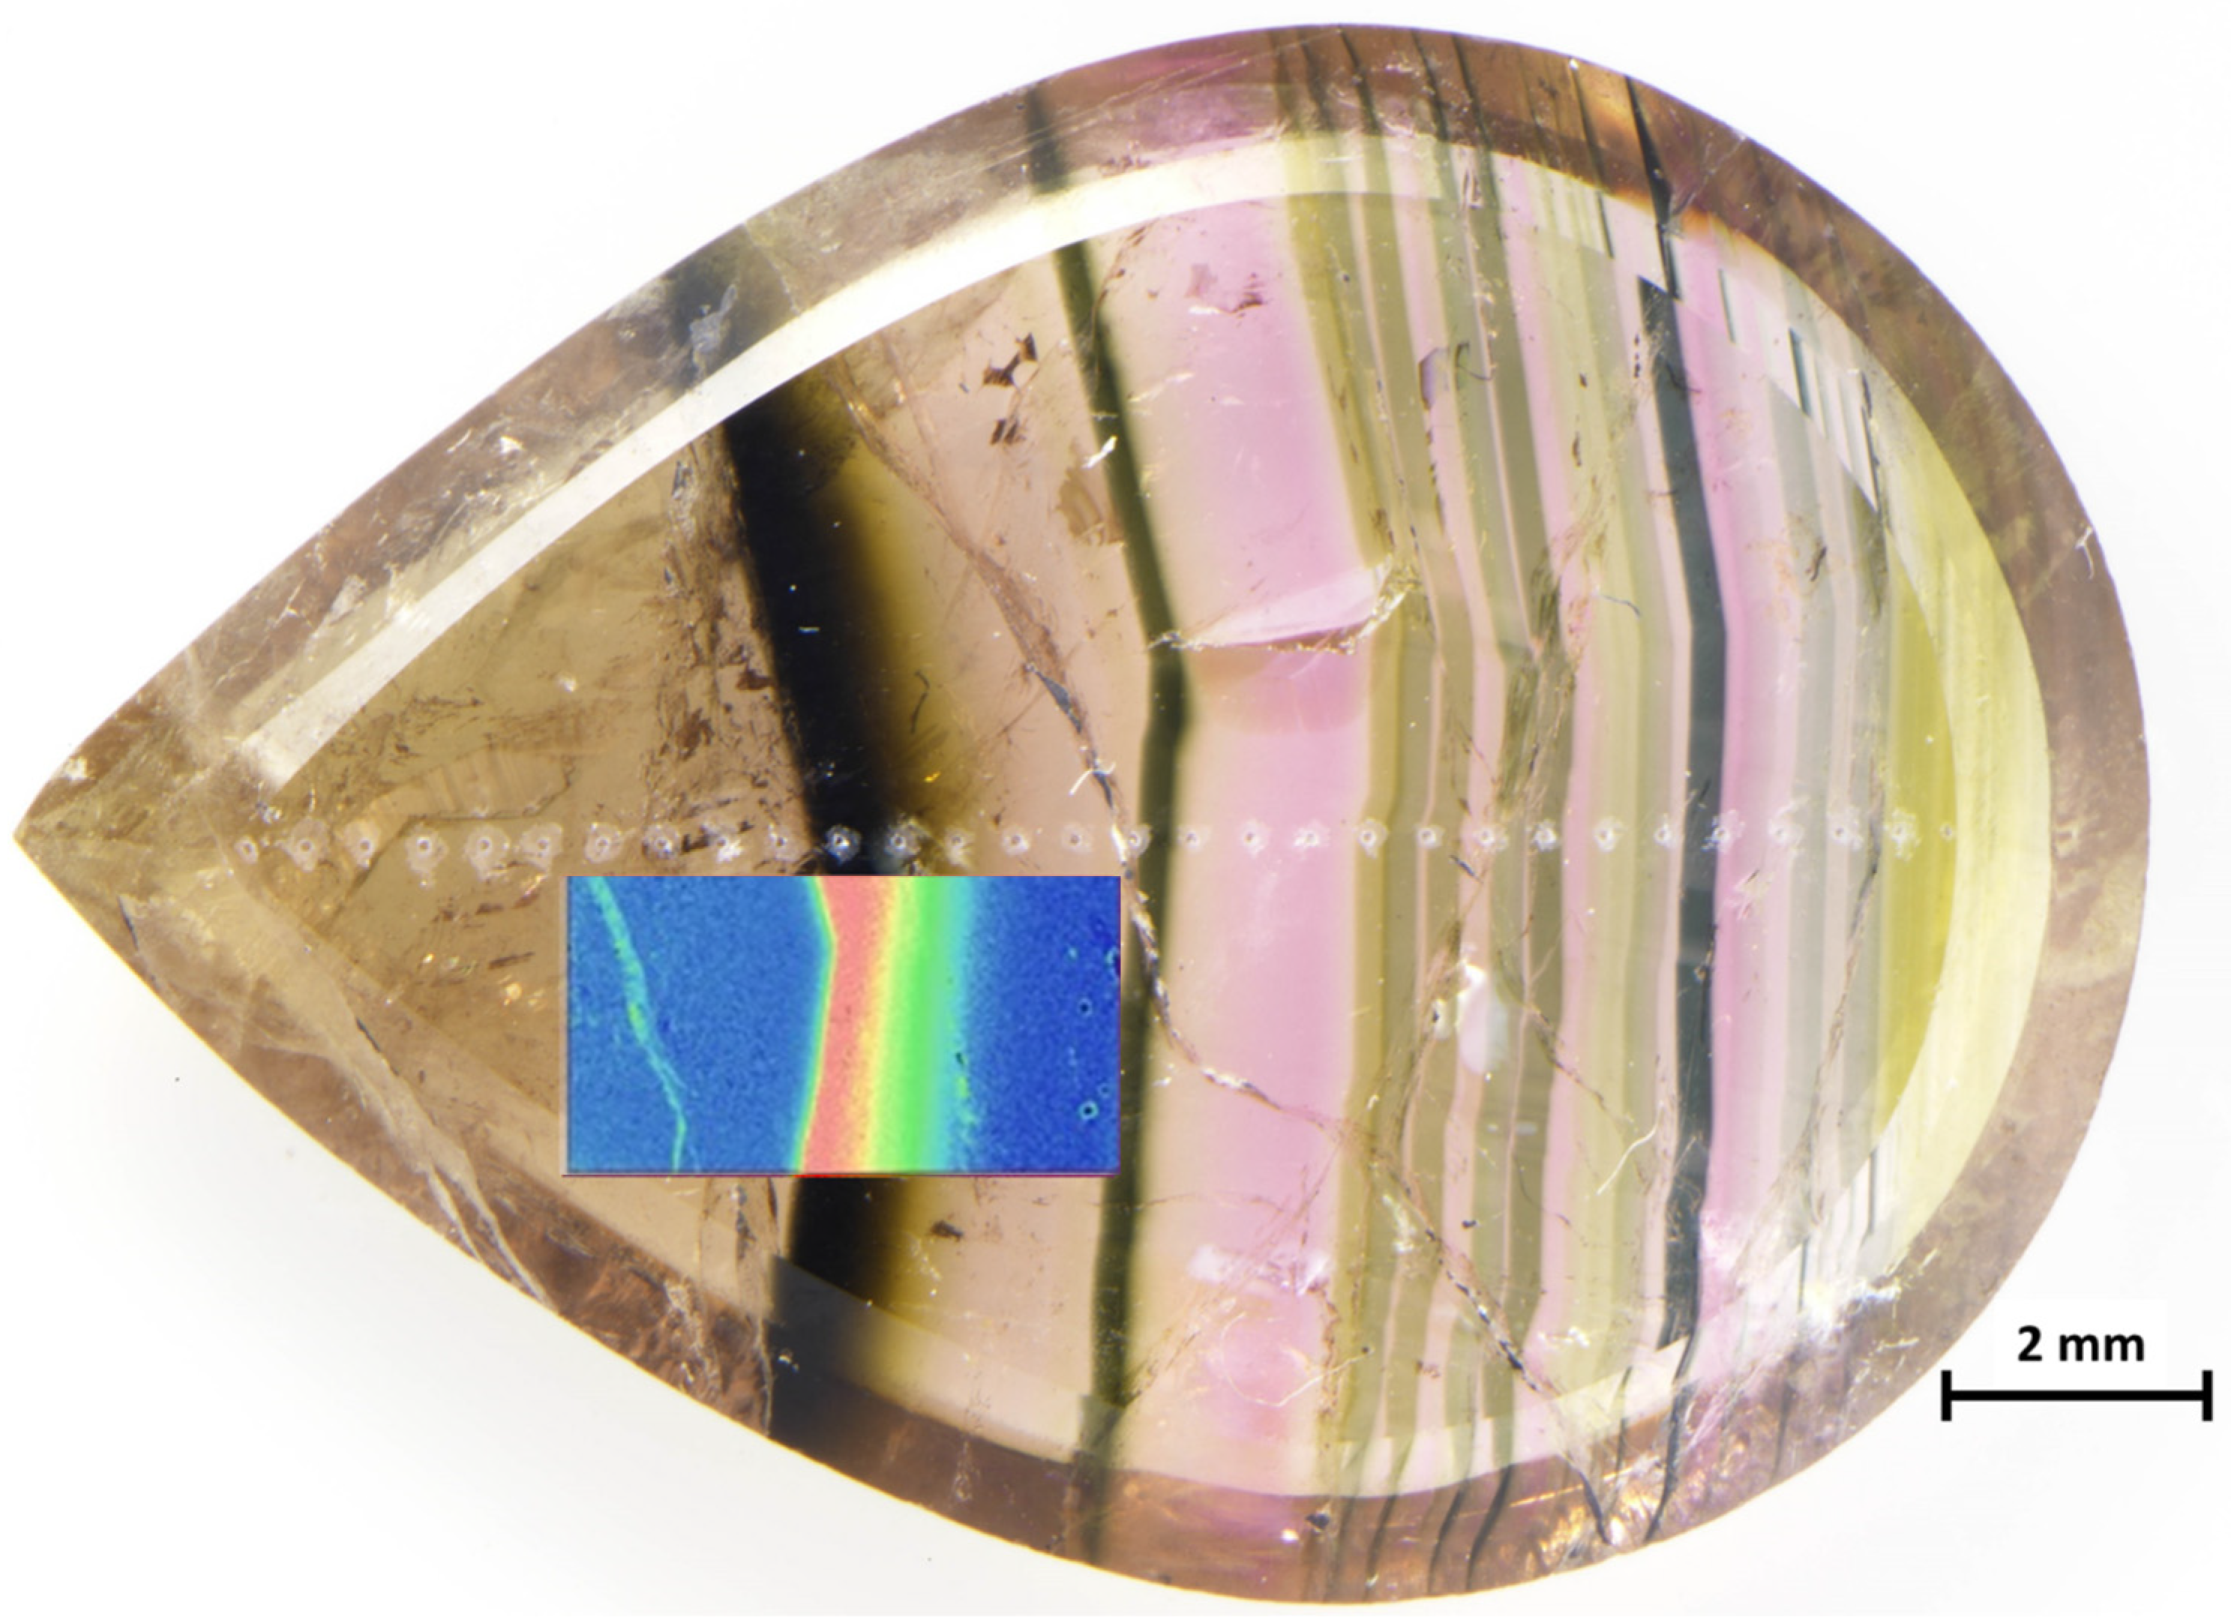
Tourmalines from Anjanabonoina, Madagascar are known for their complex color zoning. Chemical analyses suggest that the zones are composed of elbaite and liddicoatite [52], similar to the pear-shaped tourmaline sample shown in Figure 21. A traverse of LA-ICP-MS analyses were performed across the length of the sample. Using these data, the two laser ablation areas on the thickest black band of the sample in Figure 21 were classified as elbaite [51], the sodium-, lithium-, aluminum-rich tourmaline species (e.g., [53]). The remaining areas were classified as liddicoatite, the calcium-, lithium-, aluminum-rich tourmaline species. Obviously, one will not always have the luxury to place several laser ablation spots on the table of a fine gemstone. However, Raman mapping offers a new tool to identify tourmaline species and to study the chemical zoning of a gem tourmaline in an accurate, non-destructive, and acceptable way.
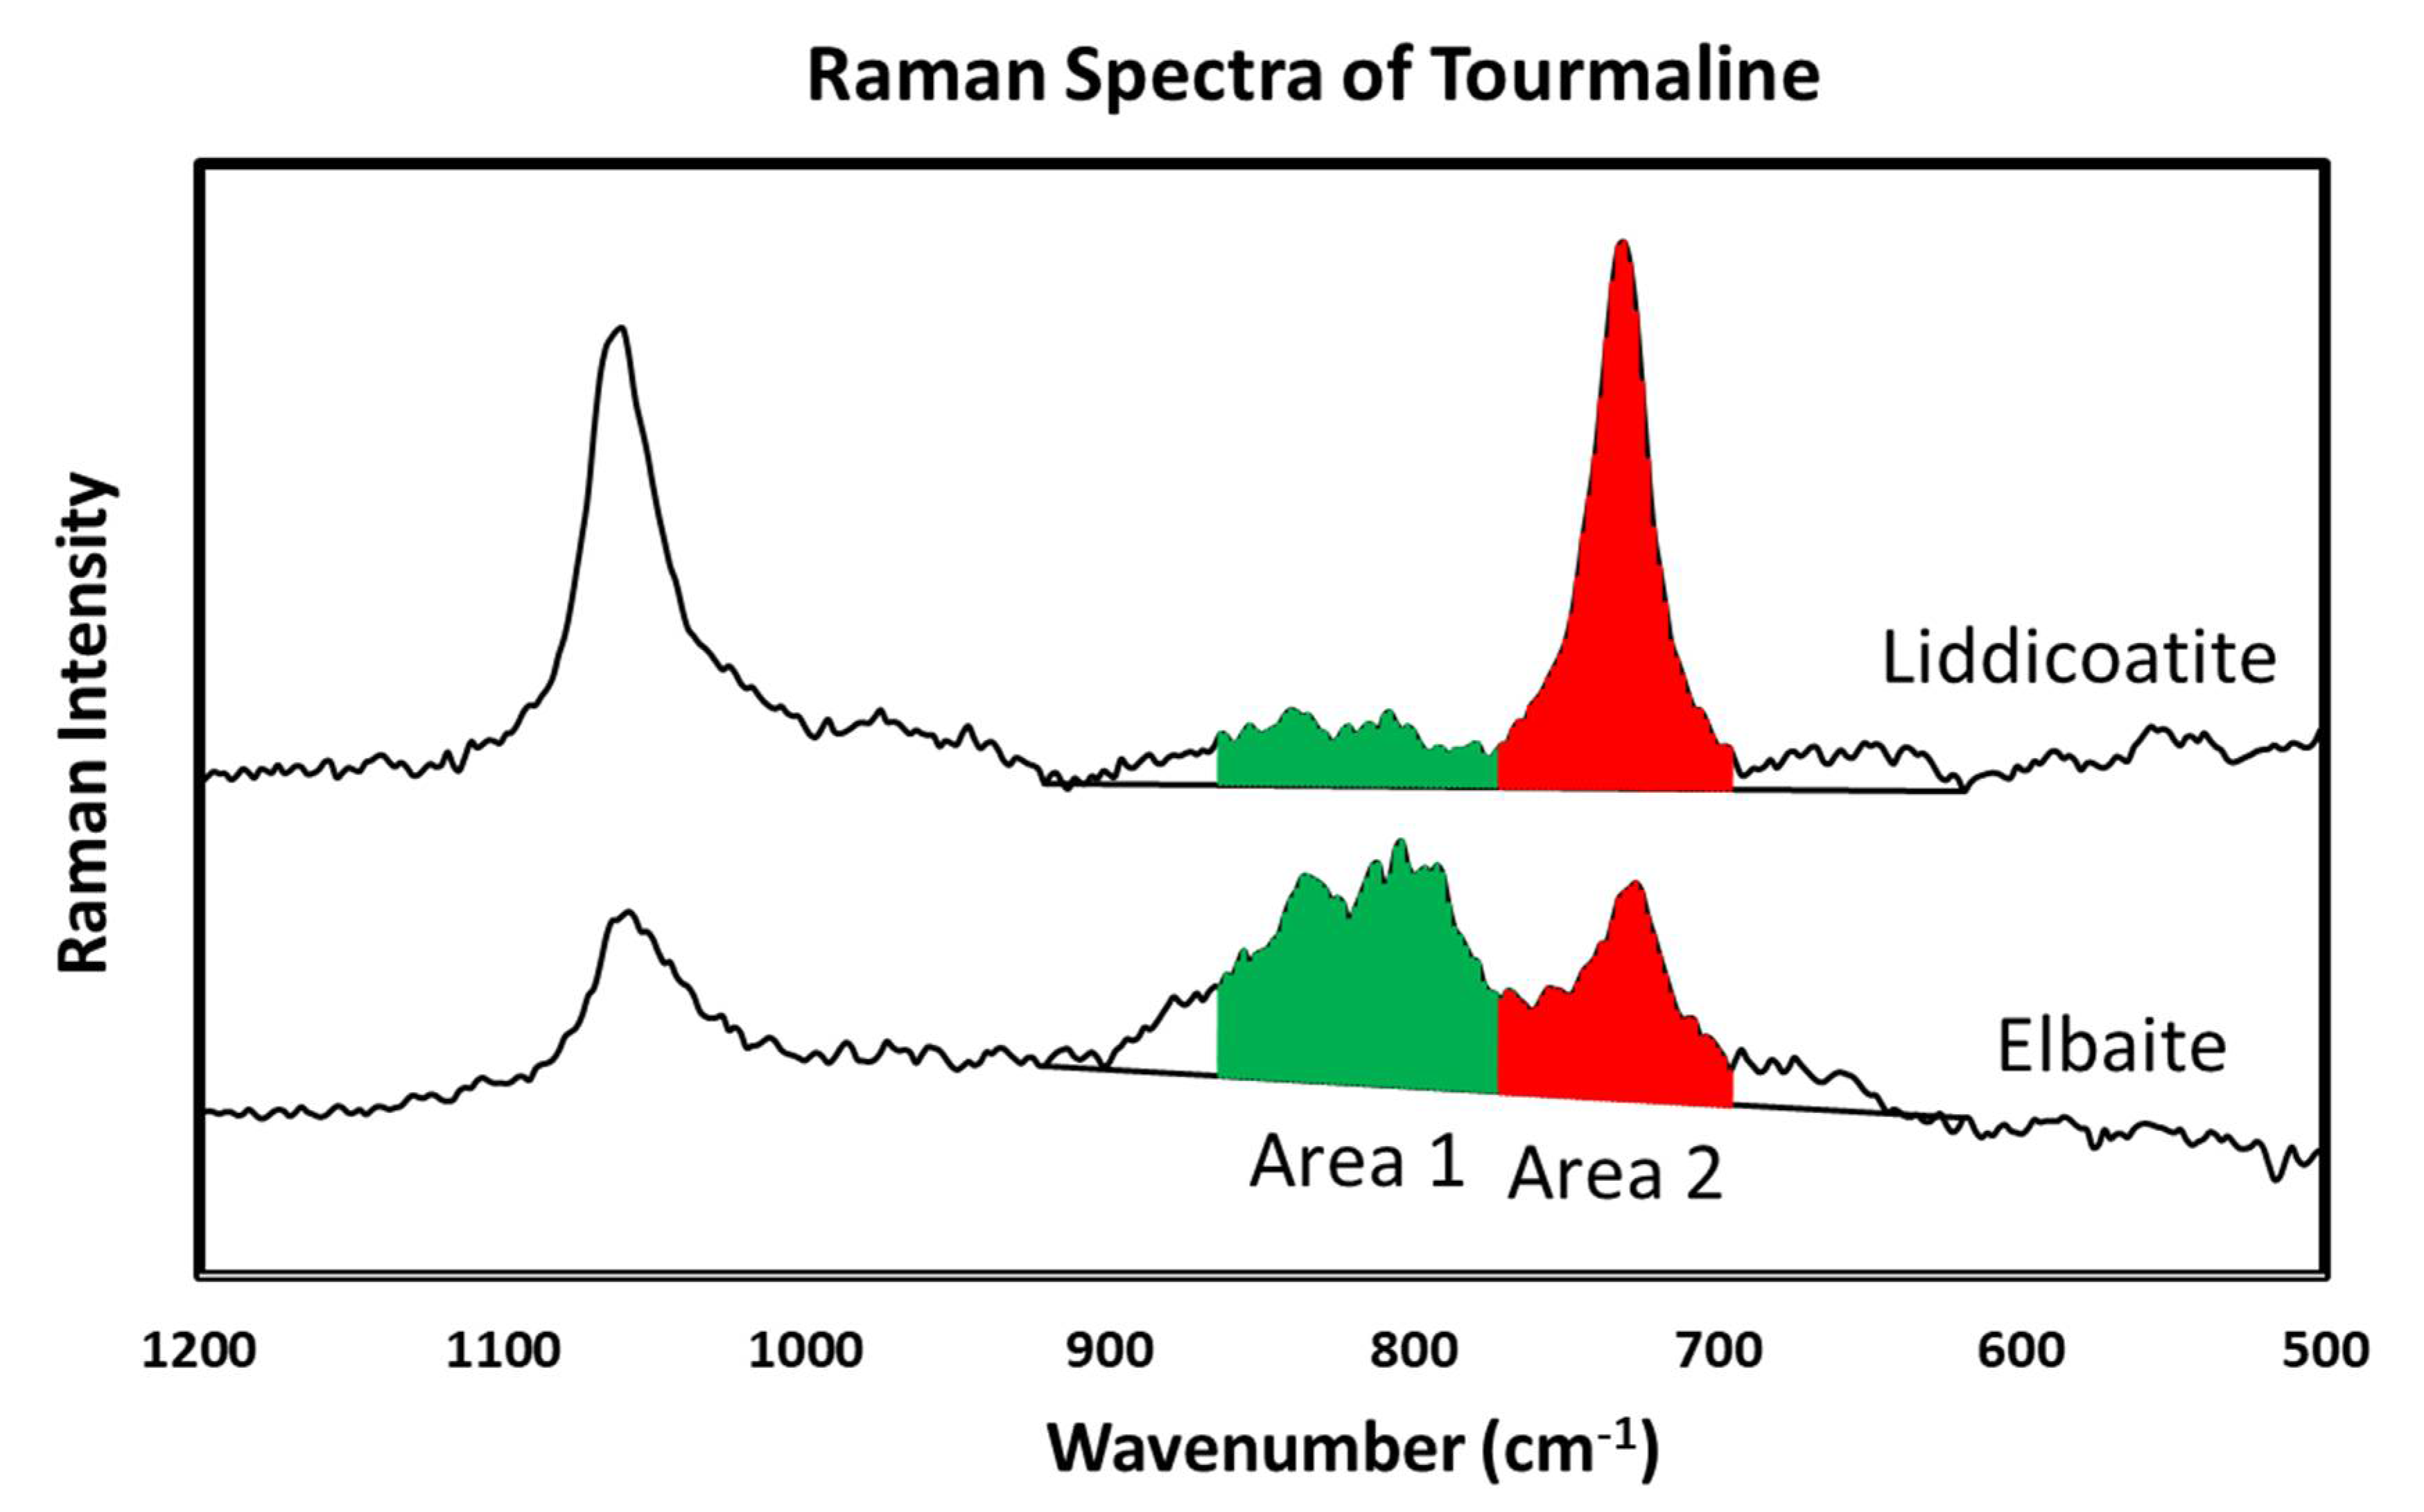
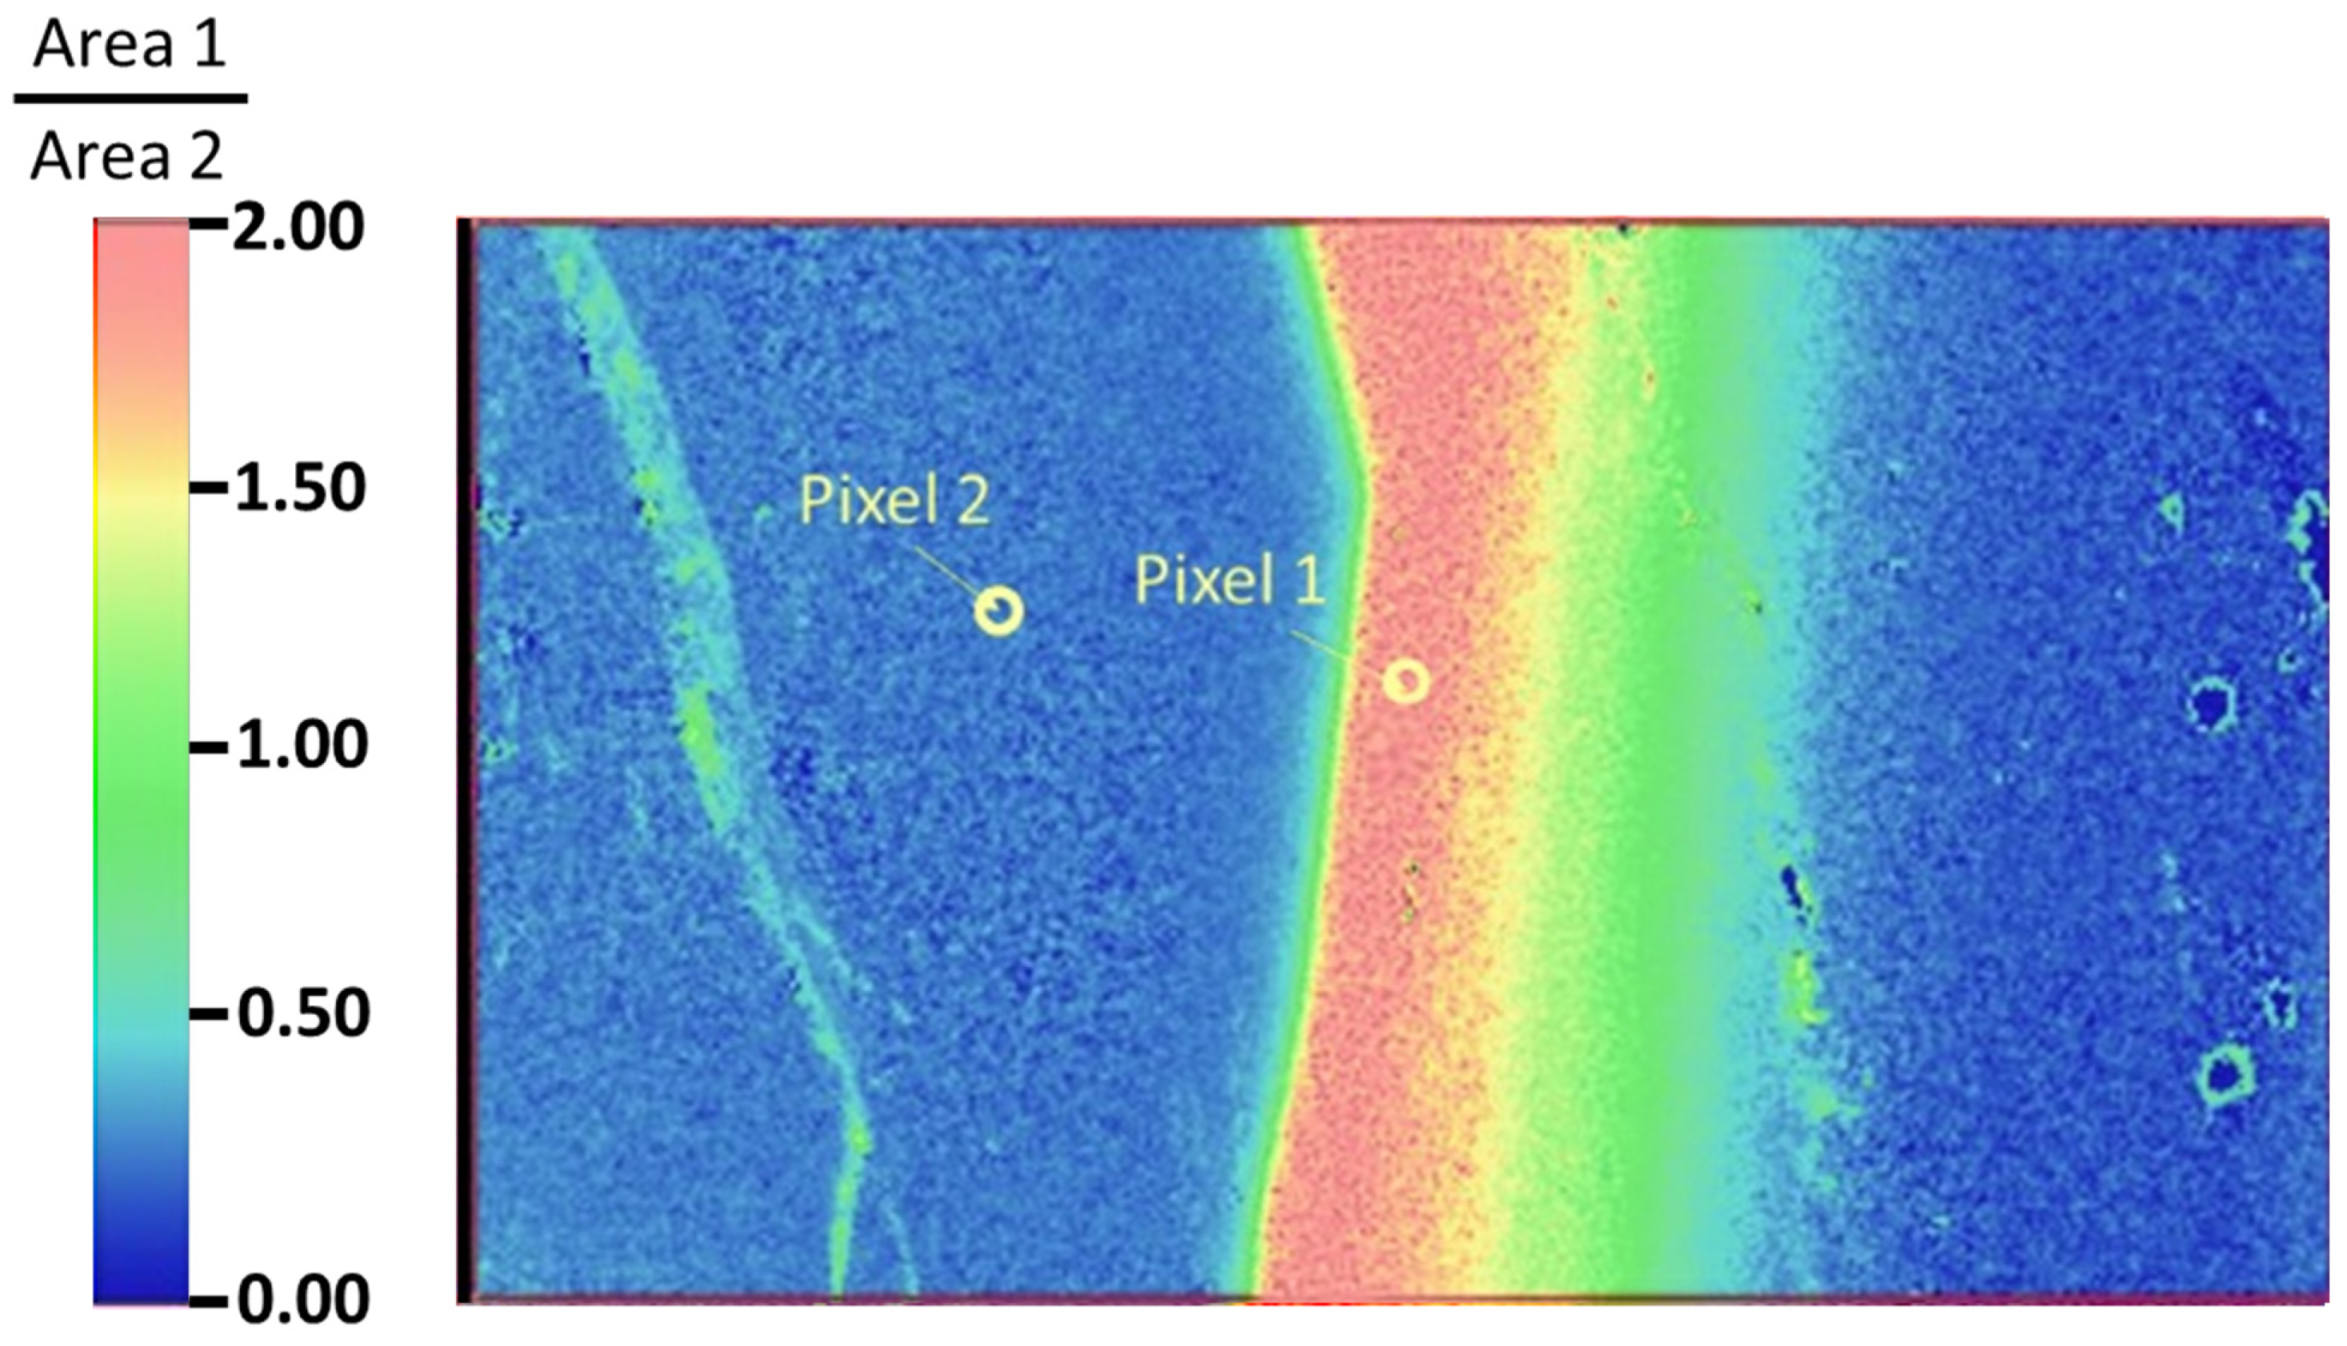
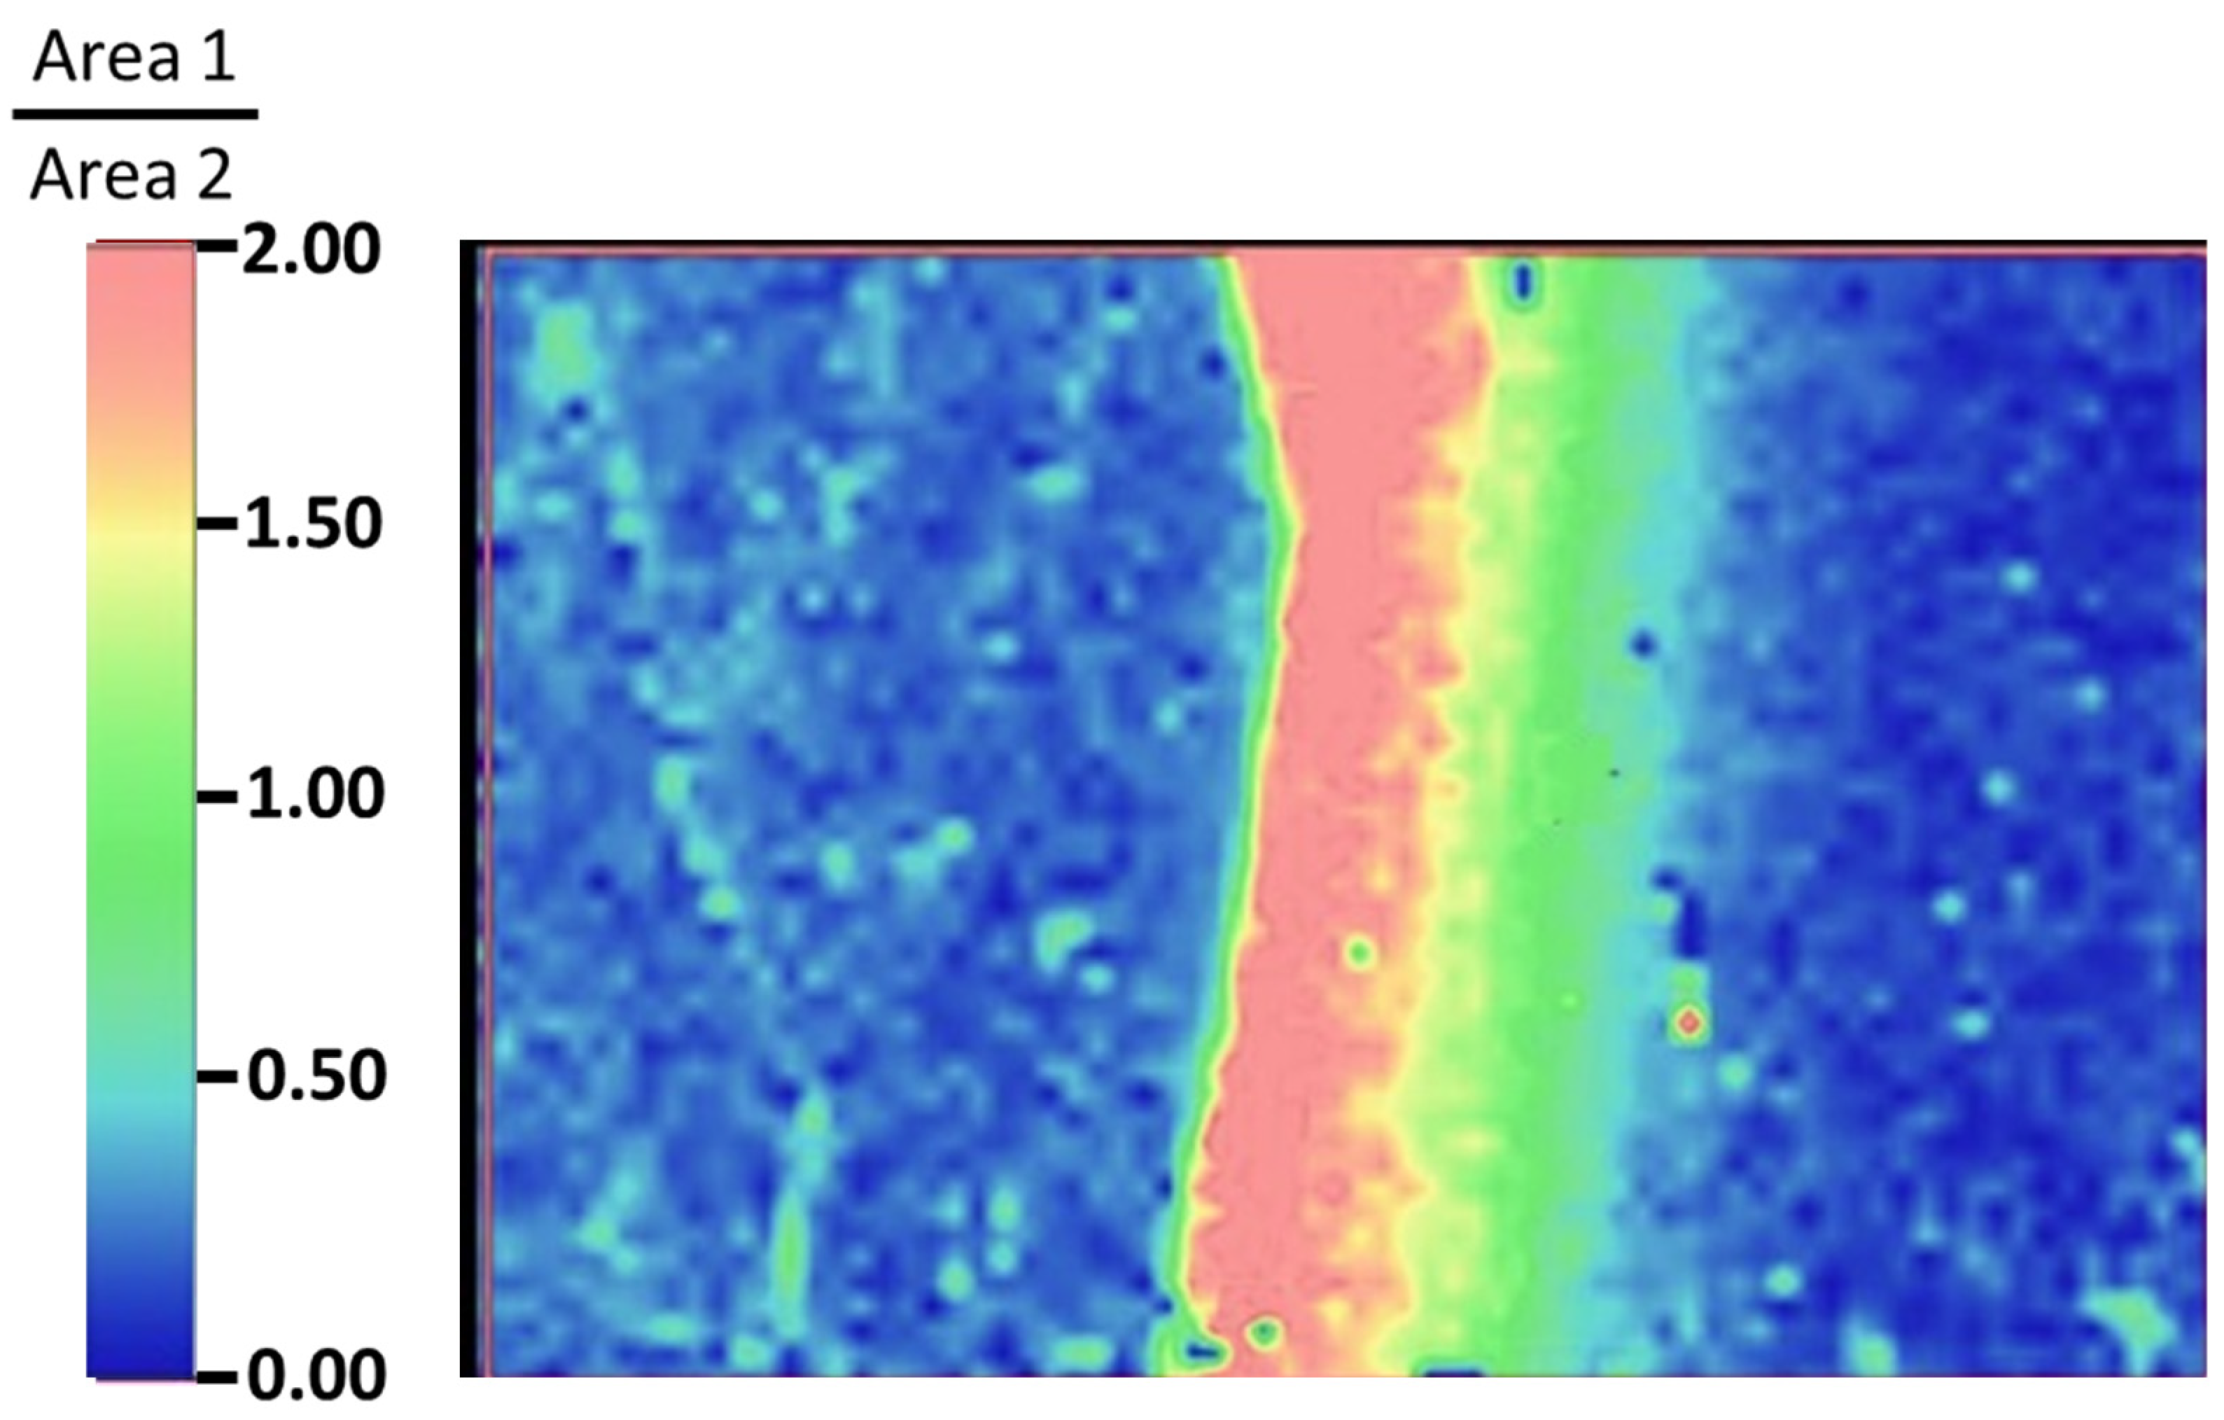
By using a ratio of the integrated green area 1 to the red area 2 in Figure 22, a third parameter was developed and used for mapping. Elbaitic tourmaline has a much stronger band at around 840 cm−1, and a much larger ratio of the area 1 to 2 compared to liddicoatite [54]. The ratio of these two areas differentiates the two species clearly in the map; the areas that are composed of mostly elbaite appear as red, while the areas that are composed of mostly liddicoatite appear as blue. The estimated ratio that separates elbaite and liddicoatite is around 1.5.
One portion of this sample had a high-resolution Raman map with a 455 nm polarized laser at room temperature with 0.5 s exposure time, and 10 µm pixel size (Figure 21 and Figure 23). The total time used to generate this map was 16 h and 24 min. A map with lower resolution in Figure 24 was also generated to compare to Figure 23. The total time used to generate this map is 48 min with a larger 50 µm pixel size. Therefore, it is feasible to map a production stone at lower resolution and shorter time.
The ability to accurately measure the overall composition of chemically zoned tourmaline gemstones using a non-destructive method could be a useful application in a gemological laboratory.

10. Raman Mapping for Separation of Jadeite and Omphacite

10.1. Chemical Distinction between Jadeite and Omphacite

Jadeite and omphacite are related members of the pyroxene mineral group with monoclinic crystal symmetry. As a result, most gemological tests give similar results for both minerals (e.g., refractive index (R.I.) = 1.65–1.69 for jadeite, 1.66–1.72 for omphacite; specific gravity (S.G.) = 3.3 for jadeite, 3.34 for omphacite). The common thinking for identification has long been that if a stone is a member of the jadeite group, then the color can adequately serve as a separation tool. In the jewelry industry, very dark green to black material, as well as bluish “Guatemalan jade,” have been considered omphacite, whereas light to medium-colored violet, white, green, and mottled stones were identified as jadeite. This color-based separation of jadeite pyroxenes seemed to work well until the recent revelation that some gem-quality medium green stones that visually resembled traditional jadeite jade were, in fact, composed completely of omphacite [55,56,57].
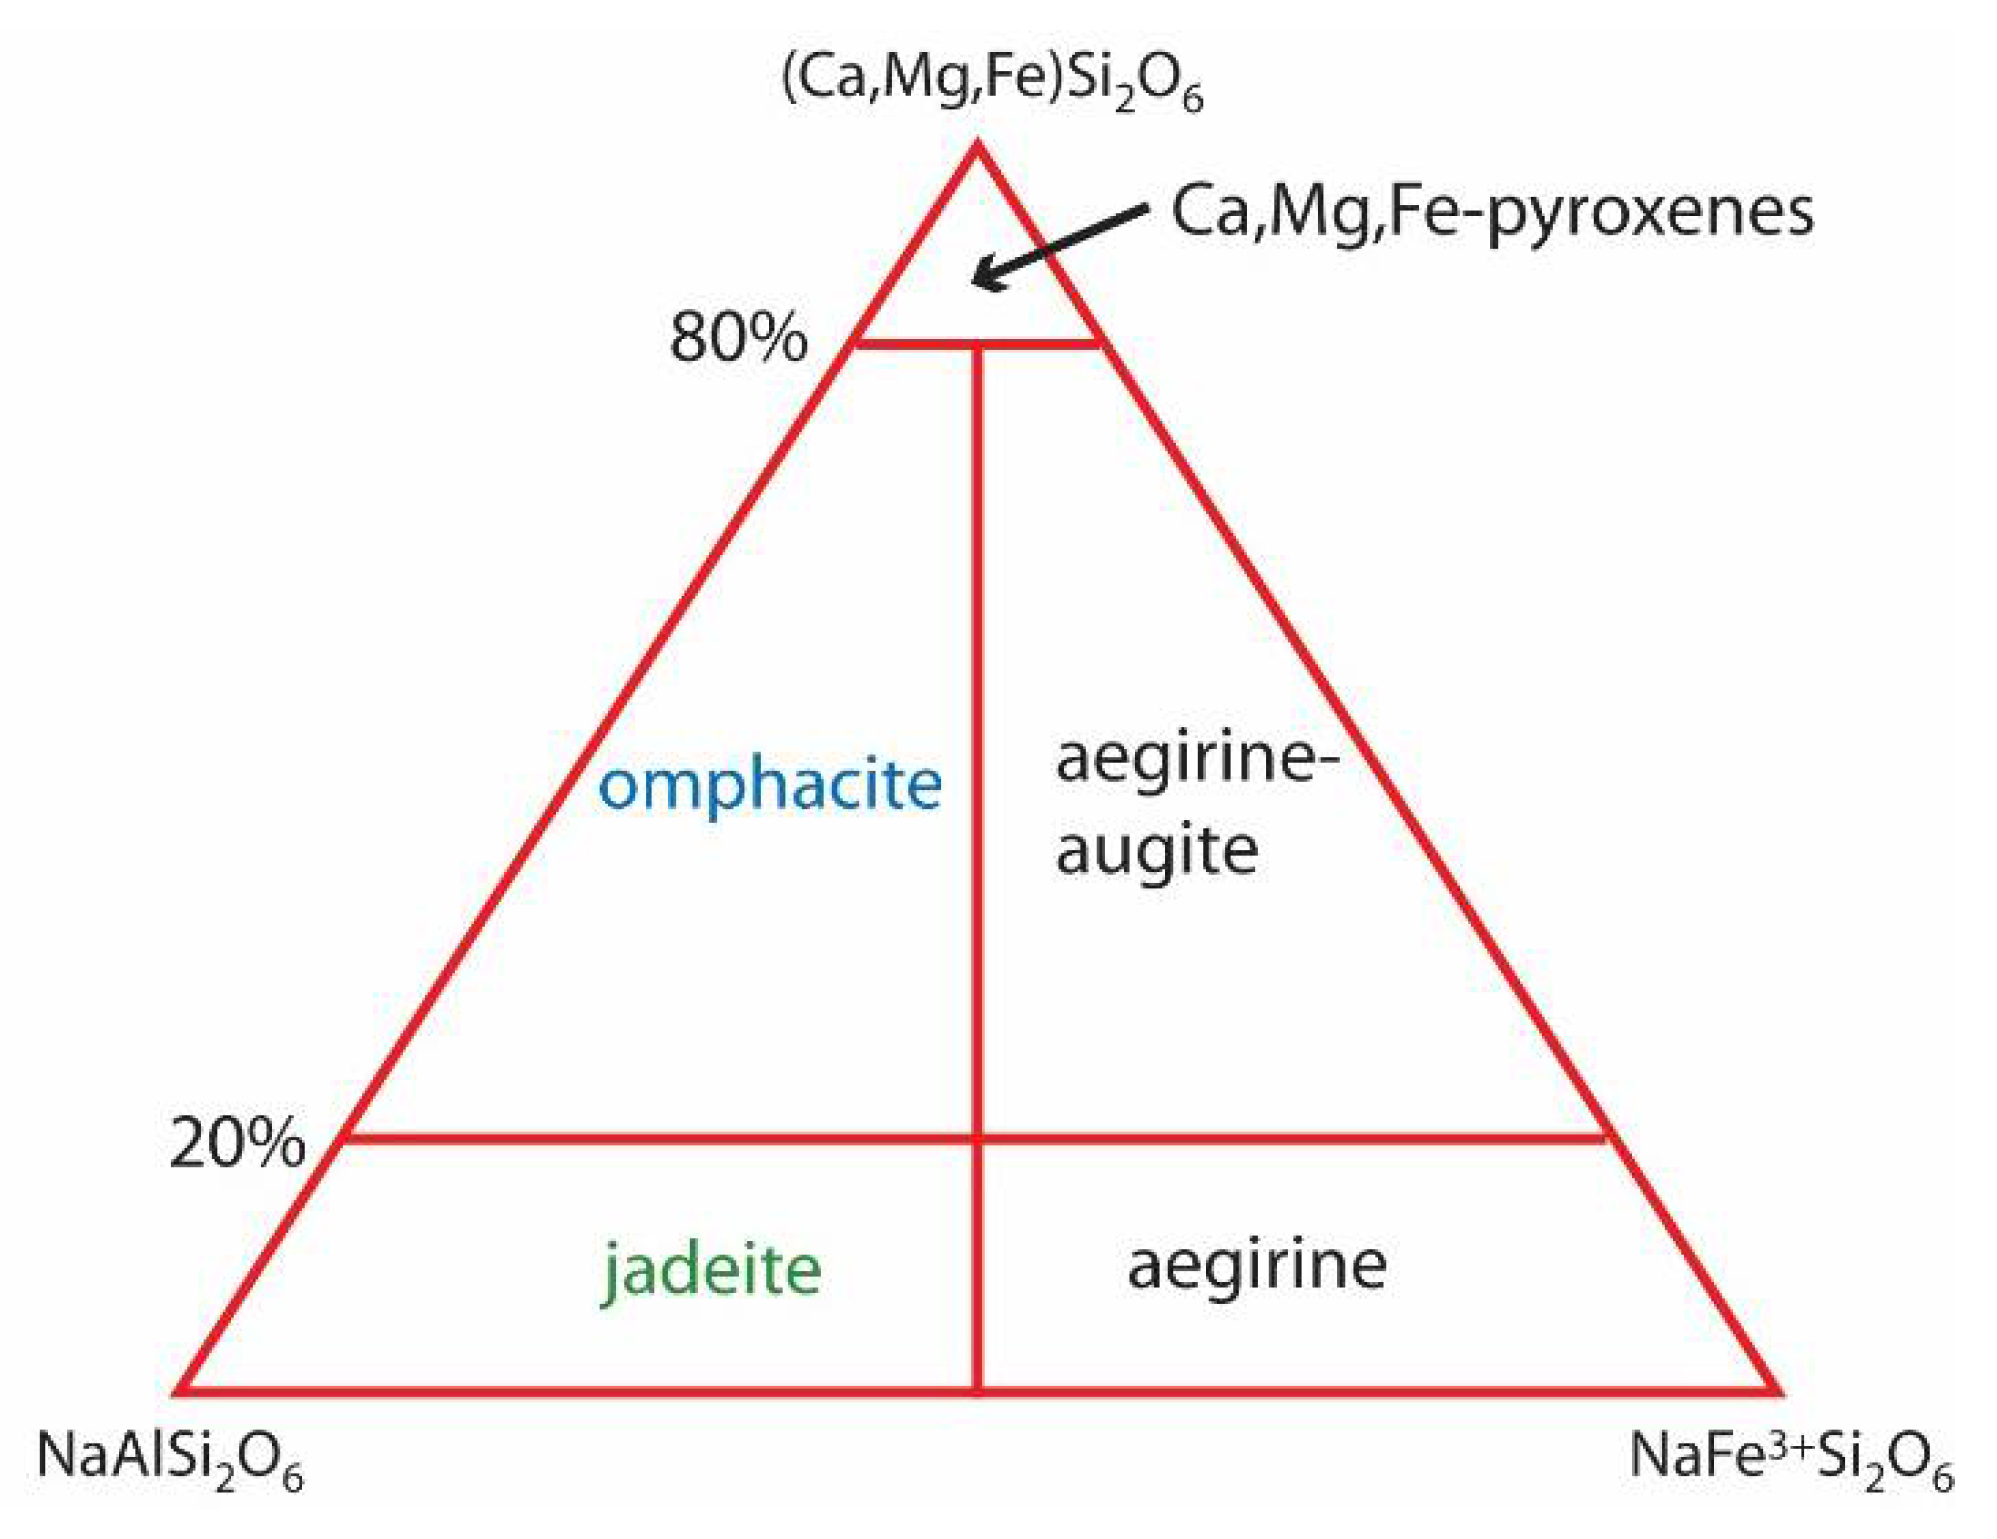
To mineralogists, the difference between jadeite and omphacite is caused by the substitution of particular chemical elements in the atomic structure of the minerals. The chemical formula for jadeite is Na(Al,Fe3+)Si2O6, and for omphacite, it is (Ca,Na)(Mg, Al)Si2O6. In mineral formulas, the elements in parentheses can substitute for each other because they can fit into the same lattice positions. From examining these formulas, the only significant differences between these two related silicate minerals are the amount of sodium (Na) and calcium (Ca) in the first formula position and the amounts of aluminum (Al), magnesium (Mg), and ferric iron (Fe3+) in the second formula position. The formula amounts of silicon (Si) and oxygen (O) are the same for most monoclinic pyroxenes. For minerals such as jadeite and omphacite, where only a few elements substitute for each other, a continuum in chemical composition often exists that ranges from an end member with only one element in each formula position (e.g., jadeite, with only Na in the first position) to another end member with only the other element in that formula position (e.g., the pyroxene diopside has a formula of CaMgSi2O6, with only Ca in the first position). When related minerals can occur with any ratio of the end member elements in the first formula position (Na to Ca in this example), the chemical relationship between the minerals is called a solid solution series. If just two elements are substituting, the relationship between minerals can be defined as percentages along a mixing line. However, in the case of most pyroxenes, more than two elements are in play, requiring the use of a triangular plot, called a ternary diagram, to display multiple element substitutions simultaneously (Figure 25). In this type of diagram, each corner represents 100% of that component.
Chemically, omphacite is an intermediate composition in the solid solution series between the broad group of Ca,Mg,Fe-pyroxenes and end member jadeite (NaAlSi2O6). The omphacite compositional space, however, is very broad and the boundaries are not strictly defined. Most mineralogical references use 20% and 80% (Ca,Mg,Fe)Si2O6 component as the bounding horizontal lines for the omphacite region, as seen in Figure 25, but this leaves a very restricted space for jadeite that might not be representative of the material seen in the gem market.

10.2. Identification Using Raman Analysis

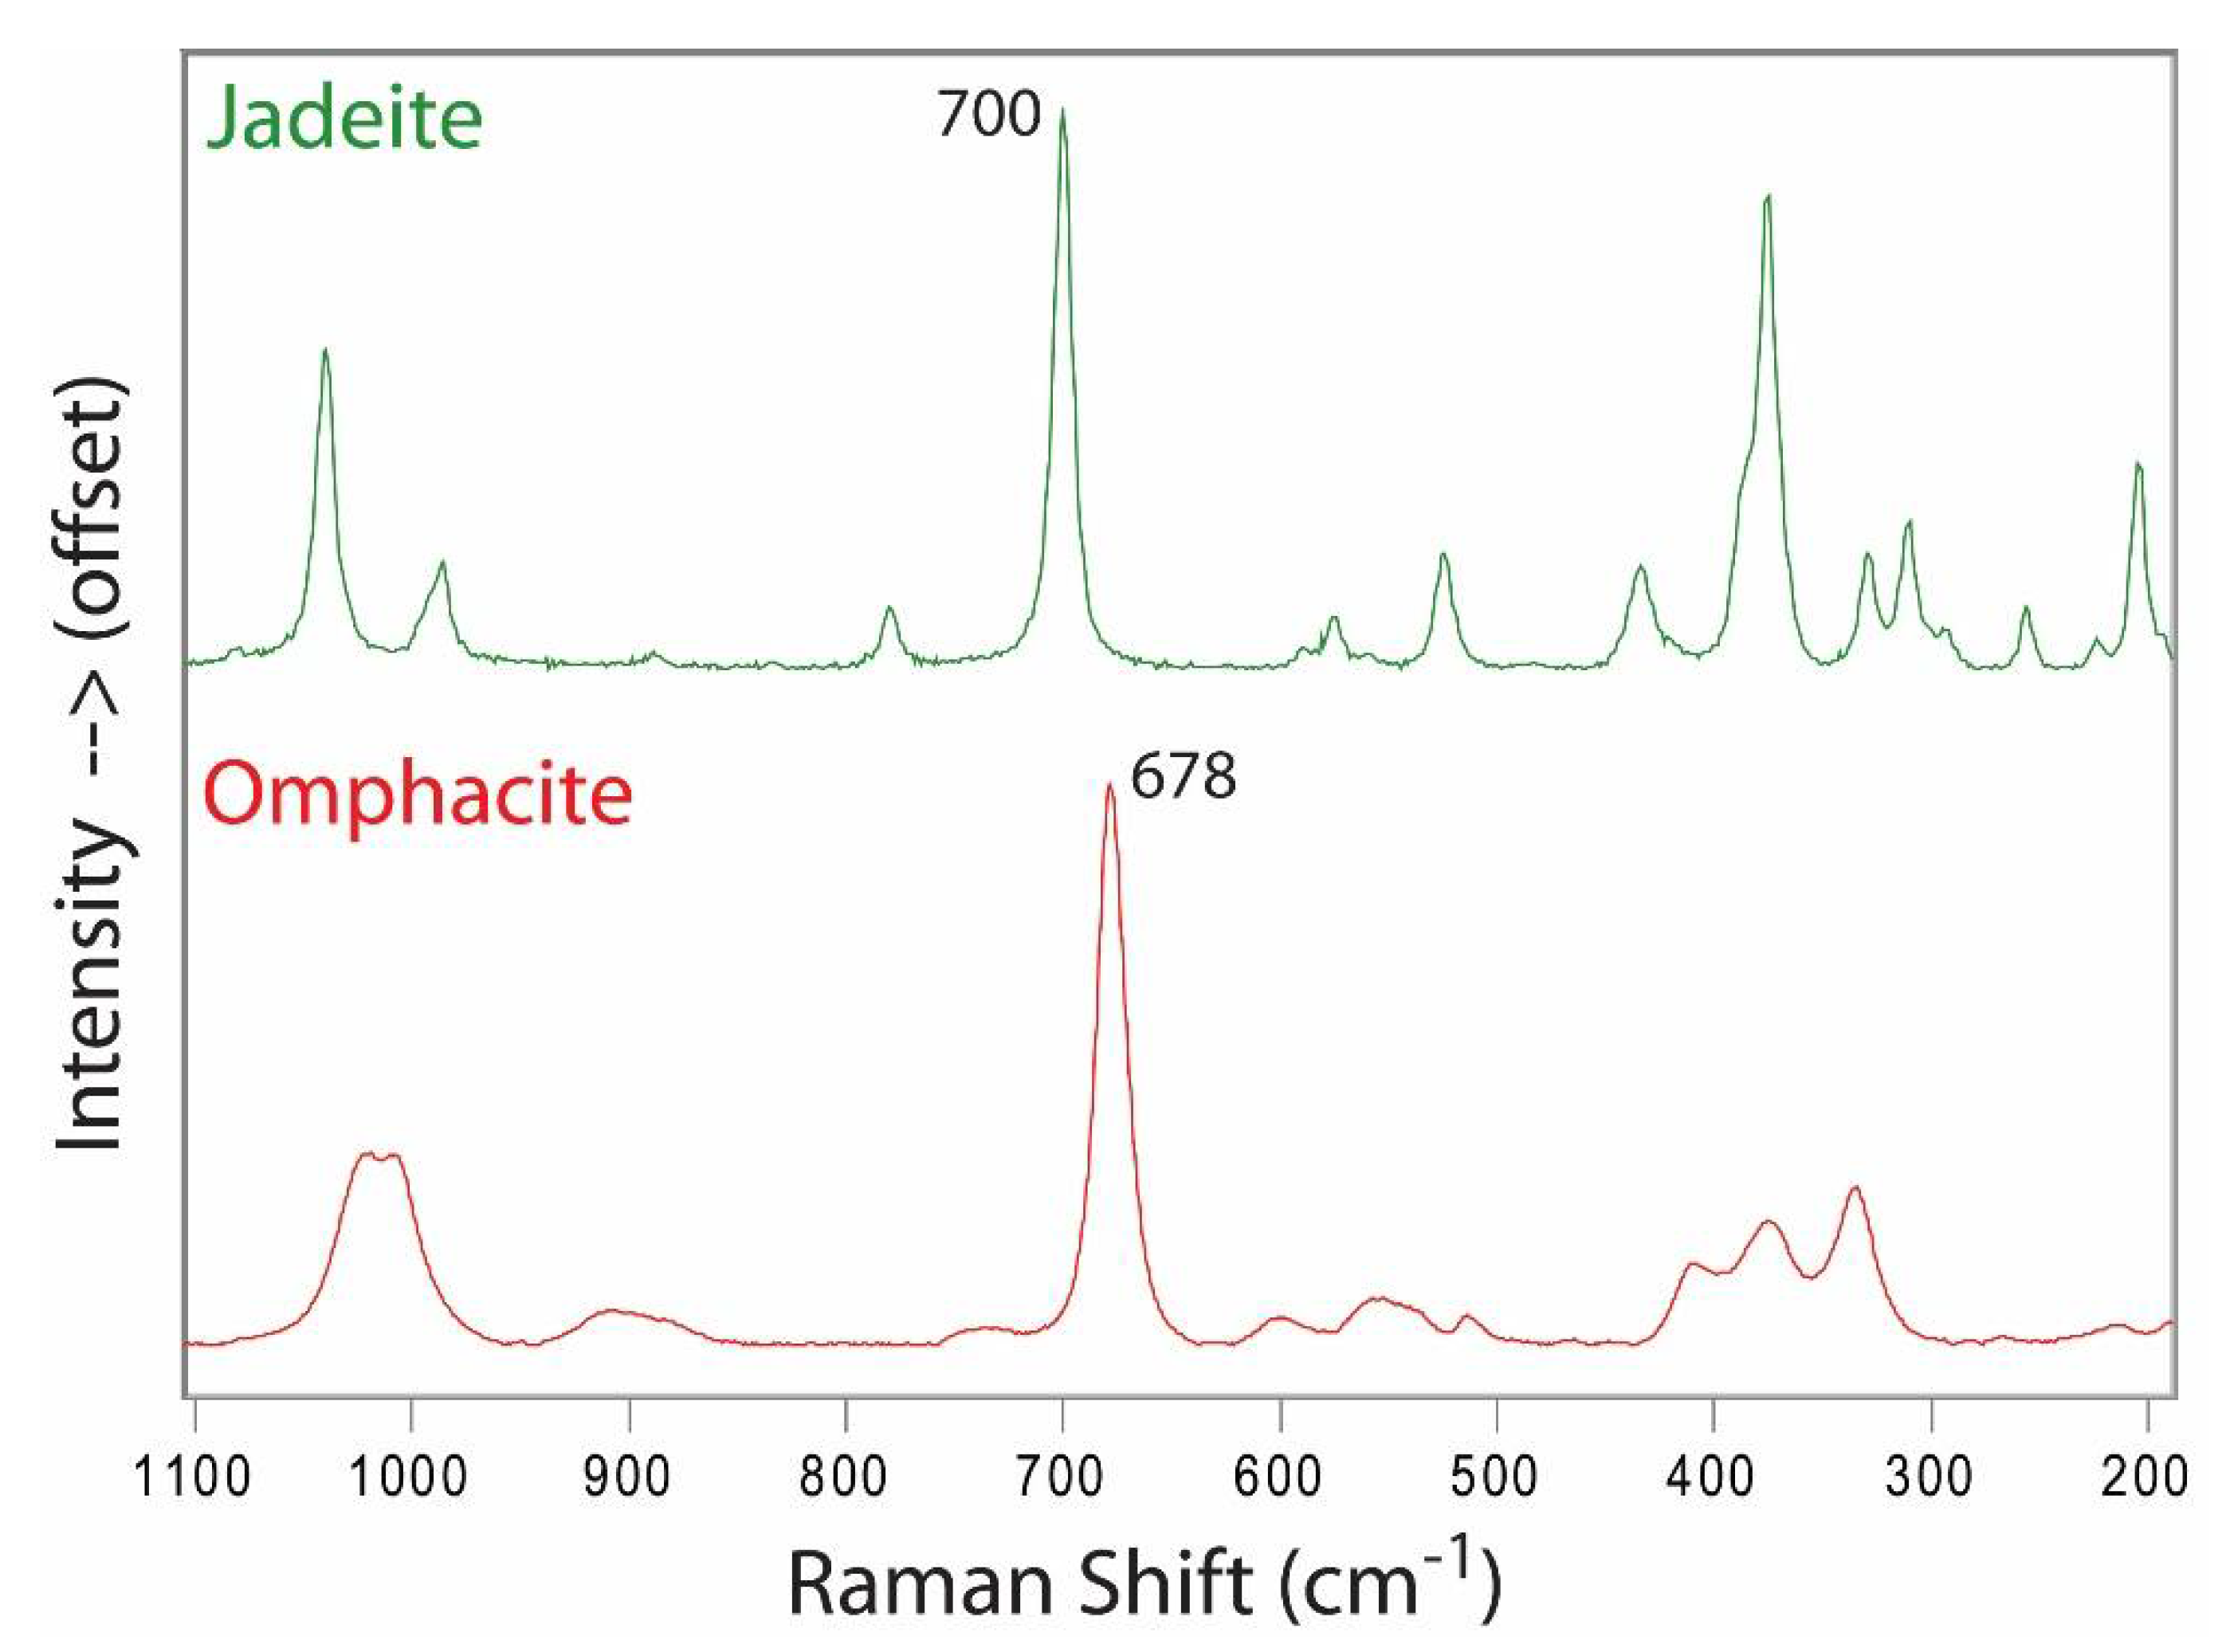
Raman spectroscopy has proven to be an invaluable technique for the identification of minerals. When excited by a laser, most minerals emit light that is shifted in frequency relative to the wavelength of the laser. This shift is characteristic of the structure and chemistry of the mineral and can be used as an identification tool when compared to a database of known mineral shifts. In most cases, care has to be taken with the orientation of the crystals during Raman analysis because the technique is extremely sensitive to crystallographic directions. Fortunately, in the case of polycrystalline materials such as the jadeite and omphacite used in the jewelry industry, the tiny crystals are randomly oriented and do not significantly affect the Raman data. Although not commonly used in gemology for the separation of different pyroxenes, Raman spectroscopy shows distinct differences between jadeite and omphacite due to the elemental substitutions and corresponding structural changes that are very useful for identification (Figure 26).
Jadeite shows prominent Raman peaks at ~204, 255, 310, 328, 375, 433, 524, 575, 700, 779, 987, and 1039 cm−1, whereas omphacite has distinct features at 335, 374, 409, 554, 678, 905, and 1015 cm−1. While many Raman features are slightly different between the minerals, the most prominent, and potentially useful (as shown in Figure 26, Figure 27 and Figure 28), are the peaks that occur at 678 (omphacite) and 700 (jadeite) cm−1.
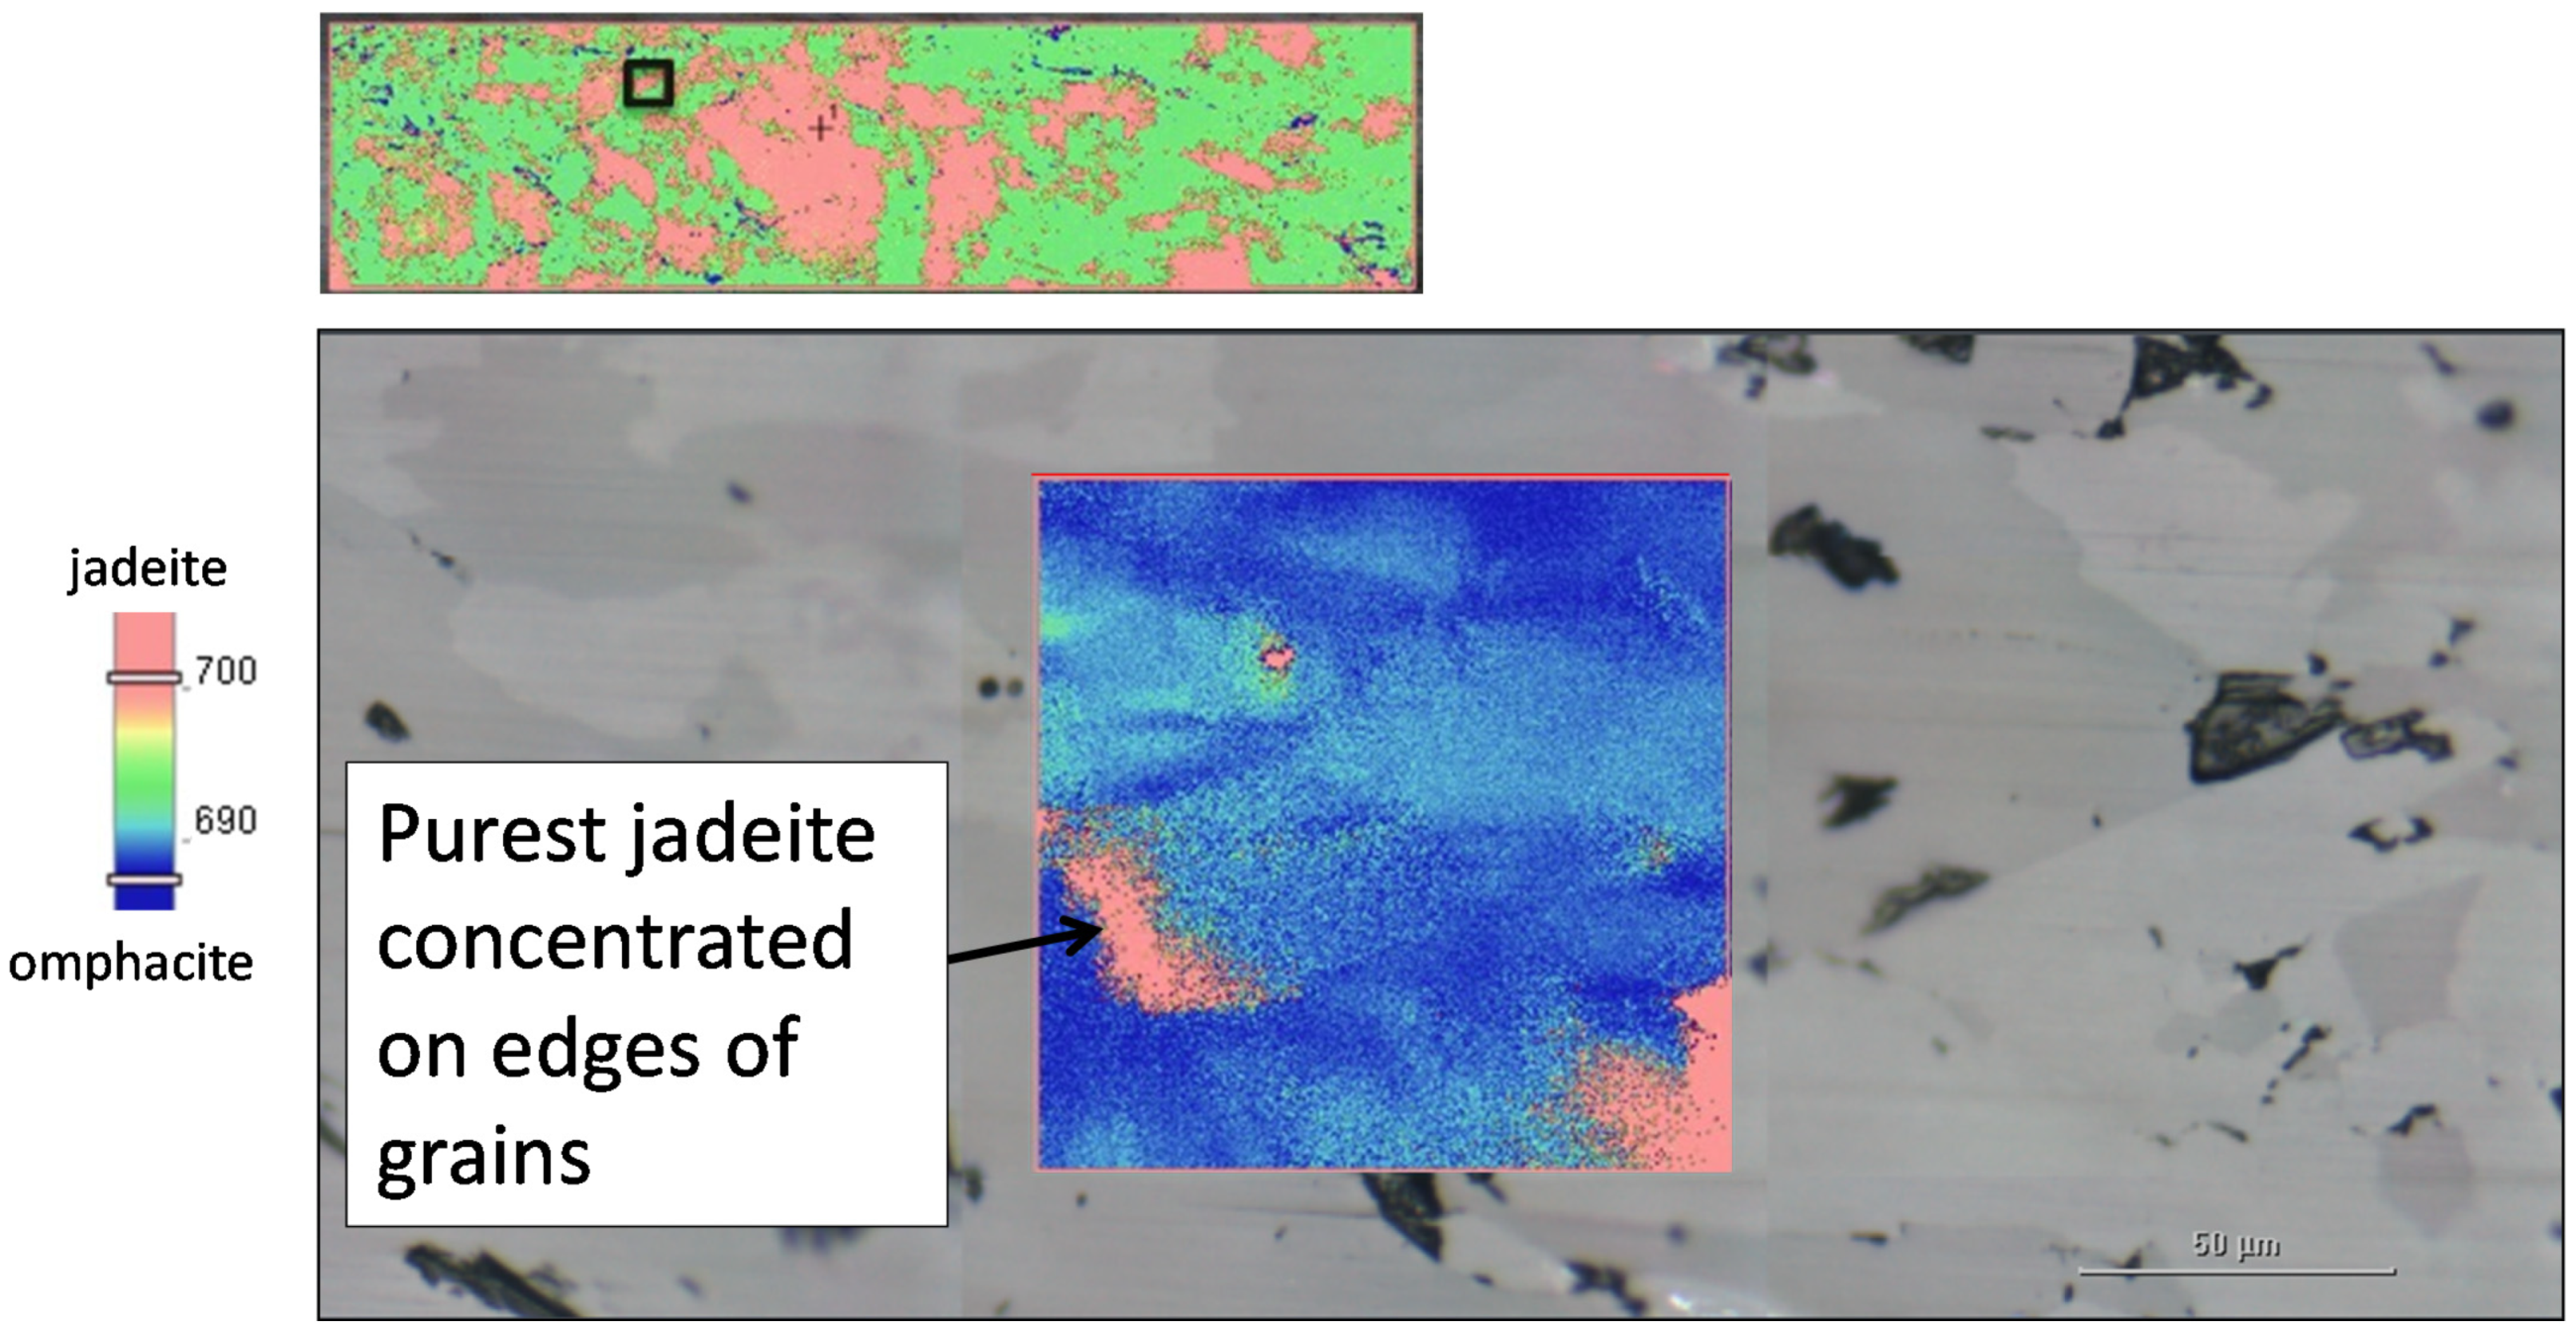
As effective as Raman analysis is at separating jadeite and omphacite, it has traditionally been used as a spot technique. High-pressure minerals such as jadeite and rocks that contain these minerals tend to be somewhat heterogeneous due to the nature of their geologic formation. As a result, a single Raman analysis in one spot of a gem may reveal a very different composition than another location. Raman mapping helps us to better understand the distribution of mineral phases, even those that are only subtly distinguishable by a shifted Raman peak, and evaluate the composition of a larger, more representative portion of a gem than a single spectrum might allow. For example, a Raman map of the peak position of the ~678–700 cm−1 feature in jadeite/omphacite shows a very heterogeneous growth pattern of interlocking grains of nearly pure jadeite and mixed jadeite/omphacite (Figure 27).
Under higher magnification with the Raman mapping microscope, the different mineral grains in the same sample can be seen with reflected light. A high-resolution Raman map of individual and adjacent grains shows that the nearly pure jadeite composition is concentrated at the edges of the grains, with the matrix between grains being largely composed of omphacite (Figure 28). This level of detail helps us to better understand the complexity of the geological history for this apparently uniform green material.
While many “jadeite” jewelry pieces in the trade consist of a mixed composition, some have been found to be nearly completely composed of omphacite, as shown in Figure 29. Traditional Raman spectroscopy can identify the differences between jadeite and related pyroxenes such as omphacite; however, Raman mapping allows for a more thorough understanding of the true composition of gems as a whole and thus provides a better representation of what a consumer is purchasing.

11. Raman Mapping of Pearls

Pearls are mainly composed of calcium carbonate (CaCO3) biominerals together with organic matrix and water. In pearl analysis, Raman spectroscopy is a rapid, non-destructive technique that mainly is used to identify different CaCO3 polymorphs, including aragonite, calcite, and vaterite, and determine color origin of the pearl: whether it is caused by natural pigments (in particular, polyenes and uroporphyrin) or has been modified by treatment processes [5,59,60,61].
Aragonite is the most common CaCO3 polymorph found in nacreous pearls of both saltwater (SW) and freshwater (FW) environments, as well as in various non-nacreous pearls that exhibit surface flame structure and porcelain-like luster (known as porcelaneous pearl), such as conch and melo pearls [62]. Calcite is known to be a main composition of some non-nacreous pearls produced in some mollusk species of Pinnidae, Pectinidae, and Ostreidae families [63,64,65]. Moreover, some marine nacreous pearls can develop in the pearl sac that originated from young epithelium cells, which is composed of prismatic layers of calcite in the center and layers of aragonite deposition at the outside [66]. Vaterite is an unstable CaCO3 polymorph that usually is not found in the pearl, especially for marine pearls. Nevertheless, the occurrence of vaterite has been reported on the surface of freshwater cultured nacreous pearls in the white frosty region, which is lusterless and influences the quality of pearls [67,68,69,70]. Vaterite has also been discovered in the center of freshwater non-bead cultured pearls, which may relate to implanted tissues that were used to culture the pearls [68,71]. Therefore, characterizing CaCO3 polymorphs is a valuable technique which can help in determining the mollusk species, environment, and origin of certain types of pearls in gemological laboratories.
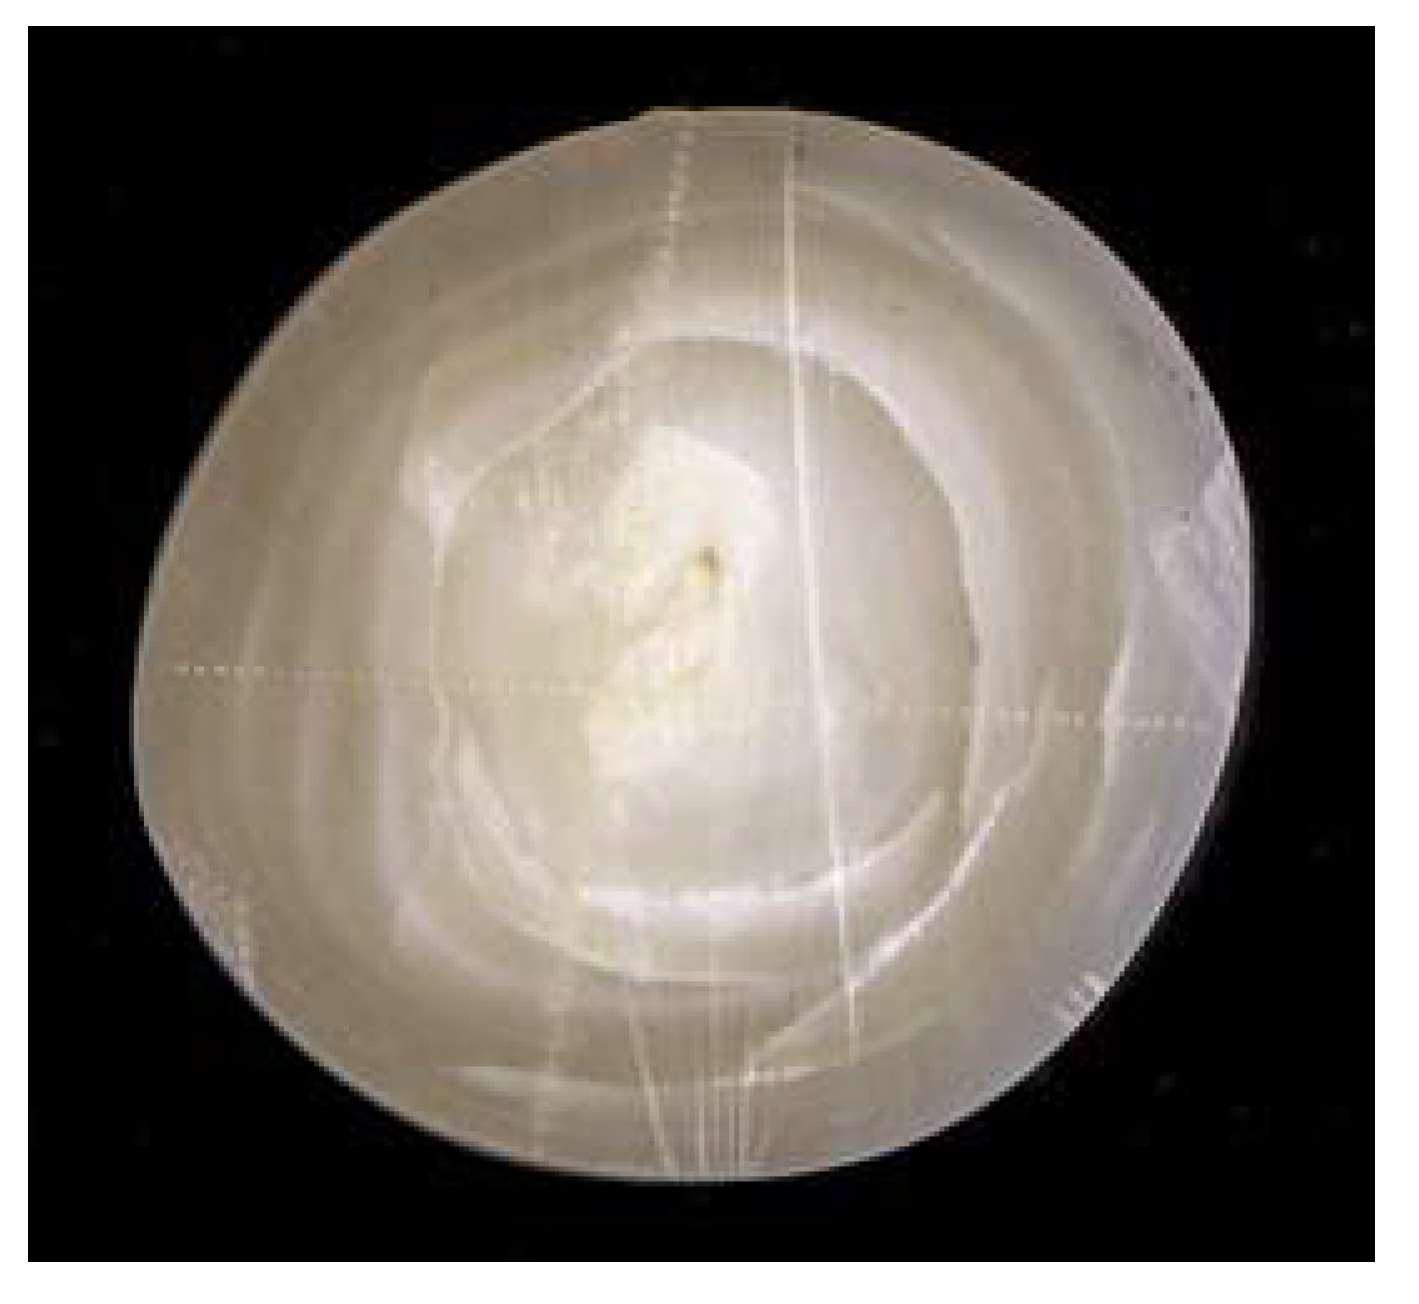
Raman mapping is not routinely used for pearl testing, yet the technique is being investigated for its ability to assist in verifying the environmental growth condition of a questionable pearl that exhibits unusual chemical characteristics and internal growth structures. This pearl has been reported previously, with its growth environment and origin inconclusive (pearl A in [72]). Subsequently, to verify the pearl’s identity, it was cut in half to analyze in more detail. A diamond-plated saw was used to cut the pearl in a direction relatively parallel to the flat base, and the surfaces of both cross-sections were left unpolished for the study. The study presented here only focuses on the top cross-section sample, which weighed 4.78 carats and measured 11.81 × 10.95 × 5.06 mm (Figure 30). The sample’s chemical composition was examined using LA-ICP-MS analysis. Two lines of 54 spots were analyzed across the surface at perpendicular directions to each other. The trace element data revealed that some spots in the central area contained very high magnesium (Mg) concentrations (761–3360 ppm) compared with regular SW (around 100–300 ppm) and FW (below 100 ppm) values, and their manganese (Mn), barium (Ba), strontium (Sr), and sodium (Na) values did not correlate to either SW or FW characteristics.
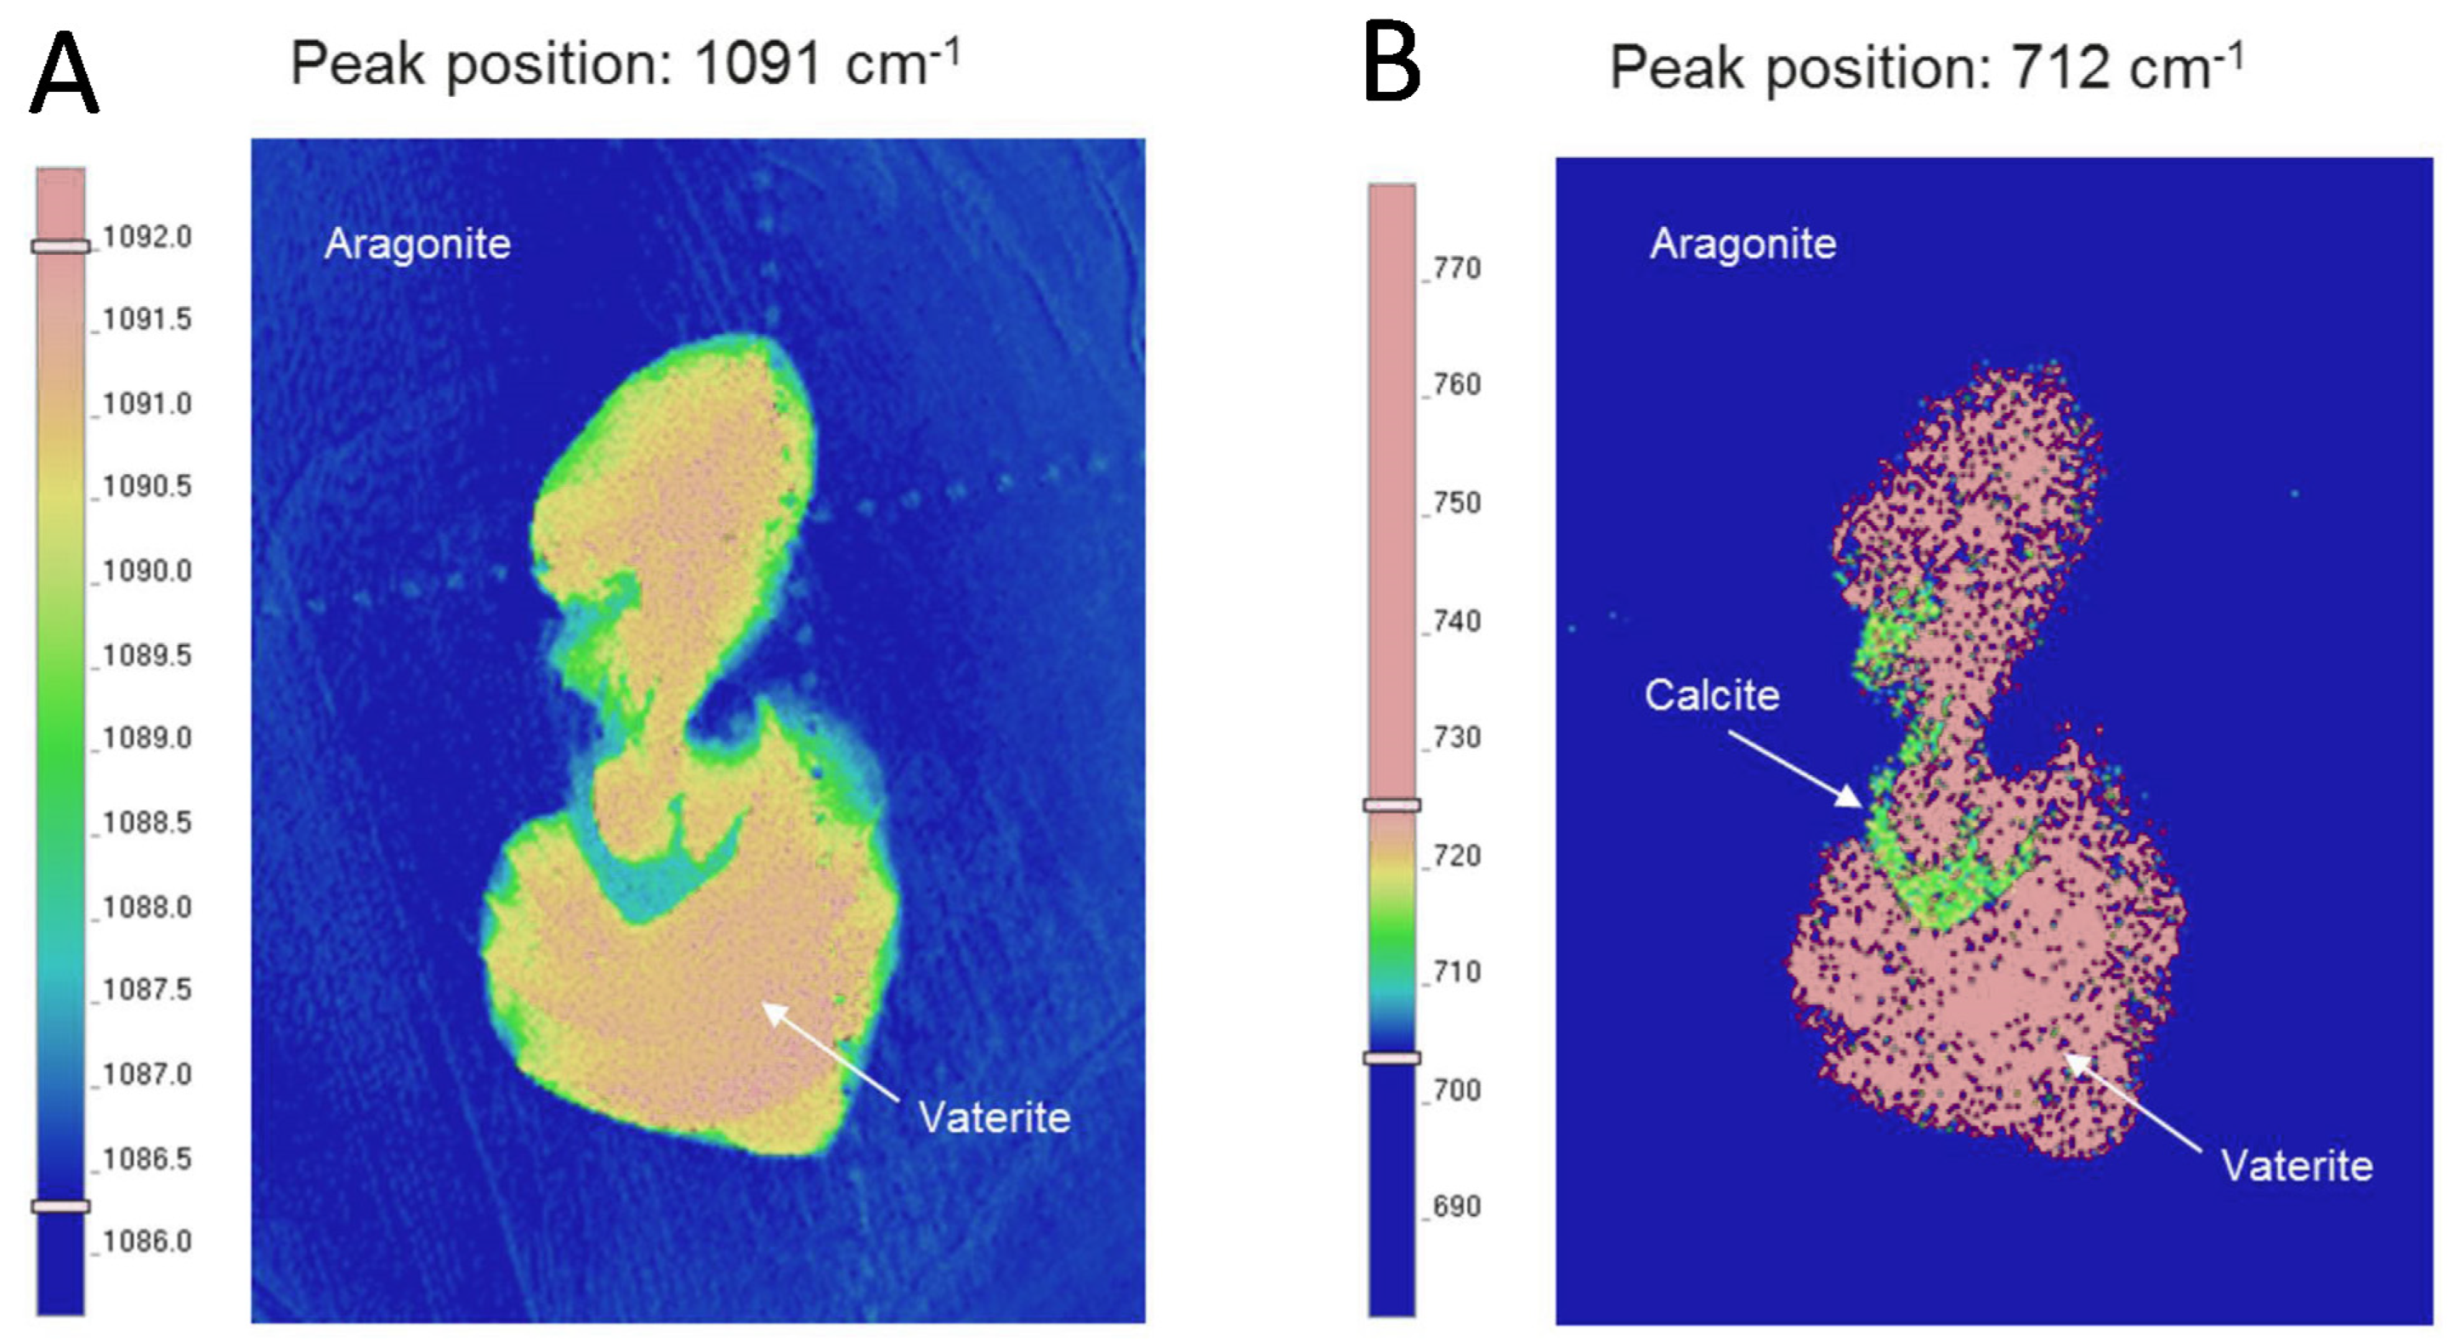
Raman spectroscopy analyses on the cross-section of this specimen were conducted using a Renishaw inVia Raman microscope with an 830 nm diode laser excitation wavelength at room temperature. The 830 nm laser provided better peak resolution compare to the 514 nm laser that is normally used in pearl testing owing to higher background fluorescence in this sample. The results indicated that the high Mg value spots are composed of vaterite, which could be an indication of growth under FW environment. In addition, aragonite and calcite spectra were also found in nearby areas together with vaterite. The three CaCO3 polymorphs can be distinguished by different band positions of carbonate ion (CO32−) modes. Raman spectra of vaterite showed major bands at 1075, 1080, and 1091 cm−1 which correspond to symmetric stretching (ʋ1) mode of CO32−, and minor bands at 667, 685, 740, 743, and 751 cm−1 which correspond to in-plane bending (ʋ4) modes of CO32−. The results conformed with previous findings [68]. Raman bands of aragonite were observed at 1085 cm−1 for the ʋ1, and doublet bands at 701 and 705 cm−1 for the ʋ4. The presence of calcite was indicated by the bands at 1086 (ʋ1), and 712 cm−14). Though some dominant vaterite spectra contain a tiny band of aragonite at 702 cm−1, the vaterite bands at 685, 740, 743, 751, and 1075 cm−1 (shoulder) also are present in the dominant aragonite calcite spectra (Figure 31).
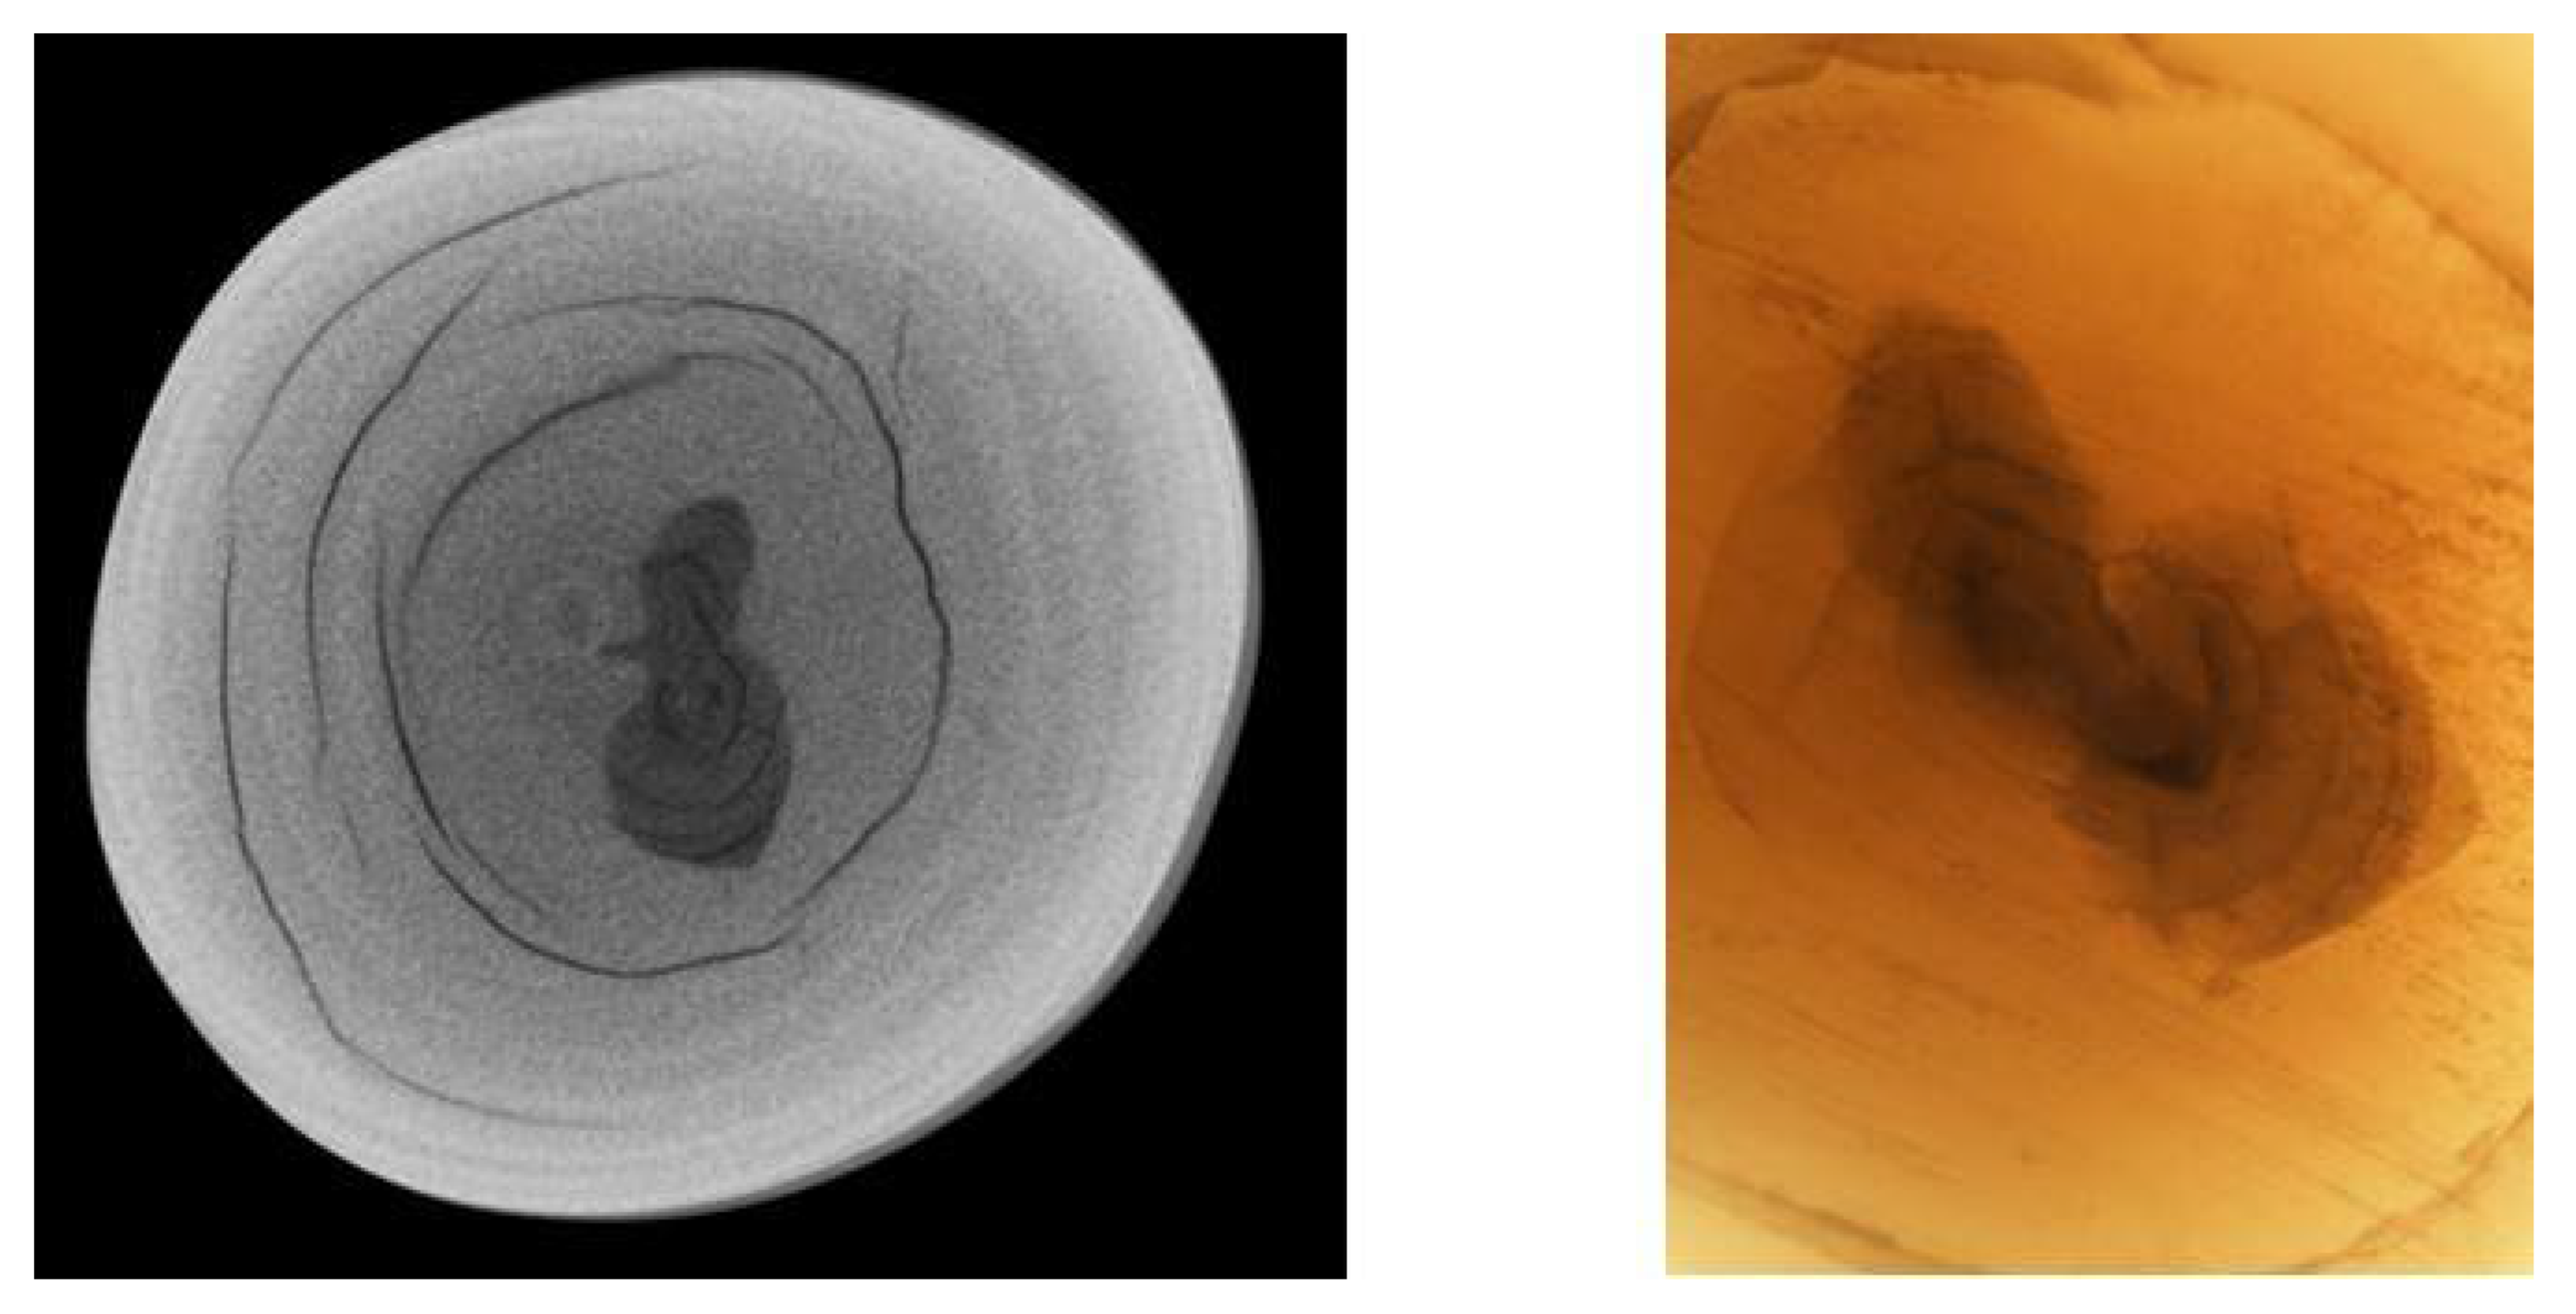
Raman mapping was further used to determine the distribution of the different polymorphs with 785 nm laser excitation wavelength at room temperature, 0.04 s exposure time per pixel, 20 µm pixel size, and a total of 10 scans. The Raman map in Figure 32A showed intensity variation at 1091 cm−1, the dominant peak for vaterite. Raman mapping of the 1091 cm−1 peak indicated a vaterite zone in the center (yellow to red in the false color map of Figure 32A) and the surrounding low intensities (dark blue) consisted of aragonite. However, the region between aragonite and calcite in the central area close to vaterite cannot be separated using this peak position. The Raman map of the calcite band at 712 cm−1 in Figure 32B displayed the distribution areas of the CaCO3 polymorphs better: calcite was only detected in an irregular, small area (green in false color map of Figure 32B) associated with vaterite. The vaterite growth sector in the maps corresponded to the pearl’s internal structure, obtained from X-ray computed microtomography analysis (μ-CT) and observed with photomicrography in transmitted light (Figure 33). The vaterite showed lower radiodensity (i.e., more transparent) to X-rays than the aragonite area, and it appeared as darker gray in the μ-CT image.
The mixture of aragonite–vaterite formation in the central area of freshwater pearls was previously studied and reported [68,71,73]; however, the authors did not detect calcite in their studies. Previous researchers reported large domains of calcite together with aragonite in the central area of non-bead cultured freshwater pearls [74]. However, they believed that the combination of aragonite, vaterite, and calcite formation in the same freshwater pearl had never been reported in the literature to date. The detection of the vaterite area in the center of the pearl by Raman mapping technique helped to verify that the pearl was likely from freshwater environment since vaterite was not reported to present in saltwater pearls [71,75,76]. In accordance with the previous studies, it is potentially a non-bead cultured pearl. Nevertheless, a recent study reported a vaterite area on the surface of a natural freshwater pearl [77]. Further study on the bottom cross-section sample and another pearl that displayed similar unusual chemical characteristics (pearl B in [72]) has to be performed to ensure the identification results.

12. Future Possibilities and Conclusions

The advancements of various treatments and laboratory-growth methods have required the use of complex analytical identification instruments, such as mapping spectrometers and automated gem testing. The ability to quickly and easily collect Raman and PL data has allowed gemologists to perform fundamental research on spatial inhomogeneities in ways that were not possible just a few short years ago. This has created numerous avenues across a wide variety of gem materials to study growth mechanisms, a deeper exploration of various treatments, and look into wider applications such as geographic origin determination.
In the future, we expect to see improvements in data resolution and sensitivity and likely the integration of various mapping technologies. While this article has focused on several gemological applications and scientific research using Raman and PL mapping, other applications on gem materials not recounted here have also been studied [78,79,80,81,82,83,84]. Additionally, similar research aims have involved other mapping technologies such as IR absorption mapping [85,86,87,88,89], cathodoluminescence mapping [90,91,92,93,94,95], chemical analysis using LIBS [96] or X-ray fluorescence [97], electron paramagnetic resonance (EPR) imaging [98], and fluorescence decay (luminescence lifetime) mapping [99,100]. In the future, we expect that instrumentation will be able to integrate these various technologies together.
The Raman and PL mapping technique allows scientists and researchers to quickly collect and analyze Raman and PL spectra so they can more easily identify the nature of defects, species identification, or structure in diamonds, pearls, and other gemstones. Additionally, it permits gemologists to evaluate new criteria for distinguishing treated and lab-grown gemstones and, for some, to better discern the country of origin.

Author Contributions

Conceptualization, S.E.-M., C.M.B., A.C.P., A.H., Z.S. and G.M.; investigation, S.E.-M., C.M.B., A.C.P., A.H., Z.S. and G.M.; data curation, S.E.-M., C.M.B., A.C.P., A.H., Z.S. and G.M.; writing—original draft preparation, S.E.-M., C.M.B., A.C.P., A.H., Z.S. and G.M.; writing—review and editing, S.E.-M.; project administration, S.E.-M. All authors have read and agreed to the published version of the manuscript.

Funding

This research received no external funding.

Acknowledgments

The authors thank Lorne Loudin, Troy Ardon, Evan Smith, Barbara Dutrow, Wuyi Wang, Chunhui Zhou, and Ulrika D’Haenens-Johansson for their advice and assistance with the experimental collection and/or data analysis.

Conflicts of Interest

The authors declare no conflict of interest.

References

  1. Breeding, C.M.; Shen, A.H.; Eaton-Magana, S.; Rossman, G.R.; Shigley, J.E.; Gilbertson, A. Developments in gemstone analy-sis techniques and instrumentation during the 2000s. Gems Gemol. 2010, 46, 241–257. [Google Scholar] [CrossRef]
  2. Lim, H.J.; Park, S.Y.; Cheong, H.S.; Choi, H.M.; Kim, Y.C. Discrimination between natural and HPHT-treated type IIa diamonds using photoluminescence spectroscopy. Diam. Relat. Mater. 2010, 19, 1254–1258. [Google Scholar] [CrossRef]
  3. Wotherspoon, A.; Steeds, J.W.; Catmull, B.; Butler, J. Photoluminescence and positron annihilation measurements of nitrogen doped CVD diamond. Diam. Relat. Mater. 2003, 12, 652–657. [Google Scholar] [CrossRef]
  4. Groat, L.A.; Giuliani, G.; Stone-Sundberg, J.; Sun, Z.; Renfro, N.D.; Palke, A.C. A review of analytical methods used in geographic origin determination of gemstones. Gems Gemol. 2019, 55, 512–535. [Google Scholar] [CrossRef] [Green Version]
  5. Bersani, D.; Lottici, P.P. Applications of Raman spectroscopy to gemology. Anal. Bioanal. Chem. 2010, 397, 2631–2646. [Google Scholar] [CrossRef]
  6. Kiefert, L.; Karampelas, S. Use of the Raman spectrometer in gemmological laboratories: Review. Spectrochim. Acta A 2011, 80, 119–124. [Google Scholar] [CrossRef]
  7. Jaszczak, J.A. Raman spectroscopy in the identification and study of minerals. Rocks Miner. 2013, 88, 184–189. [Google Scholar] [CrossRef]
  8. Loudin, L.C. Photoluminescence mapping of optical defects in HPHT synthetic diamond. Gems Gemol. 2017, 53, 180–188. [Google Scholar] [CrossRef]
  9. Fiquet, G.; Richet, P.; Montagnac, G. High-temperature thermal expansion of lime, periclase, corundum and spinel. Phys. Chem. Miner. 1999, 27, 103–111. [Google Scholar] [CrossRef]
  10. Read, P.G. Gemmology, 3rd ed.; Elsevier Butterworth-Heinemann: Oxford, UK, 2008. [Google Scholar]
  11. Collins, A.T. Colour centres in diamond. J. Gemmol. 1982, 18, 37–75. [Google Scholar] [CrossRef]
  12. Eaton-Magana, S.; Breeding, C.M. An introduction to photoluminescence spectroscopy for diamond and its application to gemology. Gems Gemol. 2016, 52, 2–17. [Google Scholar] [CrossRef]
  13. Eaton-Magana, S.; McElhenny, G.; Breeding, C.M.; Ardon, T. Comparison of gemological and spectroscopic features in type IIa and Ia natural pink diamonds. Diam. Relat. Mater. 2020, 105, 107784. [Google Scholar] [CrossRef]
  14. Eaton-Magana, S.; Ardon, T. Spatial distribution of defects in natural type IIb diamond after irradiation and annealing. Diam. Relat. Mater. 2020, 109, 108034. [Google Scholar] [CrossRef]
  15. Renfro, N.D.; Palke, A.C.; Berg, R.B. Gemological characterization of sapphires from Yogo Gulch, Montana. Gems Gemol. 2018, 54, 184–201. [Google Scholar] [CrossRef]
  16. Zaitsev, A.M. Optical Properties of Diamond; Springer: New York, NY, USA, 2003. [Google Scholar]
  17. Hainschwang, T.; Notari, F.; Pamies, G. A defect study and classification of brown diamonds with deformation-related color. Minerals 2020, 10, 903. [Google Scholar] [CrossRef]
  18. Crameri, F.; Shephard, G.E.; Heron, P.J. The misuse of colour in science communication. Nat. Commun. 2020, 11, 1–10. [Google Scholar] [CrossRef] [PubMed]
  19. Raman, C.V.; Krishnan, K.S. A new type of secondary radiation. Nature 1928, 121, 501–502. [Google Scholar] [CrossRef]
  20. Gaillou, E.; Post, J.E.; Bassim, N.D.; Zaitsev, A.M.; Rose, T.; Fries, M.D.; Stroud, R.M.; Steele, A.; Butler, J.E. Spectroscopic and microscopic characterizations of color lamellae in natural pink diamonds. Diam. Relat. Mater. 2010, 19, 1207–1220. [Google Scholar] [CrossRef]
  21. Howell, D.; Fisher, D.; Piazolo, S.; Griffin, W.L.; Sibley, S.J. Pink color in Type I diamonds: Is deformation twinning the cause? Am. Mineral. 2015, 100, 1518–1527. [Google Scholar] [CrossRef]
  22. Titkov, S.V.; Mineeva, R.M.; Zudin, N.G.; Sergeev, A.M.; Speransky, A.V.; Shigley, J.E.; Breeding, C.M. Spectroscopic and gemological study of purple diamonds from Siberia. In Proceedings of the 30th International Gemmological Conference, Moscow, Russia, 15–19 July 2007; pp. 123–124. [Google Scholar]
  23. Eaton-Magana, S.; Ardon, T.; Zaitsev, A.M. Inclusion and point defect charactereistics of Marange graphite-bearing diamonds and high temperature annealing. Diam. Relat. Mater. 2017, 71, 20–29. [Google Scholar] [CrossRef]
  24. Smit, K.V.; Shirey, S.B.; Stern, R.A.; Steele, A.; Wang, W. Diamond growth from C-H-N-O recycled fluids in the lithosphere: Evidence from CH4 micro-inclusions and delta13C-delta15N-N content in Marange mixed-habit diamonds. Lithos 2016, 265, 68–81. [Google Scholar] [CrossRef]
  25. Rondeau, B.; Fritsch, E.; Guiraud, M.; Chalain, J.P.; Notari, F. Three historical ‘asteriated’ hydrogen-rich diamonds: Growth history and sector-dependent impurity incorporation. Diam. Relat. Mater. 2004, 13, 1658–1673. [Google Scholar] [CrossRef]
  26. Lang, A.R.; Bulanova, G.P.; Fisher, D.; Furkert, S.; Sarua, A. Defects in a mixed-habit Yakutian diamond: Studies by optical and cathodoluminescence microscopy, infrared absorption, Raman scattering and photoluminescence spectroscopy. J. Cryst. Growth 2007, 309, 170–180. [Google Scholar] [CrossRef]
  27. Breeding, C.M.; Eaton-Magana, S.; Shigley, J.E. Natural-color green diamonds: A beautiful conundrum. Gems Gemol. 2018, 54, 2–27. [Google Scholar] [CrossRef]
  28. Kane, R.E.; McClure, S.F.; Menzhausen, J. The legendary Dresden Green diamond. Gems Gemol. 1990, 26, 248–266. [Google Scholar] [CrossRef]
  29. Bosshart, G. The Dresden green. J. Gemmol. 1989, 21, 351–362. [Google Scholar] [CrossRef]
  30. Zaitsev, A.M.; Moe, K.S.; Wang, W. Optical centers and their depth distribution in electron irradiated CVD diamond. Diam. Relat. Mater. 2017, 71, 38–52. [Google Scholar] [CrossRef]
  31. Nasdala, L.; Grambole, D.; Wildner, M.; Gigler, A.M.; Hainschwang, T.; Zaitsev, A.M.; Harris, J.W.; Milledge, J.; Schulze, D.; Hofmeister, W.; et al. Radio-colouration of diamond: A spectroscopic study. Contrib. Miner. Pet. 2012, 165, 843–861. [Google Scholar] [CrossRef]
  32. Eaton-Magana, S.; Moe, K.S. Temperature effects on radiation stains in natural diamonds. Diam. Relat. Mater. 2016, 64, 130–142. [Google Scholar] [CrossRef]
  33. Ardon, T.; Eaton-Magana, S. Multiple radiation stains suggest interesting geological residency. Gems Gemol. 2020, 56, 283–285. [Google Scholar]
  34. Eaton-Magana, S.; McElhenny, G. Diamond with cavities showing radiation evidence. Gems Gemol. 2020, 56, 126–127. [Google Scholar]
  35. Wang, W.; Yazawa, E.; Persaud, S.; Myagkaya, E.; D’Haenens-Johansson, U.F.S.; Moses, T.M. Formation of the "Matryoshka" Diamond from Siberia. Gems Gemol. 2020, 56, 127–128. [Google Scholar]
  36. Gem News International. Crowningshieldite: A new mineral. Gems Gemol. 2018, 54, 469. [Google Scholar]
  37. Smith, E.M.; Shirey, S.B.; Wang, W. The very deep origin of the world’s biggest diamonds. Gems Gemol. 2017, 53, 388–403. [Google Scholar] [CrossRef]
  38. Renfro, N.D.; Koivula, J.I.; Muyal, J.; McClure, S.F.; Schumacher, K.; Shigley, J.E. Chart: Inclusions in natural, synthetic, and treated diamond. Gems Gemol. 2018, 54, 428–429. [Google Scholar]
  39. McElhenny, G.; Turner, M.; Breeding, C.M. Corundum Inclusions in Gem Diamond. Gems Gemol. 2020, 56, 129–131. [Google Scholar]
  40. Welbourn, C.M.; Cooper, M.; Spear, P.M. De Beers natural versus synthetic diamond verification instruments. Gems Gemol. 1996, 32, 156–169. [Google Scholar] [CrossRef]
  41. Eaton-Magana, S.; Shigley, J.E. Observations on CVD-grown synthetic diamonds: A review. Gems Gemol. 2016, 52, 222–245. [Google Scholar] [CrossRef]
  42. Palke, A.C.; Saeseaw, S.; Renfro, N.D.; Sun, Z.; McClure, S.F. Geographic origin determination of blue sapphire. Gems Gemol. 2019, 55, 536–579. [Google Scholar] [CrossRef] [Green Version]
  43. Dubinsky, E.V.; Stone-Sundberg, J.; Emmet, J.L. A quantitative description of the causes of color in corundum. Gems Gemol. 2020, 56, 2–28. [Google Scholar] [CrossRef]
  44. Emmett, J.L.; Stone-Sundberg, J.; Guan, Y.; Sun, Z. The role of silicon in the color of gem corundum. Gems Gemol. 2017, 53, 42–47. [Google Scholar] [CrossRef]
  45. Zaw, K.; Sutherland, L.; Yui, T.F.; Meffre, S.; Thu, K. Vanadium-rich ruby and sapphire within Mogok Gemfield, Myanmar: Implications for gem color and genesis. Miner. Deposita 2015, 50, 25–39. [Google Scholar] [CrossRef]
  46. Sorokina, E.S.; Hofmeister, W.; Hager, T.; Mertz-Kraus, R.; Buhre, S.; Saul, J.M. Morphological and chemical evolution of corundum (ruby and sapphire): Crystal ontogeny reconstructed by EPMA, LA-ICP-MS, and Cr3+ Raman mapping. Am. Mineral. 2016, 101, 2716–2722. [Google Scholar] [CrossRef]
  47. Palke, A.C. Coexisting rubies and blue sapphires from major world deposits: A brief review of their mineralogical properties. Minerals 2020, 10, 472. [Google Scholar] [CrossRef]
  48. McClure, S.F.; Moses, T.M.; Shigley, J.E. What’s Next? Gems Gemol. 2019, 55, 682–684. [Google Scholar]
  49. Katsurada, Y.; Sun, Z. Cuprian liddicoatite tourmaline. Gems Gemol. 2017, 53, 34–41. [Google Scholar] [CrossRef]
  50. Katsurada, Y.; Sun, Z.; Breeding, C.M.; Dutrow, B.L. Geographic origin determination of Paraiba tourmaline. Gems Gemol. 2019, 55, 648–659. [Google Scholar] [CrossRef]
  51. Sun, Z.; Palke, A.C.; Breeding, C.M.; Dutrow, B.L. A new method for determining gem tourmaline species by LA-ICP-MS. Gems Gemol. 2019, 55, 2–17. [Google Scholar] [CrossRef]
  52. Dirlam, D.M.; Laurs, B.M.; Pezzotta, F.; Simmons, W.B. Liddicoatite tourmaline from Anjanabonoina, Madagascar. Gems Gemol. 2002, 38, 28–53. [Google Scholar] [CrossRef] [Green Version]
  53. Henry, D.J.; Dutrow, B.L. The incorporation of fluorine in tourmaline: Internal crystallographic controls or external environmental influences? Can. Miner. 2011, 49, 41–56. [Google Scholar] [CrossRef]
  54. Hoang, L.H.; Hien, N.T.M.; Chen, X.B.; Minh, N.V.; Yang, I.S. Raman spectroscopic study of various types of tourmaline. J. Raman Spectrosc. 2011, 42, 1442–1446. [Google Scholar] [CrossRef]
  55. McClure, S.F. The Jadeite/Omphacite Nomenclature Question, GIA News from Research; Gemological Institute of America: Carlsbad, CA, USA, 2012. [Google Scholar]
  56. Franz, L.; Sun, T.T.; Hänni, H.A.; de Capitani, C.; Thanasuthipitak, T.; Atichat, W. A comparative study of jadeite, omphacite and kosmochlor jades from Myanmar, ans suggestions for a practical nomenclature. J. Gemmol. 2014, 34, 210–229. [Google Scholar] [CrossRef]
  57. Coccato, A.; Karampelas, S.; Worle, M.; van Willigen, S.; Petrequin, P. Gem quality and archaeological green ‘jadeite jade’ versus ‘omphacite jade’. J. Raman Spectrosc. 2014, 45, 1260–1265. [Google Scholar] [CrossRef]
  58. Lafuente, B.; Downs, R.T.; Yang, H.; Stone, N. The Power of Databases: The RRUFF Project; Walter de Gruyter GmbH: Berlin, Germany, 2016. [Google Scholar]
  59. Wang, W.; Scarratt, K.; Hyatt, A.; Shen, A.H.-T.; Hall, M. Identification of “chocolate pearls” treated by Ballerina Pearl Co. Gems Gemol. 2006, 42, 222–235. [Google Scholar] [CrossRef] [Green Version]
  60. Karampelas, S.; Fritsch, E.; Mevellec, J.Y.; Gauthier, J.P.; Sklavounos, S.; Soldatos, T. Determination by Raman scattering of the nature of pigments in cultured freshwater pearls from the mollusk Hyriopsis cumingi. J. Raman Spectrosc. 2007, 38, 217–230. [Google Scholar] [CrossRef]
  61. Liping, L.; Zhonghui, C. Cultured pearls and colour-changed cultured pearls: Raman spectra. J. Gemmol. 2001, 27, 449–455. [Google Scholar] [CrossRef] [Green Version]
  62. Hänni, H.A. Explaining the flame structure of non-nacreous pearls. Aust. Gemmol. 2010, 24, 85–88. [Google Scholar]
  63. Scarratt, K.; Hanni, H.A. Pearls from the lion’s paw scallop. J. Gemmol. 2004, 29, 193–203. [Google Scholar] [CrossRef] [Green Version]
  64. Sturman, N.; Homkrajae, A.; Manustrong, A.; Somsa-ard, N. Observations on pearls reportedly from the Pinnidae family (Pen pearls). Gems Gemol. 2014, 50, 202–215. [Google Scholar] [CrossRef]
  65. LeCroy, B.; Homkrajae, A. 15.53 ct pearl discovered in edible oyster from the Ostreidae family. Gems Gemol. 2020, 56, 420–422. [Google Scholar]
  66. Strack, E. Pearls; Rϋhle-Diebener: Stuttgart, Germany, 2006. [Google Scholar]
  67. Ma, H.Y.; Lee, I.S. Characterization of vaterite in low quality freshwater cultured pearls. Mater. Sci. Eng. C 2006, 26, 721–723. [Google Scholar] [CrossRef]
  68. Wehrmeister, U.; Jacob, D.E.; Soldati, A.L.; Hager, T.; Hofmeister, W. Vaterite in freshwater cultured pearls from China and Japan. J. Gemmol. 2007, 30, 399–412. [Google Scholar] [CrossRef]
  69. Qiao, L.; Feng, Q.-L.; Li, Z. Special vaterite found in freshwater lackluster pearls. Cryst. Growth Des. 2007, 7, 275–279. [Google Scholar] [CrossRef]
  70. Bourrat, X.; Qiao, L.; Feng, Q.L.; Angellier, M.; Dissaux, A.; Beny, J.M.; Barbin, V.; Stempfle, P.; Rousseau, M.; Lopez, E. Origin of growth defects in pearl. Mater. Charact. 2012, 72, 94–103. [Google Scholar] [CrossRef] [Green Version]
  71. Soldati, A.L.; Jacob, D.E.; Wehrmeister, U.; Hofmeister, W. Structural characterization and chemical composition of aragonite and vaterite in freshwater cultured pearls. Miner. Mag. 2008, 72, 579–592. [Google Scholar] [CrossRef]
  72. Sturman, N.; Otter, L.M.; Homkrajae, A.; Manustrong, A.; Nilpetploy, N.; Lawanwong, K.; Kessrapong, P.; Jochum, K.P.; Stoll, B.; Gotz, H.; et al. A pearl identification challenge. Gems Gemol. 2019, 55, 229–243. [Google Scholar] [CrossRef]
  73. Ma, H.; Zhang, B.; Lee, I.S.; Qin, Z.; Tong, Z.; Qiu, S. Aragonite observed in the prismatic layer of seawater-cultured pearls. Front. Mater. Sci. China 2007, 1, 326–329. [Google Scholar] [CrossRef]
  74. Habermann, D.; Banerjee, A.; Meijer, J.; Stephan, A. Investigation of manganese in salt- and freshwater pearls. Nucl. Instrum. Methods Phys. Res. Sect. B 2001, 181, 739–743. [Google Scholar] [CrossRef]
  75. Ma, H.Y.; Su, A.; Zhang, B.; Li, R.K.; Zhou, L.C.; Wang, B. Vaterite or aragonite observed in the prismatic layer of freshwater-cultured pearls from south China. Prog. Nat. Sci. 2009, 19, 817–820. [Google Scholar] [CrossRef]
  76. Ma, H.; Li, R.; Yang, L.; Zhang, B.; Shen, M.; Mu, S.; Wei, Q. A modified integrated model of the internal structure of Chinese cultured pearls. J. Wuhan Univ. Technol. Sci. Ed. 2011, 26, 510–513. [Google Scholar] [CrossRef]
  77. Karampelas, S.; Mohamed, F.; Abdulla, H.; Almahmood, F.; Flamarzi, L.; Sangsawong, S.; Alalawi, A. Chemical characteristics of freshwater and saltwater natural and cultured pearls from different bivalves. Minerals 2019, 9, 357. [Google Scholar] [CrossRef] [Green Version]
  78. Lenz, C.; Nasdala, L. A photoluminescence study of REE3+ emissions in radiation-damaged zircon. Am. Miner. 2015, 100, 1123–1133. [Google Scholar] [CrossRef] [Green Version]
  79. Lenz, C.; Belousova, E.; Lumpkin, G.R. The in-situ quantification of structural radiation damage in zircon using laser-induced confocal photoluminescence spectroscopy. Minerals 2020, 10, 83. [Google Scholar] [CrossRef] [Green Version]
  80. Lee, C.W.Y.; Cheng, J.; Cheng, K.W.; Hui, T.K.C.; Batten, T. Raman Spectroscopy and Photoluminescence Mapping of Diamonds with Multiple Fluorescence Zones. MD Tech. Rev. Lett. Available online: http://www.gems-ltd.org/resources/research/Raman%20Spectroscopy%20and%20Photoluminescence%20Mapping.docx.pdf (accessed on 3 February 2021).
  81. Korsakov, A.V.; Hutsebaut, D.; Theunissen, K.; Vandenabeele, P.; Stepanov, A.S. Raman mapping of coesite inclusions in garnet from the Kokchetav massif (Northern Kazakhstan). Spectrochim. Acta Part A Mol. Biomol. Spectrosc. 2007, 68, 1046–1052. [Google Scholar] [CrossRef] [Green Version]
  82. Bernard, S.; Beyssac, O.; Benzerara, K. Raman mapping using advanced line-scanning systems: Geological applications. Appl. Spectrosc. 2008, 62, 1180–1188. [Google Scholar] [CrossRef]
  83. Smith, D.C. Raman micro-mapping of chemical and/or physical mineral phase transformations involving jadeite, coesite, diamond or zircon in natural ultra-high pressure metamorphic environments (UHPM). 2004. Unpublished work. [Google Scholar]
  84. Zeug, M.; Vargas, A.I.R.; Nasdala, L. Spectroscopic study of inclusions in gem corundum from Mercaderes, Cauca, Colombia. Phys. Chem. Miner. 2016, 44, 221–233. [Google Scholar] [CrossRef] [Green Version]
  85. Babich, Y.V.; Feigelson, B.N. Spatial distribution of the nitrogen defects in synthetic diamond monocrystals: Data of IR mapping. Geochem. Int. 2009, 47, 94–98. [Google Scholar] [CrossRef]
  86. Shiryaev, A.A.; Johner, N.; Zedgenizov, D.A. Infra-red mapping of defects in diamonds using a focal plane array (FPA) detector. In Proceedings of the 20th General Meeting International Mineralogical Association, Budapest, Hungary, 21–27 August 2010. [Google Scholar]
  87. Howell, D.; O’Neill, C.J.; Grant, K.J.; Griffin, W.L.; O’Reilly, S.Y.; Pearson, N.J.; Stern, R.A.; Stachel, T. Platelet development in cuboid diamonds: Insights from micro-FTIR mapping. Contrib. Miner. Pet. 2012, 164, 1011–1025. [Google Scholar] [CrossRef]
  88. Howell, D.; Collins, A.T.; Loudin, L.C.; Diggle, P.L.; D’Haenens-Johansson, U.F.S.; Smit, K.V.; Katrusha, A.N.; Butler, J.E.; Nestola, F. Automated FTIR mapping of boron distribution in diamond. Diam. Relat. Mater. 2019, 96, 207–215. [Google Scholar] [CrossRef]
  89. Spetsius, Z.V.; Bogush, I.N.; Kovalchuk, O.E. FTIR mapping of diamond plates of eclogitic and peridotitic xenoliths from the Nyurbinskaya pipe, Yakutia: Genetic implications. Russ. Geol. Geophys. 2015, 56, 344–353. [Google Scholar] [CrossRef]
  90. Edwards, P.R.; Martin, R.W.; Lee, M.R. Simultaneous cathodoluminescence hyperspectral imaging and X-ray microanalysis. Goldschmidt Conf. Abstr. 2005, A591. [Google Scholar]
  91. Lee, R.L.; Martin, R.W.; Edwards, P.R.; Parsons, I. Hyperspectral cathodoluminescence mapping of calcite and feldspar. Goldschmidt Conf. Abstr. 2005, A593. [Google Scholar]
  92. MacRae, C.M.; Wilson, N.C.; Torpy, A.; Davidson, C.J. Hyperspectral cathodoluminescence imaging and analysis extending from the ultraviolet to near-infrared. Microsc. Microanal. 2012, 18, 1239–1245. [Google Scholar] [CrossRef]
  93. MacRae, C.M.; Wilson, N.C.; Torpy, A. Hyperspectral cathodoluminescence. Miner. Pet. 2013, 107, 429–440. [Google Scholar] [CrossRef]
  94. Edwards, P.R.; Martin, R.W.; Lee, M.R. Combined cathodoluminescence hyperspectral imaging and wavelength dispersive X-ray analysis of minerals. Am. Mineral. 2007, 92, 235–242. [Google Scholar] [CrossRef]
  95. Lee, M.R.; Parsons, I.; Edwards, P.R.; Martin, R.W. Identification of cathodoluminescence activators in zoned alkali feldspars by hyperspectral imaging and electron-probe microanalysis. Am. Mineral. 2007, 92, 243–253. [Google Scholar] [CrossRef]
  96. Piñon, V.; Mateo, M.P.; Nicolas, G. Laser-induced breakdown spectroscopy for chemical mapping of materials. Appl. Spectrosc. Rev. 2013, 48, 357–383. [Google Scholar] [CrossRef]
  97. Liedl, A.; Polese, C.; Hampai, D.; Della-Ventura, G.; Dabagov, S.B.; Marcelli, A.; Bellatreccia, F.; Cavallo, A. X-ray micro-computed tomography and micro X-ray fluorescence mapping of synthetic emerald by using a laboratory polycapillary optics X-ray tube layout. X-ray Spectrom. 2014, 44, 201–203. [Google Scholar] [CrossRef]
  98. Watt, G.A.; Newton, M.E.; Baker, J.M. EPR and optical imaging of the growth-sector dependence of radiation-damage defect population in synthetic diamond. Diam. Relat. Mater. 2001, 10, 1681–1683. [Google Scholar] [CrossRef]
  99. Liaugaudas, G.; Collins, A.T.; Suhling, K.; Davies, G.; Heintzmann, R. Luminescence-lifetime mapping in diamond. J. Phys. Condens. Matter 2009, 21, 364210. [Google Scholar] [CrossRef] [PubMed]
  100. Jones, D.C.; Kumar, S.; Lanigan, P.M.; McGuinness, C.D.; Dale, M.W.; Twitchen, D.J.; Fisher, D.; Martineau, P.M.; Neil, M.A.A.; Dunsby, C.; et al. Multidimensional lumiescence microscope for imaging defect colour centres in diamond. Methods Appl. Fluoresc. 2019, 8, 014004. [Google Scholar] [CrossRef] [PubMed]
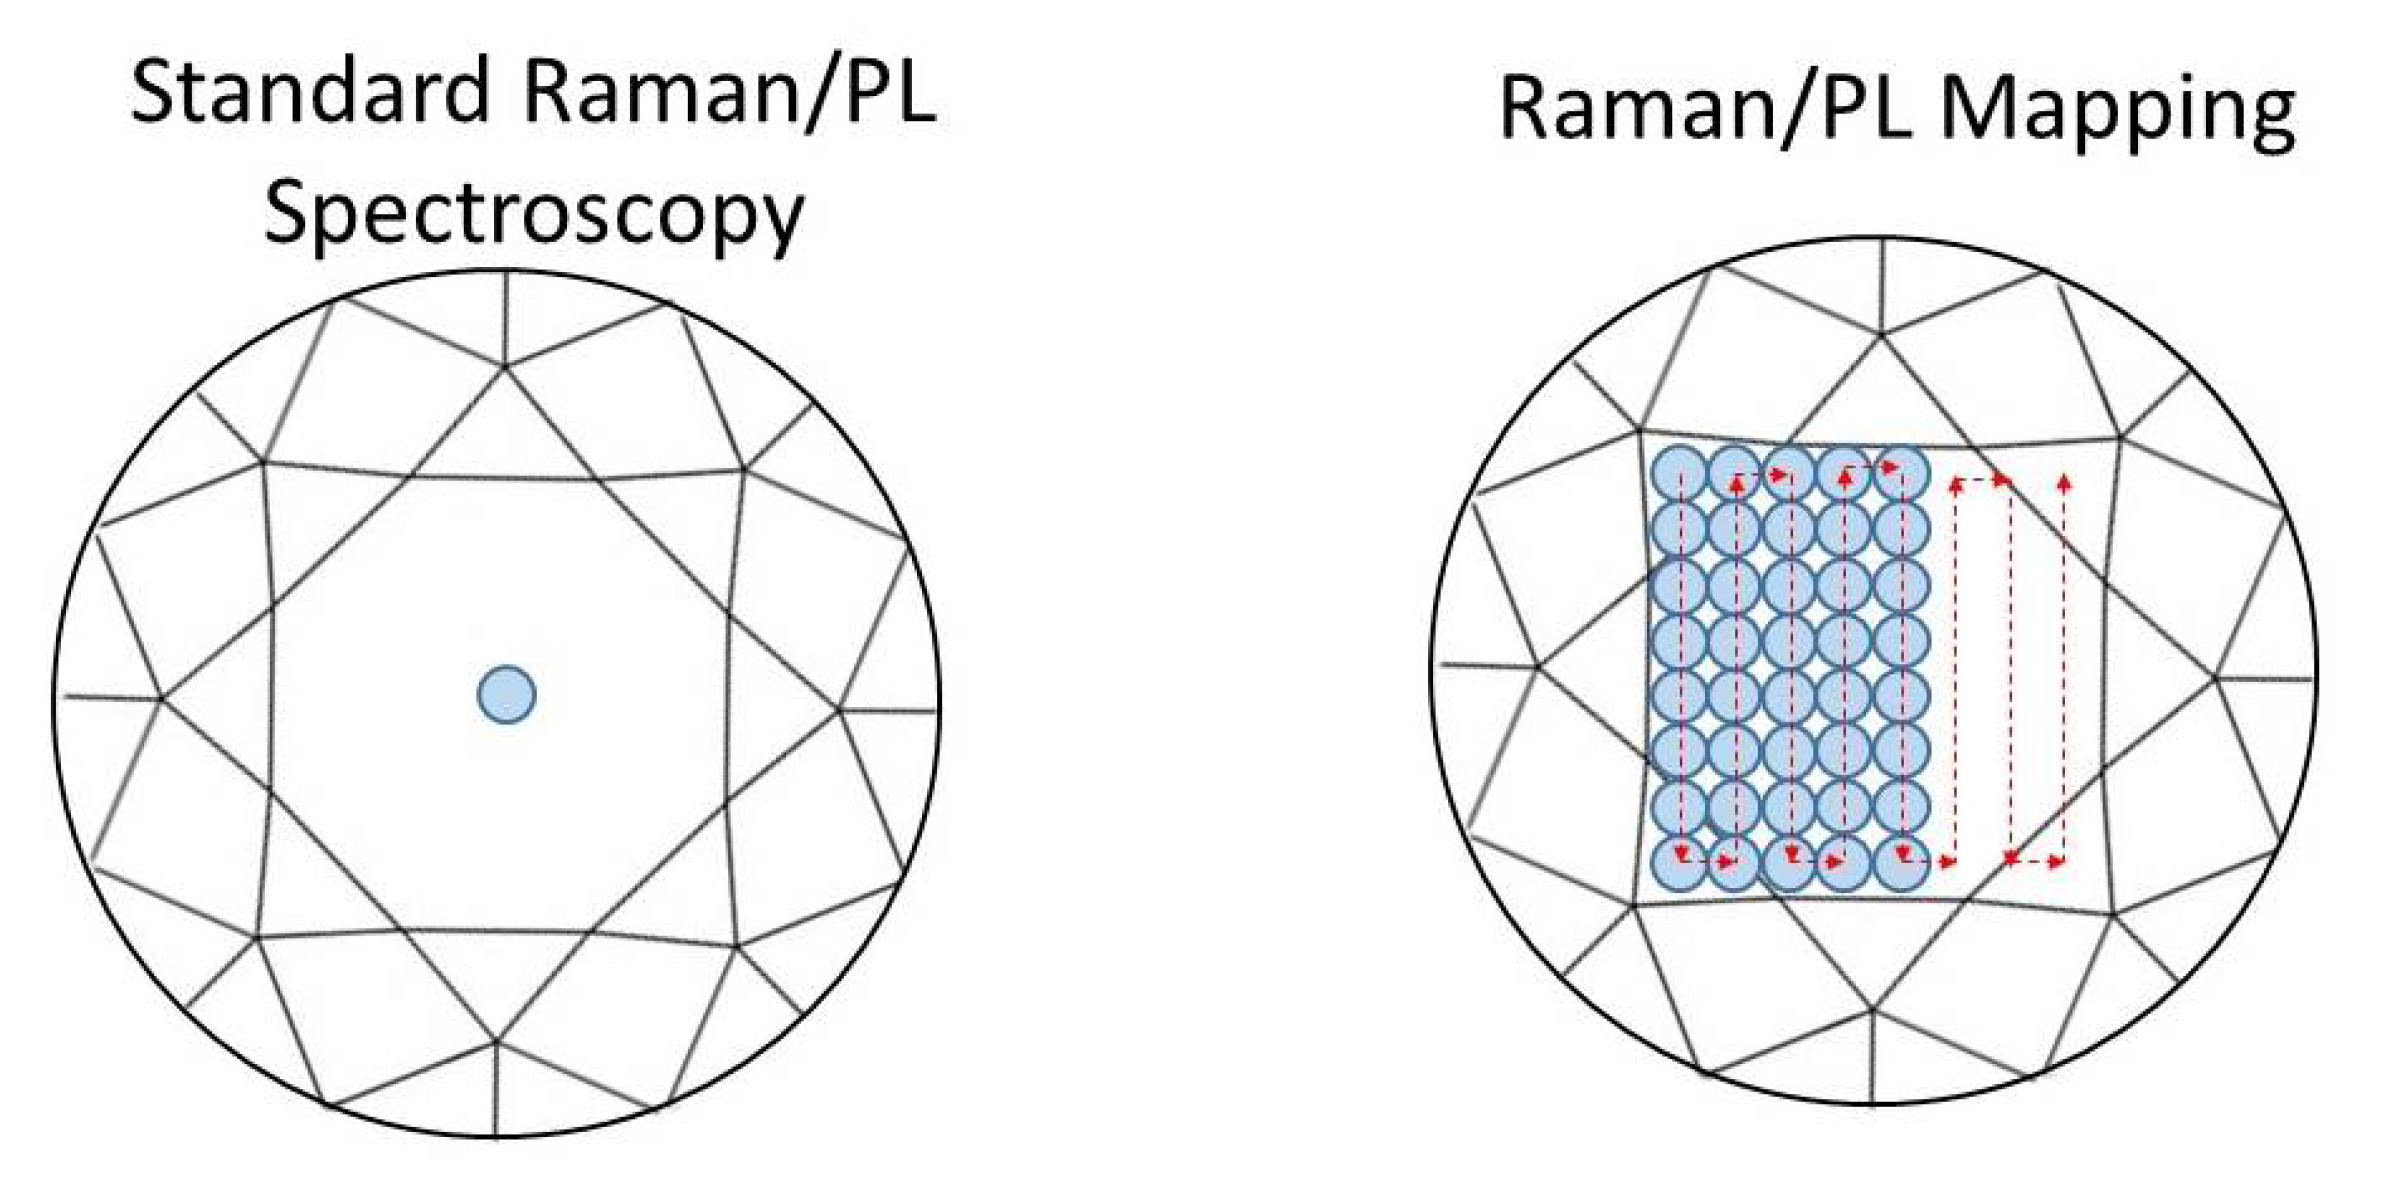
Figure 1. Data collection across the table facet of a round diamond with standard spectroscopy (Left) is compared against mapping spectroscopy in which spectra are collected across the entire surface (Right) [8].
Minerals 11 00177 g001
Figure 2. These PL maps were collected on the table of a faceted diamond at liquid nitrogen temperature. The PL map on the left was collected without any graphite coating on the pavilion faceted while the PL map at right had the coating to reduce the pavilion reflections.
Minerals 11 00177 g002
Figure 3. (A) Here is an example of a type Ia natural diamond with pronounced brown graining. (B) A few individual spectra along with some example calculations are shown as illustration of the internal, baseline-corrected calculations occurring for the dozens of possible variables across the thousands of collected spectra. (C) These false color PL maps were assembled from data collected with 455 nm excitation with the diamond submerged in liquid nitrogen. The PL mapping data are composed of ~26,000 individual spectra taken with a 10 µm pixel size in 4½ min. They show the normalized peak intensity for the H4 defect at 495.9 nm and the PL feature at 490.7 nm. (D) For the PL map shown in Figure 3C, right, the color ranges are adjusted to opposite extremes to illustrate the differences in data representation that can be seen from adjusting the color limits. (E) Additional analysis of the spectral data is possible by exporting the calculated values into external programming, such as plotting the intensities of various spectral features within a spreadsheet software in which each datapoint originates from a different spectrum. The data shown here for H3 and the 490.7 nm defect are for illustration only; no correlation can be concluded based on results from a single sample.
Minerals 11 00177 g003
Figure 4. PL spectra were collected on the same diamond using two different lasers (488 and 514 nm) at liquid nitrogen temperature. The resulting spectra are plotted against the wavelength. Each laser shows a different location for the diamond Raman line based on the excitation wavelength. For both lasers, the energy difference between the excitation wavelength and the Raman line is constant—1332 cm−1. Each spectrum shows the luminescence feature NV0 and the activation for its zero-phonon line (ZPL) is fixed at 575 nm regardless of the excitation source.
Minerals 11 00177 g004
Figure 5. (A) This thin plate (4 × 4 × 1.6 mm) fashioned from a natural diamond sourced from Siberia showed pink-to-purple coloration concentrated along thin parallel lamellae [22]. (B) The PL map of a broad emission band (~600–750 nm) using 532 nm excitation. (C) A line scan of a portion of the map. The data were collected in confocal mode with a 3 µm pixel size.
Minerals 11 00177 g005
Figure 6. Raman mapping of a cubo-octahedral diamond plate from the Marange deposit in Zimbabwe, which often shows regions of grayish clouds. The image and Raman map are looking at the boundary between colorless and included regions, studying the graphite-related Raman feature at a Raman shift of 1600 cm−1. This room-temperature Raman map is composed of 2968 individual spectra with 5 µm pixel size and took 4.5 h to complete using 532 nm excitation.
Minerals 11 00177 g006
Figure 7. (Left) PL mapping of GR1 (vacancy) defects on the surface of a natural rough diamond on heavily irradiated areas that show dark green stains and ~20 µm narrow adjacent zones of GR1. (Right) A higher magnification version of the left image shows an overlay of the regions with high GR1 (box with red outlines) along with the corresponding PL map, which is displaced in order to show the radiation features underneath. The arrows are indicating a few examples of the narrow regions with elevated GR1 concentration and have a width of 18.5–22 µm, consistent with the penetration depth for alpha irradiation.
Minerals 11 00177 g007
Figure 8. PL mapping of GR1 at the edge of a cleaved diamond sample with radiation damage shows that the structure of vacancy distribution at depth in the diamond is similar to that observed adjacent to surface stains.
Minerals 11 00177 g008
Figure 9. (Left) DiamondView fluorescence image showed interesting green fluorescence around the cavities on the crown facet of a 0.70 ct E-color diamond. The green fluorescent haloes were created by radioactive fluids (Center). Subsequent PL mapping with 532 nm excitation showed that high amounts of radiation brought about a number of localized changes in the diamond surrounding the cavities. (Right) A line scan (indicated by a black line in the central image) shows the normalized peak intensity for the GR1 from the PL map, collected at 3 μm intervals [34].
Minerals 11 00177 g009
Figure 10. The 0.62 ct greenish rough diamond was termed the “Matryoshka” diamond because of the free-moving internal diamond. (A) Camera mosaic generated by the mapping instrument shows the internal diamond in focus and the external diamond out of focus; the confocal PL mapping was collected at the corresponding focal plane. (B) The PL map of the normalized GR1 defect intensity at 741.2 nm (normalized using the diamond Raman peak at 691 nm) was collected with 633 nm excitation at liquid nitrogen temperature. For this map, ~34,000 individual spectra were collected with a 25 µm pixel size over a collection time of 7½ min. The red arrow in both figures shows an area of high GR1 intensity on the surface of the internal diamond. For this diamond, we did not use graphite paint (e.g., Figure 2) as we were concerned about the paint potentially entering the internal cavity and instead fixed graphite tape to the bottom of the sample while imaging.
Minerals 11 00177 g010
Figure 11. Top left: Photomicrograph of the breyite inclusion located within a type IIa pink diamond; the red box shows the area being mapped. Top center: False color map showing the spatial distribution of graphite around the breyite inclusion. Top right: False color map showing the spatial distribution of the 640–680 cm−1 peak found in the breyite spectra. Bottom: Raman spectrum showing the identification of the breyite inclusion within the image.
Minerals 11 00177 g011
Figure 12. (A) A 0.13 ct diamond shown to have corundum inclusions. (B) Photomicrograph of the Table 693 nm chromium peaks (532 nm excitation). (C) Photoluminescence spectrum showing the detection of chromium with 532 nm laser excitation. (D) Raman spectra confirming the corundum identification. The blue trace shows the submitted diamond inclusion, while the red trace is a known corundum reference. Spectra vertically offset for clarity [39].
Minerals 11 00177 g012
Figure 13. (A) A 0.46 ct Fancy Vivid yellow HPHT-grown diamond is illuminated by the DiamondView microscope, showing the various intensities and colors of fluorescence across the growth sectors. (B) The PL map for the neutral nitrogen-vacancy (NV0) center—ZPL = 575 nm; (C) PL map for the negatively charged nitrogen-vacancy (NV) center—ZPL = 637 nm; (D) Plot of the values for NV0 vs. NV across the region indicated by the black box in (B). It shows a consistent ratio between these two centers across the growth sectors, thus providing more information than can be determined from a DiamondView image alone.
Minerals 11 00177 g013
Figure 14. (Top) A thin laser-cut slice from a CVD-grown diamond composed of five different layers from five consecutive growth runs using a natural diamond substrate. The sample is shown with 2 types of illumination: visible and DiamondView (fluorescence) illumination, showing the distinct growth interfaces. (Bottom) Spectral data exported from the PL map (along the red line shown in top image) show the change in vacancy-related defects (NV0 at 575 nm, NV at 637 nm, and the negative silicon-vacancy defect at 737 nm) due to the growth interruptions.
Minerals 11 00177 g014
Figure 15. Photo of a Madagascar blue sapphire wafer showing hexagonal blue color zoning with sharp boundaries between blue and colorless zones (left). On the (right) is the Cr distribution map of the same sapphire created by PL mapping.
Minerals 11 00177 g015
Figure 16. Photo of a Burmese blue sapphire wafer showing diffuse color zoning (left). On the (right) is the Cr distribution map of the same sapphire created by PL mapping.
Minerals 11 00177 g016
Figure 17. Photo of a Burmese blue sapphire wafer with homogeneous blue coloration (left). On the (right) is the Cr distribution map of the same sapphire created by PL mapping.
Minerals 11 00177 g017
Figure 18. Representative PL maps showing Cr distribution in Madagascar sapphires demarcating (AE) sharp, oscillatory growth patterns, often arranged in hexagonal patterns, as well as (F) diffuse variations in Cr concentrations.
Minerals 11 00177 g018
Figure 19. Representative PL maps showing Cr distribution in Sri Lankan sapphires demonstrating (AE) sharp, oscillatory growth patterns, often arranged in hexagonal patterns, as well as (F) diffuse variations in Cr concentrations. Note, (A) reproduced from [48].
Minerals 11 00177 g019
Figure 20. Representative PL maps showing Cr distribution in Burmese sapphires showing (A) the near absence of spatial variations in Cr concentrations, (B,C) growth zoning with diffuse boundaries, and (DF) growth zoning with sharp boundaries arranged in hexagonal patterns.
Minerals 11 00177 g020
Figure 21. A pear-shaped step-cut gem quality tourmaline stone from Anjanabonoina, Madagascar. An area was analyzed by the Raman mapping technique (blue rectangle; color scale shown in Figure 23). Laser ablation (LA-ICP-MS) craters are visible as dots across the table of the sample. Chemical data obtained by LA-ICP-MS classify the thickest black band as elbaite, with the remaining sample classified as liddicoatite. Sample courtesy of Barbara L. Dutrow.
Minerals 11 00177 g021
Figure 22. Raman spectra of two pixels in the Raman map. The bottom trace represents a pixel (pixel 1 in Figure 23) classified as elbaite while the top trace represents a pixel (pixel 2 in Figure 23) classified as liddicoatite. The ratio of the integrated green area 1 to the red area 2 can be plotted as the third parameter in the map to differentiate these two species. This allows higher resolution species identification.
Minerals 11 00177 g022
Figure 23. High-resolution Raman map of a portion of the tourmaline shown in Figure 21. Color bar represents the ratio of area 1 to area 2 (see Figure 22), which varies across the analyzed portion. Pixel size is 10 µm and it required 16 h and 24 min to generate this map.
Minerals 11 00177 g023
Figure 24. A low-resolution Raman map of the similar portion of the tourmaline sample shown in Figure 21. Pixel size is 50 µm and it took 48 min to generate this map.
Minerals 11 00177 g024
Figure 25. A ternary diagram for Na-bearing pyroxenes shows the relationships between jadeite, omphacite, and other related minerals.
Minerals 11 00177 g025
Figure 26. Raman spectra collected with a 514 nm laser reveal important differences between jadeite and omphacite. Data from RRUFF database [58].
Minerals 11 00177 g026
Figure 27. Raman map of a “jadeite” ring (left) shows a mixture of mineral compositions. The false color map (right) ranges in color from jadeite (pink) to omphacite (blue) based on the position of the 678–700 cm−1 primary Raman peak.
Minerals 11 00177 g027
Figure 28. High-resolution Raman mapping of the Raman shift position (cm−1) within a small area of the ring from Figure 27 shows jadeite concentrated at grain edges and a matrix of omphacite in between grains. The false color map ranges in color from jadeite (pink) to omphacite (blue) based on the position of the 678–700 cm−1 primary Raman peak.
Minerals 11 00177 g028
Figure 29. Raman mapping of jadeite/omphacite composition from one stone in the ring seen on the left shows a mostly uniform composition of omphacite. This ring would most often be sold as jadeite in the trade due to a relatively poor understanding of the compositional differences and the gemological difficulty in separating them. The false color map (right) ranges in color from jadeite (pink) to omphacite (blue) based on the position of the 678–700 cm−1 primary Raman peak.
Minerals 11 00177 g029
Figure 30. Unpolished surface of the top cross-section sample with two perpendicular lines of spot analyzed by LA-ICP-MS analysis.
Minerals 11 00177 g030
Figure 31. (A) Raman spectra of vaterite (orange), dominant aragonite with minor vaterite bands (blue), dominant calcite with minor vaterite bands (green). (B) The most intense bands correspond to ʋ1 of vaterite showed at 1075, 1080, and 1091 cm−1 whereas in aragonite and calcite spectra displayed at 1085 cm−1 and 1086 cm−1, respectively. (C) The ʋ4 of vaterite showed as weak bands at 667, 685, 740, 743, and 751 cm−1. Doublet bands at 701 and 705 cm−1 belong to aragonite and a single band at 712 cm−1 indicates calcite. The mixture of different polymorphs in the same spectra was presented. The dominant vaterite spectrum contain a tiny band of aragonite at 702 cm−1, and the vaterite bands at 685, 740, 743, 751, and 1075 cm−1 (shoulder) are presented in the dominant aragonite calcite spectra.
Minerals 11 00177 g031
Figure 32. Raman maps collected using the 785 nm laser at room temperature showed intensity variation of the vaterite band at 1091 cm−1 (A) and the calcite band at 712 cm−1 (B). Raman map at 1091 cm−1 peak position showed high intensities of vaterite zone in the center and enclosing with low intensities (dark blue) of aragonite area. Calcite was clearly indicated with 712 cm−1 peak position as an irregular small area (green intensity) associated with vaterite in the center.
Minerals 11 00177 g032
Figure 33. The vaterite growth sector presented in the maps corresponds to the pearl’s internal structure, obtained from X-ray computed microtomography analysis (μ-CT, left) and observed in photomicrograph with transmitted light (right). The vaterite showed lower radiodensity (more transparent) to X-ray than the aragonite area, and it appeared as a darker gray region in μ-CT image.
Minerals 11 00177 g033
Publisher’s Note: MDPI stays neutral with regard to jurisdictional claims in published maps and institutional affiliations.