Article

Optical and Luminescence Spectroscopy of Varicolored Gem Spinel from Mogok, Myanmar and Lục Yên, Vietnam

1
Department of Mineralogy and Petrology, Faculty of Natural Sciences, Comenius University, Ilkovičova 6, 84215 Bratislava, Slovakia
2
Earth Science Institute of the Slovak Academy of Science, Dúbravska Cesta 9, 84005 Bratislava, Slovakia
3
Gemological Laboratory of e–gems.cz, 11000 Prague, Czech Republic
4
Gemmological Laboratory, Department of Geography and Regional Development, Faculty of Natural Sciences, Constantine the Philosopher University in Nitra, Nábrežie mládeže 91, 94974 Nitra, Slovakia
5
Department of Physical and Theoretical Chemistry, Faculty of Natural Sciences, Comenius University, Ilkovičova 6, 84215 Bratislava, Slovakia
6
Department of Geological Sciences, Masaryk University, Kotlářská 2, 61137 Brno, Czech Republic
*
Author to whom correspondence should be addressed.
Minerals 2021, 11(2), 169; https://doi.org/10.3390/min11020169
Submission received: 22 December 2020 / Revised: 26 January 2021 / Accepted: 3 February 2021 / Published: 7 February 2021
(This article belongs to the Special Issue Gemstone Analysis by Spectroscopy and Microscopy)

Abstract

:
We studied 12 crystal fragments of natural spinel from Mogok, Myanmar and Lục Yên, Vietnam. All samples were crystal fragments of various shapes and sizes and several of them had gemological quality. Studied samples are enriched in Cr, V, Fe2+, Fe3+, Zn, which are responsible for its resulting color. They could be divided into groups of V-Cr spinels with Cr 0.001–0.006 apfu, V 0.001–0.004 apfu, and Fe spinels containing increased Fe2+ (0.001–0.017 apfu) and Fe3+ (0.004–0.012 apfu). Some samples show luminescence bands at 677, 685, 697, 710, and 718 nm assigned to Cr3+. The optical absorption spectra of spinels were divided into two groups of V-Cr and Fe spinels based on the dominant element acting on optical spectra. The optical spectrum of V-Cr spinels can be divided into two zones (1) 420–550 nm (V3+ and Cr3+ absorption); (2) 640–1000 nm (Fe2+-Fe3+ charge transfer). The optical absorption spectra of Fe spinels can also be divided into two zones (1) 410–650 nm (Fe2+-Fe3+ charge transfer) and (2) 770–1000 nm (Fe2+). This variation in chromophores results in the differences in color: V-Cr spinels are pink to red, Fe spinels are in shades of blue as well as yellow and pink.

1. Introduction

Due to their wide range of intense colors, high mechanical resistance, and high thermal and chemical stability, minerals belonging to the spinel group are actively sought as gemstones, while synthetic spinel powders are widely used as ceramic pigment. The variability in color displayed by spinels is due to their ability to accommodate a wide range of transition metal cations of different valence states at their structural sites (Fe, Cr, V, Co, etc.) [1]. Spinel color is caused by impurities; without impurities it is colorless. Its color can be brown, black, red, orange, yellow, green, blue, indigo, or purple. The luster is glassy to matt, with a white scratch, the spinel is isotropic [2].
The spinel-supergroup minerals have the general formula AB2X4 [3], where A represents divalent and B trivalent cations at the tetrahedrally and octahedrally coordinated sites in a structure with a cubic nearly close-packed arrangement. In spinel, the A site is occupied by Mg, B contains Al, and X site is occupied by O. Most natural and synthetic spinels are disordered, Al occupies tetrahedral site, and both Al and Mg occupies octahedral sites [4]. This disorder causes defects, electron traps, and vacancies in the crystal structure that complicate the interpretation of the spectra. In nature, the spinel can slowly cool enough to be arranged [5]. The cations occupy one-fourth of the tetrahedral interstices and half of the octahedral interstices in the cubic close packed array of oxide ions (space group Fd3m) [6]. The composition as well as cation distribution of spinel minerals and materials have a strong influence on their physical properties [7], as far as light absorption in concerned [1].
The goal of this paper is a multimethodological study of twelve spinel samples from two localities—Luc Yen, Vietnam and Mogok, Myanmar. These have a different coloring and chemical composition. Chromophores in spinel were identified by electron micro-probe analysis (EMPA) and optical absorption spectroscopy (OAS) to determine the main chromophores or their combination causing the resulting mineral coloration. Similarly, the main luminophores were studied by Raman spectroscopy.

2. Geological Settings

The rich tectonic history of Southeast Asia developed during several deformation episodes related to the closure of the Paleo-Tethys Ocean and, later, to the Himalayan orogeny. The geology of northern Vietnam is dominated by metamorphic rocks (mainly medium-grade mica schist, marble, and granulitic gneisses) inherited from these two major orogenic events: the Indosinian orogeny, and the Himalayan collision [8].
All of Luc Yen’s gem deposits are in the Lo Gam zone of Northern Vietnam. The structure of this unit results from the deformation of the Himalayan orogenesis superimposed on the pre-existing Indosinian structure [9]. The Lo Gam formation consists of a sedimentary series metamorphosed into marble, gneiss, calc-silicates, mica schist, and amphibolite. These metamorphic rocks are sometimes intruded by granitic and pegmatitic dykes [9,10,11]. The marbles are mainly calcitic and interlayered with Al-, V-, and Cr-rich amphibolite. Blue spinel in these primary deposits is not associated with ruby or red spinel [12]. There are numerous deposits in this area including ruby and spinel deposits, also fine tourmaline, sapphire, amazonite, pargasite, and humite [13].
Mogok gem-rich area is located within the central part of the Metamorphic Belt in the Central Myanmar. This assemblage is composed of Paleozoic and Mesozoic high-grade metasediments and intrusive rocks [14,15,16] and forms part of the Mogok-Mandalay-Mergui belt. The Mogok Stone Tract is mainly composed of gneiss, marble, calc-silicate rocks and quartzite, intruded by various felsic to mafic igneous rocks [17]. Ruby, sapphire, and spinel are found in primary deposits (calc-silicate rocks and marbles, with spinel only forming in the latter) and secondary deposits such as alluvial and eluvial placers, as well as karstic sinkholes and caverns [18]. These are associated with beryl, actinolite, tourmaline, pargasite, phenakite, topaz, uvite, zircon, and many others [19].

3. Materials and Methods

We studied 12 crystal fragments of natural samples spinel from Mogok, Myanmar SP–M1 to 9 and Lục Yên, Vietnam SPV–1 to 3. Measurements were performed on unoriented samples.
The chemical composition of spinels and associated minerals was established using a Cameca SX100 electron microprobe in wavelength-dispersion mode at the Masaryk University (Brno, Czech Republic), Department of Geological Sciences, under the following conditions: accelerating voltage 15 kV, beam current 20 nA, and beam diameter 3 μm. The samples were analyzed with the following standards: hematite (Fe Ka), Mn2SiO4 (Mn Ka), TiO (Ti Ka), wollastonite (Ca Ka), andalusite (Al Ka), Mg2SiO4 (Mg Ka), titanite (Si Ka), chromite (Cr Ka), gahnite (Zn Ka), vanadinite (V Ka), Ni2SiO4 (Ni Ka), Co (Co Ka). The measured element detection limits ranged from 150 to 700 ppm. The spinel crystal-chemical formula was calculated based on 3 cations per formula unit, the Fe2+/Fe3+ ratio was calculated from the charge-balanced formula.
Raman spectroscopy was performed by a LabRAM–HR Evolution (Horiba Jobin–Yvon) spectrometer system with a Peltier cooled CCD detector and Olympus BX–41 microscope (Department of Geological Sciences, Masaryk University, Brno, Czech Republic). Raman spectra were excited by 473 nm frequency–doubled diode laser with power of 2.5 mW, dispersed by diffraction grating with density 600 gr/mm and a 520.6 cm−1 silicon wafer enabled spectral calibration. Spectra ranged from 100 to 10,000 cm−1 with acquisition time of 15 s per frame and 2 accumulations.
Optical (Vis-NIR) absorption spectra of samples in the region (400–750 nm) were measured with the GL Gem SpectrometerTM at room temperature in the Gemological Institute of Constantine the Philosopher University, Nitra, Slovakia. The UV absorption spectra of the polished samples within the regime 197–400 nm and resolution 1 nm, were measured using PERKIN-ELMER Lambda 35 UV/VIS double beam spectrophotometer in absorption mode, reference to air and 1 nm slit width at Faculty of Natural Sciences, Comenius University (Bratislava, Slovakia).
Both Raman and UV/Vis/NIR spectra were processed in Seasolve PeakFit 4.1.12 software. Raman and absorption bands were fitted by Voigt function with automatic background correction and Savitzky–Golay smoothing.

4. Results

We studied 12 crystal fragments of natural spinel from Mogok SP–M–1 to 9 and Lục Yên, Vietnam SPV–1 to 3 (Table 1). All samples were crystal fragments of various shapes and sizes and several of them had gemological quality.

4.1. Chemical Composition
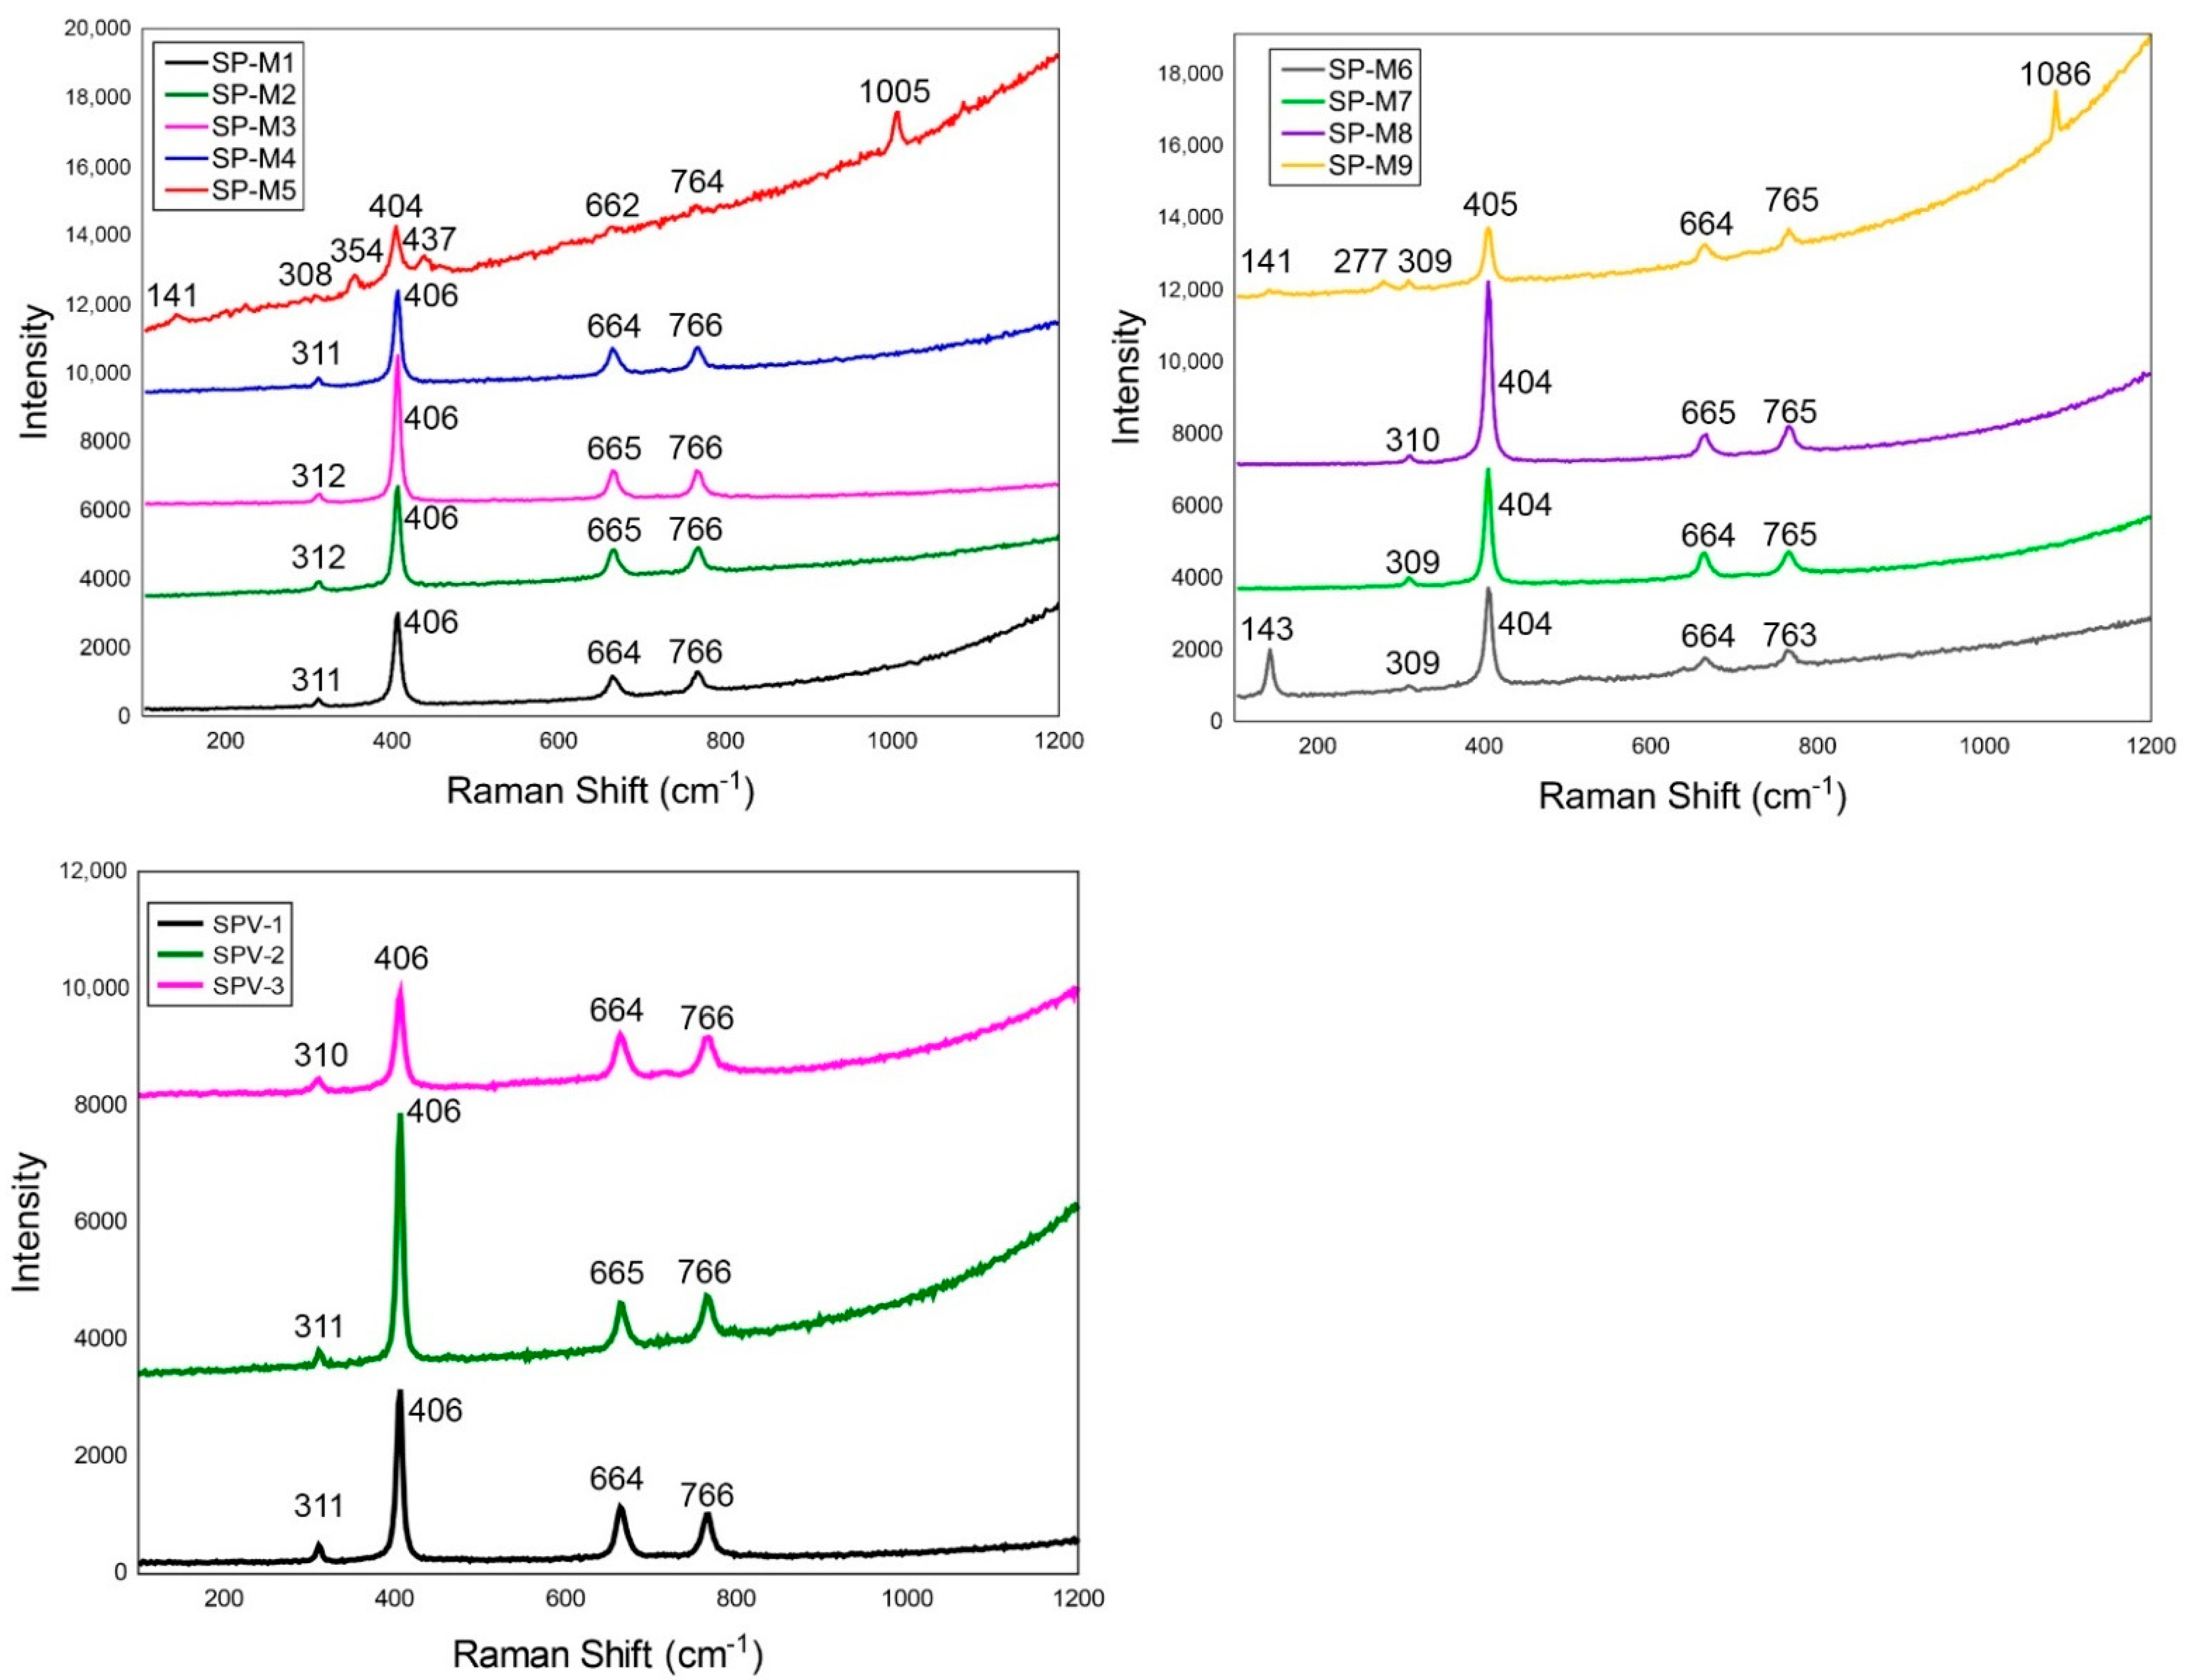
The most abundant elements in the spinel samples are Al and Mg corresponding to the mineral formula of spinel end member (Table 2). Spinel is enriched in Cr, V, Fe2+, Fe3+, and Zn, which are responsible for its resulting color. V and Cr-bearing spinels (SP–M1, 2, 4, 5, and 6, and SPV–1, 2, and 3) contain increased Cr (0.001–0.006 apfu), V (0.001–0.004 apfu), and low content of Fe2+ and Fe3+. Fe-bearing spinels (SP–M3, 7, 8, and 9) contain increased Fe2+ (0.001–0.017 apfu), Fe3+ (0.004–0.012 apfu).

4.2. Raman Spectra

The Raman bands of spinel (Figure 1) were assigned according to [20] (Table 3). The 308–312 and 662–665 cm−1 band are attributed to T2g symmetry, 404–406 cm−1 band to Eg symmetry, 763–767 cm−1 bands to A1g symmetry. The measured values have deviations of up to 5 cm−1 compared to the reference literature. Measured Raman spectra also differ from published by the absence of some vibrations, depending on the sample orientation relative to the laser beam.

4.3. Luminescence Spectra

Luminescence spectra of the spinel samples SP–M1 to 9 and SPV–1 to 3 was measured on the Raman spectrometer with 432 nm laser. The most intensive region in the luminescence spectra (Figure 2) of spinels is between 650 and 730 nm, with the most intensive bands at 686–687 nm. The luminescence region can be divided into five parts: (1) region 650–680 nm with the most intensive luminescence in the area 675–677 nm; (2) region 680–690 nm with the most intensive luminescence in the area 686–687 nm; (3) region 690–705 nm with maximum at 698 nm; (4) region 705–715 nm with maximum at 707 nm (5) region 715–730 nm with maximum at 717 nm. Luminescence bands at 677, 685, 697, 710, and 718 nm were assigned to Cr3+ according to [21]. The luminescence spectra of spinels have a major difference in intensity, due to the influence of luminophores.

4.4. Optical Absorption Spectroscopy

The optical absorption spectra of spinels were measured separately in UV and Vis-NIR regions. All spectra display presence of the intensive broad band (absorption edge) below 300 nm which can be attributed to ligand-metal charge transfer of both O2− → Fe2+ and O2− → Fe3+. Moreover, SP-M1 and SPV-2 samples have also relatively broad bands, but significantly less-intensive bands at 360–380 nm caused by spin-allowed electronic dd transitions 4A2g4T1g(F) in Cr3+ at the M sites.
Based on the spectral features in the Vis-NIR region, samples can be divided into two groups V-Cr (with V-Cr spinels divided according to the chromophore dominance into V-Cr or Cr-V spinels) and Fe spinels (Fe2+ dominated and Fe3+ dominated), based on the dominant element acting on optical spectra. Vanadium–chromium spinels have two major absorption bands and a third less intense absorption band (Figure 3; Table 4). Therefore, the optical spectrum can be divided into two zones (1) 420–550 nm; (2) 640–1000 nm. In the first zone, there are two significant absorption bands which are caused by the V3+ and Cr3+. The second absorption features occur in the infrared region due to electron intervalence charge transfers (IVCT) Fe2+↔Fe3+ and Fe2+ [22]. The most intensive absorption band is in the violet-blue to blue region and the green to yellow-green region. There is less intensive absorption band in the near infrared and ultraviolet regions.
The optical spectra of Fe-spinels (Figure 4, Table 5) are different, they are more complicated, and they have more absorption regions. In this case, the absorption can also be divided into two zones (1) 410–650 nm and (2) 770–1000 nm. In the first zone, there are two absorption regions at 422–464 nm and 541–647 nm, the most intense absorption bands at 541, 553 (SP–M3, SP–M8) and 461 nm (SP–M7, SP–M9). This zone belongs to IVCT Fe2+↔Fe3+ and Fe2+. The third region, the infrared region, with two absorption bands at 770–795 and 908–932 nm, is due to Fe2+ [22]. The most intense absorptions are in the violet-blue to blue, yellow green to red, and weak absorption in the ultraviolet and near infrared regions.

5. Discussion

5.1. Raman Spectroscopy

The molecular vibrations in spinel supergroup belong to the following symmetry species: A1g(R) + Eg(R) + F1g + 3F2g(R) + 2A2u + 2Eu + 5F1u(IR) + 2F2u, where R (Raman active) and IR (infrared active) denote spectral activity. Spinel structure has a symmetry center; therefore, the active modes exclude each other. Five of the nine optical modes, 1Ag + 1Eg + 3T2g, are Raman active, and four, 1Ag + 1Eg + 3T2g, are infrared active [5,20].
However, only four Raman bands have been reported for a natural spinel. The missing fifth band at 492 cm−1 was obtained only in the spectrum of synthetic spinel. When the sample is heated, a band appears in the spectrum at 727 cm−1 [5].
Spinel has Raman vibrational modes in the spectral region from 100 to 800 cm−1. We observed strong Raman bands in the regions of 400–500 cm−1, and 700–800 cm−1; these were attributed to Eg and A1g, respectively.
Some studied samples—SP–M5, 6, and 9—exhibited different bands than commonly found in published Al-spinel literature [5,23,24,25]. It is possible that during the measurement, some mineral inclusion, which was located below the surface of the sample and, therefore, not detected by EMPA, was measured.
Since Mogok spinels are formed in marbles, or carbonates, there is a probable occurrence of Ca-mineral inclusions in spinels. They were typically present as colorless, irregularly shaped inclusions. In the sample SP–M9, we recorded calcite or dolomite inclusions. Raman bands at 141, 277, and 1086 cm−1 are consistent with the published data [26]. The band at 1086 cm−1 is assigned to the ν1(CO3)2− symmetric stretching mode. Bands at 141 and 277 cm−1 are at lower wavelengths and are the result of external group vibrations (CO3)2−, which include rotational and translational oscillation of these groups [27].
Identification of the 143 cm−1 Raman band origin in SP–M6 is more complicated. It may be (CO3)2− vibration in carbonate, while other bands did not manifest in the spectrum due to crystal orientation. However, it could also be a different inclusion, possibly anatase. Weak Raman bands were reflected in the area at 510 and 635 cm−1, which are consistent with the published data of spinel [26].

5.2. Luminescence Spectroscopy

Luminescence features were observed in the Raman spectra of spinel in Figure 2. Luminescence bands at 677, 685, 697, 710, and 718 nm were assigned to Cr3+ [21]. Highly increased intensity of spinel luminescent bands is associated with a laser effect that occurs at 685 nm [28]. The luminescence spectrum of spinel usually has three parts: (a) the purely electronic R-lines, assigned collectively to the most intense centers [29]; (b) a series of N-lines (Stokes or anti-Stokes line) associated with eight Cr3+–Cr3+ pair interactions and with Cr3+ at sites differing from the primary site, the concentration-dependent N-lines are caused by chromium pairs, the structure-dependent N-lines arise from six coordinated Cr3+ ions whose short range orders are distorted [30]; (c) series of phonon side bands on the low energy side of the R-lines that relate to the vibrational modes of the spinel crystal [29].
Thus, for a mineral to be luminescent the following three conditions must be satisfied at once: (1) a suitable type of crystal lattice favorable to form emission centers; (2) sufficient content of luminescence centers and (3) a small number of quenchers. The most important quenchers in minerals are Fe2+, Co2+, and Ni2+, which have intense charge-transfer bands [21], while Fe3+ forms luminescent centers with concentrations up to approximately 1% [31]. Ferrous iron replaces Mg2+ at the tetrahedral site and Fe3+ substitutes Al3+ at the octahedral site [32]. Differences in shift are minimal, but the biggest difference is in the intensity of bands (Figure 2). Different luminescence intensities are due to the variable content of Fe (Table 2) which quenches the luminescence intensity. This quenching occurs because the energy is transferred from Cr3+ to Fe2+ and is transformed to heat [33].
Spinel SPV–1, 2, and 3 samples from Vietnam have the most intense luminescence resulting from the highest content of Cr3+ (0.0020.006 apfu, 0.12–0.31 wt.% Cr2O3). The SPV–2 sample with 0.006 apfu Cr3+, 0.008 apfu Fe3+, and Fe2+ below 0.001 apfu has the highest intensity within all the samples studied. Other spinels from Vietnam are very similar with very intense Cr3+ luminescence, which cannot be effectively quenched at the almost absent Fe2+.
However, there is not a straightforward dependence of Cr3+ content and the luminescence intensity in spinels from Mogok. The SP–M2 sample has the most intensive luminescence bands. Although the Cr3+ is not very abundant (0.001 apfu Cr3+, 0.06 wt.% Cr2O3), the Fe2+ content (0.001 apfu Fe2+, 0.05 hm.% FeO) is not high enough for the effective quenching of the luminescence. Although the intensity of luminescence is related to the Cr3+ content, Fe2+ must also be considered. This is the case of the SP–M8 sample with a moderate luminescence intensity. The content of Fe2+ (0.013 apfu, 0.65 wt.% FeO) is relatively higher compared to previously mentioned samples, however, still not sufficient to completely quench luminescence of Cr3+ (0.001 apfu, 0.03 wt.% Cr2O3) and Fe3+ (0.006 apfu, 0.36 wt.% Fe2O3) luminescent centers. Similarly, in SP–M7, Fe2+ (0.017 apfu, 0.85 hm.% FeO) has even higher contents than SP–M8, its intensity is significantly lower. The SP–M9 sample with low amount of Cr3+ (Cr2O3 0.02 wt.%) has the least intense luminescence; the content of Fe2+ (0.002 apfu, FeO 0.11 wt.%), although not the highest among studied samples, contributed to the effective reduction of luminescence. In this case, Fe3+ is not in the position of the luminescent center but rather contributes to its reduction.

5.3. Optical Absorption Spectroscopy

Colors of spinels can be explained by the crystal field formalism which involves predominantly ionic crystals containing ions with unpaired electrons, elements with partially filled d shells: V, Cr, Mn, Fe, Co, Ni, and Cu. From these transition elements, iron is the dominant color contributor in minerals [34].
Octahedrally coordinated d5 ions (Fe3+, Mn2+) exhibit no ground-state crystal-field splitting and are not expected to show any colors. Their compounds are weakly colored at the best due to other factors. The free-ion ground state of octahedrally coordinated d6 ions (Fe2+) splits into two, and these ions will show one absorption band, corresponding to a transition between these two energy levels. If all or part of this band is in the visible region, compounds containing these cations will display color. The d2 (V3+) and d3 (Cr3+) ions have two free-ion terms of the same multiplicity, 3F and 3P for d2, and 4F and 4P for d3. In the crystal field, the 3P or 4P states with the higher energy give rise to 3T1g and 4T1g states. Spin-allowed transitions to these additional energy levels give rise to three absorption bands in the case of V3+. In Cr3+ ions, the transition to the 4T state is at a high energy and is not recorded in the visible spectrum [35].
According to their dominant chromophore, the studied spinels can be divided to vanadium–chromium and iron spinels.

5.3.1. V and Cr Spinels

Vanadium–chromium or chromium–vanadium-bearing spinel samples (Figure 3) show a color typically changing from orange to red or magenta [22].
The optical spectra of this group spinels are approximately similar, consisting of the main absorption band, which is divided into two regions, absorption in the infrared region and sharp but weak absorption in the ultraviolet region. In Table 4, absorption bands are assigned to the dominant chromophores, or interactions. For SP–M1, SP–M2, SP–M4, SP–M5, and SP–M6 (Figure 3a–e) spinels with dominant vanadium, the first absorption bands at 424–468 and 542–554 nm were assigned to spin allowed dd 3T1g(3F) → 3T1g(3P) and 3T1g(3F) → 3T2(3F) transitions in V3+ at the M sites. Chromium-enriched spinel (SPV–1-3) absorption bands at 424–448 and 541–543 nm were assigned to spin-allowed dd transition 4A2g4T1g(4F) and 4A2g4T2g(4F) in Cr3+ at the M sites (Figure 3f–h). All the spectra studied had weaker and broad absorption band in infrared region, caused by oxygen to metal O2-–Fe2+ electronic charge transfer transition [22].
The color of spinel depends on the concentration of chromophores and their interactions in the structure. Vanadium dominant spinels are orange, red, pink and their various shades. Orange-colored SP–M2 and SP–M6 spinels with the increased iron content have broad absorption band without significant transmission in the blue region. The pink-shaded SP–M1 and SP–M4 samples are similar, only SP–M4 has stronger transmission at 480 nm (blue region) and 620 nm causing a strong purplish pink color. Chromium content in this sample causes more intensive transmission in the yellow-green region, while SP–M1 has Cr below the detection limit. Red spinel SP–M5 has absorption band shifted to 480 nm. Transmission occurs from 600 nm to NIR region. The SP–M5 sample has the highest contents of V, Cr, and also Fe. The high iron and vanadium contents result in a very saturated and dark color of the spinel.
Spinels from Vietnam are pink to red with different shades but have usually higher Cr than V content (Table 1). The SPV–1 sample has relatively stronger absorption in blue to green region than SPV–2; thus, SPV–1 is red and SPV–2 intensively pink. The SPV–3 sample has relatively strong absorption in the whole visible light spectrum due to the highest content of Fe and the lowest contents of Cr. Consequently, the color of this sample is grey.
In the NIR region at around 770–800 nm, the studied samples display broad absorption band likely associated with Fe2+ spin-forbidden 5E → 3T1 electron transition [22].

5.3.2. Fe Spinels

Iron in spinels occurs in two valence states—as Fe3+ and Fe2+ [34]. Iron is the main chromophore among the iron group of studied spinels. The differences in spectra result from variations in the Fe3+/Fe2+ ratio, and also from the presence of minor Cr3+ and V3+. Studied iron spinels can be divided into two types: Fe3+-dominant SP–M3 and SP–M9 samples (Figure 4a,d) and Fe2+ dominant SP–M7 and SP–M8 samples (Table 5, Figure 4b,c). Spinels containing Fe2+ have shades of blue (SP–M7,8) and samples with predominant Fe3+ content have shades of pink to yellow (SP–M3,9).
Absorption bands in spinel spectra are likely caused by electronic transitions in isolated Fe2+ and Fe3+ cations, as well as by pairs of Fe ions [36,37]. The absorption bands at 464 and 461 nm can be attributed to 6A1g4A1g, 4Eg (4G) transition in VIFe3+ [36]. However, it is not excluded that, at least partly, absorption may be intensified by exchange-coupled interaction in Fe3+–Fe3+ pairs [37]. Therefore, we cannot discriminate between electronic transitions in isolated ions and electron exchange in coupled pairs of Fe3+ as the cause of these band in spectra of spinels. The intensity of these band does not strictly correlate with the amount of Fe3+.
This discrepancy may be because in iron-enriched spinels, a part of ferric iron enters tetrahedral sites of the spinel structure. In such case, oscillator strength of the electronic transition of tetrahedral ions may be several orders of magnitude higher than in octahedral [36] and the proper absorption bands may be significantly enhanced [37]. Energy of 6A1g4A1g, 4Eg transition may be very similar in VIFe3+ and IVFe3+, and therefore both transitions may be seen as a single band in the spectra [37]. In the spectra of low-iron spinels, these bands may also be caused by spin-forbidden transitions of tetrahedral Fe2+. Therefore, in most cases this relatively sharp distinct peak in spinel spectra is a superposition of two or even three bands of close energies, caused by spin-forbidden transitions [38]. Samples SP–M7 and SP–M8 with the highest Fe2+ contents (0.17 and 0.13 apfu) have the most intensive absorption in this area. In contrast, SP–M3 sample has the lowest iron content from Fe–spinels and the absorption band at 464 nm is negligible.
Absorption bands at 541–557 nm in the SP–M3, 7, 8 samples belong to the spin forbidden transition 5E(D) → 3T2(H) of Fe2+ [37,39,40]. Bands at 639–647 nm are assigned to VIFe2+VIFe3+ IVCT and/or VIFe2+IVFe3+ exchange-coupled pair transitions [39,41]. This argument is well supported by the presence of the absorption band at 908–932 nm attributed to a spin-allowed transition 5T2g5Eg in VIFe2+ [39,40,41].

6. Conclusions

Spectroscopic comparison of spinels showed a direct influence of transition metals (luminophores and chromophores) on spectra. The chemical composition and chromophores, luminophores in the structure largely affects the resulting spectra. The effect of luminophores on luminescence spectra was most pronounced in intensity. The dependence of the number of luminophores and the intensity of luminescence was confirmed, where Fe acted predominantly as a quencher. We have seen the effect of quenching but also the enhancement of luminescence due to Cr3+. Optical spectra were divided according to the dominant chromophore into V and Cr spinels, Fe spinels. These differences visible in the spectra and the chemical composition has confirmed this division.

Author Contributions

Concept of study, I.M., P.B., J.F., and R.H.; methodology, I.M., P.B., J.F., Ľ.I., J.Š., D.F., S.F., and R.Š.; investigation, I.M., P.B., J.F., and R.H.; compilation and writing of the manuscript, I.M., P.B., and J.F.; review and editing, I.M., P.B., and J.F. All authors have read and agreed to the published version of the manuscript.

Funding

This research was funded by the Slovak Research and Development Agency under the Contract, number APVV–18–0065 and by the Ministry of Education of Slovak Republic grant agency under the contract VEGA-1/0137/20.

Data Availability Statement

Data is contained within the article.

Conflicts of Interest

The authors declare no conflict of interest.

References

  1. D’Ippolito, V.; Andreozzi, G.B.; Hålenius, U.; Skogby, H.; Hametner, K.; Günther, D. Color mechanisms in spinel: Cobalt and iron interplay for the blue color. Phys. Chem. Miner. 2015, 42, 431–439. [Google Scholar] [CrossRef]
  2. Anthony, J.W.; Bideaux, R.A.; Bladh, W.; Nichols, M.C. Handbook of Mineralogy; Mineralogical Society of America: Chantilly, VA, USA, 2017; Available online: http://www.handbookofmineralogy.org/ (accessed on 19 February 2020).
  3. Bosi, F.; Biagioni, C.; Pasero, M. Nomenclature and classification of the spinel supergroup. Eur. J. Mineral. 2019, 31, 183–192. [Google Scholar] [CrossRef] [Green Version]
  4. Uchida, H.; Lavina, B.; Downs, R.T.; Chesley, J. Single–crystal X–ray diffraction of spinels from the San Carlos Volcanic Field, Arizona: Spinel as a geothermometer. Am. Mineral. 2005, 90, 1900–1908. [Google Scholar] [CrossRef]
  5. Cynn, H.; Sharma, S.K.; Cooney, T.F.; Nicol, M. High–temperature Raman investigation of order–disorder behavior in the MgAl2O4 spinel. Phys. Rev. B 1992, 45, 500–502. [Google Scholar] [CrossRef]
  6. Busca, G.; Lorenzelli, V.; Ramis, G.; Willeyi, R.J. Surface Sites on Spinel-Type and Corundum-Type Metal Oxide Powders. Am. Chem. Soc. 1993, 9, 1492–1499. [Google Scholar] [CrossRef]
  7. Hazen, R.M.; Yang, H. Effect of cation substitution and order–disorder on P–V–T equations of state of cubic spinels. Am. Mineral. 1999, 84, 1956–1960. [Google Scholar] [CrossRef]
  8. Kušnír, I. Mineral resources of Vietnam. Acta Montan. Slovaca 2000, 5, 165–172. [Google Scholar]
  9. Garnier, V.; Ohnenstetter, D.; Giuliani, G.; Maluski, H.; Deloule, E.; Phan Trong, T.; Pham Van, L.; Hoàng Quang, V. Age and significance of ruby-bearing marble from the Red River Shear Zone, northern Vietnam. Can. Mineral. 2005, 43, 1315–1329. [Google Scholar] [CrossRef]
  10. Leloup, P.H.; Arnaud, N.; Lacassin, R.; Kienast, J.R.; Harrison, T.M.; Phan Trong, T.T.; Replumaz, A.; Taponnier, P. New constraints on the structure, thermochronology, and timing of the Ailo Shan-Red River shear zone, SE Asia. J. Geophys. Res. Atmos. 2001, 106, 6683–6732. [Google Scholar] [CrossRef]
  11. Garnier, V.; Giuliani, G.; Ohnenstetter, D.; Fallick, A.E.; Dubessy, J.; Banks, D.; Vinh, H.Q.; Lhomme, T.; Maluski, H.; Pêcher, A.; et al. Marble-hosted ruby deposits from Central and South-East Asia: Toward a new genetic model. Ore Geol. Rev. 2008, 34, 169–191. [Google Scholar] [CrossRef]
  12. Chauviré, B.; Rondeau, B.; Fritsch, E.; Ressigeac, P.; Devidal, J.L. Blue spinel from the Luc Yen district of Vietnam. Gems Gemmol. 2015, 51, 2–17. [Google Scholar] [CrossRef]
  13. Long, P.V.; Pardieu, V.; Giuliani, G. Update on gemstone mining in Luc Yen, Vietnam. Gems Gemmol. 2013, 49, 233–245. [Google Scholar] [CrossRef]
  14. Barley, M.E.; Pickard, A.L.; Za, K.; Rak, P.; Doyle, M.G. Jurassic to Miocene magmatism and metamorphism in the Mogok Metamorphic Belt and the India-Eurasia collision in Myanmar. Tectonics 2003, 22, 1–11. [Google Scholar] [CrossRef]
  15. Searle, M.P.; Noble, S.R.; Cottle, J.M.; Waters, D.J.; Mitchell, A.H.G.; Hlaing, T.; Horstwood, M.S.A. Tectonic evolution of the Mogok Metamorphic Belt, Burma (Myanmar) constrained by U-Th-Pb dating of metamorphic and magmatic rocks. Tectonics 2007, 26, 1–24. [Google Scholar] [CrossRef]
  16. Thu, K. The Igneous Rocks of the Mogok Stone Tract: Their Distributions, Petrography, Petrochemistry, Sequence, Geochronology and Economic Geology. Ph.D. Thesis, Department of Geology, University of Yangon, Yangon, Myanmar, 2007. Available online: http://m.palaminerals.com/mogok (accessed on 17 December 2020).
  17. Iyer, L.A.N. The geology and gemstones of the Mogok Stone Tract, Burma. Mem. Geol. Surv. India 1953, 82, 100. [Google Scholar]
  18. Thein, M. Modes of occurrence and origin of precious gemstone deposits of the Mogok Stone Tract. J. Myanmar Geosci. Soc. 2008, 1, 75–84. [Google Scholar]
  19. Mogok Township, Pyin–Oo–Lwin District, Mandalay Region, Myanmar. Available online: https://www.mindat.org/loc-24345.html (accessed on 24 February 2019).
  20. Chopelas, A.; Hofmeister, A.M. Vibrational spectroscopy of aluminate spinels at 1 atm and of MgAl2O4 to over 200 kbar. Phys. Chem. Miner. 1991, 18, 279–293. [Google Scholar] [CrossRef]
  21. Gaft, M.; Reisfeld, R.; Panczer, G. Modern Luminescence Spectroscopy of Minerals and Materials, 2nd ed.; Springer: Berlin/Heidelberg, Germany, 2015; p. 606. [Google Scholar]
  22. Andreozzi, G.B.; D’Ippolito, V.; Skogby, H.; Hålenius, U.; Bosi, F. Color mechanisms in spinel: A multi-analytical investigation of natural crystals with range of coloration. Phys. Chem. Miner. 2018, 42, 431–439. [Google Scholar] [CrossRef]
  23. Lazzeri, M.; Thibaudeau, P. Ab initio Raman spectrum of the normal and disordered MgAl2O4 spinel. Phys. Rev. B 2006, 74, 140301. [Google Scholar] [CrossRef]
  24. Slotznick, S.P.; Shim, S.H. In situ Raman spectroscopy measurements of Mg Al2O4 spinel up to 1400 °C. Am. Mineral. 2008, 93, 470–476. [Google Scholar] [CrossRef]
  25. Widmer, R.; Malsy, A.K.; Armbruster, T. Effect of heat treatment on red gemstone spinel: Single- crystal X–ray, Raman, and photoluminescence study. Phys. Chem. Miner. 2015, 42, 251–260. [Google Scholar] [CrossRef]
  26. Phyo, M.M.; Bieler, E.; Franz, L.; Balmer, W.; Krzemnicki, M.S. Spinel from Mogok Myanmar–A detailed inclusion study by Raman Microspectroscopy and Scanning Electron Microscopy. J. Gemol. 2019, 36, 418–435. [Google Scholar] [CrossRef]
  27. Gunasekaran, S.; Anbalagan, G.; Pandi, S. Raman and infrared spectra of carbonates of calcite structure. J. Raman Spectrosc. 2006, 37, 892–899. [Google Scholar] [CrossRef]
  28. Jouini, A. MgAl2O4 Spinel Laser Crystals: Pure and Ti-, Mn-, or Ni- Doped. Shaped Crystals. In Advances in Materials Research, 8; Fukuda, T., Chani, V.I., Eds.; Springer: Berlin/Heidelberg, Germany, 2007; pp. 203–215. [Google Scholar]
  29. Mohler, R.L.; White, W.B. Influence of Structural Order on the Luminescence of Oxide Spinels: Cr3+−Activated Spinels. J. Electrochem. Soc. 1995, 11, 3923–3927. [Google Scholar] [CrossRef]
  30. Derkosch, J.; Mikenda, W.; Preisinger, A. N–Lines and Chromium–Pairs in the Luminescence Spectra of the Spinels ZnAl2O4: Cr3+ and MgAl2O4: Cr3+. J. Solid State Chem. 1977, 22, 127–133. [Google Scholar] [CrossRef]
  31. Tarashchan, A. Luminescence of Minerals; Naukova Dumka: Kiev, Ukraine, 1978. (In Russian) [Google Scholar]
  32. De Souza, S.S.; Ayres, F.; Blak, A.R. Simulation models of deffects in MgAl2O4:Fe2+, Fe3+ spinels. Radiat. Eff. Defects Solids 2001, 156, 311–316. [Google Scholar] [CrossRef]
  33. Nassau, K. The Physics and Chemistry of Color, 2nd ed.; John Wiley & Sons, Inc.: Etobicoke, ON, Canada, 1983; p. 454. [Google Scholar]
  34. Nassau, K. The origins of color in minerals. Am. Mineral. 1978, 63, 219–229. [Google Scholar]
  35. Tilley, R.J.D. Transition–Metal Ion Colors. In Encyclopedia of Color Science and Technology; Springer Science: New York, NY, USA, 2013; pp. 1–10. [Google Scholar]
  36. Burns, R.G. Mineralogical Applications of Crystal Field Theory, 2nd ed.; Cambridge University Press: Cambridge, UK, 1993; p. 576. [Google Scholar]
  37. Taran, M.N.; Koch-Müller, M.; Langer, K. Electronic absorption spectroscopy of natural (Fe2+, Fe3+)-bearing spinels of spinel s.s.-hercynite and gahnite-hercynite solid solutions at different temperatures and high-pressures. Phys. Chem. Miner. 2005, 32, 175–188. [Google Scholar] [CrossRef]
  38. Dickson, B.L.; Smith, G. Low temperature optical absorption and Mössbauer spectra of staurolite and spinel. Can. Mineral. 1976, 14, 206–215. [Google Scholar]
  39. Schmetzer, K.; Haxel, C.; Bank, H. Colour of natural spinels, gahnospinels and gahnites. Neues Jahrb. Mineral. 1989, 160, 159–180. [Google Scholar]
  40. Fregola, R.A.; Skogby, H.; Bosi, F.; D’Ippolito, V.; Andreozzi, G.B.; Hålenius, U. Optical absorption spectroscopy study of the causes for color variations in natural Fe-bearing gahnite: Insights from iron valency and site distribution data. Am. Mineral. 2014, 99, 2187–2195. [Google Scholar] [CrossRef]
  41. Hålenius, U.; Skogby, H.; Andreozzi, G.B. Influence of cation distribution on the optical absorption spectra of Fe3+-bearing spinel s.s.–hercynite crystals: Evidence for electron transitions in VIFe2+VIFe3+ clusters. Phys. Chem. Miner. 2002, 29, 319–330. [Google Scholar]
Figure 1. Raman spectra of the spinel samples (from left to right) SP–M1 to 9 from Mogok, SPV–1 to 3 from Vietnam.
Minerals 11 00169 g001
Figure 2. Luminescence spectra of the spinel samples SP–M1 to 9 from Mogok and SPV–1 to 3 from Vietnam measured on the Raman spectrometer with 432 nm laser.
Minerals 11 00169 g002
Figure 3. Optical absorption spectra of the V and Cr spinels: vanadium-dominant (ae); chromium-dominant (fh).
Minerals 11 00169 g003
Figure 4. Optical absorption spectra of Fe spinels: Fe3+-dominant (a,d); Fe2+-dominant (b,c).
Minerals 11 00169 g004
Table 1. Electron microprobe analyses of spinels, first provided in wt. % of elements and then recalculated on the basis of 3 anions, the Fe2+/Fe3+ ratio calculated from the charge-balanced formula.
SP–M1SP–M2SP–M3SP–M4SP–M5SP–M6SP–M7SP–M8SP–M9SPV–1SPV–2SPV–3
SiO20.050.070.080.040.060.020.050.040.050.030.060.04
TiO20.010.010.010.030.140.000.000.000.010.040.000.08
Al2O371.2871.6471.2971.4871.1271.0670.2770.3670.8070.8770.5270.86
V2O30.120.120.010.080.240.110.040.050.010.190.060.07
Cr2O30.000.060.070.040.070.020.040.030.020.170.310.12
Fe2O30.140.030.200.110.220.150.650.360.380.220.460.35
FeO0.120.050.050.000.110.000.850.650.110.080.000.31
MnO0.000.010.000.000.000.000.010.000.000.020.010.02
MgO28.1228.2328.1928.2528.3028.3927.3427.4928.0128.0828.1827.92
ZnO0.110.160.060.330.000.070.280.130.030.110.100.26
NiO0.010.010.010.030.030.000.000.000.000.020.000.00
CoO0.020.050.000.000.000.000.000.000.020.020.000.00
CaO0.010.000.010.020.010.010.000.000.000.000.010.00
Total99.98100.4499.99100.40100.3199.8299.5499.1299.4299.8399.71100.02
Si4+0.0010.0020.0020.0010.0010.0010.0010.0010.0010.0010.0010.001
Al3+1.9951.9961.9941.9921.9851.9891.9871.9921.9931.9881.9811.987
V3+0.0020.0020.0000.0020.0040.0020.0010.0010.0000.0040.0010.001
Cr3+0.0000.0010.0010.0010.0010.0000.0010.0010.0000.0030.0060.002
Fe3+0.0030.0010.0040.0020.0060.0030.0120.0060.0070.0050.0080.009
Ti4+0.0000.0000.0000.0000.0000.0000.0000.0000.0000.0000.0000.000
Mg2+0.0000.0000.0000.0030.0030.0060.0000.0000.0000.0000.0030.000
B2.0002.0002.0002.0002.0002.0002.0002.0002.0002.0002.0002.000
Ti4+0.0000.0000.0000.0000.0030.0000.0000.0000.0000.0010.0000.002
Fe2+0.0020.0010.0010.0000.0000.0000.0170.0130.0020.0000.0000.003
Mn2+0.0000.0000.0000.0000.0000.0000.0000.0000.0000.0000.0000.000
Mg2+0.9950.9950.9980.9930.9960.9980.9780.9840.9970.9960.9980.990
Zn2+0.0020.0030.0010.0060.0000.0010.0050.0020.0000.0020.0020.005
Ni2+0.0000.0000.0000.0000.0010.0000.0000.0000.0000.0000.0000.000
Co2+0.0000.0010.0000.0000.0000.0000.0000.0000.0000.0000.0000.000
Ca2+0.0000.0000.0000.0000.0000.0000.0000.0000.0000.0000.0000.000
A1.0001.0001.0001.0001.0001.0001.0001.0001.0001.0001.0001.000
Table 2. Raman shifts (cm−1) of Raman-active bands in the studied samples. Assignment of the spinel band modes was made according to [20].
MineralSymmetrySP–M1SP–M2SP–M3SP–M4SP–M5SP–M6
141143
SpinelT2g311312312311308309
354
SpinelEg406406406406404404
437
SpinelT2g664665665664662664
SpinelA1g766767766766764763
1005
SP–M7SP–M8SP–M9SPV–1SPV–2SPV–3
Calcite/Dolomite 141
Calcite/Dolomite 277
SpinelT2g309310309311311310
SpinelEg404404405406406406
SpinelT2g664665664664665664
SpinelA1g765765765766766766
Calcite/Dolomite 1086
Table 3. Color of the spinel samples and dominant chromophore.
SampleProvenanceColorDetermined Chromophore
SP–M1Mogok, MyanmarLight grayish pinkVanadium–chromium
SP–M2Mogok, Myanmarpale orangeVanadium–chromium
SP–M3Mogok, Myanmarvery pale pinkIron (Fe3+)
SP–M4Mogok, Myanmarpurplish pinkVanadium–chromium
SP–M5Mogok, Myanmarvery dark redVanadium–chromium
SP–M6Mogok, Myanmarvery soft orangeVanadium–chromium
SP–M7Mogok, Myanmarvery dark cyanIron (Fe2+)
SP–M8Mogok, Myanmardark blueIron (Fe2+)
SP–M9Mogok, Myanmarlight grayish yellowIron (Fe3+)
SPV–1Lục Yên, Yên Bái, Vietnamreddish pinkVanadium–chromium
SPV–2Lục Yên, Yên Bái, Vietnamstrong pinkChromium–vanadium
SPV–3Lục Yên, Yên Bái, Vietnamgrayish pinkChromium–vanadium
Table 4. Assignment of the absorption bands for V and Cr spinel samples to chromophores.
SP–M1SP–M2SP–M4SP–M5SP–M6SPV–1SPV–2SPV–3Assignment
398 399396397399397 V3
425 424484439448424437V3+, Cr3+
468 509465 Cr3+
554544542546543543541543V3+, Cr3+
648
782770 773785784 779Fe2+
807 803 Fe2+
Table 5. Assignment of the absorption bands for Fe spinel samples to chromophores.
SP–M3SP–M7SP–M8SP–M9Assignment
438415422426Fe2+
464461461461Fe3+
541557553557Fe2+
641647639641IVCT Fe2+↔Fe3+
778775770795Fe2+
914908932Fe2+
Publisher’s Note: MDPI stays neutral with regard to jurisdictional claims in published maps and institutional affiliations.

