Article

Decomposition and Flammability of Polyimide Graphene Composites

Department of Materials Science and Engineering, University of Cincinnati, 2600 Clifton Avenue, Cincinnati, OH 45221, USA
*
Author to whom correspondence should be addressed.
Minerals 2021, 11(2), 168; https://doi.org/10.3390/min11020168
Submission received: 17 December 2020 / Revised: 22 January 2021 / Accepted: 29 January 2021 / Published: 5 February 2021

Abstract

:
Polyimide-graphene composites were synthesized by in-situ condensation polymerization and the thermal stability and decomposition behavior of the composites were studied. Polyimides, because of their aromatic backbone, are a class of fire-retardant polymers. Their high char retention ≥50% at testing temperatures ≥600 °C makes them thermally stable polymers. The effect of nanographene sheets on the decomposition behavior of polyimide is presented in this paper. It is shown that the reinforcement of polyimide with nanographene sheets significantly decreased the rate of decomposition of polyimide and increased the char retention of the composite. Thermogravimetric analysis data were used to assess the thermal stability, rate of mass loss and predicted limiting oxygen index of the neat polyimide and composites. Results obtained showed around a 43% decrease in the rate of polyimide degradation at 50 wt.% graphene loading. The limiting oxygen index of the polyimide nanocomposite was calculated by using the char retention, and it was found to increase by up to 24% at 50 wt.% graphene loading over that for the neat matrix.

Graphical Abstract

1. Introduction

Aromatic polyimides are high-temperature engineering polymers that find applications in aerospace and electronics industries due to their outstanding mechanical strength, high chemical resistance, high thermal stability and excellent electrical and thermal insulation properties [1,2,3,4,5]. Polyimides can be used to replace metal and ceramic parts in order to achieve weight savings that can translate into improved fuel efficiency for aircrafts while avoiding corrosion issues prevalent in metals. However, at higher use temperatures, they suffer from thermal oxidative damage which causes the polymer to slowly degrade and results in microcracks and structural failure [6,7,8,9]. As such, there is need to produce polyimide systems which can resist damage due to high heat flux exposures or fire risk scenarios.
Polymer nanocomposites have been extensively studied and found to greatly enhance the mechanical, thermal, gas barrier, conductivity, flammability, electromagnetic shielding and other properties of the virgin polymer [10,11]. Nanocomposite materials have the advantage of maximizing the interfacial area between the filler and the matrix, hence improving the interfacial strength. Multifunctional nanocomposites have been fabricated using carbon nanotubes and nanofibers, graphene, clay, inorganic nanoparticles and metal nanostructures [11,12,13,14].
Significant changes in fire safety regulations have increased emphasis not only on lowering the flammability of materials but also on the environmental impact of the flame-retarded material. Polymer-graphene nanocomposites are promising in reducing flammability as well as improving the mechanical, thermal and other properties of the material while still being environmentally friendly. The use of nanoscale particles that are finely dispersed in the polymer matrix may delay the onset of thermal decomposition and slow down the mass loss rate of the degrading polymer [15,16,17].
Polyimide-graphene nanocomposites with high loadings of graphene (>10 wt.%) were studied to improve the thermal stability and lower the flammability of the polyimide. The high graphene loading is likely to yield a high char that would protect the underlying polymer as the nanocomposite decomposes. Decomposition profiles in air and in nitrogen were studied using thermogravimetric analysis and emphasis was placed on the influence of graphene on polymer matrix degradation. Degradation in nitrogen (pyrolysis) was performed to allow the sample degradation in inert atmosphere to be studied without interference by the flame that would normally be present during combustion.

2. Materials and Methods

2.1. Materials

Nanographene sheets (98.48% purity) were purchased from Angstron Materials, Dayton, OH, USA. The characteristics are listed in Table 1 below.
Pyromellitic dianhydride (PMDA-99% purity), 4,4-oxydianiline (ODA) and N-methyl-pyrrolidone (NMP-99% purity), were purchased from Sigma-Aldrich, St. Louis, MO, USA. No further purification of the materials was performed.

2.2. Synthesis of Poly(Amic Acid)–Nano-Graphene Sheets Mixture (PAA-NGS)

A total of 5.2 g of ODA was added to 100 mL of NMP contained in a round bottomed flask followed by mechanical stirring until the solid completely dissolved in the solvent. NGS corresponding to 10 wt.% of total solids was added to the ODA-NMP solution and stirring continued for 8 h. PMDA was then slowly added to the mixture, followed by stirring for 12 h, the temperature of the reactants being maintained at 10 °C. Subsequent mixtures containing 20, 30, 40 and 50 wt.% NGS were synthesized. The PAA-NGS mixtures prepared was stored in a refrigerator at 5 °C.

2.3. Fabrication of Polyimide-Nano Graphene Sheets Films (PI-NGS)

Approximately 10 mL of PAA-NGS mixture was uniformly poured on to a glass substrate and thermally imidized in a vacuum oven at 120 °C for 2 h and finally cured at 200 °C for 1 h to form polyimide-nano graphene composite films. The stepwise imidization was done to maintain a stable film and avoid shrinkage. The films obtained had a thickness of 100–200 µm. The samples are abbreviated as follows, based on the wt.% of graphene sheets in the composites: PINGS-10, PINGS-20, PINGS-30, PINGS-40 and PINGS-50.

2.4. Thermogravimetric Analysis

The thermogravimetric analysis of the composite films of about 3–6 mg was carried out at heating rates of 10, 15, 20 and 30 °C/min, respectively, in a temperature range from 25–950 °C in nitrogen and air atmospheres. The TGA tests were performed by using a Q50 Thermal Analyzer purchased from TA Instruments, New Castle, DE, USA.
Kinetic analysis was done using the Kissinger-Akahira-Sunose (KAS) model. This is an Isoconversional method that is recognized as most appropriate method for the determination of activation energy of thermally active reactions [18]. The rate of non-isothermal reactions at a heating rate of β (dT/dt) is represented by Equation (1) [19,20]
d α d T = A e x p ( E a R T ) β f ( α )
where α is the extent of conversion ( w o w t w o w f ) , A is the pre-exponential factor, R is the gas constant, Ea is the activation energy and f(α) is a function of the reaction model and is dependent on the reaction mechanism.
Integrating Equation (1) with the initial boundary conditions, α = 0 at T = 0 yields
g ( α ) = 0 α d α f ( α ) = A β T o T exp ( E a R T ) d T A E o β R p ( E a R T ) p ( E a R T ) exp ( E a R T ) ( E a R T ) 2
Integrating the expression and finding the logarithm of both sides gives the final expression described in Equation (3).
ln β T 2 = ln ( A R E a g ( α ) ) E a R T
The slope of the linear curve of ln β/T2 vs. −1/T gives the activation energy for each degree of conversion (α). The pre-exponential factor, A, is the intercept of the linear curve [21].

2.5. Raman Spectroscopy

The chemical structure of the polyimide-graphene composites was studied using Thermo-Scientific NXR 9560 FT-Raman spectroscopy (Thermo Fisher Scientific, Waltham, MA, USA). The laser beam wavelength was set as 1064 nm and the laser power used was 200 mV.

2.6. Scanning Electron Microscopy

Environmental Scanning Electron Microscopy (ESEM), model FEI XL30 FEG (FEI Company, Hillsboro, OR, USA) was used to study the morphology of the composite films. The samples were coated with silver to improve their conductivity.

3. Results and Discussion

3.1. Raman Spectroscopy

Figure 1 shows the Raman spectra of the neat PI and the PINGS composites. A strong Raman absorption peak is observed at 1790 cm−1 for the neat PI and PINGS-10. This is attributed to the C=O stretching in the imide ring. The peak is not observed in the composites containing higher loadings of graphene. This can be attributed to graphene masking the C=O bond in the neat polymer. The peak observed at 1390 cm−1 is due to the C=N stretching in the imide ring. This peak is shifted to higher wavelengths and broadened at high loadings of graphene, indicating an interaction between graphene and the polyimide matrix, creating a new microstructure. At higher loadings of graphene (≥10 wt.%), Raman absorption peaks are observed at 1360 cm−1 and 1540 cm−1. These were assigned to the D band (disordered carbon) and the G band (graphitic carbon) of the graphene, respectively.

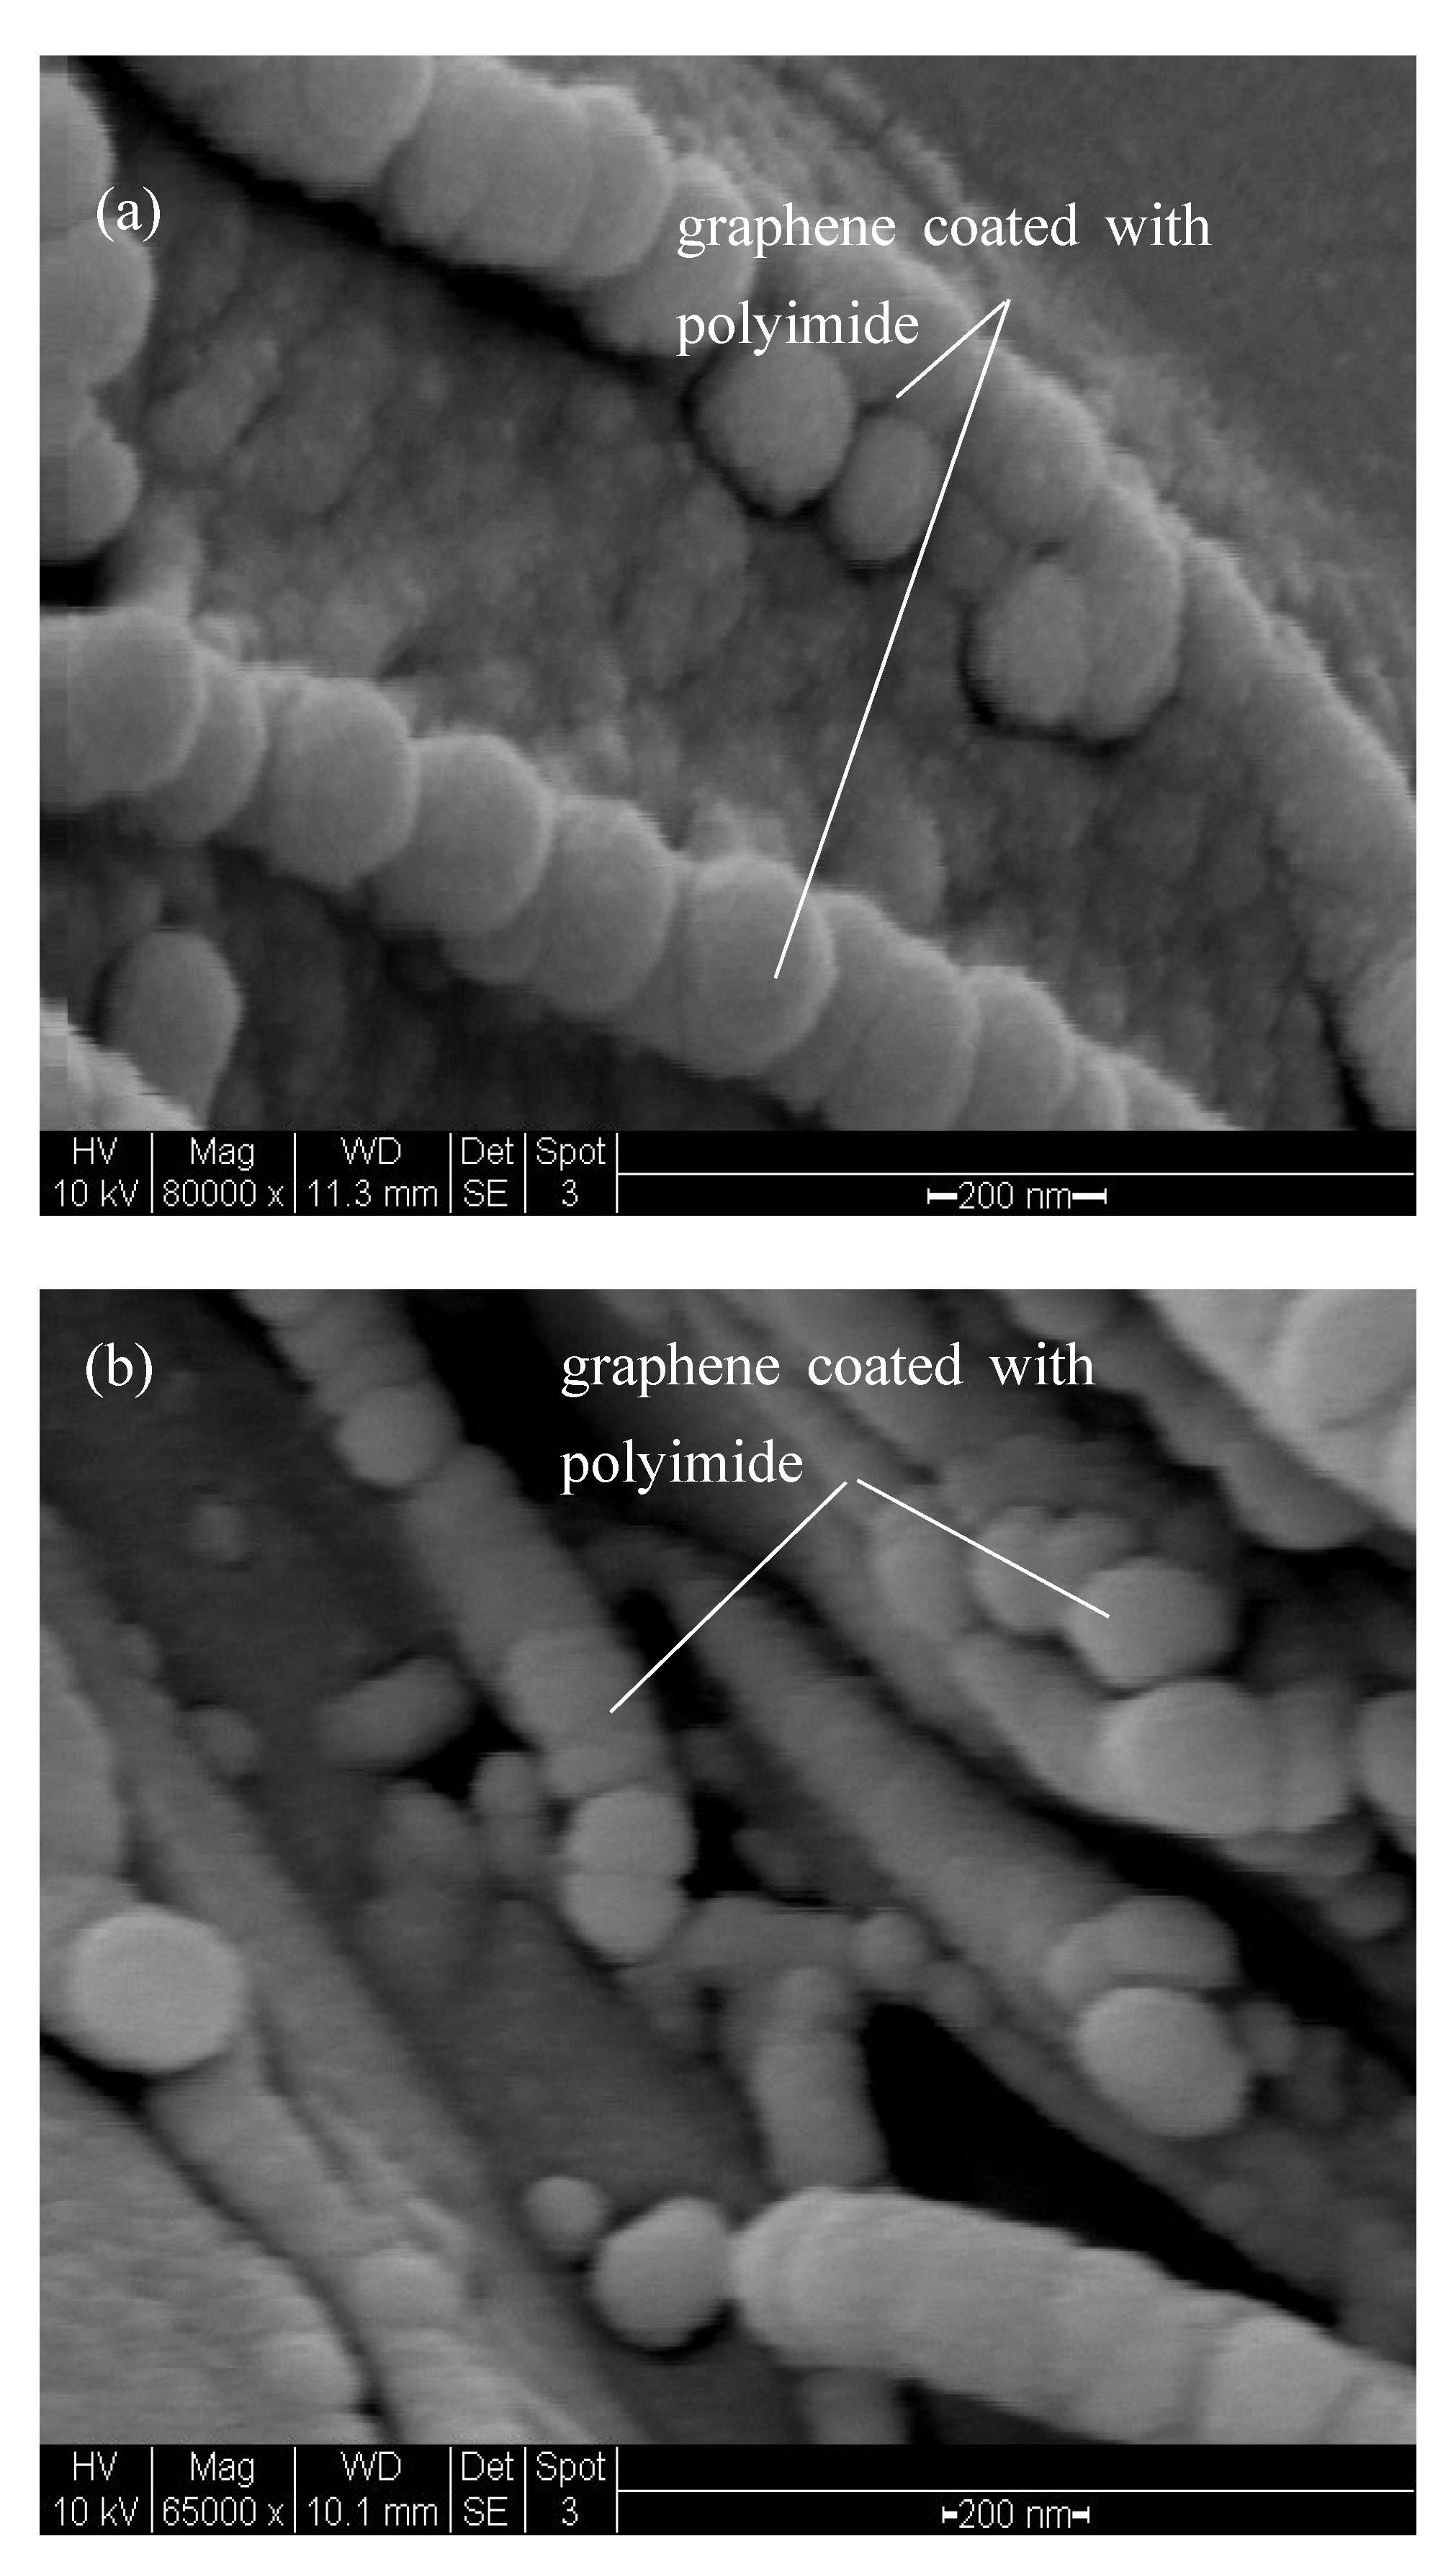
3.2. Scanning Electron Microscopy with EDAX

Figure 2 shows the SEM images of neat PI, nano-graphene sheets and PINGS-10 with the EDAX data with information on the elemental composition. Dispersion of graphene in the polymer matrix is observed in the PINGS-10 sample.
At a higher magnification (×80,000), SEM images show coating of polyimide onto graphene. The images in Figure 3 indicate two regimes in the composites, the bulk polymer and the area surrounded by graphene. Graphene is shown to protrude out of the matrix. These observations are noteworthy as they explain the action of graphene in protecting the underlying polymer matrix from degradation.

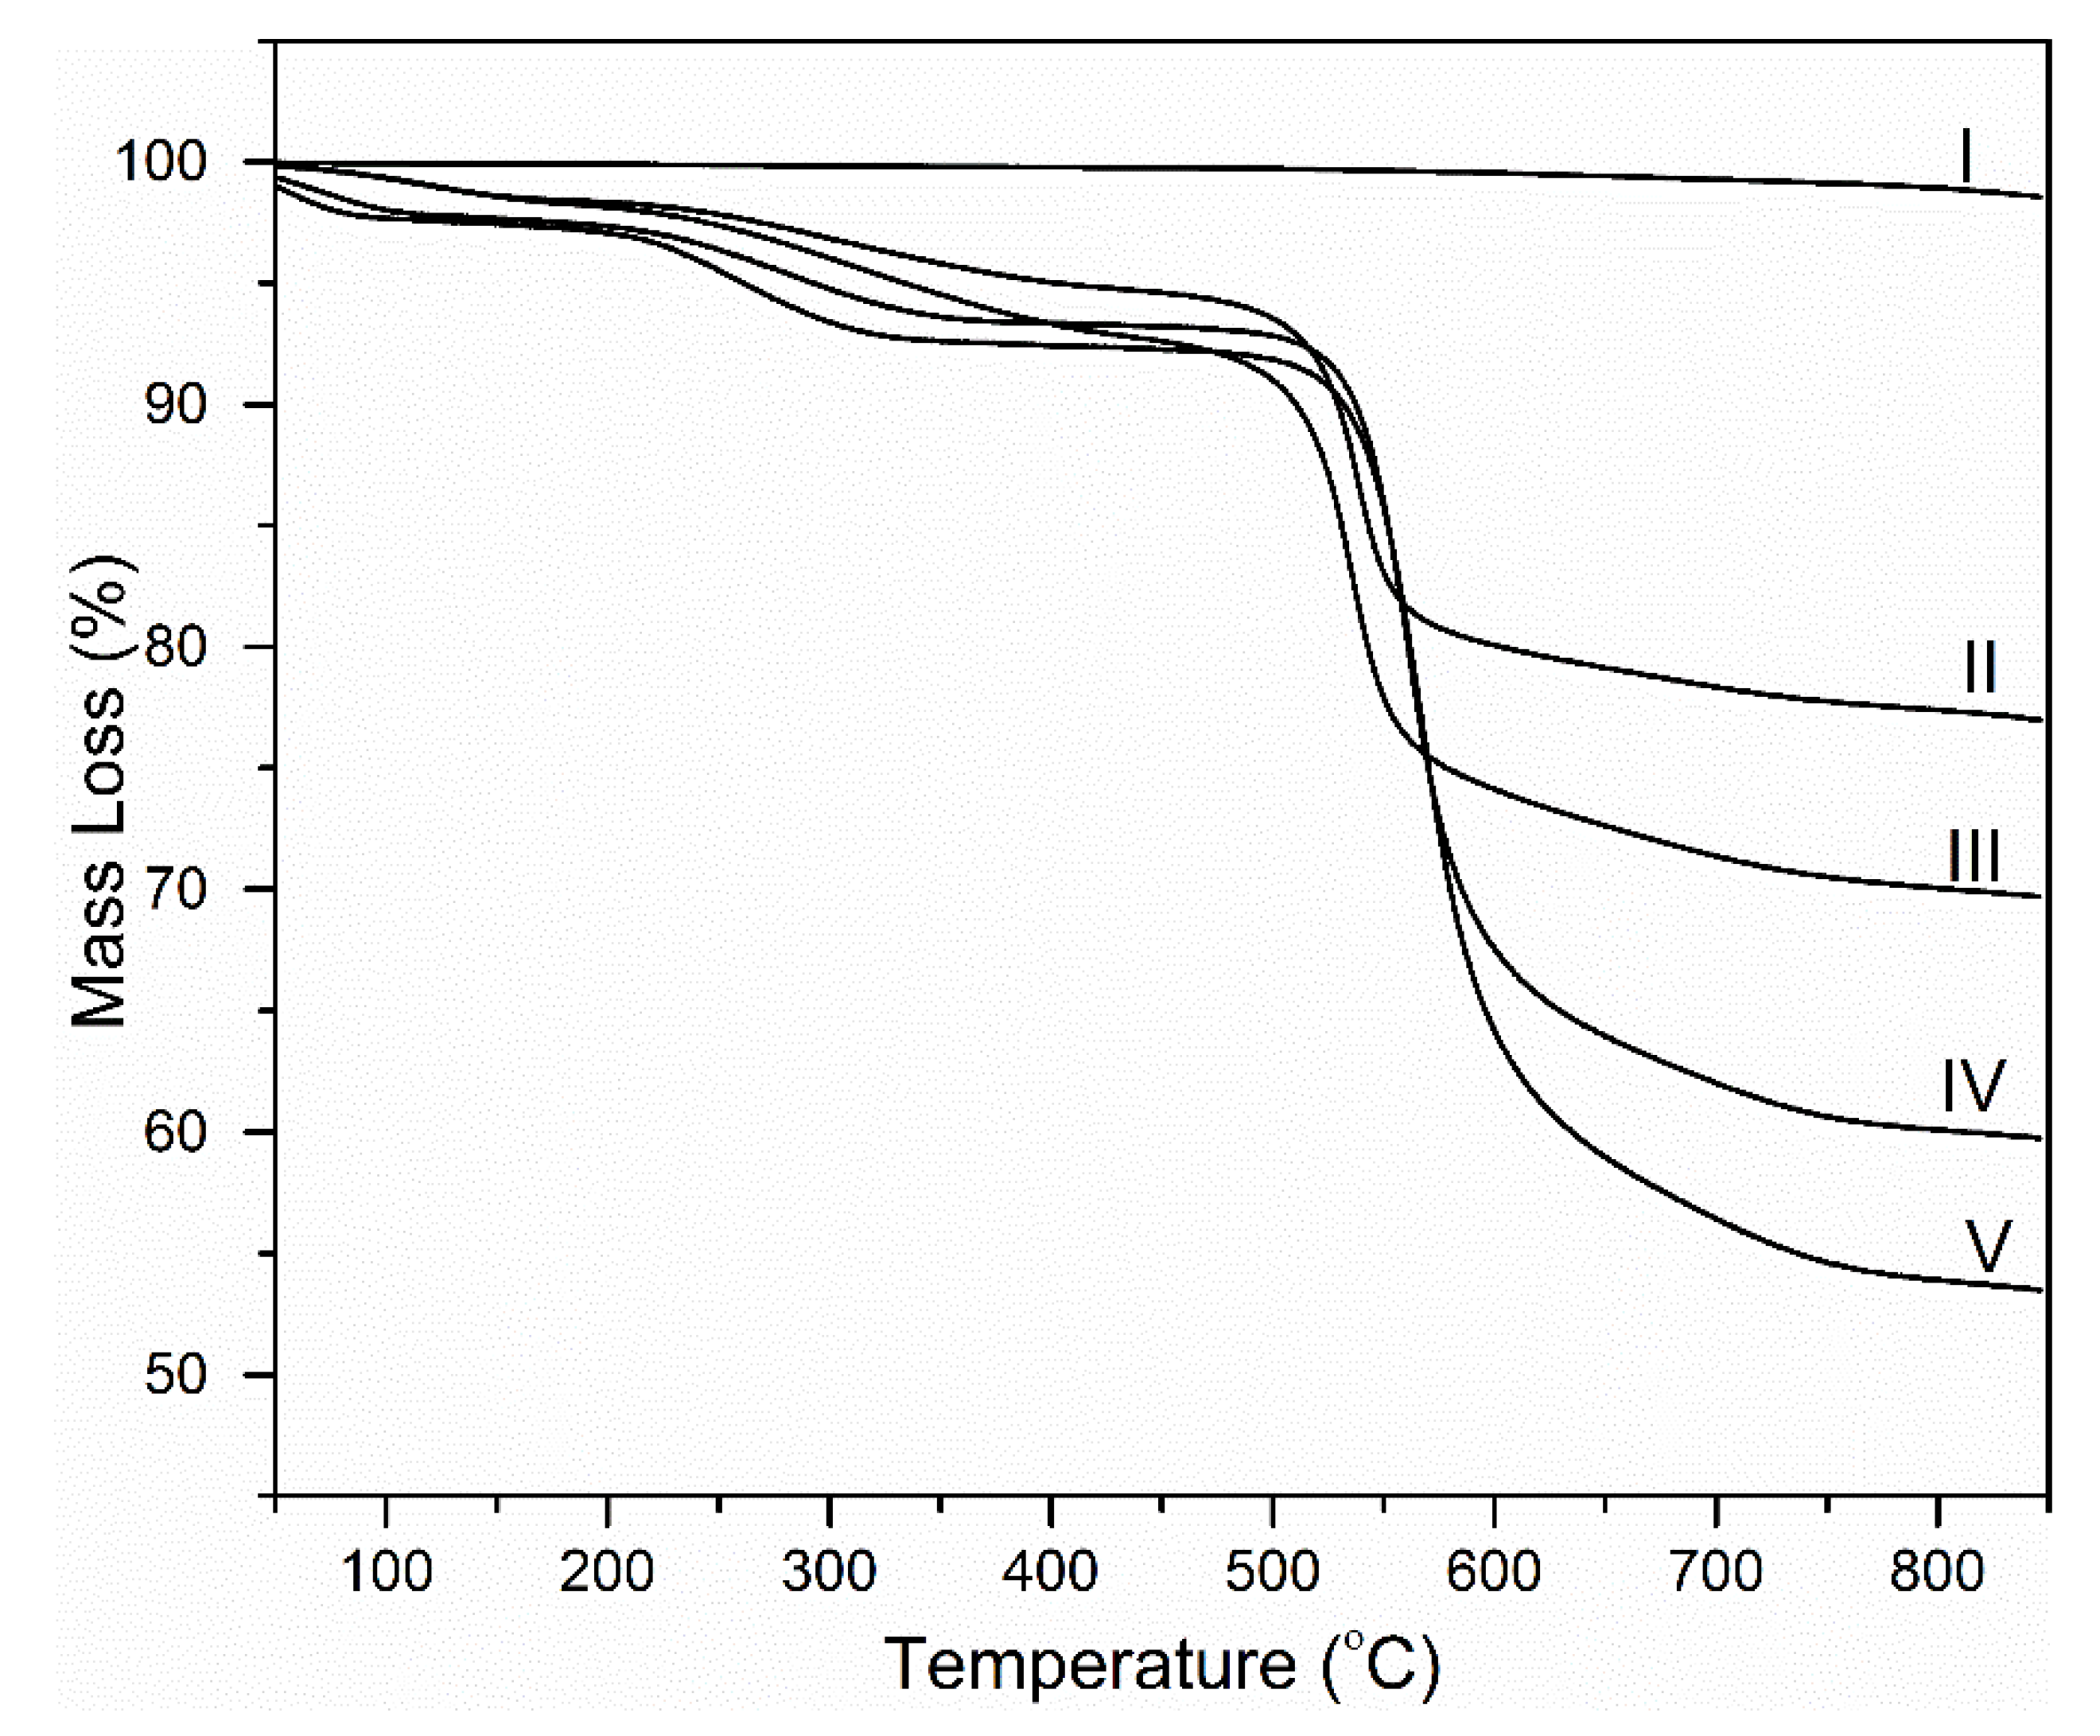
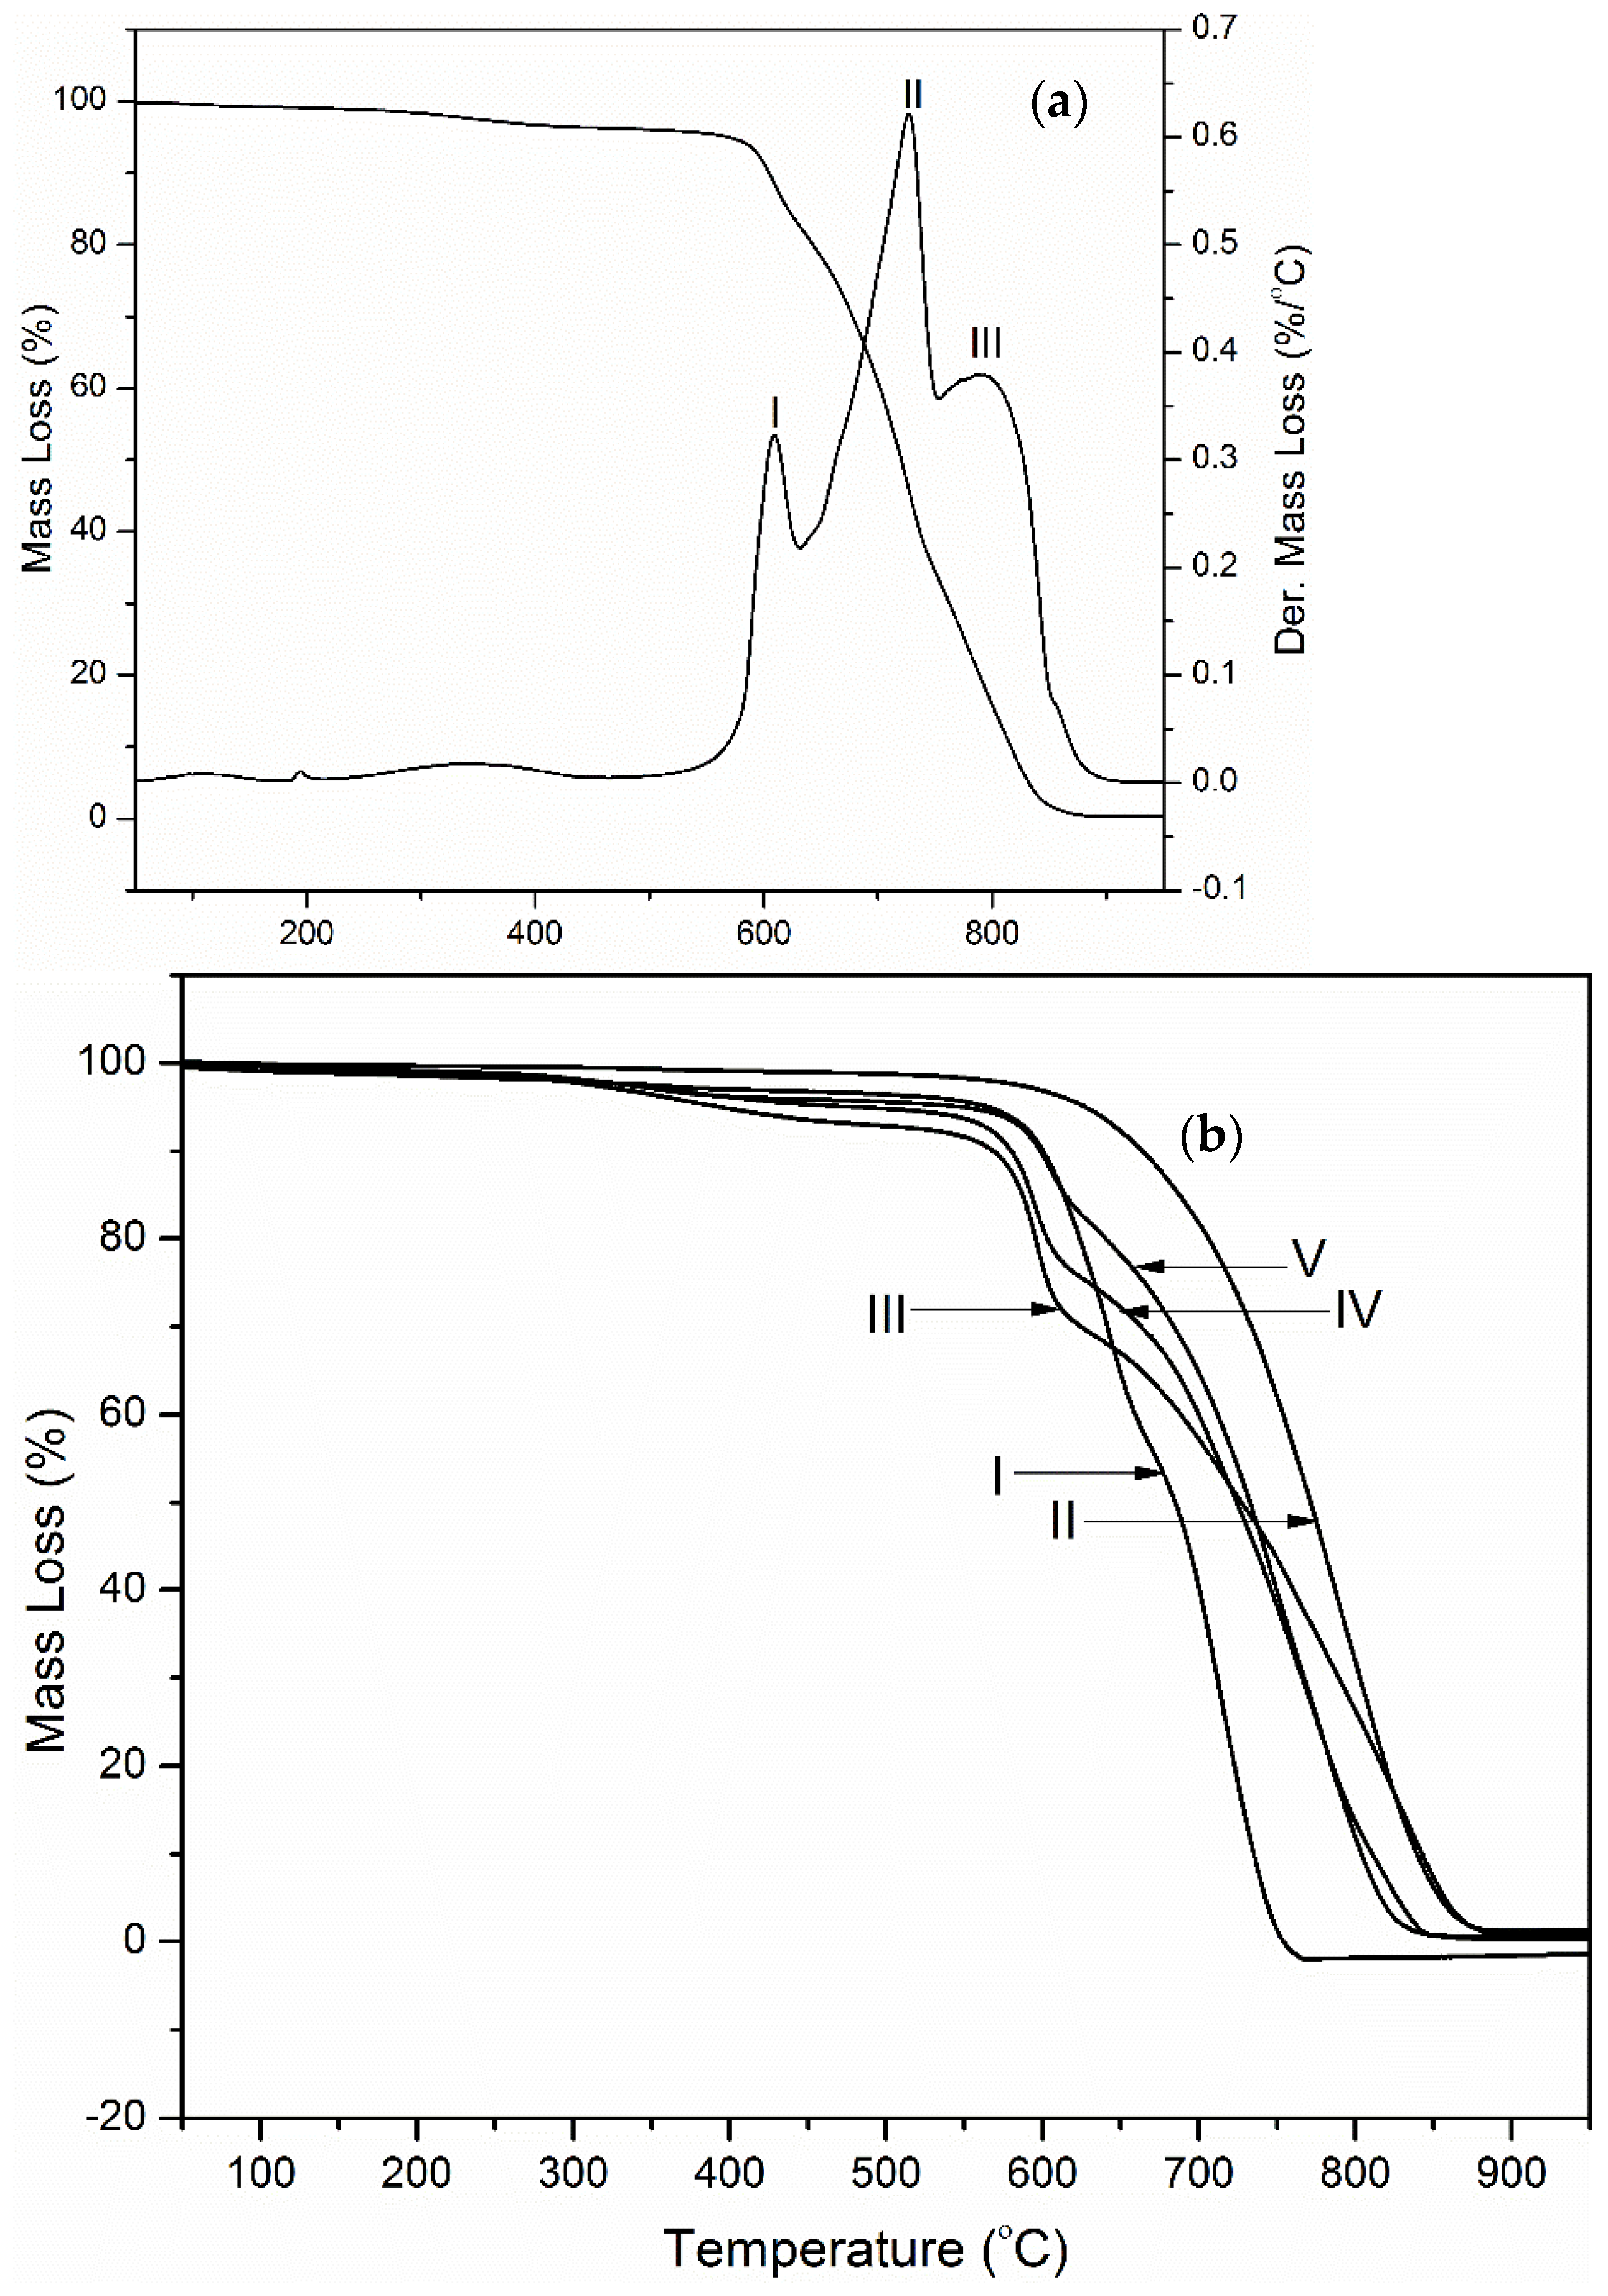
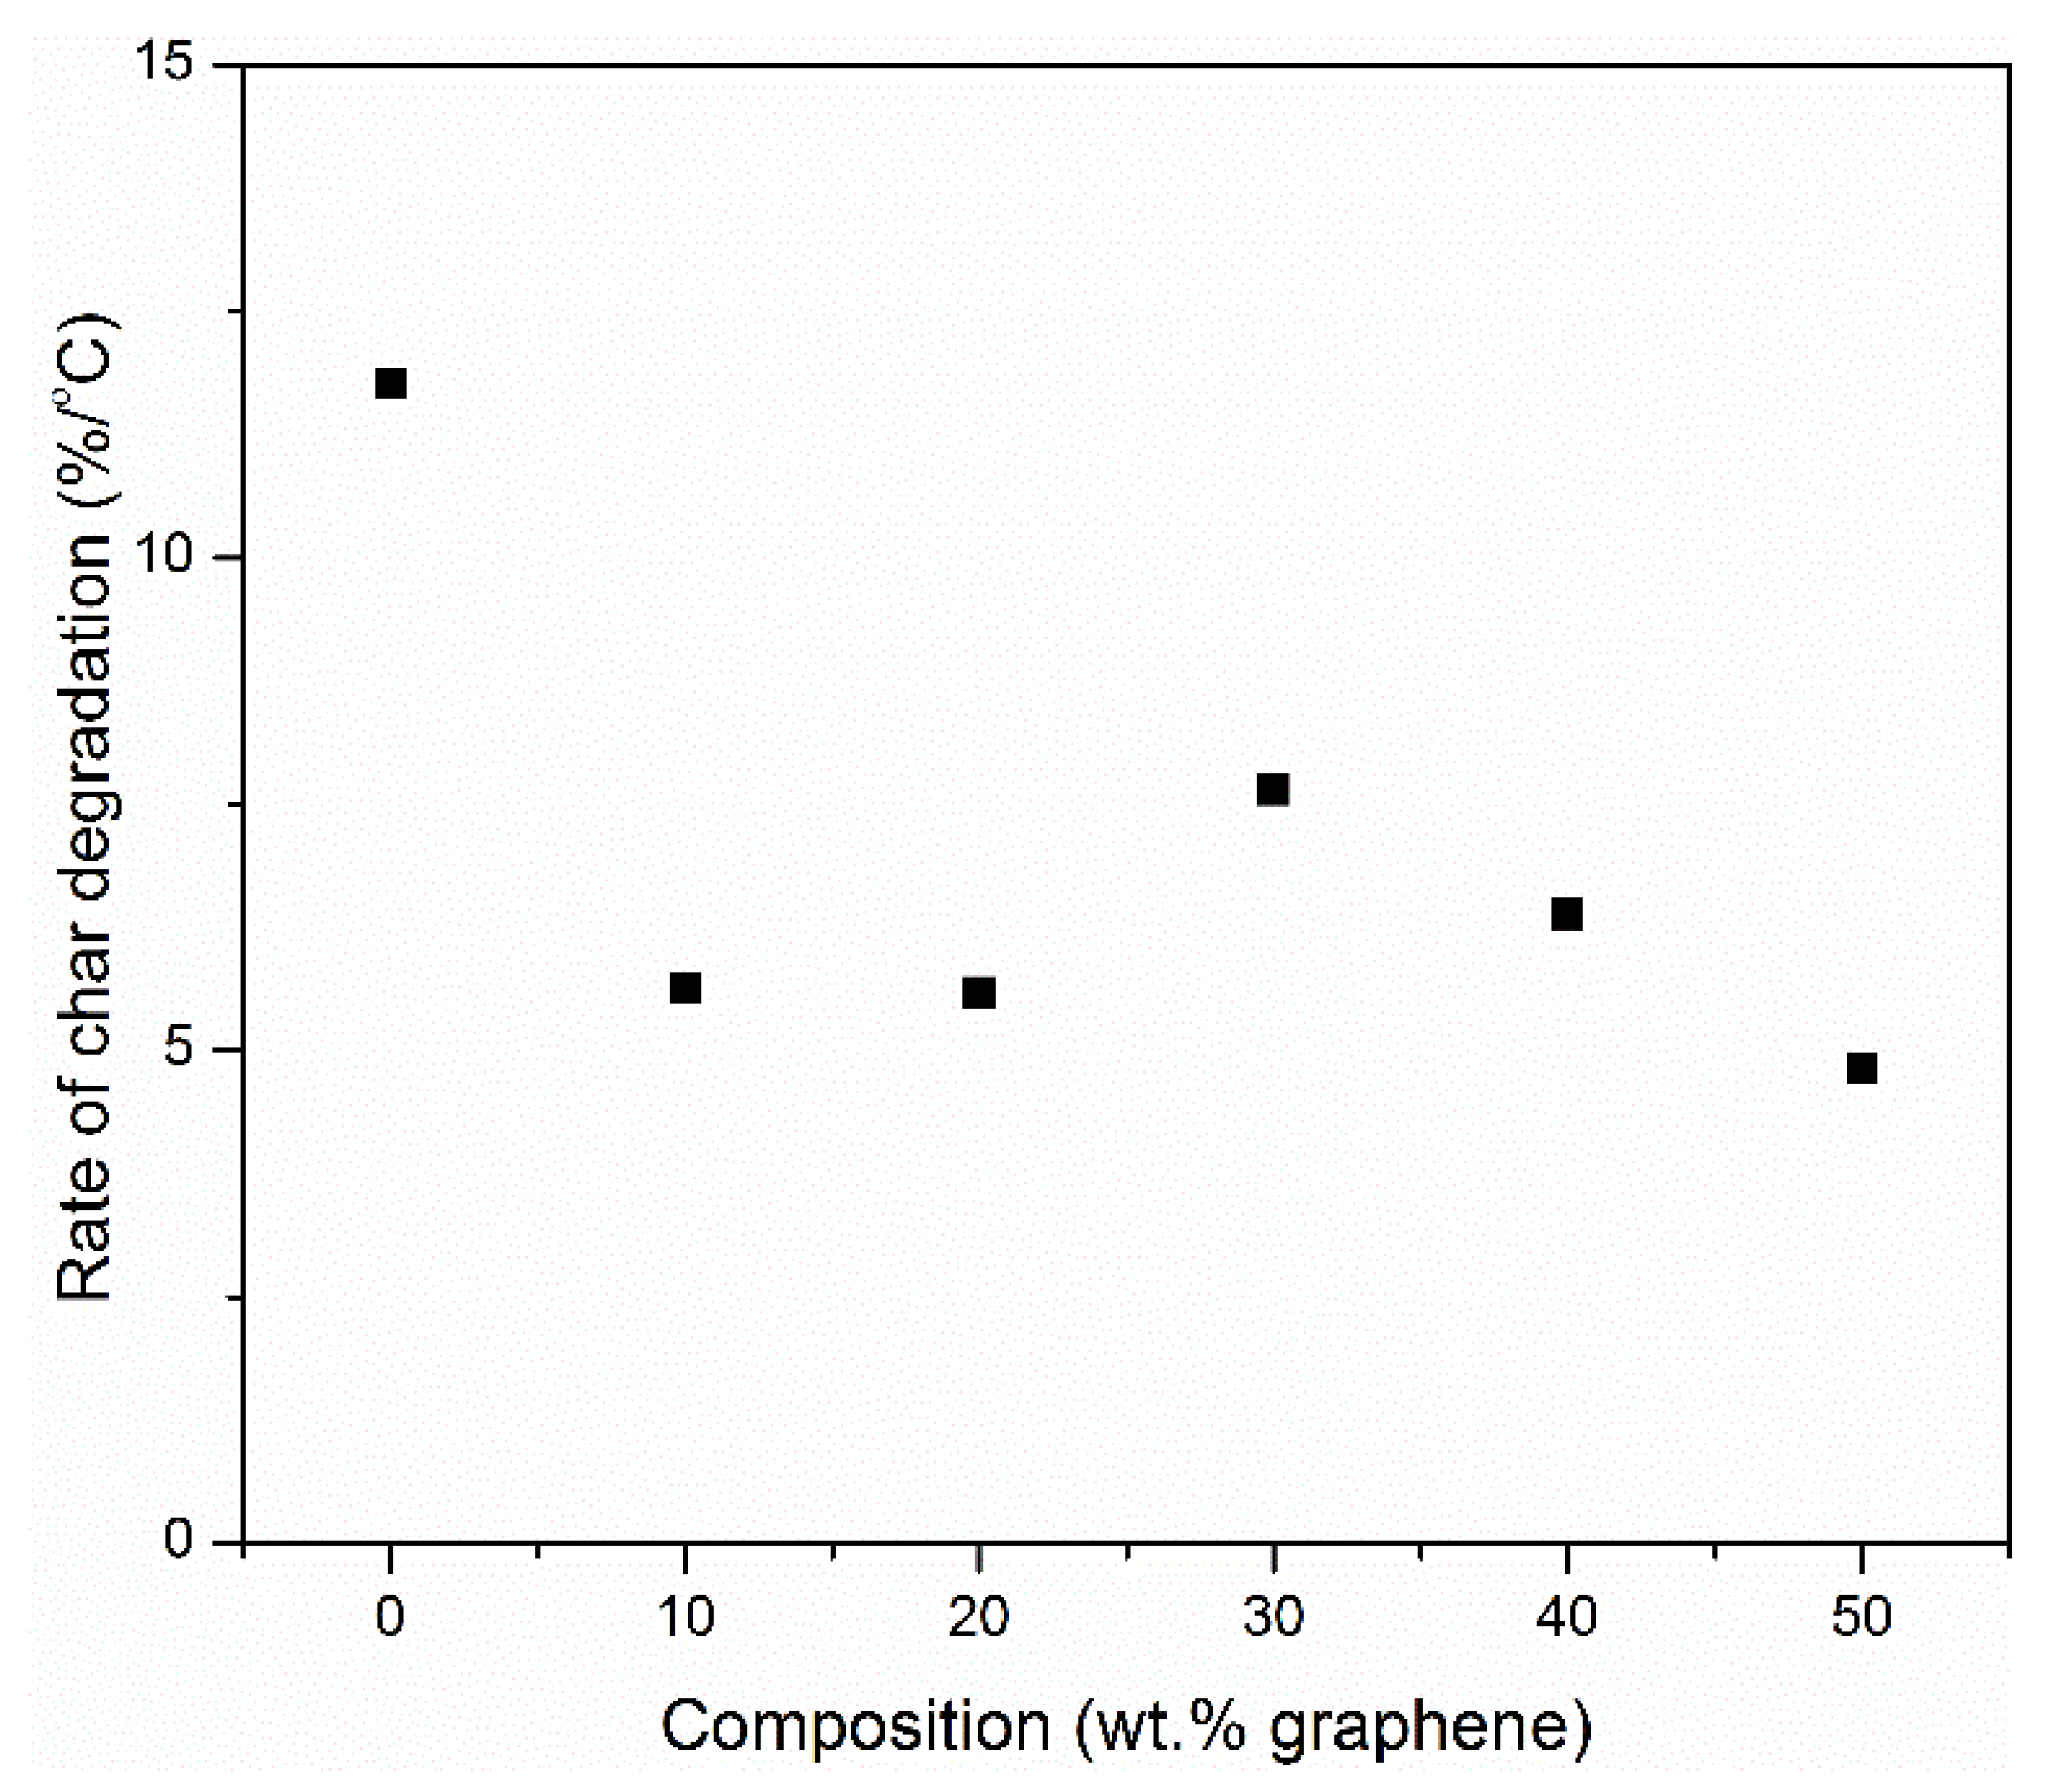
3.3. Thermogravimetric Analysis

Mass loss curves in nitrogen are shown in Figure 4. Graphene undergoes less than 2% mass loss up to 800 °C. Graphene has been shown to maintain its structure in inert atmosphere to temperatures above 800 °C, hence the minimal mass loss [22]. Neat polyimide (PI) and the PINGS nanocomposites show multiple degradation stages. The first stage occurs at temperatures below 100 °C and it is attributed to evaporation of preabsorbed water and solvent from the films [23]. The second degradation stage occurs at temperatures of 210–330 °C. This is attributed to the evaporation of water resulting from the closure of uncyclized amic acids (imidization) [24]. Major weight loss occurs at 480–600 °C.
The proposed reaction scheme of the major weight loss is as shown in Figure 5.
Analysis of major volatile decomposition products evolved indicate that the imide ring is the site of initial degradation [25]. Thermal cleavage of the imide ring leads to the loss of carbon, oxygen, and hydrogen in the form of carbon monoxide, carbon dioxide, water, and other low boiling point products [26]. At temperatures above 600 °C, a cleavage of stronger bonds in the aromatic rings lead to the loss of aromatic hydrocarbons and amines, resulting in the slow degradation of the char [27].
Char retention was determined from the mass loss curves shown in Figure 4. It was reported by Van Krevelen [28] that the char retention of polymers obtained from a thermogravimetric test carried out under nitrogen atmosphere has a direct correlation with the limiting oxygen index (LOI) (Equation (4), [28])
LOI × 100 = 17.5 + 0.4CR
where CR is the char residue in wt.% at 850 °C. The LOI of pure carbon is 100%. Figure 6 shows the predicted limiting oxygen index for polyimide-graphene composite film as a function of graphene composition. The graphene used in the experiments is multi-layered (thickness of 70–100 nm) and has a purity of 98%, indicating that the composition is not 100% carbon, and hence a 98% LOI rating was assigned to it.
Based on the approximations obtained from Equation (4), there is a 17% improvement in the LOI of the neat PI with the addition of 50 wt.% graphene.
Figure 7 shows the derivative mass loss curves of the samples. Table 2 gives a summary of the temperature at maximum rate of degradation (Tmax) and the area under the curves. A shift to lower temperatures is observed as the graphene loadings in the composites increases. This may be an indication that graphene interferes with imidization, thereby slightly reducing the onset temperature of degradation of polyimide. However, the change in the onset of degradation temperature is only about 7% at 50 wt.% graphene. This is small compared to the significant decrease in the area under the derivative curves with increasing graphene loading. A decrease of 69% is observed at 50 wt.% graphene. This is indicative of decreased mass loss of the sample, thereby preserving the structural integrity of the sample.
The rate of mass loss was obtained from the derivative mass loss curves. The mass loss rate corresponds to the amount of fuel released as a function of time and it is an excellent predictor of the heat release rate, which is correlated to the flammability of a material. The higher the mass loss, the more fuel released, which in turn will lead to more volatile combustible species that will release heat upon combustion. It is assumed that all volatiles released are completely flammable since there are no gas-phase flame retardants present in the samples. The variation in the rate of degradation of the polyimide matrix with weight percent graphene in the nanocomposites is shown in Figure 8.
The mass loss rate difference (ΔM/M0) decreased by 12% at 10 wt.% graphene and 56% at 50 wt.% graphene. This significant decrease in the mass loss rate is attributed to an improvement in char retention due to the presence of graphene. Graphene forms a continuous protective char layer that acts as a thermal insulator and a mass transport barrier [19]. The use of graphene derivatives as fillers to improve the barrier properties of polyimide has been reported by various researchers [20,29]. Due to the excellent thermal conductivity of graphene, it also absorbs heat to reduce system temperature and slows down decomposition of the underlying polymer [30].
Degradation of the composites in air atmosphere was observed to occur in multiple stages (Figure 9a) corresponding to polymer matrix degradation, I (also observed in nitrogen), polymer char degradation, II and graphene char degradation, III. Figure 9b shows a comparison of the weight loss curves for polyimide and the composites. The fully imidized polyimide burned completely with no residue left, while there was a small amount of residue observed for the composites, indicating that the graphene does not completely degrade in air at temperatures of up to 1000 °C. An overlay of the derivative mass loss curves obtained in air and nitrogen show an overlap of the polyimide degradation peak, indicating that similar processes occur in both atmospheres as pertains to polymer matrix degradation (Figure 10a).
Polyimide char decomposition occurs over a broad temperature range, resulting in a broad and intense decomposition peak. Decomposition of the matrix char seems to occur in stages associated with porous and dense char fractions. The latter is believed to be more stable due to the presence of fused aromatic rings (also known as turbostratic char; formed between 600–900 °C). This pregraphitic char has more oxidative stability and therefore tends to burn off at higher temperatures [31]. The PINGS samples show a third decomposition peak that corresponds to the degradation of the more crystalline and highly graphitized graphene char. The more crystalline and highly graphitized graphene char is responsible for the decrease in the rate of degradation of the polymer matrix, as it forms a thermal barrier that protects the underlying polymer from the external heat flux.
The rate of decomposition of the char was determined from the derivative TGA curves obtained in air. The results, as shown in Figure 11, show an initial decrease of 52% in the rate of char degradation from neat PI to the nanocomposite containing 10 wt.% graphene. The rate fluctuates slightly between the nanocomposite samples containing 10, 20, 30, 40 and 50 wt.% graphene.
The final decomposition temperature was observed to significantly increase as the amount of graphene in the composite increases. However, the addition of graphene slows down the rate of decomposition of the polymer char and extends the final temperature of degradation by approximately 100 °C at 50 wt.% graphene. This is particularly important because the structural integrity of the material is preserved, preventing total collapse of the system that may be associated with a lot of damage in a fire scenario. The presence of polyimide matrix reduces the rate of decomposition of graphene. The rate of decomposition of graphene was determined to be about 8 %/min but that for graphene peak in the composite containing 50 wt.% of graphene was about 5%/min, indicating some level of protection of graphene provided by the polyimide char (Figure 10b and Figure 11). Neat graphene completely degrades at approximately 920 °C while PINGS-50 degrades at 880 °C, hence approaching the thermal oxidative stability of neat graphene.

3.4. Activation Energy of Imidization and Decomposition of Polyimide

Two major degradation processes are observed in the thermal degradation of polyimide in inert atmosphere. These are attributed to the cyclodehydration process that leads to loss of water (occurs between 200–400 °C) and polymer degradation that leads to the rapid loss in mass due to release of volatiles (occurs at temperatures above 500 °C). The phenomenon of cyclodehydration (imidization) was confirmed by calculating the activation energies corresponding to this mass loss region. Imidization is a low energy phenomenon that occurs due to the breaking of hydroxinium-OH2 bond and formation of the tertiary 3° imide nitrogen bonds. The polymer degradation would exhibit higher activation energies required to break the C-C bonds of about 250 kJ/mole. Various researchers have reported activation energies of imidization with a range of 75–100 kJ/mol [26,32,33]. Others have also reported activation energy of imidization of polymerizable reaction mixtures, PMR-15, of between 32 and 63 kJ/mol [34].
The activation energy of imidization and that of the degradation of the polymer were calculated using the Kissinger-Akahira-Sunose method. Figure 12 shows plots of lnβ/T2 versus 1/T from which the activation energies at different conversion degrees were calculated.
The activation energy of imidization was found to be in the range of 50–70 kJ/mol as shown in Figure 11, while that for the degradation of PINGS composites was found to be in the range of 245–272 kJ/mol as shown in Figure 13.
The activation energy of PINGS-30 was found to be out of the range of the other PINGS composites. This might be due to the difference in thickness of the 30 wt.% sample.

4. Conclusions

The incorporation of graphene into polyimide matrix had a significant influence on the thermal stability and flammability properties of polyimide. Graphene has been shown to work synergistically with polyimide to improve the flame retardancy of the nanocomposite system. Char retention was observed to improve by 43% from the neat polymer to the composite containing 50 wt.% graphene. This translated in an enhancement of 24% in the predicted limiting oxygen index. A decrease in the rate of mass loss of the polymer matrix was observed; 56% reduction at 50 wt.% graphene. This attests to the powerful barrier properties of graphene, protecting the underlying polymer from external heat flux and slowing down mass transport from the polymer. Analysis of decomposition in air also indicates that the presence of graphene shifts the final decomposition temperature of the nanocomposites by >100 °C, preserving the structural integrity of the material. Two major mechanisms were observed to occur during the degradation of the nanocomposites: imidization and polymer degradation. Activation energy calculations were used to isolate these processes.

Author Contributions

Conceptualization, J.O.I. and C.A.; methodology, J.O.I. and C.A.; validation, C.A. and S.C.; formal analysis, C.A.; investigation, C.A. and S.C.; resources, J.L.; data curation, C.A.; writing—original draft preparation, C.A.; writing—review and editing, J.O.I. and C.A.; visualization, C.A.; supervision, J.O.I.; project administration, J.O.I. All authors have read and agreed to the published version of the manuscript.

Funding

This research received no external funding.

Data Availability Statement

The data presented in this study are available in within the article.

Conflicts of Interest

The authors declare no conflict of interest.

References

  1. Koo, M.; Bae, J.-S.; Shim, S.E.; Kim, D.; Nam, D.-G.; Lee, J.-W.; Lee, G.-W.; Yeum, J.H.; Oh, W. Thermo-dependent characteristics of polyimide–graphene composites. Colloid Polym. Sci. 2011, 289, 1503–1509. [Google Scholar] [CrossRef]
  2. Banerjee, S.; Madhra, M.K.; Salunke, A.K.; Maier, G. Synthesis and properties of fluorinated polyimides. 1. Derived from novel 4,4?-bis(aminophenoxy)-3,3?-trifluoromethyl terphenyl. J. Polym. Sci. Part A Polym. Chem. 2002, 40, 1016–1027. [Google Scholar] [CrossRef]
  3. Qu, W.-L.; Ko, T.-M. Studies of dielectric characteristics and surface energies of spin-coated polyimide films. J. Appl. Polym. Sci. 2001, 82, 1642–1652. [Google Scholar] [CrossRef]
  4. Liu, M.; Jia, Z.; Jia, D.; Zhou, C. Recent advance in research on halloysite nanotubes-polymer nanocomposite. Prog. Polym. Sci. 2014, 39, 1498–1525. [Google Scholar] [CrossRef]
  5. Xiao, S.; Che, L.; Li, X.; Wang, Y. A novel fabrication process of MEMS devices on polyimide flexible substrates. Microelectron. Eng. 2008, 85, 452–457. [Google Scholar] [CrossRef]
  6. Morgan, A.B.; Putthanarat, S. Use of inorganic materials to enhance thermal stability and flammability behavior of a polyimide. Polym. Degrad. Stab. 2011, 96, 23–32. [Google Scholar] [CrossRef]
  7. Schoeppner, G.; Tandon, G.P.; Pochiraju, K.V. Predicting thermooxidative degradation and performance of high-temperature polymer matrix composites. In Multiscale Modeling and Simulation of Composite Materials and Structures; Springer: Boston, MA, USA, 2008; pp. 359–462. [Google Scholar] [CrossRef]
  8. Pochiraju, K.V.; Tandon, G.P. Modeling Thermo-Oxidative Layer Growth in High-Temperature Resins. J. Eng. Mater. Technol. Trans. ASME 2005, 128, 107–116. [Google Scholar] [CrossRef]
  9. Putthanarat, S.; Tandon, G.P.; Schoeppner, G. Influence of aging temperature, time, and environment on thermo-oxidative behavior of PMR-15: Nanomechanical characterization. J. Mater. Sci. 2008, 43, 6714–6723. [Google Scholar] [CrossRef]
  10. Pielichowski, K.; Pielichowska, K. Polymer Nanocomposites. In Handbook of Thermal Analysis and Calorimetry; Elsevier: Amsterdam, The Netherlands, 2018; pp. 431–485. [Google Scholar] [CrossRef]
  11. Hu, K.; Kulkarni, D.D.; Choi, I.; Tsukruk, V.V. Graphene-polymer nanocomposites for structural and functional applications. Prog. Polym. Sci. 2014, 39, 1934–1972. [Google Scholar] [CrossRef]
  12. Ko, H.; Jiang, C.; Shulha, H.; Tsukruk, V.V. Carbon Nanotube Arrays Encapsulated into Freely Suspended Flexible Films. Chem. Mater. 2005, 17, 2490–2493. [Google Scholar] [CrossRef]
  13. CaraDonna, A.; Badini, C.; Padovano, E.; Pietroluongo, M. Electrical and Thermal Conductivity of Epoxy-Carbon Filler Composites Processed by Calendaring. Materials 2019, 12, 1522. [Google Scholar] [CrossRef] [Green Version]
  14. Kovtyukhova, N.I.; Martin, B.R.; Mbindyo, J.K.N.; Smith, P.A.; Razavi, B.; Mayer, T.S.; Mallouk, T.E. Layer-by-Layer Assembly of Rectifying Junctions in and on Metal Nanowires. J. Phys. Chem. B 2001, 105, 8762–8769. [Google Scholar] [CrossRef]
  15. Morgan, A.B. Flame retarded polymer layered silicate nanocomposites: A review of commercial and open literature systems. Polym. Adv. Technol. 2006, 17, 206–217. [Google Scholar] [CrossRef]
  16. Gilman, J.W. Flammability and thermal stability studies of polymer layered-silicate (clay) nanocomposites. Appl. Clay Sci. 1999, 15, 31–49. [Google Scholar] [CrossRef]
  17. Morgan, A.B.; Harris, R.H.; Kashiwagi, T.; Chyall, L.J.; Gilman, J.W. Flammability of polystyrene layered silicate (clay) nanocomposites: Carbonaceous char formation. Fire Mater. 2002, 26, 247–253. [Google Scholar] [CrossRef]
  18. Muraleedharan, K.; Alikutty, P.; Mujeeb, V.M.A.; Sarada, K. Kinetic Studies on the Thermal Dehydration and Degradation of Chitosan and Citralidene Chitosan. J. Polym. Environ. 2014, 23, 1–10. [Google Scholar] [CrossRef]
  19. Masikhwa, T.M.; Madito, M.J.; Bello, A.; Dangbegnon, J.K.; Manyala, N. High performance asymmetric supercapacitor based on molybdenum disulphide/graphene foam and activated carbon from expanded graphite. J. Colloid Interface Sci. 2017, 488, 155–165. [Google Scholar] [CrossRef] [PubMed]
  20. Tsai, M.-H.; Tseng, I.-H.; Liao, Y.-F.; Chiang, J.-C. Transparent polyimide nanocomposites with improved moisture barrier using graphene. Polym. Int. 2012, 62, 1302–1309. [Google Scholar] [CrossRef]
  21. Aboulkas, A.; El Harfi, K.; El Bouadili, A. Thermal degradation behaviors of polyethylene and polypropylene. Part I: Pyrolysis kinetics and mechanisms. Energy Convers. Manag. 2010, 51, 1363–1369. [Google Scholar] [CrossRef]
  22. Liu, F.; Wang, M.; Chen, Y.; Gao, J. Thermal stability of graphene in inert atmosphere at high temperature. J. Solid State Chem. 2019, 276, 100–103. [Google Scholar] [CrossRef]
  23. Al-Ajaj, I.A.; Kareem, A.A. Synthesis and characterization of polyimide thin films obtained by thermal evaporation and solid state reaction. Mater. Sci. 2016, 34, 132–136. [Google Scholar] [CrossRef] [Green Version]
  24. Yang, W.-K.; Liu, F.-F.; Li, G.-M.; Zhang, E.-S.; Xue, Y.-H.; Dong, Z.-X.; Qiu, X.; Ji, X. Comparison of different methods for determining the imidization degree of polyimide fibers. Chin. J. Polym. Sci. 2015, 34, 209–220. [Google Scholar] [CrossRef]
  25. Cella, J.A. Degradation and stability of polyimides. Polym. Degrad. Stab. 1992, 36, 99–110. [Google Scholar] [CrossRef]
  26. Pyun, E.; Mathisen, R.J.; Sung, C.S.P. Kinetics and Mechanisms for Thermal Imidization of a Polyamic Acid Studied by Ultraviolet—Visible Spectroscopy. Macromolecules 1989, 22, 1174–1183. [Google Scholar] [CrossRef]
  27. Adamczak, A.D.; Spriggs, A.A.; Fitch, D.M.; Awad, W.; Wilkie, C.A.; Grunlan, J.C. Thermal degradation of high-temperature fluorinated polyimide and its carbon fiber composite. J. Appl. Polym. Sci. 2010, 115, 2254–2261. [Google Scholar] [CrossRef] [Green Version]
  28. Van Krevelen, D. Some basic aspects of flame resistance of polymeric materials. Polymer 1975, 16, 615–620. [Google Scholar] [CrossRef]
  29. Tseng, I.-H.; Liao, Y.-F.; Chiang, J.-C.; Tsai, M.-H. Transparent polyimide/graphene oxide nanocomposite with improved moisture barrier property. Mater. Chem. Phys. 2012, 136, 247–253. [Google Scholar] [CrossRef]
  30. Kurańska, M.; Prociak, A.; Cabulis, U.; Kirpļuks, M.; Ryszkowska, J.L.; Auguścik, M. Innovative porous polyurethane-polyisocyanurate foams based on rapeseed oil and modified with expandable graphite. Ind. Crop. Prod. 2017, 95, 316–323. [Google Scholar] [CrossRef]
  31. Levchik, S.V. Introduction to Flame Retardancy and Polymer Flammability. In Flame Retardant Polymer Nanocomposites; John Wiley & Sons, Inc.: Hoboken, NJ, USA, 2006; pp. 1–29. [Google Scholar] [CrossRef] [Green Version]
  32. Yu, H.-C.; Jung, J.-W.; Choi, J.-Y.; Chung, C.-M. Kinetic study of low-temperature imidization of poly(amic acid)s and preparation of colorless, transparent polyimide films. J. Polym. Sci. Part A Polym. Chem. 2015, 54, 1593–1602. [Google Scholar] [CrossRef]
  33. Lauver, R.W. Kinetics of imidization and crosslinking in PMR polyimide resin. J. Polym. Sci. Polym. Chem. Ed. 1979, 17, 2529–2539. [Google Scholar] [CrossRef] [Green Version]
  34. Iroh, J.O.; Jordan, K. Rate of imidization of polymerizable reaction mixtures: PMR-15. J. Appl. Polym. Sci. 1997, 66, 2529–2538. [Google Scholar] [CrossRef]
Figure 1. Raman spectra of (a) neat polyimide (PI) and PI containing (b) 1 wt.% (c) 10 wt.% and (d) 30 wt.% graphene.
Minerals 11 00168 g001
Figure 2. SEM images of (a) Neat PI, (b) Nano-graphene sheets and (c) PINGS-10 (×25,000).
Minerals 11 00168 g002
Figure 3. SEM micrographs showing cross-sectional morphology of (a) PINGS-30 and (b) PINGS-40.
Minerals 11 00168 g003
Figure 4. Thermogravimetric mass loss curves of (I) Graphene, (II) PINGS-50, (III) PINGS-30, (IV) PINGS-10 and (V) Neat PI (in nitrogen; β = 30 °C/min).
Minerals 11 00168 g004
Figure 5. Degradation mechanism of polyimide in nitrogen.
Minerals 11 00168 g005
Figure 6. Predicted limiting oxygen index (LOI) versus composition for neat PI and composites containing 10, 20, 30, 40 and 50 wt.% graphene based on Equation (2) ([28]).
Minerals 11 00168 g006
Figure 7. Derivative mass loss curves (I) PI, (II) PINGS -10, (III) PINGS-30, (IV) PINGS-50 and (V) Graphene (in nitrogen; β = 30 °C/min).
Minerals 11 00168 g007
Figure 8. Rate of degradation of the polymer matrix as a function of the percentage of graphene in the nanocomposites (in nitrogen; β = 30 °C/min).
Minerals 11 00168 g008
Figure 9. (a) Thermogravimetric and derivative mass loss curve for PI composite containing 50 wt.% graphene showing (I) the PI matrix degradation peak, (II) the PI char/graphene char degradation peak, (III) the graphene char degradation peak (in air; β = 30 °C/min). (b) Thermogravimetric mass loss curves of (I) Neat PI (II) Graphene (III) PINGS-10 (IV) PINGS-30 (V) PINGS-50 (in air; β = 30 °C/min).
Minerals 11 00168 g009
Figure 10. (a) TGA and derivative TGA mass loss curves in air and in nitrogen for PINGS (b) Derivative TGA mass loss curves (I) PI, (II) PINGS -50, and (III) Graphene (in air; β = 30 °C/min).
Minerals 11 00168 g010
Figure 11. Rate of char degradation as a function of graphene composition in the nanocomposites Graphene (in air; β = 30 °C/min).
Minerals 11 00168 g011
Figure 12. Kissinger-Akahira-Sunose (KAS) plots for PINGS-10 and PINGS-30.
Minerals 11 00168 g012
Figure 13. Activation energy of imidization and polymer degradation as a function of composition of graphene in the nanocomposites.
Minerals 11 00168 g013
Table 1. Characteristics of the nanographene sheets.
Average Lateral Dimension (µm)Thickness (nm)Oxygen Content (%)Specific Surface Area (m2/g)Density (g/cm3)Carbon (wt. %)Hydrogen (wt.%)Nitrogen (wt.%)Oxygen (wt.%)
770–100<110–150.1–0.3≥97≤1≤0.5≤2
Table 2. Summary data from derivative curves.
SampleTmax (°C)Area under Curve (%)
Neat PI59258.7
PINGS-1057335.4
PINGS-3056130.8
PINGS-5054818.2
Publisher’s Note: MDPI stays neutral with regard to jurisdictional claims in published maps and institutional affiliations.

