Article

Exploring New Ways to Reconstruct the Forma Urbis Romae: An Archaeometric Approach (CL Color and Stable Isotope Analyses)

by
Lluís Casas
1,*,
Roberta Di Febo
1,2,
Mauro Brilli
3,
Francesca Giustini
3,
Marco Gozzi
3,
Francesca De Caprariis
4,
Juan Diego Martín-Martín
5 and
Claudio Parisi Presicce
4
1
Departament de Geologia, Universitat Autònoma de Barcelona (UAB), Edifici C, 08193 Cerdanyola del Vallès, Catalonia, Spain
2
Institut Català d’Arqueologia Clàssica (ICAC), Plaça d’en Rovellat, 43003 Tarragona, Catalonia, Spain
3
Istituto di Geologia Ambientale e Geoingegneria (IGAG), Consiglio Nazionale delle Ricerche (CNR), Area della Ricerca di Roma 1, Via Salaria km 29,300, Monterotondo St., 00015 Rome, Italy
4
Musei Capitolini, Piazza del Campidoglio 1, 00186 Rome, Italy
5
Departament de Mineralogia, Petrologia i Geologia Aplicada, Facultat de Ciències de la Terra, Universitat de Barcelona (UB), 08028 Barcelona, Catalonia, Spain
*
Author to whom correspondence should be addressed.
Minerals 2021, 11(12), 1400; https://doi.org/10.3390/min11121400
Submission received: 17 November 2021 / Revised: 7 December 2021 / Accepted: 8 December 2021 / Published: 11 December 2021
(This article belongs to the Special Issue Colours in Minerals and Rocks)

Abstract

:
The Forma Urbis Romae (F.U.) was a 3rd-century-AD monumental map of ancient Rome consisting of 151 rectangular marble slabs. Several efforts have been made to reconstruct it from its current incomplete and fragmentary condition. In this paper, we explore the potential of an archaeometric approach to serve this purpose. Almost a hundred F.U. fragments have been characterized, particularly focusing on cathodoluminescence (CL) microscopy and stable isotopes (δ18O and δ13C). Different statistical methods have been used to quantify the similarity between samples. The central assumption is that samples from a given slab share similar CL colors and isotopic ratios. The assumption has been verified for samples from single fragments and then it has been used to check ten debated reconstruction hypotheses. The measured isotopic ratios confirm the Proconnesian nature of the F.U. marble, except for a fragment. Beyond provenance, the results cast doubts on four out of the ten checked reconstruction hypotheses and support the other six. The reconstruction of the F.U. remains a fascinating challenge, and both isotopic and CL analyses have demonstrated their potential to tackle it. Further research could extend the presented methodology to a higher number of samples. The innovative use of CL to reconstruct a fragmented artwork could be applied to other projects.

1. Introduction

1.1. The Forma Urbis Romae

The Forma Urbis Romae (abbreviated, in this paper, as F.U. or simply the plan) was a sculpted marble plan of Rome. It was commissioned between 203 and 211 AD by the emperor Septimius Severus, as part of the reconstruction of the Templum Pacis (Temple of Peace) destroyed by a severe fire in 192 AD [1,2]. It was located in one of the rooms of the Templum Pacis, on a wall surface that, around the 6th century, was incorporated into the basilica complex of Santi Cosma e Damiano (Rome). The basilica is still visible today from the via dei Fori Imperiali as well as the rows of holes where the map was attached using bronze clamps (Figure 1). An earlier version of the plan was probably installed in the same place when Vespasian first built the Temple of Peace in 70–75 AD [3,4].
The function of the F.U. has frequently been the object of debate among scholars. The administrative purpose of the plan has been suggested by different authors [5,6,7]; meanwhile, others believe that it only had a decorative–celebratory function of the greatness of the city of Rome. In this regard, the lack of standard cadastral data, such as numerical inscriptions on dimensions and private owners, along with some graphic ambiguities, would be the evidence that this plan would have not served any official purpose [8,9,10,11]. However, the use of marble plans with cadastral and administrative functions and with a finer and more accurate workmanship than the F.U. is confirmed by the discovery of some fragments in different places of the city of Rome and, in 2006, in the same chamber of the Templum Pacis [12,13].
Although the exhaustive description of the vicissitudes of the F.U. over the centuries is out of the scope of this paper, we will summarize below the defining moments of the history of the research on this plan.
By the mid-6th century, the plan was no longer considered of any interest, which is attested by the fact that the Templum Pacis complex was reused in the construction of the church of Santi Cosma e Damiano, which incorporated the wall of the F.U. into its exterior [1], and a necropolis was installed in the same area of the Temple [14,15]. During the Middle Ages, most of the marble slabs were scavenged or burned in the limekilns for mortar production.
The activity of spoliation in the area of Templum Pacis continued until the Renaissance period, as reported by Lanciani [16]. In 1562, the remaining fragments were found in excavations behind the church of Santi Cosma e Damiano. The fragments were offered as a gift to the Farnese, an influential Italian Renaissance family, whose collections were studied and drawn [17]. The drawings of about 91 fragments are today gathered in the Vatican Library (codex Vat. Lat. 3439 fols 13–23), and they represent a valuable and unique record as some fragments have been partially or completely lost since the drawings were made. During the 17th century, the interest in these fragments was lost and the less striking specimens were discarded as rubble and used in a Farnese construction, the Giardino Segreto, between the via Giulia and the Tiber [9]. The following centuries saw the publication of some works about the plan fragments, such as the illustrations by Bellori (1673) and Piranesi (1754). Although these publications do not reproduce the real cartography of the plan, they are the only available source for some minor fragments that are lost today. Between the 19th and 20th centuries, the discovery of new fragments coming from the Roman Forum, the aula of Templum Pacis, and the Farnese constructions brought the attention of the scholars back to the F.U. [9]. Prominent Italian topographers of the time, such as Carettoni, Gatti, Colini, and Cozza, began to work on the F.U., carrying out measurements and documentations of the fragments and the study of the wall on which the plan was originally mounted in order to determine the proper arrangement of the slabs. This collaborative work yielded, in 1960, the publication of La Pianta Marmorea di Roma Antica: Forma Urbis Romae, which represents, until now, the most important reference work for the study of the F.U. [1]. The 1960 edition was followed by Rodriguez Almeida’s supplementary volume entitled Forma Urbis Marmorea. Aggiornamento Generale 1980 [18], which represents the second major twentieth-century publication of the Severan Marble Plan. Research works, new integrations, and theories about new positions of plan fragments have been published annually in the last decades (see, for example, [19,20,21,22,23,24]).
Until the mid-90s of the last century, to undertake studies on the F.U. implied being in Rome, and the relevant publications on the subject, mainly in Italian, were difficult to find outside of specialist research settings. In those years, the success of the application of digital technologies in the Humanities (digital humanities) led the Sovrintendenza Capitolina ai Beni Culturali (Superintendence of Cultural Heritage) to start a collaboration project with Stanford University (http://formaurbis.stanford.edu, accessed on 10 December 2021). Thanks to the use of laser scanners and digital color cameras, the shapes and surface appearance of every known fragment of the F.U. were digitized. In this way, an online database was created that provides descriptions and bibliographic information about each fragment, as well as photographs and 3D models of individual fragments that can be rotated or zoomed in to study their incisions in detail [25,26,27]. This approach has completely modified the access conditions to the F.U. and, since then, all the available documentation has been accessible through the Internet. Additionally, through a collaboration between the Sovrintendenza Capitolina and the Ancient World Mapping Center (University of North Carolina, Chapel Hill, NC, USA), a new updated scanning campaign is currently ongoing.

1.2. Archaeometry beyond Provenance

The F.U. was about 13 m tall by 18.10 m wide and occupied approximately a surface of 235 m2. The map depicted, at a 1:240 scale, a great range of buildings, including domus, insulae, baths, porticoes, aqueducts, amphitheatres, relevant public monuments, streets, squares, and warehouses, most of them identified by name [9]. Natural features (watercourses, hills, and trees) were omitted, except in the case of monumental complexes [28]. The designs were incised onto 151 Proconnesian marble slabs (Figure 2) regularly arranged, while engraved lines, inscriptions, and graphic conventions were painted with the red-orange minium pigment. Traces of color are still visible in some engravings today [7].
Proconnesian marble (or Marmor proconnesium as appears in the so-called Diocletian’s edict (301 AD) of maximum prices) was quarried on the northern side of Proconnesos island (modern Turkish Marmara island), and it was formed during the Palaezoic as a consequence of a regional mid-grade metamorphism [29]. The exploitation of this marble started in the second half of the 1st century AD and increased during the following centuries [30]. Proconnesian marble gradually superseded Carrara marbles in Rome and, during the Severan period, its presence in the Imperial capital increased to almost 100% [31].
Archaeometric investigations, and in particular cathodoluminescence (CL) and C and O isotopic measurements on marbles, are ever more frequently used in the field of archaeology and cultural heritage for provenance studies [32,33,34]. The use of C and O isotopic ratios for determining the provenance of classical Greek marbles was pioneered by Craig and Craig [35]. One of the first applications of CL in the studies of ancient marbles was proposed by Barbin and collaborators [36,37] who determined the cathodomicrofacies of the main marbles of antiquity by a combination of cathodoluminescence, petrography, and isotopic data. Few isotopic analyses have been performed, to date, on marble fragments of the F.U. [38]. In contrast, CL has not been previously applied to the characterization of the marble fragments of the plan. Although the marble from F.U. was originally thought to be Hymettian (from Greece), it is now well established that is actually Proconnesian [38,39], and it would not make much sense to use isotopes or CL to only confirm this well-established marble provenance. However, there are many reasons to undertake the archaeometric characterization of the F.U. beyond its provenance. Unfortunately, the remaining fragments only cover 10–15% percent of the original map surface. The state of conservation of the about 1300 F.U. fragments is heterogenous, ranging from small debris to nearly complete reconstituted slabs. Additionally, burial, exposure to fire, and weathering have produced superficial damages that make the identification difficult. For some of the fragments it has been possible to identify and locate correctly anonymous buildings and rooms, also thanks to the continuous progression of archaeological excavations and finds in the city [12,24,26,27,40,41]. However, there are many isolated fragments and debated hypotheses on possible reconstructions.
The goal of this paper is to present new data on a multi-technique characterization of around one hundred marble chips sampled from several fragments of the F.U. (including mineralogy, petrography, carbon and oxygen stable isotopes, and CL). In particular, statistical methods have been applied to stable isotopes and CL data to test their applicability to tackle specific questions concerning: the attribution of fragments to a specific slab; matches between pairs of fragments; and validation/confutation of affinity hypotheses based on previous archaeological works or on the suitability of the different tested statistical methods. The results could contribute to the archaeological discussions raised in the last decades around the F.U., in particular issues regarding the topography of the Palatine Hill and its surroundings (e.g., Adonaea gardens; the so-called Temple of Faustina; and the Curiae Veteres building); the actual position of the iconic building labelled SEVERI ET ANTONINI; or the real pertinence of several fragments connected with the Campus Martius area.

2. Materials and Methods

2.1. Studied Materials

A set of 93 fragments of F.U. have been selected for this study. From them, a total number of 132 samples were carefully collected in the form of tiny chips using a small hammer and a chisel, avoiding weathered material and patinas. Almost all of the samples were split into two parts, one to be used for thin sections, the other to be grinded for isotopic analysis. The selected fragments have been described, identified, and assigned to a slab (Figure 2) according to the Stanford database (http://formaurbis.stanford.edu, accessed on 10 December 2021). Depending on the available knowledge, the samples can be distributed into three groups:
  • Group 1 (Table S1): samples belonging to a single fragment of a slab, often composed of several matching pieces. For these samples, the analyses have been undertaken with the specific goal of exploring the scientific consistency of the tested approaches.
  • Group 2 (Table S2): selected fragments consisting of several matching pieces and others of a single piece. In any case, these form sample sets from at least two fragments, which are argued to belong to a given slab despite not matching. These fragments are related to archaeologically debated questions (see Table 1) on their identification and position in reconstructions of the F.U. The analyses have been undertaken with the specific goal of contributing to solve the open questions.
  • Group 3 (Table S3): isolated fragments with or without an assigned slab. These are single-piece fragments that have been analyzed to provide a general insight into the internal variability of the Proconnesian marble features of F.U. Particularly, the data will be used as a general frame to delimit the envelopes covering all the data (isotopic ratios as well as the different measured chromatic variables corresponding to the CL response) of marble from the F.U.
Finally, two more fragments of other Roman-presumed marble plans have been also analyzed [12]. One, labelled as fn31, is an engraved marble slab retrieved from the Templum Pacis with remains of a possible grid of centuriation, although it could actually be a fragment of a tabula lusoria. The other, labelled as fms1960, was found in 1890 in the wall of a vineyard and shows a group of shops (tabernae) on which remain engraved the names, in the genitive, of two or three owners.

2.2. Methods

2.2.1. Analytical Techniques

A preliminary examination of all the sampled chips was undertaken using a stereomicroscope before the separation of a very small quantity for isotopic analyses. The rest of the chips were embedded in epoxy resin to prepare petrographic thin sections. Thin sections were characterized petrographically using a polarizing light microscope (OM) (Nikon Eclipse E600 POL, Tokyo, Japan) under plane polarized light (PPL) and cross polarized light (XPL). The images were retrieved using an attached camera (Nikon DS-Fi3). Further, thin sections were analyzed by cathodoluminescence (CL) microscopy at the Earth Sciences Faculty, Universitat de Barcelona, using a CL8200 Mk5-1 equipment (Cambridge Image Technology Ltd., Welwyn Garden City, HRT, UK), with operating conditions of 17–18 kV and a gun current of ~200 μA. Several exposure times were tested and finally a time exposure of 15 s was used to systematically take CL pictures of all the samples. It is known that the cathodoluminescence response can vary depending on the equipment used and related settings. Additionally, the technique is also very sensitive to the instrumental setup [59] and to a wide range of environmental factors, including humidity and temperature [60]. To minimize such variations, all the CL images were acquired using constant operating conditions and in a single batch of measurements. To control the stability of the system a number of reference samples were repeatedly intercalated within the measurement of the F.U. samples.
Oxygen and carbon isotopes were determined on the calcitic marble powdered samples by isotope ratio mass spectrometry at the Istituto di Geologia Ambientale e Geoingegneria (CNR) of Rome. A Thermo Gasbench II automatic preparation device was used for phosphoric acid digestion at 72 °C and CO2 purification; a Finnigan Delta Plus mass spectrometer measured the carbon and oxygen isotope ratios of carbon dioxide expressed in the usual delta notation, which represents the relative deviation in parts per thousand of the heavy isotope/light isotope ratio of the samples from that of a reference standard. The international standard used was V-PDB for both the oxygen and carbon isotopes. The precision of the analyses was ± 0.10‰.

2.2.2. Statistical Methods

Several statistical methods were used to compare the different CL images (and also the measured isotopic ratios) in order to quantify their similarity. Methods relying on the following concepts have been explored: average pixel, most common pixel (pixel clustering), Euclidian distance (between colors or isotopic ratios), confidence ellipse, Kolmogorov–Smirnov (K–S) distance, and K–S test.
For all the tested methods regarding CL, all the images were cropped (Figure 3) to isolate large rectangular areas containing only the colors of the CL response of samples (cracks, empty spaces, and adjacent areas to the marble sample were avoided). The pixels from the cropped CL images were characterized using different color space systems. Finally, the RGB model was selected because the measured values exhibited a higher dispersion within the RGB color space. In this model, each pixel color is expressed as an RGB triplet indicating the combination of red (R), green (G), and blue (B) to produce a given color. The component values are usually expressed in numbers ranging from 0 to 255. As RGB is an additive color model, white is represented by (255,255,255) and black by (0,0,0). For every image, color histograms corresponding to each channel (R, G, and B) were computed along with the average color of the whole image. Pixel clustering was also applied using the CLARA algorithm [61] in order to obtain a segmented (or simplified) version of the images containing only a limited number of different colors (from 1 to 10).
From the Euclidean distances (between either isotopic values, averaged colors, or main color clusters), a value of similarity between samples was computed considering the observed distribution of distances within the whole database of experimental values. Specifically, similarity was computed as a percentage indicating the height of a Gaussian function at a distance (d) from its maximum. This distance (d) corresponds to the Euclidian distance between the 2 compared data and the corresponding Gaussian function was tuned, fixing that its height measures 10% of its maximum value when computed at a distance d95 (Figure 4a), d95 being the distance that encompasses 95% of all the distances within the observed distribution of distances (using all the available measurements). For comparisons comprising three or more samples, the Euclidian distance was measured from the centroid of the corresponding set of values. The computed similarities were first used to check the consistency of the CL colors from samples from a given fragment and to test hypotheses on affinity between different fragments. A similar approach was also used for comparisons of the obtained isotopic values.
The RGB triplet values were also mapped to a 3-axis graph and it became clear that the measured colors concentrate basically on a plane. This enabled 2D analyses on the values projected on the corresponding median plane. For images of samples corresponding to a same slab with absolute certainty (i.e., samples from matching pieces forming a single fragment), 95% confidence ellipses were computed for the given group and the hypotheses on the identity of other samples were rechecked on the basis of their relative position to the confidence ellipse producing a similarity measurement that could be used as a sort of probability of pertaining to the group for every sample. Specifically, for every analyzed group, it was imposed that, within the confidence ellipse, similarity is maximum (i.e., the probability of pertaining to the group for any triplet within the ellipse is considered 100%) and, from its borders, the similarity is assumed to decrease following a Gaussian curve, fixing arbitrarily that at the border of a general confidence ellipse (computed with all the analyzed images) is 10% (Figure 4b). The method has the advantage of relying on a certain chromatic area for the definition of the characteristic values of a group, instead of using only a single value (the centroid) that is used for data treatment using Euclidian distances. However, the ellipses can only be computed if a minimum of three CL images of matching samples are available.
Finally, a comparison between the histograms corresponding to the different images was performed by calculating the Kolmogorov–Smirnov (K–S) distance [62] between the corresponding cumulative distributions and calculating the corresponding p-values (K–S test).
Data processing was mainly performed using scripts from RStudio (the integrated development environment for R software) as well as Origin and Excel spreadsheet-based computational tools.

3. Analytical Results

3.1. Petrography

Thin-section analyses of F.U. samples show a heteroblastic texture with a bimodal crystal-size distribution. The spatial distribution of the crystals defines, for most of them, a mortar-like texture consisting of larger crystals surrounded by smaller crystals. Grain boundary shapes vary from embayed to sutured. Crystals sometimes appear with deformed polysynthetic twins. Maximum grain size (MGS) values range from 0.7 to 2.9 mm (fine–medium–coarse grained calcite crystals). Occasional accessory minerals include mica and pyrite. The provenance of the F.U. marble has already been established (see Section 1.2) and the described petrographic characteristics fall into those typical of Proconnesian marble. From the petrographic point of view and in the absence of further additional analyses, there is no reason to believe that any of the fragments examined belong to a different marble. The two samples that do not pertain to the F.U. (fn31 and fms1960) exhibit similar petrographic features, except for the significantly lower MGS (~0.4 mm) of sample fms1960 that would make it a very-fine-grained marble, whilst the accepted MGS range for Proconnesian marble is 0.65 mm to 4.5 mm [63].
Although Proconnesian marble shows distinct macroscopic features, such as grey banding, this can be common to other ancient marbles and can go unnoticed in small samples [64]. Many other classical marbles occasionally share petrographic features with Proconnesian marble, such as Aphrodisian or Ephesian marbles, and therefore the identification of Proconnesian marble solely based on petrography could be misleading.

3.2. Isotopic Analyses

The results of the measured stable C and O isotope ratios for the sampled marbles are summarized in Figure 5 (numerical values and identification of samples can be found in Table S4). All the samples, except one, group in a cluster that, according to the isotopic envelopes published by [63], could mainly correspond to Paros-2, Thasos-1(2), or Proconnesos-1 (Figure 5a). The correspondence with Proconnesian marble appears clearer using the 90% confidence ellipses (Figure 5b) that are computed using the isotopic database published by [65]. In particular, the provenance will point to ‘Prokonnesos III’ as appears in [66], and therefore the F.U. samples would correspond to marble from the quarries Harmantaş and Aksoy. However, for sample 238a, the obtained isotopic compositions range between 1.31‰ and 3.38‰ for carbon and −4.09‰ and 0.74‰ for oxygen. It is worth noting that both fn31 and fms1960 samples (those that do not belong to the F.U.) also fall within the same isotopic range. The isotopic composition of the outlier sample (from fragment 238a) is δ13C = −0.68‰ and δ18O = −2.61‰. In accordance with this, this fragment could actually not be made of Proconnesian marble. The isotopic values of this sample are consistent with Paros (Marathi quarry) [66] or Aphrodisias [63] provenance.
The measured isotopic composition of samples from a given fragment tend to be close to each other within the cloud of points formed by all the measured samples, and this feature could be used to add to the discussion on affinity between samples. However, this trend is not always fully verified (see 31-type samples in Figure 5c and Table 2). The heterogeneity of the isotopic composition of marbles has actually been cited as one limiting factor of isotopic data even for the determination of provenance [67].

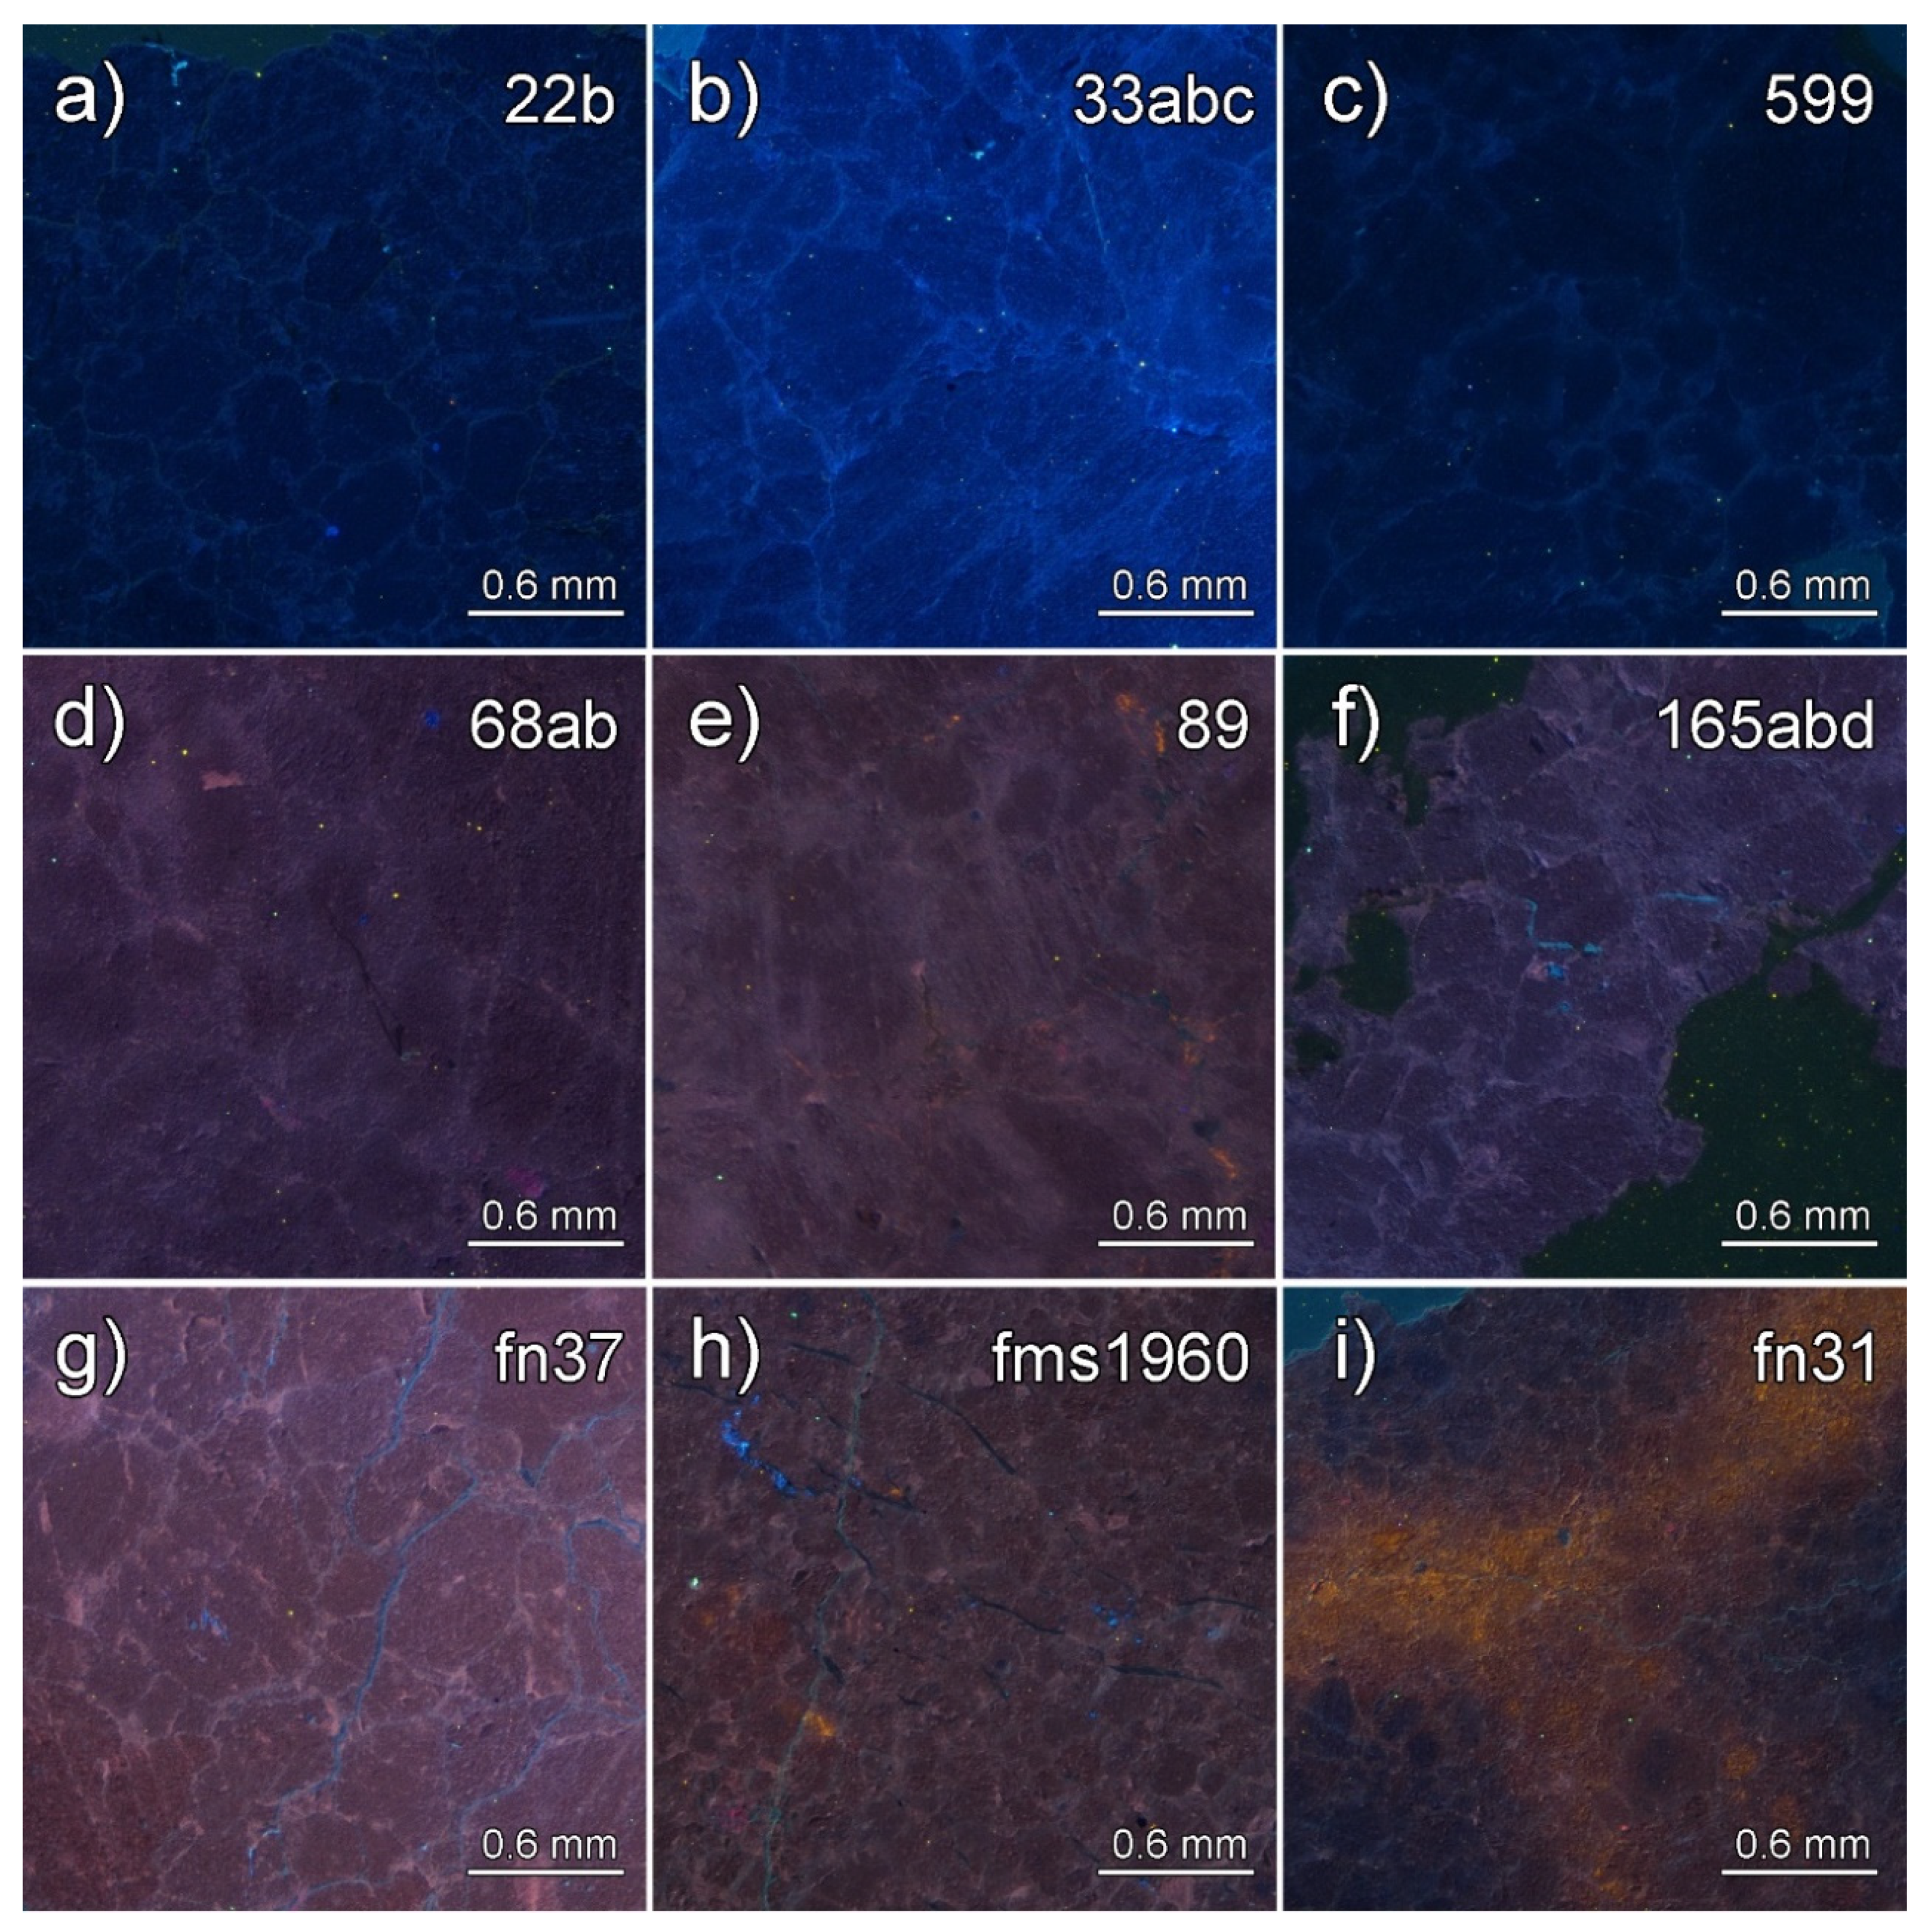
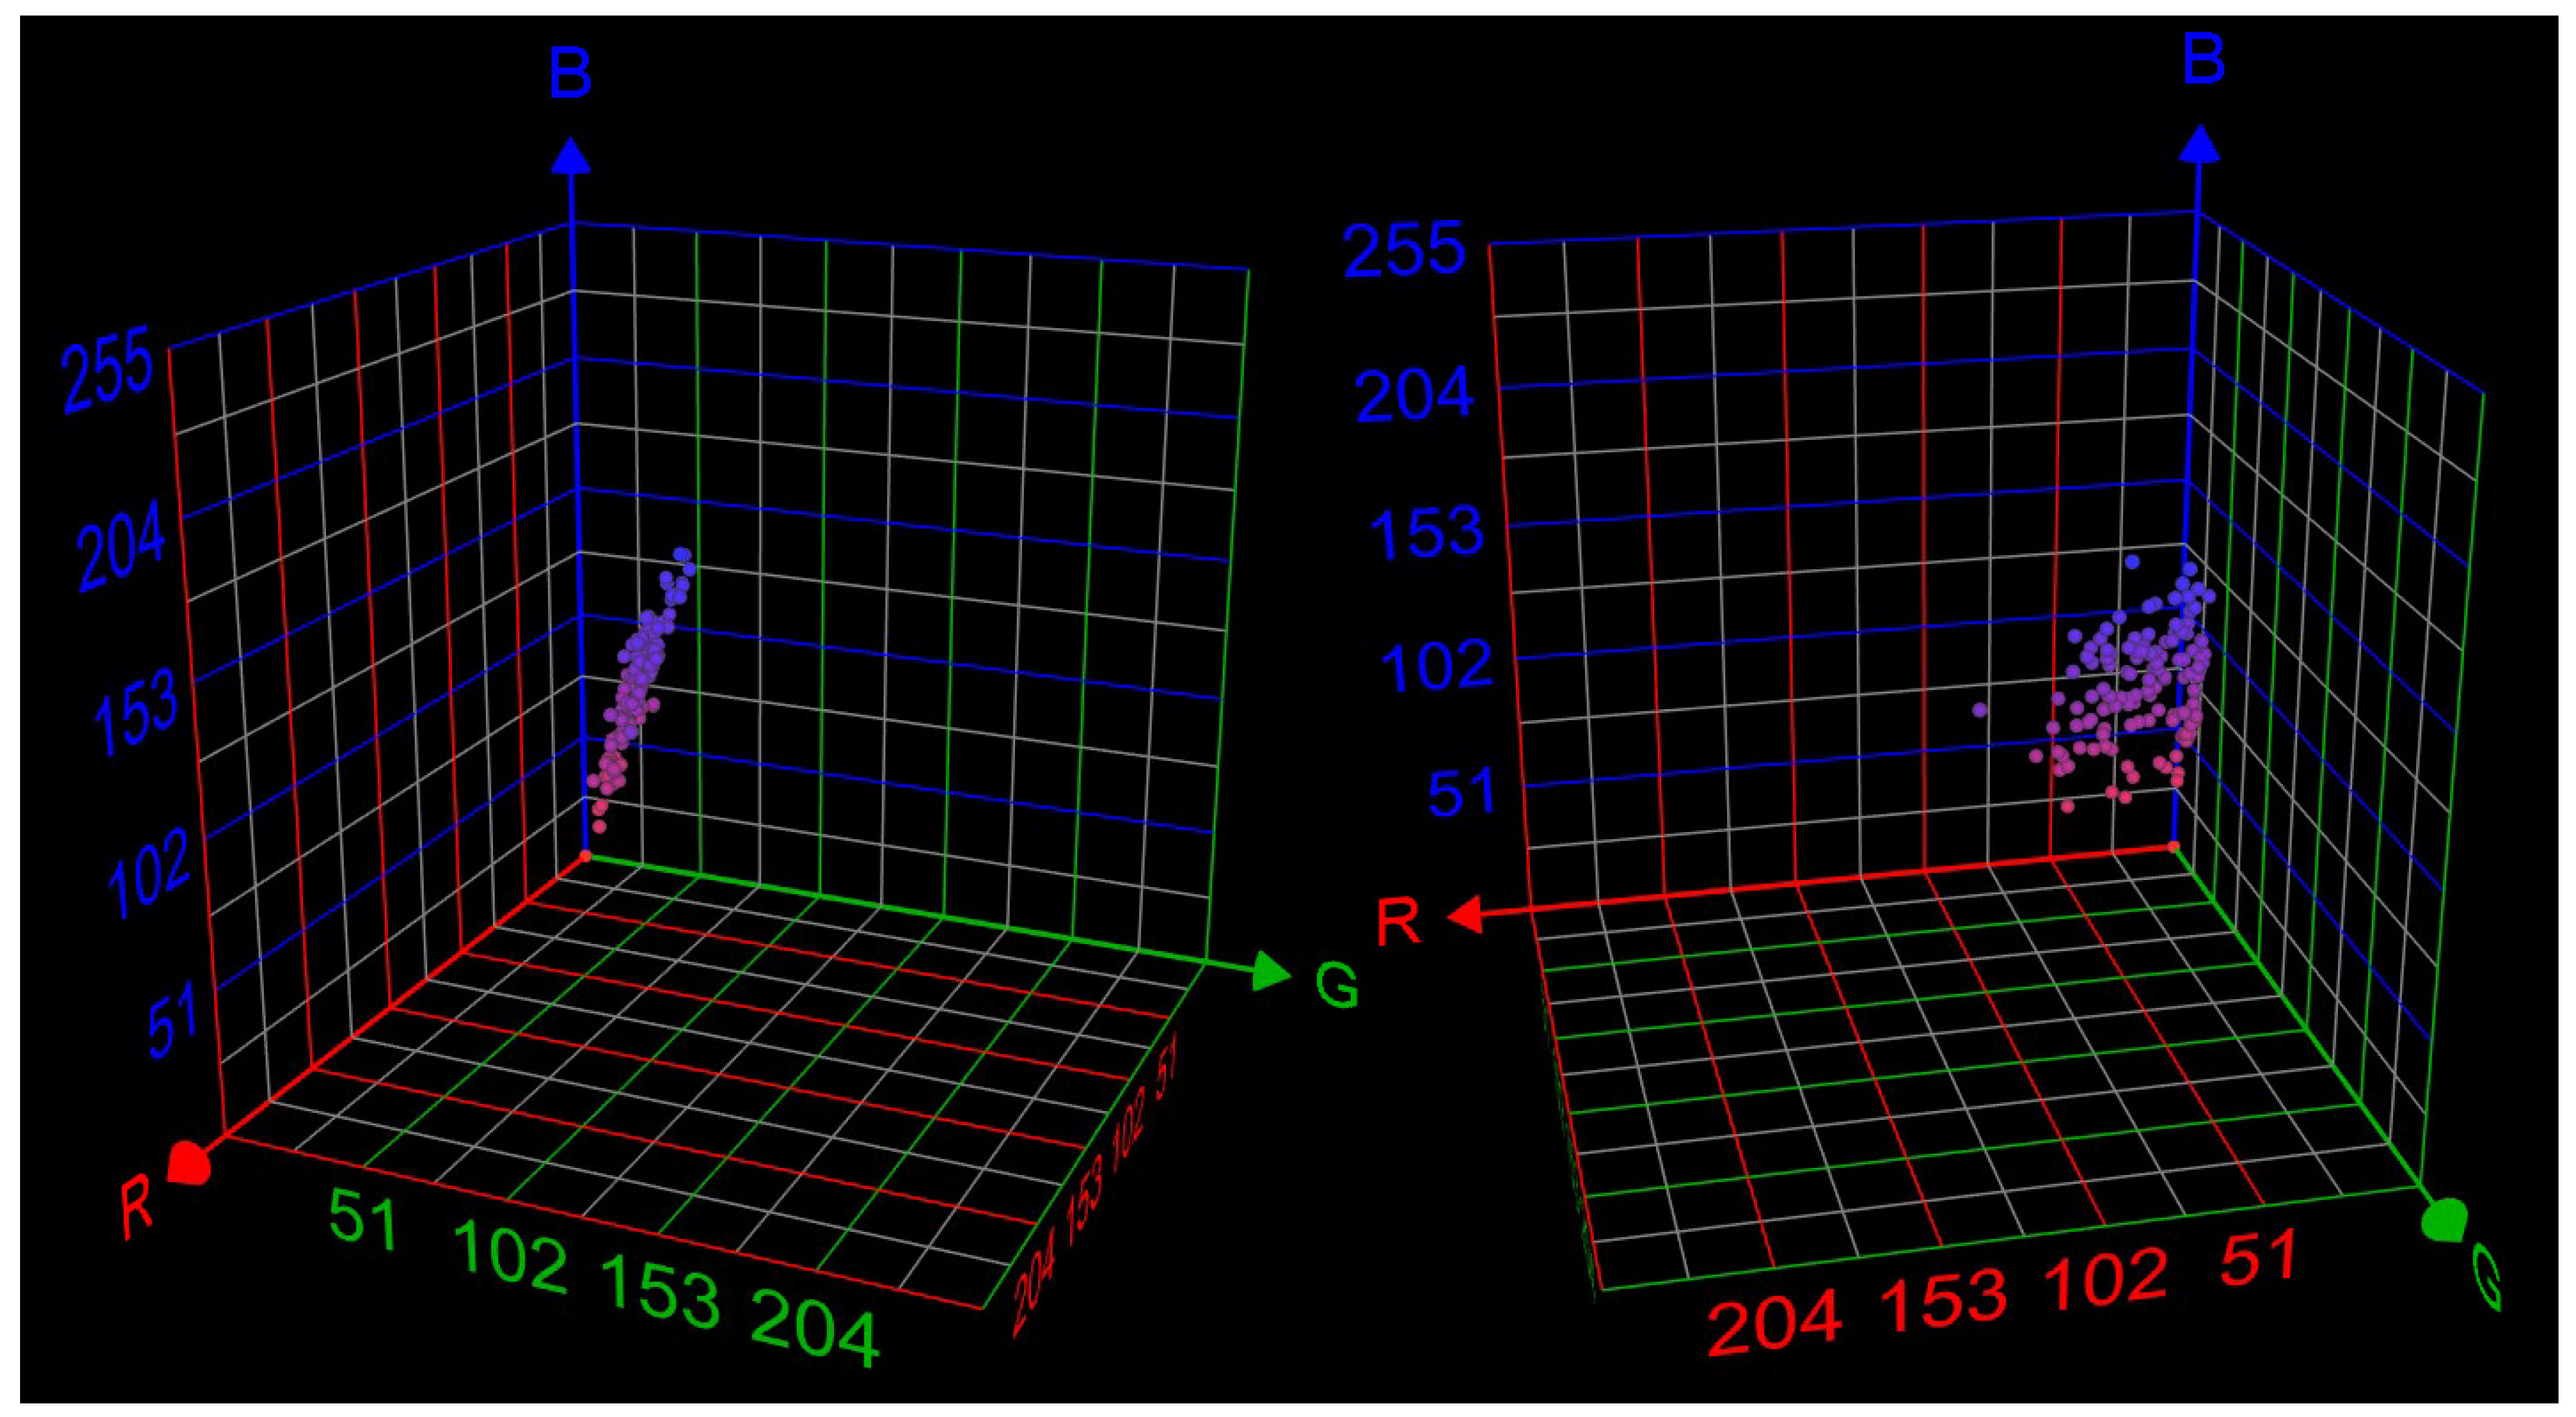
3.3. Cathodoluminescence (CL)

The CL signal of the measured samples could be described qualitatively in terms of color, intensity, and homogeneity as it is commonly performed in CL provenance studies [59,68]. This approach could be useful to discriminate Proconnesian marble from other petrographically similar marbles. However, the standard description would not be very helpful to undertake intra-discrimination of the different Proconnesian varieties within the F.U. The CL response of all the measured samples using standard exposure times (1 s, for instance) would be described as the very dark blue/violet typical of Proconnesian marble [59,69]. The very dark CL color is the main reason that 15-s-exposure times were used in all the measurements. This high exposure time helps to highlight the differences between samples (Figure 6). Thereby, some of them exhibit a neatly blue CL color (~53%), others a neatly violet CL color (~31%), and yet others a mixture of hues, difficult to define (~16%). However, despite the long exposure time, some of the samples had a rather low CL intensity (~32%) and, among these, there are often those that exhibited a CL that was difficult to define either as blue or violet. In addition to this, the distribution of the CL is also difficult to describe using only the terms homogeneous and heterogeneous. The CL of the vast majority of the samples can be qualified as homogeneous (87%) as it corresponds to the common description of Proconnesian marble [70]. However, even in the case of samples with a homogenous CL, there is almost always a distribution of intensities and/or colors, often correlated with the crystal grains. The crystal borders usually show a brighter CL intensity and often with a different hue. Additionally, features such as the transition from one CL response to the other can be very different (from abrupt to very smoothed) and with different thicknesses (strictly delimited to the grain border or covering a kind of corona around the crystals). The exact difference in color and intensity between crystal cores and borders can also vary from sample to sample. Finally, in a few cases, there are intensity variations that are not clearly correlated to the visible petrographic features under OM. Cropped CL images of all the samples are available in the Supplementary Materials section.
The two samples that are not part of the F.U. (fms1960 and fn31) also exhibit faint intensity with violet/purple hues (Figure 6h–i); in this case, the CL color is heterogeneously distributed and with scattered orange/yellowish brighter patches. These orange patches do not appear on any of the other measured samples, except for the isolated fragment labelled 89 (Figure 6e).

4. Statistical Results (CL) on Complementarity between Fragments

4.1. The CL Chromatic Range of Marbles from the F.U.

The averaged CL colors of the analyzed images range from very dark greenish-blue (e.g., RGB 5,16,36) or purple (e.g., RGB 54,34,38) colors to slightly lighter colors with blue hues (e.g., RGB 40,62,144 or RGB 3,39,120). Table S5 in the Supplementary Materials lists all the averaged CL colors. The plot of the average RGB triplets corresponding to all the analyzed images shows that all measured triplets lie approximately within a plane (Figure 7). Therefore, the CL color-channel values of the Proconnesian marble from the F.U. show a certain relationship that can be expressed with the equation of the median plane:
0.85 R + 2.59 G + 11 = B
After applying pixel clustering to the images, almost all the segmented images (82%) contained only two pixel-clusters. Only a minor number of images contained three (12%), four (4%), or five (2%) color clusters. The area ratio between the 2 main pixel-clusters ranged often between 60:40 and 50:50. Table S5 also reports all the RGB values corresponding to the main CL pixel-clusters and their area percentage.

4.1.1. Samples from a Single Fragment

In a similar way to isotope data, we could assume that CL measurements from a single fragment should produce very similar CL colors. Indeed, when computing similarity as described in Section 2.2.2, we observe that percentages corresponding to averaged colors are often above 90% (in 30 out of the 37 comparisons) and only in 2 cases the computed similarity is below 80% (Table 3). In particular, the lowest computed value is 74% for 1 of the samples (7d) from the 7abcd fragment, and the CL of this particular sample is heterogeneous with an abnormal color gradient from violet to orange hues that is not present in the other 7-type samples (see images in the Supplementary Materials).
A comparison between the main color clusters of the segmented images generally produce very high percentages of similarity. However, the computed similarity is occasionally very low. The most noticeable case of this is that of fragment 336ab, for which the computed similarity between the main color cluster of samples 336a and 336b is only 24% (the comparison between averaged colors yielded a similarity of 93%). The low value is due to the fact that the color clusters from different samples do not exhibit the same hierarchy. For instance, the RGB value of the main color cluster of the segmented 336a image shows affinity with the second color cluster of the segmented 336b image (but not with its main color cluster). This issue is related the fact that, in general, the segmentation of CL images does not produce a very predominant color cluster and therefore considerations on the possible affinity between different fragments should be better based on the averaged CL colors and not on the color clusters.

4.1.2. Samples That Presumably Belong to the Same Slab

Results from the previous section indicate that CL images from samples that belong to a single fragment exhibit very high values of averaged CL color similarity. In this section, we explore the application of this characteristic as a criterion to check ongoing hypotheses on the identity of scattered fragments to a given slab.
  • Groups including pieces that match
Table 4 presents the obtained percentages of similarity for these groups. Within this table, the percentages on the central column correspond to comparisons between sampled pieces that match (i.e., samples that physically fit together). This can be used to again confirm that the pieces that match show very similar CL colors. In this regard, a low percentage (as that of fragment 517abcdef) would indicate strong CL heterogeneities within the corresponding slab. The percentages on the left column of the table identify isolated fragments that are also assigned to the slab indicated in the row. These fragments are compared to the RGB centroid computed using the samples that match.
According to the results listed in Table 4, the five samples from the fragment 5Abcd show a rather high affinity (>72%). However, the two samples with the lowest similarities (74% and 72%) compared to the corresponding centroid would imply a certain degree of CL heterogeneity. In any case, the averaged CL colors of the other fragments assigned to the same slab (5a, 5b, and 5h) differ even more from that of the centroid computed with the different samples of the 5Abcd fragment. Considering a minimum similarity of at least 70% as a threshold (based on the results from Section 4.1.1), 5h could still be part of the same slab, but the other two fragments (5a and 5b) would share a slab with the 5Abcd fragment only if accepting an important variation of its CL color across its surface. Incidentally, this agrees with the fact that, according to the suggested reconstruction of the corresponding slab (IX-5), the 5Abcd ensemble and fragments 5a and 5b are in opposite positions, whereas fragment 5h would be closer to the 5Abcd ensemble.
Another group of samples from a given fragment (those forming the 70abc fragment in VI-11 slab) also show quite a high similarity in their averaged CL colors (Table 4). The comparison with the two isolated fragments that some authors also assign to slab VI-11 (18a and 103) produces different results. For one of them (18a), the computed averaged CL color similarity (81%) is consistent with the ensemble of samples that define the chromatic features of 70abc, but, in contrast with the other fragment (103), the obtained percentage (63%) indicates a rather low similarity.
The ensemble of 31-type samples (slab V-12) contains 2 separated group samples that fit together: one the one hand, the group formed by the connected 31ii, 31ll, and 31cc fragments, and, on the other hand, 2 samples from the 31qrs fragment. Both groups of samples show a very high internal similarity and the comparison between the two corresponding RGB centroids (value not shown in Table 4) also yields a high similarity percentage (79%). The comparison with the two scattered fragments also assigned to slab V-12 (31h and 499) produces diverse results (see Table 4). The 31h fragment only shows a clear affinity with the 31qrs fragment and, in contrast, the 499 fragment shows a certain affinity with both groups of connected 31-type fragments, but in particular with that formed by 31ii–ll–cc.
The two sampled pieces of the 40cdefgh fragment (assigned to the slab III-12) exhibit a very high similarity (96%) of their averaged CL colors (Table 4). The 307ab fragment is sometimes also assigned to slab III-12, although others researchers claim that it is part of slab IV-6. The two pieces (307a and 307b) of this fragment also show a significant mutual similarity (75%, value not shown in the table). Regarding the first hypothesis (i.e., 307ab in III-12), the centroids corresponding to the confronted fragments (40cdefgh and 307ab) show a similarity of only 57% (68% and 40%, respectively, if the comparison is made with 307a and 307b separately, as appears in Table 4). These percentages are far below the minimum similarity threshold for matching samples. Alternatively, samples from 307ab can be confronted to other fragments assigned to slab IV-6 (37a and 238a), but again the similarity values result to be rather low (see Table 4). In addition to this, 37a and 238a also exhibit low mutual similarity (55%, value not shown in the table). This could imply that fragments 307ab, 37a, and 238a would not actually share the same slab. In fact, the isotopic ratios measured in sample 238a already suggested that this sample could even not be made of Proconnesian marble.
The two sampled matching fragments from slab VIII-5 (452ab and 452d) show a very high affinity (91% similarity) and it is all the same when comparing the corresponding RGB centroid with the CL colors of the sampled scattered fragments (8a and 8c) that are assigned to the same slab (see values in Table 4). Therefore, in this case, the results would fully support the hypothesis that all these fragments pertain to the same slab.
In contrast, the two sampled pieces from the multi-piece fragment 517abcdef (slab V-9) show a very low affinity (a 35% similarity); indeed, they show very different CL colors, although they share a violet hue. Additionally, the two sampled scattered fragments (29f and 29g) that are also assigned to this slab have bluish CL color and, accordingly, the corresponding similarity of their averaged CL color compared with the RGB centroids computed from 517abcdef samples is also very low (see values in Table 4). The only case of high similarity between samples assigned to slab V-9 is that between 29f and 29g (97%, not shown in the table) despite not being fragments that match.
  • Pairs of fragments that do not match
Four pairs of fragments have been confronted. Three of them (11c-11fgh, 36b-590, and 46acd-68ab) exhibit a high similarity in terms of averaged CL color (Table 5) and main CL color cluster. Therefore, the results support the corresponding hypotheses of every pair of fragments to belong to a same slab, including the case of 36b and 590 that are commonly assigned to different slabs [45,51].
In contrast, the comparison between fragments 28a and 28c produces a rather low similarity percentage (60%). However, it is unlikely that these two samples would not belong to the same slab. In fact, no author questions their slab ascription for many reasons (they constitute almost the whole slab and their incised topography matches through the presently lost 28b fragment). Therefore, in this case, the differences must be attributed to heterogeneities within the slab. Accordingly, the macroscopic characteristic parallel veins of Proconnesian marble are much more visible in 28c compared to 28a, but their orientation is exactly the same.

4.1.3. Isolated Samples

The Euclidian distances between all the RGB triplets can be taken as an indication of the reference frame of variation of Proconnesian marble from the F.U. It would not make sense to try to group isolated samples by just looking at their CL chromatic affinity because the number of slabs of the F.U. is very high and clearly our dataset is a very incomplete picture of the Forma Urbis. Many slabs lack any preserved fragment; not all the preserved ones have actually been sampled; and, for many, only one sample was retrieved. Additionally, several slabs could actually share chromatic features. However, the relatively high number of sampled fragments allow the detection of outliers.
Moreover, from the averaged RGB color triplets, fragment fn37 shows chromatic values (in particular an abnormally high R value) that could indicate that this sample is made of a significantly different variety of marble, and perhaps this could indicate that the sample is not part of the F.U. A very illustrative way to visualize the outliers is to project the CL RGB triplets of all the analyzed samples (both isolated and matching) on a median plane. In this way, it is possible to observe at first glance the dispersion of values. The values can also be used to draw on the plot a 95% confidence ellipse as it is currently performed with bivariate normal distributions. The position corresponding to the fn37 sample neatly appears as an outlier (Figure 8). Other samples that also appear outside the ellipse, although very much closer to it, are fn31 (a sample that does not actually belong to the F.U.), 7d, and one from the 10opqr fragment. Sample fms1960, which is also accepted as not belonging to the F.U., appears within the confidence ellipse, but quite close to its borders. Finally, the projected values of sample 238a, which exhibits anomalous isotopic ratios, appear well within the ellipse.

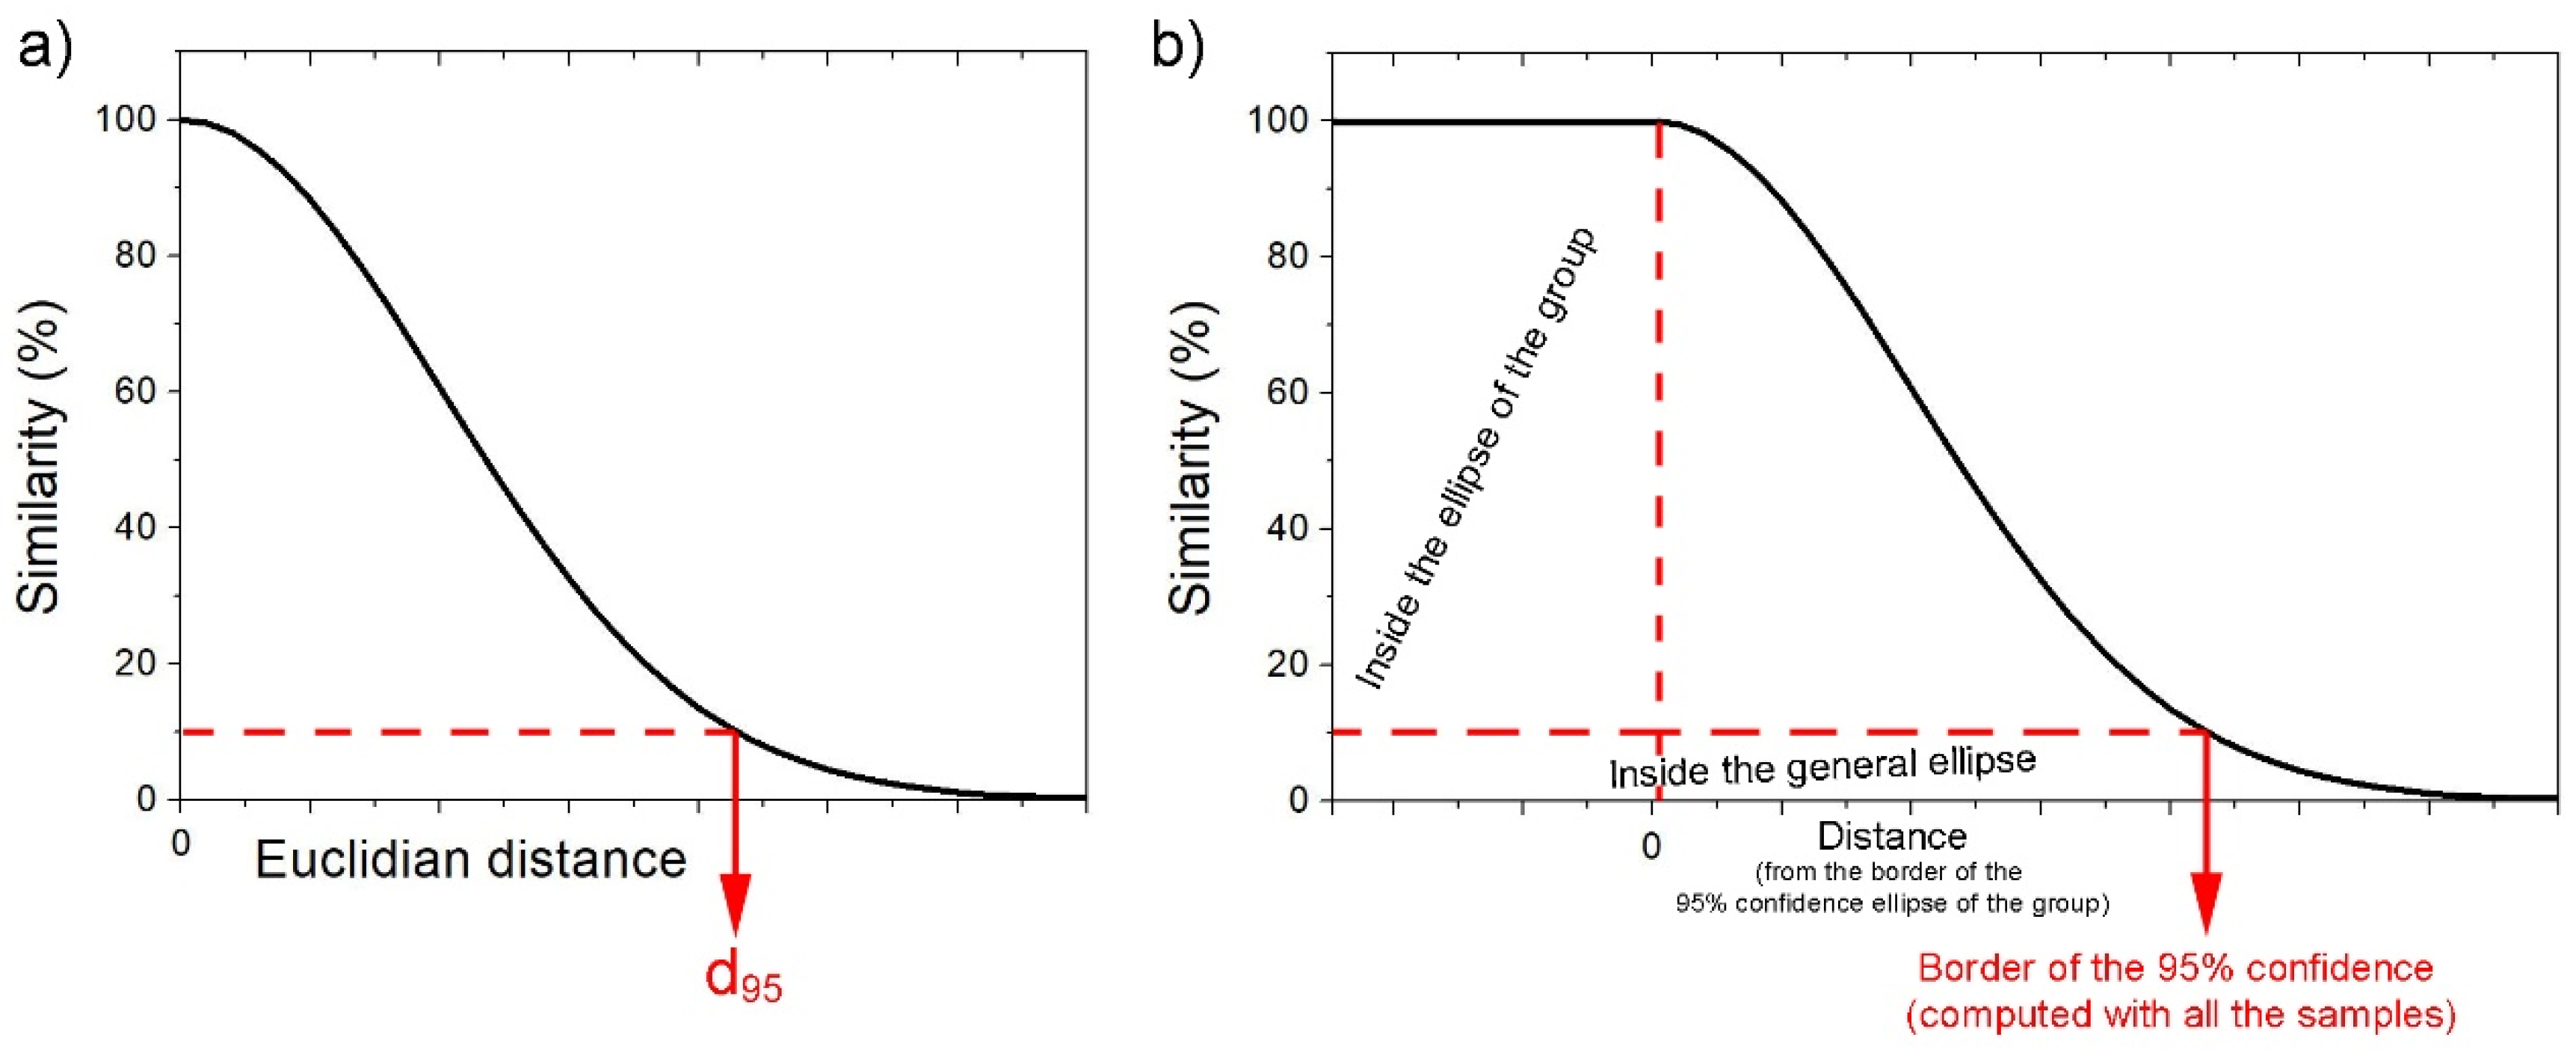
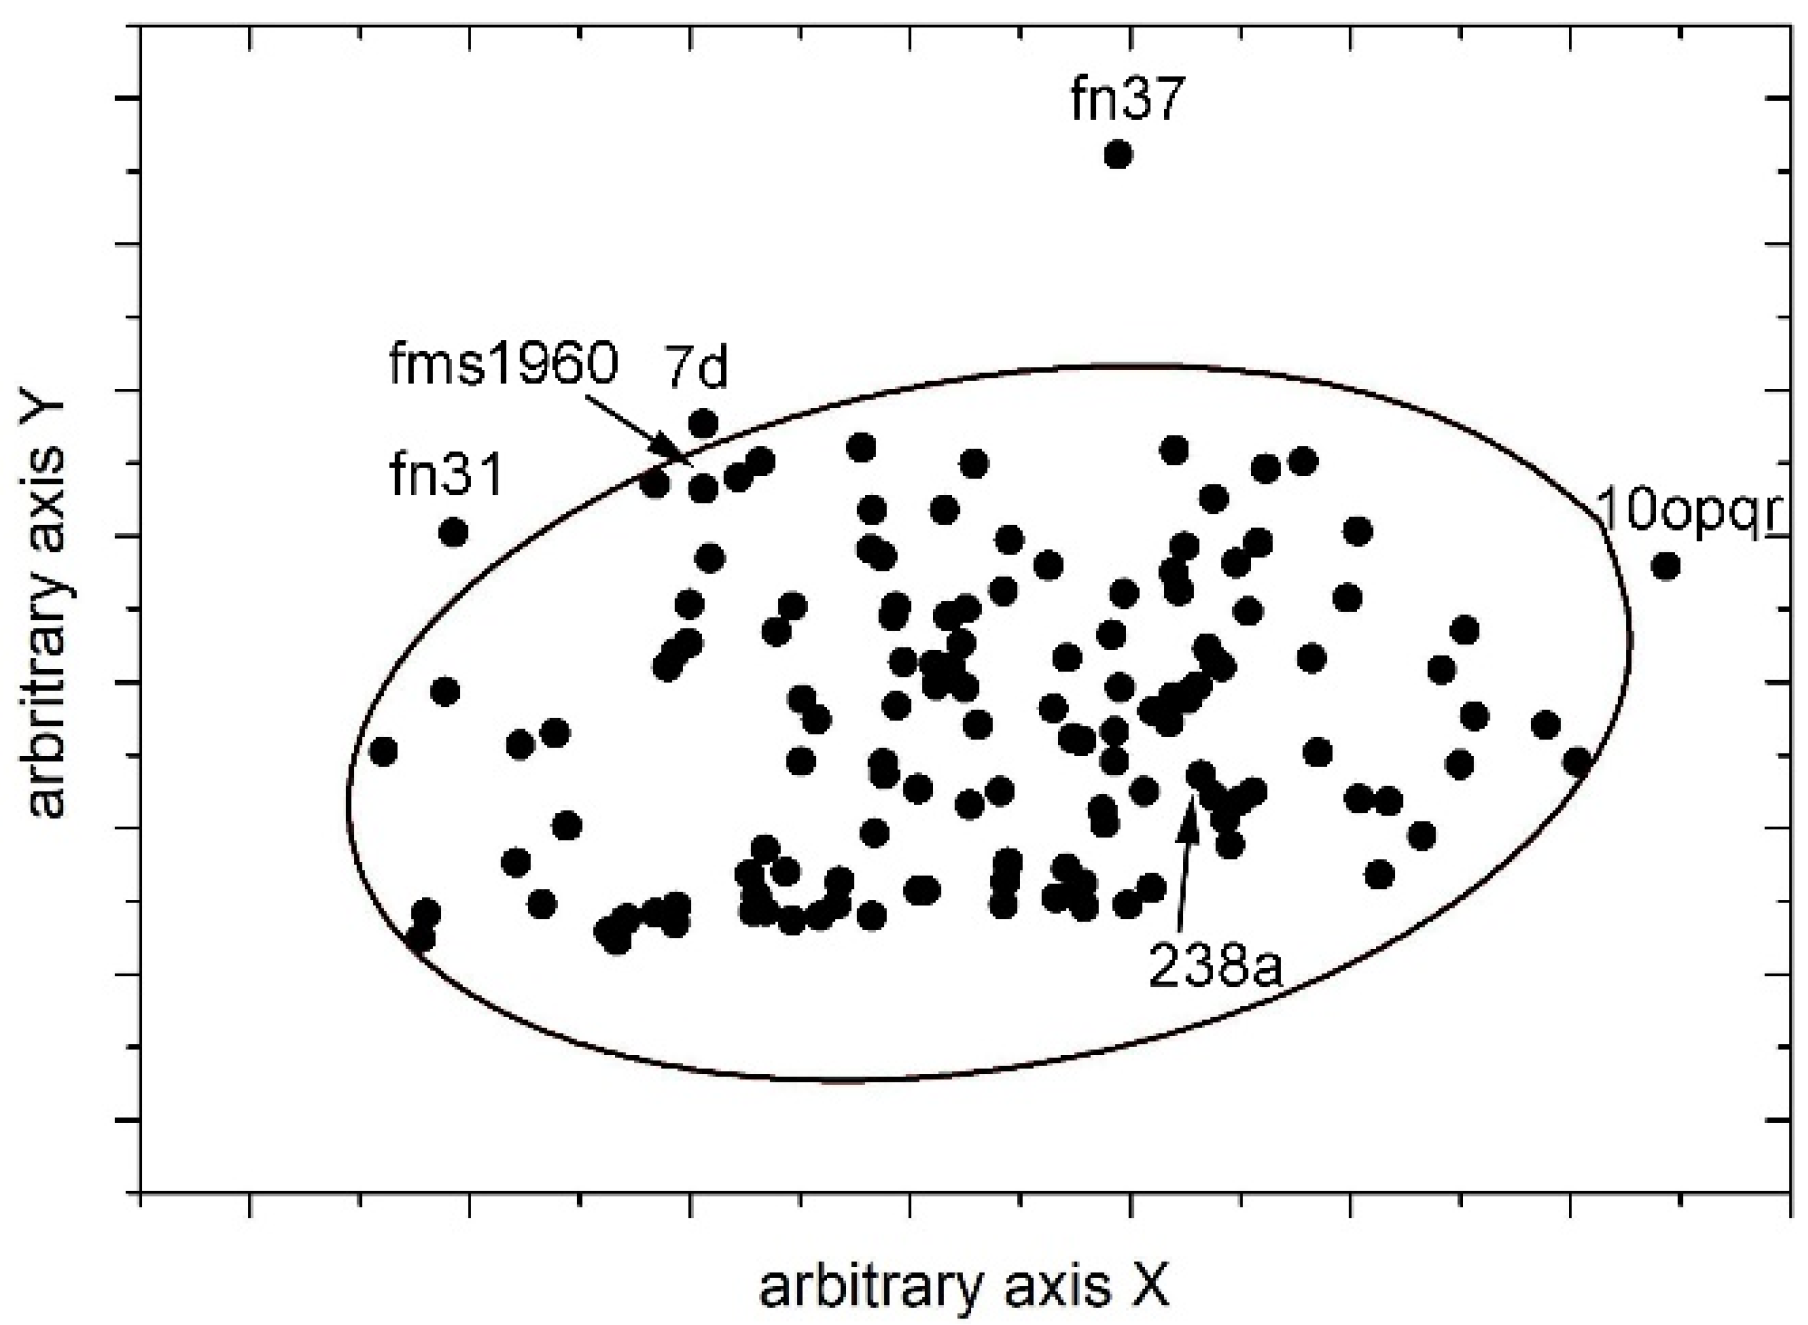
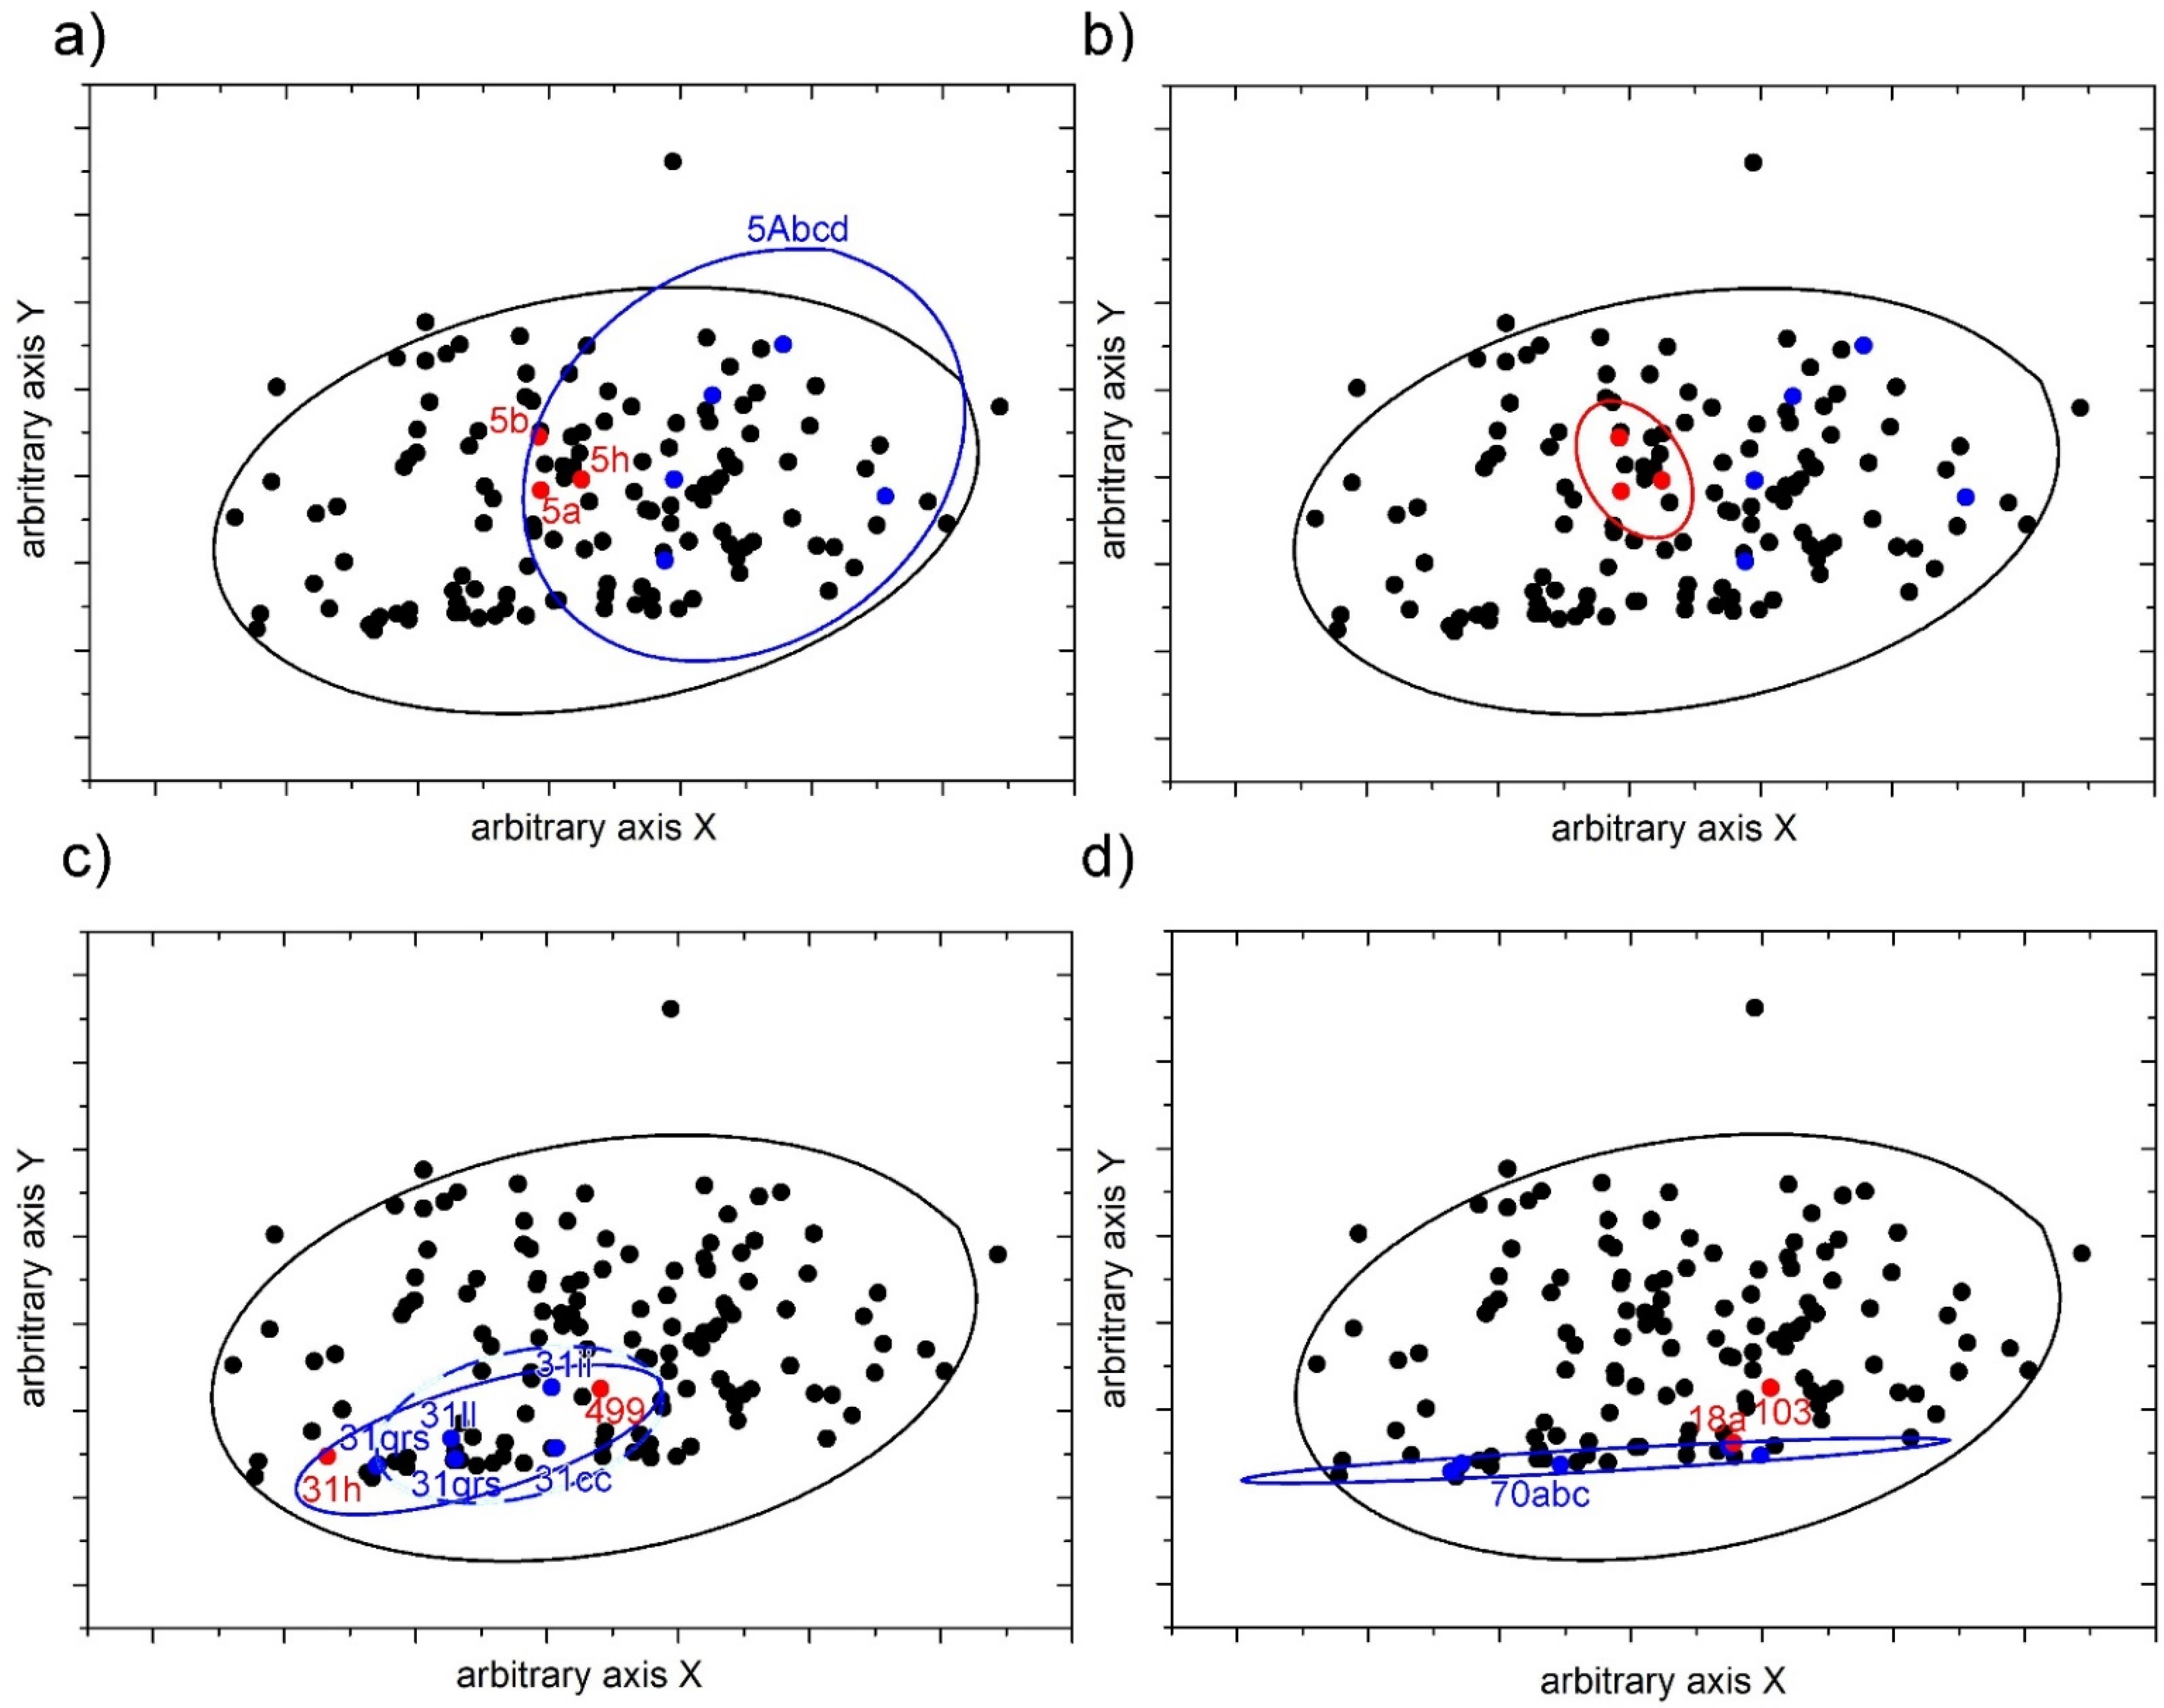
4.2. Confidence Ellipses of Sample Groups

Confidence ellipses provide an additional way to evaluate the identity of scattered fragments to a given slab provided that the slab can be characterized by a confidence ellipse on the median RGB plane. The ellipse is computed using the projected RGB triplets of the sampled pieces that fit together. Unfortunately, the confidence ellipse cannot be applied unless a reference group can be defined with at least three samples. Once defined, for the corresponding scattered fragments, the affinity with the group was computed as described in Section 2.2.2. Figure 9 shows the three tested cases, including the general ellipse computed with all the available data and the confidence ellipses of every group. Table 6 summarizes the obtained results and, as expected using this methodology, the scattered samples appear to have more affinity to their presumed group.
Using this methodology, the high dispersion of values for the 5Abcd fragment (Figure 9a) becomes apparent, which results in a very large ellipse that actually covers more than 50% of the general ellipse (Table 6). The 3 scattered 5-type samples appear to lie within this large confidence ellipse, but, considering the large area of the confidence ellipse, this cannot be taken as a clear reason to associate these three fragments to the 5Abcd fragment. As it is well acknowledged that fragments 5a, 5b, and 5h are related to a given representation (Figure 10), a confidence ellipse could also be drawn using them (Figure 9b). As these three fragments present similar color values, the resulting ellipse covers only a small area of the general ellipse (<5%). The dispersed color values of samples from the 5Abcd fragment lie outside the small ellipse and some of them are quite far from it (Figure 9b).
Regarding the 31-type samples (slab V-12), a confidence ellipse can be drawn using the values of matching 31cc, 31ii, and 31ll fragments (dashed-line ellipse in Figure 9c), producing a relatively small ellipse (covering only 13% of the area of general ellipse). This small ellipse encompasses the two samples from fragment 31qrs, in addition to the scattered fragment 499. The other scattered fragment (31h) is outside this ellipse. However, another ellipse could be computed using samples from both 31cc, ii, and ll, and 31qrs fragments (solid-line ellipse in Figure 9c). The resulting ellipse is still small (again covering only a 13% of the general ellipse) and now encompasses both 499 and 31h. Hence, taking into account the small dispersion of values, in this case one could conclude that there are founded reasons to suppose that all these samples belong to the same slab.
The five samples from fragment 70abc (slab VI-11) define a very narrow ellipse (Figure 9d) covering only 5% of the area of general ellipse. From the two scattered fragments (18a and 103) assigned to this slab, one (18a) lies within the narrow ellipse, whilst the other (103) is outside it, although close enough to produce a similarity percentage of 77%.

4.3. Histogram Analyses

For every CL image, three histograms can be used to characterize the image (one per each color channel). The histograms of different images often show similar shapes, but the exact position of maxima tends to vary from image to image. Shifts in the maxima positions are also detected when comparing images taken from a single sample. In particular, distributions corresponding to the red channel tend to be narrow. This, combined with the fact that the exact position of the peak is variable, can produce very large K–S distances (in some cases almost attaining the highest K–S distance possible, i.e., 1). No clear correlation has been found between the computed K–S distances and the nature of the two compared images (known either to be part of a single fragment or part of different fragments and slabs). Furthermore, K–S tests uniformly produced values of 0, thus verifying that all the distributions have to be considered as different. Therefore, the K–S analysis extensively focuses on the specificities of every image and it is unsuitable to group images because according to the results all of them would share few features.

5. Discussion

Stable isotope and CL data have been analyzed following a similar approach. For both types of data, similarity has been computed as a measure of the relative distance between the confronted data (isotopic ratios and averaged RGB colors, respectively) within the point cloud formed by the whole database. Samples that clearly belong to the same slab (their matching being clear because the sampled pieces physically fit together and often also due to their incised topography) offered a way to validate the methodology.
Indeed, the assumption that samples from a single fragment share similar CL and isotopic ratios is almost always verified. Using isotopic ratios, only one out of the 15 comparisons between matching samples produced values of similarity below 76% and values are usually above 90% (Table 2). The only sample with low affinity with other related samples is 31ll (it produced a similarity of only 57%). Using averaged CL colors, from 55 comparisons between samples that undoubtedly belong to a same slab (Table 3 and Table 4), only one produced a very low similarity value (the two samples from the 517abcdef fragment yielded a value of only 35%). The rest of the comparisons produced values above 69% and often above 90%. The few cases in which the similarity values are low stress the fact that both CL and stable isotopes can be subjected to natural heterogeneities. The presence of these heterogeneities could produce misleading results, and they seem to appear less often for CL data. Additionally, the presence of CL heterogeneities sometimes correlates with macroscopic features, which was the case of the comparison between 28a and 28c samples.
In addition to the comparison between averaged CL colors, the comparison was also performed between the main CL color clusters. However, for most of the CL images, there is not a clearly predominant color cluster and the cluster hierarchy can easily change among different samples from a same fragment, resulting in a low similarity between the main color clusters.
It is worth noting that high similarity values between CL (or isotopic values) from two fragments do not necessary imply that they are connected because different slabs could actually share chromatic (or isotopic) features. Therefore, high similarity should be only used to support a previously hypothesized connection between fragments, as the ten cases presented in Table 1. In order to test these ten reconstruction hypotheses or debated questions made by archaeologists, the discussion was mainly based on the averaged CL colors, occasionally supported by isotopic ratios. For hypotheses including a large number of samples that define a reference group, a comparison was made using both the computed centroid and the corresponding confidence ellipse. The confidence ellipse allows a more flexible definition of reference groups. However, in the case of highly dispersed reference values, there is the risk to include almost all the possible values within the definition of the group and, therefore, it is not possible to discriminate between different samples. The ten hypotheses are summarized in Table 7 along with the main deductions obtained from the undertaken comparisons; the detailed discussion of every hypothesis follows below in the same order as they appear in the table.
According to the results from the four hypotheses that considered a possible connection between two fragments, three pairs (11c-11fgh, 36b-590, and 46acd-68ab) exhibit a high CL similarity that is compatible with the hypothesized connection. It follows from this that both 11c and 11fgh could be located in the same slab (VII-7), as suggested by [45]. Fragments 36b and 590 could also share a common slab, as suggested by [52], and this raises the question of the dedication of the labeled temple in 36b and the location of the fragments in relation to the F.U. grid. Concerning fragments 46acd and 68ab, the results would support the archaeological hypothesis suggested by Cozza [55], although the slab remains unlabeled and, therefore, its location within the F.U. is unknown. In contrast with the three aforementioned pairs, the pair 28a-28c shows a low similarity. However, the observed difference correlates with macroscopic heterogeneities and, therefore, there are not strong reasons to suggest that these two fragments do not belong to the same slab. Isotopic analyses also confirm the similarity between the tested pairs of samples, including the 28a-28c pair (although the isotopic ratios of sample 590 were not actually measured).
Two other hypotheses, among those listed in Table 1, are concerned with two samples that fit together forming a group, and these are confronted to other scattered fragments. Thus, fragments 8a and 8c show a high similarity with the 452 group, and they are all compatible with a common slab (VIII-5) in agreement with the hypothesis by Cecamore [56]. This could pave the way for a possible reconstruction of the inscription on these fragments as the shrine Cvriae Vetaeres and then the placement of this building near the NE corner of the Palatine hill, and in the same slab that contains the Septizodium and the eastern half of the Circus Maximus. In contrast, fragments 29f and 29g show little affinity with the samples from group 517, although 29f and 29g show good affinity with each other. According to this, both 29f and 29g would belong to slab V-9 as suggested by Carettoni [1]. These fragments were known in the 16th century to be already detached from the main fragments 29bcd and 29e, and they were recognized as part of one large fragment that included, along with the Basilica Ulpia, the southwestern part of the Trajan’s markets and the beginning of the Forum of Trajan. On the contrary, the placement of fragment 517 into slab V-9, as suggested by Tucci [50], is unsupported by the CL data, although their measured isotopic ratios are similar with those measured for 29f and 29g.
Two other simple hypotheses are concerned with a large number of samples that match (four for the group 70abc, and five for the group 5Abcd) and, again, these are confronted to scattered fragments. One the one hand, from the two fragments confronted to group 70abc, 18a exhibits moderate affinity with the group and 103 shows a rather low affinity. Computing a confidence ellipse for the 70abc group (Figure 9d), the 18a fragment lies in it and, in contrast, fragment 103 lies outside, reinforcing the doubts about the ascription of this fragment to the same slab as the 70abc group. Therefore, the resulting archaeological implications are that fragment 18a could really belong to slab VII-11 along with the 70-type fragments suggested by Almeida [47]. On the contrary, the placement of fragment 103 near group 70abc, in the same slab as suggested by Cecamore [46], appears more doubtful. In fact, the same author already pointed out that, in the absence of a direct contact among fragments, any objections that could be made to the location of one do not necessarily apply to the other. On the other hand, from the three fragments confronted to group 5Abcd, 5h shows a moderate affinity with the group, and 5a and 5b a rather low affinity. The computation of a confidence ellipse for the group results in a very large ellipse (Figure 9a), highlighting the high internal dispersion of averaged CL colors within this group. Such high internal variability can sometimes appear as it does considering the unquestioned samples (10-type) from the slab VIII-3, as those belonging to the 10abcde and 10opqr fragments would define a large-area ellipse and the scattered sample 10g will also lie within it. However, in the case of the scattered 5-type samples, such dispersion is not observed when comparing 5a, 5b, and 5h between them (Figure 9b). In addition to this, the isotopic ratios measured for 5a fragment differ considerably from those obtained for the 5Abcd group. Therefore, the placement of the 5Abcd group into slab IX-5 along with the Temple of the Divine Claudius (which is defined by the ensemble of unconnected 5-type fragments) appears rather problematic, as already suggested by [42,43].
Finally, there are two additional complex hypotheses implying two independent groups of samples that match. The groups can be confronted with each other as well as with other scattered fragments:
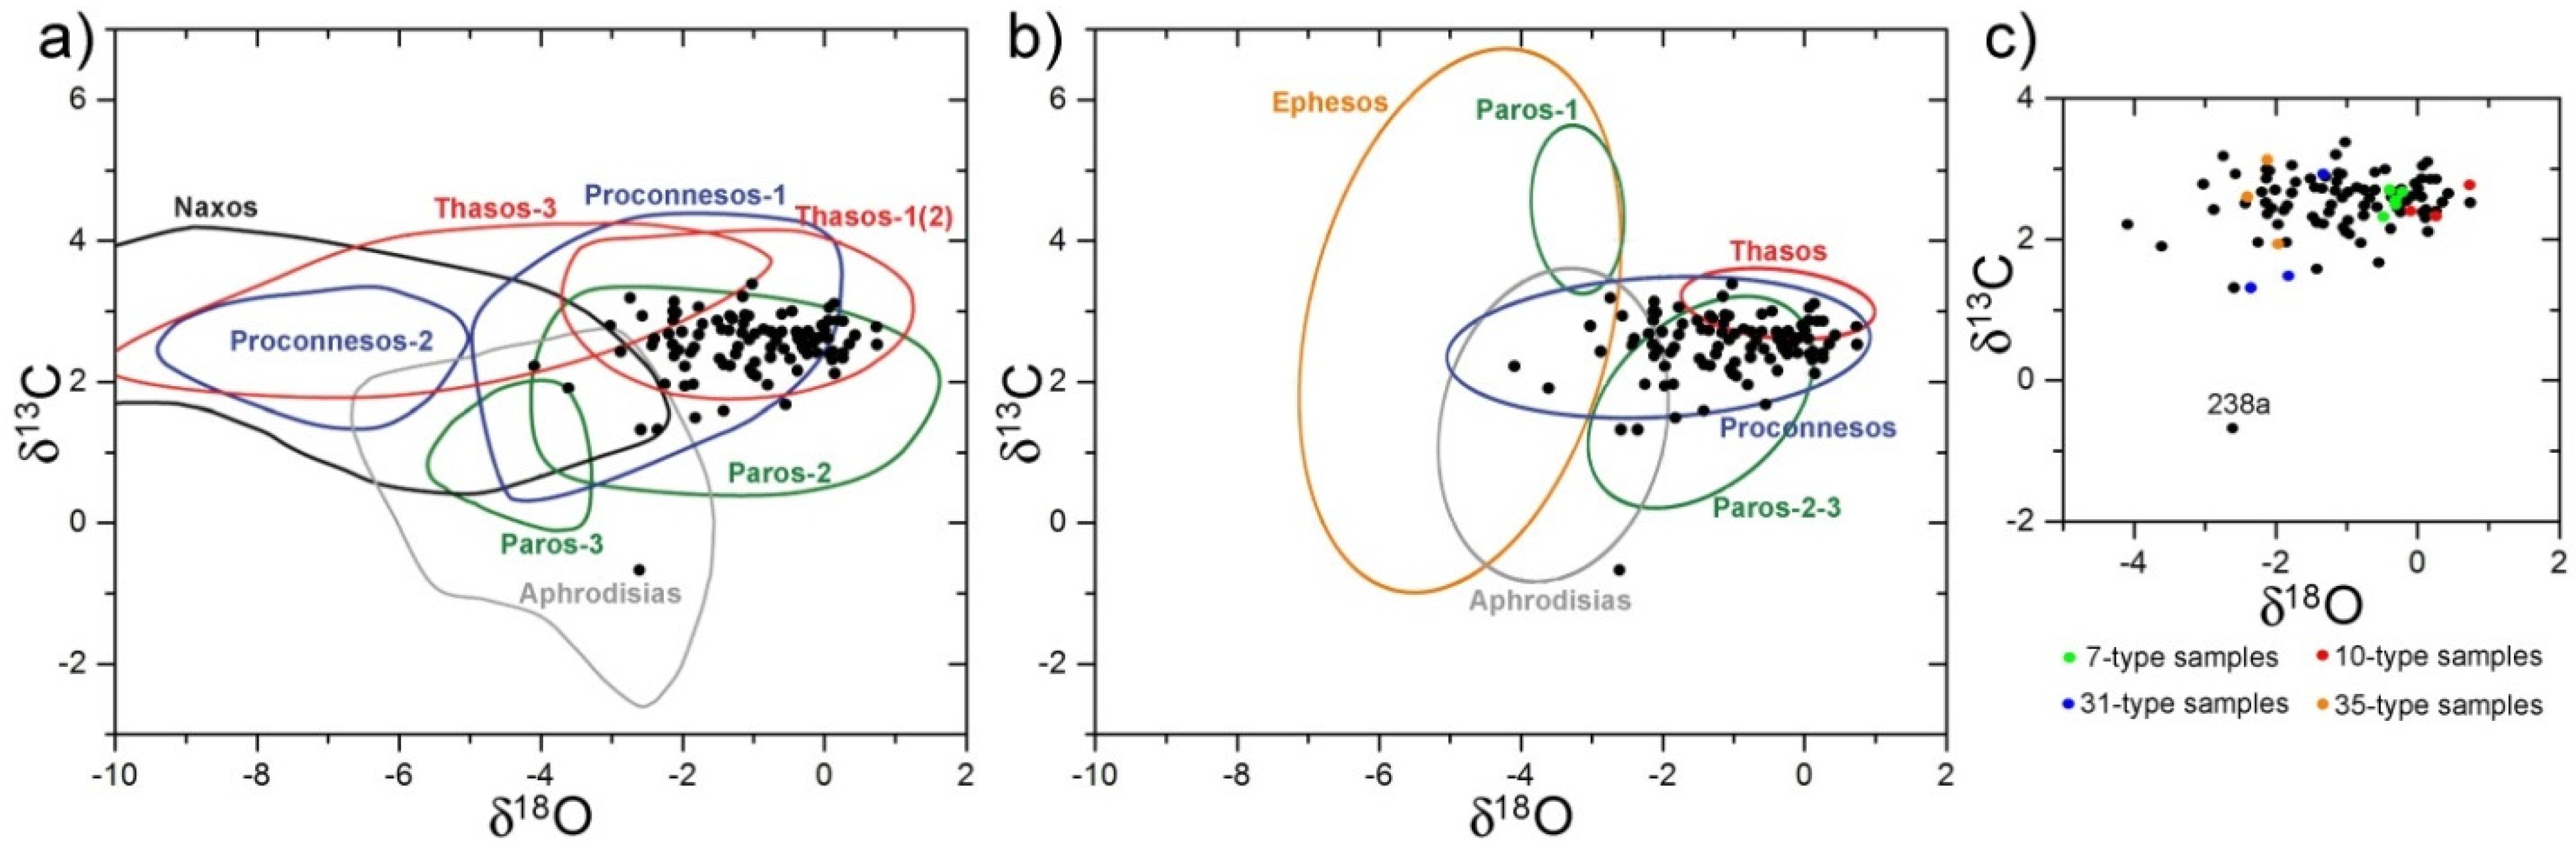
  • According to both CL and isotopic results, the 40cdefgh and 307ab groups (with two sampled samples each) have a low similarity, and thus it is unlikely that they belong to a common slab (III-12), as suggested by Almeida [54]). The group 307ab also shows a low CL chromatic similarity with the scattered fragments 37a and 238a with which a possible connection was also suggested by the Stanford computer-aided reconstruction algorithms. Therefore, the position of fragment 307ab along the bottom edge of slab IV-6 is not sustained by our analytical data. Isotopic ratios support this lack of connection between groups and isolated samples (only samples from fragments 307ab and 37a show significantly similar isotopic ratios). In particular, the isotopic ratios of sample 238a are outside the isotopic range that is assigned to Proconnesian marble. For this reason, the ascription of fragment 238a to the F.U. is, in fact, doubtful. Additionally, the similarity between the averaged colors of CL of samples 238a and 37a is only 55%, reinforcing the doubts on the relation between these fragments.
  • The averaged CL colors from groups 31cc–ii–ll and 31qrs (with three and two sampled samples, respectively) show a relatively high dispersion of values that result in rather different values for the corresponding centroids for both groups. The two isolated fragments (31h and 499) presumably connected to these groups also exhibit dissimilar averaged CL colors. Incidentally, the isotopic ratios measured for 31-type samples (Figure 5c) also show scattered values; in particular, sample 31ll exhibits rather different isotopic ratios. However, despite the hints of significant internal variability of values, the analysis of the averaged CL values projected on the median plane contradicts this view. A 95% confidence ellipse grouping the projected averaged CL colors of both groups (31cc–ii–ll and 31qrs) covers only 13% of the area of a similar ellipse computed with all the projected values from measured F.U. samples. The projected values of isolated 31h and 499 fragments lie within the ellipse defined by the 31-type fragments. This could support the hypothesis [21,58] that suggested that both 499 and 31h are part of slab V-12 along with the other fragments labeled as 31.

6. Conclusions

6.1. Provenance

The results from petrography, C and O isotopy, and cathodoluminescence (cathodomicrofacies) analyses of the F.U. samples indicate that almost all of them are typical of Proconnesian marbles, confirming an origin from Marmara (Turkey) [63,65,70,71,72]. In this regard, all the samples, except fragment 238a, fall into the isotopic domain of Proconnesian marbles. As for sample 238a, it is an isotopically anomalous Proconnesian marble or a different type of marble with similar petrographic features and a low intensity CL.

6.2. Methods and Statistical Treatment

The conventional analytical routine (standard analyses based on petrography, cathodoluminescence, and isotopic ratios) appears to be relatively limited to undertake the intra-discrimination of F.U. samples to add to the discussion of the possible matching of different marble fragments. Statistical methods applied on isotopic analyses or on quantification of cathodoluminescence images have demonstrated to have the potential to quantitatively assess the affinity between different marble samples that would belong to the same marble slab. However, it is worth mentioning that both isotopic ratios and CL colors are subjected to natural heterogeneities even at a lower scale than the slab size.
Regarding CL images, the most suitable statistical data treatment is the one that reaches a balance between specific and common features. Histogram analyses based on K–S distances extensively focus on specificities and every image appears to be different from the others. Contrarily, confidence ellipses computed with highly dispersed CL color values could end up embracing large areas of the point cloud formed by the whole database of colors from the F.U. images and, therefore, most of the images would be classified as equivalent. Similarity computed considering the observed distribution of distances within the whole database of F.U. images as well as the distance from confidence ellipses (when computed from not highly dispersed CL color values) appears to be the most appropriate statistical treatment to tackle the matching hypothesis of F.U. fragments.
There is not a strong correlation between similarities computed from isotopic and averaged CL color values. The very small amount of samples required for isotopic analyses would be an advantage that would privilege this technique. Nevertheless, isotopic analyses are more expensive and time consuming than CL measurements and, despite the unavoidable natural heterogeneities, the rate of consistent results among samples that match seems higher for CL data.
The innovative use of CL to reconstruct a fragmented marble cartographic masterpiece represents a step beyond its common application for provenance studies. The approach presented in this paper could be applied to other projects aimed at the reconstruction of fragmented artworks.

6.3. Reconstruction Hypotheses and Future Work

The ten hypotheses or debated questions presented in Table 1 have been archaeometrically checked, and the outcome of the discussion of the results has been summarized in Table 7. The archaeometric data support the majority of matching hypotheses. However, the ascription of fragment 103 to slab VII-11 and of fragment 5Abcd to slab IX-5 appears uncertain. Moreover, data strongly suggest that (i) fragment 517abcdef should not be ascribed to slab V-9, (ii) the connection between fragments 37a and 307ab appears also unlikely, and (iii) fragment 307ab is not related to fragment 40cdefgh (slab III-12). Finally, isotopic ratios strongly suggest that fragment 238a could be not carved in Proconnesian marble. From that, two distinct hypotheses arise: either fragment 238a does not really belong to the F.U. or not all the fragments of the plan were actually carved in Proconnesian marble.
The reconstruction of the marble puzzle of the Forma Urbis Romae remains a fascinating challenge. Considering the fragmentary state of conservation of the F.U. and the small fraction of surviving fragments, the present research work could be simply considered a reasonable starting point for further archaeometric investigations that could extend the number of data, both isotopic and CL. The museum system run by Roma Capitale (Musei Capitolini), as the hosting institution of the F.U. fragments, has gladly seized the opportunity of using new technologies to solve old archaeologically debated questions. Research is a fundamental, core activity of museums and they will keep committed to explore the possibilities of archaeometry to contribute to a better understanding of the archaeological discussions raised in the last decades around the F.U.
Besides offering a glimpse at the grandest city of the world in all its glory, the plan remains a unique and invaluable artefact for the study of the city, contributing to the reconstruction of the urban topography mostly for the buildings destroyed or unavailable due to the continuous occupation of the site.

Supplementary Materials

The following are available online at https://www.mdpi.com/article/10.3390/min11121400/s1: Table S1: Samples of group 1; Table S2: Samples of group 2; Table S3: Samples of group 3 (isolated samples); Table S4: δ18O and δ13C isotopic ratios; Table S5: CL RGB triplets for the different analyzed samples, including the averaged color and the three main color clusters for segmented images. Collection of cropped CL images (jpg format) for all the analyzed samples embedded in a single zip file. References [73,74,75,76,77,78,79,80,81,82,83,84,85,86,87,88,89,90,91,92,93,94,95,96,97,98,99,100,101,102,103,104,105,106,107,108,109,110,111,112,113,114,115,116,117,118,119,120,121,122,123,124,125,126,127,128,129,130,131,132,133,134,135,136,137,138] are cited in the Supplementary Materials.

Author Contributions

Conceptualization, L.C., R.D.F., M.B. and F.D.C.; sample and archaeological-issue selection, F.D.C. and R.D.F.; sampling, M.B., F.G. and M.G.; petrography, R.D.F.; isotopic measurements, M.B. and F.G.; cathodoluminescence measurements, L.C., R.D.F. and J.D.M.-M.; statistical analysis, L.C. and R.D.F.; writing—original draft preparation, L.C., C.P.P. and R.D.F.; writing—review and editing, all authors. All authors have read and agreed to the published version of the manuscript.

Funding

This research was partially supported by European funds awarded to the Regione Lazio, DTC-Intervento 2-Ricerca e Sviluppo di Tecnologie per la Valorizzazione del Patrimonio Culturale (PT 20190257 “Musei Capitolini Parco del Celio -Le porte del Celio, le chiavi della Città).

Data Availability Statement

Most of the data presented in this study have been made publicly available within the Supplementary Materials section. Any other data are available on request from the corresponding author.

Acknowledgments

Marc Anglisano is acknowledged for providing support on data-analysis tools. Finally, we would like to thank the editor as well as two anonymous reviewers for their valuable remarks and comments.

Conflicts of Interest

The authors declare no conflict of interest.

References

  1. Carettoni, G.; Colini, A.M.; Cozza, L.; Gatti, G. La Pianta Marmorea di Roma Antica; Forma Urbis Romae, I-II: Rome, Italy, 1960. [Google Scholar]
  2. Tucci, P.L. Nuove osservazioni sull’architettura del Templum Pacis. In Divus Vespasianus.Il bimillenario dei Flavi; Coarelli, F., Ed.; Electa: Rome, Italy, 2009; pp. 158–167. [Google Scholar]
  3. Marucchi, O. Descrizione del Foro Romano; Tipografia, A., Ed.; Befani: Rome, Italy, 1883. [Google Scholar]
  4. Coarelli, F. Il Foro Romano I. Periodo Arcaico; Edizioni Quasar: Rome, Italy, 1983. [Google Scholar]
  5. Coarelli, F. L’Urbs e il suburbio. In Società Romana e Impero Tardoantico. Roma, Politica, Economia, Paesaggio Urbano; Giardina, A., Ed.; Laterza: Rome, Italy, 1986; pp. 1–58. [Google Scholar]
  6. Coarelli, F. L’orientamento e il Significato Ideologico Della Pianta Marmorea Severiana di Roma. In Théorie et pratique de l’architecture romaine. La norme et l’expérimentation. Études offertes à Pierre Gros; Lafon, X., Sauron, G., Eds.; Publication de l’Université de Provence: Aix en Provence, France, 2005; pp. 61–68. [Google Scholar]
  7. Meneghini, R.; Santangeli Valenzani, R. Nuovi frammenti dagli scavi del Templum Pacis (1998–2002). In Formae Urbis Romae. Nuovi Frammenti di Piante Marmoree dallo Scavo dei Fori Imperiali; Meneghini, R., Santangeli Valenzani, R., Eds.; l’Erma di Bretschneider: Rome, Italy, 2006; pp. 13–39. [Google Scholar]
  8. Castagnoli, F. La pianta marmorea di Roma antica. Gnomon 1961, XXXIII, 604–610. [Google Scholar]
  9. Reynolds, D.W. Forma Urbis Romae: The Severan Marble Plan and the Urban Form of Ancient Rome. Ph.D. Thesis, University of Michigan, Ann Arbor, MI, USA, 1996. [Google Scholar]
  10. Rodríguez Almeida, E. Formae Urbis Antiquae. Le Mappe Marmoree di Roma tra Repubblica e Settimio Severo; Collection de l’École Française de Rome: Rome, Italy, 2002. [Google Scholar]
  11. Palombi, D. La Forma Urbis marmorea “in contesto”. Bull. della Comm. Archeol. comunale di Roma 2016, 117, 207–212. [Google Scholar]
  12. Meneghini, R. La Forma Urbis e le altre cartografie marmoree di Roma antica alla luce delle ultime ricerche e scoperte. Bull. della Comm. Archeol. Comunale di Roma 2016, 117, 179–192. [Google Scholar]
  13. D’Ambrosio, E.; Meneghini, R.; Rea, R. Nuovi frammenti di piante marmoree dagli scavi dell’aula di culto del Templum Pacis. Bull. della Comm. Archeol. Comunale di Roma 2011, 112, 67–76. [Google Scholar]
  14. Ghilardi, M. Trasformazioni del paesaggio urbano. Il Templum Pacis durante la guerra greco-gotica (a proposito di Procop., GOTH. IV 21). In Les Cités de l’Italie Tardo-Antique (IV-VI Siècle): Institutions, Economie, Société, Culture et Religion, Atti del Convegno Internazionale di Studi, Rome, Italy, 11–13 March 2004; Ghilardi, M., Goddard, C., Porena, P., Eds.; Publications de l’École française de Rome: Rome, Italy, 2006; pp. 137–148. [Google Scholar]
  15. Capponi, M.; Ghiraldi, M. Scoperta, nel Templum Pacis, di un’area sepolcrale probabilmente contemporanea alla fondazione dei SS. Cosma e Damiano. In Ecclesiae Urbis, Proceedings of the Atti del Congresso Internazionale di Studi Sulle Chiese di Roma (IV-X Secolo), Rome, Italy, 4–10 September 2000; Guidobaldi, F., Guiglia, A., Eds.; Pontificio Istituto di Archeologia Cristiana: Vatican City, Vatican, 2002; pp. 733–755. [Google Scholar]
  16. Lanciani, R. Storia Degli Scavi di Roma e Notizie Intorno le Collezioni Romane di Antichità, I (1000–1530); Quasar: Rome, Italy, 1989. [Google Scholar]
  17. Anderson, J. Post-mortem adventures of the marble plan of Rome. Class. Outlook 1982, 59, 69–73. [Google Scholar]
  18. Rodríguez Almeida, E. Forma Urbis Marmorea. Aggiornamento Generale 1980; Edizioni Quasar: Rome, Italy, 1981. [Google Scholar]
  19. Cozza, L. Sul frammento 212 della pianta marmorea. J. Rom. Archaeol. 1989, 2, 117–119. [Google Scholar] [CrossRef]
  20. Coarelli, F. Le Plan de Via Anicia: Un nouveau fragment de la Forma Marmorea de Rome. In Rome, l’espace Urbain et Ses Réprèsentations; University of Paris-Sorbonne Press: Paris, France, 1991; pp. 65–81. [Google Scholar]
  21. Rodríguez Almeida, E. Nuovi dati dalla Forma Urbis Marmorea per le mura perimetrali, gli accessi e i templi del Colle Capitolino. Boll. di Archeol. 1991, 8, 33–44. [Google Scholar]
  22. Tucci, P.L. Eight Fragments of the Marble Plan of Rome Shedding New Light on the Transtiberim. Br. Sch. Rome 2004, 72, 185–202. [Google Scholar] [CrossRef]
  23. Tucci, P.L. New Fragments of Ancient Plans of Rome. J. Rom. Archaeol. 2007, 20, 469–480. [Google Scholar] [CrossRef]
  24. Filippi, G.; Liverani, P. Un nuovo frammento della Forma Urbis con il Circus Flaminius. Atti della Pontif. Accad. Rom. di Archeol. 2015, 87, 69–88. [Google Scholar]
  25. Koller, D.R.; Trimble, J.; Najbjerg, T.; Gelfand, N.; Levoy, M. Fragments of the City: Stanford’s Digital Forma Urbis Romae Project. In Imaging Ancient Rome: Documentation–Visualization–Imagination, Proceedings of the Third Williams Symposium on Classical Architecture, Rome, 20–23 May 2004; Haselberger, L., Humphrey, J., Eds.; Journal of Roman Archaeology: Portsmouth, RI, USA, 2006; Volume S61, pp. 237–252. [Google Scholar]
  26. Koller, D.R.; Levoy, M. Computer-aided Reconstruction and New Matches in the Forma Urbis Romae. Bull. della Comm. Archeol. comunale di Roma 2006, Supplementi 15, 103–125. [Google Scholar]
  27. De Caprariis, F. Forma Urbis Severiana. Novità e Prospettive. Bull. della Comm. Archeol. Comunale di Roma 2016, 117, 81–98. [Google Scholar]
  28. Lloyd, R. Three monumental gardens on the Marble Plan. Am. J. Archaeol. 1982, 86, 91–100. [Google Scholar] [CrossRef]
  29. Aksoy, R. Mesoscopic tectonic features of the Marmara island and the Kapıdağı peninsula, NW Turkey. Turkish J. Earth Sci. 1996, 5, 187–195. [Google Scholar]
  30. Pensabene, P. Il fenomeno del marmo nella Roma tardo-repubblicana e Imperiale. In Marmi Antichi II. Cave e Tecnica di Lavorazione Provenienze e Distribuzione; Pensabene, P., Ed.; L’Erma di Bretschneider: Rome, Italy, 1998; pp. 333–391. [Google Scholar]
  31. Bruno, M.; Cancelliere, S.; Conti, L.; Pensabene, P.; Lazzarini, L.; Pallante, P.; Turi, B. Provenance and distribution of white marbles in temples and public buildings of imperial Rome. In Proceedings of the Fifth International Conference of the Association for the Study of Marble and Other Stones in Antiquity, Museum of Fine Arts, Boston, MA, USA, 11–15 June 1998; Herrmann, J., Herz, N., Newman, R., Eds.; Archetype: London, UK, 2002; pp. 289–301. [Google Scholar]
  32. Brilli, M.; Giustini, F.; Conte, A.M.; Lapuente Mercadal, P.; Quarta, G.; Royo Plumed, H.; Scardozzi, G.; Belardi, G. Petrography, geochemistry, and cathodoluminescence of ancient white marble from quarries in the southern Phrygia and northern Caria regions of Turkey: Considerations on provenance discrimination. J. Archaeol. Sci. Rep. 2015, 4, 124–142. [Google Scholar] [CrossRef]
  33. Casas, L.; Di Febo, R.; Parcerisa, D. Petrographic Markers for Archaeometric Identification of Montjuïc Sandstone, the Flagship Stone of Barcelona (NE Spain). Minerals 2020, 10, 154. [Google Scholar] [CrossRef] [Green Version]
  34. Casas, L.; Di Febo, R.; Boix, C.; Egea, A.; Vallcorba, O.; Queralt, I.; Anglisano, A.; Moreno, I.; Andino, L. The Colors of the Circus Mosaic from Barcino (Roman Barcelona): Characterization, Provenance, and Technology Issues. Minerals 2021, 11, 746. [Google Scholar] [CrossRef]
  35. Craig, H.; Craig, V. Greek Marbles: Determination of Provenance by Isotopic Analysis. Science 1972, 176, 401–403. [Google Scholar] [CrossRef]
  36. Barbin, V.; Ramseyer, K.; Decrouez, D.; Herb, R. Marbres blancs: Caractérisation par cathodoluminescence. Comptes Rendus l’Académie des Sci. Paris 1989, 308, 861–866. [Google Scholar]
  37. Barbin, V.; Ramseyer, K.; Decrouez, D.; Burns, S.; Chamay, J.; Maier, J. Cathodoluminescence of white marbles: An overview. Archaeometry 1992, 34, 175–183. [Google Scholar] [CrossRef]
  38. Tucci, P.L. The Temple of Peace in Rome; Cambridge University Press: Cambridge, UK, 2017. [Google Scholar]
  39. Claridge, A. Rome. An Oxford Archaeological Guide; Oxford University Press: Oxford, UK, 1998. [Google Scholar]
  40. Carozza, V. Roma. Resti di abitazioni alle pendici del Cispio. J. Fasti Online 2007, 89, 1–6. [Google Scholar]
  41. Rodríguez Almeida, E. Forma Urbis Marmorea: Nuove integrazioni. Bull. della Comm. Archeol. Comunale di Roma 1971, 82, 105–135. [Google Scholar]
  42. Pavolini, C. Archeologia e topografia della Regione II (Celio). Un aggiornamento Sessant’anni dopo Colini; Edizioni Quasar: Rome, Italy, 2006. [Google Scholar]
  43. Insalaco, A. Indagini e restauri lungo il Clivus Scauri, 6. Rilettura di un gruppo di frammenti della Forma Urbis. In Caelius I: Santa Maria in Domnica, San Tommaso in Formis e il Clivus Scauri; L’Erma di Bretschneider: Rome, Italy, 2003; pp. 106–112. [Google Scholar]
  44. Rodríguez Almeida, E. Aggiornamento topografico dei colli Oppio, Cispio e Viminale secondo la Forma Urbis Marmorea. Atti della Pontif. Accad. Rom. di Archeol. Rend. 1975, 48, 263–278. [Google Scholar]
  45. Rodríguez Almeida, E. Novità minori dalla Forma Urbis marmorea. Ostraka 1992, 1, 55–80. [Google Scholar]
  46. Cecamore, C. Faustinae aedemque decernerent (SHA, Marcus, 26). Les fragments 69-70 de la Forma Urbis et la première dédicace du temple de la Vigna Barberini. Mélanges l’École française Rome. Antiq. 1999, 111, 311–349. [Google Scholar] [CrossRef]
  47. Rodríguez-Almeida, E. Euristica materiale e Forma marmorea. Alcuni falsi problemi. Atti della Pontif. Accad. Rom. di Archeol. Rend. 1995, 68, 3–20. [Google Scholar]
  48. Steinby, E.M. Il frammento 18a della Forma Urbis Romae. In Lacus Iuturnae; Aronen, J., Steinby, E.M., Eds.; De Luca Editore: Rome, Italy, 1989; Volume I, pp. 24–33. [Google Scholar]
  49. Palombi, D. FUR, fr. 18a [---]astoris: Una lettura alternativa? In Res Bene Gestae. Ricerche di Storia Urbana su Roma Antica in Onore di Eva Margareta Steinby; Edizioni Quasar: Rome, Italy, 2007; pp. 279–291. [Google Scholar]
  50. Tucci, P.L. L’Arx Capitolina: Tra mito e realtà. In Imaging Ancient Rome: Documentation–Visualization–Imagination, Proceedings of the Third Williams Symposium on Classical Architecture, Rome, Italy, 20–23 May 2004; Haselberger, L., Humphrey, J., Eds.; Journal of Roman Archaeology supplementary series, 61; 2006; Volume 61, pp. 63–73. [Google Scholar]
  51. Rodríguez Almeida, E. Miscellanea sulla Forma Urbis marmorea. Atti della Pontif. Accad. Rom. di Archeol. Rend. 1978, 51–52, 91–109. [Google Scholar]
  52. Parisi Presicce, C.L. Una nuova proposta per la localizzazione del Tempio dei Divi Traiano e Plotina. Bull. della Comm. Archeol. Comunale di Roma. (In press).
  53. Rodríguez-Almeida, E. Diversi problemi connessi con la lastra 37 della Forma U. M. e la topografia in Circo e in Campo. Atti della Pontif. Accad. Rom. di Archeol. Rend. 1991, 64, 3–26. [Google Scholar]
  54. Rodríguez-Almeida, E. A proposito della Forma marmorea e di altre formae. Mélanges l’Ecole Française Rome Antiq. 2000, 112, 217–230. [Google Scholar] [CrossRef]
  55. Cozza, L. Adonaea nella Pianta marmorea severiana. Analecta Rom. Instituti Danici 1990, 19, 233–237. [Google Scholar]
  56. Cecamore, C. Le Curiae Veteres sulla Forma Urbis Marmorea e il pomerio romuleo secondo Tacito. Römische Mitt. 2002, 109, 43–58. [Google Scholar]
  57. Panella, C. Un’area sacra sulle pendici nord-orientali del Palatino. Meta Sudans 1996, I, 27–91. [Google Scholar]
  58. Rodríguez Almeida, E. De la Forma Urbis Marmorea, en torno al Collis Capitolinus. In Eius Virtutis Studiosi; Classical and postclassical studies in memory of Frank Edward Brown (1908–1988); Scott, R.T., Scott, A.R., Eds.; National Gallery of Art: Washington, DC, USA, 1993; pp. 31–43. [Google Scholar]
  59. Lapuente, M.P.; Turi, B.; Blanc, P. Marbles from Roman Hispania: Stable isotope and cathodoluminescence characterization. Appl. Geochem. 2000, 15, 1469–1493. [Google Scholar] [CrossRef]
  60. Pagel, M.; Barbin, V.; Blanc, P.; Ohnenstetter, D. Cathodoluminescence in Geosciences: An Introduction. In Cathodoluminescence in Geosciences; Pagel, M., Barbin, V., Blanc, P., Ohnenstetter, D., Eds.; Springer: Berlin/Heidelberg, Germany, 2000; pp. 1–21. [Google Scholar]
  61. Kaufman, L.; Rousseeuw, P.J. Finding Groups in Data: An Introduction to Cluster Analysis; Wiley Series; John Wiley & Sons, Inc.: New York, NY, USA, 1990. [Google Scholar]
  62. Chakravarti, I.M.; Laha, R.G.; Roy, J. Handbook of Methods of Applied Statistics; John Wiley & Sons: New York, NY, USA, 1967. [Google Scholar]
  63. Antonelli, F.; Lazzarini, L. An updated petrographic and isotopic reference database for white marbles used in antiquity. Rend. Lincei 2015, 26, 399–413. [Google Scholar] [CrossRef]
  64. Attanasio, D.; Brilli, M.; Bruno, M. The properties and identification of marble from Proconnesos (Marmara island, Turkey): A new database including isotopic, EPR and petrographic data. Archaeometry 2008, 50, 747–774. [Google Scholar] [CrossRef]
  65. Attanasio, D.; Brilli, M.; Ogle, N. The Isotopic Signature of Classical Marbles; L’Erma di Bretschneider: Rome, Italy, 2006; ISBN 9788882653781. [Google Scholar]
  66. Prochaska, W.; Attanasio, D. The challenge of a successful discrimination of ancient marbles (part I): A databank for the marbles from Paros, Prokonnesos, Heraklea/Miletos and Thasos. J. Archaeol. Sci. Rep. 2021, 35, 102676. [Google Scholar] [CrossRef]
  67. German, K.; Holzmann, G.; Winkler, F.J. Determination of marble provenance: Limits of isotopic analysis. Archaeometry 1980, 22, 99–106. [Google Scholar] [CrossRef]
  68. Brilli, M.; Lapuente Mercadal, M.P.; Giustini, F.; Royo Plumed, H. Petrography and mineralogy of the white marble and black stone of Göktepe (Muğla, Turkey) used in antiquity: New data for provenance determination. J. Archaeol. Sci. Rep. 2018, 19, 625–642. [Google Scholar] [CrossRef] [Green Version]
  69. Mrozek-Wysocka, M. Ancient marbles: Provenance determination by archaeometric study. In Geoscience in Archaeometry; Michalska, D., Szczepaniak, M., Eds.; Methods and Case Studies; Wydawnictwo Naukowe Bogucki: Poznań, Poland, 2014; pp. 99–122. [Google Scholar]
  70. Barbin, V.; Ramseyer, K.; Fontignie, D.; Burns, S.; Decrouez, D. Differentiation of blue-cathodoluminescing white marbles. In Ancient Stones: Quarrying, Trade and Provenance. Katholieke Universiteit Leuven. Acta Archaeologica Lovaniensia, Monographiae 4; Waelkens, M., Herz, N., Moens, L., Eds.; Leuven University Press: Leuven, Belgium, 1992; pp. 231–236. [Google Scholar]
  71. Lazzarini, L. Archaeometric aspects of white and coloured marbles used in antiquity: The state of the art. Period. di Mineral. 2004, 73, 113–125. [Google Scholar]
  72. Gorgoni, C.; Lazzarini, L.; Pallante, P.; Turi, B. An updated and detailed mineropetrographic and C-O stable isotopic reference database for the main Mediterranean marbles used in antiquity. In Proceedings of the Vth ASMOSIA Conference, Boston, MA, USA, 12–15 June 1998; Herrmann, J.J., Herz, N., Newman, R., Eds.; Archetype Publisher: London, UK, 2002; pp. 1–25. [Google Scholar]
  73. Asor Rosa, L. Testimonianze archeologiche dall’area del Semenzaio Comunale. Bull. della Comm. Archeol. Comunale di Roma 2001, 102, 147–162. [Google Scholar]
  74. Ciancio Rossetto, P. Il nuovo frammento della Forma severiana relativo al Circo Massimo. Bull. della Comm. Archeol. comunale di Roma 2006, Supplementi 15, 127–141. [Google Scholar]
  75. Buonfiglio, M. Relazione preliminare sulle nuove acquisizioni sul Circo Massimo: Indagini archeologiche 2009–2016. In Proceedings of the Tarraco Biennal, Actes 3r Congrés Internacional d’Arqueologia i Món Antic, Tarragona, Spain, 16–19 November 2016; López Villar, J. Ed., Fundació Privada Mútua Catalana: Tarragona, Spain, 2017; pp. 119–136. [Google Scholar]
  76. Buonfiglio, M. L’Arco di Tito al Circo Massimo. Dalle indagini archeologiche alla ricostruzione virtuale. Bull. della Comm. Archeol. Comunale di Roma 2017, 118, 163–186. [Google Scholar]
  77. Scagnetti, F.; Grande, G. Roma Urbs Imperatorum Aetate. Pianta topografica a Colori di Roma Antica; Edizioni Private e Varie: Rome, Italy, 1993. [Google Scholar]
  78. Panella, C. L’organizzazione Degli spazi sulle Pendici Settentrionali del Colle Oppio tra Augusto e i Severi; Publications de l’École Française de Rome: Rome, Italy, 1987; pp. 611–651. [Google Scholar]
  79. Valentini, R.; Zucchetti, G. Codice Topografico della Città di Roma; Tipografia del Senato: Rome, Italy, 1940. [Google Scholar]
  80. Coarelli, F. Aedes Fortis Fortunae, Naumachia Augusti, Castra Ravennatium. La via Campana Portuensis e alcuni edifici adiacenti nella Pianta Marmorea Severiana. Ostraka 1992, 1, 39–54. [Google Scholar]
  81. Taylor, R. Torrent or Trickle? The Aqua Alsietina, the Naumachia Augusti, and the Transtiberim. Am. J. Archaeol. 1997, 101, 465–492. [Google Scholar] [CrossRef]
  82. Coarelli, F. Divorum, Porticus, Templum. In Lexicon Topographicum Urbis Romae; Steinby, E.M., Ed.; Edizioni Quasar: Rome, Italy, 1995; Volume 2, pp. 19–20. [Google Scholar]
  83. Senseney, J. Adrift toward Empire: The Lost Porticus Octavia in Rome and the Origins of the Imperial Fora. J. Soc. Archit. Hist. 2011, 70, 421–441. [Google Scholar] [CrossRef]
  84. Siwicki, C. Defining Rome’s Pantheum. J. Anc. Hist. 2019, 7, 269–315. [Google Scholar] [CrossRef]
  85. Gatti, G. Saepta Iulia e Porticus Aemilia nella Forma severiana. Bull. della Comm. Archeol. Comunale di Roma 1934, 62, 55–82. [Google Scholar]
  86. Gatti, G. I Saepta Iulia nel Campo Marzio. L’Urbe 1937, 2, 8–23. [Google Scholar]
  87. Tucci, P.L. Tra il Quirinale e l’Acquedotto Vergine sulla pianta marmorea severiana: I frammenti 538 a-o. Analecta Rom. Inst. Danici 1996, 23, 21–33. [Google Scholar]
  88. Coarelli, F. Pons Aemilius. In Lexicon Topographicum Urbis Romae; Steinby, E.M., Ed.; Edizioni Quasar: Rome, 1999; Volume 4, pp. 106–107. [Google Scholar]
  89. Taylor, R. Tiber River Bridges and the Development of the Ancient City of Rome. Waters Rome 2002, 2, 1–20. [Google Scholar]
  90. Tucci, P.L. The Pons Sublicius: A reinvestigation. Mem. Am. Acad. Rome 2012, 56–57, 177–212. [Google Scholar]
  91. Buzzetti, C. Claudius, Divus, Templum (Reg. II). In Lexicon Topographicum Urbis Romae; Steinby, E.M., Ed.; Edizioni Quasar: Rome, Italy, 1993; Volume 1, pp. 277–278. [Google Scholar]
  92. Moonen, S. The Temple of Peace and the Temple of Divus Claudius. A Study into the Functions of the Temple of Peace and the Temple of Divus Claudius and Their Role within the Ideology of Vespasian. Master’s Thesis, Radboud University Nijmegen, Nijmegen, The Netherlands, 2018. [Google Scholar]
  93. Gorrie, C. The Septizodium of Septimius Severus Revisited: The Monument in Its Historical and Urban Context. Latomus 2001, 3, 653–670. [Google Scholar]
  94. Rodríguez Almeida, E. I confini interni della regio V, Esquiliae, nella Forma Urbis Marmorea. In L'archeologia in Roma Capitale tra Sterro e Scavo; Pisani Sartorio, G., Quilici, L., Eds.; Marsilio Editore: Venice, Italy, 1983; pp. 106–115. [Google Scholar]
  95. Rickman, G. Roman Granaries and Store Buildings; Cambridge University Press: Cambridge, UK, 1971. [Google Scholar]
  96. Trimble, J. Fragment 18a in light of the new excavations. In Cartography in Antiquity and the Middle Ages. Fresh Perspectives, New Methods Technology and Change in History; Talbert, R., Unger, R., Eds.; Brill: Boston, MA, USA, 2008; pp. 67–98. [Google Scholar]
  97. Battistin, F. Abitare nella Roma dei Severi. Studio delle tipologie abitative dai frammenti della Forma Urbis marmorea. Archeol. Class. 2015, 66, 547–574. [Google Scholar]
  98. Bollmann, B. Römische Vereinshäuser. Untersuchungen zu den Scholae der römischen Berufs-, Kult- und Augustalen-Kollegien in Italien; von Zabern: Mainz, Germany, 1998. [Google Scholar]
  99. Sartorio, G. Compita larum. Edicole sacre nei crocicchi di Roma antica. Boll. della Unione Stor. ed Arte 1988, 1-4, 23–34. [Google Scholar]
  100. Cordischi, L. Note in margine di topografia romana: Codeta, “minor Codeta” e “Naumachia Caesaris”. Bull. della Comm. Archeol. Comunale di Roma 1999, 100, 53–62. [Google Scholar]
  101. Scaroina, L.; La Regina, A. Resti della basilica Ulpia sotto il Palazzo Roccagiovine. In Lexicon Topographicum Urbis Romae—Supplementum VII. Scritti in onore di Lucos Cozza; Coates-Stephens, R., Cozza, L., Eds.; Edizioni Quasar: Rome, Italy, 2014; pp. 167–181. [Google Scholar]
  102. Amici, C.M. Foro di Traiano: Basilica Ulpia e Biblioteche; Panetto & Petrelli: Rome, Italy, 1982. [Google Scholar]
  103. Richardson, L. The evolution of the Porticus Octaviae. Am. J. Archaeol. 1976, 80, 57–64. [Google Scholar] [CrossRef]
  104. Gatti, G. Dove erano situati il Teatro di Balbo e il Circo Flaminio? Capitolium 1960, 3–12. [Google Scholar]
  105. Gatti, G. Ancora sulla vera posizione del Teatro di Balbo e del Circo Flaminio. Palatino 1961, V, 17–20. [Google Scholar]
  106. Ciancio Rossetto, P. Portico d’Ottavia: Scavi, restauri, valorizzazioni. In Arch.it.arch: Dialoghi di Archeologia e Architettura (Seminari 2005–2006); Edizioni Quasar: Rome, Italy, 2009; pp. 62–77. [Google Scholar]
  107. Ciancio Rossetto, P. Teatro di Marcello: Nuove acquisizioni sulla struttura e organizzazione della scena e dell’area post scaenam alla luce delle indagini recenti. Riv. Trimest. dell’Istituto Naz. di Stud. Rom. 2008, 3–23. [Google Scholar]
  108. Monterosso, A. Via Triumphalis per Theatrum Marcelli, símbolos de arquitectura en la Forma Urbis Marmorea. Rev. Archéologique 2009, 3–51. [Google Scholar]
  109. Dell’Era, F. Il complesso di Matidia nel Campo Marzio. In Adventus Hadriani: Investigaciones sobre Arquitectura Adrianea; l’Erma di Bretschneider: Rome, Italy, 2020; pp. 107–128. [Google Scholar]
  110. Zevi, F. Per l’identificazione della Porticus Minucia frumentaria. Mélanges l’École française Rome 1993, 105, 661–708. [Google Scholar]
  111. Zevi, F. Ancora una nota sulla Porticus Minucia. Mélanges 1994. [Google Scholar]
  112. Coarelli, F. Il Campo Marzio. Dalle Origini Alla Fine Della Repubblica; Edizioni Quasar: Rome, Italy, 1997. [Google Scholar]
  113. Caprioli, F. Forma Architettonica, linguaggio Decorativo E Committenza della Prima Fase del Tempio B di largo Argentina. Tradizione e Innovazione. L'elaborazione del Linguaggio Ellenistico Nell'architettura Romana e Italica in età Tardo-Repubblicana; L’Erma di Bretschneider: Rome, Italy, 2011; pp. 89–107. [Google Scholar]
  114. Rodríguez Almeida, E. Un nuovo frammento della Forma Urbis Marmorea. In Città e architettura nella Roma Imperiale, Atti del Seminario del 27 ottobre 1981 nel 25o Anniversario dell’Accademia di Danimarca. Analecta Romana Instituti Danici, Supplementum 10; Odense University Press: Odense, Denmark, 1983; pp. 87–92. [Google Scholar]
  115. Rodríguez-Almeida, E. Forma Urbis marmorea: Nuovi elementi di analisi e nuove ipotesi di lavoro. Mélanges l’École française de Rome 1977, 89, 219–256. [Google Scholar] [CrossRef]
  116. Hülsen, C. La rappresentazione degli edifici palatini nella Forma Urbis Romae dei tempi Severiani. Diss. Letta Alla Pontif. Accad. Romana di Archeol. 1914, 11, 101–120. [Google Scholar]
  117. Panella, C.; Zeggio, S.; Ferrandes, A. Lo scavo delle pendici nord-orientali del Palatino tra dati acquisiti e nuove evidenze. Sci. dell’Antichità 2014, 20, 159–210. [Google Scholar]
  118. Zeggio, S. Santuario sulle pendici nord-orientali del colle Palatino. In La Roma dei Re. Il Racconto Dell’archeologia, Catologo Mostra (Roma, Musei Capitolini, 27 luglio 2018- 2 giugno 2019); Gangemi Editore Spa: Rome, Italy, 2019; pp. 135–150. [Google Scholar]
  119. Monterroso Checa, A. “Aqvedvctivm” Una lectura tridimensional en la Forma Urbis Marmorea. Arqueol. la Arquit. 2011, 65–84. [Google Scholar] [CrossRef] [Green Version]
  120. Santangeli Valenzani, R. Arcus Nervae, Templum Iani, Arcus Aureae: L’Ordo di Benedetto Canonico e la Topografia dell’area dei Fori Imperiali nel Medioevo. Bull. della Comm. Archeol. Comunale di Roma 1998, 99, 145–152. [Google Scholar]
  121. La Valle, M. Osservazioni sull’Arcus Aureae e sulla Porticus Absidata. Bull. della Comm. Archeol. Comunale di Roma 2007, 108, 195–220. [Google Scholar]
  122. Domingo, J. Las termas de L. Licinius Sura (Balneum Surae) en el Aventino de Roma: Hipótesis de localización y problemas para su reconstrucción. Pyrenae 2015, 46, 49–75. [Google Scholar]
  123. Prim, J. Vie religieuse au VIe siècle av. J.C. et topographie urbaine. Mélanges l’École française Rome 2014, 126. [Google Scholar]
  124. Armellin, P.; Quaranta, P. Il tempio di Diana sull’Aventino. Nuove acquisizioni. Bull. della Comm. Archeol. Comunale di Roma 2004, 105, 279–298. [Google Scholar]
  125. Cassatella, A.; Venditelli, L. Santuario di Diana sull’Aventino: Il problema della localizzazione. In Roma Archeologia nel Centro; De Luca Editori d’Arte: Rome, Italy, 1985; Volume 2, pp. 442–451. [Google Scholar]
  126. Alföldi, A. Il santuario federale latino di Diana sull’Aventino e il tempio di Ceres. Stud. e Mater. di Stor. delle Relig. 1961, 31, 21–39. [Google Scholar]
  127. Tucci, P.L. La controversa storia della Porticus Aemilia. Archeol. Class. 2012, 63, 575–591. [Google Scholar]
  128. Arata, F.P.; Felici, E. Porticus Aemilia, navalia o horrea ? Ancora sui frammenti 23 e 24 b-d della Forma Urbis. Archeol. Class. 2011, 62, 127–153. [Google Scholar]
  129. Tuck, S.L. A new identification for the Porticus Aemilia. J. Rom. Archaeol. 2000, 13, 176–182. [Google Scholar] [CrossRef]
  130. Rodríguez Almeida, E. Cohortes III Horreorum Galbianorum. Atti della Pontif. Accad. Rom. di Archeol. Rend. 1977, 50, 9–25. [Google Scholar]
  131. Ferrera, L. Il monumento funerario del console Ser. Sulpicius Galba. Bull. della Comm. Archeol. Comunale di Roma 1998, 99, 51–72. [Google Scholar]
  132. Staccioli, R.A. Terme minori e balnea nella documentazione della Forma Urbis. Archeol. Class. 1961, 13, 91–102. [Google Scholar]
  133. Etienne, R. Extra Portant Trigeminam: Espace politique et Espace Économique à l’Emporium de Rome; Publications de l’École française de Rome: Rome, Italy, 1987; pp. 235–249. [Google Scholar]
  134. Hrychuk Kontokosta, A. Building the Thermae Agrippae: Private Life, Public Space, and the Politics of Bathing in Early Imperial Rome. Am. J. Archaeol. 2019, 123, 45–77. [Google Scholar] [CrossRef]
  135. Ferrera, L. Gli dei di terracotta. La ricomposizione del frontone da Via di San Gregorio; Electa: Rome, Italy, 2002. [Google Scholar]
  136. Bauer, H. Il Foro Transitorio e il Tempio di Giano. Atti della Pontif. Accad. Rom. di Archeol. Rend. 1976, 49, 117–150. [Google Scholar]
  137. Meneghini, R. Il cosiddetto tempio di Giano, il perduto foro di Minerva e la prima fase costruttiva del foro di Nerva. Sci. dell’Antichità 2015, 21, 59–80. [Google Scholar]
  138. Manacorda, D. Il Tempio di Vulcano in Campo Marzio. Dialoghi di Archeol. 1990, 3, 35–51. [Google Scholar]
Figure 1. On the left, a view of the present state of the wall of the Templum Pacis, where the Forma Urbis Romae was fixed, currently integrated in the church of Santi Cosma e Damiano. On the right, several examples of sampled fragments of the F.U.
Minerals 11 01400 g001
Figure 2. Slab map of the F.U. showing the slab numbering code (in green) adapted from the Stanford Digital Forma Urbis Romae Project in which the Tiber river course and some important structures have been highlighted (in purple). The presumed position of the 53 sampled labelled fragments has been indicated, and 40 unlabeled fragments were also sampled.
Minerals 11 01400 g002
Figure 3. Example of data treatment performed on petrographic CL images. The original image (corresponding to a sample of fragment 33abc) was cropped (red rectangle) and, from it, several data were obtained: histograms for the three color-channels; a simplified version of the image in which colors have been clustered into a few pixel types identified by their RGB values and their abundance on the image; and the average RGB value of the image.
Minerals 11 01400 g003
Figure 4. Graphic representation of similarity computation. (a) Similarity decreases following a Gaussian function as the Euclidian distance between data increases, fixing a similarity of 10% at a distance d95 defined as the distance that encompasses 95% of the computed distance distribution. (b) Similarly, for data compared to a computed confidence ellipse, similarity is 100% within the ellipse and then decreases in the manner of a Gaussian function fixing a similarity of 10% for data that lie within the border of a 95% confidence ellipse computed with all available data.
Minerals 11 01400 g004
Figure 5. The isotopic results (expressed relative to V-PDB) of all the measured samples plot in (a) the isotopic reference envelopes from [63] and (b) the 90% confidence ellipses from [65]. In (c), some samples have been identified to show the relative dispersion of samples from a given fragment and the outlier (238a).
Minerals 11 01400 g005
Figure 6. Petrographic images of thin sections of some sampled marble fragments viewed under CL. With ascribed slab (a) 22b, slab VII-15 and (b) 33abc, slab V-17; without ascribed slab (c) 599, (d) 68ab, (e) 89, (f) 165abd and (g) fn37; fragments not assigned to the F.U. (h) fms1960 and (i) fn31.
Minerals 11 01400 g006
Figure 7. The 3D scatter plot of RGB values corresponding to the averaged CL color of all the analyzed samples. The plot is shown in two different perspectives to highlight that the values concentrate on a plane.
Minerals 11 01400 g007
Figure 8. Averaged RGB CL colors projected on the median plane for of all the analyzed samples; a general 95% confidence ellipse has been drawn on it. Some samples have been labeled to identify their positions.
Minerals 11 01400 g008
Figure 9. Averaged RGB CL colors projected on the median plane. Some values have been highlighted: in blue matching samples that define a confidence ellipse, and in red other samples that presumably also belong to the group. (a) 5Abcd and related fragments; (b) the samples as before, but in this case the confidence ellipse has been computed using the values of fragments 5a, 5b, and 5h that do not match; (c) 31-type matching fragments and related fragments, the dashed-line ellipse was computed using only 31cc, 31ii, and 31ll fragments; and (d) 70abc and related fragments.
Minerals 11 01400 g009
Figure 10. Position of the 5-type fragments within the reconstructed slab IX-5 as appears in [56]. The sampled fragments have been labeled, including the multi-piece 5Abcd fragment and three single-piece fragments (5a, 5b, and 5h). It is well established that these single-piece fragments are part of a representation of the Temple of the Deified Claudius (see Table S2).
Minerals 11 01400 g010
Table 1. Sample sets from group 2 that some authors have argued to be part of a single slab.
Sample
Set
Slab/sReasons to Consider/Question a Common Slab and Relevant References
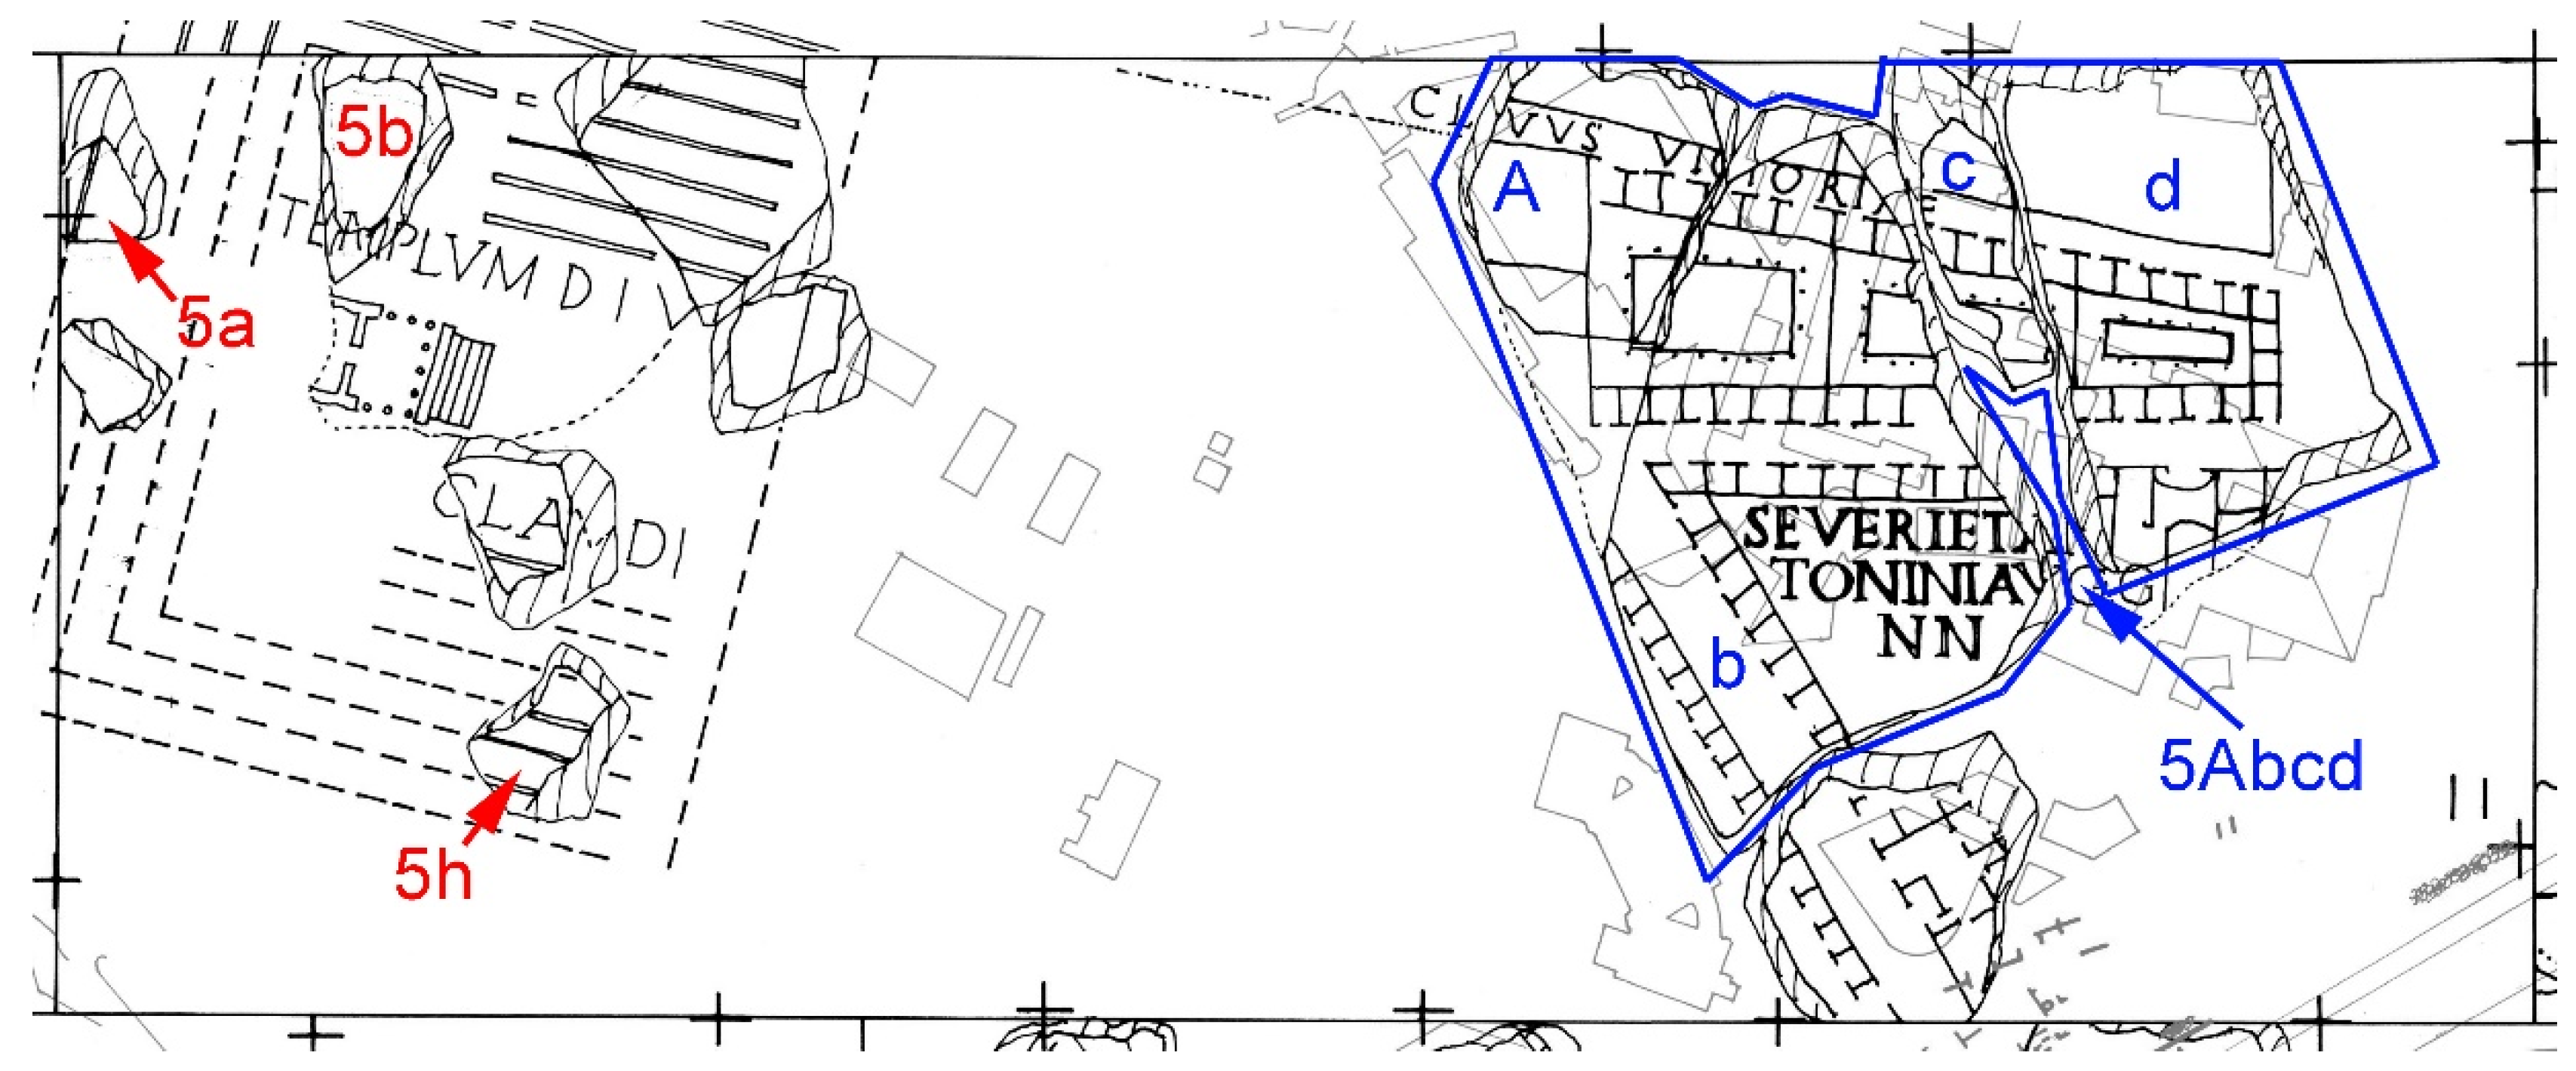
5Abcd, 5a, 5b, 5hIX-5Some authors [1,18] argue that the physical features of the fragments (thickness, similar veining, etc) indicate that all of them belong to slab IX-5. However, others [42,43] argue that the differences between the archaeologically unearthed remains and the depicted content indicate that fragment 5Abdc would not fit within this slab.
11c, 11fghVII-7Rodríguez Almeida [44,45] places both fragments within the same slab based on the physical similarities of the fragments (sawing irregularities on the back) and the good correspondence between the inscribed contents and excavated remains.
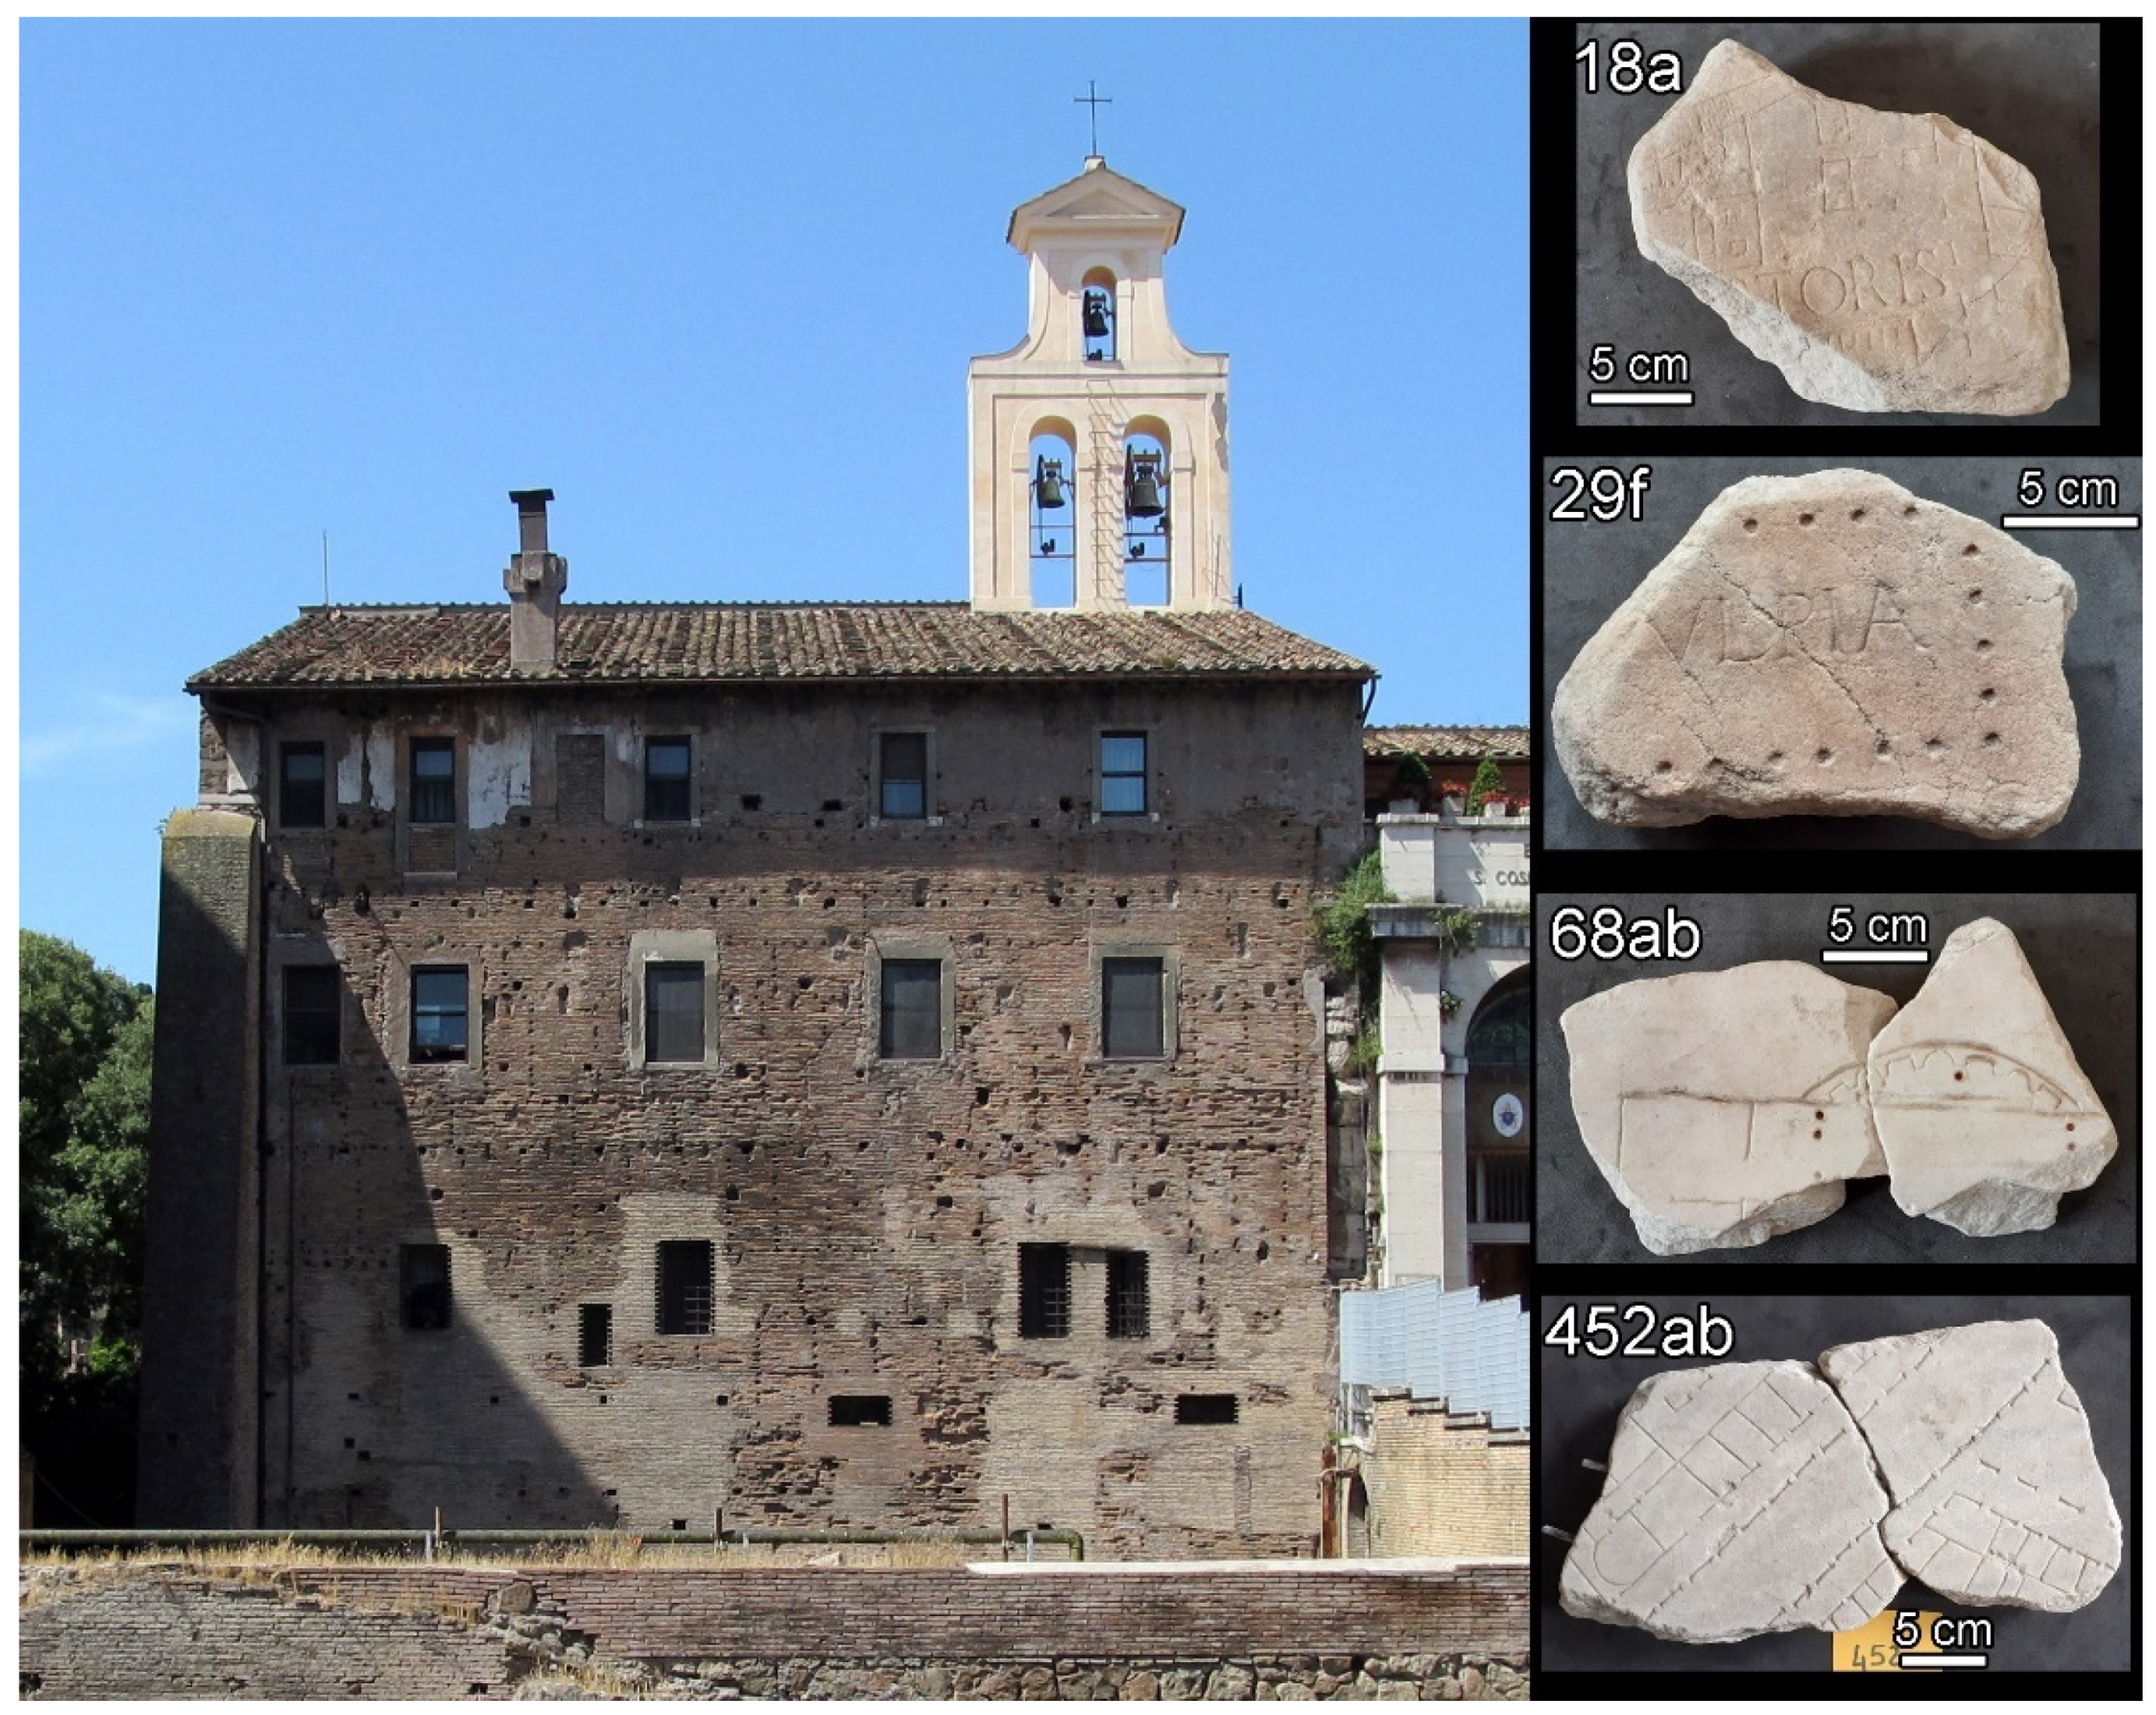
18a, 103, 70a, 70b, 70cVII-11Cecamore [46] groups 70a, 70b, and 70c within slab VII-11 based on the correspondence between the engraved topography and the archaeological data. She also argues that fragment 103 could belong to the same slab (based on physical similarities, such as thickness and veining). Rodríguez Almeida [47] adds fragment 18a to slab VII-11. However, other authors [48,49] argue that the inscription on fragment 18a does not identify the Temple of Castor and that the fragment should be placed elsewhere in the plan.
28a, 28cVI-9Both fragments are believed to constitute almost the whole of slab VI-9. This slab would be complete with the lost fragment 28b that is placed in between. The exact position of the slab is deduced from the holes of the clamps [1].
29f, 29g, 517abcdefV-9Based on the study of drawings of the codex Vat. Lat. 3439, 29f and 29g are assigned to slab V-9 [1]. Tucci [50] also assigns fragment 517abcdef to this slab based mainly on topographic evidence and secondarily due to similar physical features of the marbles of the mentioned fragments.
36b, 590III-9
VII-10
Rodríguez Almeida places fragment 36b within slab III-9 [51] and fragment 590 within slab VII-10 [45]. However, Parisi Presicce [52], based on a new epigraphic interpretation of fragment 36b, suggests that both fragments could belong to the same slab.
238a, 37a, 40cdefgh, 307abIV-6
III-12
Rodríguez Almeida [53] places 238a in slab IV-6, based on its physical characteristics. Fragments 37a and 307ab are also assigned to slab IV-6 by Stanford computer-aided reconstruction algorithms. In particular, 307ab would be located along the bottom edge of the slab. However, Rodríguez Almeida [54] argues that 307ab belongs to slab III-12 along with other fragments, such as 40cdefgh, because of the similar physical features.
46acd, 68ab-These fragments have not been assigned to any defined slab, but Cozza [55] suggests their connection based on similarities in physical characteristics (roughness of the back, thickness, ductus of the writing, veining direction, etc).
452ab, 452d, 8a, 8cVIII-5Cecamore [56] assigns the fragments 452ab and 452d to slab VIII-5 (along with 8a and 8c) based on a good matching between the depicted topography and the archaeological remains, and also based on written sources and physical similarities between all the preserved fragments. In contrast, Panella [57] argues that the 452-type fragments cannot be part of this slab because the represented topography is inconsistent with the actual excavated remains and the epigraphic content must be interpreted differently.
499, 31cc, 31h, 31ii, 31qrsV-12Several fragments labelled as 31 are assigned to slab V-12 [18], although some of them do not match physically. Rodríguez Almeida [21,58] suggests that fragment 499 could also be part of the ensemble based on the correlation between represented topography and the archaeological data, alongside with similarities in the physical characteristics.
Table 2. Similarity between the isotopic ratios of different samples from a single fragment (or from different matching fragments) and the corresponding computed centroid. For fragments with only two samples, similarity was directly computed with the corresponding Euclidian distance.
Fragment/sSamplesSimilarity between Samples
7abcd4100%99%100%98%
10abcde397%91%77%
31cc, ii, ll376%57%92%
35ab, cdefghi, lpqr386%89%98%
70a, 70b291%
362ab2100%
Table 3. Similarity between the averaged CL color of every sample and the centroid computed with samples of the same fragment. For fragments with only two samples, the similarity was directly computed with the corresponding Euclidian distance.
Fragment/sSamplesSimilarity between Samples
1abcde397%98%98%
7abcd493%97%81%74%
10abcde399%90%93%
10opqr384%98%91%
33abc395%97%100%
35ab, cdefghi, lpqr394%94%91%
41abc387%91%98%
57abcd296%
165abd381%96%93%
277ab487%88%95%91%
336ab293%
362ab299%
496ab282%
538abcdefg279%
586ab3100%97%96%
619a399%89%84%
621abcd399%87%83%
Table 4. Similarity between the averaged CL color of every sample and the centroid computed with samples of the same fragment (or other matching fragments). On the right, the similarity between the centroid and isolated (not matching) fragments is shown.
Fragment/sMatching SamplesSimilarity between Matching Samples (Group) 1Similarity between the Group and
Isolated Fragments
5Abcd574%94%78%72%90%5a5b5h
61%62%73%
517abcdef235% 29f29g
28%23%
40cdefg296% 307a307b
68%40%
307ab275% 37a328a
41%55%
452ab, d291% 8a8b
91%86%
31ii, ll, cc394%92%96% 31h499
54%86%
31qrs295% 31h499
93%67%
70abc581%75%84%99%82%18a103
81%63%
1 For pairs of matching samples, the similarity was directly computed with the corresponding Euclidian distance.
Table 5. Similarity between the averaged CL color of pairs of fragments that in some F.U. reconstructions are hypothesized as belonging to a same slab.
Slab/sFragment 1Fragment 2Similarity
VII-7 11c11fgh96%
VI-928a28c60%
III-9 (36b); VII-10 (590)36b59080%
unknown46acd68ab98%
Table 6. Several groups of matching samples with the indication of the percentage area of the corresponding 95% confidence ellipse compared to the area of the general ellipse. On the right, the similarity between the group and isolated (not matching) fragments is shown.
Fragment/sMatching
Samples
Ellipse AreaSimilarity between Matching Samples
(Ellipse) and Other Fragments
5Abcd556%5a5b5h
100%100%100%
31cc, ii, ll313%31h499
31qrs 1279%100%
31cc, ii, ii, qrs513%81%82%
100%100%
70bc55%18a103
100%77%
1 For this fragment, only two samples were available and therefore the confidence ellipse is actually a straight segment.
Table 7. Main deductions from the checked reconstruction hypotheses.
Simple Comparison between Two Unconnected Fragments
FragmentsSlabMain Deductions
11c, 11fghVII-7Averaged CL colors and isotopic ratios are compatible with a common slab.
28a, 28cVI-9Averaged CL colors suggest different slabs though the results are attributable to internal heterogeneities. Isotopic ratios support a common slab.
36b, 590III-9 (36b)
VII-10 (590)
Averaged CL colors are compatible with a common slab (isotopic ratios were not measured for sample 590).
46acd, 68ab-Averaged CL colors and isotopic ratios are compatible with a common slab.
Comparison between a Reference Group (Defined by Connected Fragments) and Unconnected Fragments
Reference GroupOther
Fragments
SlabMain Deductions
452ab, 452d,8a, 8cVIII-5Averaged CL colors and isotopic ratios are compatible with a common slab.
517abcdef29f, 29gV-9Isotopic ratios support a common slab. Averaged CL colors suggest that 29f and 29g would pertain to a common slab, but not 517abcdef.
70a, 70b, 70c18a, 103VII-11Averaged CL colors suggest that 18a could belong to the slab of the reference group, but the ascription of 103 is more doubtful.
5Abcd5a, 5b, 5hIX-5Averaged CL colors suggest that the unconnected 5a, 5b, and 5h ensemble belong to slab IX-5, but the ascription of 5Abcd is more doubtful.
Comparison Including Two Reference Groups and Unconnected Fragments
Reference Group 1Reference Group 2Other
Fragments
Main Deductions
40cdefgh
(slab III-12)
307ab
(slabs IV-6/
III-12)
37a, 238aData suggest that neither the two reference groups belong to a same slab nor 37a would share slab with any of the groups. Isotopic ratios strongly suggest that the 238a fragment could be not carved in Proconnesian marble.
31ii-ll-cc
(slab V-12)
31qrs
(slab V-12)
31h, 499Despite hints of internal variability, the projected averaged CL colors support the ascription of all fragments to a common slab.
Publisher’s Note: MDPI stays neutral with regard to jurisdictional claims in published maps and institutional affiliations.

