Article

Fabrication of Adsorbed Fe(III) and Structurally Doped Fe(III) in Montmorillonite/TiO2 Composite for Photocatalytic Degradation of Phenol

1
Department of Earth Resources Engineering, Kyushu University, Fukuoka 819-0395, Japan
2
Institute for Catalysis, Hokkaido University, Sapporo 001-0021, Japan
*
Author to whom correspondence should be addressed.
Minerals 2021, 11(12), 1381; https://doi.org/10.3390/min11121381
Submission received: 8 November 2021 / Revised: 2 December 2021 / Accepted: 4 December 2021 / Published: 8 December 2021
(This article belongs to the Special Issue Feature Papers in Clays and Engineered Mineral Materials)

Abstract

:
The Fe(III)-doped montmorillonite (Mt)/TiO2 composites were fabricated by adding Fe(III) during or after the aging of TiO2/Ti(OH)4 sol–gel in Mt, named as xFe-Mt/(1 − x)Fe-TiO2 and Fe/Mt/TiO2, respectively. In the xFe-Mt/(1 − x)Fe-TiO2, Fe(III) cations were expected to be located in the structure of TiO2, in the Mt, and in the interface between them, while Fe(III) ions are physically adsorbed on the surfaces of the composites in the Fe/Mt/TiO2. The narrower energy bandgap ( E g ) lower photo-luminescence intensity were observed for the composites compared with TiO2. Better photocatalytic performance for phenol degradation was observed in the Fe/Mt/TiO2. The 94.6% phenol degradation was due to greater charge generation and migration capacity, which was confirmed by photocurrent measurements and electrochemical impedance spectroscopy (EIS). The results of the energy-resolved distribution of electron traps (ERDT) suggested that the Fe/Mt/TiO2 possessed a larger amorphous rutile phase content in direct contact with crystal anatase than that of the xFe-Mt/(1 − x)Fe-TiO2. This component is the fraction that is mainly responsible for the photocatalytic phenol degradation by the composites. As for the xFe-Mt/(1 − x)Fe-TiO2, the active rutile phase was followed by isolated amorphous phases which had larger ( E g ) and which did not act as a photocatalyst. Thus, the physically adsorbed Fe(III) enhanced light adsorption and avoided charge recombination, resulting in improved photocatalytic performance. The mechanism of the photocatalytic reaction with the Fe(III)-doped Mt/TiO2 composite was proposed.

Graphical Abstract

1. Introduction

Mt and Fe(III) are abundant in nature, while Ti is one of the most abundant elements (the ninth most abundant element (0.63% by mass)), and the seventh most abundant metal in Earth’s crust. Ti can be found in almost all living things, as well as in bodies of water, rocks, and soils. The most common compound is titanium dioxide (TiO2), a popular photocatalyst that has long been studied and applied to scientific research and industry. TiO2 is highly photocatalytic-active, non-toxic, chemically stable in most conditions, and has a low cost. However, the relatively large energy bandgap ( E g ) and the recombination of electron (e) and hole (h+) reduce the photocatalytic activity of TiO2. In addition, the nanoparticles of TiO2 tend to aggregate, making it difficult to separate from water. To overcome these difficulties, numerous strategies have been applied, such as morphology modification [1,2], surface sensitization [3,4], metal nanoparticle deposition [5,6], element doping [7,8], and the preparation of composite materials with other materials [9,10].
Montmorillonite (Mt) is a typical supporting material to make composites with TiO2 to avoid aggregations of TiO2 particles, because the TiO2 particle sizes were reduced and had a better distribution in the Mt layers. Moreover, the significantly reduced fine particle sizes can improve the photocatalytic performance of TiO2 [11,12,13]. Mt is a 2:1 clay mineral, with a layered structure and exchangeable interlayer cations [14,15,16], which is sufficiently distributed in nature [16,17]. Consequently, Mt has excellent adsorption abilities, especially for positively charged substances with large relative surface areas. Besides this, Mt is relatively stable in a wide range of pHs. All of these properties make Mt a good supporting material to prepare composites [18,19,20]. However, it does not have any photocatalytic properties due to a large bandgap [21]. Iron is the fourth most abundant element in that layer. Moreover, iron species are one of the least toxic and least expensive substances that are photocatalytic in the visible region of the spectrum. However, the trace amounts of iron in natural minerals have been ignored. Many studies have suggested that iron doping in materials can give or facilitate the photocatalytic property of materials. In the layered double hydroxide (LDH) (or other clay) containing Fe(III)/Fe(II), a non-negligible promoting effect has been achieved in photocatalytic reactions [22,23,24]. Using density functional theory (DFT) calculation, a middle-gap electron trap state has been generated in the case of iron doping, thus improving the photocatalytic efficiency of the ZnTi-LDH/clay samples [25]. However, these studies did not discuss whether the Fe(III) was in the form of cation, metal oxide, metal hydroxide, or other forms. Moreover, the location of the Fe(III) in the composite was obscure.
Numerous studies have been applied on the Fe(III) doping of TiO2 since the Fe(III) ion in TiO2 can introduce a Fermi level as an electron donor or acceptor, narrowing the E g of the TiO2 and red shifting the irradiation adsorption of TiO2 [26,27,28]. It was also vigorously proposed that the metal undergoing transition with TiO2 generates oxygen vacancies, which act as the charge trapping sites promoting the generation of active radicals [29,30].
To better understand the role of clay and iron in such types of composites, two types of Mt-TiO2 composites with Fe(III) doping materials were synthesized and applied to the phenol degradation. Environmental pollution and destruction on a global scale is a growing concern today [31,32,33]. Refractory organics with aromatic structures are one of the most threatening contaminants that are toxic to human beings, microorganisms, animals, plants, and ecosystems [34,35]. There is an urgent requirement for the remediation of organic pollutants. Phenol contains one aromatic ring and one oxhydryl group. Phenolic compounds are ubiquitous and toxic in low concentrations [36]. More importantly, with phenol kept neutrally charged under pH 10 [37], the adsorption or repulsion from Mt can be prevented. Therefore, detecting the photocatalytic degradation of the materials in phenol can give clues about their photocatalytic capacity towards other organics.
In this paper, the distribution of Fe(III) on the Mt/TiO2 composites was controlled by changing the timing of when Fe(III) was added to the composites. Thus, the role of Fe(III) can be revealed based on its location in the composites. The whole synthesizing procedure was strictly controlled under pH 2 to inhibit any form of iron oxides or iron hydroxides. The Fe(III) should be always in the form of the cation. We have described the procedure for the preparation of Fe/Mt/TiO2, where Fe(III) was adsorbed in the surface of the composites, and xFe-Mt/(1 − x)Fe-TiO2, where Fe(III) was doped in the structure of the TiO2 in the composites. These two Fe(III)-doped Mt/TiO2 composites were applied for photocatalytic degradation of phenol. The photocatalytic mechanism for phenol degradation using the composites was proposed.

2. Materials and Methods

2.1. Materials

Na-Mt (Kunipia-F) with a cation exchange capacity (CEC) of 1.114 mmol/g (Bergaya and Vayer, 1997) was bought from Kunimine Industries Co. Ltd. (Tokyo, Japan). Through an elemental analysis (method of ME-ICP61, ALS Global Ltd., North Vancouver, Canada), the chemical formula of Kumipia-F is given by (Na0.97Ca0.08)+1.13 (Si7.68Al0.32) (Al2.94FeIII0.25FeII0.03Mg0.78) O20 (OH)4−1.13·nH2O. Iron(III) nitrate enneahydrate (Fe(NO3)3·9H2O, 99%), iron(III) chloride (FeCl3, 95%), sodium hydroxide (NaOH, 97.0+%), hydrochloric acid (HCl, 1.17), and nitric acid (HNO3, 1.38) were acquired from Wako Pure Chemical Industries, Ltd. (Osaka, Japan). Titanium(IV) chloride (TiCl4, 99%) and Millipore water with pH 6.31 were purchased from Kishida Chemical Co., Ltd. (Osaka, Japan) and Synergy UV (Merck, Darmstadt, Germany), respectively.

2.2. Preparation of Iron-Modified Mt and Clay/TiO2 Composites

To synthesize protonated Mt (H-Mt) and Fe(III)-doped Mt (Fe-Mt), Mt was added to HNO3 or Fe(III) (Fe (NO3)3·9H2O, 99%) solution which has a pH of 2 and was vigorously stirred at room temperature for 1 h (S/L = 10 g/L). Next, the H-Mt and Fe-Mt were centrifuged, rinsed, collected, lyophilized, ground, and sieved (<149 μm). Leveraging the sol–gel technique, Ti (OH)4/TiO2 nanoparticles were generated in aqueous media, following which TiCl4 and HCl were then added to Milli-Q water. The resultant solution contained 0.83 M TiCl4 and 1.0 M HCl, which was further stirred for 1 h and left to stand still for 6 h. Through hydrolysis, a nearly transparent, stable Ti (OH)4/TiO2 sol–gel was attained.
Before heterocoagulation, the acidity of Ti (OH)4/TiO2 sol was altered to pH = 2 with the addition of a NaOH solution since it has an original pH value of around 0. Next, the Sol–gel was added to 1% (g clay/100 mL of water) H-Mt suspension. Meanwhile, the Fe(III) eqv. to 0.274 mmol/g Mt was added for xFe-Mt/(1 − x)Fe-TiO2 samples exclusively. Both kinds of samples were vigorously stirred for 30 min. The theoretical concentration of TiO2 would be 30% (m/m). Heterocoagulated Fe/Mt/Ti(OH)4-TiO2 (Fe/Mt/TiO2) or xFe-Mt/(1 − x)Fe -Ti(OH)4-TiO2 (xFe-Mt/(1 − x)Fe-TiO2) precipitated after 20 h of sedimentation at 70 °C, 80 °C, and 90 °C. Fe(III) was added for Fe/Mt/TiO2 samples immediately after sedimentation. All the suspensions were stirred for another 1 h, followed by centrifugation at 8300 rpm for 30 min. The obtained solid substance was rinsed with Milli-Q water, freeze-dried for 24 h, ground, and sieved (<149 μm). Residual Fe(III) in the supernatant was detected by the inductively coupled plasma-optical emission spectroscopy (ICP-OES, Perkin Elmer 8500, Waltham, MA, USA). The samples synthesized at 70 °C were the main focus for comparison because the synthesis temperature did not influence the photocatalytic performance of the Fe/Mt/TiO2 composites (Figure S1).

2.3. Solid Characterization

The resultant composites were inspected with X-ray fluorescence (XRF, Shimadzu-EDX800, Kyoto, Japan). Powder X-ray diffraction (XRD) patterns of materials were recorded with an Ultima IV X-ray diffractometer (Rigaku, Akishima, Japan) by Cu Kα radiation produced at 40 kV and 40 mA, a divergence slit of 1.0 mm, an anti-scatter slit of 10 mm, and a receiving slit of 0.15 mm over a 2θ of 2.0–10°, with a step size of 0.02° and a scanning speed of 2°/min. X-ray photoelectron spectroscopy (XPS) was carried out on an ESCA 5800 system (Ulvac-PHI, Kanagawa, Japan) with a monochromatic Al Kα X-ray source at 200 W. A survey scan was carried out from 0 to 1000 eV with passing energy of 187.85 eV, narrow scans of N 1 s, as well as C 1 s orbitals, which were acquired using passing energies of 23.5 and 58.7 eV. Peak separation was performed with Casa XPS software (Version 2.3.16 PR 1.6) following the subtraction of a Shirley baseline. Binding energies (EB) of peaks were calibrated using EB [C 1s] = 284.6 eV. The scanning electron microscopy (SEM) and energy dispersive X-ray analysis (EDX) investigations were performed on a VE-9800 scanning electron microscope (Keyence, Osaka, Japan) with an accelerating voltage of 20 kV. The transmission electron microscopy (TEM) and EDX were applied using a JEM-2100HCKM, JEOL (Akishima, Japan). Diffuse reflectance spectroscopy (DRS) was conducted with a range of 200–800 nm on a UV-2450 spectrophotometer which has a diffuse–reflectance attachment with BaSO4 as a reference. Solid-state photoluminescence spectroscopy (PL) was conducted with a JASCO F-6600 spectrofluorometer. Electrochemical properties, such as photocurrent response and the electrochemical impedance spectroscopy (EIS) of composites, were examined by the 1280c AMETEK advanced measurement technology (Berkshire, United Kingdom). Later, 200 mg of Fe/Mt/TiO2 and xFe-Mt/(1 − x)Fe-TiO2 composites were included in a periodic acid–Schiff (PAS) cell which contained an electret condenser microphone and a quartz window on top under N2 flow saturated with methanol vapor for a minimum of 30 min. The light beam from a Xe lamp with a grating monochromator modulated at 80 Hz using a light chopper was emitted in the range of 650 nm–350 nm through the cell window to identify the PAS signal with a digital lock-in amplifier. The energy-resolved distribution of electron traps (ERDT) was obtained by figuring out the amount of photo absorption change for the accumulated electrons.

2.4. Photocatalytic Activity Test

The photocatalytic activities of synthesized products were tested for phenol degradation under the irradiation of a 300 W xenon lamp. Before the irradiation, 20 mg of the photocatalyst was suspended in 100 mL of 10 mg/L phenol aqueous solution in a photoreactor with a cooling water jacket outside. The suspensions were stirred at 500 rpm in darkness for 5 min to arrive at an adsorption–desorption equilibrium. In the irradiation process, approximately 1 mL of suspension was collected from the reaction cell at proper intervals and was subsequently filtered by a 0.45-μm cellulose acetate membrane filter for removal of the photocatalyst. Afterward, the solutions were examined by high-performance liquid chromatography (HPLC) [38]. The concentrations of phenol, together with its degradation products, were estimated by evaluating the absorption of these substances at a wavelength of 270 nm. Scavenger tests and the reusability test were carried out following the aforementioned procedures. For the scavenger test, 50 mmol of ethanol, isopropanol, and para-benzoquinone was added before the addition of photocatalytic materials.

3. Results

3.1. Characterizations

After the filtration of the synthesized Fe/Mt/TiO2 and xFe-Mt/(1 − x)Fe-TiO2, the remaining Fe(III) was detected by ICP-OES. The Fe(III) concentration was below the detection limit of the ICP, suggesting that almost all the added Fe(III) was doped in the composites. Therefore, the doped amount of Fe(III) in all the composites were the same and should not be the impact factor influencing the photocatalytic character of the samples. XRF was applied to calculate the weight percentage of the TiO2 phase in the whole composite (Table 1). When comparing the Fe/Mt/TiO2 and xFe-Mt/(1 − x)Fe-TiO2, the Fe/Mt/TiO2 always kept a slightly higher amount of TiO2 than xFe-Mt/(1 − x)Fe-TiO2, but the difference was not significant. The highest TiO2 content was obtained when the product was synthesized at 80 °C. When compared with clay/TiO2 composites synthesis without Fe(III) in previous research [39,40,41], the optimal temperature for the highest TiO2 yield was at 70 °C. The presence of Fe(III) in composites required a higher synthetic temperature for the highest TiO2 yield.
The XRD patterns of the original Mt, Fe(III) cation-doped Mt (Fe-Mt, synthesized at ambient temperature), TiO2, Fe/Mt/TiO2, and xFe-Mt/(1 − x)Fe-TiO2 synthesized at 70 °C were analyzed, and the XRD pattern of these samples was shown in Figure 1. The 001 peaks from Mt included the interlayer distance and the thickness of one layer (0.96 nm) [42]. The interlayer distances in the Fe-Mt, Fe/Mt/TiO2, and xFe-Mt/(1 − x)Fe-TiO2 were almost the same value (0.42/0.43 nm) when compared with the original Mt (0.25 nm), which suggested that only ion exchange of Fe(III) with the interlayer cations in Mt occurred during the synthesis of the composites. Additionally, the TiO2 should only be distributed on the surface of Mt. The hydrated ionic sizes of Fe(III) are 0.45 nm [42]. The smaller interlayer distances of the Mt in the composites, rather than the ionic sizes, may be distributed from the Van der Waals force among the aluminosilicate layers extruding from the hydrated shell of Fe(III), which are imperfectly shaped [42].
The only single anatase phase of TiO2 was presented for the pristine TiO2. For both Fe/Mt/TiO2 and xFe-Mt/(1 − x)Fe-TiO2, the 101 and 004 peaks at 25.4 and 37.9° (JCPDS No. 21–1272) of anatase phase were detected. Additionally, the 110 peak of rutile was formed at 28.3°. The representative 001, 003, and 101 reflection peaks of Mt in the composites were detected at 6.0–6.5, 19.8, and 35.2°, respectively [43]. The formation of TiO2 in the composites by different synthetic temperatures was elucidated, and their XRD patterns were presented in Figure S2. Peak separation was utilized to further analyze the XRD patterns in more detail in Figure 2. The typical 101 diffraction of anatase at 25.4° and the 110 diffraction of rutile between 28.2–28.4° were well fitted. The parameters after peak fitting were listed in Table S1. The large full width at half-maximum (FWHM) values for anatase and rutile related to the broad peaks of all the samples suggested a low crystallinity of the TiO2 phase on the Mt layers. The TiO2 content in xFe-Mt/(1 − x)Fe-TiO2 at three synthesized temperatures was higher than in Fe/Mt/TiO2, and the Fe(III) in TiO2 can improve the crystallization of the anatase phase. Increasing the temperature can improve the crystallization of anatase in Fe/Mt/TiO2 but depress it in xFe-Mt/(1 − x)Fe-TiO2 from 80 °C to 90 °C. As proven by ICP analysis, only the location of Fe(III) can dominate the growth of TiO2 phases on the aluminosilicate layers of Mt. For the following characterizations, the Fe/Mt/TiO2 and xFe-Mt/(1 − x)Fe-TiO2 synthesized at 70 °C were applied to compare with previous studies.
The morphology of the TiO2, Fe/Mt/TiO2, and xFe-Mt/(1 − x)Fe-TiO2 composites in μm scale was investigated by the SEM observation (Figure 3). The TiO2 particle sizes were significantly reduced in the Mt layer in the Fe/Mt/TiO2 and xFe-Mt/(1 − x)Fe-TiO2 composites; furthermore, the Mt stacking layers in Fe/Mt/TiO2 and xFe-Mt/(1 − x)Fe-TiO2 were even smaller than in the pure TiO2. From the SEM-EDX for both the Fe/Mt/TiO2 (Figure 3d–i) and xFe-Mt/(1 − x)Fe-TiO2 (Figure 3j–o), the TiO2 nanoparticles intensively covered the surface of the Mt particles. The TiO2 covering of the Mt layers in Fe/Mt/TiO2 in the nanometer scale was further observed through TEM-EDX, as illustrated in Figure 4. A higher intensity of Al distribution was observed in the Ti-empty/-lacking regions, which indicated the overlapping of TiO2 particles in the Mt layers. The low-intensity distribution of Al in the Ti-concentrated region should be attributed to the occluding of TiO2. The even distribution of Fe elements suggested the relative homogeneous distribution of Fe(III) on all of the Mt phase, TiO2 phase, and in the interface between the Mt and TiO2.
The electronic level and chemical composition of Fe/Mt/TiO2 and xFe-Mt/(1 − x)Fe-TiO2 were investigated by XPS and depicted in Figures S3 and S4. In the wide-scan spectrum for the Fe/Mt/TiO2 and xFe-Mt/(1 − x)Fe-TiO2 (Figures S3a and S4a), the dominant peaks attributed to the Ti 2p orbitals were raised from TiO2, and the dominant peaks attributed to the O 1s, Si 2p, and Al 2p orbitals were raised from Mt. The deconvolution peaks from the Ti 2p orbitals represented two peaks for both the Fe/Mt/TiO2 and xFe-Mt/(1 − x)Fe-TiO2 in Figures S3b and S4b. The peaks at 464.3–464.4 and 458.7 eV were attributed to the Ti (IV) 2p1/2 and 2p3/2 orbitals [44]. The deconvoluted spectra of Fe 2p (Figures S3c and S4c) for both composites showed two peaks that are assigned to Fe(III) 2p1/2 and 2p3/2 at 723.9–725.5 and 713.2–713.4 eV, respectively [45]. In the C 1s region of the Fe/Mt/TiO2 and the xFe-Mt/(1 − x)Fe-TiO2 (Figures S3d and S4d), the peaks at 288.6–289.0, 286.3–287.0, and 284.6 eV are from C = O, C—O, and C—C, respectively [46]. In the O 1s region of the Fe/Mt/TiO2 and xFe-Mt/(1 − x)Fe-TiO2 (Figures S3e and S4e), the peaks at 533.0–534.3, 531.7–531.9, and 530.1–531.0eV are from absorbed H2O on the surface, hydroxide bonds, and oxide bonds, respectively [47,48,49]. The peak raised at 102.5 in both composites, as is shown in Figures S3f and S4f, are both assigned to tetrahedral Si—O [50,51]. The valence band (VB) on top of the Fe/Mt/TiO2 and xFe-Mt/(1 − x)Fe-TiO2 was estimated by drawing the straight tangent line to the VB spectrum of the samples in Figure 5 [52,53], and the values are 1.72 and 1.95 eV, respectively.

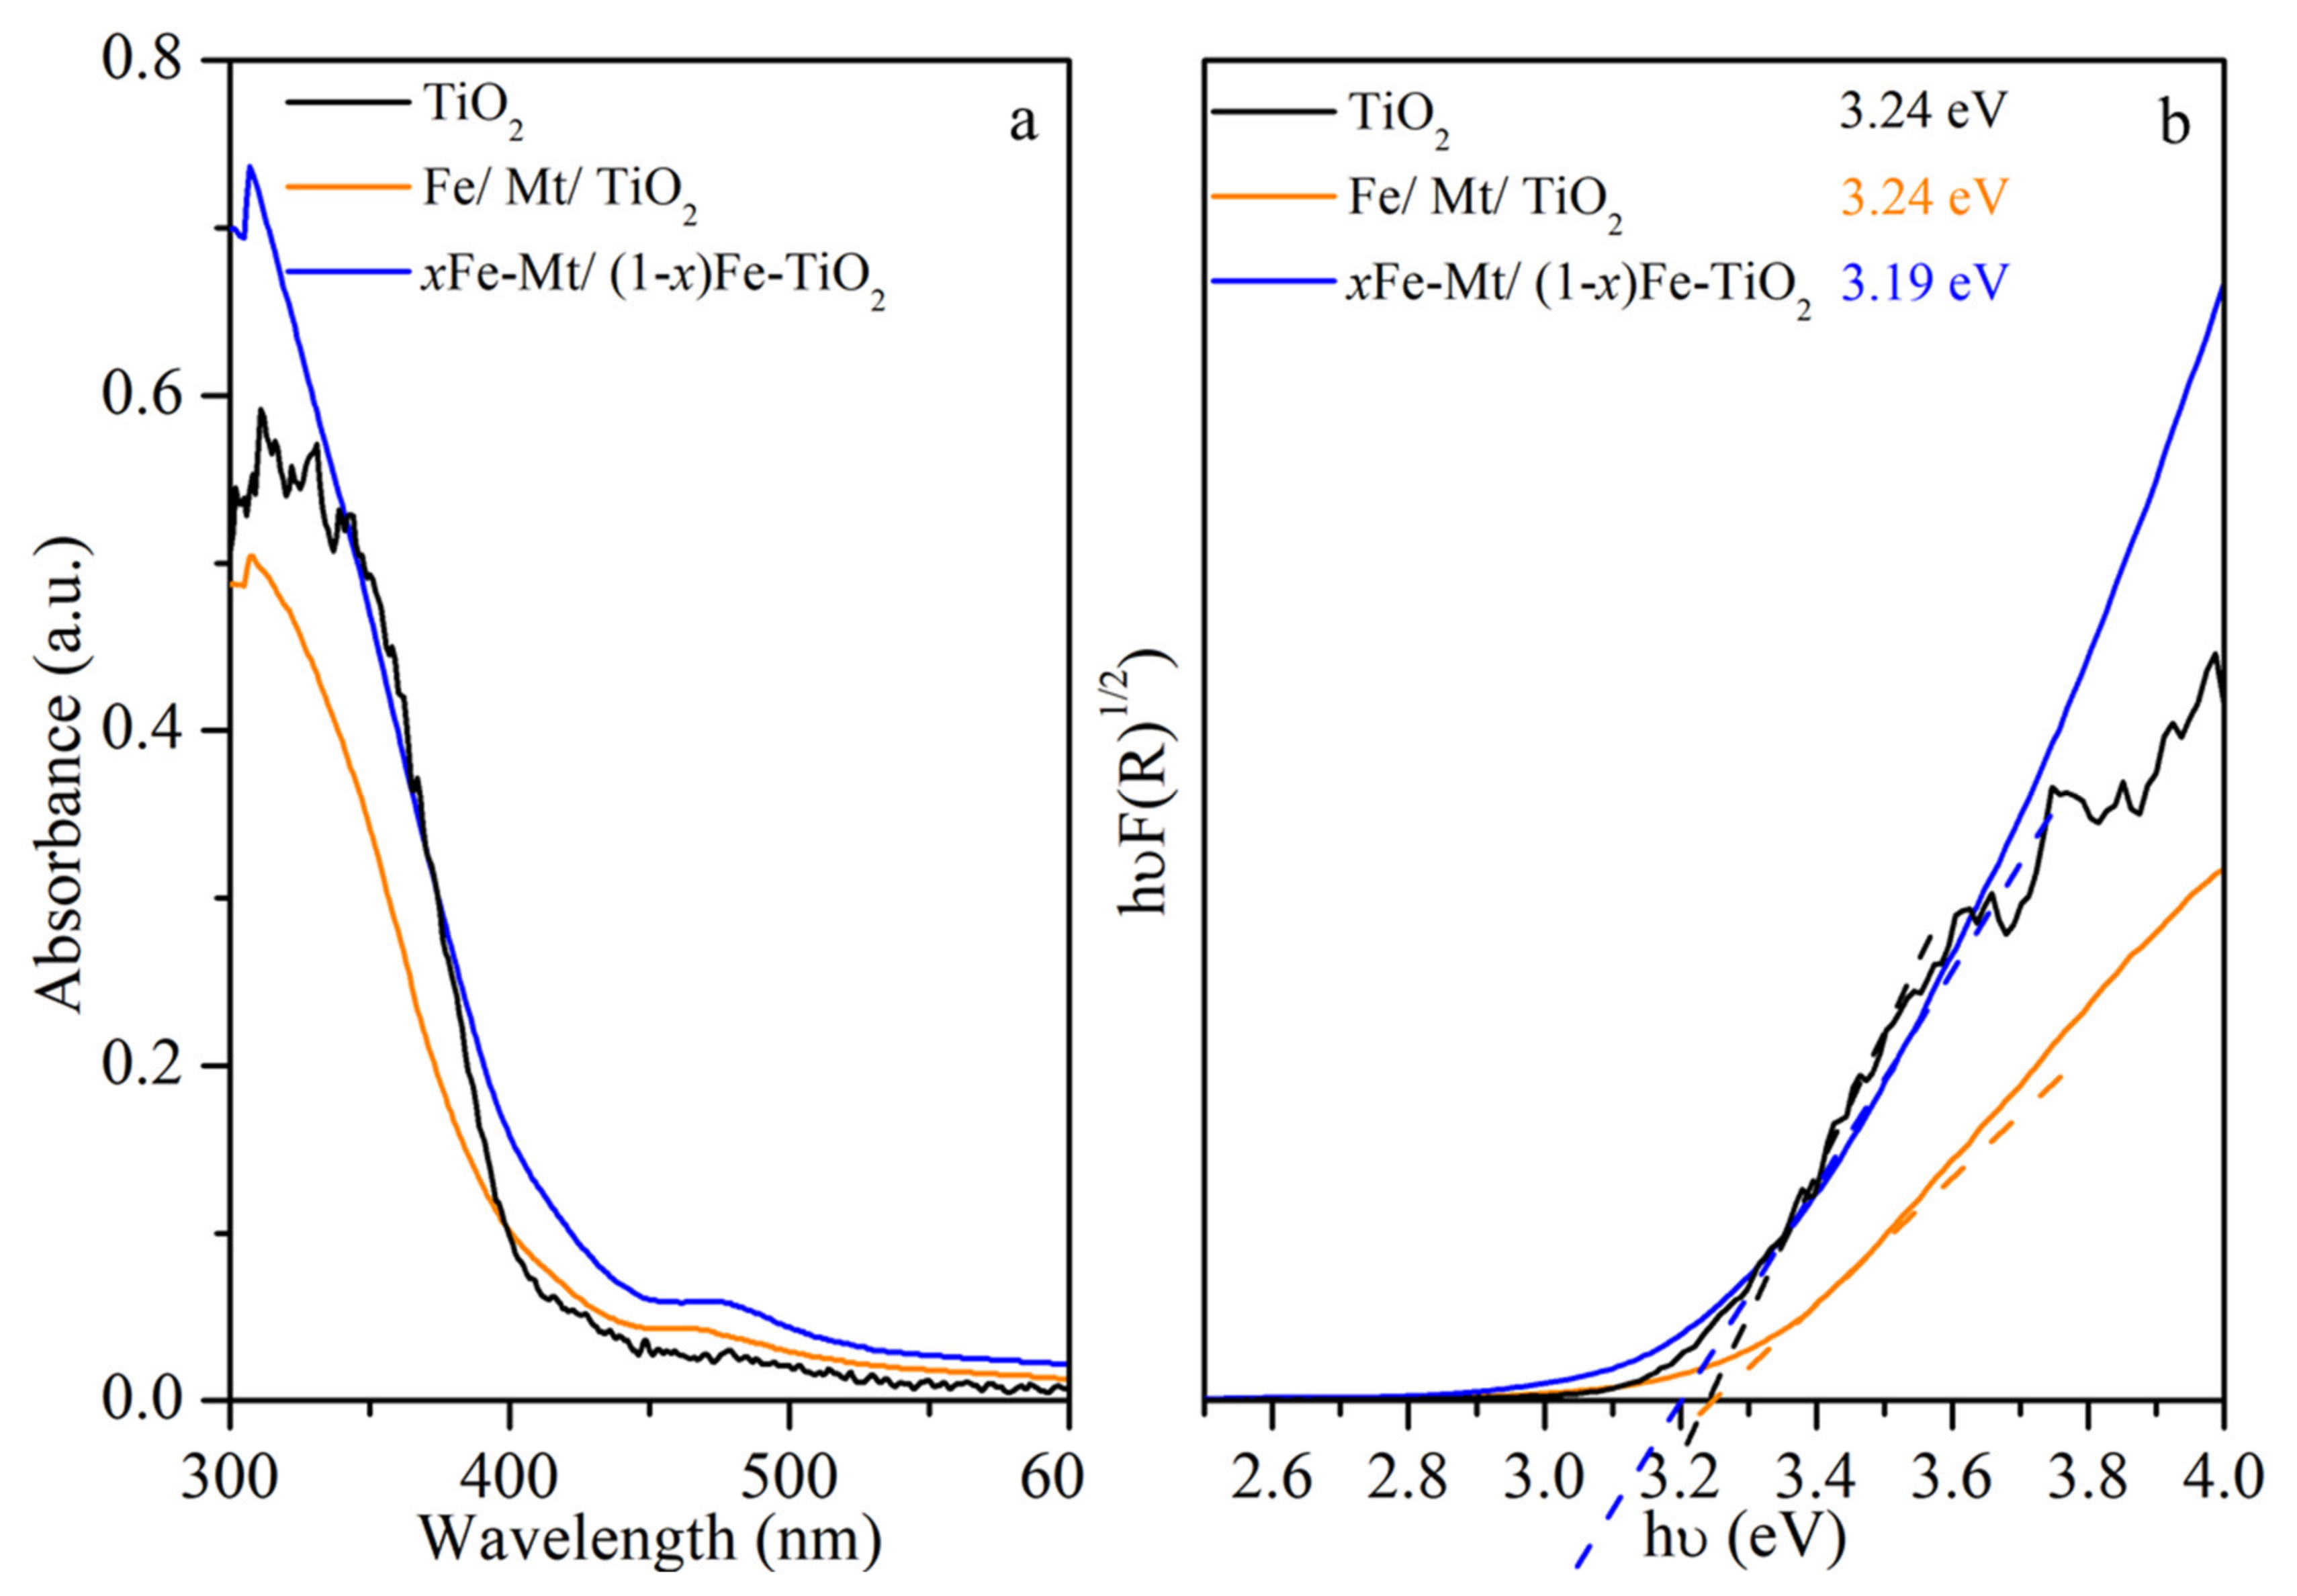
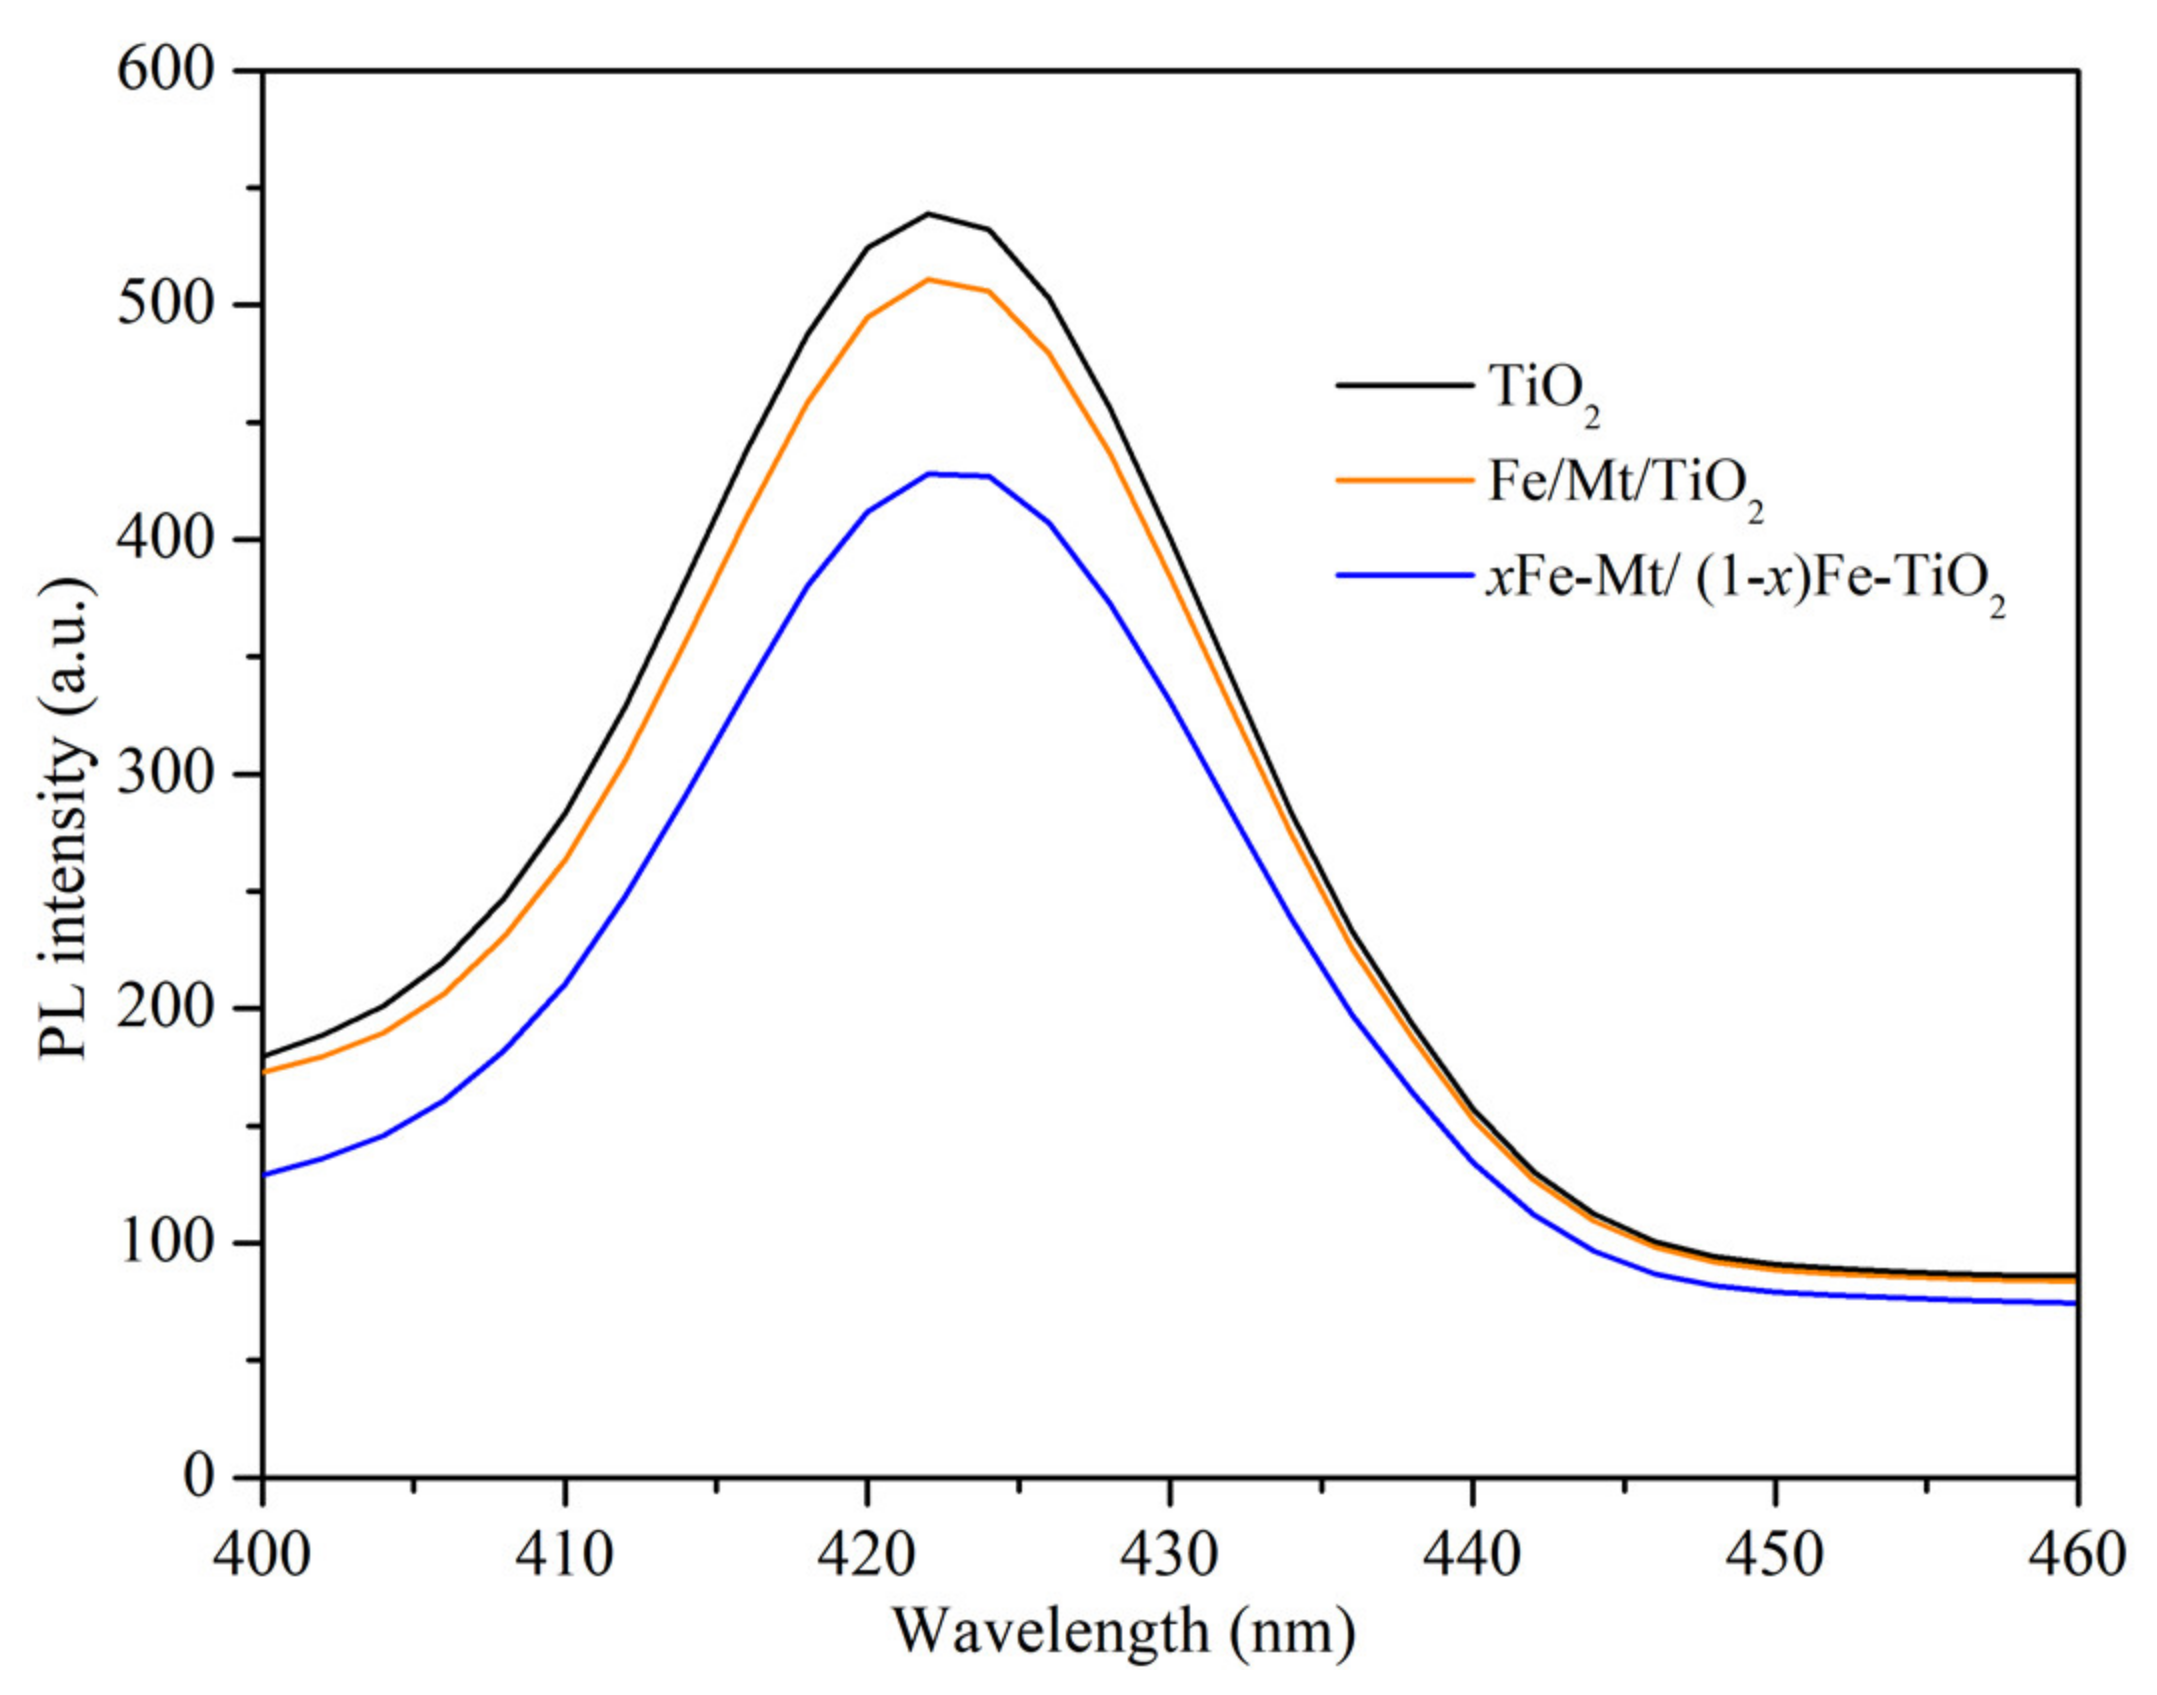
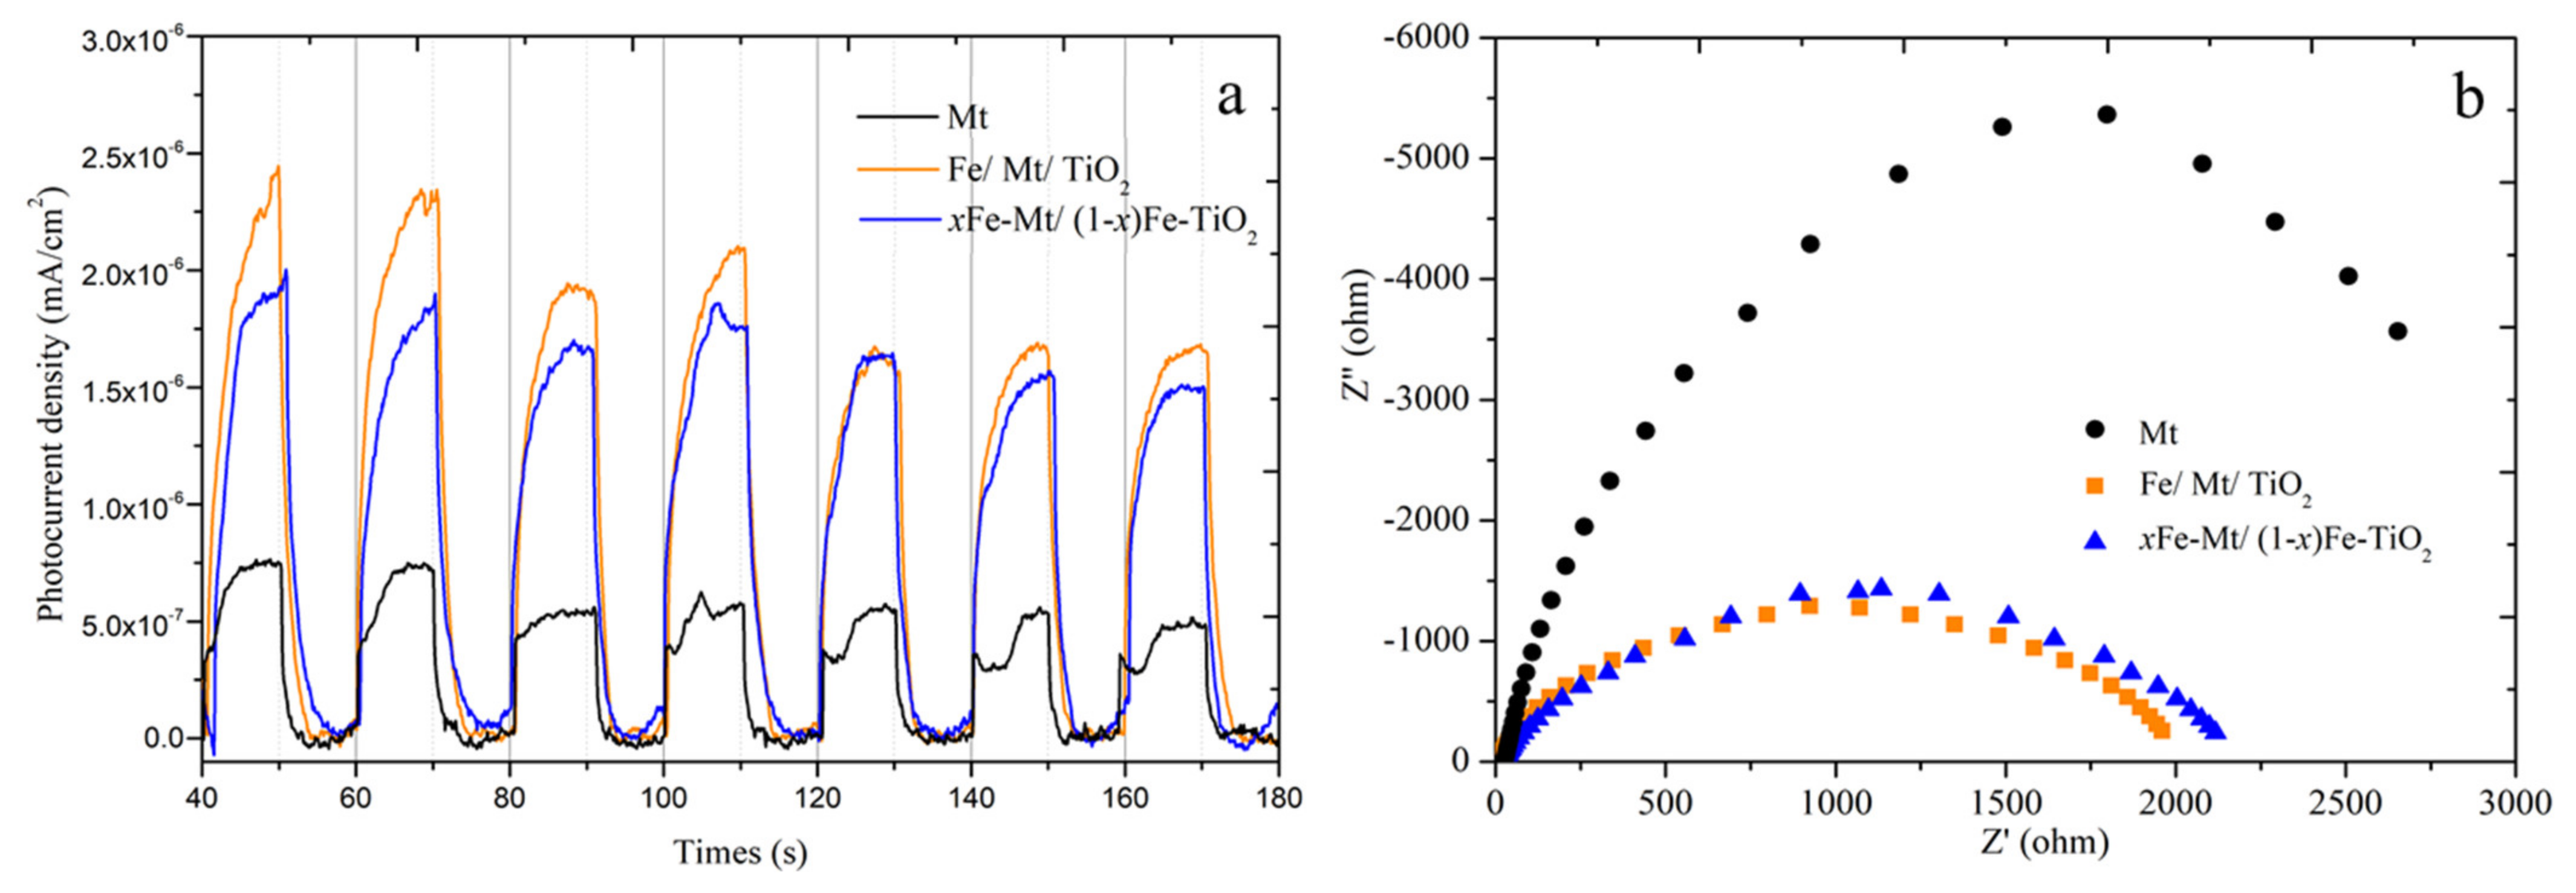
3.2. Investigation of Optical and Charge Separation Properties

As indicated by the UV-DRS spectra of the TiO2, Fe/Mt/TiO2, and xFe-Mt/(1 − x)Fe-TiO2 (Figure 6a), it can be determined that both composites exhibited higher absorbance in the visible light region compared to pure TiO2 due to the additional Mt and Fe(III) in the composites. Compared to Fe/Mt/TiO2, the xFe-Mt/(1 − x)Fe-TiO2 composite showed a slight red shift in the absorption edge, and such an extension in the absorption band influenced the optical properties of samples significantly. By using the Tauc plotting Kubelka–Munk function versus energy, the optical bandgap energy ( E g ) of Fe-Mt can be evaluated, according to Equation (1) (Figure 6b) [54,55,56]:
α h v = k h v E g n / 2
where α , h , v , k , and E g denote the absorption coefficient, Planck constant, light frequency, proportionality constant, and bandgap energy, respectively. The value of n is dependent on the type of optical transition of the measured semiconductor (for direct transition, n = 1; for indirect transition, n = 4 [57]). For TiO2, Fe/Mt/TiO2, and xFe-Mt/(1 − x)Fe-TiO2, the calculated bandgap values of samples were estimated to be approximately 3.24, 3.24, and 3.19 eV,, respectively (Figure 6b). The lower E g of the xFe-Mt/(1 − x)Fe-TiO2 may be due to the generation of a new electronic level of Fe(III) in the structure of the TiO2 [58,59].
The recombination rate of e-h+ pairs was measured using PL (Figure 7). The higher PL intensity of TiO2 compared to the other two composites suggested that the better charge separation efficiency on the composite was mainly due to the effects of Mt. In comparison with the Fe/Mt/TiO2, xFe-Mt/(1 − x)Fe-TiO2 showed a decreased luminous intensity, which may be because the doped Fe(III) in the structure of the TiO2 generated the middle-gap state to avoid the recombination of the e-h+ pairs in the TiO2.
Furthermore, with the transient photocurrent response measurements and EIS to relate with the photocatalytic phenol degradation activity, the transfer and production of electrons in the TiO2, Fe/Mt/TiO2, and xFe-Mt/(1 − x)Fe-TiO2 were investigated. As exhibited in Figure 8a, the photocurrent density was ranked as Fe/Mt/TiO2 > xFe-Mt/(1 − x)Fe-TiO2 > TiO2. Moreover, the EIS spectra of the TiO2, Fe/Mt/TiO2, and xFe-Mt/(1 − x)Fe-TiO2 were measured, as shown in Figure 8b. According to the results, a smaller radius of the EIS Nyquist diagram was discovered in the Fe/Mt/TiO2, which suggested a lower charge transfer resistance to improve the photocatalytic activity.

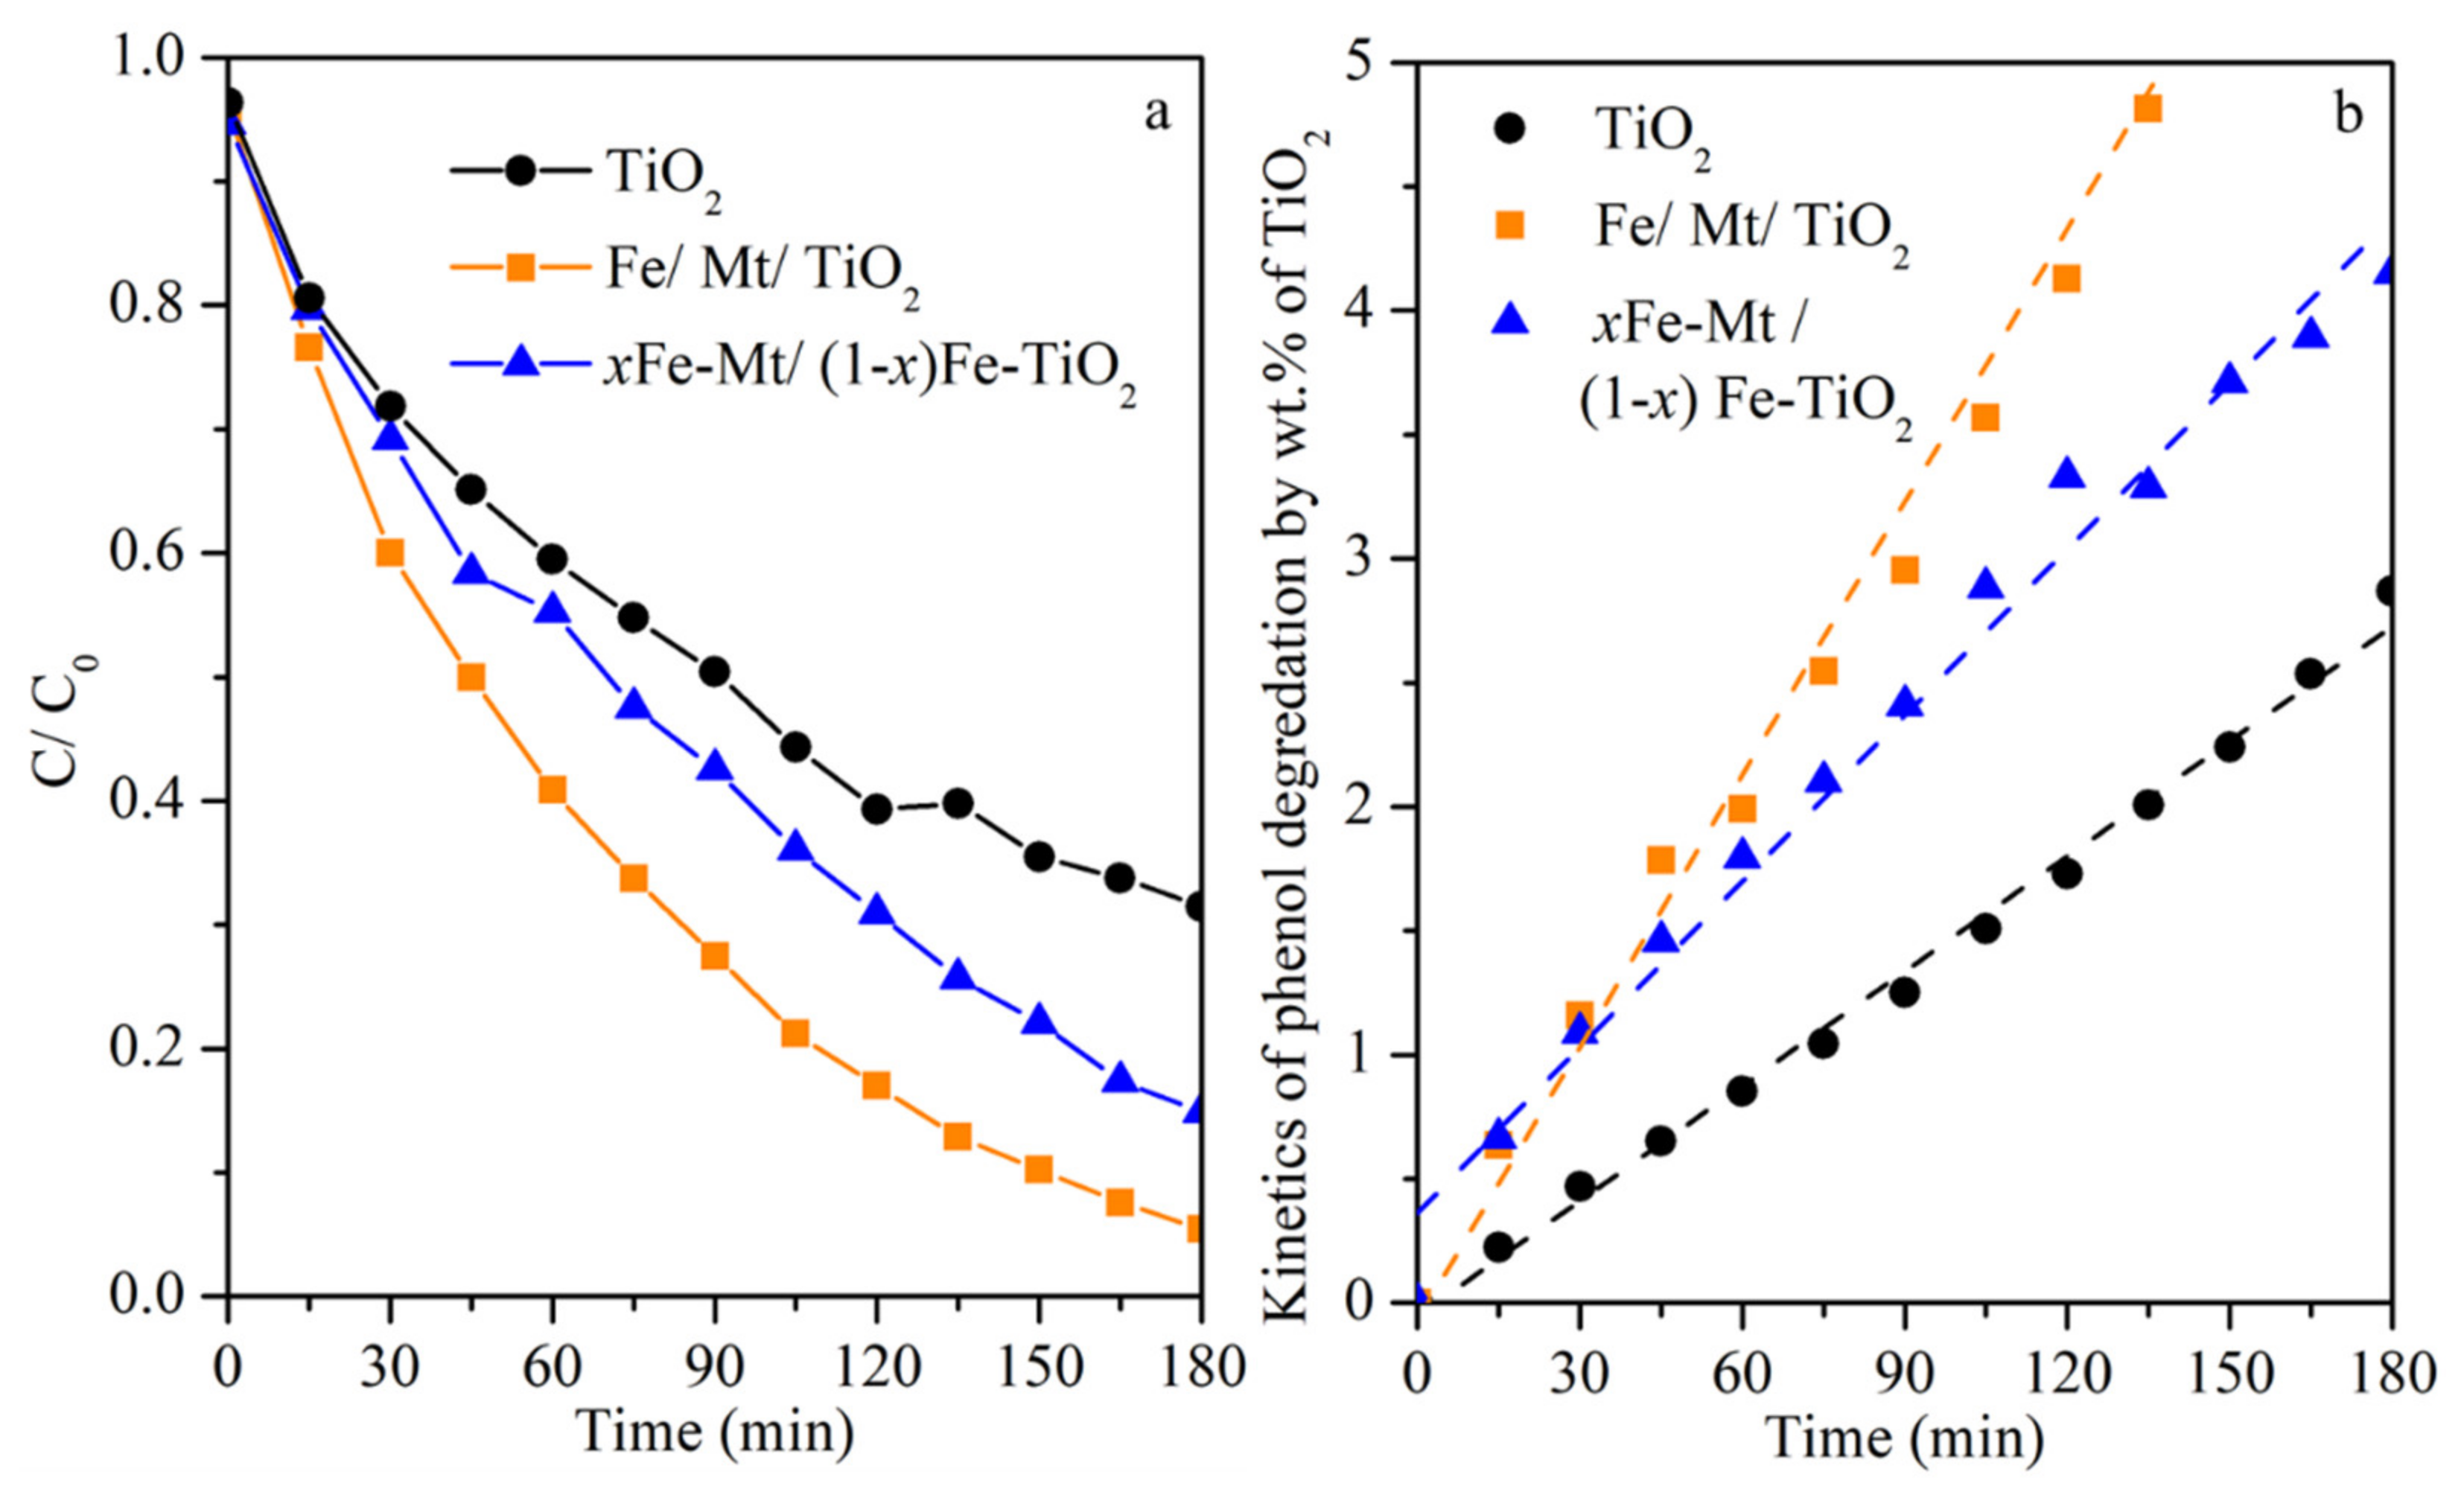
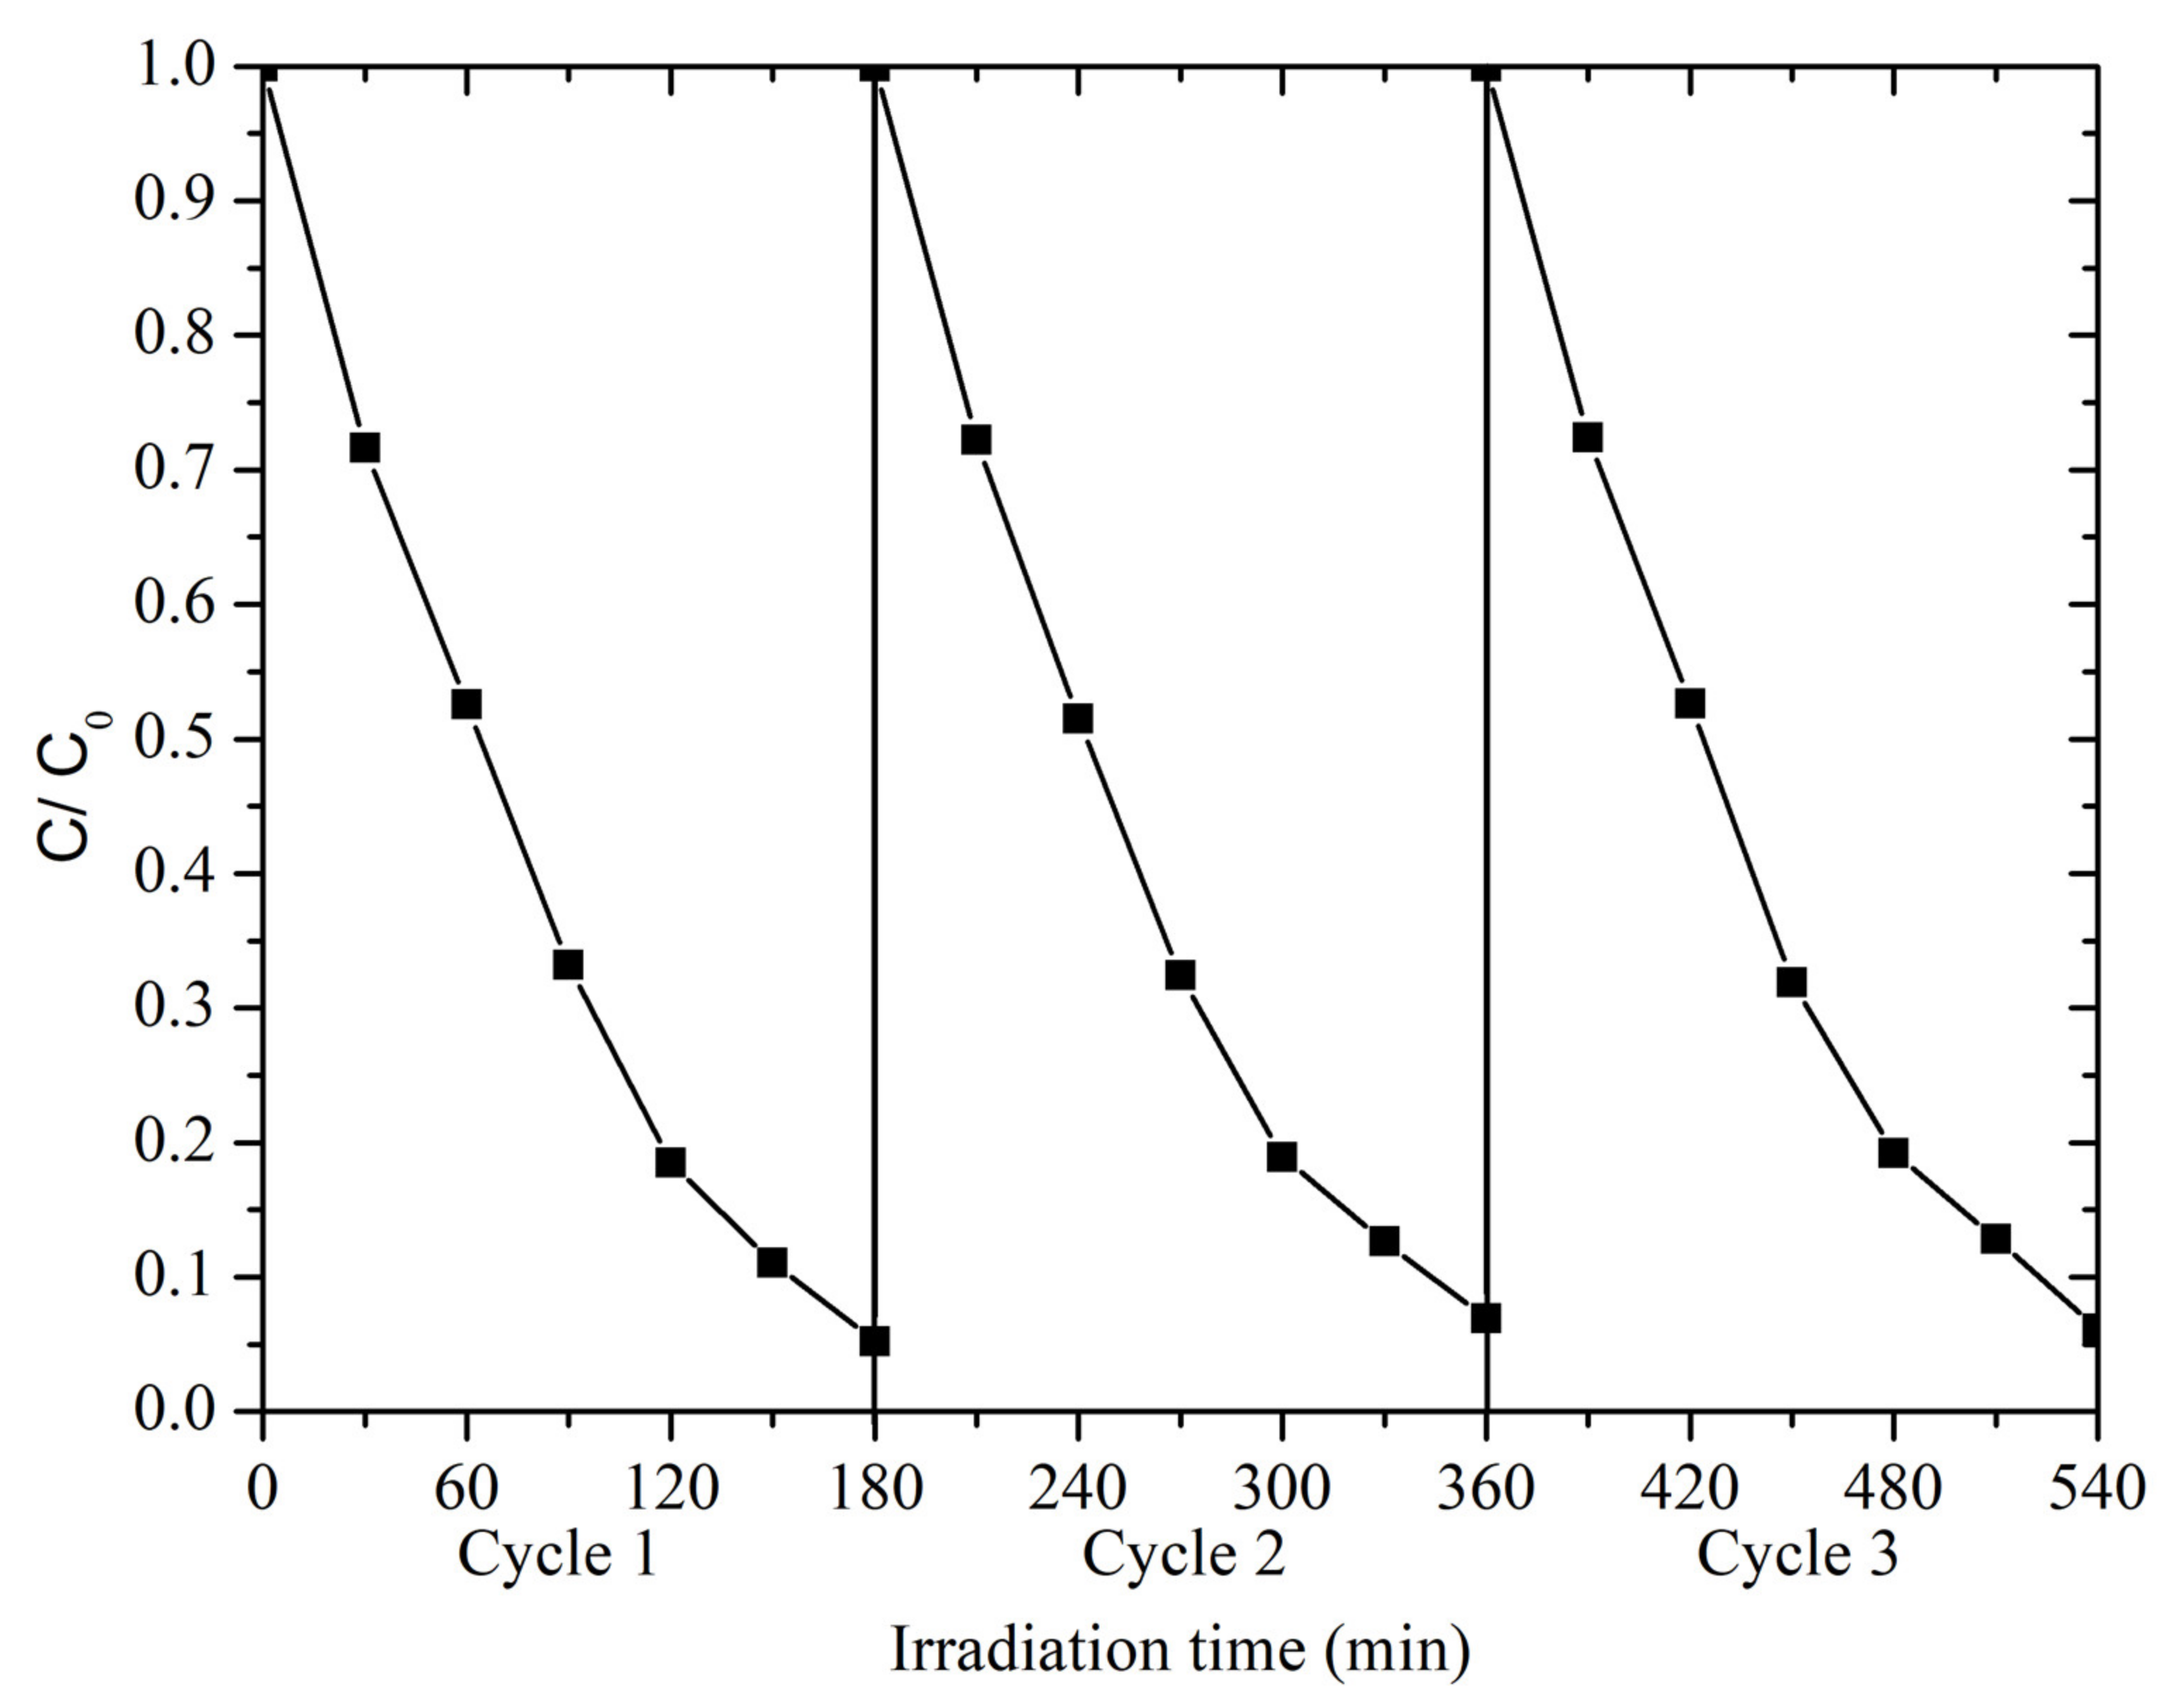
3.3. Photocatalytic Activity

Figure 9a presents the photocatalytic removal of phenol as a function of reaction time using the TiO2, Fe/Mt/TiO2, and xFe-Mt/(1 − x)Fe-TiO2. In the dark conditions, a slight adsorption of phenol was observed for all the samples. On the other hand, the adsorption reached equilibrium within the first 5 min, and it predominantly occurred on the surface of the samples via physical adsorption. In comparison, the Fe/Mt/TiO2 showed the highest photocatalytic performance of 94.6% on phenol degradation for 3 h. The adsorbed Fe(III) on the surface of the composite and the interlayer of Mt can improve the photocatalytic activity. Photocatalytic reduction kinetics of phenol fitted well to pseudo-first-order kinetics (Equation (2)) (Figure 9b) [60]:
ln ( C / C 0 ) = k t
where C and C 0 (mmol/g) refer to the residual and initial concentrations of phenol and parameter k (min−1) marks the rate constant of the pseudo-first-order model. The parameters for the pseudo-first-order were listed in Table S1. The correlation coefficient (R2) for the pseudo-first-order is more than 0.980 for all three samples, and the chi-square for all the samples is of −4 order of magnitude. Therefore, the pseudo-first-order model can predict kinetics. The rate constants are 0.015, 0.022, and 0.037 min−1 for the TiO2, Fe/Mt/TiO2, and xFe-Mt/(1 − x)Fe-TiO2, respectively. The Fe/Mt/TiO2 and xFe-Mt/(1 − x)Fe-TiO2 showed superb efficiency. Most importantly, the xFe-Mt/(1 − x)Fe-TiO2 had a higher capacity than the Fe/Mt/TiO2, which is consistent with the photocurrent, but the impedes the results and goes against the DRS and PL results.
The reusability test was applied (Figure 10) to investigate the chemical stability of the Fe/Mt/TiO2, which possessed the better photocatalytic performance during the photocatalytic oxidation of phenol. High photocatalytic degradation of phenol in the Fe/Mt/TiO2 was maintained over 93.1% for three cycles. The slight reduction of the photocatalytic performance after the first cycle should be due to the mass loss of the samples during washing.

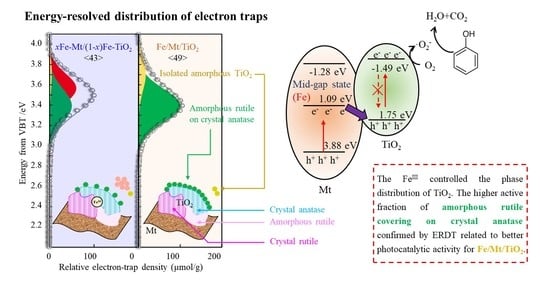
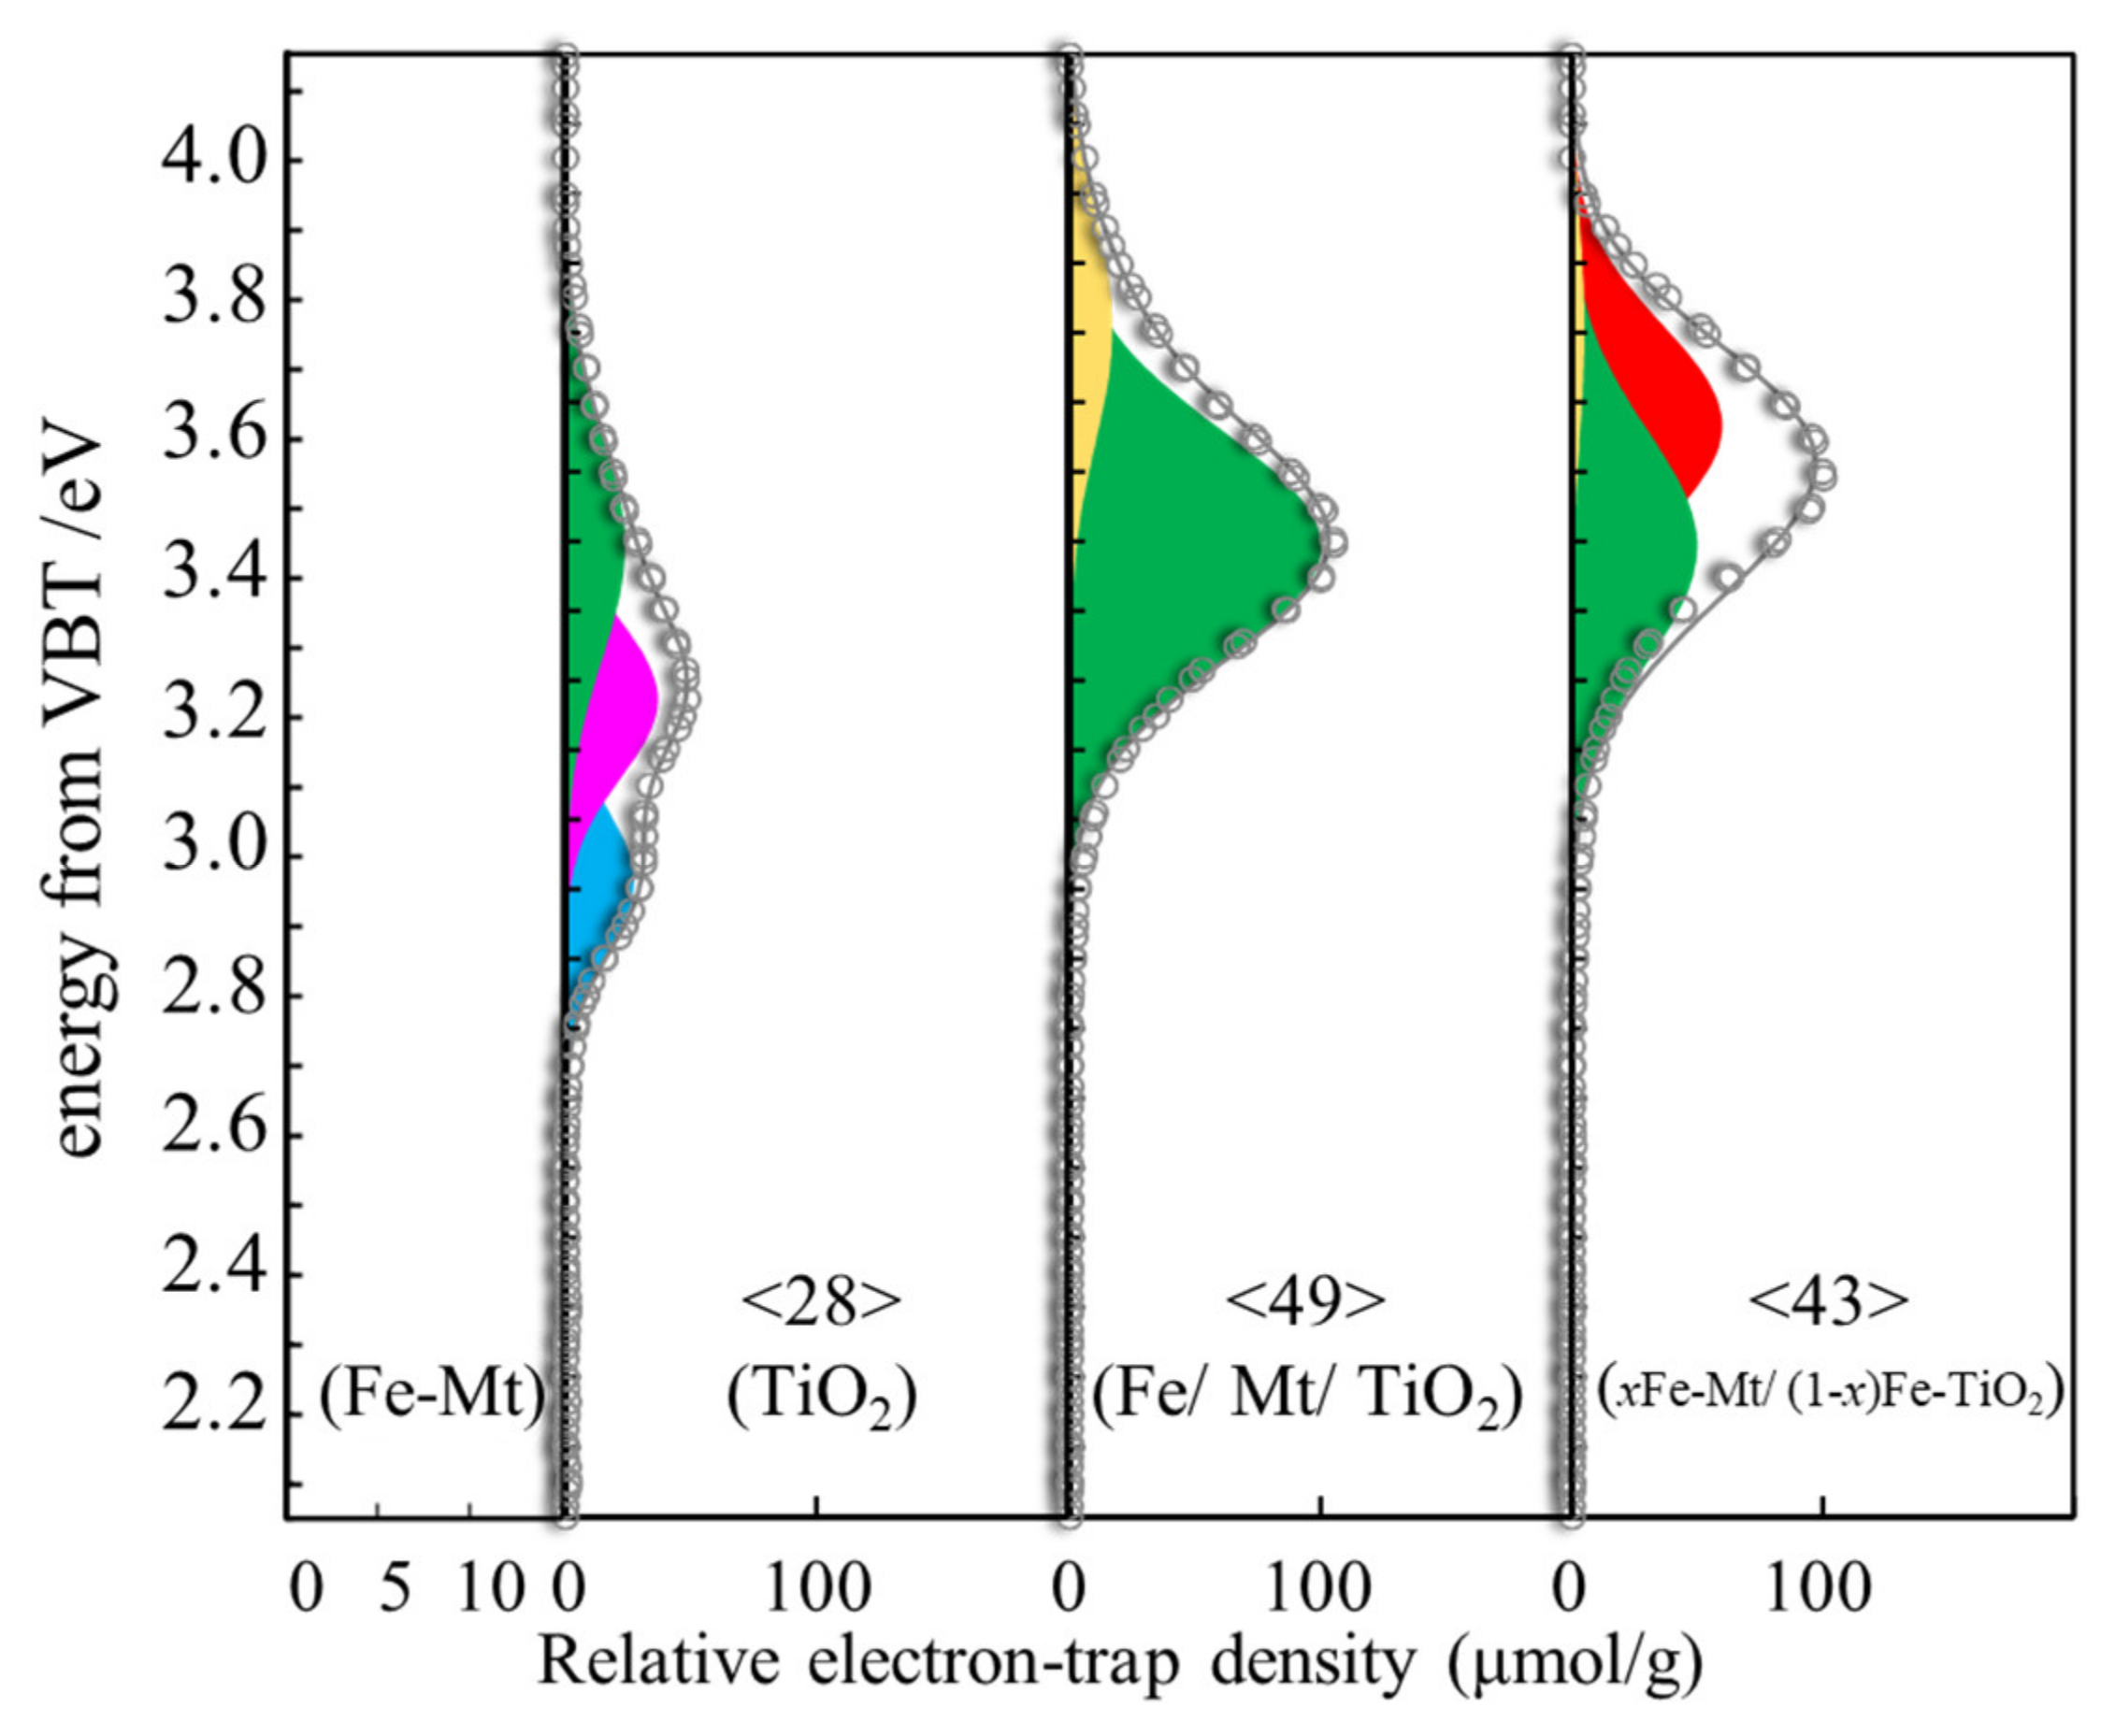
3.4. ERDT Patterns of TiO2, Fe/Mt/TiO2, and xFe-Mt/(1 − x)Fe-TiO2

Reversed double-beam photoacoustic spectroscopy (RDB-PAS) was utilized to investigate the surface electronic properties of Fe-Mt, TiO2, Fe/Mt/TiO2, and xFe-Mt/(1 − x)Fe-TiO2. The obtained ERDT could indicate the surface photocatalytic properties of the measured samples [61]. Figure 11 shows the ERDT patterns for Fe-Mt, TiO2, Fe/Mt/TiO2, and xFe-Mt/(1 − x)Fe-TiO2, and the parameters are listed in Table 2. This technique can be applied only to n-type semiconductors; thus, Fe-Mt had no electron trap (ETs) on ERDT because Fe(III) generated a Fermi level as an electron donor which is a p-type characteristic of semiconductor. The energy-reversed distribution of electron traps emerged at energy ranges of 2.20–4.00 eV for the TiO2, Fe/Mt/TiO2, and xFe-Mt/(1 − x)Fe-TiO2. This suggested that there were TiO2 phases covering the surfaces of the composites. The electron trapping patterns of TiO2 were fitting using peak separation. Three peaks at 2.96, 3.22, and 3.44 eV were assigned as crystal rutile, amorphous rutile, and amorphous rutile covered with crystal anatase, respectively. The dominance of the amorphous phase was consistent with the low crystallinity of the TiO2 which was suggested in XRD results (Figure 2 and Table S1). The ERDT patterns of the Fe/Mt/TiO2 and xFe-Mt/(1 − x)Fe-TiO2 were also separated. The peak at 3.44 eV represents the amorphous rutile covered in crystal anatase which also emerged in the pattern of the TiO2. Crystal TiO2 should be the dominant fraction for photocatalytic reaction, and the amorphous phase may gain the photocatalytic activity the presence of crystal phase in the TiO2 [62,63,64]. The crystal anatase in both composites was covered by amorphous TiO2. Only the amorphous TiO2 directly in contact with the crystal phase should be responsible for photocatalytic activity. The intensity of this kind of rutile peak in the Fe/Mt/TiO2 (85.4%) was twice of that in the xFe-Mt/(1 − x)Fe-TiO2 (43.5%). Therefore, this result can explain why the xFe-Mt/(1 − x)Fe-TiO2 showed lower photocatalytic activity for the degradation of phenol than the Fe/Mt/TiO2. Both electron accumulation peaks at 3.62 and 3.76 eV were attributed to isolated amorphous TiO2 that will be not in contact with the crystal phase of the TiO2. This fraction of the TiO2 on the composite was expected to have negligible photocatalytic activity. Besides, the total intensity of the isolated TiO2 phase on the xFe-Mt/(1 − x)Fe-TiO2 was much higher than on the Fe/Mt/TiO2 and may overlap with the photocatalytic active amorphous rutile, depressing the charge generating and transferring.

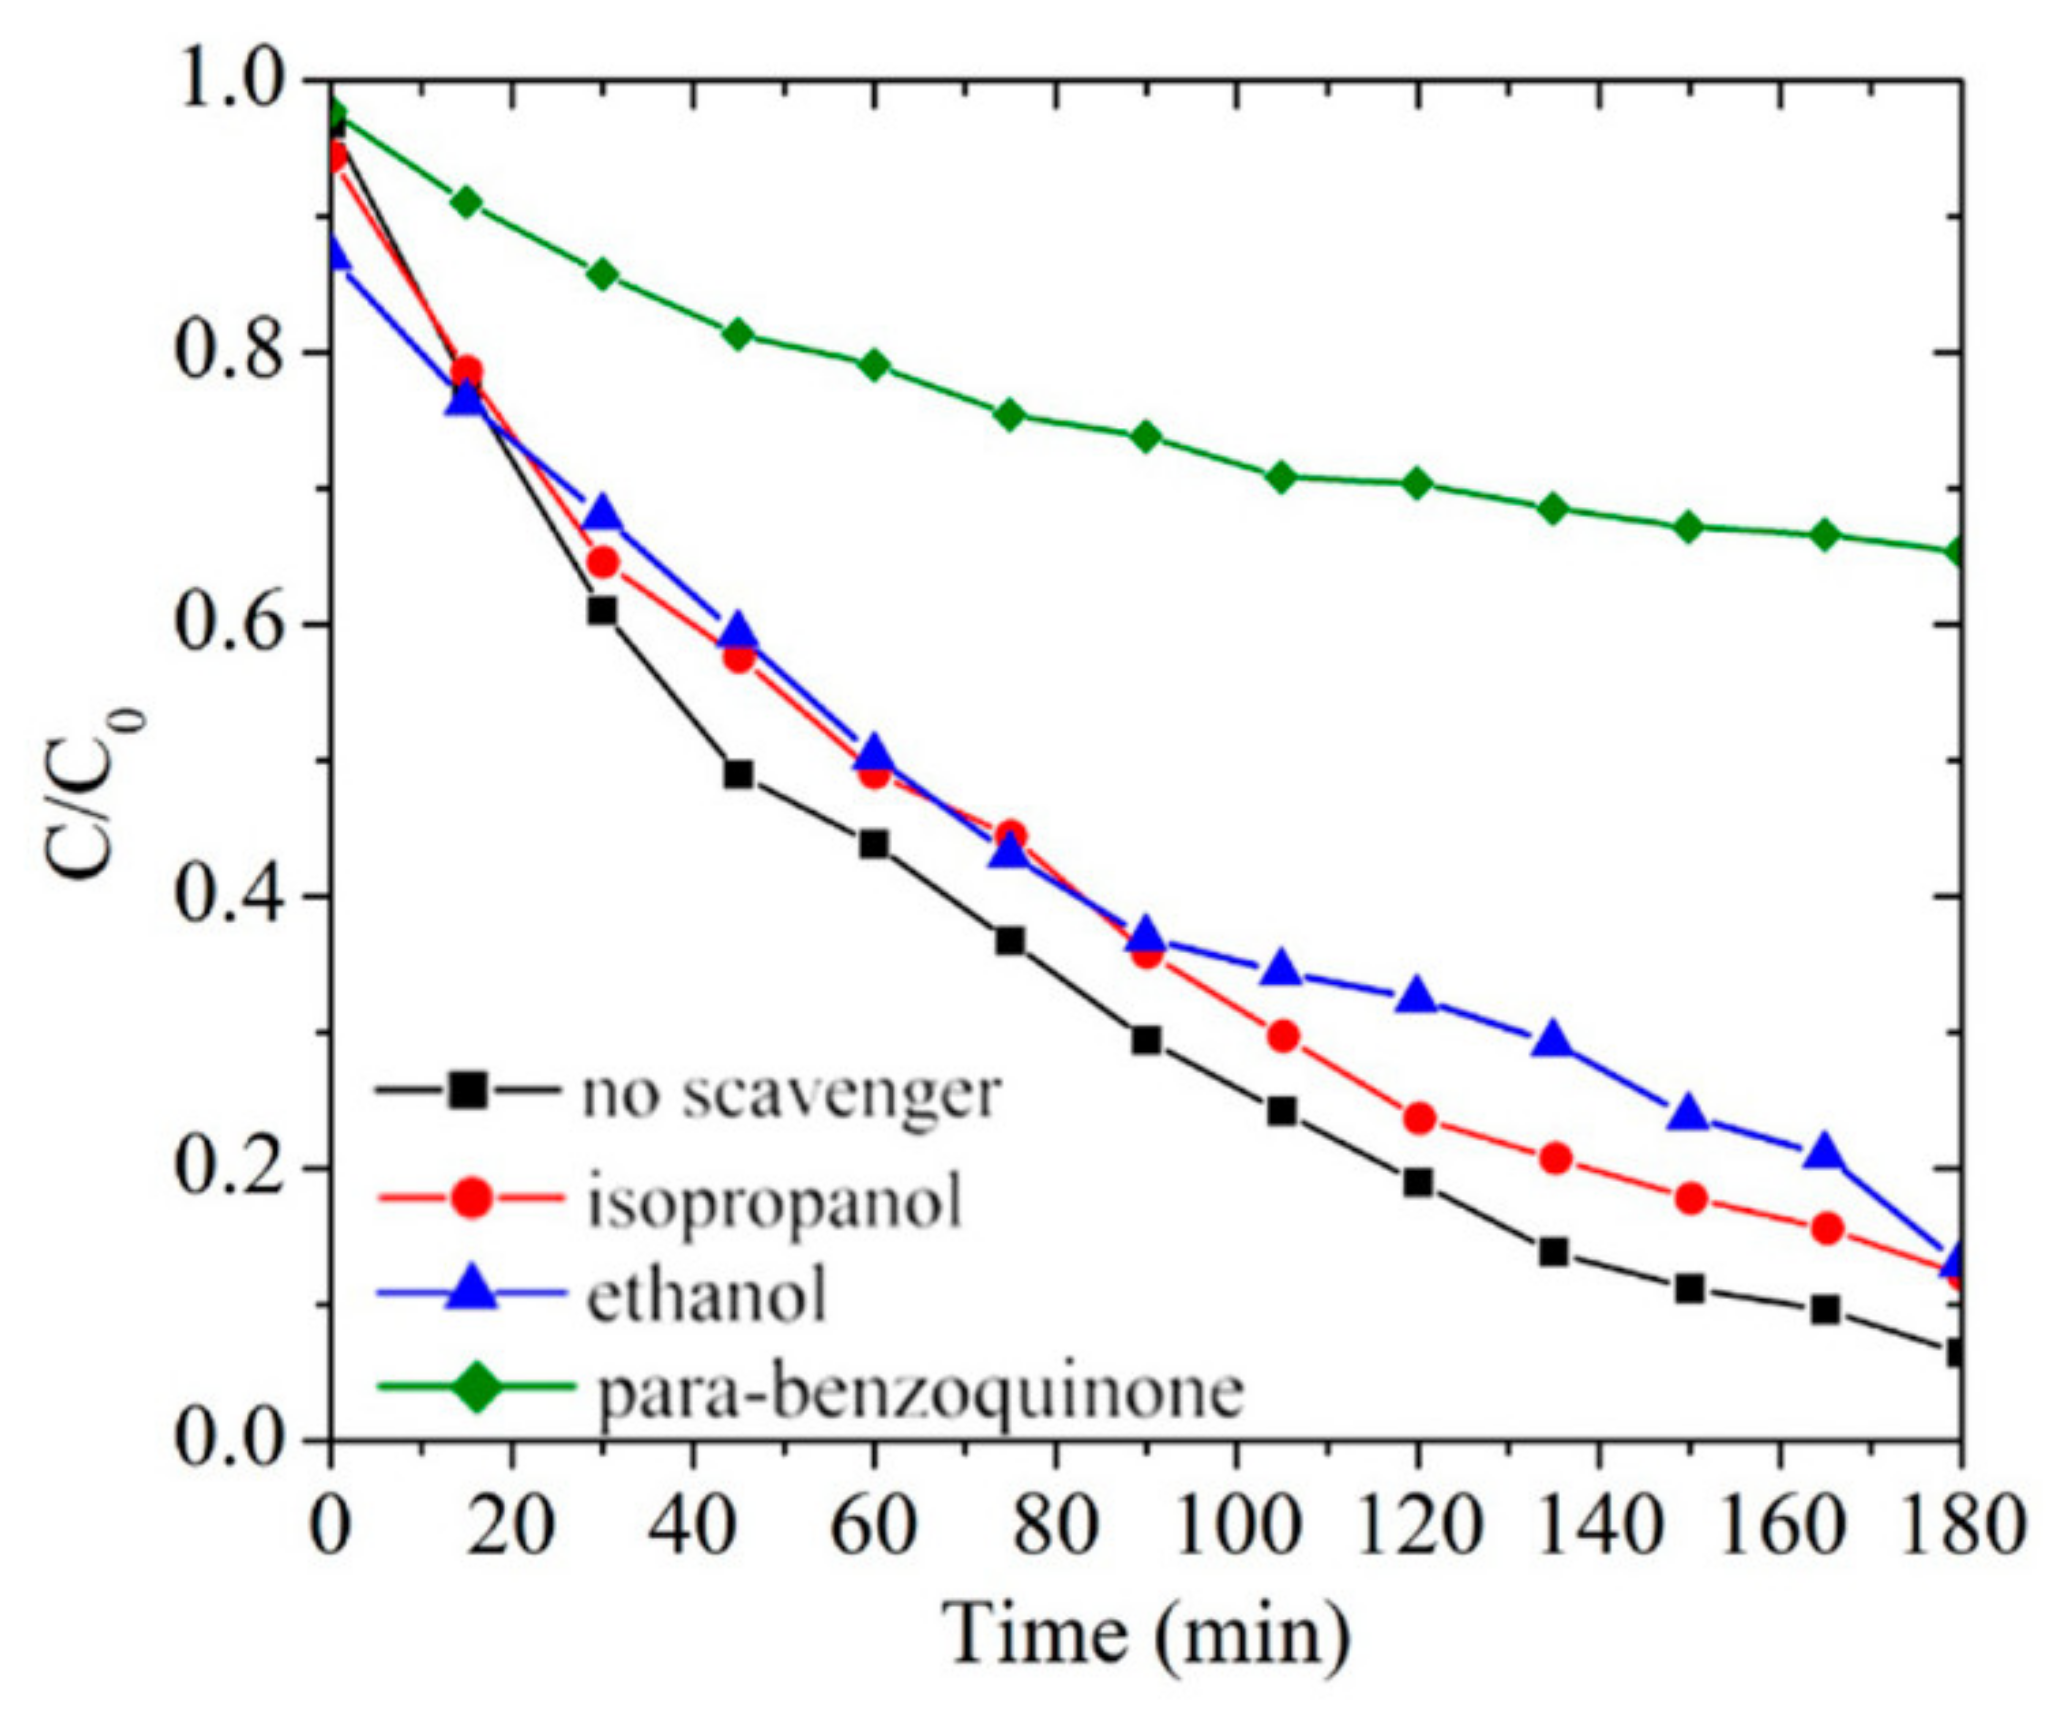
3.5. Radical Scavenger Tests

During the progress of the light irradiation, the radicals generated are responsible for the photocatalytic reaction. To detect which radical can be predominantly generated throughout the photocatalytic reaction, radical scavengers were added during the photocatalytic degradation of phenol in the Fe/Mt/TiO2, which is the best photocatalyst (Figure 12). Ethanol is the h+ scavenger, and isopropanol is the ∙OH scavenger. The addition of both ethanol and isopropanol had a slight impact on the photocatalytic performance of the Fe/Mt/TiO2, with a rate constant of 0.014 for both. It means that the h+ and ∙OH should not be the main radical sources for the photocatalytic reaction. A significant depression for the photocatalytic degradation of phenol with the rate constant of 0.010 was observed with the addition of para-benzoquinone, which is the ∙O2 radical scavenger. Therefore, ∙O2 is the dominant radical for the photocatalytic degradation of phenol. This phenomenon is reasonable because the VB calculated from XPS results was higher than the reduction potential of the ∙OH production. Thus, the ∙OH radical should not be directly generated by the Fe/Mt/TiO2.

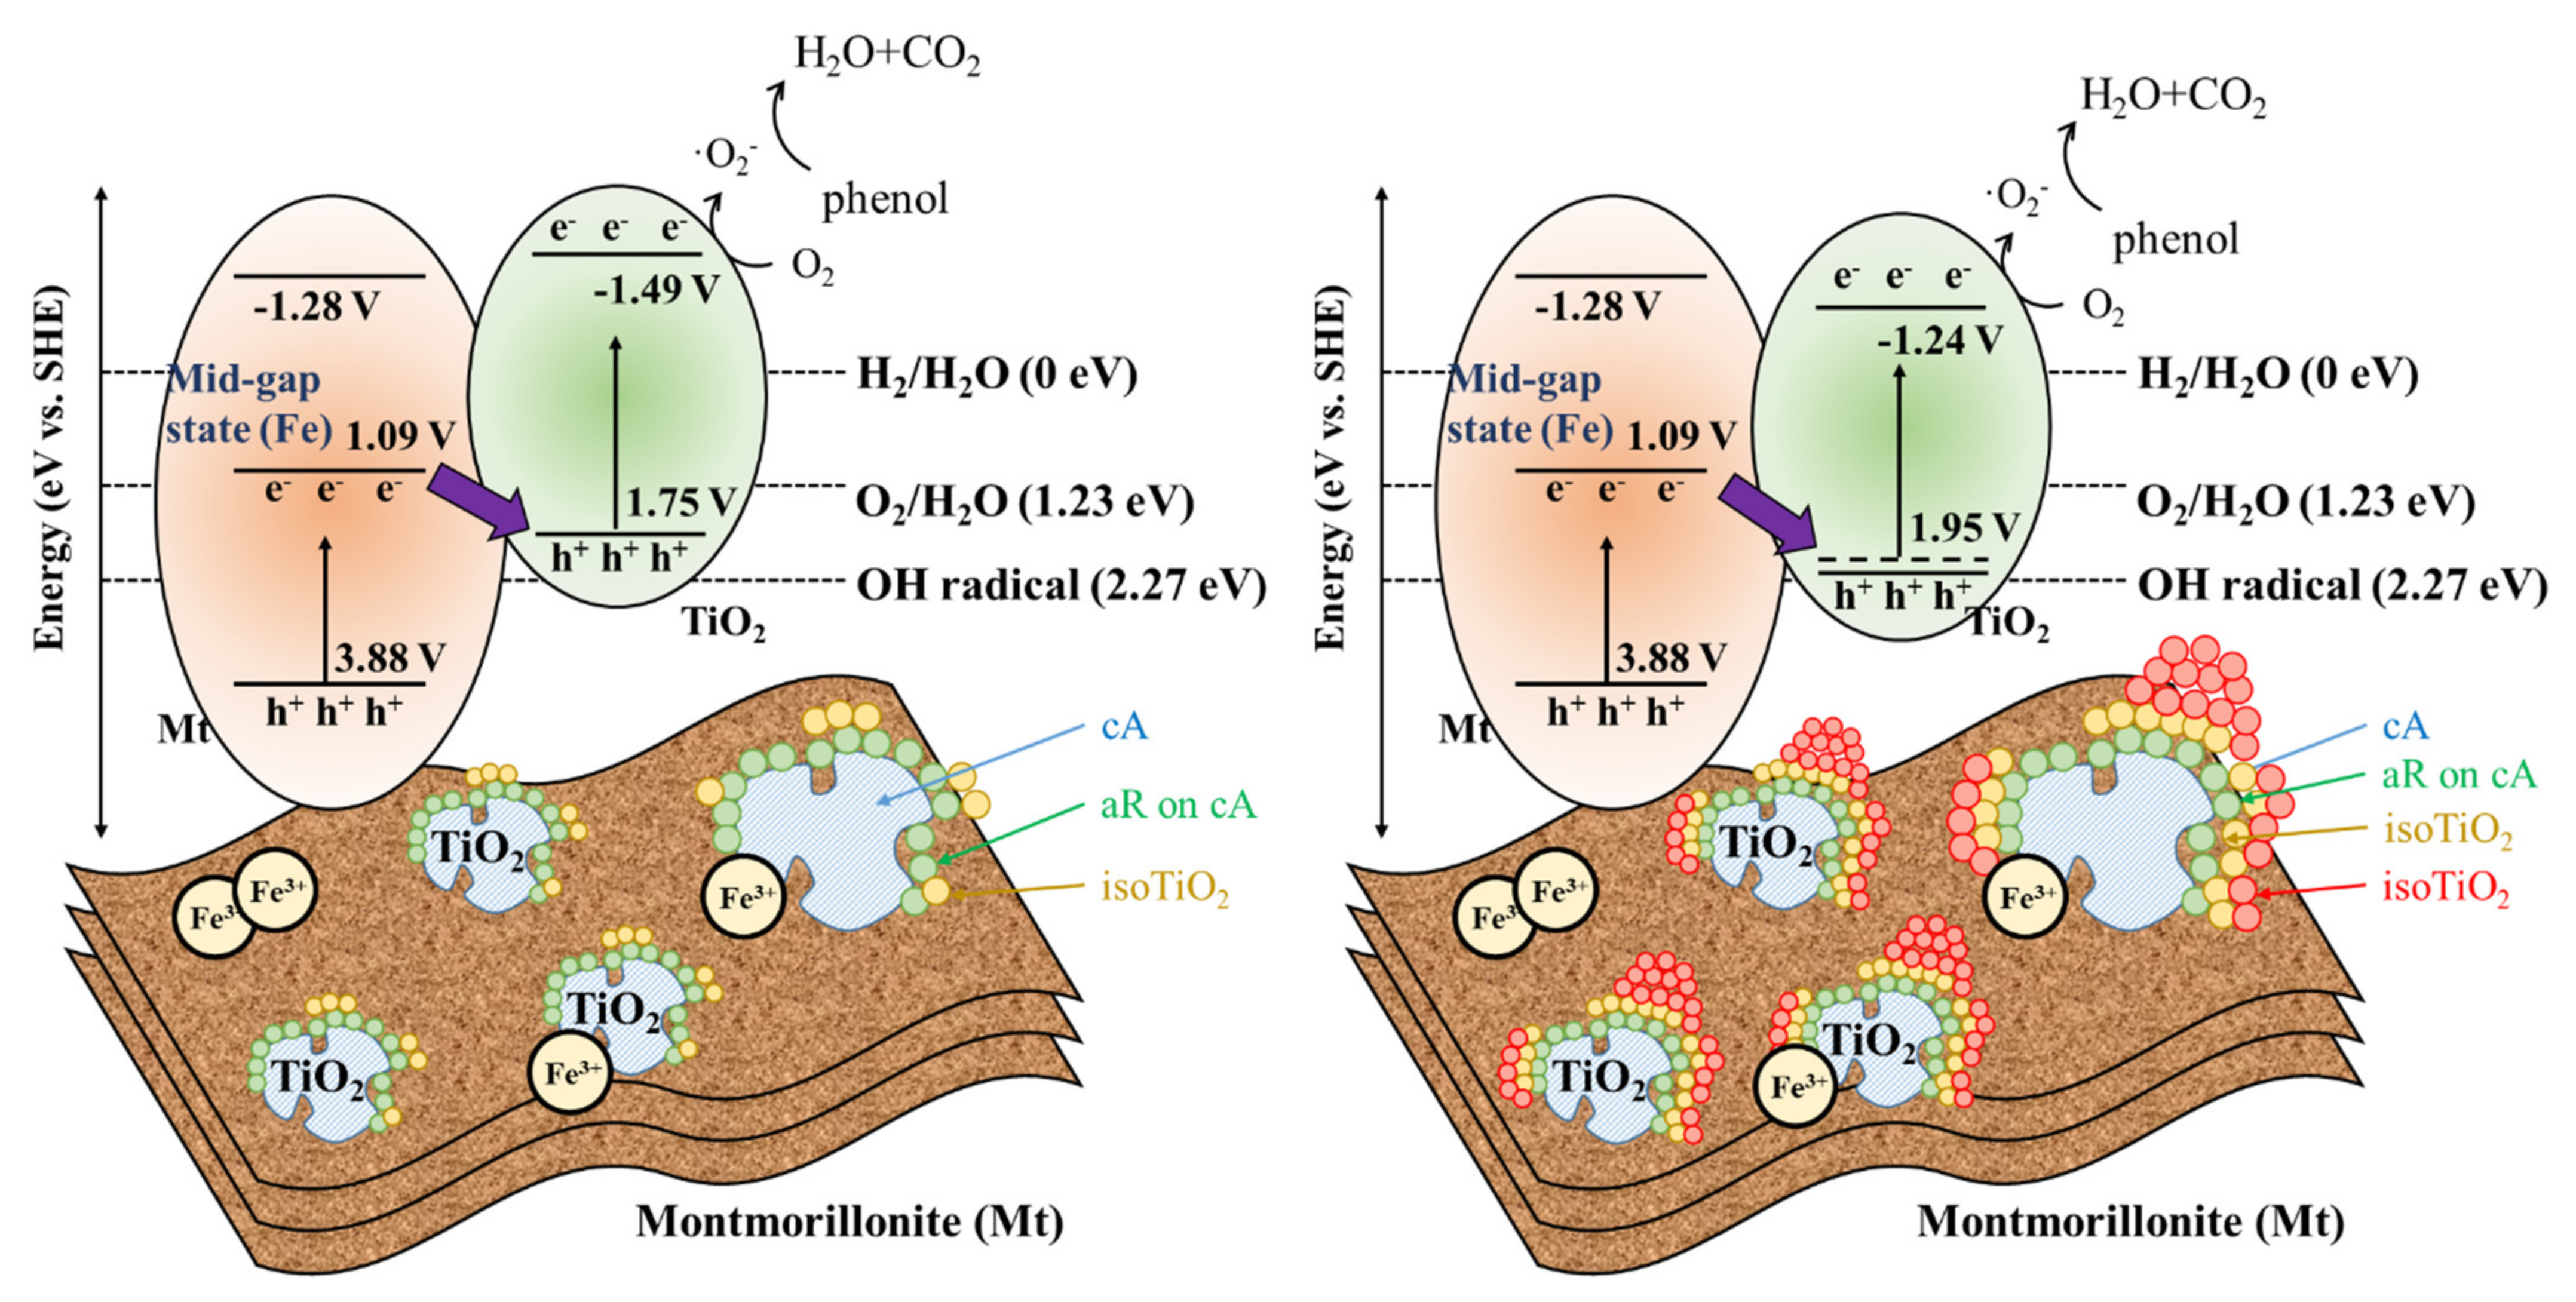
3.6. Photocatalytic Mechanisms

Based on the above results, the mechanisms of both the Fe/Mt/TiO2 and xFe-Mt/(1 − x)Fe-TiO2 could be proposed (Scheme 1). In both composites, the crystal anatase will not be directly exposed on the surface but in contact with the amorphous rutile, which is performed as the main photocatalyst. The amount of amorphous rutile covered in crystal anatase in the Fe/Mt/TiO2 was approximately twice that in the xFe-Mt/(1 − x)Fe-TiO2. On the contrary, the amount of isolated amorphous anatase and rutile overlapping with the photocatalytic active sites in xFe-Mt/(1 − x)Fe-TiO2 was much higher. These two factors resulted in a higher photocatalytic activity for the Fe/Mt/TiO2 than the xFe-Mt/(1 − x)Fe-TiO2. Based on DRS and E g results, the TiO2 phase in the Fe/Mt/TiO2 has an E g of 3.24 eV, with the 1.75 eV energy level of VB and the 1.49 eV energy level of CB. Additionally, the TiO2 phase in the xFe-Mt/(1 − x)Fe-TiO2 has an E g of 3.19 eV, with the 1.95 eV energy level of VB and -1.24 eV energy level of CB. The VBT of both the Fe/Mt/TiO2 and the xFe-Mt/(1 − x)Fe-TiO2 are lower than the reduction potential of ∙OH production [25]. So, the h+ and OH should have little influence on the photocatalytic degradation of phenol. In addition, the radical scavenger test for the Fe/Mt/TiO2 also proved that the O2 should be the predominant radical during the photocatalytic reaction. The Fe(III) located on the interlayer and surface of the Mt in both composites may generate a new Fermi level [25] and establish heterojunctions with the bulk TiO2 in the composites to reduce the charge recombination and enhance electron transfer.

4. Conclusions

The Fe/Mt/TiO2 was prepared by introducing Fe(III) cations into the Mt/TiO2 composite after the formation of the Mt/TiO2 composite, while the xFe-Mt/(1 − x)Fe-TiO2 was obtained by the doping of Fe(III) cations during the formation of the Mt/TiO2 composite. The locations of the Fe(III) cations in the Fe/Mt/TiO2 were expected to be on the surface of the composite and in the interlayers of the Mt, while the Fe(III) cations in the xFe-Mt/(1 − x)Fe-TiO2 may exist in the structures of TiO2 and Mt. The different locations of the doped Fe(III) in the composite directly interferes with the formation of the TiO2 content in the composite. The wt% of the TiO2 in the Fe/Mt/TiO2 always kept higher (26.91–27.63%) than in the xFe-Mt/(1 − x)Fe-TiO2 (26.77–27.50%), but the anatase to rutile ratio was always lower (0.92–1.45 for Fe/Mt/TiO2 and 1.53–1.91 for xFe-Mt/(1 − x)Fe-TiO2). Both composites’ optical and electrochemical properties and photocatalytic phenol degradation activity were better than that of pristine TiO2, due to the formation of the heterojunction between TiO2 and Mt, and the introduction of Fe(III) into the composites. Compared between two composite samples, the xFe-Mt/(1 − x)Fe-TiO2 composite showed better light absorption abilities ( E g : 3.19 eV) than the Fe/Mt/TiO2 composite ( E g : 3.24 eV), confirmed by DRS results because the doped Fe(III) in the structure of the TiO2 generates a new electronic level to reduce the E g . However, the Fe/Mt/TiO2 exhibited a better charge generation ability, which was proven by the higher peak intensity in the photocurrent and a smaller radius in the EIS. The photocatalytic degradation of phenol was 94.6% for the Fe/Mt/TiO2, which was higher than that of the xFe-Mt/(1 − x)Fe-TiO2 at 85.1%. These are due to the higher active fractions of amorphous rutile covered in crystal anatase on the surface of the composite (two-times more than the xFe-Mt/(1 − x)Fe-TiO2) confirmed by the ERDT results. Moreover, the ∙O2 radical played an important role in the photocatalytic degradation of phenol. Thus, the modification of Mt/TiO2 composites by Fe(III) can be an alternative material for the photocatalytic treatment of water pollutants.

Supplementary Materials

The following are available online at https://www.mdpi.com/article/10.3390/min11121381/s1, Figure S1: Photocatalytic degradation and kinetics of phenol by Fe/Mt/TiO2 synthesized at 70, 80 and 90 °C; Figure S2: XRD patterns of TiO2, Fe/Mt/TiO2 and xFe-Mt/(1 − x)Fe-TiO2 synthesized at 70, 80 and 90 °C; Figure S3: XPS (a) survey, narrow scans of (b) Ti 2p, (c) Fe 2p, (d) C 1s (e) O 1s, and (f) Si 2p orbitals for Fe/Mt/TiO2; Figure S4: XPS (a) survey, narrow scans of (b) Ti 2p, (c) Fe 2p, (d) C 1s (e) O 1s, and (f) Si 2p orbitals for xFe-Mt/(1 − x)Fe-TiO2; Table S1: Parameters of XRD peak fitting of Fe/Mt/TiO2 and xFe-Mt/(1 − x)Fe-TiO2; Table S2: Parameters of pseudo-first-order kinetics for the photocatalytic degradation of phenol on TiO2, Fe/Mt/TiO2 and xFe-Mt/(1 − x)Fe-TiO2.

Author Contributions

L.Z.: conceptualization, investigation, formal analysis, writing—original draft, review, and editing; C.C.: formal analysis; V.B.: formal analysis; B.O.: investigation; K.S.: conception, interpretation, and editing of the manuscript. All authors have read and agreed to the published version of the manuscript.

Funding

This research was funded by the Japan Society for the Promotion of Science (JSPS), KAKENHI (A) [No. JSPS JP19F19393]; Cooperative Research Programs at Hokkaido University Institute for Catalysis [Nos. 18A1001, 19B1002, 20A1001, and 21A1001]; and Kyushu University (Progress 100) to KS. This work was supported by the nanotech platform at Kyushu University with proposal no. S-20-KU-0001.

Acknowledgments

The authors would like to thank the Nanotech Center, Kyushu University for XPS measurements.

Conflicts of Interest

The authors declare no conflict of interest.

References

  1. Cerrato, G.; Marchese, L.; Morterra, C. Structural and morphological modifications of sintering microcrystalline TiO2: An XRD, HRTEM and FTIR study. Appl. Surf. Sci. 1993, 70–71, 200–205. [Google Scholar] [CrossRef]
  2. Zhaobin, W.; Qin, X.; Xiexian, G.; Sham, E.; Grange, P.; Delmon, B. Titania-modified hydrodesulphurization catalysts: I. Effect of preparation techniques on morphology and properties of TiO2—Al2O3 carrier. Appl. Catal. 1990, 63, 305–317. [Google Scholar] [CrossRef]
  3. Wen, J.; Li, X.; Liu, W.; Fang, Y.; Xie, J.; Xu, Y. Photocatalysis fundamentals and surface modification of TiO2 nanomaterials. Chin. J. Catal. 2015, 36, 2049–2070. [Google Scholar] [CrossRef]
  4. Wang, J.; Lin, Z. Dye-Sensitized TiO2 Nanotube Solar Cells with Markedly Enhanced Performance via Rational Surface Engineering. Chem. Mater. 2010, 22, 579–584. [Google Scholar] [CrossRef]
  5. Bian, Z.; Tachikawa, T.; Kim, W.; Choi, W.; Majima, T. Superior Electron Transport and Photocatalytic Abilities of Metal-Nanoparticle-Loaded TiO2 Superstructures. J. Phys. Chem. C 2012, 116, 25444–25453. [Google Scholar] [CrossRef]
  6. Cozzoli, P.D.; Fanizza, E.; Comparelli, R.; Curri, M.L.; Agostiano, A.; Laub, D. Role of metal nanoparticles in TiO2/Ag nanocomposite-based microheterogeneous photocatalysis. J. Phys. Chem. B 2004, 108, 9623–9630. [Google Scholar] [CrossRef]
  7. Dozzi, M.V.; Selli, E. Doping TiO2 with p-block elements: Effects on photocatalytic activity. J. Photochem. Photobiol. C Photochem. Rev. 2013, 14, 13–28. [Google Scholar] [CrossRef]
  8. Zaleska, A. Doped-TiO2: A review. Recent Pat. Eng. 2008, 2, 157–164. [Google Scholar] [CrossRef]
  9. Fukahori, S.; Ichiura, H.; Kitaoka, T.; Tanaka, H. Capturing of bisphenol A photodecomposition intermediates by composite TiO2–zeolite sheets. Appl. Catal. B Environ. 2003, 46, 453–462. [Google Scholar] [CrossRef]
  10. Todorova, N.; Giannakopoulou, T.; Karapati, S.; Petridis, D.; Vaimakis, T.; Trapalis, C. Composite TiO2/clays materials for photocatalytic NOx oxidation. Appl. Surf. Sci. 2014, 319, 113–120. [Google Scholar] [CrossRef]
  11. Mohammad, A.; Khan, M.E.; Cho, M.H.; Yoon, T. Fabrication of binary SnO2/TiO2 nanocomposites under a sonication-assisted approach: Tuning of band-gap and water depollution applications under visible light irradiation. Ceram. Int. 2021, 47, 15073–15081. [Google Scholar] [CrossRef]
  12. Mohammad, A.; Khan, M.E.; Cho, M.H.; Yoon, T. Adsorption promoted visible-light-induced photocatalytic degradation of antibiotic tetracycline by tin oxide/cerium oxide nanocomposite. Appl. Surf. Sci. 2021, 565, 150337. [Google Scholar] [CrossRef]
  13. Khan, M.M.; Min, B.-K.; Cho, M.H. Microbial fuel cell assisted band gap narrowed TiO2 for visible light-induced photocatalytic activities and power generation. Sci. Rep. 2018, 8, 1–12. [Google Scholar] [CrossRef] [PubMed] [Green Version]
  14. Damian, G.; Damian, F.; Szakács, Z.; Iepure, G.; Aştefanei, D. Mineralogical and Physico-Chemical Characterization of the Oraşu-Nou (Romania) Bentonite Resources. Minerals 2021, 11, 938. [Google Scholar] [CrossRef]
  15. Laufek, F.; Hanusová, I.; Svoboda, J.; Vašíček, R.; Najser, J.; Koubová, M.; Čurda, M.; Pticen, F.; Vaculíková, L.; Sun, H.; et al. Mineralogical, Geochemical and Geotechnical Study of BCV 2017 Bentonite—The Initial State and the State following Thermal Treatment at 200 °C. Minerals 2021, 11, 871. [Google Scholar] [CrossRef]
  16. DeWitt, J.; Chirico, P.; Alessi, M.; Boston, K. Remote Sensing Inventory and Geospatial Analysis of Brick Kilns and Clay Quarrying in Kabul, Afghanistan. Minerals 2021, 11, 296. [Google Scholar] [CrossRef]
  17. Li, C.; Li, Z.; Wu, T.; Luo, Y.; Zhao, J.; Li, X.; Yang, W.; Chen, X. Metallogenic Characteristics and Formation Mechanism of Naomugeng Clay-Type Lithium Deposit in Central Inner Mongolia, China. Minerals 2021, 11, 238. [Google Scholar] [CrossRef]
  18. Belver, C.; Bedia, J.; Rodriguez, J. Titania–clay heterostructures with solar photocatalytic applications. Appl. Catal. B Environ. 2015, 176-177, 278–287. [Google Scholar] [CrossRef]
  19. Papoulis, D.; Komarneni, S.; Panagiotaras, D.; Stathatos, E.; Toli, D.; Christoforidis, K.C.; Fernández-García, M.; Li, H.; Yin, S.; Sato, T.; et al. Halloysite–TiO2 nanocomposites: Synthesis, characterization and photocatalytic activity. Appl. Catal. B Environ. 2013, 132-133, 416–422. [Google Scholar] [CrossRef]
  20. Liu, J.; Zhang, G. Recent advances in synthesis and applications of clay-based photocatalysts: A review. Phys. Chem. Chem. Phys. 2014, 16, 8178–8192. [Google Scholar] [CrossRef]
  21. Man-Chao, H.; Zhi-Jie, F.; Ping, Z. Atomic and electronic structures of montmorillonite in soft rock. Chin. Phys. B 2009, 18, 2933–2937. [Google Scholar] [CrossRef]
  22. Jack, R.S.; Ayoko, G.A.; Adebajo, M.O.; Frost, R.L. A review of iron species for visible-light photocatalytic water purification. Environ. Sci. Pollut. Res. 2015, 22, 7439–7449. [Google Scholar] [CrossRef]
  23. Parida, K.; Mohapatra, L. Carbonate intercalated Zn/Fe layered double hydroxide: A novel photocatalyst for the enhanced photo degradation of azo dyes. Chem. Eng. J. 2012, 179, 131–139. [Google Scholar] [CrossRef]
  24. Kim, S.J.; Lee, Y.; Lee, D.K.; Lee, J.W.; Kang, J.K. Efficient Co–Fe layered double hydroxide photocatalysts for water oxidation under visible light. J. Mater. Chem. A 2014, 2, 4136–4139. [Google Scholar] [CrossRef]
  25. Chuaicham, C.; Xiong, Y.; Sekar, K.; Chen, W.; Zhang, L.; Ohtani, B.; Dabo, I.; Sasaki, K. A promising Zn-Ti layered double hydroxide/Fe-bearing montmorillonite composite as an efficient photocatalyst for Cr(VI) reduction: Insight into the role of Fe impurity in montmorillonite. Appl. Surf. Sci. 2021, 546, 148835. [Google Scholar] [CrossRef]
  26. Zheng, X.; Li, Y.; You, W.; Lei, G.; Cao, Y.; Zhang, Y.; Jiang, L. Construction of Fe-doped TiO2−x ultrathin nanosheets with rich oxygen vacancies for highly efficient oxidation of H2S. Chem. Eng. J. 2021, 430, 132917. [Google Scholar] [CrossRef]
  27. Kanjana, N.; Maiaugree, W.; Poolcharuansin, P.; Laokul, P. Synthesis and characterization of Fe-doped TiO2 hollow spheres for dye-sensitized solar cell applications. Mater. Sci. Eng. B 2021, 271, 115311. [Google Scholar] [CrossRef]
  28. Mancuso, A.; Sacco, O.; Vaiano, V.; Sannino, D.; Pragliola, S.; Venditto, V.; Morante, N. Visible light active Fe-Pr co-doped TiO2 for water pollutants degradation. Catal. Today 2021, 380, 93–104. [Google Scholar] [CrossRef]
  29. Kara, F.; Kurban, M.; Coşkun, B. Evaluation of electronic transport and optical response of two-dimensional Fe-doped TiO2 thin films for photodetector applications. Optik 2020, 210, 164605. [Google Scholar] [CrossRef]
  30. Pezeshkian, W.; Marrink, S.J. Simulating realistic membrane shapes. Curr. Opin. Cell Biol. 2021, 71, 103–111. [Google Scholar] [CrossRef]
  31. Lapworth, D.J.; Baran, N.; Stuart, M.E.; Ward, R.S. Emerging organic contaminants in groundwater: A review of sources, fate and occurrence. Environ. Pollut. 2012, 163, 287–303. [Google Scholar] [CrossRef] [PubMed] [Green Version]
  32. Daly, G.L.; Wania, F. Organic Contaminants in Mountains. Environ. Sci. Technol. 2005, 39, 385–398. [Google Scholar] [CrossRef] [PubMed]
  33. Alkorta, I.; Garbisu, C. Phytoremediation of organic contaminants in soils. Bioresour. Technol. 2001, 79, 273–276. [Google Scholar] [CrossRef]
  34. Kim, J.; Du, P.; Liu, W.; Luo, C.; Zhao, H.; Huang, C.-H. Cobalt/Peracetic Acid: Advanced Oxidation of Aromatic Organic Compounds by Acetylperoxyl Radicals. Environ. Sci. Technol. 2020, 54, 5268–5278. [Google Scholar] [CrossRef]
  35. Hodges, B.C.; Cates, E.L.; Kim, J.-H. Challenges and prospects of advanced oxidation water treatment processes using catalytic nanomaterials. Nat. Nanotechnol. 2018, 13, 642–650. [Google Scholar] [CrossRef]
  36. Mohammadi, S.; Kargari, A.; Sanaeepur, H.; Abbassian, K.; Najafi, A.; Mofarrah, E. Phenol removal from industrial wastewaters: A short review. Desalin. Water Treat. 2015, 53, 2215–2234. [Google Scholar] [CrossRef]
  37. Jover, J.; Bosque, R.; Sales, J. Neural Network Based QSPR Study for Predicting pKa of Phenols in Different Solvents. QSAR Comb. Sci. 2007, 26, 385–397. [Google Scholar] [CrossRef]
  38. Srikhaow, A.; Smith, S.M.; Uraisin, K.; Suttiponparnit, K.; Kongmark, C.; Chuaicham, C. Catalytic remediation of phenol contaminated wastewater using Cu–Zn hydroxide nitrate. RSC Adv. 2016, 6, 36766–36774. [Google Scholar] [CrossRef]
  39. Zhang, Y.; Gan, H.; Zhang, G. A novel mixed-phase TiO2/kaolinite composites and their photocatalytic activity for degradation of organic contaminants. Chem. Eng. J. 2011, 172, 936–943. [Google Scholar] [CrossRef]
  40. Zhang, Y.; Guo, Y.; Zhang, G.; Gao, Y. Stable TiO2/rectorite: Preparation, characterization and photocatalytic activity. Appl. Clay Sci. 2011, 51, 335–340. [Google Scholar] [CrossRef]
  41. Wang, Y.; Zhang, L.; Deng, K.; Chen, X.; Zou, Z. Low Temperature Synthesis and Photocatalytic Activity of Rutile TiO2 Nanorod Superstructures. J. Phys. Chem. C 2007, 111, 2709–2714. [Google Scholar] [CrossRef]
  42. Tansel, B. Significance of thermodynamic and physical characteristics on permeation of ions during membrane separation: Hydrated radius, hydration free energy and viscous effects. Sep. Purif. Technol. 2012, 86, 119–126. [Google Scholar] [CrossRef]
  43. Liu, H.; Chaudhary, D.; Yusa, S.-I.; Tadé, M.O. Glycerol/starch/Na+-montmorillonite nanocomposites: A XRD, FTIR, DSC and 1H NMR study. Carbohydr. Polym. 2011, 83, 1591–1597. [Google Scholar] [CrossRef]
  44. Bharti, B.; Kumar, S.; Lee, H.-N.; Kumar, R. Formation of oxygen vacancies and Ti3+ state in TiO2 thin film and enhanced optical properties by air plasma treatment. Sci. Rep. 2016, 6, srep32355. [Google Scholar] [CrossRef] [PubMed]
  45. Lv, H.; Zhao, H.; Cao, T.; Qian, L.; Wang, Y.; Zhao, G. Efficient degradation of high concentration azo-dye wastewater by heterogeneous Fenton process with iron-based metal-organic framework. J. Mol. Catal. A Chem. 2015, 400, 81–89. [Google Scholar] [CrossRef]
  46. Xiao, S.; Xu, P.; Peng, Q.; Chen, J.; Huang, J.; Wang, F.; Noor, N. Layer-by-Layer Assembly of Polyelectrolyte Multilayer onto PET Fabric for Highly Tunable Dyeing with Water Soluble Dyestuffs. Polymers 2017, 9, 735. [Google Scholar] [CrossRef] [PubMed] [Green Version]
  47. Jichao, W. On the cultivation of science college students’ innovative and entrepreneurial ability. J. China Univ. Pet. Ed. Soc. Sci. 2016, 5, 106–109. [Google Scholar]
  48. Wu, L.Q.; Li, Y.C.; Li, S.Q.; Li, Z.Z.; Tang, G.D.; Qi, W.H.; Xue, L.C.; Ge, X.S.; Ding, L.L. Method for estimating ionicities of oxides using O1s photoelectron spectra. AIP Adv. 2015, 5, 097210. [Google Scholar] [CrossRef]
  49. Chuaicham, C.; Karthikeyan, S.; Pawar, R.R.; Xiong, Y.; Dabo, I.; Ohtani, B.; Kim, Y.; Song, J.T.; Ishihara, T.; Sasaki, K. Energy-resolved distribution of electron traps for O/S-doped carbon nitrides by reversed double-beam photoacoustic spectroscopy and the photocatalytic reduction of Cr(vi). Chem. Commun. 2020, 56, 3793–3796. [Google Scholar] [CrossRef]
  50. Ferré, F.G.; Mairov, A.; Iadicicco, D.; Vanazzi, M.; Bassini, S.; Utili, M.; Tarantino, M.; Bragaglia, M.; Lamastra, F.; Nanni, F.; et al. Corrosion and radiation resistant nanoceramic coatings for lead fast reactors. Corros. Sci. 2017, 124, 80–92. [Google Scholar] [CrossRef]
  51. Nguyen, T.P.; Lefrant, S. XPS study of SiO thin films and SiO-metal interfaces. J. Phys. Condens. Matter 1989, 1, 5197–5204. [Google Scholar] [CrossRef]
  52. Dong, F.; Zhao, Z.; Xiong, T.; Ni, Z.; Zhang, W.; Sun, Y.; Ho, W.-K. In Situ Construction of g-C3N4/g-C3N4 Metal-Free Heterojunction for Enhanced Visible-Light Photocatalysis. ACS Appl. Mater. Interfaces 2013, 5, 11392–11401. [Google Scholar] [CrossRef] [PubMed]
  53. Su, X.; Yang, J.; Yu, X.; Zhu, Y.; Zhang, Y. In Situ grown hierarchical 50%BiOCl/BiOI hollow flowerlike microspheres on reduced graphene oxide nanosheets for enhanced visible-light photocatalytic degradation of rhodamine B. Appl. Surf. Sci. 2018, 433, 502–512. [Google Scholar] [CrossRef]
  54. Yamada, Y.; Nakamura, T.; Endo, M.; Wakamiya, A.; Kanemitsu, Y. Near-band-edge optical responses of solution-processed organic–inorganic hybrid perovskite CH3NH3PbI3on mesoporous TiO2electrodes. Appl. Phys. Express 2014, 7, 32302. [Google Scholar] [CrossRef]
  55. Sekar, K.; Chuaicham, C.; Balijapalli, U.; Li, W.; Wilson, K.; Lee, A.F.; Sasaki, K. Surfactant- and template-free hydrothermal assembly of Cu2O visible light photocatalysts for trimethoprim degradation. Appl. Catal. B Environ. 2021, 284, 119741. [Google Scholar] [CrossRef]
  56. Sekar, K.; Chuaicham, C.; Vellaichamy, B.; Li, W.; Zhuang, W.; Lu, X.; Ohtani, B.; Sasaki, K. Cubic Cu2O nanoparticles decorated on TiO2 nanofiber heterostructure as an excellent synergistic photocatalyst for H2 production and sulfamethoxazole degradation. Appl. Catal. B Environ. 2021, 294, 120221. [Google Scholar] [CrossRef]
  57. Chuaicham, C.; Karthikeyan, S.; Song, J.T.; Ishihara, T.; Ohtani, B.; Sasaki, K. Importance of ZnTiO3 phase in ZnTi-mixed metal oxide photocatalysts derived from layered double hydroxide. ACS Appl. Mater. Interfaces 2020, 12, 9169–9180. [Google Scholar] [CrossRef] [PubMed]
  58. Sood, S.; Umar, A.; Mehta, S.K.; Kansal, S.K. Highly effective Fe-doped TiO2 nanoparticles photocatalysts for visible-light driven photocatalytic degradation of toxic organic compounds. J. Colloid Interface Sci. 2015, 450, 213–223. [Google Scholar] [CrossRef] [PubMed]
  59. Ali, T.; Tripathi, P.; Azam, A.; Raza, W.; Ahmed, A.S.; Ahmed, A.; Muneer, M. Photocatalytic performance of Fe-doped TiO2nanoparticles under visible-light irradiation. Mater. Res. Express 2017, 4, 015022. [Google Scholar] [CrossRef]
  60. Benotti, M.J.; Stanford, B.D.; Wert, E.C.; Snyder, S. Evaluation of a photocatalytic reactor membrane pilot system for the removal of pharmaceuticals and endocrine disrupting compounds from water. Water Res. 2009, 43, 1513–1522. [Google Scholar] [CrossRef] [PubMed]
  61. Nitta, A.; Takashima, M.; Murakami, N.; Takase, M.; Ohtani, B. Reversed double-beam photoacoustic spectroscopy of metal-oxide powders for estimation of their energy-resolved distribution of electron traps and electronic-band structure. Electrochim. Acta 2018, 264, 83–90. [Google Scholar] [CrossRef] [Green Version]
  62. Su, D.; Dou, S.; Wang, G. Anatase TiO2: Better Anode Material than Amorphous and Rutile Phases of TiO2 for Na-Ion Batteries. Chem. Mater. 2015, 27, 6022–6029. [Google Scholar] [CrossRef]
  63. Viana, M.; Mohallem, N.; Miquita, D.R.; Balzuweit, K.; Silva-Pinto, E. Preparation of amorphous and crystalline Ag/TiO2 nanocomposite thin films. Appl. Surf. Sci. 2013, 265, 130–136. [Google Scholar] [CrossRef]
  64. Lottiaux, M.; Boulesteix, C.; Nihoul, G.; Varnier, F.; Flory, F.; Galindo, R.; Pelletier, E. Morphology and structure of TiO2 thin layers vs. thickness and substrate temperature. Thin Solid Films 1989, 170, 107–126. [Google Scholar] [CrossRef]
Figure 1. XRD patterns of original Mt, Fe-Mt synthesized at RT, TiO2, Fe/Mt/TiO2, and xFe-Mt/(1 − x)Fe-TiO2 synthesized at 70 °C.
Minerals 11 01381 g001
Figure 2. Peak fitting of the XRD patterns (20–35° in 2θ) of Fe/Mt/TiO2 and xFe-Mt/(1 − x)Fe-TiO2 with different synthesis temperatures (70, 80, and 90 °C). Peaks in blue were from anatase and peaks in yellow were from rutile.
Minerals 11 01381 g002
Figure 3. SEM images of: (a) TiO2; (b) Fe/Mt/TiO2; and (c) xFe-Mt/(1 − x)Fe-TiO2. SEM-EDX Kα maps of: (d) titanium; (e) iron; (f) silica; (g) aluminum; (h) magnesium; and (i) oxygen for Fe/Mt/TiO2. SEM-EDX Kα maps of: (j) titanium; (k) iron; (l) silica; (m) aluminum; (n) magnesium; and (o) oxygen for xFe-Mt/(1 − x)Fe-TiO2. Scale bars were adjusted to be the same and indicate 50.00 μm.
Minerals 11 01381 g003
Figure 4. Images of: (a) TEM-EDX, (b) TEM images, and Kα maps of: (c) titanium; (d) aluminum; and (e) iron for Fe/Mt/TiO2.
Minerals 11 01381 g004
Figure 5. XPS valence band (VB) energy region of: (a) Fe/Mt/TiO2; (b) xFe-Mt/(1 − x)Fe-TiO2.
Minerals 11 01381 g005
Figure 6. (a) DRS-UV spectra; (b) corresponding Tauc plots of Fe/Mt/TiO2 and xFe-Mt/(1 − x)Fe-TiO2 synthesized at 70 °C.
Minerals 11 01381 g006
Figure 7. Photoluminescence of Fe/Mt/TiO2 and xFe-Mt/(1 − x)Fe-TiO2 at 70 °C.
Minerals 11 01381 g007
Figure 8. (a) Photocurrent density versus time measurements of Mt, Fe/Mt/TiO2, and xFe-Mt/(1 − x)Fe-TiO2 synthesized at 70 °C under 0 V versus Ag/AgCl bias; (b) Nyquist plots of the EIS spectra of Mt, Fe/Mt/TiO2, and xFe-Mt/(1 − x)Fe-TiO2 synthesized at 70 °C.
Minerals 11 01381 g008
Figure 9. (a) Photocatalytic degradation and (b) kinetics of phenol by TiO2, Fe/Mt/TiO2 and xFe-Mt/(1 − x)Fe-TiO2 composites synthesized at 70 °C.
Minerals 11 01381 g009
Figure 10. Reusability test of Fe/Mt/TiO2 synthesized at 70 °C for phenol degradation.
Minerals 11 01381 g010
Figure 11. Peak separation of the representative energy-resolved distribution of electron traps (ERDTs) patterns of Fe-Mt synthesized at RT, and TiO2, Fe/Mt/TiO2, and xFe-Mt/(1 − x)Fe-TiO2 synthesized at 70 °C plotted as a function of energy (eV) from the valence band top (VBT) combined with CBB. The numbers in brackets denote the relative total electron trap density. Peaks at 2.96, 3.22, 3.44, and 3.62–3.76 eV were assigned as crystal rutile, amorphous rutile, amorphous rutile covered on crystal anatase, and isolated amorphous TiO2.
Minerals 11 01381 g011
Figure 12. Effects of radical scavengers (ethanol, isopropanol, and para-benzoquinone) on the photocatalytic degradation of phenol in the Fe/Mt/TiO2 composite synthesized at 70 °C. Isopropanol is the ∙OH scavenger, ethanol is the h+ scavenger, and para-benzoquinone is the O2 scavenger.
Minerals 11 01381 g012
Scheme 1. The band edge positions of Fe/Mt/TiO2 and xFe-Mt/(1 − x)Fe-TiO2 with respect to standard hydrogen electrode (SHE), where the E (vs. SHE) = − (E (vs. vacuum)–4.44) V.
Minerals 11 01381 sch001
Table 1. Elemental composition of Fe/Mt/TiO2 and xFe-Mt/(1 − x)Fe-TiO2 with different synthesis temperatures (70 °C, 80 °C, and 90 °C) in wt%.
T (°C)SampleNa (%)Mg (%)Al (%)Si (%)Ca (%)Ti (%)Fe (%)TiO2 (%)
90Fe/Mt/TiO2N.D.1.8411.7831.080.0550.075.1927.63
xFe-Mt/(1 − x)Fe-TiO2N.D.1.9712.2832.280.0547.495.9226.74
80Fe/Mt/TiO2N.D.1.8611.6530.740.0449.626.1027.65
xFe-Mt/(1 − x)Fe-TiO2N.D.1.8611.8030.540.0748.806.9427.50
70Fe/Mt/TiO2N.D.1.8812.2932.290.0348.235.2826.91
xFe-Mt/(1 − x)Fe-TiO2N.D.1.8812.0432.140.0847.196.6626.77
Table 2. Parameters of ERDT peak fitting of Fe/Mt/TiO2 and xFe-Mt/(1 − x)Fe-TiO2. c-R, a-R, a-R on c-A, and iso-TiO2 are the abbreviation of crystal rutile, amorphous rutile, amorphous rutile covered on crystal anatase, and isolated amorphous TiO2, respectively.
SamplePeak AssignmentPeak Position (Ev)Relative Intensity (%)
TiO2c-R2.9631.1%
a-R3.2242.0%
a-R on c-A3.4427.0%
iso-TiO23.62N.D.
iso-TiO23.76N.D.
Fe/Mt/TiO2c-R2.96N.D.
a-R3.22N.D.
a-R on c-A3.4443.5%
iso-TiO23.6252.2%
iso-TiO23.764.3%
xFe-Mt/(1 − x)Fe-TiO2c-R2.96N.D.
a-R3.22N.D.
a-R on c-A3.4485.4%
iso-TiO23.62N.D.
iso-TiO23.7614.6%
Publisher’s Note: MDPI stays neutral with regard to jurisdictional claims in published maps and institutional affiliations.

