Article

Self-Consistent Thermodynamic Parameters of Diopside at High Temperatures and High Pressures: Implications for the Adiabatic Geotherm of an Eclogitic Upper Mantle

1
School of Earth Sciences, Institute of Disaster Prevention, Sanhe 065201, China
2
Key Laboratory of High Temperature and High Pressure Study of the Earth’s Interior, Institute of Geochemistry, Chinese Academy of Sciences, Guiyang 550081, China
3
Hebei Key Laboratory of Earthquake Dynamics, Sanhe 065201, China
4
School of Information Engineering, Institute of Disaster Prevention, Sanhe 065201, China
*
Author to whom correspondence should be addressed.
Minerals 2021, 11(12), 1322; https://doi.org/10.3390/min11121322
Submission received: 22 October 2021 / Revised: 19 November 2021 / Accepted: 22 November 2021 / Published: 26 November 2021
(This article belongs to the Special Issue High-Pressure Physical and Chemical Behaviors of Minerals and Rocks)

Abstract

:
Using an iterative numerical approach, we have obtained the self-consistent thermal expansion, heat capacity, and Grüneisen parameters of diopside (MgCaSi2O6) over wide pressure and temperature ranges based on experimental data from the literature. Our results agree well with the published experimental and theoretical data. The determined thermodynamic parameters exhibit nonlinear dependences with increasing pressure. Compared with other minerals in the upper mantle, we found that the adiabatic temperature gradient obtained using the thermodynamic data of diopside is larger than that of garnet while lower than that of olivine, when ignoring the Fe incorporation. Combining our results with thermodynamic parameters of garnet obtained in previous studies, we have estimated the adiabatic temperature gradient and geotherm of an eclogitic upper mantle in a depth range of 200–450 km. The results show that the estimated adiabatic temperature gradient of the eclogite model is ~16% and ~3% lower than that of the pyrolite model at a depth of 200 km and 410 km, respectively. However, the high mantle potential temperature of the eclogite model leads to a similar temperature as the pyrolite model in a depth range of 200–410 km.

1. Introduction

Temperature is one of the fundamental quantities for determining the physical and chemical properties of the Earth’s interior. At present, however, it is impossible to measure the temperature of the deep Earth directly. Since the seismic discontinuities in the mantle are usually related to mineral phase transitions [1], the temperatures at the seismic discontinuities (i.e., the 410 km, 520 km, 660 km discontinuities and the mantle–core boundary) can be determined by comparing the depth of the seismic velocity discontinuities with the phase transition pressures of mantle minerals [2]. In addition, since the radiative transfer of heat is regarded to be negligible in the mantle, the temperature gradient of the mantle is expected to be nearly adiabatic [3]. As a consequence, the adiabatic temperature gradient ((∂T/∂z)S) between two seismic discontinuities can be estimated using thermodynamic parameters at high temperatures and high pressures (PTs) via Equation (1) [4,5]:
T z S = α g T C P = γ T K S g V
where T and z refer to the temperature and depth, respectively; g refers to the gravitational acceleration; KS refers to the adiabatic bulk modulus; V refers to the specific volume; and α, CP, and γ refer to the thermal expansion, isobaric heat capacity, and Grüneisen parameters, respectively.
Based on thermodynamic principles and a model of the Earth [6], Stacey provided us with important insights into the thermal state of the Earth’s interior [7]. Then, considering the temperatures at the seismic discontinuities, several authors also derived the thermodynamic parameters of the deep Earth with increasing depth using various thermal equations of state (EoS) [8,9,10]. In these studies, different seismic models and empirical equations or coefficients used in the estimations would cause significant discrepancies in the derived geotherms, consequently influencing the investigations into the physical and chemical properties of the mantle.
By comparing the elastic properties of major mantle minerals at PTs to global seismic models, the pyrolite and eclogite mantle models were proposed, which are particularly important to our understanding of deep-Earth mineral composition [1]. The pyrolite model is mainly composed of ~60% olivine, ~15% garnet, ~15% clinopyroxene and ~10% orthopyroxene at a depth of ~200 km, representing the bulk mantle mineral assemblages [11]. The eclogite model mainly consists of ~30% garnet and ~70% clinopyroxene at a depth of 200 km, which refers to the bulk mineral assemblage of the subducted oceanic crust [12]. A decade ago, based on the thermal equations of states (EoS) of forsterite (Mg2SiO4) and its high-pressure phase minerals [13,14,15,16,17], Katsura et al. [18] presented the adiabatic temperature gradient and geotherm of a pyrolitic mantle by using Equation (1). This work presented the idea that the adiabatic geotherm can be estimated using the thermodynamic properties of mantle minerals and specifically implied that the calculated adiabatic geotherm may be associated with the abundance of the minerals in the mantle. Recently, Su et al. modified a numerical iterative procedure and obtained the self-consistent thermodynamic properties of Fe-bearing olivine and garnet end-members at the PT range of the upper mantle [19,20,21] and presented the adiabatic temperature gradients by using Equation (1). The results indicated that not only different minerals but also chemical composition variations in the same groups of minerals might affect the estimated adiabatic temperature gradient. Thus, accurate thermodynamic parameters of mantle minerals at simultaneous PTs are urgently required to provide a better understanding of the relationship between the geotherm and the mineral composition.
Clinopyroxene is one of the main constituents of the upper mantle and the lower crust, and diopside (CaMgSi2O6) with a space group of C2/c is a vital calcium end-member of Ca-rich clinopyroxene [22]. Compared to the plentiful data on its elastic properties [23,24], thermodynamic data on diopside, especially under high-pressure conditions, are still lacking. Theoretically, the high-temperature and high-pressure thermal expansion of diopside can be derived from the volume at PTs measured through X-ray diffraction experiments [23,25]. However, the deduction of the pressure–volume–temperature (P-V-T) relation requires empirical EoSs such as the third order Birch–Murnaghan EoS [26] or the Mie–Grüneisen–Debye EoS [27]. To date, the thermal expansion of diopside has only been published for ambient pressure conditions [28,29]. Meanwhile, since the heat capacity of diopside has only been measured at ambient pressure conditions [30,31,32], the available Grüneisen parameter data of diopside are consequently limited at ambient pressure conditions as well [33]. Moreover, the elastic and thermodynamic parameters of diopside have tended to be obtained individually via different methods. Still, it has been demonstrated that great care must be taken to preserve thermodynamic self-consistency in describing the temperature and pressure dependence of a material simultaneously [34,35].
This study reports the unit-cell volume, elastic moduli, thermal expansion, heat capacity, and Grüneisen parameters of diopside at high temperatures and high pressures, using an iterative numerical approach. To investigate the effect of mineral composition on the adiabatic temperature gradient, we present adiabatic temperature gradients calculated using thermodynamic data on olivine, garnet, and diopside. Finally, we apply the obtained thermodynamic data on diopside to estimate the adiabatic temperature gradient and geotherm of an eclogitic upper mantle in a depth range of 200–450 km, based on the assemblage of eclogitic mineral compositions, and compare our predictions with previous studies.

2. Methods

2.1. Theory

The approach used in this study has been described in published papers [19,20,21]; the fundamental equations are shown below. Note that the uncertainties of the derived parameters are estimated from the experimental measuring error propagations using a Taylor series expansion [20].
The thermal expansion at constant pressure is related to volume (V) as α = (1/V) × (∂V/∂T)P; the integration of this expression yields [36]
V T = V T 0 e x p T 0 T α T d T
where VT0 is the volume at a reference temperature T0. The isothermal derivative of V with respect to pressure can be written as
V P T = V 2 1 v B 2 + T α 2 C P
where vB refers to the bulk velocity, which is related to the P-wave velocity (vP) and S- wave velocity (vS) as
v B = v p 2 4 3 v s 2 1 2
Moreover, the isothermal derivative of the heat capacity with respect to pressure can be evaluated by
C P P T = V T α 2 + α T P  
To start the calculation, first, we use the experimental volume data at high temperatures to obtain α(P0,T) at ambient pressure by Equation (2). With α(P0,T) and the relationship between CP and temperature at ambient pressure CP(P0,T), the approximate V at an arbitrary reference pressure can be estimated using Equation (3). Then, the resulting V is used to update the value of α and CP at the same pressure as in Equations (2) and (5), respectively. Hence, iterations of this loop lead to converged values of V, α, and CP as a function of temperature and pressure based on experimental elastic wave velocity. Furthermore, the self-consistent elastic parameters, including the adiabatic bulk modulus (KS), isothermal bulk modulus (KT), and shear modulus (G), as well as the Grüneisen parameter (γ), can be consequently derived (Equations (6)–(9)).
K S = 1 V v p 2 4 3 v s 2
K T = K S 1 + α γ T
G = 1 V v S 2
γ = α K S V C P

2.2. Thermoelastic Data

2.2.1. Elastic Wave Velocity under High-Temperature and High-Pressure Conditions

The elastic wave velocities of diopside have been obtained using Brillouin spectroscopy [37], ultrasonic interferometry [23], and first-principle calculations [24] under high-pressure conditions. The experimental data presented by Li and Neuville [23] indicated that vP and vS of diopside increase linearly with pressure and temperature within their measured P–T range. Meanwhile, the results by Sang and Bass [37] and Zou et al. [24] suggested that both vP and vS show noticeable nonlinear dependence on pressure over ~8 GPa. Hence, we use the data from Li and Neuville [23] and fit it with a two-dimensional equation:
v = m 0 + m 1 × T 300 + m 2 × P + m 3 × P 2
The fitting coefficients are listed in Table 1, with P in GPa, T in K, and vP and vS in m/s. The adjusted R2 values are 0.979 and 0.953 for vP and vS, respectively. The calculated elastic wave velocities for Equation (10) agree well with the available data [24,37]. The largest differences are less than 0.5% and 1.2% for vP and vS, respectively, within our calculated P–T range.

2.2.2. Unit-Cell Volume under High-Temperature and Ambient Pressure Conditions

The ambient pressure unit-cell volumes of diopside were measured using X-ray diffraction at high temperatures [28,29,38,39]. In this study, we fitted the experimental volume data from Pandolfo et al. [28] to Equation (2) with the program EosFit7 GUI [40], thereby obtaining the thermal expansion as a function of temperature using the formula suggested by Fei [41]:
α T = 2.8485 12 × 10 5 + 4.473 11 × 10 9 T 0.2251 12 T 2
Here, we take T0 = 303 K and VT0 = 428.70 Å3, which are the values suggested by Pandolfo et al. [28]. The volumes calculated using Equations (2) and (11) show good agreement with the previous experimental results [28,29,38,39], with the largest difference being less than 0.3%.

2.2.3. Heat Capacity under High-Temperature and Ambient Pressure Conditions

The heat capacity of diopside at high temperatures below 1000 K has been determined by Stebbins et al. [32] and Krupka et al. [30] by using calorimetry. Then, Richet and Fiquet [31] extended the measuring temperature to ~1600 K, and the experimental data were fitted to different forms. Here, we use Equation (12), which was suggested by Richet and Fiquet [31] to be the best for describing their data:
C P = 186.908 + 57.729 ln T + 5.5483 × 10 4 T 1 2.2557 × 10 7 T 2 + 2.4436 × 10 9 T 3
where CP is in J/mol K and T is in K. The quality of the fit is excellent, with an adjusted R2 value of 0.993 and the largest error being 0.12%.

3. Results

3.1. Unit-Cell Volumes at High Temperatures and High Pressures

Figure 1 presents comparisons between our calculated unit-cell volume of diopside (Supplementary Materials) and previously published results. At 300 K, our data shows good agreement with the results measured using X-ray diffraction [42,43]. The excellent consistency with available experimental results also holds at high temperatures up to 1073 K [23,25], with the largest differences being less than ~0.3%. Though our unit-cell volume is slightly lower than the first-principle calculation result under high-temperature conditions [24], the uncertainty is within 1.2%.

3.2. Elastic Properties at High Temperatures and High Pressures

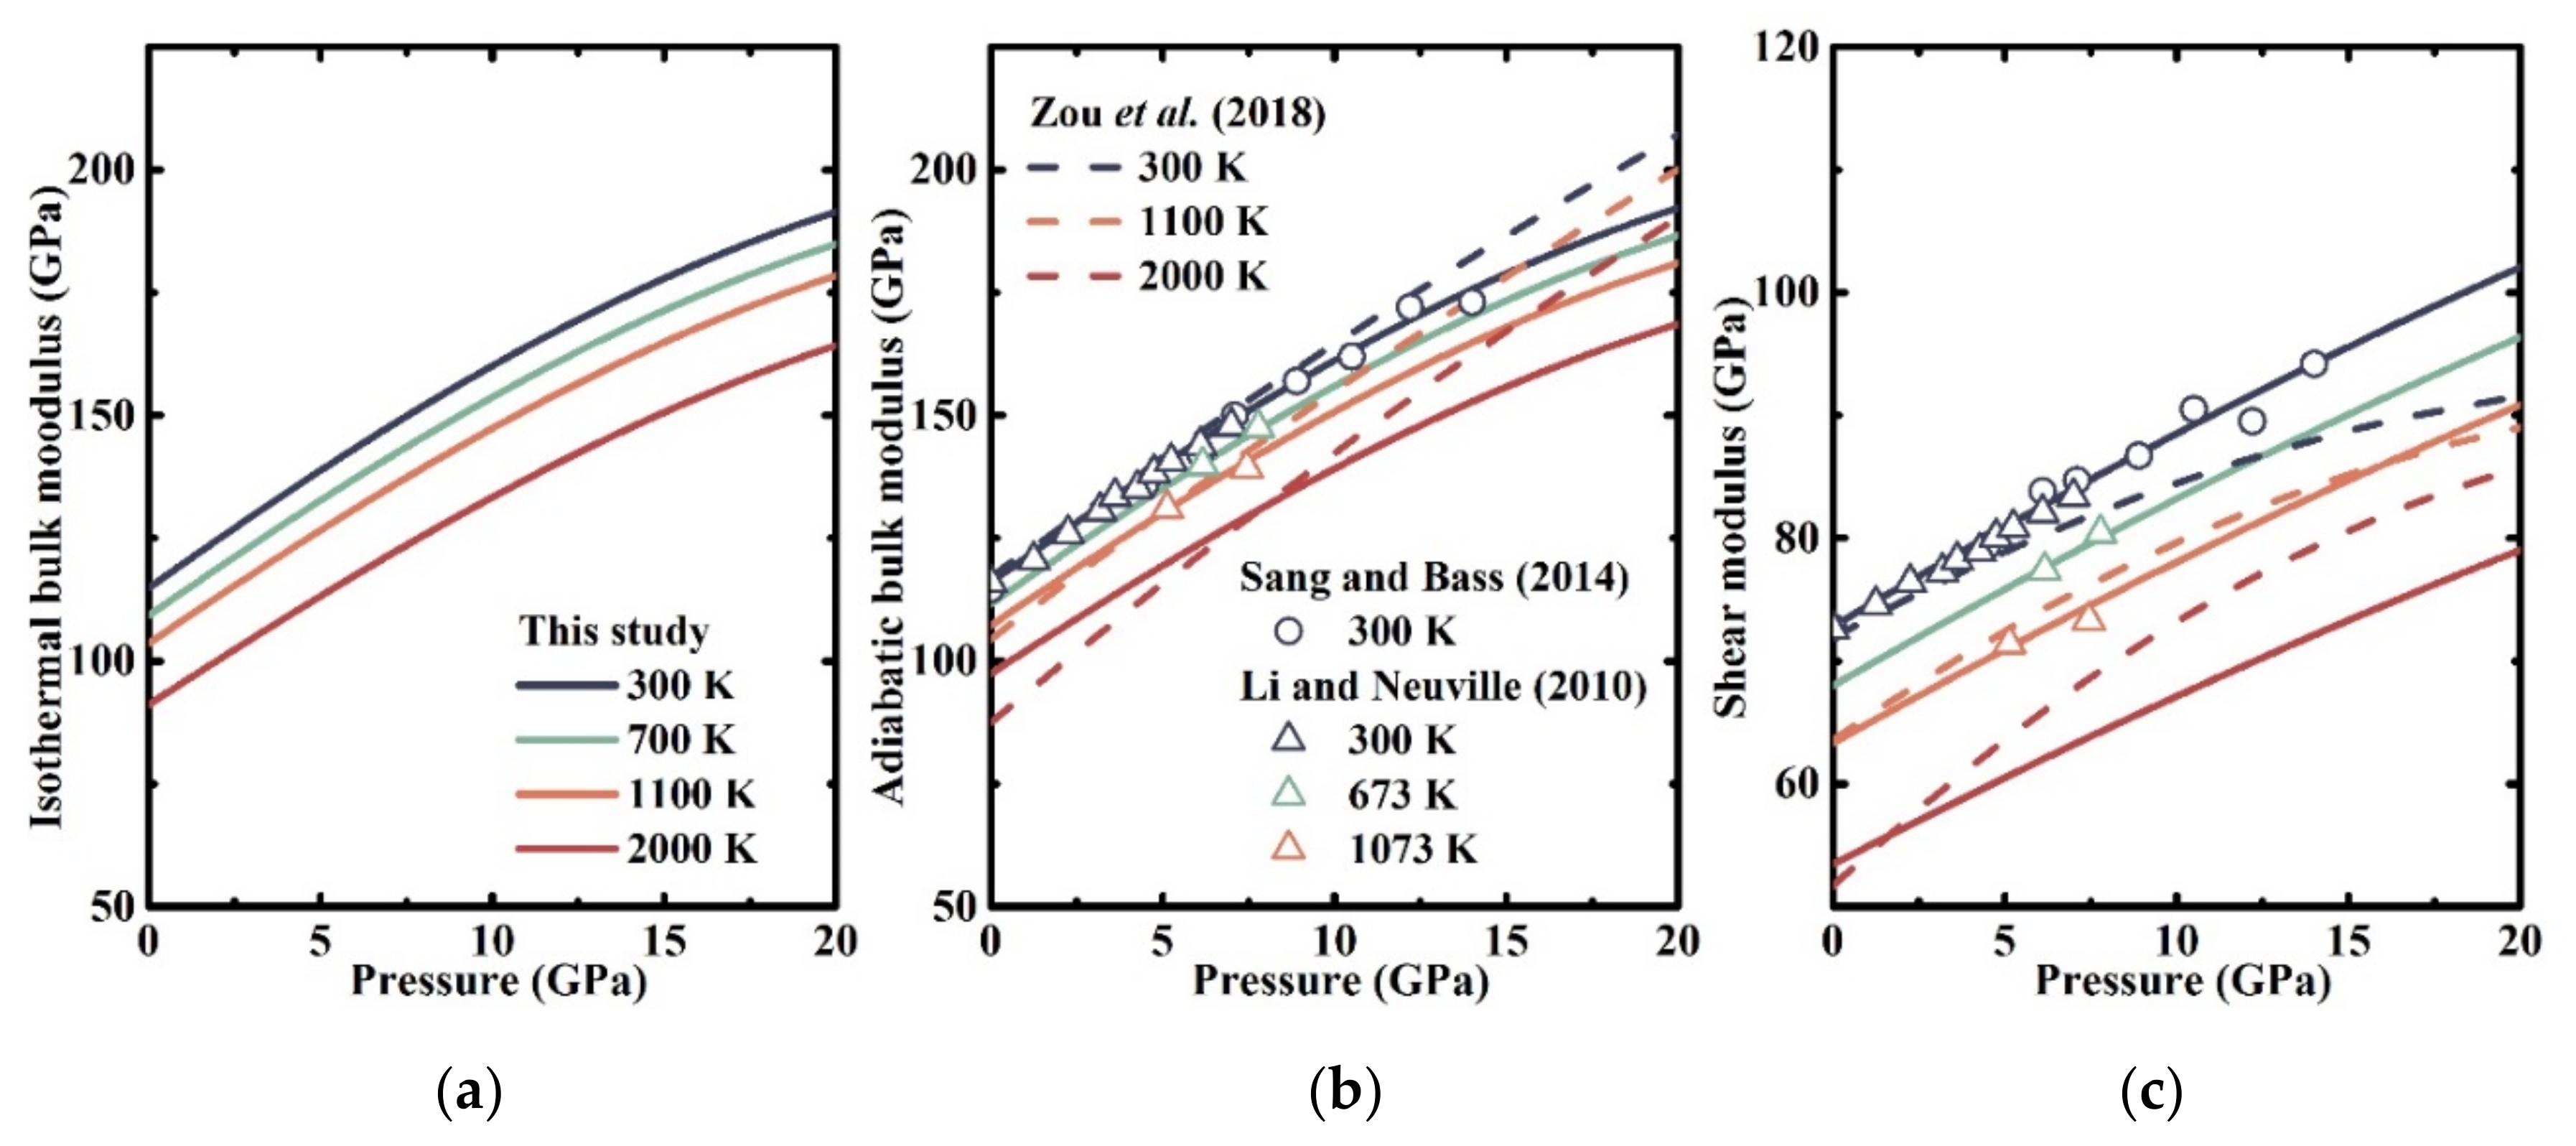
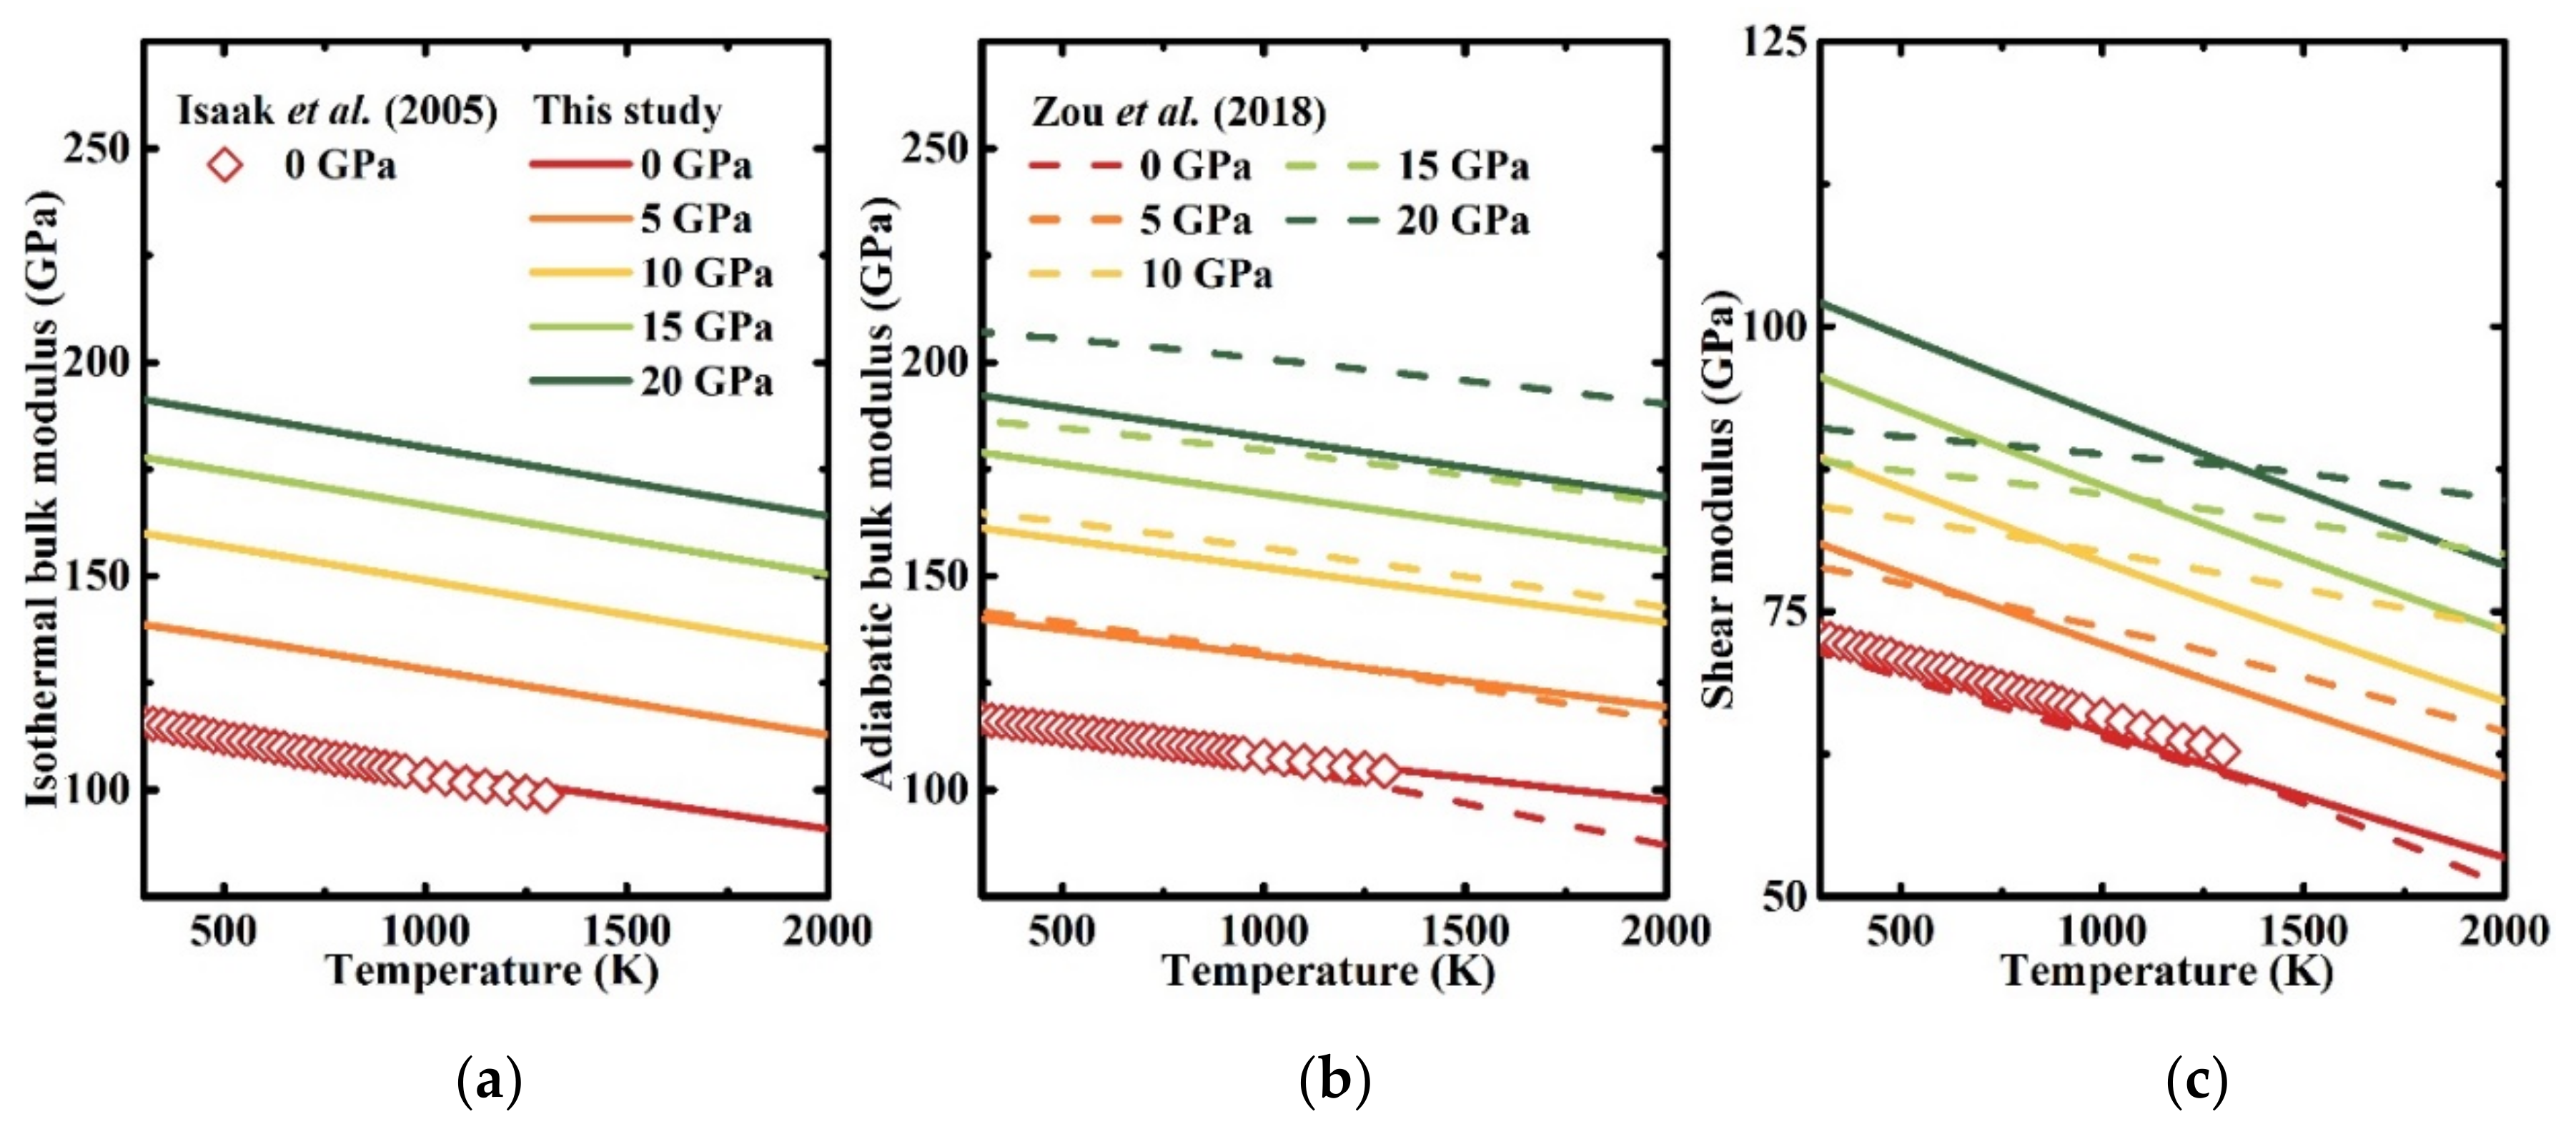
With the combination of the determined unit-cell volume and previously published vP and vS values at PTs [23], the KT, KS, and G of diopside can be calculated via Equations (6)–(8); the results are shown in Table 2 and Figure 2 and Figure 3.
As shown in Table 2, the KT, KS, and G values under ambient conditions have been determined as 114.8 GPa, 116 GPa, and 72.8 GPa, respectively, which generally agree with the experimental [23,25,37,42,43,44,45] and theoretical [24,46] results. All three elastic moduli show a nonlinear relationship with pressure and a linear relationship with temperature. At room temperature, the first pressure derivatives of the elastic moduli have been determined as ∂KT/∂P = 5.17, ∂KS/∂P = 5.18, and ∂G/∂P = 1.67, and the second pressure derivatives of elastic moduli have been determined as ∂2KT/∂P2 = −0.066/GPa, ∂2KS/∂P2 = −0.067/GPa, and ∂2G/∂P2 = −0.0106/GPa. Also, the temperature derivatives of elastic moduli have been determined as ∂KT/∂T = −0.0142 GPa/K, ∂KS/∂T = −0.011 GPa/K, and ∂G/∂T = −0.0114 GPa/K under ambient pressure conditions; these values are consistent with previously presented results [23,24,25].
Table 2. Elastic moduli of diopside and their first and second derivatives with respect to pressure and temperature.
KT0
GPa
(∂KT/∂P)T(∂2KT/∂P2)T
/GPa
(∂KT/∂T)P
10–2 GPa/K
References
114 (4)4.5 (1.8) Levien and Prewitt (1981) [44]
109.14.84 −2.05Zhao et al. (1998) [25]
105.1 (9)6.8 (1) Tribaudino et al. (2000) [43]
118 (1)3.8 (2) Thompson and Downs (2008) [42]
1224.7 Walker et al. (2008) [46]
116.44.62 −1.72Zou et al. (2018) [24]
114.85.17–0.066−1.42This study
KS0
GPa
(∂KS/∂P)T(∂2KS/∂P2)T
/GPa
(∂KS/∂T)P
10–2 GPa/K
References
116.4 (7)4.9 (1) −1.2 (1) Li and Neuville (2010) [23]
114.6 (7) Sang et al. (2011) [45]
114.6 (7)4.8 (2) Sang and Bass (2014) [37]
117.55.0−0.026 −1.5Zou et al. (2018)
116.05.18−0.067−1.10This study
G0
GPa
(∂G/∂P)T(∂2G/∂P2)T
/GPa
(∂G/∂T)P
10–2 GPa/K
References
73.0 (4)1.6 (1)−1.1 (1)Li and Neuville (2010) [23]
72.7 (4)Sang et al. (2011) [45]
72.7 (4)1.7 (1)Sang and Bass (2014) [37]
71.81.56−0.0302−0.871Zou et al. (2018) [24]
72.81.67−0.0106−1.14This study
The pressure and temperature dependences of these elastic moduli are shown in Figure 2 and Figure 3, respectively. In Figure 2b,c, the calculated KS and G values are in good agreement with the available experimental measurements under the relevant conditions [23,37]. Also, in Figure 2b, our ambient and high temperature KS values generally agree with the first-principle calculations performed by Zou et al. [24] for under ~10 GPa. Then, the pressure derivative becomes smaller than that from Zou et al. [24], leading to a significant separation of ~10% at 20 GPa. Then, in Figure 2c, our calculated G value is in good agreement with the result from Zou et al. [24] at 1100 K. Compared to Zou et al. [24], our result is larger than that from Zou et al. [24] at 300 K, and smaller than that from Zou et al. [24] at 2000 K.
In Figure 3, at ambient pressure, our elastic moduli are generally consistent with the experimental study by Isaak et al. [33], which presented the ambient pressure elastic properties of chrome-diopside. The largest differences between our and Isaak’s results are 2.1%, 0.6%, and 2.8% for KT, KS, and G, respectively. In addition, our KS and G values are generally consistent with the results from Zou et al. [24] below 10 GPa. Then, the separations get more significant along with the pressure due to the differences in the pressure derivatives of KS and G.

3.3. Thermodynamic Properties at High Temperatures and High Pressures

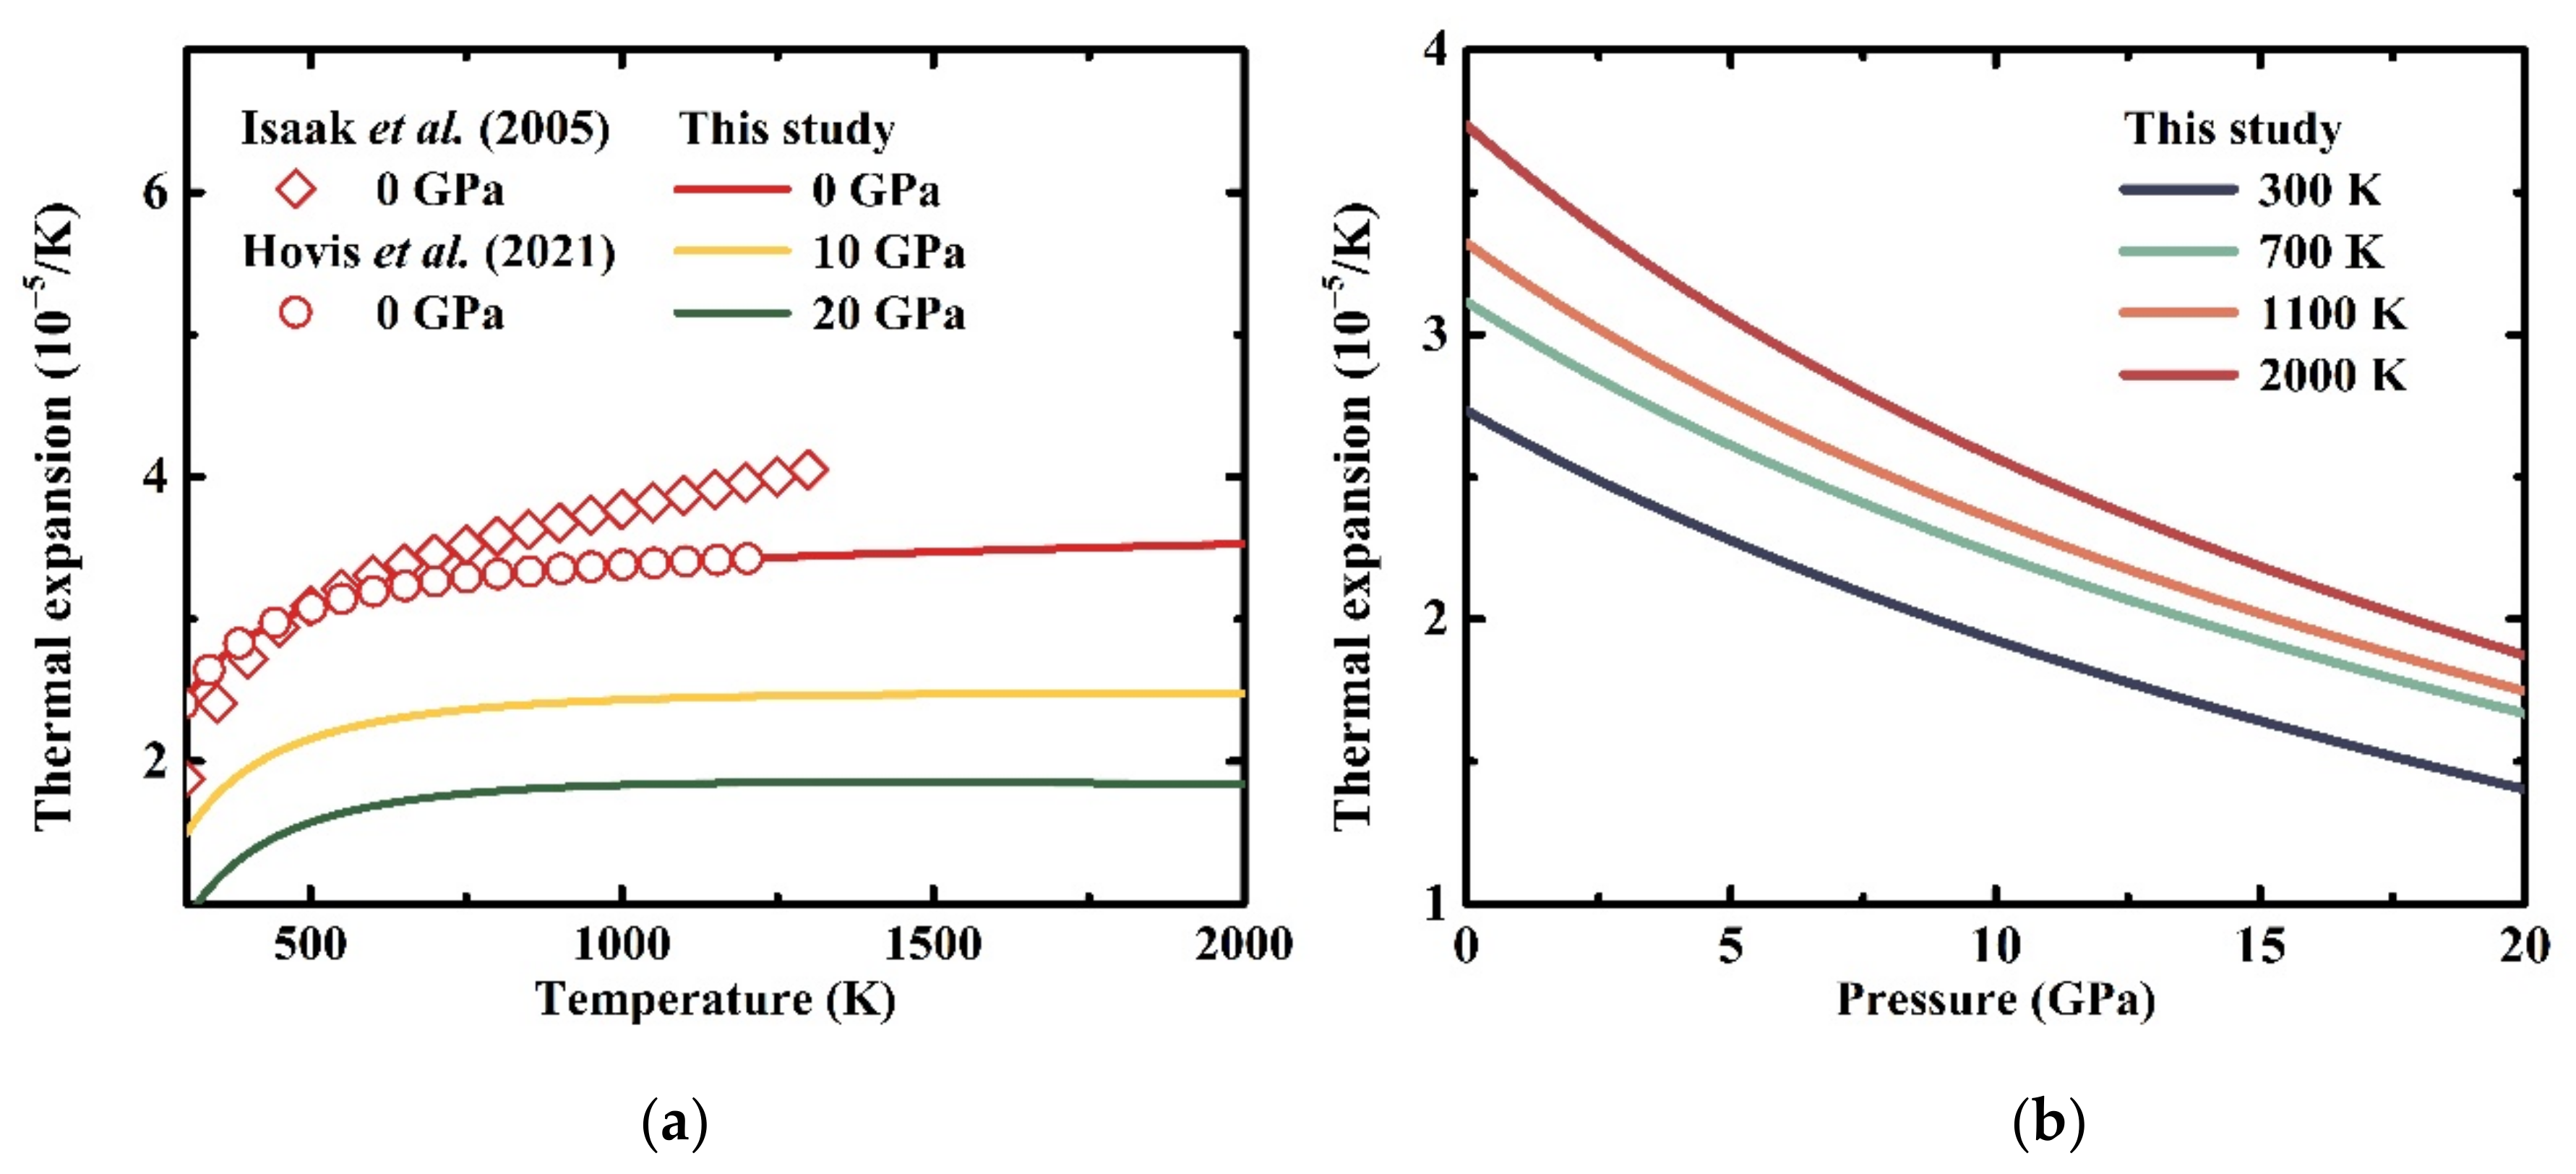
Our calculated thermal expansion, heat capacity, and Grüneisen parameters of diopside are illustrated in Figure 4, Figure 5 and Figure 6, respectively. Figure 4a shows the temperature dependence of the thermal expansion of diopside at several pressure conditions, as well as previous results for comparisons. At ambient pressure, the temperature derivative of our calculated thermal expansion ∂α/∂T is ~5.0 × 10⁻⁴/K2 over 500 K. This value is lower than that presented by Isaak et al. [33], which was obtained from the combination of previous studies [38,39,47]. Moreover, the difference in ∂α/∂T causes a 17% deviation at 1300 K. On the other hand, our result is in good agreement with the recent data obtained via an X-ray diffraction study by Hovis et al. [29], with the largest difference being 4.7% in the temperature range of 500–1500 K.
Currently, the published heat capacities of diopside are limited under ambient conditions. In Figure 5a, since the heat capacity of diopside for our calculation was taken from previous experimental studies [31], our obtained heat capacity is in good agreement with the experimental data presented by Krupka et al. [30], with a difference of 1.9%, and generally agrees with the result presented by Stebbins et al. [32] below ~850 K, with a difference of 1.5%.
The Grüneisen parameter is a valuable thermodynamic parameter in geophysics which can set limitations on the pressure and temperature dependence of the thermal properties of the mantle and core and constrain the adiabatic temperature gradient [48]. In Figure 6a, our calculated Grüneisen parameter shows a rapid decrease to ~500 K and then tends to nearly a constant, with a very small temperature derivative of –5.0 × 10⁻⁵/K at 2000 K. The result is 15% lower than that from Isaak et al. [33] at 1300 K, which is probably caused by the difference in the chemical composition of minerals. Also, the Grüneisen parameter proposed by Isaak et al. [33] demonstrated a rapid increase below ~500 K; in contrast, our determined data shows an opposite trend, exhibiting a similar pattern to garnet and olivine under ambient pressure conditions [20,49].
Additionally, to investigate the effects of pressure on the thermodynamic properties of diopside, the calculated thermal expansion, heat capacity, and Grüneisen parameters as a function of pressure at different temperatures are illustrated in Figure 4b, Figure 5b and Figure 6b, respectively. All α, CP, and γ values for diopside show nonlinear pressure dependences. Hence, we fitted the thermodynamic parameters into the equation N = N0 + ∂N/∂P × P + ∂2N/∂P2 × P2 at different temperatures; where N refers to the thermodynamic properties; N0 refers to N ambient pressure; and ∂N/∂P and ∂2N/∂P2 refer to the first and second pressure derivatives of N, respectively. The fitting coefficients are listed in Table 3.
In Table 3, all α, CP, and γ values show negative pressure dependences, and the effects of pressure on α and CP increase along with the temperature. At room temperature, the first pressure derivative of α is ∂α/∂P = –0.92 × 10⁻⁶/K GPa. This value is larger than that suggested by Zhao et al. [25] (–1.52(2) × 10–6/K GPa), which was determined in the P–T range of 8.2 GPa and 1280 K with a linear fitting equation. Then, increasing the temperature to 2000 K, ∂α/∂P decreases to ∂α/∂P = –1.37 × 10⁻⁶/K GPa. Similarly, the pressure derivative of CP (∂CP/∂P) decreases from –0.417 J/mol K GPa to –0.688 J/mol K GPa in the temperature range of 300–2000 K. In particular, the first pressure derivative of the Grüneisen parameter is ∂γ/∂P = −3.4 × 10⁻³/GPa at room temperature. Then, the value increases with temperature to −2.6 × 10⁻³/GPa at ~500 K because of the variations at the low-temperature range, and decreases with the temperature again to –4.8 × 10⁻³/GPa at 2000 K.

4. Discussion

4.1. Effect of Mineral Composition on the Adiabatic Temperature Gradient

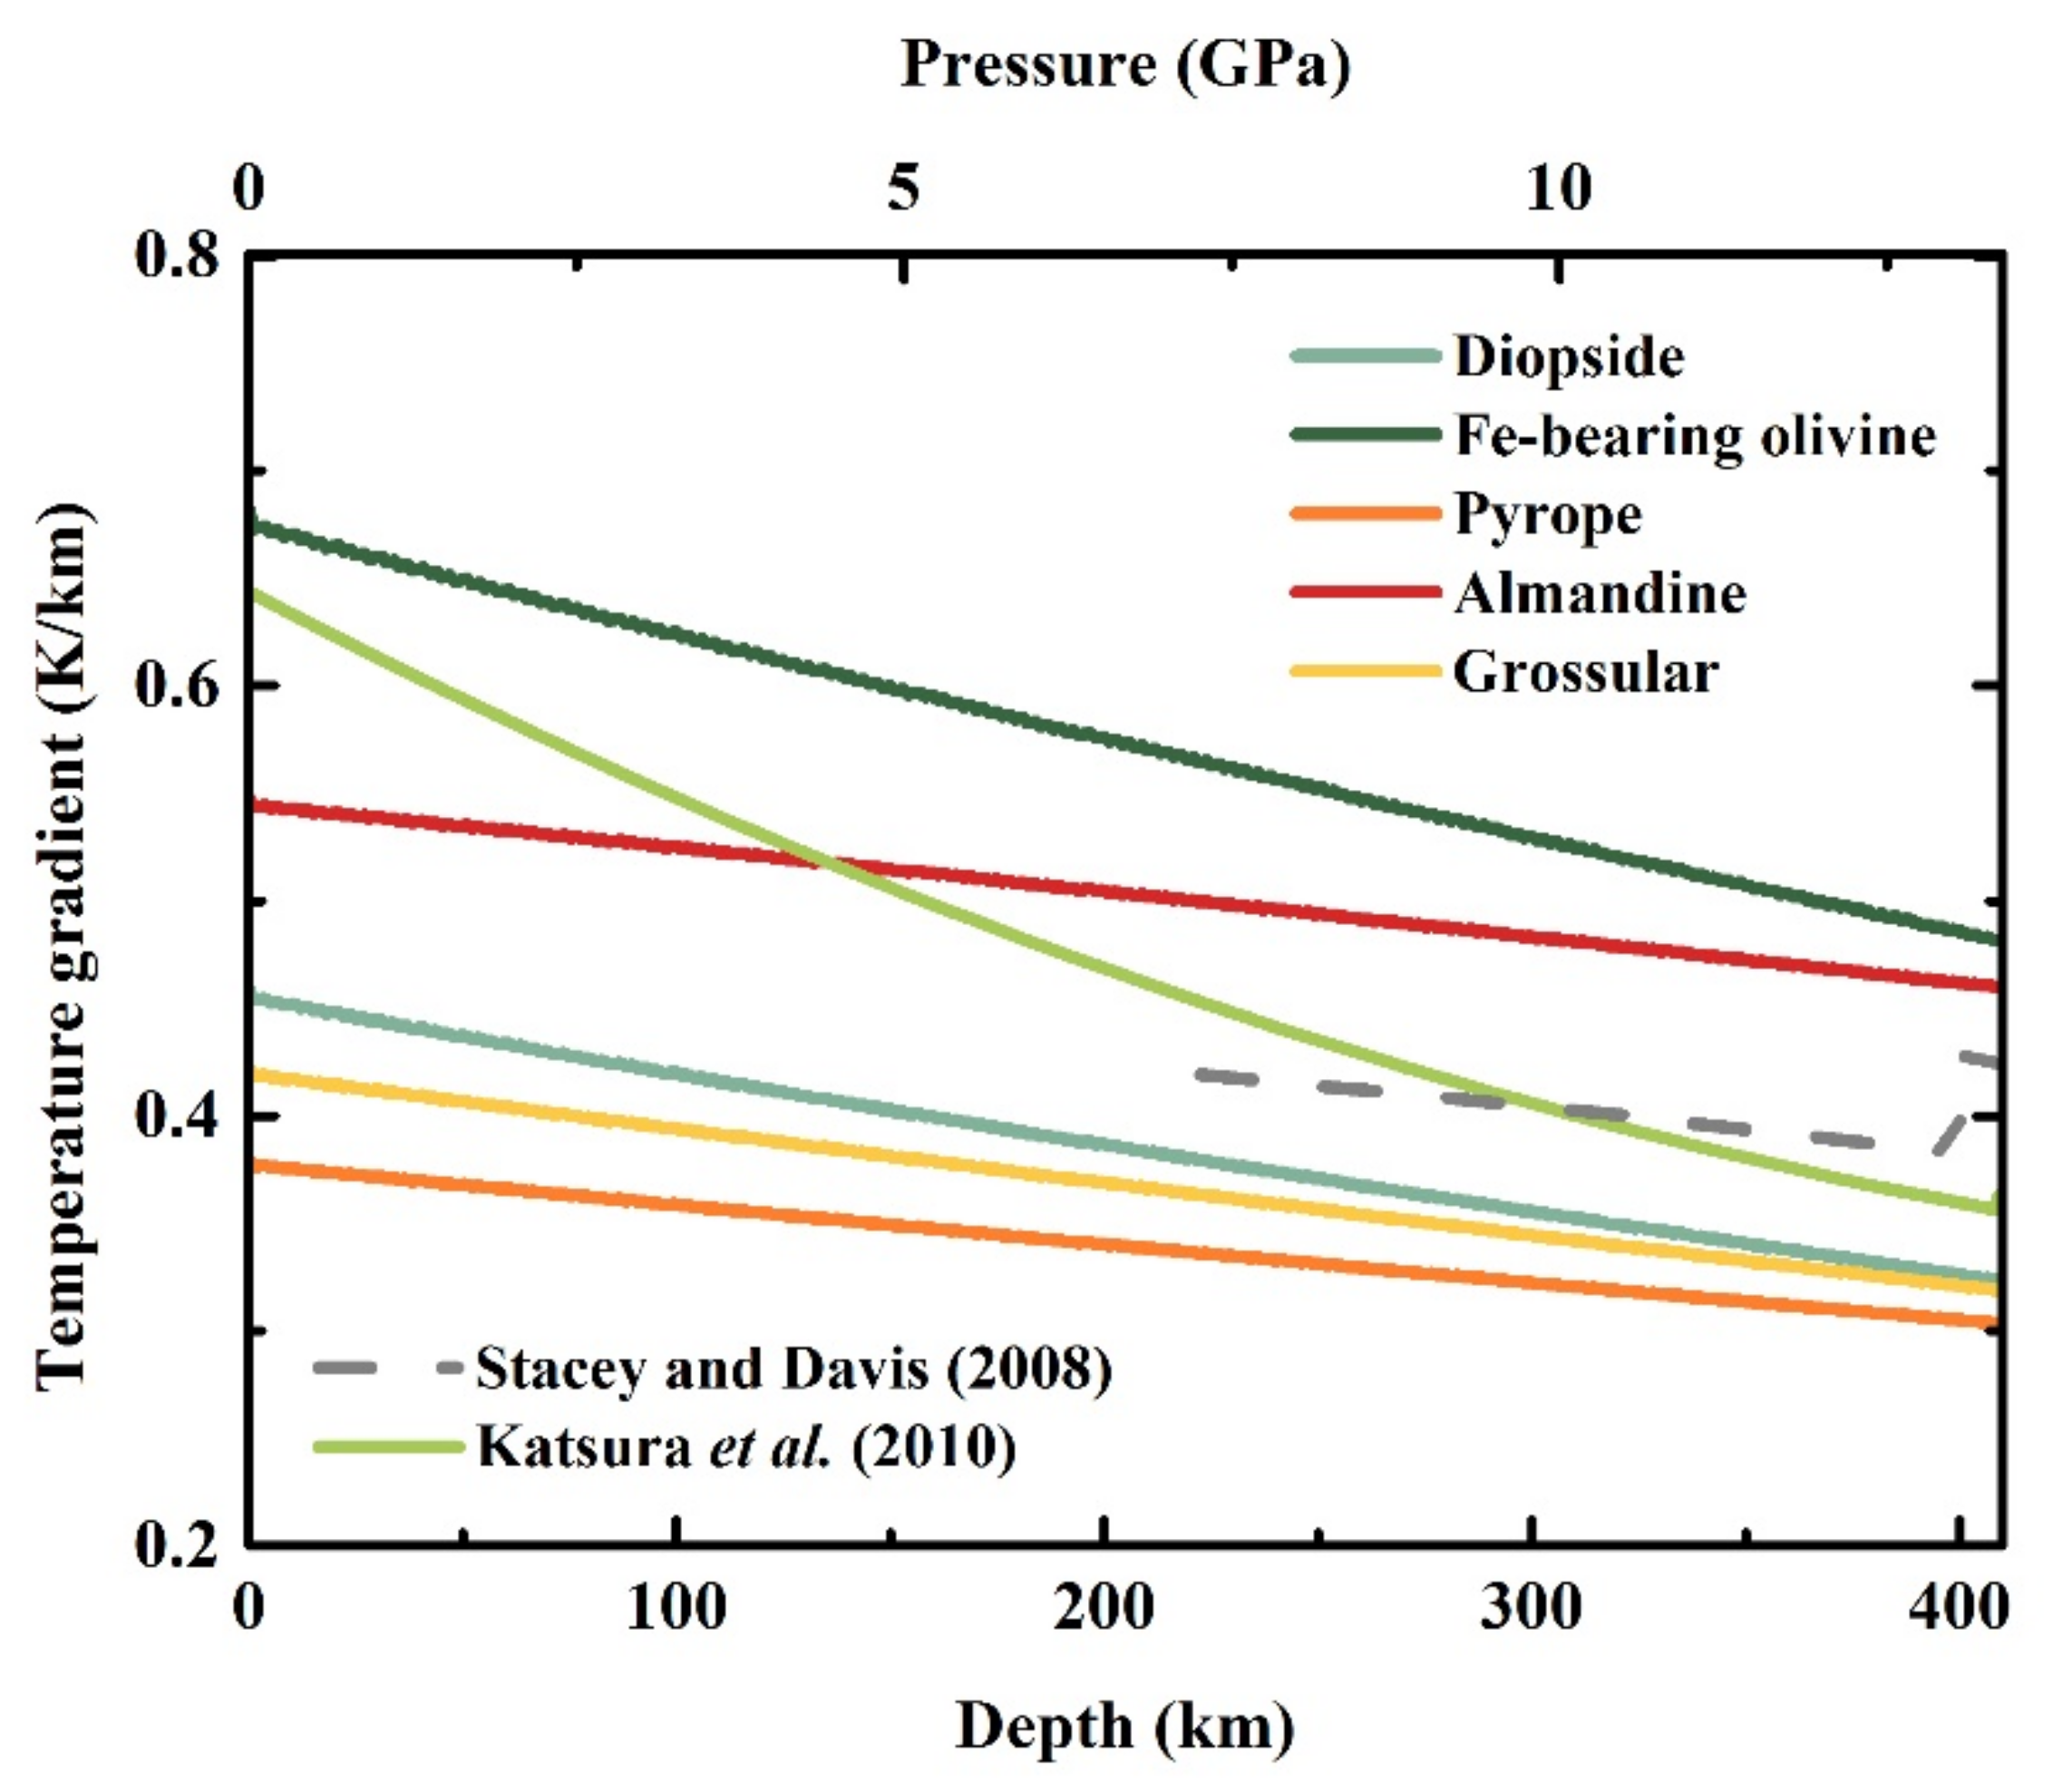
Based on the obtained thermodynamic data on diopside, we have estimated the adiabatic temperature gradient ((∂T/∂z)S) by using Equation (1); the result is shown in Figure 7. To investigate the effect of mineral composition on the adiabatic temperature gradient, the (∂T/∂z)S values obtained using thermodynamic data on Fe-bearing olivine ([Fe0.2Mg0.8]2SiO4), pyrope (Mg3Al2[SiO4]3), almandine (Fe3Al2[SiO4]3), and grossular (Ca3Al2[SiO4]3) are also illustrated in Figure 7 for comparison [19,20,21]. Note that the mantle potential temperature (TP), which refers to the temperature that it would have upon ascending adiabatically to the Earth’s surface without undergoing partial melting [50], is employed as TP = 1610 K [18]. Additionally, the pressure and gravitational acceleration variations with depth are from the study performed by Stacey and Davis [4].
The (∂T/∂z)S values obtained using thermodynamic data on diopside are 0.46 K/km, 0.39 K/km, and 0.32 K/km at depths of 0 km, 200 km, and 410 km, respectively; the value is ~14% lower than that obtained by Stacey and Davis [4] in the depth range of 220–410 km. For the Fe-free minerals, at a depth of 200 km, the (∂T/∂z)S value obtained using thermodynamic data on diopside is 14% and 5% higher than that of pyrope and grossular, respectively, whilst it is 17% lower than that of forsterite. Also, this value is 33% and 23% lower than that of the Fe-bearing olivine and Fe-bearing garnet (almandine), respectively. Moreover, a previous study suggested that the depth derivatives of (∂T/∂z)S of those minerals from the same group are similar [20]. In this study, the depth derivative of (∂T/∂z)S obtained from thermodynamic data on diopside is –3.0 × 10⁻⁴ K/km2 in the depth range of 200–410 km, which is smoother than that of olivine (–5.0 × 10⁻⁴ K/km2) and steeper than that of garnet (–2.0 × 10⁻⁴ K/km2) [20].

4.2. Adiabatic Geotherm of the Eclogite Model

It is widely accepted that the bulk mantle mineral assemblages can be represented by the pyrolite model [11,51]. The seismic discontinuities at depths of 410 km, 520 km, and 660 km are associated with the phase transitions from (Mg,Fe)2SiO4 olivine (α-phase) to wadsleyite (β-phase) and from wadsleyite to ringwoodite (γ-phase) and the dissociation of ringwoodite into bridgmanite and periclase, respectively, for the pyrolite model [52,53]. Hence, the temperature at these seismic discontinuities can be estimated by comparing the depth of these seismic discontinuities with the transition pressures in the system Mg2SiO4-Fe2SiO4 [2,18]. With the combination of the thermal equations of states of (Mg, Fe)2SiO4 olivine and its high-pressure phase minerals, as well as Equation (1), the adiabatic temperature gradient (∂T/∂z)S and adiabatic geotherm of a pyrolitic mantle was presented for ~3000 km by Katsura et al. [18], which has been widely used in later investigations.
Meanwhile, the upper mantle under the subducted oceanic crust is generally considered eclogitic in composition [12,54]. The subducting slab has a layered structure: overlying crust of mid-ocean ridge basalt (MORB), followed by residual harzburgite and depleted pyrolite from top to bottom [55,56]. When the subducting slab is subducted into the mantle, the MORB transforms directly into eclogite, which mainly contains an assemblage of eclogitic garnet and clinopyroxene, and becomes denser than the harzburgite underlying it [57,58]. Then, the clinopyroxene starts to dissolve progressively into stishovite and garnet, which then completely forms majoritic garnet by a depth of ~450 km [59,60,61]. Hence, the mineral composition of an eclogitic upper mantle is quite different from a pyrolitic upper mantle, which raises the question: Will the geotherm of the eclogite model also be different from the pyrolite model?
In order to estimate the adiabatic geotherm of an eclogitic upper mantle with Equation (1), it is necessary to determine the TP of the oceanic mantle first. Previous research on the generation of the oceanic upper mantle proposed the TP of mid-ocean ridges as 1533 K [62]; then, the temperature was suggested to be hotter [63,64]. Recently, with the consideration of water content of the peridotite in MORB, the TP of mid-ocean ridges was constrained to 1623–1683 K [65]. Also, the composition at the top of an eclogitic upper mantle (200 km) is ~70% clinopyroxene, and ~30% eclogitic garnet [66]. Therefore, with the high temperature and high pressure thermodynamic data on diopside and eclogitic garnet, the temperature at a depth of 200 km can be estimated as 1699–1762 K via Equation (13) [50]. It is worth noting that the eclogitic garnet is composed of approximately 40% pyrope, 30% almandine, and 30% grossular [67,68].
T P = T e x p g α z C P
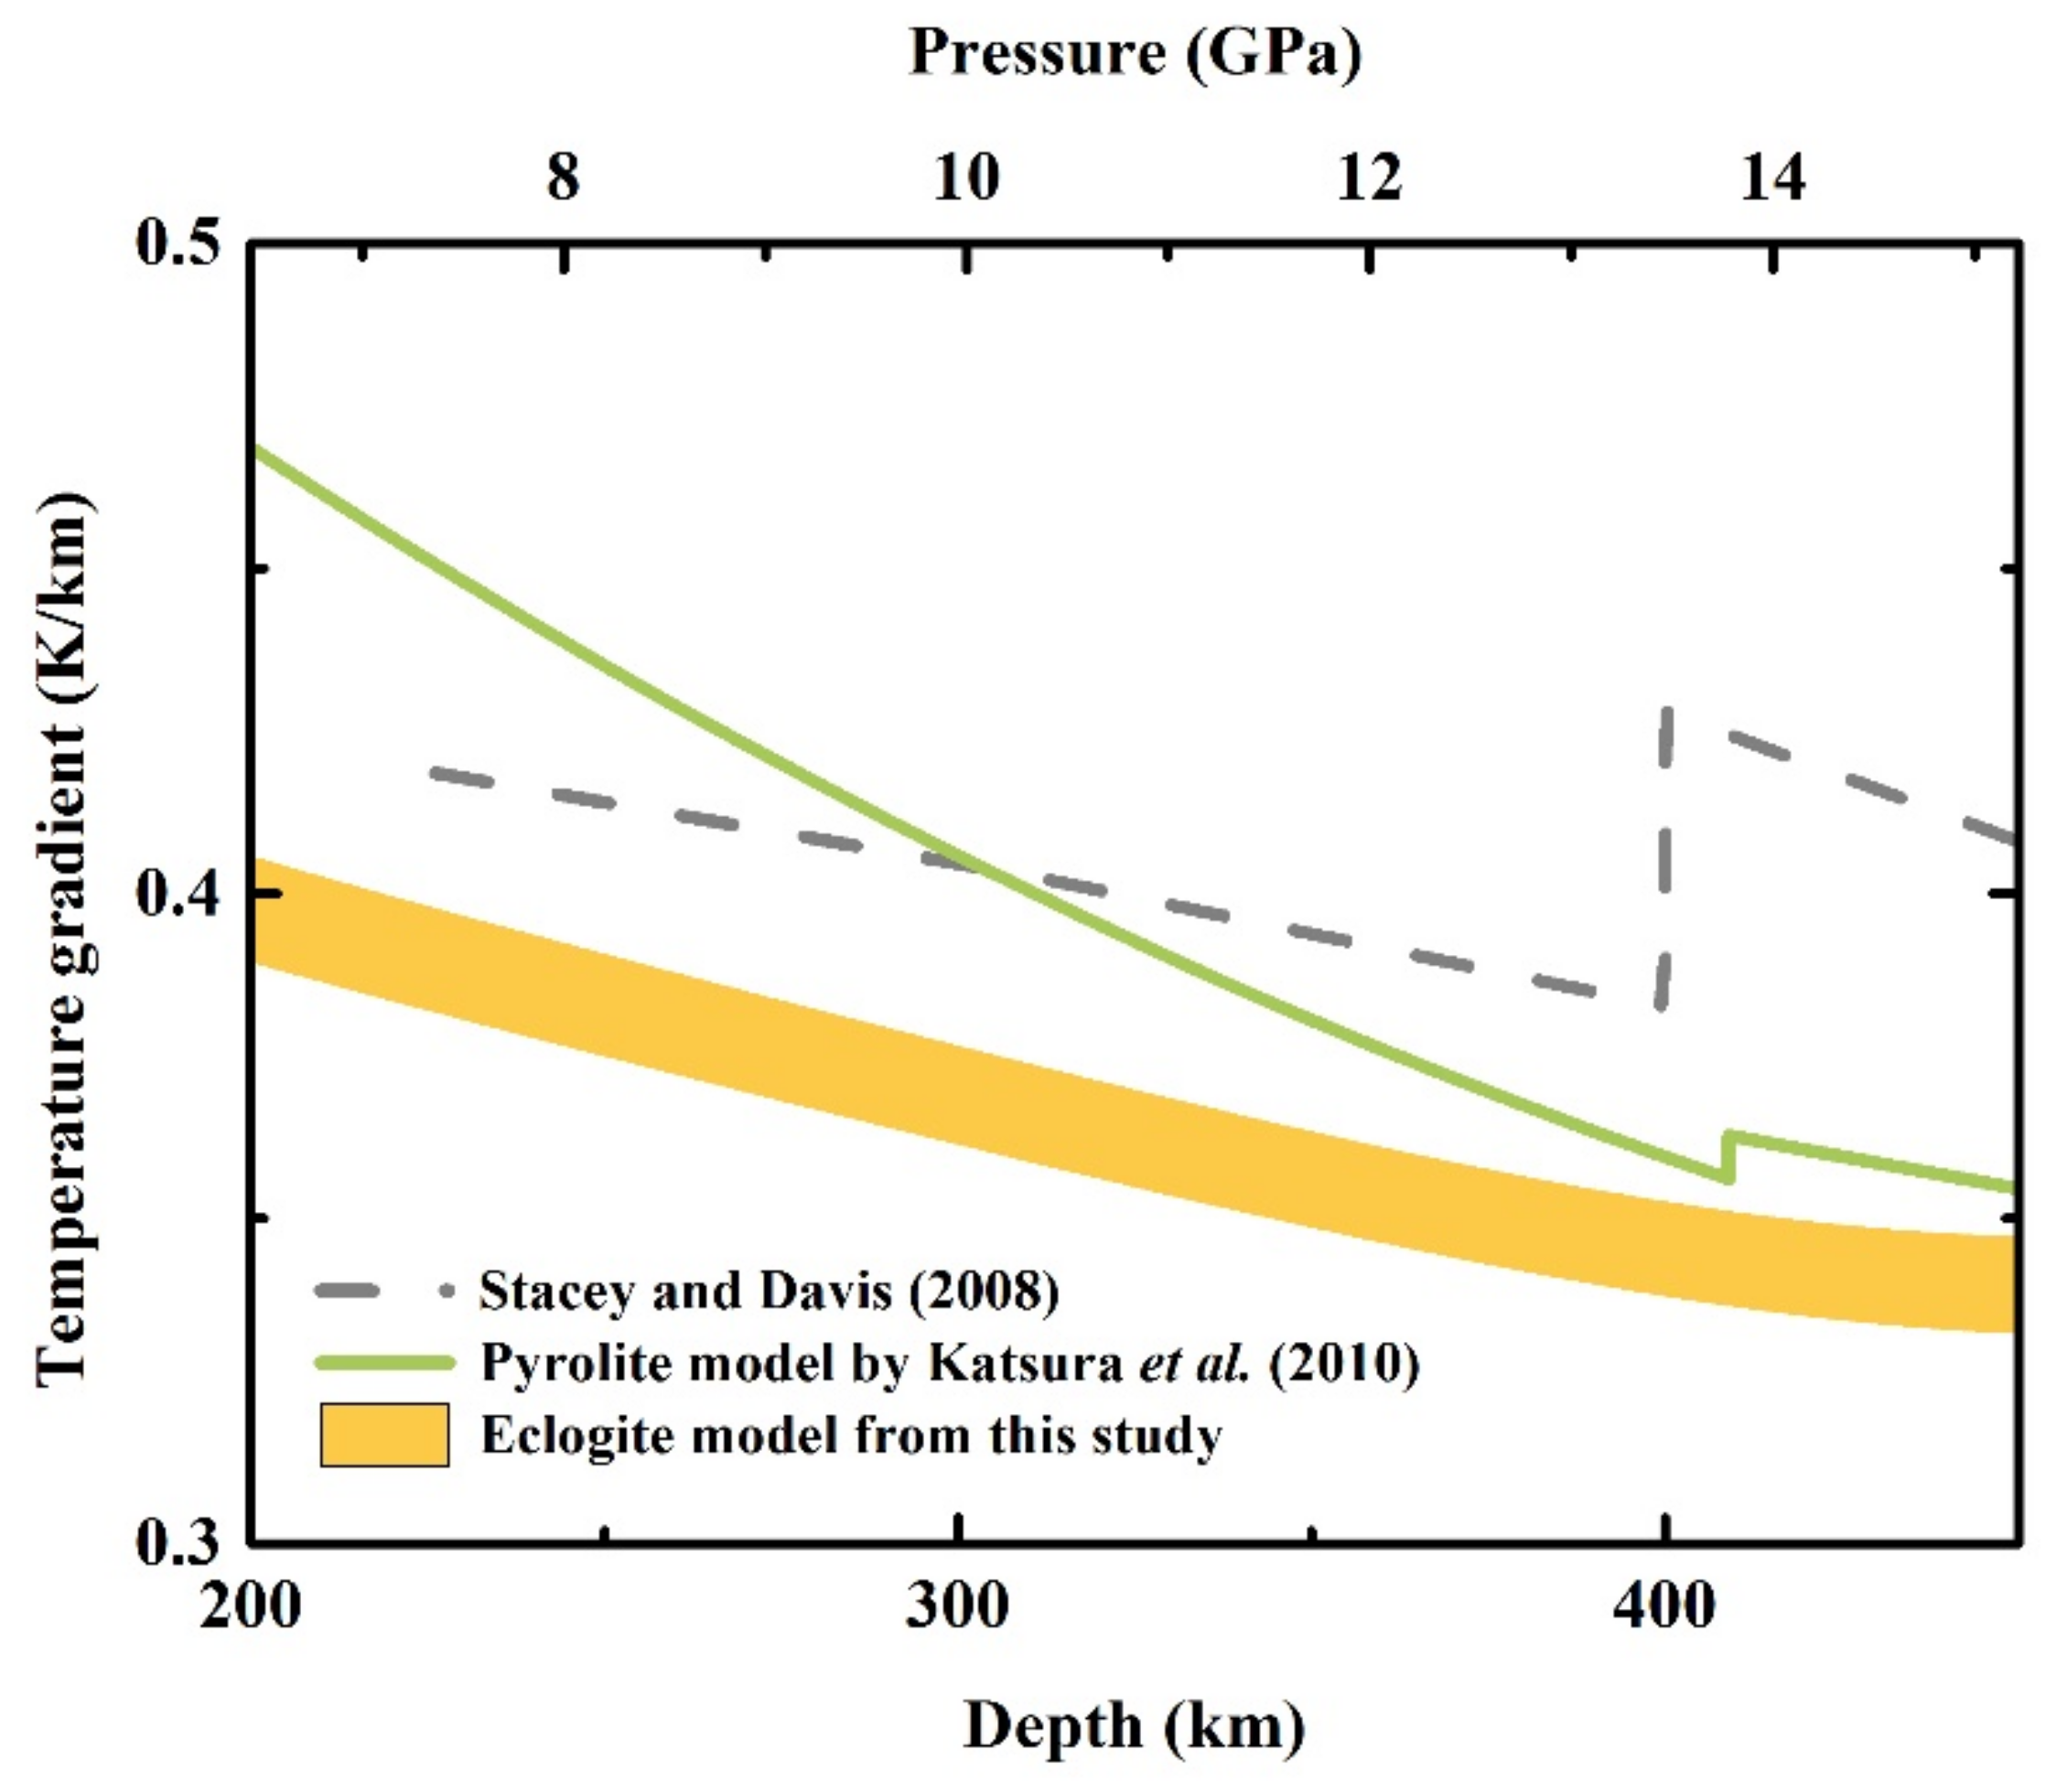
Based on the variations of mineral volume fraction with depth presented by Irifune et al. [66], our calculated (∂T/∂z)S value of the eclogite model in the depth range of 200–450 km is shown in Figure 8, together with the result obtained by using the seismic velocity [4] and the result for a pyrolitic upper mantle [18]. The (∂T/∂z)S value of the upper mantle was presented as a constant of 0.3 K/km in an early study [5]; later, a higher value was suggested at the top part of the upper mantle (0.4–0.5 K/km) [4,18]. In Figure 8, the (∂T/∂z)S value of the eclogitic model decreases from 0.39 K/km to 0.34 K/km at a depth range of 200–410 km when TP = 1623 K, which is ~12% lower than that presented by Stacey and Davis [4]. Also, the (∂T/∂z)S value of the eclogite model is ~17% lower than that of the pyrolite model suggested by Katsura et al. [18] at 200 km, but increasing the depth to 410 km, the values become closer, with a difference of 4%. Under 410 km, the (∂T/∂z)S value of the eclogite model maintains the same trend as the depth and decreases to 0.33 K/km at 450 km, while the (∂T/∂z)S value of the pyrolite model shows an increase because of the olivine–wadsleyite transition. Moreover, the value of (∂T/∂z)S for the eclogite model shows a ~5% increase with TP increasing from 1623 K to 1683 K; the values are 0.41 K/km, 0.35 K/km, and 0.34 K/km at depths of 200 km, 410 km, and 450 km, respectively.
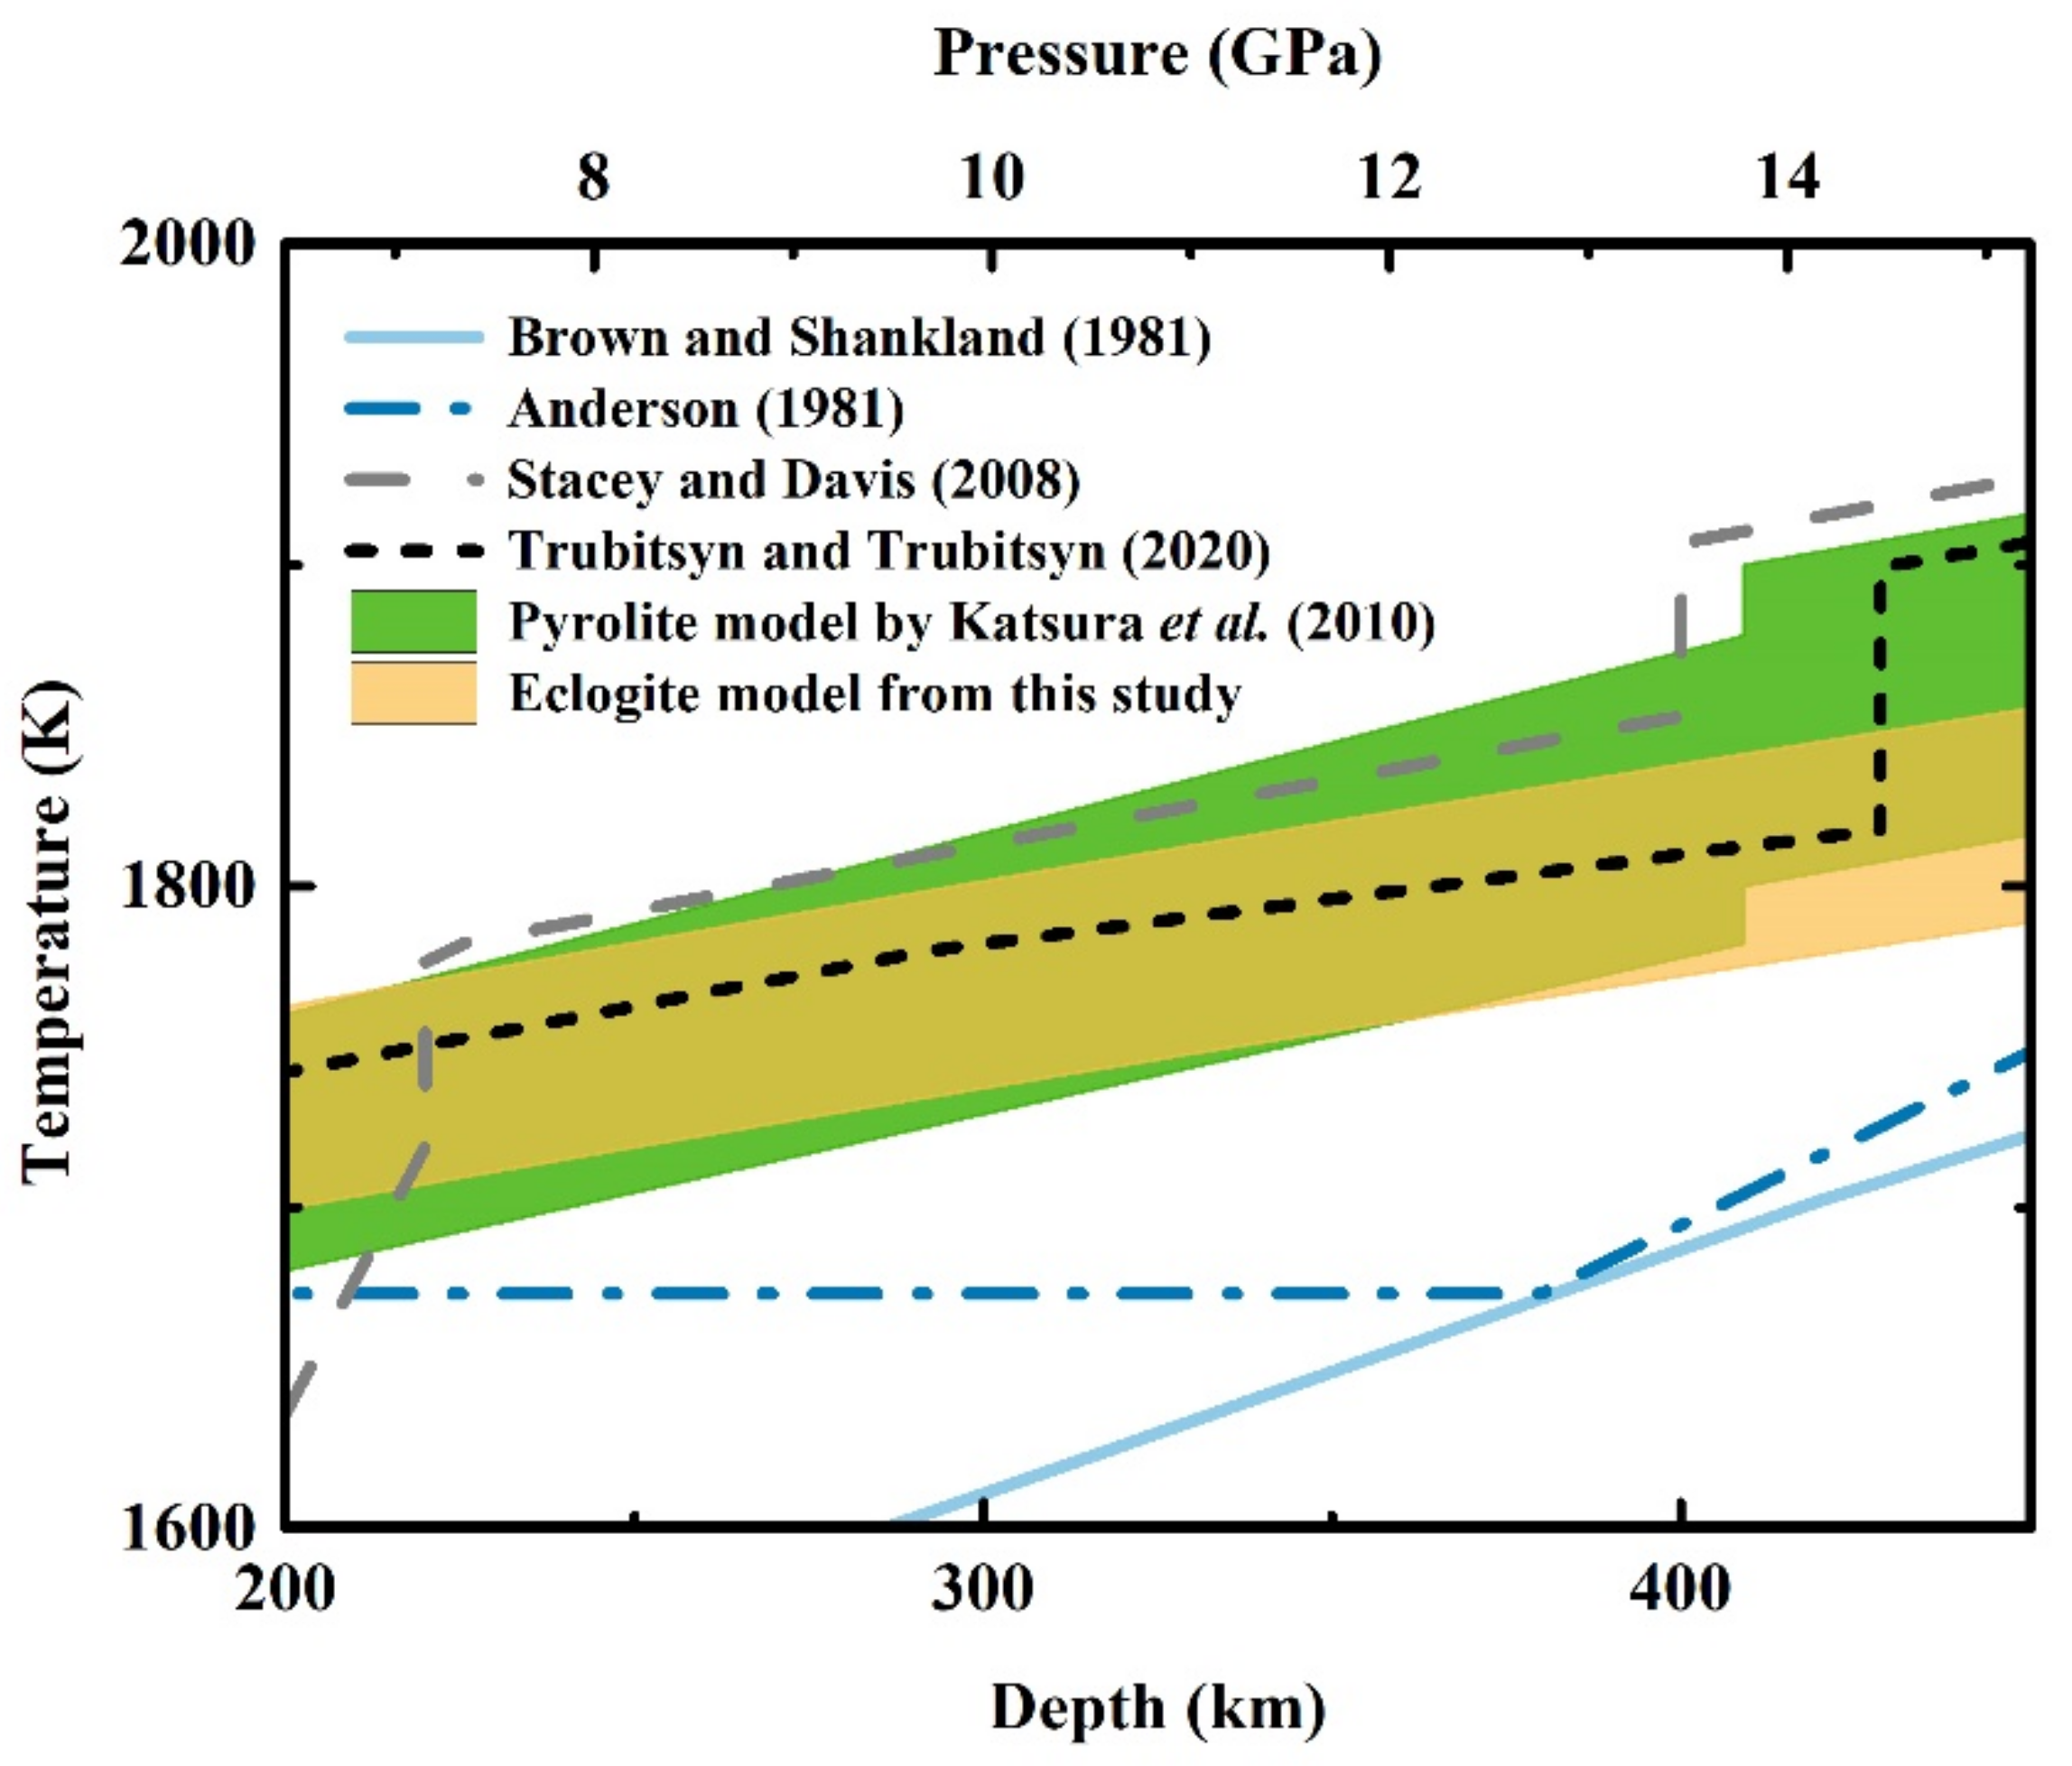
Our obtained adiabatic geotherm of an eclogitic mantle from 200 km to 450 km is shown in Figure 9. At depths of 200 km, 410 km, and 450 km, the temperatures of the eclogite model are 1699 K, 1775 K, and 1789 K when TP = 1623 K, respectively, and 1762 K, 1841 K, and 1855 K when TP = 1683 K, respectively. Under the condition of TP = 1683 K, the estimated temperature is generally consistent with the results proposed by Stacey and Davis [4] and Trubitsyn and Trubitsyn [69] in the depth range of ~200–410 km, with the differences being less than 0.8% and 1%, respectively, but ~80 K higher than the results obtained by Anderson [8] and Brown and Shankland [9] at a depth of 410 km. By comparing the depth of the 410 km discontinuity with the forsterite–wadsleyite phase transition pressure, the temperature at a depth of 409 km was determined to be 1830 ± 48 K for the pyrolite model, and consequently, the TP was presented as 1610 ± 35 K [18]. Because of the existence of olivine in the pyrolitic mantle, though the TP of the pyrolite model is lower than that of the eclogite model, the higher (∂T/∂z)S value of the pyrolite model leads to similar temperatures to the eclogite model in the depth range of 200–410 km. However, the temperature of the eclogite model does not show the increase demonstrated in the pyrolite model at the 410 km discontinuity, but maintains the same trend at a depth of 450 km.
It is worth noting that, except for olivine, the peridotitic garnet, clinopyroxene, and orthopyroxene are essential compositions in a pyrolite mantle [67,70]. Additionally, the majority of the clinopyroxene in an eclogite mantle is considered to be omphacite, which is mainly composed of diopside and jadeite (NaAlSi2O6) [71]. Also, the majoritic garnet becomes dominant over a depth of ~450 km [59,60,61]. Furthermore, Fe is a non-negligible content in both olivine and clinopyroxene [72,73]. Previous studies have suggested that Fe incorporation could increase the estimated adiabatic temperature gradient [20]. Hence, the differences between the geotherm of the pyrolite and eclogite models are probably not the same as what we described if we consider more complicated mineral compositions for the pyrolite model. More thermodynamic parameters of mantle minerals are still required to improve the geotherm model. Overall, this study shows that the adiabatic temperature gradient and adiabatic geotherm of different mantle compositions exhibit various trends with depth. As a consequence, suitable geotherms need to be taken into account when investigating different tectonic settings.

5. Conclusions

In summary, following a numerical iterative procedure, we obtained self-consistent thermodynamic parameters: thermal expansion, heat capacity, and Grüneisen parameters of diopside in a wide PT range (20 GPa, 2000 K). All these thermodynamic parameters are nonlinearly and negatively correlated with pressure. Also, the pressure effects on thermal expansion and heat capacity increase with temperature, while the effect of pressure on the Grüneisen parameter decreases to a minimum at ~500 K, then increases with temperature again. Based on thermodynamic data on major mantle minerals from this and previous studies, we have estimated the adiabatic temperature gradient and geotherm of an eclogitic upper mantle. The results suggest that the adiabatic temperature gradient of the eclogite model is lower than that of the pyrolite model at the same depth, which causes a slower rise of temperature than that of a pyrolitic upper mantle and leads to a similar adiabatic geotherm for both pyrolitic and eclogitic upper mantle in the depth range of 200–410 km.

Supplementary Materials

The following are available online at https://www.mdpi.com/article/10.3390/min11121322/s1, File S1: MS Excel spreadsheet for unit-cell volume of diopside (unit-cell volume.xlsx), File S2: MS Excel spreadsheet for isothermal bulk modulus of diopside (isothermal bulk modulus.xlsx), File S3: MS Excel spreadsheet for adiabatic bulk modulus of diopside (adiabatic bulk modulus.xlsx), File S4: MS Excel spreadsheet for shear modulus of diopside (shear modulus.xlsx), File S5: MS Excel spreadsheet for thermal expansion of diopside (thermal expansion.xlsx), File S6: MS Excel spreadsheet for heat capacity of diopside (heat capacity.xlsx), File S7: MS Excel spreadsheet for Grüneisen parameter of diopside (Grüneisen parameter.xlsx).

Author Contributions

Conceptualization, C.S., Y.L. and D.F.; methodology, C.S., Y.L. and D.F.; software, G.Y.; resources, J.J., Z.S., Y.W. and W.Q.; data curation, C.S.; writing—original draft preparation, C.S.; writing—review and editing, C.S., Y.L., D.F. and W.S.; supervision, Y.L. and D.F.; project administration, Y.L. and D.F.; funding acquisition, C.S. and Y.L. All authors have read and agreed to the published version of the manuscript.

Funding

This research was funded by the Science and Technology Project for the Langfang City [2021013079] and the National Natural Science Foundation of China [41873075].

Data Availability Statement

Data is contained within the article or supplementary material.

Acknowledgments

The authors thank Wenge Zhou at the Institute of Geochemistry, Chinese Academy of Sciences for helpful discussions and suggestions. We also thank Peter I. Dorogokupets at the Institute of the Earth Crust SB RAS and two anonymous reviewers for their insightful comments and suggestions that were very valuable for improving our manuscript.

Conflicts of Interest

The authors declare no conflict of interest.

References

  1. Weidner, D.J.; Wang, Y. Phase transformations: Implications for mantle structure. In Earth’s Deep Interior: Mineral. Physics and Tomography From the Atomic to the Global Scale; American Geophysical Union: Washington, DC, USA, 2000; pp. 215–235. [Google Scholar]
  2. Akaogi, M.; Ito, E.; Navrotsky, A. Olivine-modified spinel-spinel transitions in the system Mg2SiO4-Fe2SiO4: Calorimetric measurements, thermochemical calculation, and geophysical application. J. Geophys. Res. Solid Earth 1989, 94, 15671–15685. [Google Scholar] [CrossRef]
  3. Ono, S. Experimental constraints on the temperature profile in the lower mantle. Phys. Earth Planet. Inter. 2008, 170, 267–273. [Google Scholar] [CrossRef]
  4. Stacey, F.; Davis, P. Physics of the Earth; Cambridge Univ. Press: Cambridge, UK, 2008. [Google Scholar]
  5. Turcotte, D.L.; Schubert, G. Geodynamics, 2nd ed.; Cambridge University Press: Cambridge, UK, 2012. [Google Scholar]
  6. Dziewonski, A.M.; Hales, A.L.; Lapwood, E.R. Parametrically simple earth models consistent with geophysical data. Phys. Earth Planet. Inter. 1975, 10, 12–48. [Google Scholar] [CrossRef]
  7. Stacey, F.D. A thermal model of the earth. Phys. Earth Planet. Inter. 1977, 15, 341–348. [Google Scholar] [CrossRef]
  8. Anderson, O.L. Temperature profiles in the Earth. Evol. Earth 1981, 5, 19–27. [Google Scholar]
  9. Brown, J.M.; Shankland, T.J. Thermodynamic parameters in the Earth as determined from seismic profiles. Geophys. J. Int. 1981, 66, 579–596. [Google Scholar] [CrossRef]
  10. Jeanloz, R.; Richter, F.M. Convection, composition, and the thermal state of the lower mantle. J. Geophys. Res. 1979, 84, 5497–5504. [Google Scholar] [CrossRef]
  11. Ringwood, A.E. A model for the upper mantle. J. Geophys. Res. 1962, 67, 4473–4478. [Google Scholar] [CrossRef]
  12. Bass, J.D.; Anderson, D.L. Composition of the upper mantle: Geophysical tests of two petrological models. Geophys. Res. Lett. 1984, 11, 229–232. [Google Scholar] [CrossRef] [Green Version]
  13. Katsura, T. Thermal expansion of Mg2SiO4 ringwoodite at high pressures. J. Geophys. Res. 2004, 109, 209–218. [Google Scholar] [CrossRef]
  14. Katsura, T.; Shatskiy, A.; Manthilake, M.A.G.M.; Zhai, S.; Fukui, H.; Yamazaki, D.; Matsuzaki, T.; Yoneda, A.; Ito, E.; Kuwata, A.; et al. Thermal expansion of forsterite at high pressures determined by in situ X-ray diffraction: The adiabatic geotherm in the upper mantle. Phys. Earth Planet. Inter. 2009, 174, 86–92. [Google Scholar] [CrossRef]
  15. Katsura, T.; Shatskiy, A.; Manthilake, M.A.G.M.; Zhai, S.; Yamazaki, D.; Matsuzaki, T.; Yoshino, T.; Yoneda, A.; Ito, E.; Sugita, M.; et al. P-V-T relations of wadsleyite determined by in situ X-ray diffraction in a large-volume high-pressure apparatus. Geophys. Res. Lett. 2009, 36, 1–5. [Google Scholar]
  16. Katsura, T.; Yamada, H.; Nishikawa, O.; Song, M.; Kubo, A.; Shinmei, T.; Yokoshi, S.; Aizawa, Y.; Yoshino, T.; Walter, M.J.; et al. Olivine-wadsleyite transition in the system (Mg,Fe)2SiO4. J. Geophys. Res. Solid Earth 2004, 109, 1–12. [Google Scholar] [CrossRef]
  17. Katsura, T.; Yokoshi, S.; Kawabe, K.; Shatskiy, A.; Manthilake, M.A.G.M.; Zhai, S.; Fukui, H.; Hegoda, H.A.C.I.; Yoshino, T.; Yamazaki, D.; et al. P-V-T relations of MgSiO3 perovskite determined by in situ X-ray diffraction using a large-volume high-pressure apparatus. Geophys. Res. Lett. 2009, 36, 1–6. [Google Scholar]
  18. Katsura, T.; Yoneda, A.; Yamazaki, D.; Yoshino, T.; Ito, E. Adiabatic temperature profile in the mantle. Phys. Earth Planet. Inter. 2010, 183, 212–218. [Google Scholar] [CrossRef]
  19. Su, C.; Liu, Y. Thermal expansion, heat capacity and Grüneisen parameter of grossular at high temperature and high pressure. High. Temp.-High. Press. 2021, 50, 105–119. [Google Scholar]
  20. Su, C.; Liu, Y.; Fan, D.; Song, W.; Yang, G. Self-consistent thermodynamic parameters of pyrope and almandine at high-temperature and high-pressure conditions: Implication on the adiabatic temperature gradient. Phys. Earth Planet. Inter. 2021, 106789. [Google Scholar] [CrossRef]
  21. Su, C.; Liu, Y.; Song, W.; Fan, D.; Wang, Z.; Tang, H. Thermodynamic properties of San Carlos olivine at high temperature and high pressure. Acta Geochim. 2018, 37, 171–179. [Google Scholar] [CrossRef]
  22. Ringwood, A.E. Phase transformations and the constitution of the mantle. Phys. Earth Planet. Inter. 1970, 3, 109–155. [Google Scholar] [CrossRef]
  23. Li, B.; Neuville, D.R. Elasticity of diopside to 8 GPa and 1073 K and implications for the upper mantle. Phys. Earth Planet. Inter. 2010, 183, 398–403. [Google Scholar] [CrossRef]
  24. Zou, F.; Wu, Z.; Wang, W.; Wentzcovitch, R.M. An extended semianalytical approach for thermoelasticity of monoclinic crystals: Application to diopside. J. Geophys. Res. Solid Earth 2018, 123, 7629–7643. [Google Scholar] [CrossRef]
  25. Zhao, Y.; Dreele, R.B.V.; Zhang, J.Z.; Weidner, D.J. Thermoelastic Equation of State of Monoclinic Pyroxene: CaMgSi2O6 Diopside. Rev. High. Press. Sci. Technol. 1998, 7, 25–27. [Google Scholar] [CrossRef] [Green Version]
  26. Birch, F. Finite Elastic Strain of Cubic Crystals. Phys. Rev. 1947, 71, 809–824. [Google Scholar] [CrossRef]
  27. Jackson, I.; Rigden, S.M. Analysis of P-V-T data: Constraints on the thermoelastic properties of high-pressure minerals. Phys. Earth Planet. Inter. 1996, 96, 85–112. [Google Scholar] [CrossRef]
  28. Pandolfo, F.; Cámara, F.; Domeneghetti, M.C.; Alvaro, M.; Nestola, F.; Karato, S.-I.; Amulele, G. Volume thermal expansion along the jadeite–diopside join. Phys. Chem. Miner. 2015, 42, 1–14. [Google Scholar] [CrossRef]
  29. Hovis, G.L.; Tribaudino, M.; Leaman, A.; Almer, C.; Altomare, C.; Morris, M.; Maksymiw, N.; Morris, D.; Jackson, K.; Scott, B.; et al. Thermal expansion of minerals in the pyroxene system and examination of various thermal expansion models. Am. Mineral. 2021, 106, 883–899. [Google Scholar] [CrossRef]
  30. Krupka, K.M.; Hemingway, B.S.; Robie, R.A.; Kerrick, D.M. High-temperature heat capacities and derived thermodynamic properties of anthophyllite, diopside, dolomite, enstatite, bronzite, talc, tremolite and wollastonite. Am. Mineral. 1985, 70, 261–271. [Google Scholar]
  31. Richet, P.; Fiquet, G. High-temperature heat capacity and premelting of minerals in the system MgO-CaO-Al2O3-SiO2. J. Geophys. Res. 1991, 96, 445–456. [Google Scholar] [CrossRef]
  32. Stebbins, J.F.; Carmichael, I.S.E.; Weill, D.E. The high temperature liquid and glass heat contents and the heats of fusion of diopside, albite, sanidine and nepheline. Am. Mineral. 1983, 68, 717–730. [Google Scholar]
  33. Isaak, D.G.; Ohno, I.; Lee, P.C. The elastic constants of monoclinic single-crystal chrome-diopside to 1300 K. Phys. Chem. Miner. 2006, 32, 691–699. [Google Scholar] [CrossRef]
  34. De Koker, N.; Stixrude, L. Self-consistent thermodynamic description of silicate liquids, with application to shock melting of MgO periclase and MgSiO3 perovskite. Geophys. J. Int. 2009, 178, 162–179. [Google Scholar] [CrossRef] [Green Version]
  35. Sokolova, T.S.; Dorogokupets, P.I. Equations of State of Ca-Silicates and Phase Diagram of the CaSiO3 System under Upper Mantle Conditions. Minerals 2021, 11, 322. [Google Scholar] [CrossRef]
  36. Angel, R.J. Equations of State. Rev. Mineral. Geochem. 2000, 41, 35–59. [Google Scholar] [CrossRef]
  37. Sang, L.; Bass, J.D. Single-crystal elasticity of diopside to 14 GPa by Brillouin scattering. Phys. Earth Planet. Inter. 2014, 228, 75–79. [Google Scholar] [CrossRef]
  38. Cameron, M.; Sueno, S.; Prewitt, C.T.; Papike, J.J. High-Temperature Crystal Chemistry of Acmite, Diopside, Hedenbergite Jadeite, Spodumene and Ureyite. Am. Mineral. 1973, 58, 594–618. [Google Scholar]
  39. Finger, L.W.; Ohashi, Y. The thermal expansion of diopside to 800 °C and a refinement of the crystal structure at 700 °C. Am. Mineral. 1976, 61, 303–310. [Google Scholar]
  40. Gonzalez-Platas, J.; Alvaro, M.; Nestola, F.; Angel, R. EosFit7-GUI: A new graphical user interface for equation of state calculations, analyses and teaching. J. Appl. Crystallogr. 2016, 49, 1377–1382. [Google Scholar] [CrossRef]
  41. Fei, Y. Thermal Expansion. In Mineral. Physics & Crystallography; Ahrens, T.J., Ed.; American Geophysical Union: Washington, DC, USA, 1995; pp. 29–44. [Google Scholar]
  42. Thompson, R.M.; Downs, R.T. The crystal structure of diopside at pressure to 10 GPa. Am. Mineral. 2008, 93, 177–186. [Google Scholar] [CrossRef]
  43. Tribaudino, M.; Prencipe, M.; Bruno, M.; Levy, D. High-pressure behaviour of Ca-rich C2/c clinopyroxenes along the join diopside-enstatite (CaMgSi2O6-Mg2Si2O6). Phys. Chem. Miner. 2000, 27, 656–664. [Google Scholar] [CrossRef]
  44. Levien, L.; Prewitt, C.T. High-pressure structural study of diopside. Am. Mineral. 1981, 66, 315–323. [Google Scholar]
  45. Sang, L.; Vanpeteghem, C.B.; Sinogeikin, S.V.; Bass, J.D. The elastic properties of diopside, CaMgSi2O6. Am. Mineral. 2011, 96, 224–227. [Google Scholar] [CrossRef]
  46. Walker, A.M.; Tyer, R.P.; Bruin, R.P.; Dove, M.T. The compressibility and high pressure structure of diopside from first principles simulation. Phys. Chem. Miner. 2008, 35, 359–366. [Google Scholar] [CrossRef] [Green Version]
  47. Saxena, S.K.; Chatterjee, N.; Fei, Y.; Shen, G. Thermodynamic Data on Oxides and Silicates. An Assessed Data Set Based on Thermochemistry and High Pressure Phase Equilibrium, 1st ed.; Springer: Berlin/Heidelberg, Germany, 1993. [Google Scholar]
  48. Vočadlo, N.L.; Price, G.D. The Grüneisen parameter-computer calculations via lattice dynamics. Phys. Earth Planet. Inter. 1994, 82, 261–270. [Google Scholar] [CrossRef]
  49. Wu, Z.; Wentzcovitch, R.M. Vibrational and thermodynamic properties of wadsleyite: A density functional study. J. Geophys. Res. 2007, 112. [Google Scholar] [CrossRef] [Green Version]
  50. McKenzie, D.; Bickle, M.J. The volume and composition of melt generated by extension of the lithosphere. J. Petrol. 1988, 29, 625–679. [Google Scholar] [CrossRef]
  51. Ringwood, A.E. Phase transformations and their bearing on the constitution and dynamics of the mantle. Geochim. Et Cosmochim. Acta 1991, 55, 2083–2110. [Google Scholar] [CrossRef]
  52. Ringwood, A.E. Phase transformations in the mantle. Earth Planet. Sci. Lett. 1968, 5, 401–412. [Google Scholar] [CrossRef]
  53. Muir, J.M.R.; Zhang, F.; Brodholt, J.P. The effect of water on the post-spinel transition and evidence for extreme water contents at the bottom of the transition zone. Earth Planet. Sci. Lett. 2021, 565, 116909. [Google Scholar] [CrossRef]
  54. Ringwood, A.E. Phase Transformations and Differentiation in Subducted Lithosphere: Implications for Mantle Dynamics, Basalt Petrogenesis, and Crustal Evolution. J. Geol. 1982, 90, 611–643. [Google Scholar] [CrossRef]
  55. Ringwood, A.E.; Irifune, T. Nature of the 650–km seismic discontinuity: Implications for mantle dynamics and differentiation. Nature 1988, 331, 131–136. [Google Scholar] [CrossRef]
  56. Ishii, T.; Kojitani, H.; Akaogi, M. Phase Relations of Harzburgite and MORB up to the Uppermost Lower Mantle Conditions: Precise Comparison with Pyrolite by Multisample Cell High-Pressure Experiments with Implication to Dynamics of Subducted Slabs. J. Geophys. Res. Solid Earth 2019, 124, 3491–3507. [Google Scholar] [CrossRef]
  57. Green, D.H.; Ringwood, A.E. An experimental investigation of the gabbro to eclogite transformation and its petrological applications. Geochim. Et Cosmochim. Acta 1967, 31, 767–833. [Google Scholar] [CrossRef]
  58. Poli, S. The amphibolite-eclogite transformation; an experimental study on basalt. Am. J. Sci. 1993, 293, 1061–1107. [Google Scholar] [CrossRef]
  59. Akaogi, M.; Akimoto, S. Pyroxene-garnet solid-solution equilibria in the systems Mg4Si4O12-Mg3Al2Si3O12 and Fe4Si4O12-Fe3Al2Si3O12 at high pressures and temperatures. Phys. Earth Planet. Inter. 1977, 15, 90–106. [Google Scholar] [CrossRef]
  60. Irifune, T. Phase transformations in the earth’s mantle and subducting slabs: Implications for their compositions, seismic velocity and density structures and dynamics. Isl. Arc. 1993, 2, 55–71. [Google Scholar] [CrossRef]
  61. Kiseeva, E.S.; Yaxley, G.M.; Stepanov, A.S.; Tkalčić, H.; Litasov, K.D.; Kamenetsky, V.S. Metapyroxenite in the mantle transition zone revealed from majorite inclusions in diamonds. Geology 2013, 41, 883–886. [Google Scholar] [CrossRef]
  62. Presnall, D.C.; Gudfinnsson, G.H.; Walter, M.J. Generation of mid-ocean ridge basalts at pressures from 1 to 7 GPa. Geochim. Et Cosmochim. Acta 2002, 66, 2073–2090. [Google Scholar] [CrossRef]
  63. Putirka, K.D. Mantle potential temperatures at Hawaii, Iceland, and the mid-ocean ridge system, as inferred from olivine phenocrysts: Evidence for thermally driven mantle plumes. Geochem. Geophys. Geosystems 2005, 6, 1–14. [Google Scholar] [CrossRef]
  64. Dalton, C.A.; Langmuir, C.H.; Gale, A. Geophysical and geochemical evidence for deep temperature variations beneath mid-ocean ridges. Science 2014, 344, 80–83. [Google Scholar] [CrossRef] [PubMed]
  65. Sarafian, E.; Gaetani, G.A.; Hauri, E.H.; Sarafian, A.R. Experimental constraints on the damp peridotite solidus and oceanic mantle potential temperature. Science 2017, 355, 942–945. [Google Scholar] [CrossRef] [PubMed] [Green Version]
  66. Irifune, T.; Sekine, T.; Ringwood, A.E.; Hibberson, W.O. The eclogite-garnetite transformation at high pressure and some geophysical implications. Earth Planet. Sci. Lett. 1986, 77, 245–256. [Google Scholar] [CrossRef]
  67. Duan, L.; Wang, W.; Wu, Z.; Qian, W. Thermodynamic and Elastic Properties of Grossular at High Pressures and High Temperatures: A First-Principles Study. J. Geophys. Res. Solid Earth 2019, 124, 7792–7805. [Google Scholar] [CrossRef]
  68. Xu, J.; Zhang, D.; Fan, D.; Dera, P.K.; Shi, F.; Zhou, W. Thermoelastic Properties of Eclogitic Garnets and Omphacites: Implications for Deep Subduction of Oceanic Crust and Density Anomalies in the Upper Mantle. Geophys. Res. Lett. 2019, 46, 179–188. [Google Scholar] [CrossRef] [Green Version]
  69. Trubitsyn, A.P.; Trubitsyn, V.P. Temperature Distribution in the Earth’s Mantle. Dokl. Earth Sci. 2020, 495, 905–909. [Google Scholar] [CrossRef]
  70. Green, D.H.; Ringwood, A.E. Mineralogy of peridotitic compositions under upper mantle conditions. Phys. Earth Planet. Inter. 1970, 3, 359–371. [Google Scholar] [CrossRef]
  71. Liu, L.-G. The mineralogy of an eclogitic earth mantle. Phys. Earth Planet. Inter. 1980, 23, 262–267. [Google Scholar] [CrossRef]
  72. Ringwood, A.E.; Major, A. The system Mg2SiO4-Fe2SiO4 at high pressures and temperatures. Phys. Earth Planet. Inter. 1970, 3, 89–108. [Google Scholar] [CrossRef]
  73. Canil, D.; O’Neill, H.S.C. Distribution of Ferric Iron in some Upper-Mantle Assemblages. J. Petrol. 1996, 37, 609–635. [Google Scholar] [CrossRef] [Green Version]
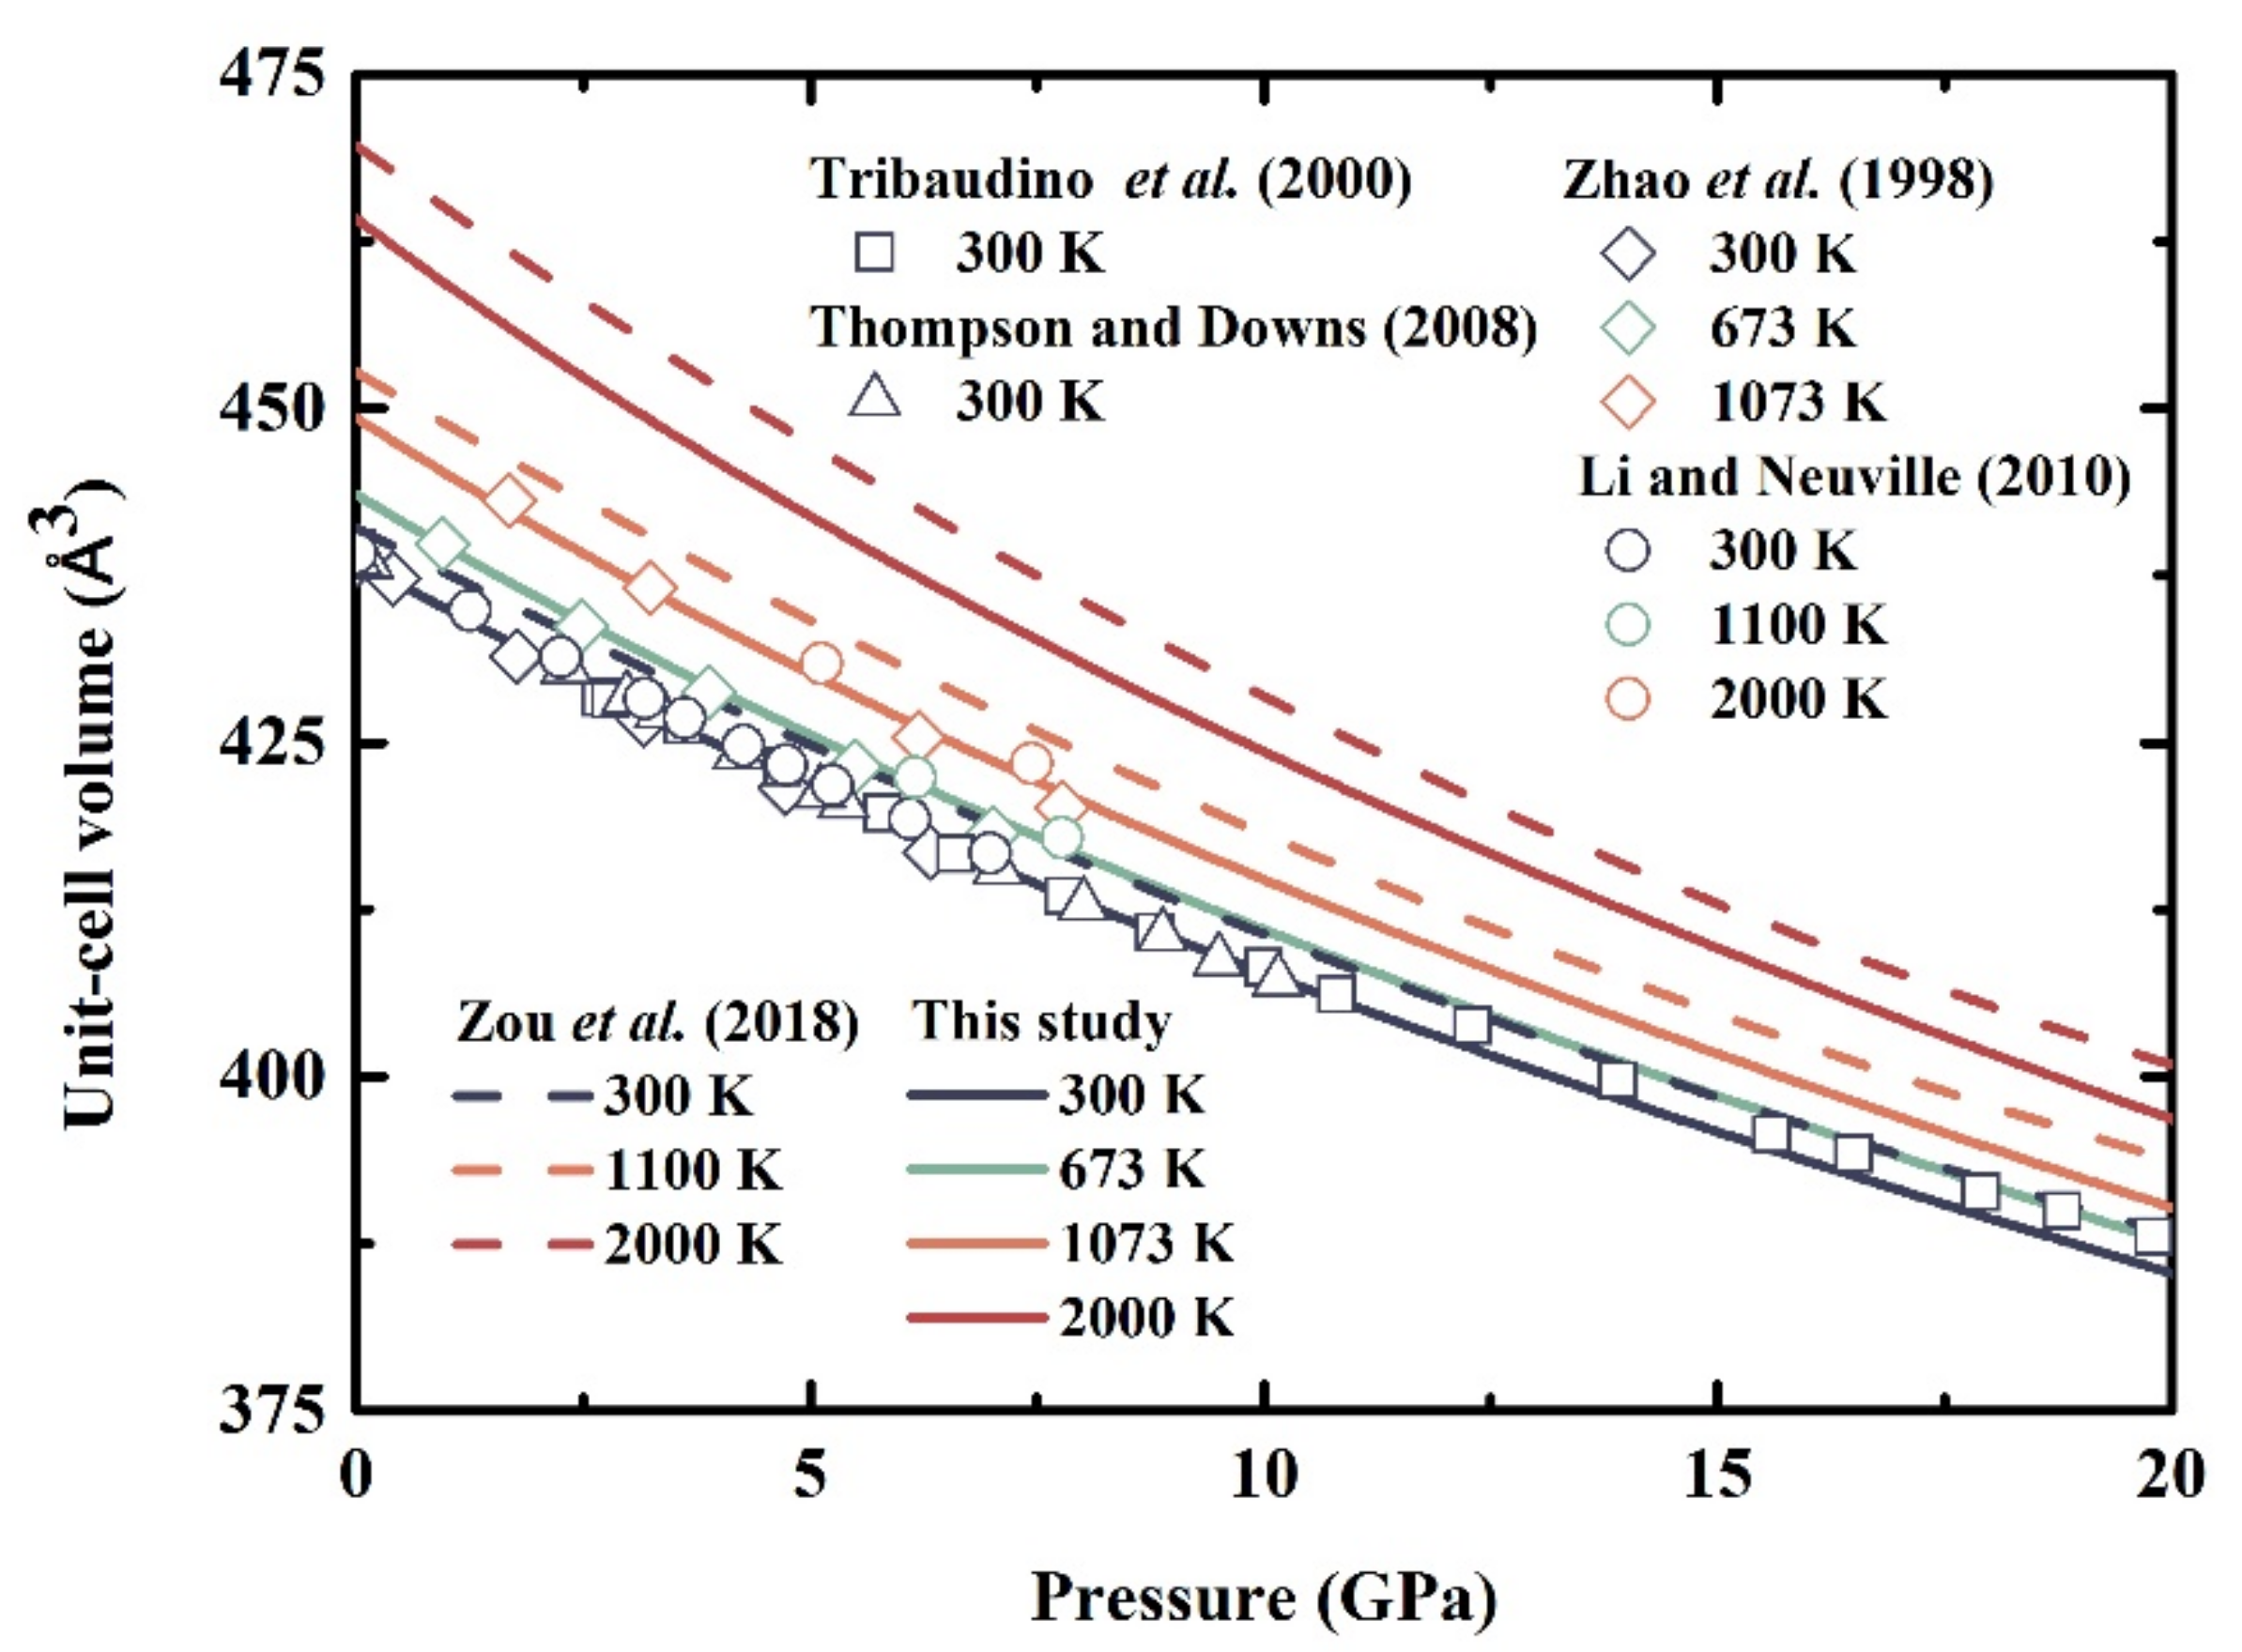
Figure 1. Unit-cell volume of diopside as a function of pressure at various temperatures. Solid lines refer to our calculated results, and dashed lines refer to the first-principle calculation results from Zou et al. (2018) [24]. The squares and triangles represent the measurements at 300 K by Tribaudino et al. (2000) [43] and Thompson and Downs (2008) [42], respectively. The diamonds and circles correspond to the measurements at various temperatures by Zhao et al. (1998) [25] and Li and Neuville (2010) [23], respectively.
Minerals 11 01322 g001
Figure 2. Elastic moduli of diopside as a function of pressure at various temperatures. Solid lines refer to our calculated results and dashed lines refer to the first-principle calculation results from Zou et al. (2018) [24]. The circles and triangles represent the results from Sang and Bass (2014) [37] and Li and Neuville (2010) [23], respectively. (a) Isothermal bulk modulus (b) Adiabatic bulk modulus (c) Shear modulus.
Minerals 11 01322 g002
Figure 3. Elastic moduli of diopside as a function of temperature at various pressures. Solid lines refer to our calculated results and dashed lines refer to the first-principle calculation results from Zou et al. (2018) [24]. The diamonds correspond to the results from Isaak et al. (2006) [33]. (a) Isothermal bulk modulus (b) Adiabatic bulk modulus (c) Shear modulus.
Minerals 11 01322 g003
Figure 4. Temperature (a) and pressure (b) dependences of the thermal expansion of diopside. Solid lines refer to our calculated results. The diamonds and circles correspond to the results from Isaak et al. (2006) [33] and Hovis et al. (2021) [29], respectively.
Minerals 11 01322 g004
Figure 5. Temperature (a) and pressure (b) dependences of the heat capacity of diopside. Solid lines refer to our calculated results. The squares and triangles correspond to the results from Stebbins et al. (1983) [32] and Krupka et al. (1985) [30], respectively.
Minerals 11 01322 g005
Figure 6. Temperature (a) and pressure (b) dependences of the Grüneisen parameter of diopside. Solid lines refer to our calculated results. The diamonds correspond to the results from Isaak et al. (2006) [33].
Minerals 11 01322 g006
Figure 7. Adiabatic temperature gradients obtained using thermodynamic data on minerals (TP = 1610 K).
Minerals 11 01322 g007
Figure 8. Adiabatic temperature gradients in the depth range of 200–450 km. The lower and upper edges of the filled area are calculated with TP as 1623 K and 1683 K, respectively.
Minerals 11 01322 g008
Figure 9. Adiabatic geotherm in the depth range of 200–450 km. The lower and upper edges of the filled area are calculated with TP as 1623 K and 1683 K, respectively.
Minerals 11 01322 g009
Table 1. Fitting coefficients for Equation (10).
m0m1m2m3
vP8061.78 (±13.41)−0.402 (±0.019)101.21 (±4.42)−1.771 (±0.317)
vS4712.23 (±13.78)−0.329 (±0.019)33.60 (±4.55)−0.388 (±0.325)
Table 3. The thermal expansion, heat capacity, and Grüneisen parameters of diopside and their first and second derivatives with respect to pressure.
T
K
α0
10–5/K
∂α/∂P
10–6/K GPa
2α/∂P2
10−8/K GPa2
3002.71−0.921.4
7003.09−1.021.6
11003.29−1.131.8
20003.70−1.372.4
T
K
CP0
J/mol K
CP/∂P
J/mol K GPa
2CP/∂P2
10−3 J/mol K GPa2
300167.15−0.4172.3
700231.57−0.2754.5
1100250.91−0.3727.2
2000274.09−0.68814.2
T
K
γ0γ/∂P
10−3/GPa
2γ/∂P2
10−4/GPa2
3001.254−3.4−5.2
7001.004−2.7−3.8
11000.961−3.4−3.5
20000.928−4.8−3.1
Publisher’s Note: MDPI stays neutral with regard to jurisdictional claims in published maps and institutional affiliations.