Article

Characterization of Natural Consolidated Halloysite Nanotube Structures

1
Department of Materials Science and Engineering, College of Mines and Earth Sciences, University of Utah, Salt Lake City, UT 84112, USA
2
School of Civil and Environmental Engineering, Cornell University, Ithaca, NY 14853, USA
3
Smith School of Chemical and Biological Engineering, Cornell University, Ithaca, NY 14853, USA
4
Department of Chemical Engineering, College of Engineering, University of Utah, Salt Lake City, UT 84112, USA
*
Author to whom correspondence should be addressed.
Minerals 2021, 11(12), 1308; https://doi.org/10.3390/min11121308
Submission received: 22 October 2021 / Revised: 15 November 2021 / Accepted: 17 November 2021 / Published: 24 November 2021
(This article belongs to the Special Issue Nanotubular and Nanofibrous Clay Minerals)

Abstract

:
Halloysite is a unique 1:1 clay mineral frequently appearing with nanotubular morphology, and having surfaces of different polarity with interesting and important technological applications. HNTs can be consolidated naturally in the earth by pressure and thermal flows. In this study of natural consolidated HNTs, the strength and hardness of these materials were found to be dependent on the presence of impurities (gibbsite, alunite, quartz, and other silica minerals), which accounted for the increased stability of such samples. In the absence of impurities, the strength of consolidated HNTs was significantly lower. The first 3D mapping of the pore structure of natural consolidated HNT is provided. The contributions of the porosity within the nanotubes and between the nanotubes were delineated using a combination of non-invasive ultra-small and small-angle X-ray scattering (USAXS/SAXS) analyses, BET/BJH pore size analyses, and computed tomography studies. A total porosity of 40%, as determined by X-ray attenuation and He porosimetry, was found for the natural consolidated HNTs, of which about one-third was due to the inter-HNT porosity. Nano-X-ray computed tomography (nano-XCT) analyses also indicated that 76% of the inter-HNT pores were smaller than 150 nm in diameter. The intra-HNT pore size determined by combined USAXS/SAXS and BET/BJH was about 10 nm. This pore network information is essential for the utilization of natural consolidated HNTs as a model geomaterial to investigate the effects of surface characteristics on confined fluid flow.

1. Introduction

The morphological organization of materials, including the sizes and shapes of pores, has been shown to result in anomalous thermodynamic, transport, and reactive properties of nanoconfined fluids [1,2]. In this context, naturally occurring geomaterials with nanoscale tubular architectures are of interest, given the high likelihood of fluids confined within their materials exhibiting anomalous properties. Halloysite is a hollow tubular aluminosilicate that has the same chemical composition as kaolinite, Al2Si2O5(OH)4. Kaolinite has a platy morphology. Although most halloysites are composed of nanoscale tubes, they may also appear with platy or spheroidal morphology [3]. The studied halloysite nanotube (HNT) had an internal pore (intra-HNT) diameter of 12–15 nm, an outer diameter of 60 nm and above, as well as a length of 0.5–10 μm [4,5]. Due to their unique physical, mechanical, and structural properties, HNTs have been used for polymer composites, flame retardation, controlled release, environmental remediation, paints and coatings, agriculture, catalysts, molecular sieves, ceramics, and cosmetics [6,7,8].
The Dragon Mine in Eureka, UT, USA, currently operated by Applied Minerals Inc., has high quality natural consolidated HNT geomaterials. Figure 1 presents images of the consolidated halloysite at different magnifications. The total porosity of the natural consolidated HNT structure is comprised of intra-HNT porosity, which refers to the internal nanopores of the HNTs, and inter-HNT porosity, which refers to the porosity between the HNTs.

1.1. Halloysite Structure, a Geometric Variation of Kaolinite

The structures of both kaolinite and HNT have basal planes of a silica tetrahedral layer and an alumina octahedral side layer bonded by apical oxygens. Most kaolinite particles maintain a planar structure up to several microns in size [9]. The kaolinite plates are held together by van der Waals forces, and water is excluded from the kaolinite plates. However, halloysite usually has a tubular structure with curvature toward the gibbsite side, i.e., the HNT structure [5]. Upon hydration, kaolinite plates roll along the major crystallographic directions to form halloysite tubular structures. There are intercalated water molecules between the halloysite plates, and water is likely associated with the gibbsite surface.

1.2. Surface Chemistry

One of the unique features of halloysite is the difference in the surface chemistry inside and outside the nanotube. The halloysite structure has a siloxane surface exposed outside of the nanotube (inter-HNT) and a gibbsite surface inside of the nanotube (intra-HNT). Due to the relatively small size of HNTs (outer diameter of 60 nm and length of 0.5–10 μm), the wetting characteristics of the inter- and intra-HNT surfaces cannot be easily determined by direct measurements. Since kaolinite and HNT have identical crystal structures, the inter-HNT siloxane surface and intra-HNT gibbsite surface are expected to have exactly the same wetting characteristics as the siloxane and gibbsite surfaces of kaolinite. Thus, the water wettability of the HNT surfaces can be estimated from previous studies on kaolinite surface chemistry, in which the kaolinite particles were ordered at a substrate with specific surface orientation (either siloxane or gibbsite face exposed) and then characterized by atomic force microscopy (AFM) [10,11].
The AFM surface force curves between a diamond-like carbon (DLC) tip and the kaolinite basal plane surfaces (siloxane and gibbsite) in 1 mM KCl at pH 4 are shown in Figure 2 [11]. Since the DLC tip surface is at its isoelectric point, the electrostatic interaction is minimal. The force curve for the kaolinite siloxane surface shows an attractive force with the hydrophobic DLC tip, which is greater than the theoretical van der Waals attraction and indicates a hydrophobic interaction. Consequently, the kaolinite siloxane surface has a relatively modest hydrophobic surface state [10]. On the other hand, the kaolinite gibbsite (alumina octahedral) surface did not show any hydrophobic interaction in addition to the theoretical van der Waals forces, indicating a hydrophilic surface state.
The wetting characteristics of the siloxane and gibbsite surfaces of either kaolinite or halloysite can also be determined by water number density analysis of the mineral–water interface using classical molecular dynamics (MD) simulations [12]. As shown in Figure 3, the water exclusion zone at the siloxane–water interface reveals the hydrophobic surface state of the kaolinite/halloysite siloxane surface. In contrast, water fills the kaolinite/halloysite gibbsite–water interface due to stronger interactions, such as hydrogen bonding with the gibbsite surface.

1.3. Objectives of the Study: Multiscale Characterization

While the prior research efforts were informative about the wettability characteristics and the surface chemistry of HNTs, uncertainties exist regarding the geomechanical characteristics, pore organization, and connectivity of HNT pores. Since the wetting characteristics of HNTs are such that the inter-HNT surface is expected to be hydrophobic and the intra-HNT surface is expected to be hydrophilic, the fluid flow in a natural consolidated structure of HNTs is expected to be influenced by the organization and connectivity of the pores. Therefore, this study addresses the following research questions:
(i) What are the mechanical characteristics of natural consolidated HNT?
(ii) What is the connectivity between the intra- and interlevel porosity?
To address these questions, nanoindentation was used to determine the hardness of natural consolidated HNT samples from different regions of the Dragon Mine, which have differing levels of consolidation. The hardness values of the various consolidated HNT samples were compared with kaolinite and other common shale minerals, such as calcite and silica. The total porosity of the consolidated HNT structure was estimated from X-ray attenuation values using micro-X-ray computed tomography (micro-XCT) and verified using He porosimetry. The inter-HNT porosity of the natural consolidated HNT structure and the pore size analyzed from the 3D pore network structure were determined by nano-X-ray computed tomography (nano-XCT) scanning. In addition, this research reports the intra-HNT pore size and outer HNT curvature (diameter) as characterized by small-angle X-ray scattering (SAXS). The SAXS results were compared with results from BET and BJH pore size analyses and literature values. The individual HNTs of the Dragon Mine consolidated HNT structures were further characterized by sedimentation field-flow fractionation (SdFFF) for particle size distribution, compared with TEM imaging, and finally by SAXS for the halloysite interlayer spacing.

2. Materials and Methods

Most of the consolidated HNT samples evaluated in this study were collected from various halloysite veins at Applied Minerals Inc.’s Dragon Mine in Eureka, UT, USA. A more consolidated kaolinite sample was evaluated from Blawn Mountain in the Wah Wah range in Beaver County, UT, USA. A less-consolidated kaolinite sample from Rincon de Cerdeno, Guanajuato, Mexico, was also evaluated. The calcite, quartz, and pyrophyllite crystals were obtained from the mineral collection at the University of Utah.

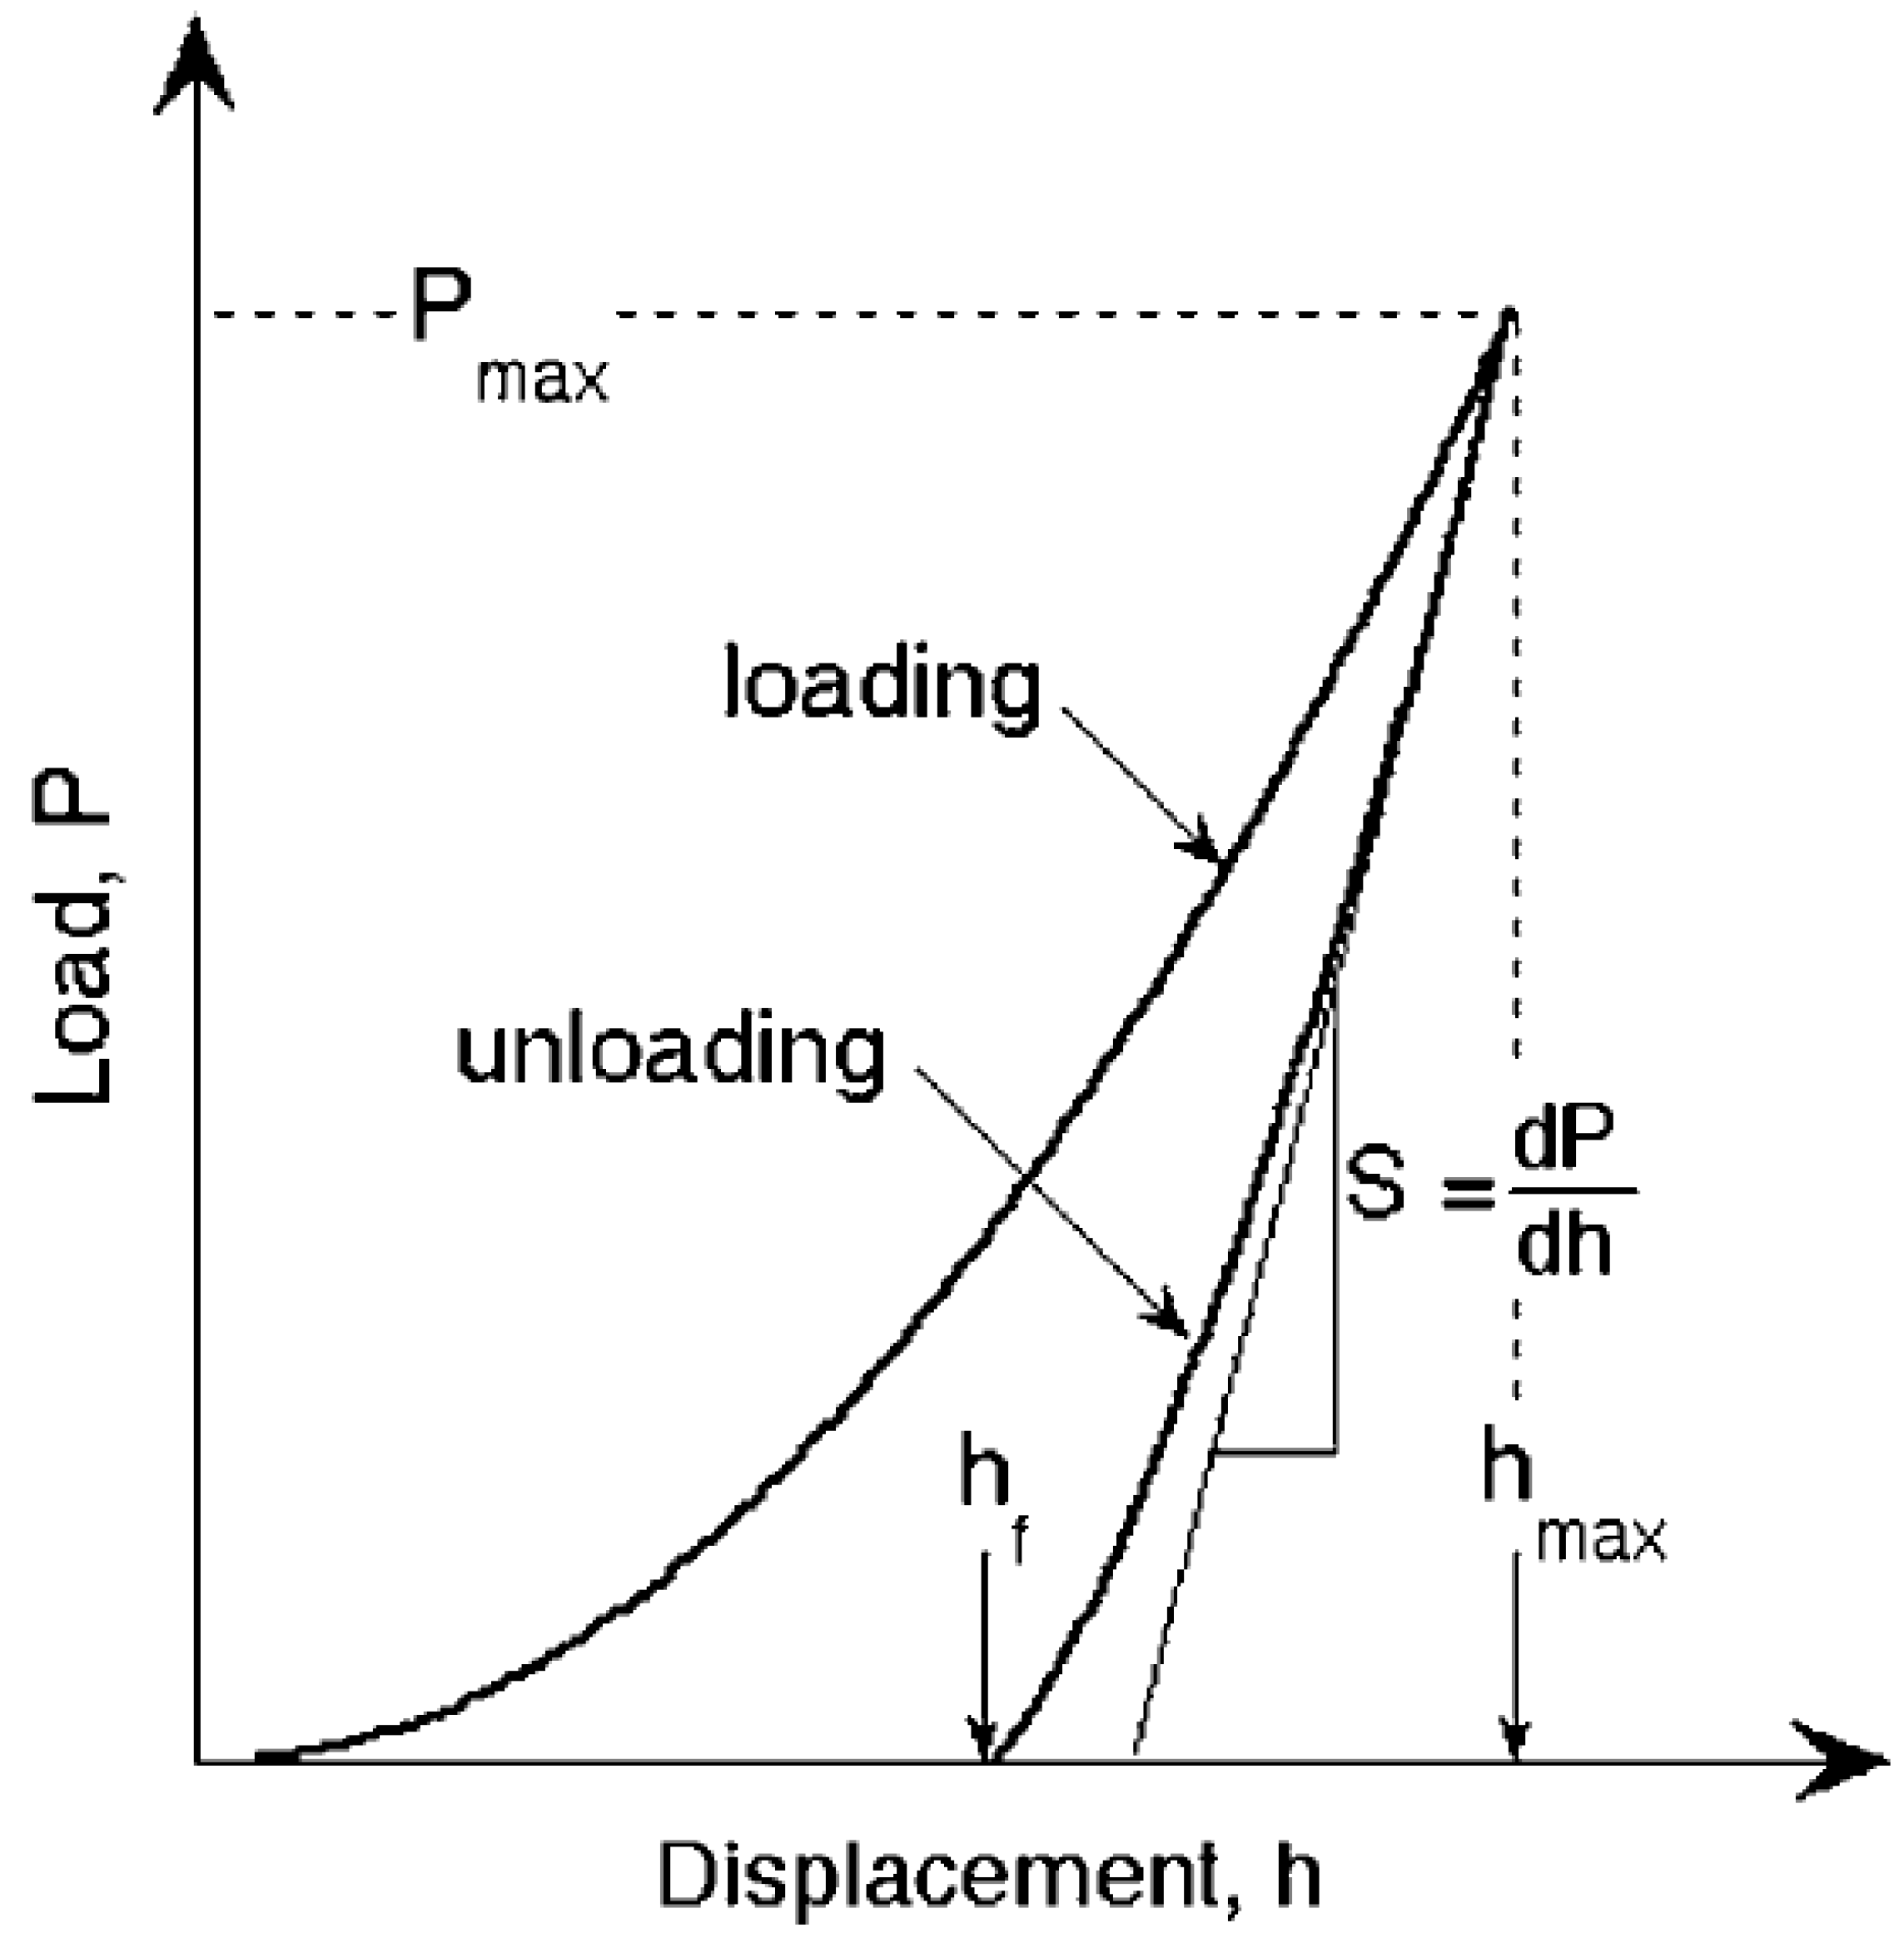
2.1. Mechanical Properties Measurements by Nanoindentation

The indentation measurements were performed at the Utah Nanofab Laboratory with a Hysitron TI Premier nanoindenter using a diamond Berkovich fluid tip [13]. As needed, mineral samples were cut into pieces with sizes ranging from 2 to 4 cm, and were surface-ground with water as a lubricant, using progressively higher grit sandpaper, starting with low (120) and proceeding to high grit (2500). This was followed by the use of lapping film to achieve an average roughness of 1 μm. These grinding/polishing activities were performed on an Allied Techprep 10–1000 polishing/grinding machine. Samples were left to air-dry for 24 h to stabilize the sorption behavior before the indentation tests. The indents were performed at ambient conditions.
The properties characteristically measured from an indentation protocol are the indented material’s hardness (H) and the elastic modulus (E). The applicable equations for the calculation of these properties are derived after Oliver and Pharr [14], with relevant variables displayed on the load–displacement curve shown in Figure 4 [14,15].
Hardness is defined as the ratio of the applied load, P, to the projected contact area of the indent at that load. This area is calculated from an empirically determined area function that depends on the contact depth, hc. The general form of this relationship has been cited as:
A = n = 0 6 C n ( h c ) 2 n
where C1…C6 are constants found through a curve-fitting procedure using the calibration indents [15], and n denotes the order of the polynomial used to fit the probe shape. The contact depth, hc, which differs from the total penetration depth, is calculated using the following expression:
h c = h m a x ε P m a x S
where hmax is the maximum contact depth, Pmax is the maximum load of an indentation, and ε is a constant dependent on indenter geometry for a Berkovich tip, which is equal to 0.75. The slope of the initial portion of the unloading curve represents the elastic stiffness of the contact and is defined as the contact stiffness, S.
The elastic modulus, E, of the sample is determined from the reduced modulus, Er, derived from the nanoindentation, defined by Oliver and Pharr [14] as:
E r = π S 2 β A
where β is a constant dependent on the indenter’s geometry; β is 1.034 for a Berkovich indenter [15]. S is the contact stiffness, and A is the projected contact area calculated from Equation (1). The elastic modulus can then be calculated by manipulating the following equation:
1 E r = ( 1 v 2 ) E + ( 1 v i 2 ) E i
where v is the Poisson’s ratio of the sample and the subscript i denotes an intrinsic property of the indenter (modulus and Poisson’s ratio). Er is determined from the nanoindentation tests and E will be the final calculation of Young’s modulus, though due to the high values of the diamond probe, Er ends up being close enough to the value of E of the material, that it is negligible to do the calculation. For the diamond Berkovich probe, Hysitron reports these parameters as Ei = 1140 GPa and v i = 0.07
S = ( d P d h ) h = h m a x
Contact stiffness is generally determined by fitting only the upper portion of the unloading data, as shown in Equation (5) [15], where P is the applied load, S is the contact stiffness taken from the tangent of the initial unloading portion of the load curve, and h is the displacement into the material.

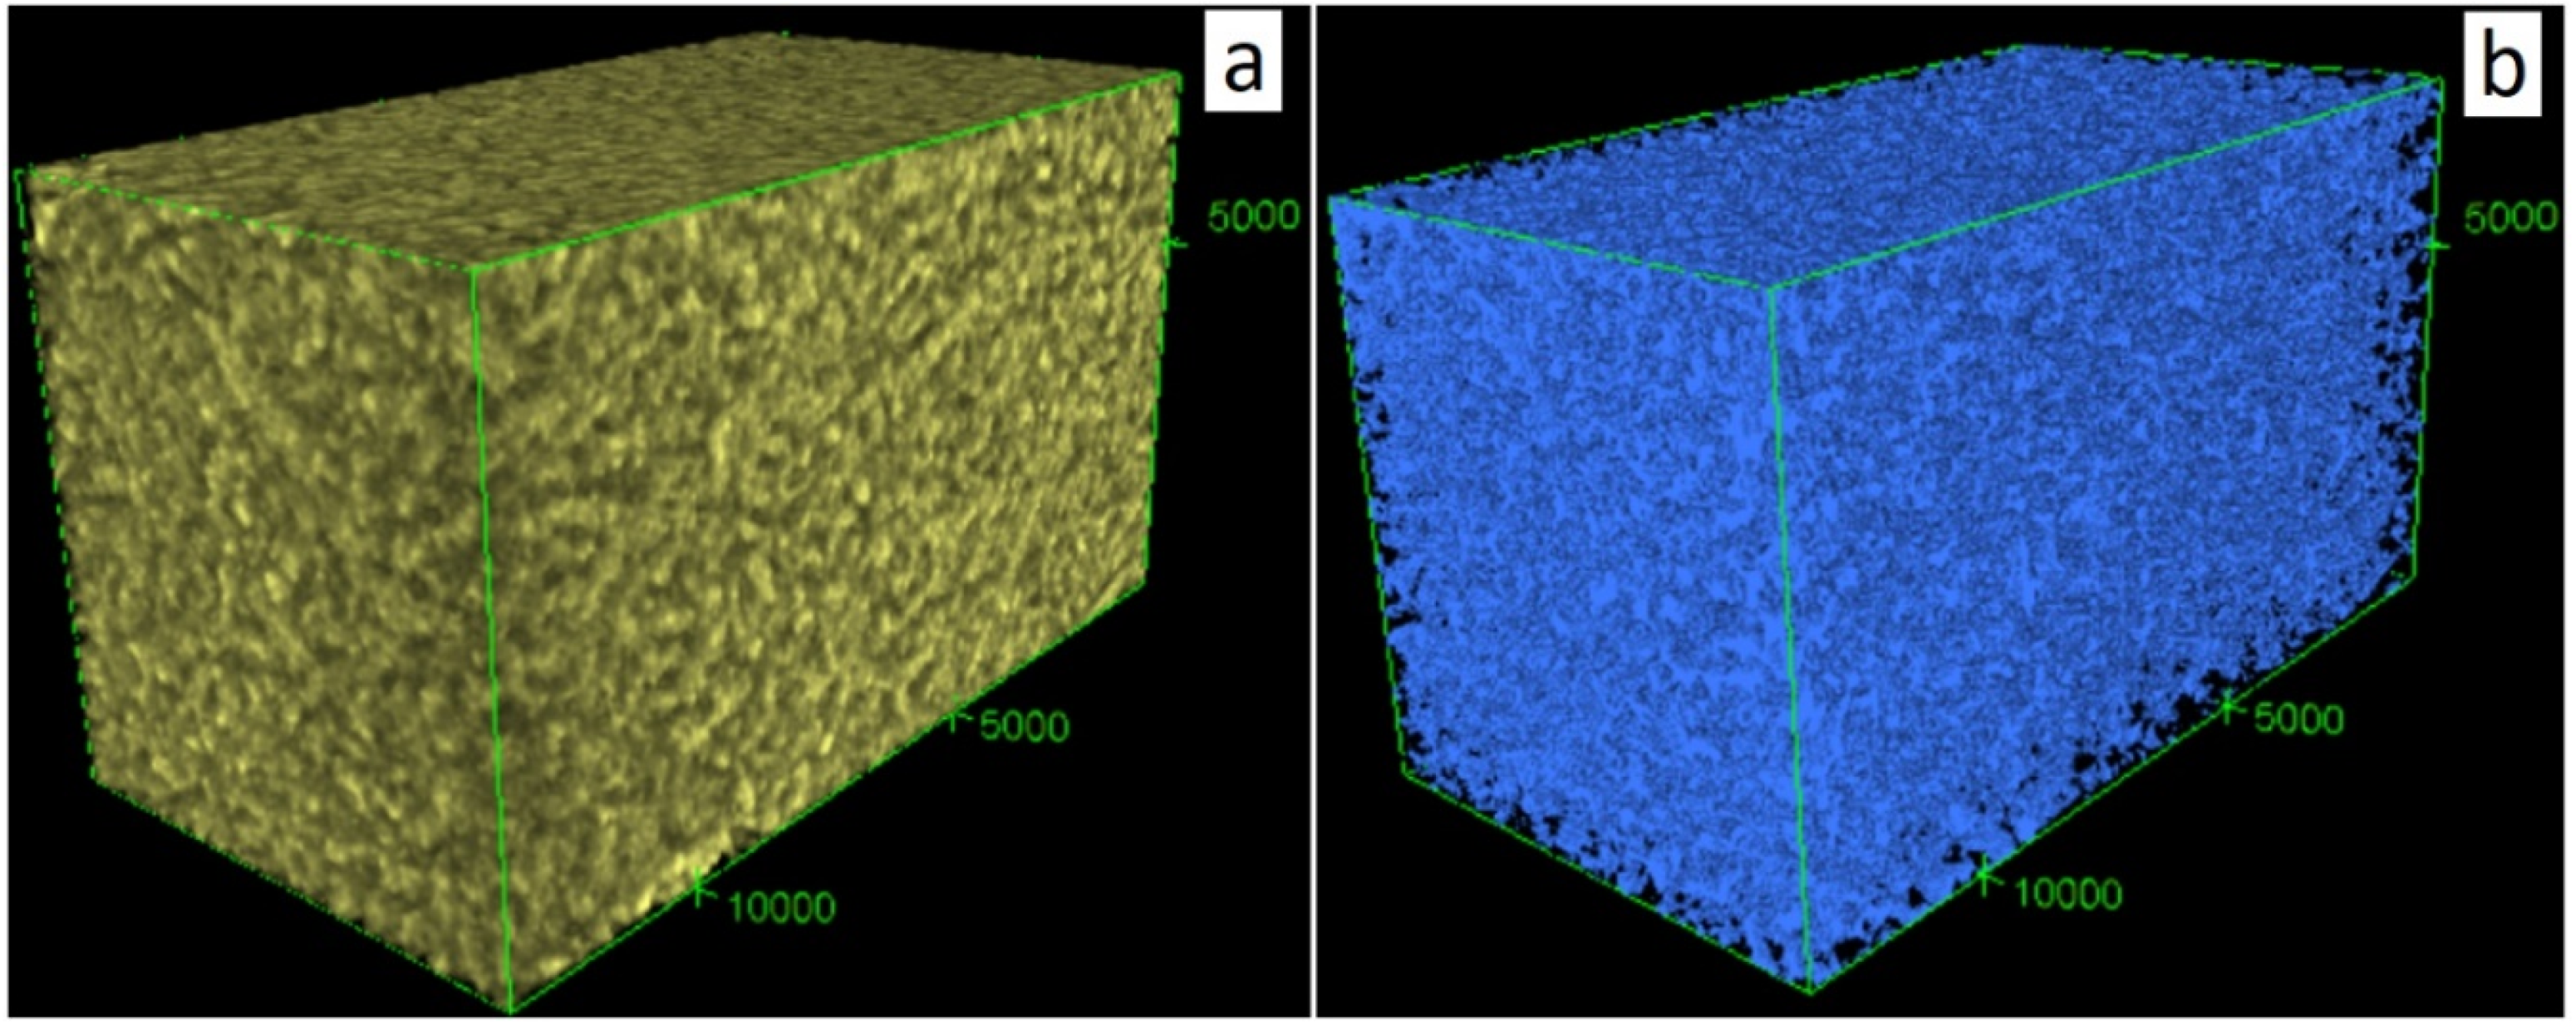
2.2. Porosity by X-ray Attenuation in Micro-X-ray Computed Tomography (Micro-XCT)

The Xradia Micro-XCT 400 system at the University of Utah was used for the micro-XCT scanning of the natural consolidated HNT with voxel resolutions of 1.85 and 19.32 μm. Due to the small pore size and homogenous distribution of the consolidated HNT nanopore structure, at a relatively large XCT voxel resolution, the porosity of the consolidated HNTs, i.e., the nanopore network, is counted as bulk density for this geomaterial. As a result, the linear X-ray attenuation in the natural consolidated HNTs can reveal the total porosity of the nanopore network inside the consolidated HNTs [16]. The phyllosilicate mineral pyrophyllite Al2Si4O10(OH)2 has a chemical composition similar to halloysite and a relatively more consolidated structure compared to kaolinite and halloysite. Pyrophyllite was selected as a reasonable standard that has no porosity to compare with consolidated HNTs. The ratio of X-ray attenuation for consolidated HNTs to pyrophyllite is reported as the micro-XCT estimated porosity for consolidated HNT, similar to a previous study on porous and brittle solid structures [17]. To validate the total porosity estimated by X-ray attenuation, the He porosimetry of natural consolidated HNTs was measured using an Ultra-Pore 300TM porosimeter manufactured by Core Laboratories.

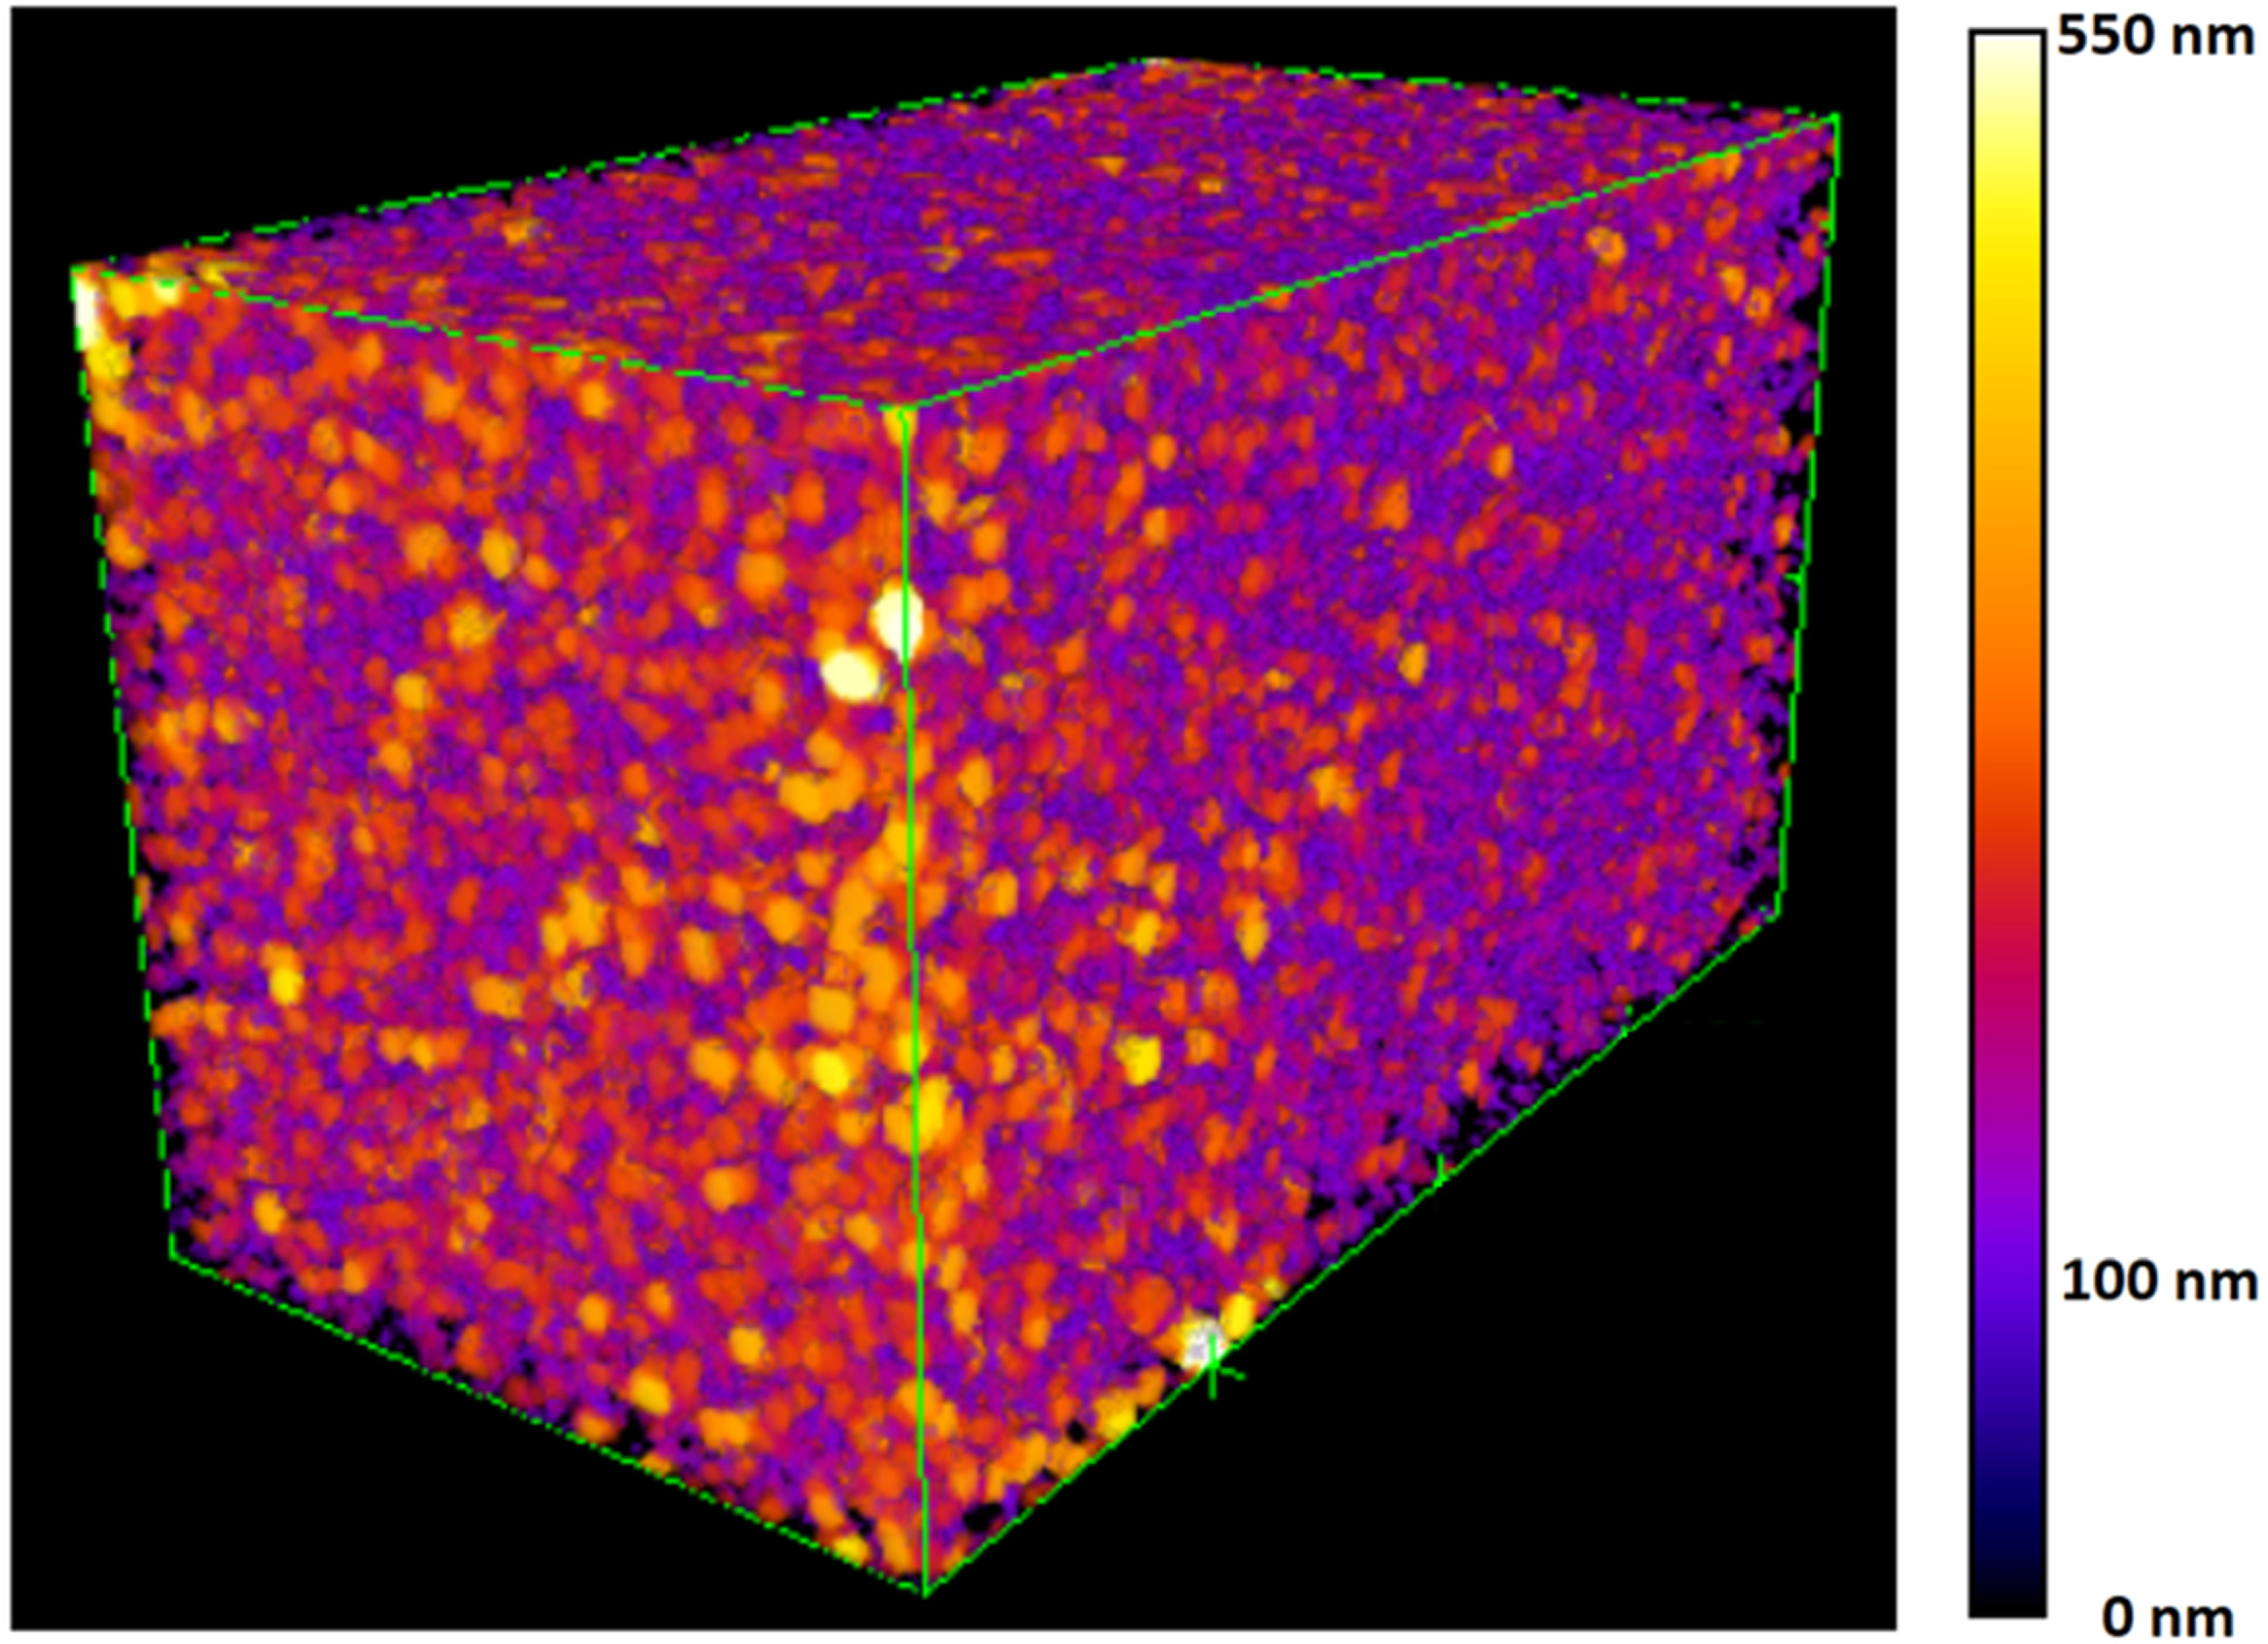
2.3. Pore Network Characterization by Nano-XCT

The natural consolidated HNT geomaterial was ground into particles smaller than 100 μm. One piece of a particle with a diameter of tens of microns was selected for nano-XCT scanning. A Zeiss Xradia Ultra 810 was used for the nano-XCT imaging with a voxel resolution of 32 nm. High-resolution nano-XCT (32 nm) is able to image the three-dimensional pore network structure inside the natural consolidated HNT. A 3D section of the consolidated HNT with dimensions of 12 μm × 6 μm × 6 μm from nano-XCT scanning was selected for the nanopore network analysis. The pore size/diameter of the nano-XCT-scanned consolidated HNTs was analyzed by computing the local thickness of the 3D pore network with ImageJ, where the diameter of the largest sphere that fit inside the pore network at a particular location was used to represent the pore size [18].

2.4. Small-Angle X-ray Scattering (SAXS)

The ultrasmall- and small-angle X-ray scattering (USAXS/SAXS) measurements on the consolidated HNT sample were performed at the Sector 9-ID-C in the Advanced Photon Source (APS), Argonne National Laboratory (ANL) using a Bonse–Hart double-crystal setup [19,20]. The natural consolidated HNT particles were loaded into a quartz capillary (I.D. = 1.3 mm and O.D. = 1.5 mm) to acquire the scan. Measurements on the empty quartz capillary were also performed, taken as the background, and then subtracted from the scattering of the consolidated HNTs. A total X-ray flux of ~1013 photon mm−2s−1 and an energy of 21 keV were applied for the scanning, which corresponds to an X-ray wavelength of 0.59 Å. The sample-to-detector distance and instrument calibrations were performed using silver behenate [21]. To reduce the USAXS and SAXS curves from scanning, the Irena and Nika macros in IgorPro software (Wavemetrics, Lake Oswego, OR, USA) were used [22,23]. This methodology has been described in previous publications [24,25,26]. The merged USAXS and SAXS curves for the consolidated HNTs are shown in Figure 5.
Two unified fit levels based on different q-regions, where q = (4π/λ) × sin(θ/2), λ is the incident X-ray wavelength, and θ is the scattering angle, were used for the fitting [27]. The selected q-regions were q = 0.00–0.02 Å−1 and q = 0.02–0.4 Å−1. The fitting performed in the selected q-regions is described by a combined Guinier–power law regime. The unified fit model is based on the approach proposed by Beaucage [28,29]. This model was primarily designed for the unit shape being spherical and centrosymmetric, but it can also be used for the scatters of different shapes, including rods, lamellae, and cylinders [29,30].
To validate the SAXS results, BET and BJH pore size analyses were conducted using a Micromeritics 3Flex with N2 gas at the University of Utah. About 1 g of the natural consolidated HNT particles was used for the measurement. The BET adsorption, desorption, and BJH adsorption average pore widths are reported as the intra-HNT diameter for the consolidated HNT structure to compare with the SAXS results and values reported in the literature.

2.5. Sedimentation Field-Flow Fractionation (SdFFF)

HNT elements from the Dragon Mine, UT, were suspended in a surfactant of 0.05% Fl-70, which is a mixture of ionic and nonionic surfactants (Fisher Scientific, USA), and then dispersed by probe sonication for 3 s. One-hundred microliters of the dispersed sample were injected into the sedimentation field-flow fractionation (SdFFF) channel (Postnova Analytics USA) using 0.05% Fl-70 as the carrier. Duplicate or triplicate injections were made to assure reproducibility. Size distributions were calculated from the corresponding retention times, using an assumed density of 2.6 g/mL for all of the halloysite samples:
d ( S d F F F ) = ( 36 k T t r t 0 π | Δ ρ | G w ) 1 3
where k is the Boltzmann constant, T is the temperature, tr is the retention time, t0 is the elution time for nonretained particles, Δρ is the difference in the density between the sample species and the carrier, G is the acceleration, and w is the FFF channel thickness.

3. Results and Discussion

3.1. Mechanical Properties of Consolidated Halloysite

Each sample was indented 10–20 times in a grid with a spacing of 50 μm between indentation spots, up to a maximum load of 1 mN. As listed in Table 1, the natural consolidated samples, HNT 01, 02, and 03, exhibited significantly different elastic modulus (Ea) and hardness (H) values. Since the consolidated HNT materials were from different locations of the halloysite vein, it was expected that the packing or association of HNTs in the consolidated structure might be different, leading to inconsistencies in consolidation and mechanical properties. Impurities such as alunite, KAl3(SO4)2(OH)6, quartz, SiO2, and gibbsite, Al(OH)3, in consolidated HNT samples from the Dragon Mine, have been reported in the literature [31,32]. As listed in Table 1, sample HNT 03 had the highest content of alunite as determined from a sulfur assay, but still a very low value of less than 1 ppm. The XRD spectrum of sample HNT 03 indicated mild peaks for alunite and significant peaks for gibbsite, while the XRD spectra for the two other HNT samples did not. The XRD quartz peaks were weak and about the same level for all three samples. Although low in content, the impurities such as alunite and gibbsite might function as binders between the nanotubes in order to improve the mechanical properties of the structure, as proposed in a previous TEM study [31]. Natural consolidated sample HNT 03, which was the most consolidated sample among the three, was selected in this study for porosity and pore size analysis by nano-XCT.
The poorly consolidated kaolinite sample from Rincon de Cerdeno, Guanajuato, Mexico, was labeled as Kaolinite 01, and the more consolidated kaolinite sample from Blawn Mountain, Beaver County, UT, was labeled as Kaolinite 02. As listed in Table 1, the kaolinite structures with different levels of consolidation also exhibited a range of elastic modulus and hardness values, as determined from nanoindentation measurements. However, the connection between the kaolinite platelets in the bulk structure is different from the packing or association of tubular elements in the natural consolidated HNT structure. The association between the kaolinite grains may not be as strong as the packing or association of the HNT elements. As a result, based on the nanoindentation measurements, the natural consolidated HNT structure had a higher hardness value overall compared to the bulk kaolinite.
Furthermore, the nanoindentation results for the natural consolidated HNT were compared with those for generic calcite and fused silica. The nanoindentation results for calcite and quartz were reflective of the Mohs scales reported by Samsonov, i.e., that calcite has a mild hardness compared to quartz [33]. Based on the elastic modulus and the hardness values, even the most consolidated HNT structure was more weakly indurated than the ionic crystal structure of calcite. Although the Mohs scales for halloysite and kaolinite were both reported to be 2–2.5, the nanoindentation study showed that the hardness of these two structures was highly dependent on their level of consolidation. These results demonstrate that the nanoindentation approach provides physical information based on the microscopic organization of the material structure.

3.2. Porosity of Natural Consolidated Halloysite

Cross-sectional views of the natural consolidated HNT 03 structure characterized by XCT with voxel resolutions of 19.32 μm, 1.85 μm, and 32 nm (Figure 6) provide a multiscale view of the structure. At a voxel resolution of 19.32 μm (Figure 6a), except for a few bright spots, possibly due to impurities such as iron or calcium (as large as several microns in size), the natural consolidated HNT material seemed to be homogeneous in the micro-XCT cross-sectional view. With the finer voxel resolution of 1.85 μm (Figure 6b), a large number of dark spots appeared in the micro-XCT cross-sectional view of the natural consolidated HNT, somewhat revealing the pore channels between the HNT elements, although the image was too blurry for any quantitative analysis. Compared to the size of an individual HNT (curvature of about 60 nm and length of 0.5–10 μm), the voxel resolution size from the micro-XCT was too coarse to observe the HNT elements in the consolidated structure, even with 1 μm or sub-micron resolution [4,5]. To estimate the porosity of the consolidated HNT structure from X-ray attenuation, micro-XCT scanning with a voxel resolution of 19.32 μm was selected due to the homogeneity shown in the scanning results.
As mentioned in Section 2 (Materials and Methods), pyrophyllite was chosen as the solid standard (zero porosity) for porosity estimation of the consolidated HNT structure by X-ray attenuation. As listed in Table 2, both the micro-XCT estimation and He porosimetry reported a total porosity of the consolidated HNT structure of about 40%. This natural consolidated HNT structure was from the relatively more solid sample (HNT 03), as discussed in Section 3.1 (Mechanical Properties). Therefore, the HNT 03 sample might be expected to have a porosity that differs from other HNT samples from the Dragon Mine. This issue will be examined in future research.
In Figure 6c, the tubular shape of the HNTs in the natural consolidated structure (HNT 03) can be seen clearly in the cross-sectional nano-XCT view at the voxel resolution of 32 nm. Thus, nano-XCT is capable of exploring at least the inter-HNT pore network structure in the natural consolidated HNT samples. As shown in Figure 7a, the raw 3D image of natural consolidated HNT 03 (12 μm × 6 μm × 6 μm) was processed with ImageJ software by thresholding and excluding the solid HNT elements to extract the 3D pore network (Figure 7b). The porosity of the inter-HNT pores larger than 32 nm in the natural consolidated HNT structure was 13.2%, as listed in Table 2. When the inter-HNT porosity was excluded from the total porosity of the consolidated HNT structure, the porosity contributed from the intra-HNT pores was about 27%. Considering the ratio of inter- and intra-HNT porosity in the consolidated HNT structure, an assumption of the heterogeneous pore surface in this nanoporous structure can be made. The inter-HNT porosity (13.2%) was about one-third of the total porosity (40.6%) and had a hydrophobic surface state. However, the smaller intra-HNT pores, as branches of the major pore network (still two-thirds of the total porosity), were hydrophilic and could be wetted by water. This led to the next step of this study, which was to investigate pore connectivity in the consolidated HNTs.

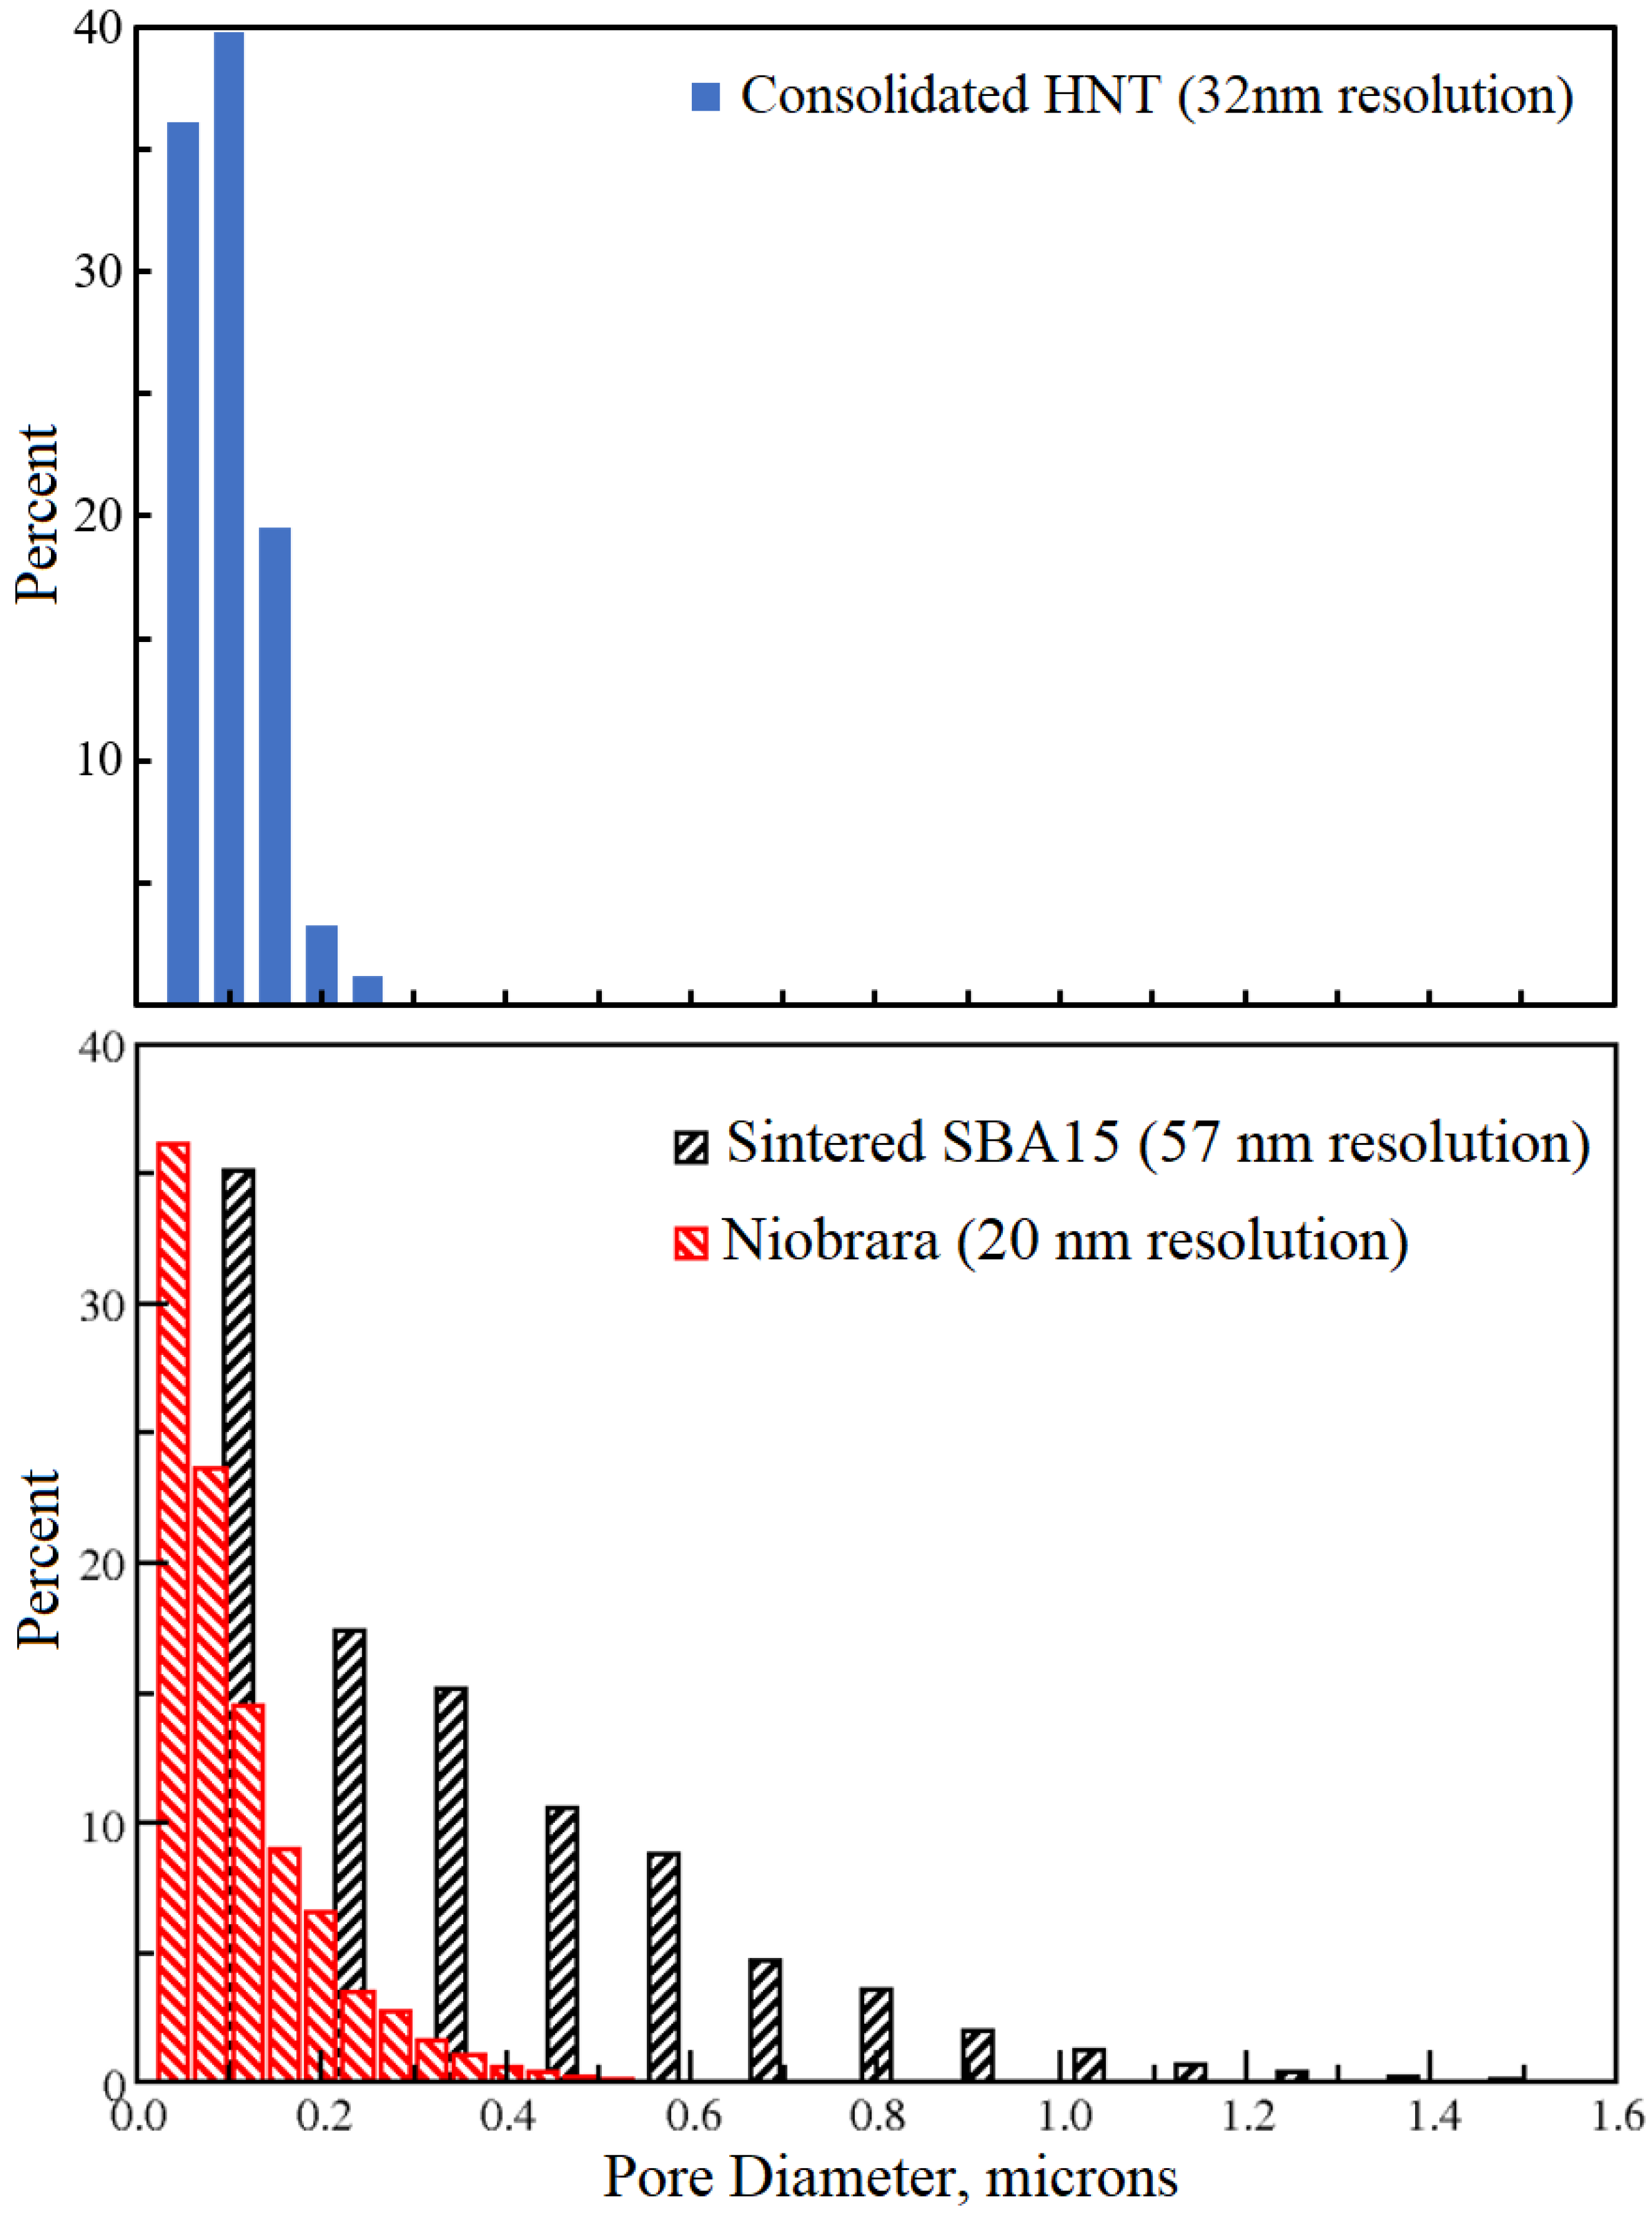
3.3. Pore Size Distribution

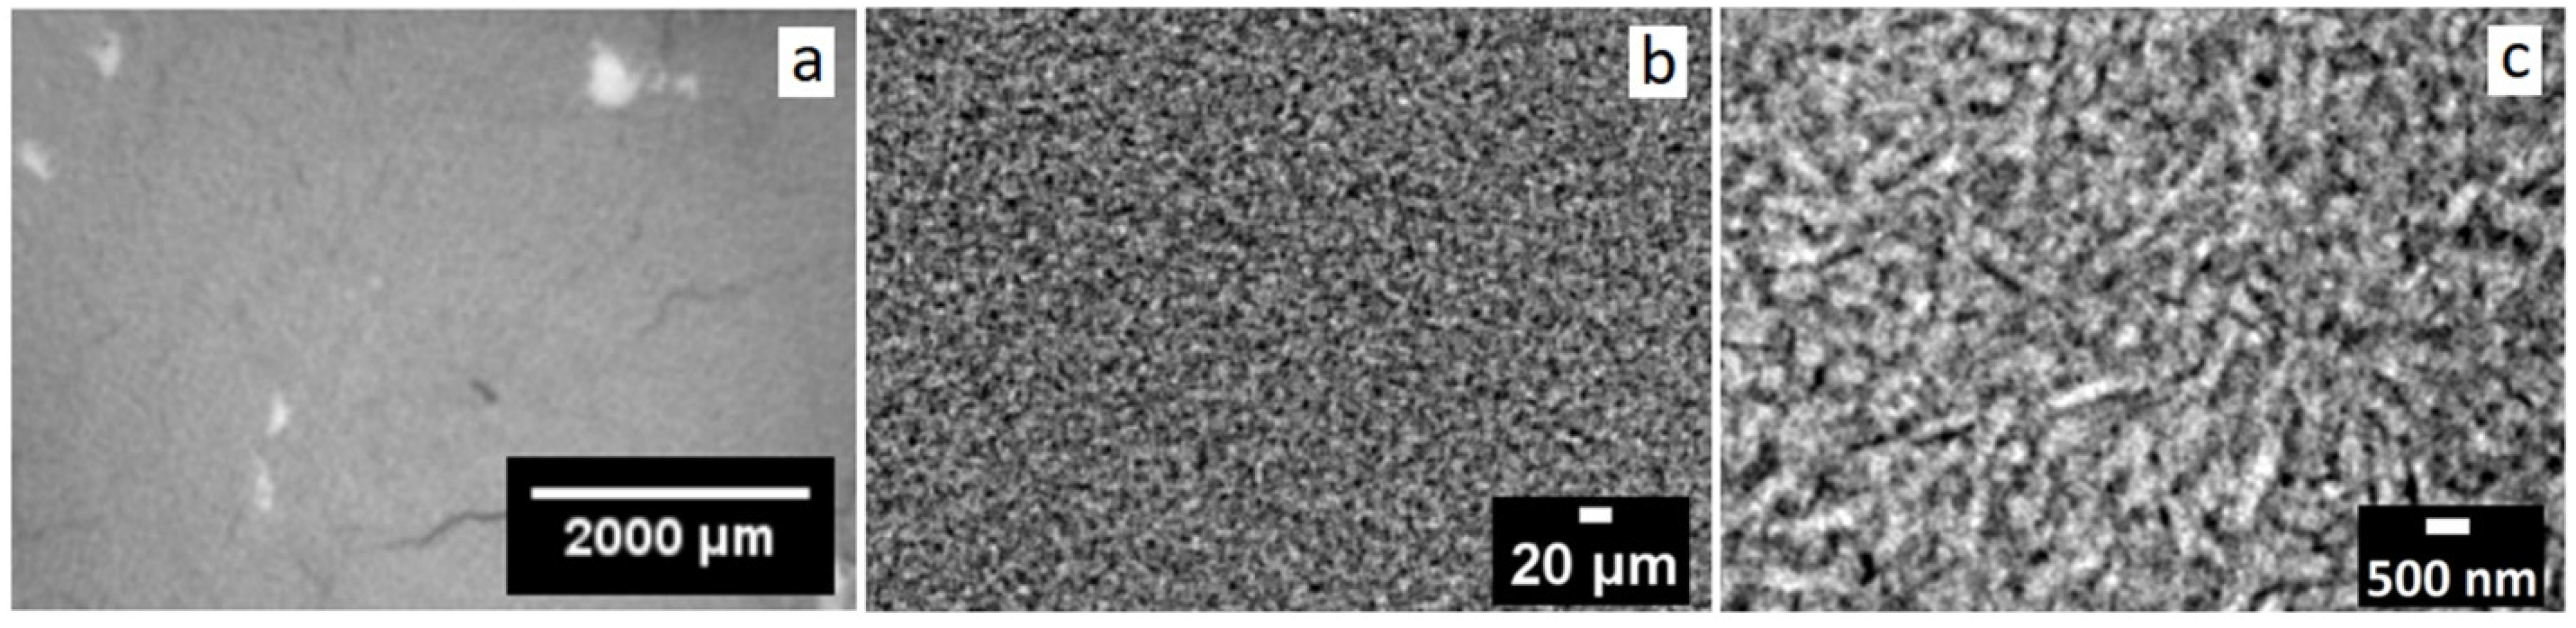
3.3.1. Inter-HNT Pore Size Measured by Nano-XCT

To analyze the size distribution of the pore channels, the local thickness of the inter-HNT 3D pore network of HNT 03 was calculated with ImageJ software [18]. The diameter of the largest sphere that fit inside the pore network at a particular location was used to represent the pore size. Using the same 3D view of the inter-HNT pore network, color codes from dark purple to bright yellow are used to mark the variable pore diameters in the consolidated HNT structure in Figure 8. Approximately 24% of the 3D pore network was orange-yellow, indicating a pore size of 150 nm or above. This could be a result of the relatively loose packing of HNT elements in such locations. However, the majority of the pore channels had a diameter of around 100 nm (purple coloration). Additionally, from the connectivity analysis with ImageJ, the entire inter-HNT pore network for the consolidated HNT sample (HNT 03) exhibited connectivity throughout the entire volume of 12 μm × 6 μm × 6 μm.
To quantitatively assess the pore size distribution of the inter-HNT pore network, the consolidated HNT was compared with the nano-XCT pore size results for two other naturally porous materials: Niobrara oil shale and a geo-architected nano-porous material, sintered SBA15 (Figure 9) [34,35]. For more detailed information regarding Niobrara oil shale and sintered SBA15, the reader is referred to Lin and Miller, and Maheshwari, et al. [34,35]. Nano-XCT characterization of the oil-bearing Niobrara shale showed that 81% of the pore channels were smaller than 200 nm, which is similar to the value for consolidated HNT, in which 76% of the pores were smaller than 150 nm. However, the shapes and sizes of the nanopores in the Niobrara shale vary significantly, and their spatial distribution is relatively irregular and uneven in the silicate or carbonate shale [34]. The sintered SBA15 material was made from 2~3 μm SBA15 particles by spark plasma sintering (SPS) at 800 °C and 30 MPa. The total porosity for the sintered SBA15 was about 65%. Although inside the SBA15 particles, there were ordered nanopores with diameters of about 6 nm, voids between the SBA15 particles were still present after sintering [35]. About 65% of the pores in the sintered SBA15 structure were larger than 200 nm, and some pores were larger than 1 μm. This pore size analysis and comparison showed that the inter-HNT channels inside the consolidated HNT structure are relatively more homogeneous in terms of pore size and pore shape than the Niobrara oil shale and the sintered SBA15. Thus, the consolidated HNT structure could be a worthy natural nanoporous material to be used to study fluid–solid interaction and fluid transportation under confinement, and it may have some potential to be architected to achieve targeted pore structure and connectivity.

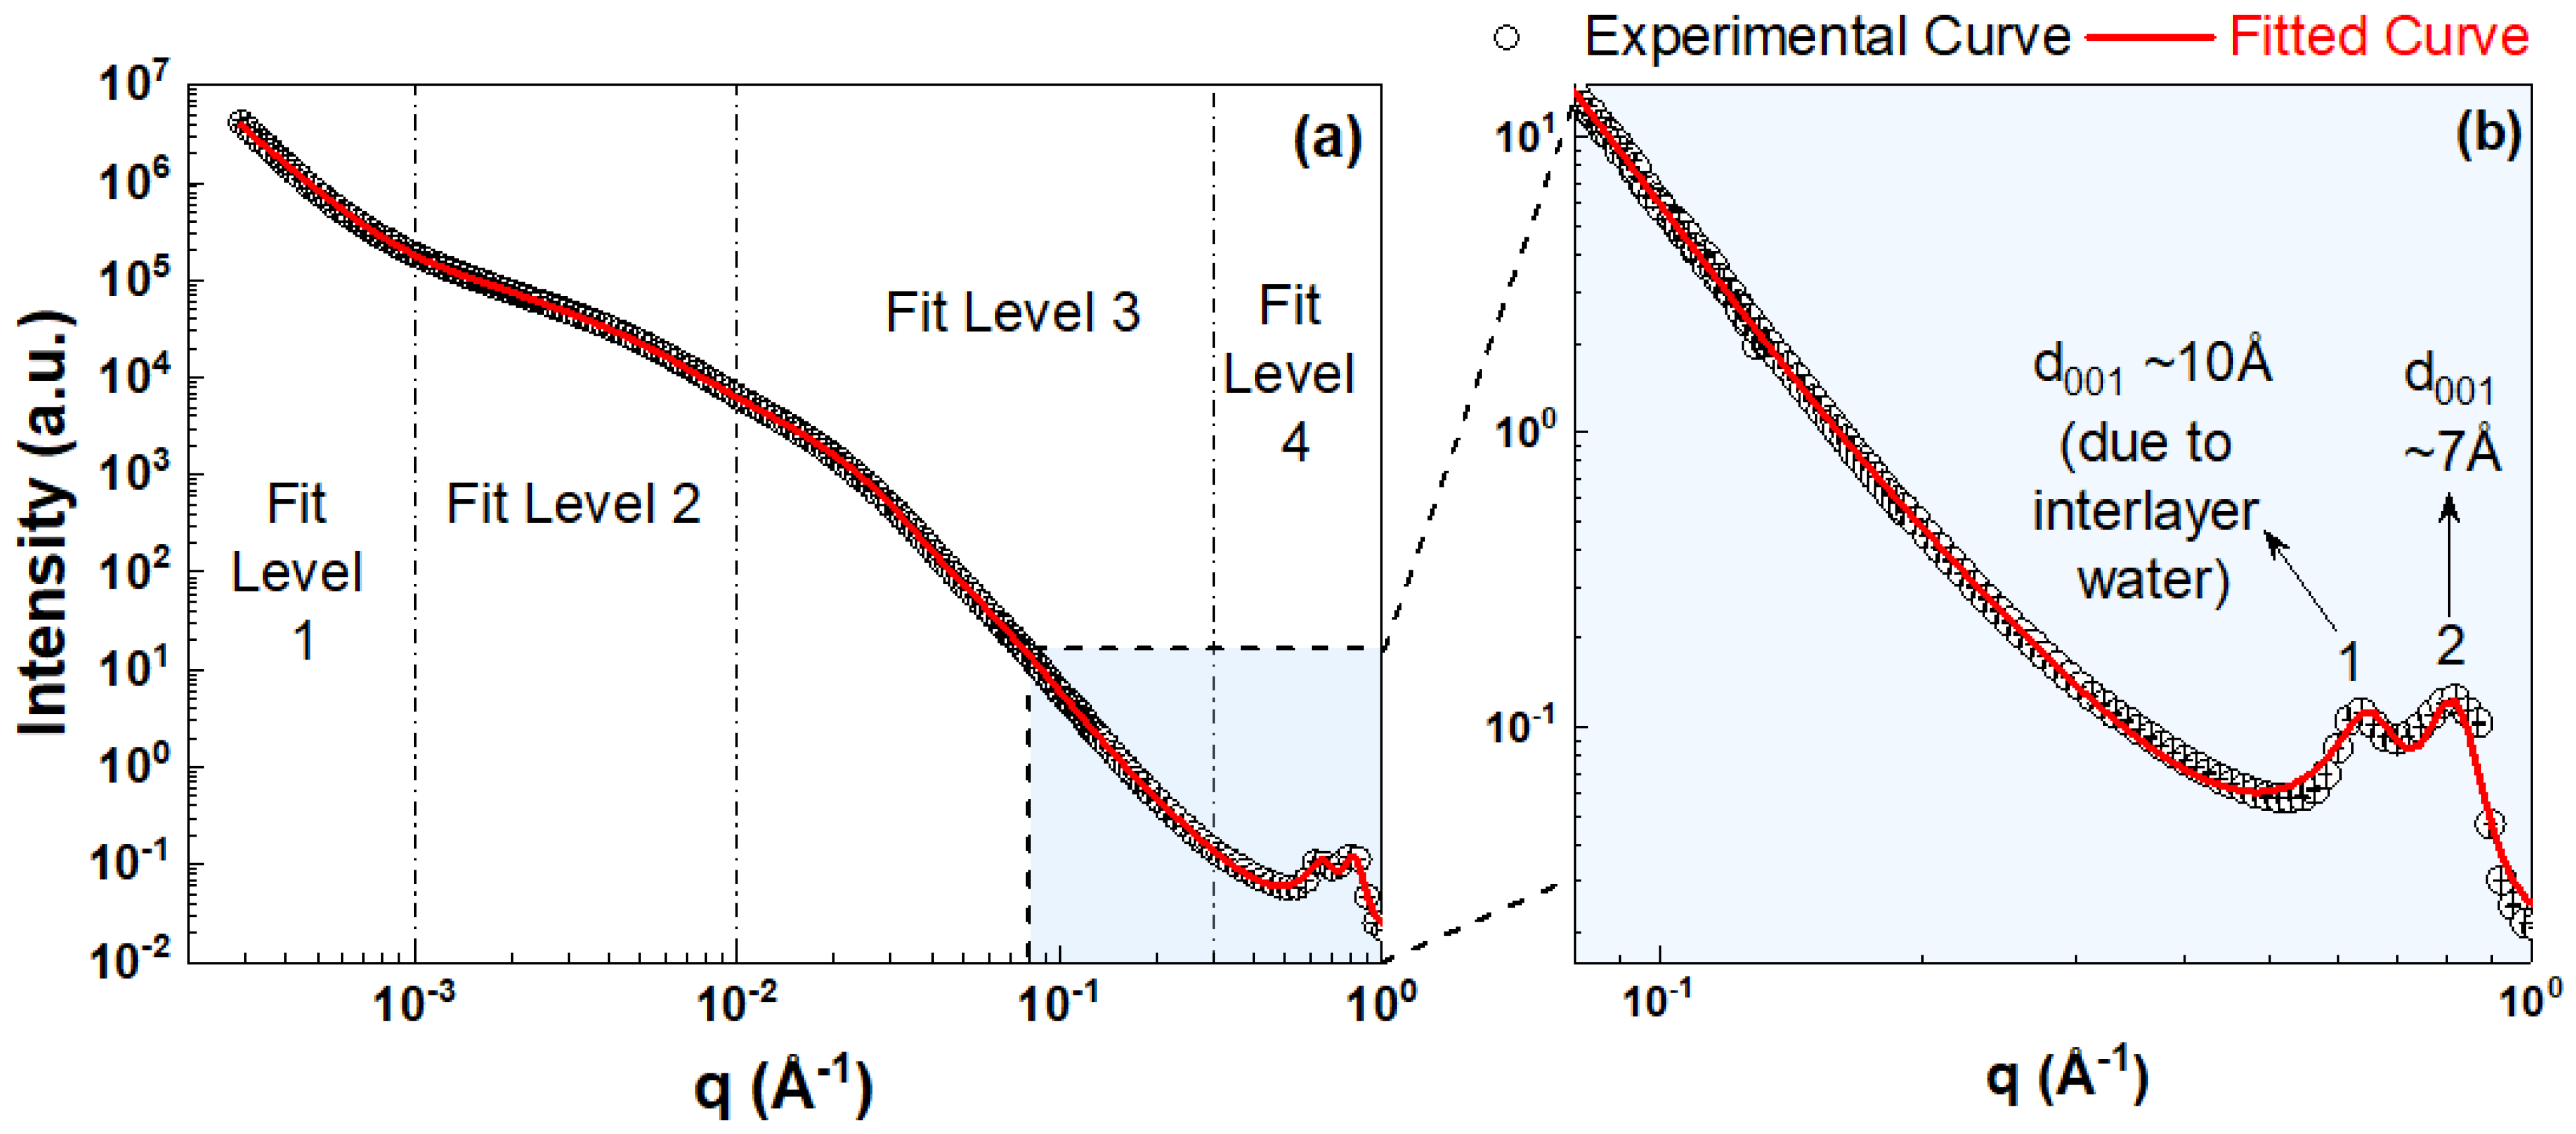
3.3.2. Intra-HNT Pore Size Measured by Combined USAXS/SAXS

The voids inside the nanotubes of the halloysite (HNT 03) contribute to the intra-porosity in these materials. The radius of gyration, Rg, which corresponds to the representative pore size dimension of a halloysite nanotube, was determined using the Unified Fit model at level 3, which corresponds to a q range of 0.001–0.02 Å−1 in the USAXS/SAXS data, as shown in Figure 5. A surface fractal with a power-law slope of 3.35 was obtained for fit level 3 in the q range of 0.001–0.02 Å−1. The intra-HNT pore size in the consolidated HNT from the Dragon Mine, UT, was 12.8 nm, as determined by Rg from SAXS data (Table 3).
The pore size of HNT determined from USAXS/SAXS was in the same range as the intra-HNT pore size of 10.5 nm determined using BET N2 adsorption and desorption, which is consistent with published results [4,5]. The reported pore sizes of halloysite were based on the inert gas adsorption method. Unlike these inert gas adsorption and desorption approaches, the determination of Rg from SAXS analyses is a more direct measurement of the intra-HNT diameter than the inert gas adsorption approach. Overall, the SAXS and inert gas adsorption methods provide consistent HNT pore diameters of ~10 nm. Intra-HNT pores comprised two-thirds of the entire porosity in halloysites. However, quantifying this porosity has been a challenge. The SAXS and BET approaches described in this study provide a quantitative basis for determining the intra-porosity in HNTs, which was conventionally challenging to determine using nano-XCT.

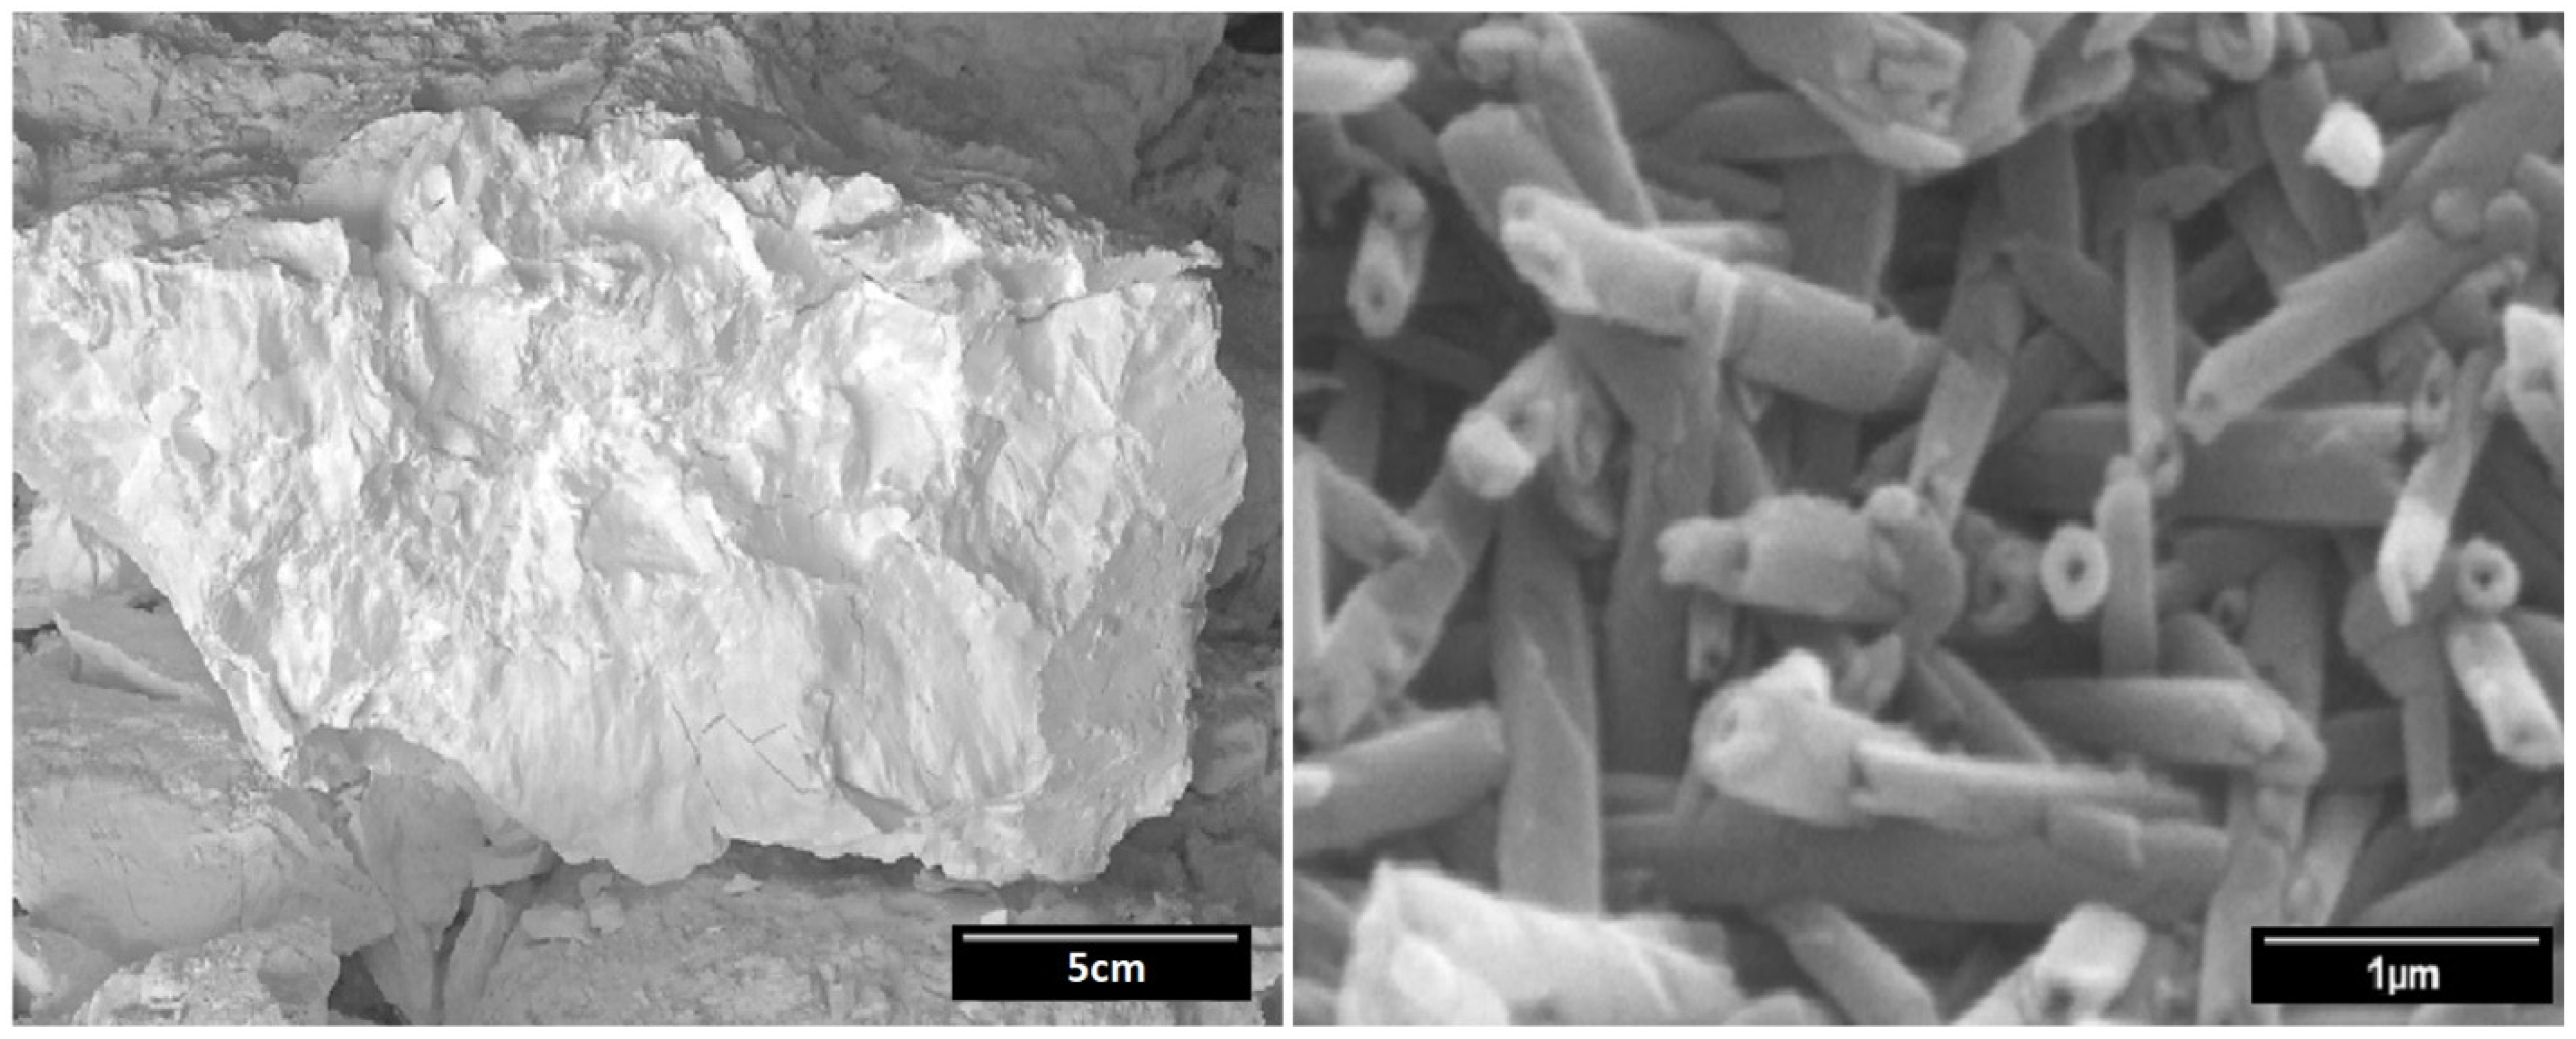
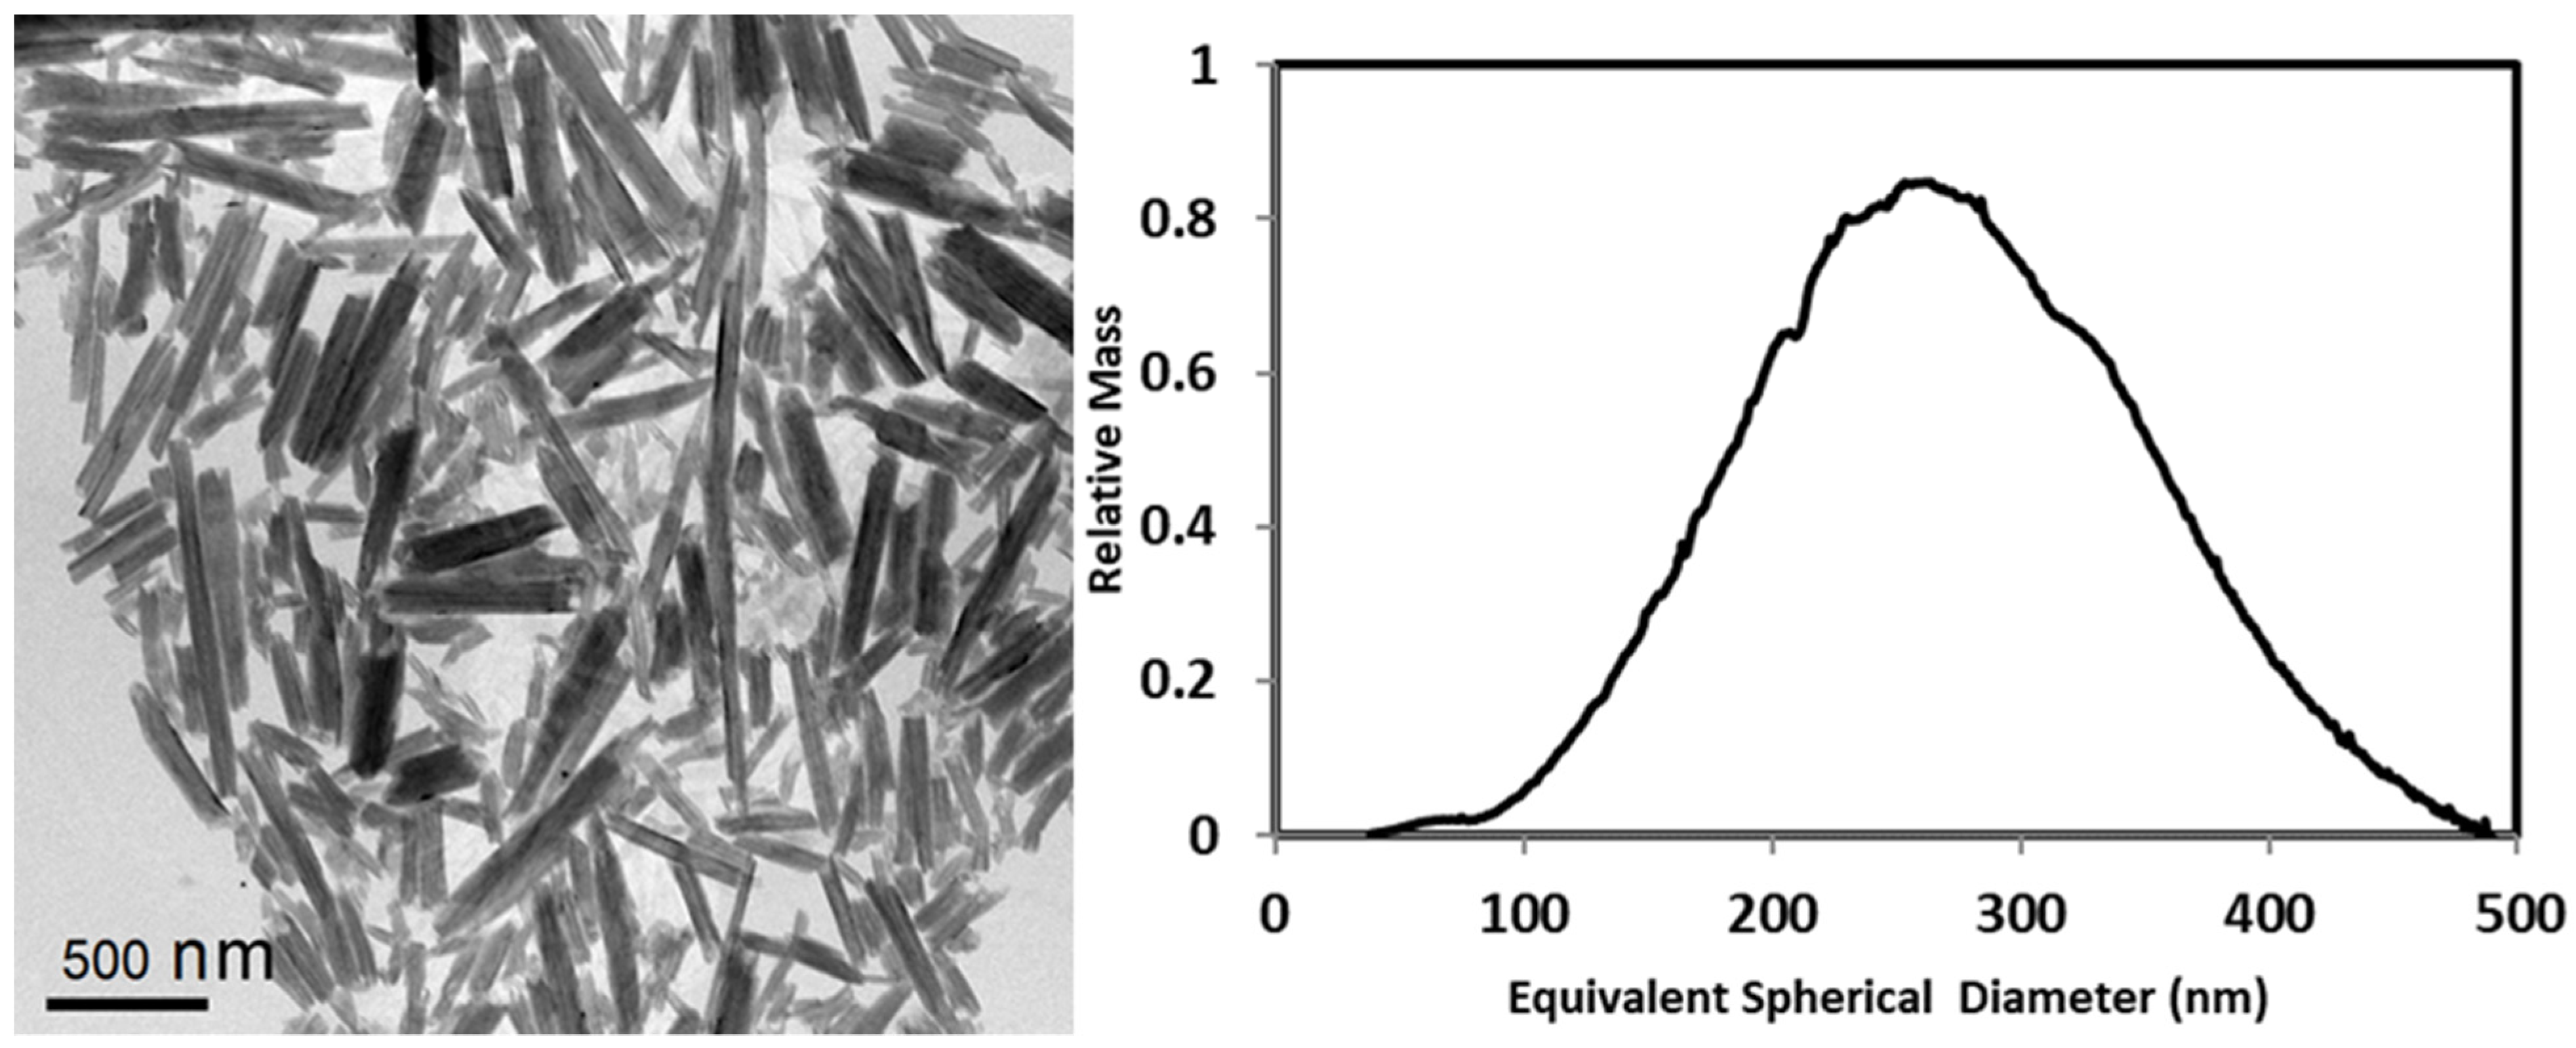
3.4. Individual HNTs of the Natural Consolidated Structures

The individual HNTs of the natural consolidated samples from different locations in the Dragon Mine were analyzed by SdFFF for particle size, i.e., equivalent spherical diameter (ESD), and validated by TEM imaging. Additionally, atomic spacing in the halloysite lattice structure of the natural consolidated HNT from the Dragon Mine, UT, was extracted from the SAXS results.

3.4.1. Size of Individual HNTs

Three HNT samples from the Dragon Mine were labeled as Dragon A, B, and C, and were randomly selected from the natural consolidated HNT materials from different locations of the halloysite vein. All HNT samples were prepared according to the procedures in Section 2 (Materials and Methods) for dispersion and sedimentation of individual HNTs. As listed in Table 4, all the HNT samples had an equivalent spherical diameter (ESD) range of 90~500 nm and an ESD peak value of 210~270 nm. The ESD range and peak for the three groups of HNT elements of the Dragon Mine are generally consistent with published values for HNTs from other resources [4,5,6,36]. The variance among these three groups of HNT elements likely resulted from the slightly different geological conditions during the halloysite formation and deposition at different locations in the vein.
In addition to indicating intra-HNT pore diameters of ~12 nm, the SAXS results indicated the outer curvature of HNT to be about 70 nm based on the Rg value obtained from fit level 2 in the q range of 0.02–0.4 Å−1. The outer diameters of the Dragon Mine HNTs using SAXS measurements are consistent with the literature values [4,5,6,36]. In Figure 10, the TEM image of the Dragon Mine HNT elements that were dispersed and sedimented in deionized water is compared with the ESD distribution of Dragon C determined by SdFFF. The majority of the HNT elements had an outer curvature of about 70 nm. The darker color in the TEM image indicates HNT elements with relatively higher mass. The HNT elements with different lengths and outer diameters are expected to have variable packing patterns in the consolidated structure, which may influence the transport behavior of confined fluids.

3.4.2. Halloysite Interlayer Spacing

One of the distinguishing features of halloysite is the nanoscale tubular morphology, which differs from that of planar kaolinite. Furthermore, halloysite can swell in the presence of water, while kaolinite does not have this attribute. The information about the interlayer spacing was extracted from fit level 4 of the SAXS curve (q > 0.1 Å−1), as shown in Figure 5b. Peaks 1 and 2 at 0.66 Å−1 and 0.82 Å−1, respectively, were assigned for the basal d001 spacing in the halloysite/kaolinite structure. Peaks 1 and 2 represent a d spacing of 0.77 nm and 0.95 nm, respectively. The d spacing of 0.77 nm exactly matches the XRD-determined spacing between two layers of halloysite/kaolinite Al2Si2O5(OH)4 without water or other molecules in between [37]. Previous studies have reported that the d spacing of the halloysite/kaolinite structure can be expanded with the intercalation of water or other molecules [4,5,38,39]. The gibbsite surface of the halloysite/kaolinite structure is hydrophilic and can be wetted by water. The HNT structure has the ability to retain water molecules between the aluminosilicate layers. The d spacing of 0.95 nm determined from the SAXS analysis indicated that there are interlayer water molecules present in the HNT structure. The water content in the HNT may change depending on the moisture and temperature of the environment.

4. Conclusions

In this paper, the mechanical and multiscale porosity features of natural consolidated structures of halloysite nanotubes are reported. This information is crucial for harnessing the natural consolidated HNT materials as separation media. One of the unique features of HNTs is the difference in the surface characteristics at the inner and outer walls of the HNTs (hydrophilic vs. hydrophobic). These differences are expected to result in anomalous flow behavior through consolidated halloysite materials. Mechanical properties such as the elastic modulus and hardness of halloysite materials are higher compared to kaolinite. The natural consolidated HNTs are significantly softer than common minerals such as calcite and quartz.
The 3D structure of the inter-HNT pore network in the natural consolidated HNT structure is reported in this paper for the first time. This pore network was imaged by nano-XCT with a voxel resolution of 32 nm. The porosity for the inter-HNT pores over 32 nm was about 13%. A total porosity of 40% is reported for the natural consolidated HNT material from X-ray attenuation analysis by micro-XCT and He porosimetry measurements. Nano-XCT imaging showed that 76% of the inter-HNT pores were smaller than 150 nm in diameter with relatively uniform spatial distribution, and the inter-HNT 3D pore network had sufficient connectivity through the consolidated structure.
Noninvasive SAXS characterization showed that the intra-HNT pore diameter was ~12 nm. The expanded d spacing due to the presence of interlayer water in the HNTs was also identified from the SAXS diffraction peaks. The SdFFF-analyzed equivalent spherical diameter of the individual HNT elements from the Dragon Mine had a peak value from 210~270 nm. The experimental approach described in this study is uniquely suited for characterizing geomaterials with inherent hydrophobic and hydrophilic features and specific morphologies.

Author Contributions

Conceptualization, J.J. and J.D.M. (Jan D. Miller); formal analysis, J.J., S.A., H.A., T.T. and W.N.; writing—original draft preparation, J.J., H.A. and W.N.; supervision, G.G., J.D.M. (John D. McLennan), and J.D.M. (Jan D. Miller); project administration, J.D.M. (Jan D. Miller). All authors have read and agreed to the published version of the manuscript.

Funding

This work was supported as part of the Multi-Scale Fluid-Solid Interactions in Architected and Natural Materials (MUSE), an Energy Frontier Research Center funded by the USA Department of Energy, Office of Science, Basic Energy Sciences at the University of Utah, under award # DE-SC0019285.

Data Availability Statement

The data presented in this study are available upon request from the first author, Jiaqi Jin.

Acknowledgments

Special thanks are given to Steven Hillier, The James Hutton Institute, Craigiebuckler, Aberdeen, UK, for providing samples A and B, and to Robin White at Carl Zeiss Microscopy, LLC, for the nano-XCT scanning. The authors also wish to thank Dorrie Spurlock for her assistance with the preparation of this paper.

Conflicts of Interest

The authors declare no conflict of interest. The funders had no role in the design of the study; in the collection, analyses, or interpretation of data; in the writing of the manuscript; or in the decision to publish the results.

References

  1. Secchi, E.; Marbach, S.; Niguès, A.; Stein, D.; Siria, A.; Bocquet, L. Massive radius-dependent flow slippage in carbon nanotubes. Nature 2016, 537, 210–213. [Google Scholar] [CrossRef]
  2. Rogers, B.J.; Wirth, M.J. Slip flow through colloidal crystals of varying particle diameter. ACS Nano 2013, 7, 725–731. [Google Scholar] [CrossRef] [Green Version]
  3. Joussein, E.; Petit, S.; Churchman, J.; Theng, B.; Right, D.; Delvaux, B. Halloysite clay minerals—A review. Clay Miner. 2005, 40, 383–426. [Google Scholar] [CrossRef]
  4. Vinokurov, V.A.; Stavitskaya, A.V.; Chudakov, Y.A.; Ivanov, E.V.; Shrestha, L.K.; Ariga, K.; Darrat, Y.A.; Lvov, Y.M. Formation of metal clusters in halloysite clay nanotubes. Sci. Technol. Adv. Mater. 2017, 18, 147–151. [Google Scholar] [CrossRef] [PubMed]
  5. Brindley, G.W. Structural mineralogy of clays. Clays Clay Miner. 1952, 1, 33–43. [Google Scholar] [CrossRef]
  6. Yuan, P.; Thill, A.; Bergaya, F. Nanosized Tubular Clay Minerals: Halloysite and Imogolite. In Developments in Clay Science 7; Elsevier: Amsterdam, The Netherlands, 2016; pp. 1–754. [Google Scholar]
  7. Churchman, G.J.; Pasbakhsh, P.; Hillier, S. The rise and rise of halloysite. Clay Miner. 2016, 51, 303–308. [Google Scholar] [CrossRef] [Green Version]
  8. Lampropoulou, P.; Papoulis, D. Halloysite in different ceramic products: A review. Materials 2021, 14, 5501. [Google Scholar] [CrossRef] [PubMed]
  9. Yahaya, S.; Jikan, S.S.; Badarulzaman, N.A.; Adamu, A.D. Chemical composition and particle size analysis of kaolinite. Path Sci. 2017, 3, 1001–1004. [Google Scholar] [CrossRef]
  10. Gupta, V.; Miller, J.D. Surface force measurements at the basal planes of ordered kaolinite particles. J. Colloid Interface Sci. 2010, 344, 362–371. [Google Scholar] [CrossRef]
  11. Yin, X.; Miller, J.D. Wettability of kaolinite basal planes based on surface force measurements using atomic force microscopy. Miner. Metall. Process. 2012, 29, 13–19. [Google Scholar] [CrossRef]
  12. Yin, X. Anisotropic Surface Features of Selected Phyllosilicates. Ph.D. Thesis, The University of Utah, Salt Lake City, UT, USA, 2012. [Google Scholar]
  13. Dutta, A.K. Mechanical Properties of Granular Materials using Nanoindentation and Modeling with Distinct Element Method. Ph.D. Thesis, University of Tennessee, Knoxville, TN, USA, 2006. [Google Scholar]
  14. Oliver, W.C.; Pharr, G.M. An improved technique for determining hardness and elastic modulus using load and displacement sending indentation experiments. J. Mater. Res. 1992, 7, 1564–1583. [Google Scholar] [CrossRef]
  15. Oliver, W.C.; Pharr, G.M. Measurement of hardness and elastic modulus by instrumented indentation: Advances in understanding and refinements to methodology. J. Mater. Res. 2004, 19, 3–20. [Google Scholar] [CrossRef]
  16. McCullough, E.C. Photon attenuation in computed tomography. Med. Phys. 1975, 2, 307–320. [Google Scholar] [CrossRef] [PubMed]
  17. Lin, C.L.; Videla, A.R.; Yu, Q.; Miller, J.D. Characterization and analysis of porous, brittle solid structures by X-ray micro computed tomography. JOM 2010, 62, 86–89. [Google Scholar] [CrossRef]
  18. Hildebrand, T.; Rüegsegger, P. A new method for the model-independent assessment of thickness in three-dimensional images. J. Microsc. 1997, 185, 67–75. [Google Scholar] [CrossRef]
  19. Bonse, U.; Hart, M. Tailless x-ray single-crystal reflection curves obtained by multiple reflection. Appl. Phys. Lett. 1965, 7, 238–240. [Google Scholar] [CrossRef]
  20. Ilavsky, J.; Zhang, F.; Allen, A.J.; Levine, L.E.; Jemian, P.R.; Long, G.G. Ultra-Small-Angle X-ray scattering instrument at the advanced photon source: History, recent development, and current status. Metall. Mater. Trans. A 2013, 44, 68–76. [Google Scholar] [CrossRef]
  21. Nyam-Osor, M.; Soloviov, D.V.; Kovalev, Y.S.; Zhigunov, A.; Rogachev, A.V.; Ivankov, O.I.; Erhan, R.V.; Kuklin, A.I. Silver behenate and silver stearate powders for calibration of SAS instruments. J. Phys. Conf. Ser. 2012, 351, 012024. [Google Scholar] [CrossRef]
  22. Ilavsky, J.; Jemian, P.R. Irena: Tool suite for modeling and analysis of small-angle scattering. J. Appl. Crystallogr. 2009, 42, 347–353. [Google Scholar] [CrossRef]
  23. Ilavsky, J. Nika: Software for two-dimensional data reduction. J. Appl. Crystallogr. 2012, 45, 324–328. [Google Scholar] [CrossRef]
  24. Gadikota, G.; Zhang, F.; Allen, A. In situ angstrom-to-micrometer characterization of the structural and microstructural changes in kaolinite on heating using ultra small-angle, small-angle, and wide-angle x-ray scattering (USAXS/SAXS/WAXS). Ind. Eng. Chem. Res. 2017, 56, 11791–11801. [Google Scholar] [CrossRef] [PubMed]
  25. Gadikota, G.; Zhang, F.; Allen, A.J. Towards understanding the microstructural and structural changes in natural hierarchical materials for energy recovery: In-operando multi-scale X-ray scattering characterization of Na-and Ca-montmorillonite on heating to 1150 °C. Fuel 2017, 196, 195–209. [Google Scholar] [CrossRef] [PubMed] [Green Version]
  26. Gadikota, G.; Allen, A. Microstructural and structural characterization of materials for CO2 storage using multi-scale X-ray scattering methods. In Materials and Processes for CO2 Capture, Conversion, and Sequestration; Wiley Online: Hoboken, NJ, USA, 2018; pp. 296–318. [Google Scholar]
  27. Glatter, O.; Kratky, O.; Kratky, H.C. Small Angle X-ray Scattering; Academic Press: Cambridge, MA, USA, 1982. [Google Scholar]
  28. Beaucage, G. Approximations leading to a unified exponential/power-law approach to small-angle scattering. J. Appl. Crystallogr. 1995, 28, 717–728. [Google Scholar] [CrossRef]
  29. Beaucage, G. Small-angle scattering from polymeric mass fractals of arbitrary mass-fractal dimension. J. Appl. Crystallogr. 1996, 29, 134–146. [Google Scholar] [CrossRef] [Green Version]
  30. Asgar, H.; Jin, J.; Miller, J.; Kuzmenko, I.; Gadikota, G. Contrasting thermally-induced structural and microstructural evolution of alumino-silicates with tubular and planar arrangements: Case study of halloysite and kaolinite. Colloid Surf. A Physicochem. Eng. Asp. 2021, 613, 126106. [Google Scholar] [CrossRef]
  31. García, F.J.; Sergio, G.R.; Andreas, K.; Armin, R. Study of natural halloysite from the Dragon Mine, Utah (USA). Z. Für Anorg. Und Allg. Chem. 2009, 635, 790–795. [Google Scholar] [CrossRef]
  32. Pasbakhsh, P.; Churchman, G.J.; Keeling, J.L. Characterisation of properties of various halloysites relevant to their use as nanotubes and microfibre fillers. Appl. Clay Sci. 2013, 74, 47–57. [Google Scholar] [CrossRef]
  33. Samsonov, G.V. Mechanical properties of the elements. In Handbook of the Physicochemical Properties of the Elements; IFI_Plenum: New York, NY, USA, 1968; p. 432. [Google Scholar]
  34. Lin, C.L.; Miller, J.D. Spatial characterization of heterogeneous nanopore surfaces from XCT scans of Niobrara shale. Colloid Surf. A 2019, 572, 120–137. [Google Scholar] [CrossRef] [Green Version]
  35. Maheshwari, H.; Roehling, J.D.; Turner, B.A.; Abdinor, J.; Tran-Roehling, T.B.; Deo, M.D.; Bartl, M.H.; Risbud, S.H.; Van Benthem, K. Robust mesoporous silica compacts: Multi-scale characterization of microstructural changes related to physical–mechanical properties. J. Mater. Sci. 2016, 51, 4470–4480. [Google Scholar] [CrossRef]
  36. Hillier, S.; Brydson, R.; Delbos, E.; Fraser, T.; Gray, N.; Pendlowski, H.; Phillips, I.; Robertson, J.; Wilson, I. Correlations among the mineralogical and physical properties of halloysite nanotubes (HNTs). Clay Miner. 2016, 51, 325–350. [Google Scholar] [CrossRef]
  37. Bish, D.L.; Von Dreele, R.B. Rietveld refinement of non-hydrogen atomic positions in kaolinite. Clays Clay Miner. 1989, 37, 289–296. [Google Scholar] [CrossRef]
  38. Wada, N.; Raythatha, R.; Minomura, S. Pressure effects on water-intercalated kaolinite. Solid State Commun. 1987, 63, 783–786. [Google Scholar] [CrossRef]
  39. Frost, R.L.; Kristof, J.; Paroz, G.N.; Kloprogge, J.T. Role of water in the intercalation of kaolinite with hydrazine. J. Colloid Interface Sci. 1998, 208, 216–225. [Google Scholar] [CrossRef] [PubMed]
Figure 1. Photograph of natural consolidated halloysite nanotube (HNT) sample from underground (left) and SEM image of the fractured surface of natural consolidated HNT (right), from the Dragon Mine, Eureka, UT, USA.
Minerals 11 01308 g001
Figure 2. Interaction forces measured between a hydrophobic diamond-like carbon (DLC) tip and a kaolinite–silica face (left) and a kaolinite–alumina face (right) in 1 mM KCl at pH 4. Reprinted with permission from the Society for Mining, Metallurgy & Exploration (SME) [11].
Minerals 11 01308 g002
Figure 3. Snapshots of molecular dynamics (MD) simulations of kaolinite siloxane–water (left) and gibbsite–water (right) interfaces. Atom color code: red, O; white, H; yellow, Si; green, Al. [12].
Minerals 11 01308 g003
Figure 4. Typical load–displacement curve with the relevant parameters labeled. Contact stiffness, S, is central for calculating moduli [14]. The contact stiffness is the instantaneous slope of the load-displacement unloading curve.
Minerals 11 01308 g004
Figure 5. Combined ultrasmall- and small-angle X-ray scattering (USAXS/SAXS) curves and modeled curves for consolidated HNT: (a) full range; (b) the zoomed-in SAXS region.
Minerals 11 01308 g005
Figure 6. XCT cross-sectional views of the consolidated HNT (HNT 03) structure at voxel resolutions of (a) 19.32 μm, (b) 1.85 μm, and (c) 32 nm.
Minerals 11 01308 g006
Figure 7. Nano-X-ray computed tomography (Nano-XCT) (voxel resolution 32 nm) determined (a) consolidated HNT structure (HNT 03) and (b) 3D pore network. Volume of this consolidated HNT structure is 12 μm × 6 μm × 6 μm.
Minerals 11 01308 g007
Figure 8. The 3D pore network of the consolidated HNT structure (HNT 03) color-coded for the pore size/diameter determined by the computed local thickness of the pore channel.
Minerals 11 01308 g008
Figure 9. Nano-XCT pore size/diameter distribution of the consolidated HNT structure (HNT 03) (top, blue) compared with previous nano-XCT studies of sintered SBA15 (bottom, black) and Niobrara oil shale (bottom, red). Pore size for the shale was analyzed by the medial axial method [34,35].
Minerals 11 01308 g009
Figure 10. TEM image of individual HNT elements for sample Dragon C (left) and their corresponding equivalent spherical diameter (ESD) distributions determined from sedimentation field-flow fractionation (SdFFF) (right).
Minerals 11 01308 g010
Table 1. Elastic modulus (Ea) and hardness (H) values for selected consolidated halloysite nanotubes (HNTs), kaolinite, calcite, and quartz from nanoindentation tests performed at a peak force of 1 mN using a Berkovich probe, compared to literature values of the Mohs scale [33]. Alunite composition in consolidated HNT samples determined from sulfur assay.
Nanoindentation Results Alunite
Content (ppm)
Mohs Scale
Mineral SampleAverage Ea (GPa)SD Ea (GPa)Average H (GPa)SD. H (GPa)
Consolidated
HNT 01
1.530.500.030.01<0.06
Consolidated
HNT 02
4.601.130.280.140.332–2.5
Consolidated
HNT 03
14.283.270.410.230.94
Kaolinite 010.030.030.000.002–2.5
Kaolinite 023.861.270.070.05
Calcite47.202.402.280.183
Quartz77.8210.87
Table 2. Total porosity estimated by X-ray attenuation and porosity of nano-X-ray computed tomography (nano-XCT) pore networks for natural consolidated HNT (HNT 03).
MethodX-ray Attenuation Micro-XCT (19.32 μm)He Porosimetry3D Pore Network
Nano-XCT (32 nm)
Total Porosity40.6%40.4%
Inter-HNT Porosity > 32 nm13.2%
Table 3. Intra-HNT pore size of the consolidated HNT measured by small-angle X-ray scattering (SAXS) and BET/BJH.
Method/SourceIntra-HNT Pore Size (nm)
SAXS Rg12.8
BET N2 Adsorption10.4
BET N2 Desorption10.7
BJH N2 Adsorption12.3
Literature [4,5]12~15
Table 4. Particle analysis for individual HNT elements from the Dragon Mine by sedimentation field-flow fractionation (SdFFF) for equivalent spherical diameter (ESD) range and peak, compared with the SAXS determined HNT outer diameter.
SampleESD Range (nm)Peak ESD (nm)Mean Diameter (nm)
Dragon A90~500246
Dragon B100~400211
Dragon C100~500262
SAXS70
Publisher’s Note: MDPI stays neutral with regard to jurisdictional claims in published maps and institutional affiliations.

