Abstract
This study focuses on a comparison of alkali-activated materials based on natural zeolites without and with the addition of blast furnace slag and their subsequent modification by acid leaching. The addition of slag to alkali-activated mixtures is generally used to increase the strength. The subsequent modification of its chemical, textural and mechanical properties by acid leaching makes this material usable in other industries, especially in the chemical industry. This study aimed to examine the influence of the addition of blast furnace slag to alkali-activated mixtures based on natural zeolites and observe the effect of subsequent acid leaching on the chemical, textural and mechanical properties and CO2 adsorption capacity of these materials. The modification of alkali-activated materials was carried out by acid leaching using 0.1 M HCl and then using 3 M HCl. The properties of these materials were determined using N2 physisorption, Hg porosimetry, XRF, XRD, DRIFT, TGA and strength measurements. The results showed that the addition of blast furnace slag significantly increased the cutting-edge strength of the obtained materials and affected the textural properties, especially in leached samples. The presence of blast furnace slag generated a higher proportion of mesopores, which are attributed to the presence of the calcium silicate hydrate (C–S–H) phase and are easily removed by leaching, as shown by the XRF results. The obtained data showed an improvement in properties and extension of the potential applicability of these materials in the chemical industry, especially for catalytic and adsorption applications.
1. Introduction
For inorganic materials, which are widely used in industry as catalysts, supports and adsorbents, their textural (surface, porosity), chemical, mechanical and sorption properties are important [1]. Among these inorganic materials, synthetic zeolites are used, which are of high purity, possess high surface area and have a well-ordered porous structure. However, these synthetic zeolites still have high prices and require complex synthesis steps. Therefore, in terms of low cost, easier availability and eco-friendly properties in addition to textural characterization, chemical stability and exceptional physicochemical properties, there is an effort to use natural zeolites instead of synthetic ones [2].
Zeolites are hydrated crystalline aluminosilicates of alkali and alkaline earth metals, having unique 3D porous structures containing channels and cavities that are negatively charged and contain positively charged ions (e.g., Na+, K+ and Ca2+), water molecules and OH− groups [3,4,5]. The primary building units of zeolites are SiO₄ and AlO₄ tetrahedra linked with other tetrahedrons (secondary building units) by sharing of the 1, 2 or 3 oxygen atoms [4,6]. These unique structural properties are the basis for their microporous structure and exceptional ion exchange and sorption properties [3,5]. The most known and most widely used naturally occurring zeolite is clinoptilolite [6,7] with general formula (Na, K, Ca1/2)6[Al6Si30O72] × 24H2O [8]. In addition to cation exchange application [9] (as sorbents for heavy metals and ammonia from waste and wastewater) [10], clinoptilolite has been used for various purposes in diverse fields [4], including wastewater treatment [11,12], the building industry (as supplementary cementitious material) [13,14,15] and gas purification [16,17]. Clinoptilolite is also a promising material in catalytic applications, especially after its activation and modification.
The activation and subsequent modification of clinoptilolite lead to a transformation of the material properties and an improvement of Si/Al ratio, porosity, crystal structure, and surface area [18]. Alkaline activation refers to the reaction of aluminosilicate precursor in an alkaline environment (the presence of alkaline activator NaOH/KOH and water glass) to form a hardener binder [19]. Precursors can be of natural origin (kaolin, zeolite, volcanic ash, or natural pozzolans), or they can be thermally treated (metakaolin, fly ash, or granulated blast furnace slag) [20]. The alkaline activation of natural zeolite and foaming of the mixture produces a foam material, which consists of the original structure and an amorphous N/K–A–S–H (Na2O/K2O–Al2O3–SiO2–H2O) gel [21]. The subsequent reaction of the alkali-activated mixture with the foaming agent (H2O2) leads to the formation of a gas that foams the mixture, leading to the formation of macropores [21]. The resulting alkali-activated materials have properties such as mechanical strength, long-term durability, low shrinkage, fast setting, acid resistance, fire resistance, and low thermal conductivity [22].
In addition to natural zeolites, the use of the alkali-activated blast furnace slag, which is eco-friendly and replaces Portland cement-based concrete, is also becoming more common, thereby reducing CO2 emissions [23]. Slag is also proving to be a good adsorbent for the removal of heavy metals from wastewaters [24]. Blast furnace slag is a by-product obtained in the manufacture of pig iron in the blast furnace from iron ore, combustion residue of coke and fluxes such as limestone, serpentine and other materials [25,26]. Natural zeolite contains mainly SiO2 and Al2O3, in contrast to blast furnace slag, which contains mainly CaO, and in addition to SiO2 and Al2O3, a significant amount of MgO [27,28]. In a study by Hrachovcová et al. (2020) [29], natural zeolite was mixed with CaO and MgO before alkali activation and the results showed an increase in cutting-edge strength and a significant effect on textural properties. Due to its composition, blast furnace slag becomes a suitable ingredient to blend with natural zeolite for the potential improvement of the properties of alkali-activated materials. Among others, blast furnace slag is readily available, non-toxic and can be a good raw material for making high-value materials similar to geopolymers [26], where the alkaline activation of blast furnace slag results in the formation of calcium silicate hydrate (C–S–H) phase as the main product [22].
These materials can be further modified by leaching (dealumination) using mineral or organic acid. Leaching results in the removal of Al atoms from the framework [30] and the formation of extra-framework aluminum species (EFALs), leading to the formation of mesopores and the loss of Brønsted acid sites [31]. The dealumination of alkali-activated material also leads to the removal of other cations such as Ca2+, Na+, K+ and Mg2+ and an increase in the Si/Al ratio [30].
This work aimed to evaluate the effect of the addition of slag to natural zeolite (clinoptilolite) and the subsequent effect of reducing the water coefficient w on the chemical, adsorption and textural properties of alkali-activated materials. The effect of leaching with 0.1 M and 3 M HCl on this alkali-activated material was also investigated. Characterization of the materials was carried out using N2 physisorption, Hg porosimetry, XRF, XRD, DRIFT, strength measurements and CO2 adsorption.
2. Materials and Methods
2.1. Materials
Powdered natural zeolite ECO 50 (CLI) containing at least 85% clinoptilolite purchased from Zeocem a.s., Bystré, Slovakia and blast furnace slag Zeoslag 20 (Zeocem a.s., Bystré, Slovakia), which is a mixture of slag and natural zeolite, were used for sample preparation. Potassium hydroxide (KOH) provided by Lach-Ner s.r.o. in a pro analysis (p.a.) purity and sodium silicate solution (Na2SiO3) with silicate modulus 3.22 obtained from Labar s.r.o. in a technical grade purity were used for the preparation of the alkaline activator. Hydrogen peroxide (H2O2—30 wt%) provided by Lach-Ner s.r.o. in a pro analysis (p.a.) purity was used as a foaming agent. The acid leaching of the zeolite pellets was performed using hydrochloric acid (HCl—35 wt%; p.a. purity), which was purchased from Lach-Ner s.r.o. The chemical composition of the starting materials is given in Table 1.

Table 1.
Chemical composition of the starting materials. The results were obtained by XRF analysis.
2.2. Synthesis of Alkali-Activated Zeolite Foams
For the preparation of alkali-activated zeolite foams, an alkaline activator was first prepared, consisting of 29.1 g of Na2SiO3 solution, 12.5 g of 40% KOH solution and 13.7 mL of distilled water. The resulting silicate modulus (MSi = (SiO2)/(Me2O); Me = K + Na) of the alkaline activator was 1.51.
The first sample was prepared by mixing the alkaline activator with 60 g of powdered natural zeolite (CLI), which was dried at 120 °C overnight. The resulting water coefficient w (the weight of water in the mixture to the weight of natural zeolite) of this mixture was 0.7. The second sample was prepared by mixing CLI and Zeoslag (1:1 ratio) with the alkaline activator. The water coefficient of the resulting mixture was 0.7. The addition of slag significantly changes the rheological properties of the mixture (increases its fluidity/reduces its viscosity), and therefore, the water coefficient of the mixture was reduced to 0.57 for the third sample. The last sample was prepared by mixing Zeoslag with the alkaline activator. There, the water coefficient was reduced to a value of 0.47.
Then, H2O2 (30 wt%) was added as a foaming agent to the prepared homogenized mixtures (powder + alkaline activator) at 0.25% relative to the powder component. The foamed alkali-activated mixtures were then shaped into pellets with a diameter of 5 mm. Activation of the pellets was carried out for 48 h at 50 °C. The resulting pellets were removed from the molds and allowed to age for 1 month at ambient conditions in platen closure bags.
All samples synthesized in this way were designated as S samples. Sample prepared by alkaline activation (AA) of CLI, followed by foaming and with a resulting water coefficient of 0.7 was designated as AAC (0.7)/S. Sample in which CLI and Zeoslag were mixed with alkaline activator and foaming agent with a resulting water coefficient of 0.7 was designated as AACZ (0.7)/S. Sample with the CLI and Zeoslag mixed with alkaline activator and foaming agent and the reduced water coefficient of 0.57 was designated as AACZ (0.57)/S. Sample prepared by alkaline activation and foaming of Zeoslag with the resulting water coefficient of 0.47 was designated as AAZ (0.47)/S.
A graphical scheme of the synthesis and post-synthetic modification is shown in Figure 1.
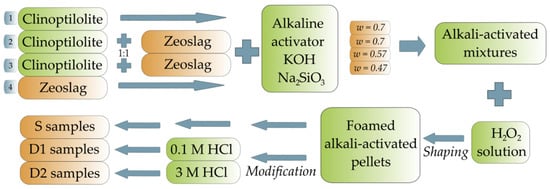
Figure 1.
Graphical scheme of synthesis of alkali-activated zeolite foams and subsequent post-synthetic modification.
2.3. Post-Synthesis Modifications of Alkali-Activated Zeolite Foams
A portion of each prepared S sample (AAC (0.7), AACZ (0.7), AACZ (0.57) and AAZ (0.47)) was then post-synthetically modified with 0.1 M and 3 M HCl. First, a portion of each prepared S sample was modified by acid leaching using 0.1 M HCl at 80 °C for 5 h. The modified samples were designated as D1 samples (AAC (0.7)/D1, AACZ (0.7)/D1, AACZ (0.57)/D1 and AAZ (0.47)/D1). Another part of each prepared S sample was modified by acid leaching using 3 M HCl at 80 °C for 5 h. Samples modified using 3 M HCl were designated as D2 samples (AAC (0.7)/D2, AACZ (0.7)/D2, AACZ (0.57)/D2 and AAZ (0.47)/D2). The resulting foam/solution ratio (g/mL) was 1:20 for all samples. After acid leaching, the samples were washed with distilled water until neutral pH was reached. After washing, the modified samples were dried in an oven at 120 °C overnight.
2.4. Characterization Techniques
X-ray fluorescence analysis (XRF) was used to determine the elemental composition of alkali-activated zeolite foams. The samples were measured on an S8 Tiger (Bruker AXS GmbH, Karlsruhe, Germany) with Rh cathode. The quant-express method (without a standard) was used for measurement. The results were evaluated using Spectra plus software (Version 3).
X-ray diffraction (XRD) analysis was used to obtain XRD patterns. A D8 Advance ECO powder diffractometer (Bruker AXS GmbH, Karlsruhe, Germany) with CuKα radiation (λ = 1.5406 Å) was used for the analysis. The resolution was set to 0.04° and the integration time to 1 s. Measurements were performed over a range of 2θ angles from 5° to 70°. The obtained diffractogram was evaluated using the Diffrac.Eva software (Bruker AXS GmbH, Karlsruhe, Germany) using the Powder Diffraction File Database (PDF 4+ 2018, International Centre for Diffraction Data, Newtown Square, PA, USA).
Textural properties, such as specific surface area and pore volume, were determined by N2 physisorption using Autosorb iQ (Quantachrome Instruments, Boynton Beach, FL, USA). Before analysis, the samples were degassed under vacuum at 110 °C for 16 h. After degassing, during which unwanted vapors and gases adsorbed on the sample surface were removed, 69-point adsorption/desorption isotherms were measured at liquid nitrogen temperature (−195.8 °C) using nitrogen as adsorbate. The value of total pore volume was read from the isotherm at 0.995 P/P₀. The volume and distribution of micropores and mesopores were evaluated by Non-Local Density Functional Theory (NLDFT) using adsorption branch kernel (N2 at 77 K) on silica-based on a cylindrical pore model. The Brunauer-Emmett-Teller (BET) method was used for the determination of the surface area of the samples. The surface area was calculated using the BET equation in the linear range of 0.05–0.30 P/P₀ and in the range of 0.009–0.15 P/P₀ for samples that contained micropores.
The distribution of macropores, mesopores and total intrusion volume were obtained by measurement on an AutoPore IV 9510 mercury porosimeter (Micromeritics Instrument Corporation, Norcross, GA, USA). Before measuring the intrusion curve, the prepared samples were degassed at 110 °C for 16 h under vacuum. After drying, each prepared sample was loaded into a 3 milliliter-solid penetrometer with a total stem volume of 0.412 mL. First, the penetrometer was inserted into the low-pressure port, where analysis was performed in the range of 0–345 kPa. Then, the penetrometer was inserted into the high-pressure port and analysis was performed up to 413 MPa. The result of the measurement was the intrusion curve (dependence of intrusion volume (mL) on pressure (MPa)/pore diameter (nm)).
The strength in the cutting edge was defined using UMZ-3k (Micro-Epsilon, Bechyně, Czech Republic) with a corresponding trapezoidal flat blade attachment (area size of 1 mm2). The loading speed was 10 mm/min, and the maximum strength parameter was 375 N.
Diffuse reflectance infrared spectra were obtained using Diffuse Reflectance Infrared Fourier Transform Spectroscopy (DRIFT). 15 mg of each prepared powdered sample was weighed and mixed with 300 mg of KBr. The mixture thus prepared was analyzed using a Nicolet iS 10 instrument (Thermo Scientific, Waltham, MA, USA). The instrument setting was set to 2 cm−1, and the number of scans was set to 128.
The adsorption properties of alkali-activated zeolite foams were measured on a TGA Discovery series thermogravimetric analysis instrument (TA Instruments, New Castle, DE, USA). The samples were first dried at 120 °C in a stream of N2 (20 mL min−1), and after cooling to 50 °C, CO2 adsorption was performed (gas flow rate 20 mL min−1) for 90 min. Desorption was carried out by reheating the sample to 120 °C in a flow of N2 (20 mL min−1). For comparison, an identical test was always performed in the nitrogen stream only (without CO2 adsorption).
3. Results and Discussion
Finely ground natural zeolite was used for the preparation of the samples, and Zeoslag 20, which is supplied as a concrete additive and is a mixture of slag and natural zeolite, was chosen as the slag source. The blast furnace slag contains a high proportion of Ca and Mg in addition to Si and Al. As shown in our previous research [29], their addition to alkali-activated mixtures significantly increases the strength of the materials and also greatly affects their textural and rheological properties. Among other things, commercial availability is crucial for further possible commercial use; therefore, blast furnace slag, which is part of the Zeoslag 20 material, was chosen as the source of Ca and Mg.
3.1. Elemental Composition
X-ray Fluorescence Analysis (XRF)
The chemical composition of the alkali-activated zeolite foams was determined by XRF analysis. The measurements showed differences in composition between the differently prepared alkali-activated foams (Figure 2a). The foams prepared by alkaline activation of Zeoslag had the highest Ca and Mg content compared to the other AA foams. On the other hand, the AAZ (0.47)/S sample contained less Al and Fe than the other S samples. Acid leaching using HCl extracted the elements from the activated foams. For the samples that were post-synthetically modified by acid leaching using 0.1 M HCl, there was only a slight change in elemental composition compared to the unmodified samples. The leaching with this weak acid mainly removed the extra framework elements that were introduced into the sample by the alkaline activator, i.e., K and Na, where K was partially removed while Na was mostly removed. During D1 leaching, a decrease in the amount of Na removed was observed with increasing slag content, which may be related to the presence of a higher content of C–S–H phase that inhibits acid leaching. Acid leaching using 3 M HCl resulted in the significant removal of K and Na. The strong acid was able to remove not only the Na and K, introduced into the mixture by the alkaline activator, but also the Na and K contained in the original natural zeolite. Furthermore, other elements such as Fe, Ca and Mg were leached and at the same time, Al was removed from the framework. The same changes in elemental composition were observed in the study of Tišler et al. (2019) [1]. The degree of element removal from the samples was expressed using the Si/Al molar ratio and the silicate modulus MSi (Equation (1)).
where MSi is a silicate modulus (mol/mol), and Me is Na, K, Fe, Ca and Mg.
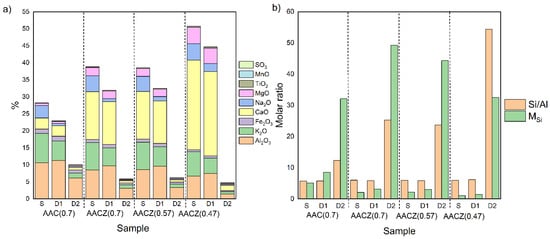
Figure 2.
Chemical composition of samples (Si is up to 100%) (a) and Si/Al molar ratio and MSi parameter (b) of variously prepared unmodified S samples, modified D1 and D2 samples leached 0.1 M HCl and 3 M HCl, respectively. Determination by XRF.
Leaching with 0.1 M HCl (D1 samples) resulted in almost no change in the Si/Al ratio (Figure 2b). Leaching with 3 M HCl (D2 samples) resulted in a significant increase in the Si/Al ratio, as in the study by van Donk et al. (2003) [32]. Among the D2 modified samples, the sample AAZ (0.47)/D2 had the highest Si/Al ratio. In this sample containing slag, there was almost complete removal of Al, which does not come from the zeolite framework but mainly from the slag and can be extracted more easily (Table A1). As also evidenced by the sample AAC (0.7)/D2 (sample without slag), after D2 leaching, there was still 6.17% of Al, and therefore the Si/Al ratio was the lowest. Furthermore, the step increase in the MSi parameter for all D2 samples was due to the significant loss of Ca, K, Na, Mg and Fe. The AACZ (0.7)/D2 and AACZ (0.57)/D2 samples that differed in a water coefficient had a comparable Si/Al ratio, but the AACZ (0.7)/D2 sample had the most significant loss of Ca, Na and K with Mg and thus had the highest MSi parameter of all the samples. This suggests that higher water coefficients produce more porous (hydrated) structures, which are more accessible to the leaching solution, as evidenced by Hg porosimetry and N2 physisorption measurements (see Section 3.3.).
3.2. Crystalline Structure
3.2.1. X-ray Powder Diffraction (XRD)
The presence of crystalline phases of the alkali-activated zeolite foams was determined by XRD. The obtained XRD pattern (Figure 3a) of sample AAC (0.7), which contained only alkali-activated natural zeolite, showed typical sharp diffractions that can be attributed to clinoptilolite [33] (PDF 83-1261). The AACZ (0.7)/S and AACZ (0.57)/S samples prepared by alkaline activation of slag and natural zeolite showed a visible change in crystal structure and a decrease in crystallinity. The XRD pattern of AACZ (0.7)/S showed a significant decrease in peak intensities typical of clinoptilolite. Compared to the AAC (0.7)/S sample, there was a reduction of about 60% of reflections (Table 2) at 2θ of 9.9° (plane [020]) and 11.2° (plane [200]). The sample prepared from natural zeolite and Zeoslag with a reduced water coefficient (AACZ (0.57/S)) had an even 4% lower peak intensity at 2θ of 9.9° and 11.2° than the AACZ (0.7)/S sample. These samples also showed a significant reduction in other clinoptilolite reflections (e.g., 22.4°, 26.1°, 26.7°, 30.0° and 32.0°). The decrease in crystallinity for the samples containing the addition of slag was probably due to amorphization, i.e., a better dissolution of the particles into the binder matrix, which is largely composed of the C–S–H phase, apart from the N(K)–A–S–H phase. The pattern of the AAZ (0.47)/S sample was almost flat, without any significant reflections; thus, it is largely an amorphous material.
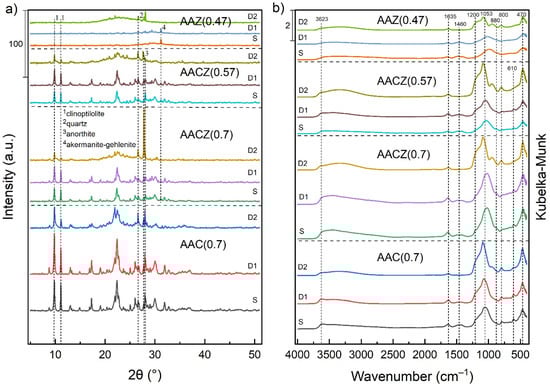
Figure 3.
XRD pattern (a) and DRIFT spectra (b) of AAC (0.7), AACZ (0.7), AACZ (0.57) and AAZ (0.47) samples. 1 Clinoptilolite (PDF 83-1261); 2 quartz (PDF 65-0466); 3 anorthite (PDF 71-0748); 4 akermanite-gehlenite (PDF 79-2423).
Table 2.
Intensities at 2θ of 9.9°and 11.2° and the intensity ratio of all samples.
Acid leaching with 0.1 M HCl did not significantly affect the crystal structure, but there was a slight increase in the intensities at 2θ of 9.9°and 11.2°. This slight increase in intensities was due to the partial removal of the amorphous phase that was formed from the excess alkaline activator [34]. Upon leaching with 3 M HCl, there was a significant reduction to the complete disappearance of the reflections typical of clinoptilolite. In D2 samples, a slight degradation of the crystal framework occurred, which is related to the step increase in the Si/Al ratio. If there is a high amount of Al3+ atoms in the original lattice, the subsequent dealumination may lead to a loss of crystallinity [35].
The intensity ratio of the most significant clinoptilolite reflections at 2θ of 9.9° and 11.2° for the AAC (0.7)/S and AACZ (0.7)/S samples was 0.91 and for the AACZ (0.57)/S sample was 0.92. There was a slight decrease in the intensity ratio for the D1 samples. This decrease was related to the removal of Na and K from the structure during leaching. For the D2 samples, there was a significant decrease in the intensity ratio. This significant decrease is related to the replacement of almost all Na and K in the structure by HCl protons [1]. The largest decrease was observed for the sample AACZ (0.7)/D2, down to 0.34. This sample showed the most significant removal of Na and K from the material structure. The sample AAZ (0.47)/S had the lowest intensity ratio (0.69) of the S samples, and after D1 and D2 leaching, this ratio increased. The intensity of 31.1 at 2θ belonged to the akermanite-gehlenite phase (PDF 79-2423) and came from the blast furnace slag. In the AACZ samples, this phase was less pronounced as it was overlain by other crystalline phases of the natural zeolite components. During D2 leaching, this band was completely removed from the spectrum.
3.2.2. Diffuse Reflectance Infrared Fourier Transform Spectroscopy (DRIFT)
The DRIFT spectra (at the 400–4000 cm−1 region) determining the structure of the alkali-activated zeolite foams are shown in Figure 3b. There were only slight differences in the DRIFT spectra between the differently prepared alkali-activated zeolite foams. The vibrations located in the 1600–3700 cm−1 region are attributed to the presence of zeolitic water [35]. A band which is located at 1635 cm−1 corresponds to the bending vibrations of the -OH groups of residual water [36]. This band is closely related to the band located at 3623 cm−1, which is attributed to the stretching vibrations of hydroxyl. In the dealuminated samples (leaching with 3 M HCl), there was a slight decrease in the intensity of this band because the free linkages on the surface were reduced [35]. For the unmodified S samples and D1 samples, there was a fine band at 1460 cm−1. This band is related to the formation of Na2CO3, which is formed by the reaction between NaOH with the atmospheric CO2 [37]. In D2 samples, this band disappeared from the spectra. The strongest vibrations in the spectra, which are typical for aluminosilicates, are assigned to asymmetrical stretching vibrations of Si–O–T (T = Si or Al) at about 1053 cm−1, a weaker one at about 1200 cm−1 [38], and bending vibrations of the SiO groups at 470 cm−1 [39]. The position of the prominent band at 1053 cm−1 depends on the Si/Al ratio, and using this band, it is possible to determine the aluminum content in the crystalline framework [35].
Acid leaching (D2 samples) and the decrease of Al atoms in the framework tetrahedral sites resulted in a slight shift to a higher wavelength. This shift is because the substitution of Al3+ for Si4+ decreases the T–O–T angle and changes [35] the bond strength [40]. It is assumed that the more Al3+ atoms are excluded from the sample, the more the band is shifted to the left. Furthermore, it is noticeable in Figure 3b that the position of the principal Si–O–T asymmetric stretching band located originally at 1053 cm−1 in the AAC (0.7)/S sample has shifted to lower wavenumbers in the AACZ (0.7)/S, AACZ (0.57) and AAZ (0.47) sample. This shift was through a reaction with blast furnace slag, as in the study by Perná et al. (2017) [39]. On the other hand, the band at 470 cm−1 showed an increase in its intensity instead of a shift in the spectrum. The bands at approximately 610 cm−1 were in the spectra due to Al–O–Si stretching vibrations [41]. By leaching with 3 M HCl, the intensity of this band decreased, and for the AAZ (0.47) samples, this band was not noticeable in the spectra. A weak band at 800 cm−1, which was present in all spectra, is attributed to quartz or amorphous SiO2 stretching bond vibrations [35,42]. In the D2 samples, there was an increase in the intensity of this band. Another weak band in the DRIFT spectra at about 880 cm−1 is associated with Si–OH bending vibrations [43].
3.3. Porosity and Strength
3.3.1. Mercury Porosimetry (Hg Porosimetry)
Total intrusion pore volume and pore size distribution in the macropore and mesopore ranges were determined by Hg porosimetry. As shown in Table 3, AAC (0.7) samples containing only clinoptilolite had the highest total intrusive pore volume. Mixing CLI and slag (AACZ (0.7)) resulted in a slight decrease in total intrusion volume. Reducing the water coefficient w for the samples containing slag (AACZ (0.57)) further reduced the intrusion volume. AAZ (0.47) samples containing only slag had the lowest intrusion volume. These samples also had the lowest mesopore volume in the 3–50 nm region. On the other hand, the samples containing slag (AACZ) showed an increase in mesopore volume in the 3–50 nm region compared to the AAC (0.7) samples. The most pronounced, almost threefold increase in mesopore volume was in the samples with a higher water coefficient (AACZ (0.7)).
Table 3.
Mesopore volume in the range of 3–50 nm (mL/g) and total intrusion volume (mL/g) determined by Hg porosimetry.
The pore size distribution (Figure 4a) showed that the AAC (0.7)/S sample had a wide pore size distribution, while the sample AAZ (0.47)/S contained mainly macropores with a diameter of 1800 nm. The same results can be seen from the intrusion curve in Figure 4b, where the intrusion curve of the AAC (0.7)/S sample increased almost linearly throughout its range (pore filling occurred), while a slight increase was seen just around 1800 nm for the AAZ (0.47) sample. For samples containing a mixture of natural zeolite and slag, AACZ (0.7)/S and AACZ (0.47)/S, a slight increase was seen in two parts of the intrusion curves. Thus, it is clear from Figure 4 that these samples mainly contained mesopores with a diameter of 23 nm and macropores with a diameter of 4000–8000 nm. The higher mesopore content (mainly in the region of 20–30 mm) in the AACZ (0.7)/S sample compared to AACZ (0.57)/S was due to the higher water coefficient. The AACZ (0.7)/S sample contained more hydrated structures (C–S–H phase) and thus more pores from which water could escape.
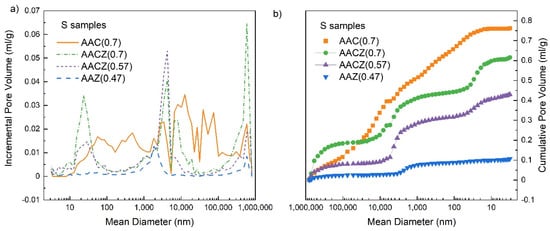
Figure 4.
Pore size distribution (a) and intrusion curves (b) of S samples, determined using Hg porosimetry.
Acid leaching with 0.1 M HCl had little effect on the pore size distribution of the D1 samples, whereas leaching with 3 M HCl resulted in more significant changes in the pore size distribution (Figure 5). For the D1 samples, there was not much difference in the pore size distribution compared to the unmodified S samples, as leaching with 0.1 M HCl removed only alkali, mainly Na, K and some Ca + Mg. The more pronounced changes and increase in porosity in the D2 samples were because the 3 M HCl leaching, in addition to removing alkali, also removed Al (dealumination) and simultaneously cleaned the pores. The same increase in porosity of the samples leached with 3 M HCl occurs in the paper by Hrachovcová et al. [29]. The use of 3 M HCl resulted in only a slight increase in volume in the mesoporous region for the AAC (0.7)/D2 sample, while a slightly larger increase was observed for macropores of 3–13 μm in diameter (Figure 5a). The largest increase in macropore volume was then observed for the AACZ (0.7)/D2 and AACZ (0.57)/D2 samples with diameters of 8 μm and 6.6 μm, respectively (Figure 5b,c). These samples, as well as the AAC (0.7)/D2 sample (Figure 5d), showed an increase in mesopore volume with a diameter of 23 nm.
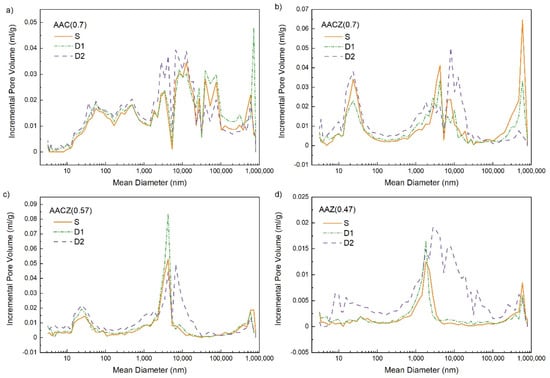
Figure 5.
Pore size distribution of AAC (0.7) (a), AACZ (0.7) (b), AACZ (0.57) (c) and AAZ (0.47) (d) samples determined using Hg porosimetry.
3.3.2. N2 Physisorption
Adsorption of gaseous N2 at 77 K is a typical method for studying surface and pore size distribution. From the shape of the adsorption/desorption isotherm, information about the pore structure of porous materials can be obtained [44]. The International Union of Pure and Applied Chemistry (IUPAC) has divided isotherms into six types based on their nature [45]. Figure 6a shows the adsorption–desorption isotherms that express the amount of adsorption with equilibrium pressure at a constant temperature [45] of S samples. All S samples showed type IV isotherm characterized by a hysteresis loop, which is formed by the filling/vacating of mesopores by capillary condensation [45]. In type IV isotherms, we can distinguish four types of hysteresis. The measured isotherms of the S samples showed the H3 loop, which did not show any limiting adsorption (plateau) at a high P/P0, indicating larger mesopores and macropores [46]. According to IUPAC, this type of hysteresis is typical for aggregates of plate-like particles, giving rise to slit-shaped pores [47,48]. Furthermore, larger mesopores that are only accessible by smaller pores can theoretically take the shape of ink-bottle pores [46]. The isotherm shape and hysteresis loop size for the AAZ (0.47)/S sample indicated only a low total volume and low mesopore volume, respectively, compared to the other samples. The exact pore volumes are given in Table 4. Figure 6b shows the pore size distribution in the range of 0.7–80 nm of S samples evaluated using non-local density functional theory NLDFT. Evaluation using this theory showed that the S samples did not contain any micropores. Although zeolite-based materials are known for the presence of micropores, these micropore-specific crystal structures of zeolite are inaccessible to N2 molecules due to their blockage by large cations [35] or silicate structures of the alkali activator. Figure 6b further shows that the S samples contained a broad distribution of mesopores. The exception was again the sample AAZ (0.47)/S; its pore size distribution was almost flat, and the mesopore volume was 0.010 cm3/g.
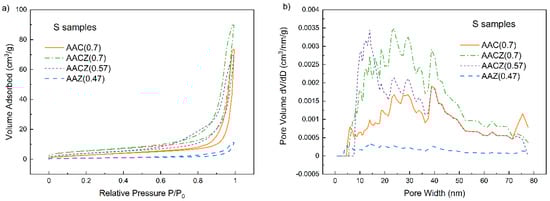
Figure 6.
Adsorption/desorption isotherms (a) and pore size distributions (b) of S samples determined by N2 physisorption.
Table 4.
Surface area SBET and pore volumes of samples.
The comparison of the specific surface area (SBET) and the pore volume of the samples are shown in Table 4. The AAC (0.7)/S sample had a surface area of 11 m2/g and a total pore volume of 0.114 cm3/g. Mixing natural zeolite and slag (AACZ (0.7)/S) slightly increased the specific surface area and total pore volume to 20 m2/g and 0.139 cm3/g, respectively. The reduction of the water coefficient (AACZ (0.57/S)) resulted in a slight decrease of these parameters. Among the unmodified S samples, the AAZ (0.47)/S sample had the smallest surface area and also total pore volume due to the lower content of hydrated structures and lower w in the mixture. D1 leaching then resulted in a slight increase in all the parameters listed in Table 4 for all the samples, including the formation of a small number of micropores.
Since the effect of D2 leaching on alkali-activated CLI has been the subject of our previous studies [29,34], in this study, the effect of D2 leaching was only investigated on the AACZ (0.7)/S sample, which had the largest SBET surface area as well as pore volume among all the S samples measured (Table 4). Figure 7a shows the isotherms and micropore size distributions of AACZ (0.7) samples before leaching, after D1 leaching and after D2 leaching. From the shape of the isotherm, it was clear that the AACZ (0.7)/S sample did not contain any micropores. A slight increase in the isotherm at low relative pressure was already visible in D1 leaching, indicating the microporous character of the sample [49]. For the D2 samples, this increase was already significant and indicated a larger micropore volume, which was 0.048 cm3/g for the AACZ (0.7)/D2 sample. According to the micropore size distribution, it was found that the D2 samples had the most micropores with a diameter of 0.8 nm and then slightly fewer micropores with diameters of 1.1 nm and 1.2 nm. Unlike the S samples, which were attributed to the type IV of isotherms, the AACZ (0.7) samples after acid D1 and D2 leaching exhibited a combination of type I and IV isotherms, typical for microporous and mesoporous materials, respectively [50]. The hysteresis loop of the AACZ (0.7)/S sample corresponded to the H3 type, as did the other measured S samples. The leached samples then exhibited a combination of H3 and H4 hysteresis types, which are typical of slit-shaped pores and narrow slit-like pores, respectively, according to IUPAC [48]. Figure 7b shows the mesopore size distribution of the AACZ (0.7) samples, and there was a visible increase in mesopores in the D1 leached sample, especially in the 3–10 nm region. The D2 sample then showed a twofold increase in mesopore volume compared to the D1 sample.
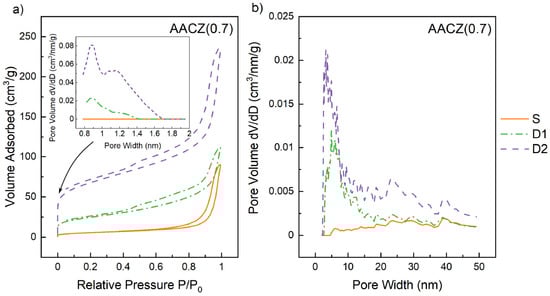
Figure 7.
Adsorption/desorption isotherms and micropore size distributions (0.7–2 nm) (a) and mesopore size distributions (2–50 nm) (b) of AACZ (0.7) samples determined by N2 physisorption.
3.3.3. Cutting Edge Strength
The AAZ (0.47)/S sample containing only Zeoslag had the highest cutting edge strength of 134.9 N (Figure 8a). Conversely, the lowest cutting edge strength was for sample AAC (0.7)/S, which did not contain the blast furnace slag.
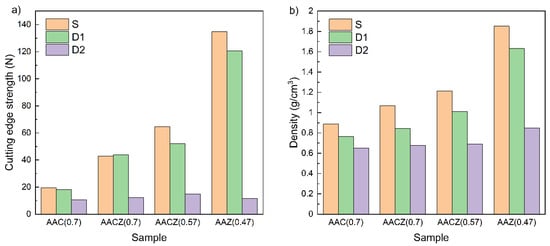
Figure 8.
Cutting edge strength (a) and density (b) of AAC (0.7), AACZ (0.7), AACZ (0.57) and AAZ (0.47) samples.
For the sample AACZ (0.7)/S containing natural zeolite and blast furnace slag, the cutting edge strength increased to 42.9 N compared to the sample without the addition of blast furnace slag (AAC (0.7)/S), which had 19.6 N. The reduction in water coefficient for the sample with blast furnace slag (AAC (0.57)/S) resulted in a 50% increase in strength. The reduction in strength in mixtures with higher water coefficients was attributed to the formation of more hydrated structures (C–S–H phase), i.e., the matrix contains more pores filled with water. The same trend was observed for density (Figure 8b), where a lower water coefficient led to more compact material, resulting in higher strength. Generally, density increases with higher slag content. This increase may be due to the presence of the C–S–H phase, which is denser (increase in density and decrease in the total intrusion volume of the samples) and complements the binder N(K)–A–S–H phase resulting from the alkaline activation of CLI. Furthermore, this increase may be due to the foaming process, where changes in the kinetics of H2O2 decomposition may occur due to different mixture compositions.
In D1 samples, there was only a slight decrease in the cutting edge strength and density, while in D2 samples, a significant decrease in the cutting edge strength was observed below 20 N. This significant decrease was related to the formation of additional pores formed by the removal of elements from the structure of the alkali-activated foams and thus to the weakening of the sample walls. Due to the stress of samples by leaching with 3 M HCl, microcracks may form, as reported in one of our previous articles [1]. The formation of additional pores was confirmed by N2 physisorption (the total pore volume was increased) and by Hg porosimetry (the total intrusion volume increased). Another reason for the significant decrease in strength was the removal of excess alkali activator, which strengthens the material in unmodified samples [29]. Similar to the strength case, the leached D2 samples showed a more pronounced decrease in density, with a 50% decrease in the AAZ (0.47)/D2 sample compared to the AAZ (0.47)/S sample (1.85 vs. 0.85 g/cm3) and was the most pronounced in the series studied. The change in density of the sample without slag (AAC (0.7)/S vs. AAC (0.7)/D2) is only 27%, again indicating easier leaching of slag-containing mixtures.
3.4. Adsorption Properties
Thermogravimetric Analysis (TGA) CO2 Adsorption
Since CO2 in the atmosphere contributes significantly to the greenhouse effect, there is now an effort to reduce anthropogenic CO2 emissions [51,52]. Therefore, the adsorption properties of differently prepared alkali-activated zeolite foams were investigated. Since the adsorption properties of alkali-activated clinoptilolite were studied in our previous work [50], a set of AACZ (0.7) samples was selected to observe the difference in CO2 adsorption between unmodified and modified samples. This set, prepared by mixing natural zeolite and slag, had the largest SBET and pore volume as measured by N2 physisorption. Figure 9a shows the adsorption curves of the AACZ (0.7) samples before modification and after D1 and D2 leaching. It can be seen from the adsorption curves that the AACZ (0.7)/S sample showed gradual adsorption of CO2 and a gradual increase in mass. On the other hand, for the leached AACZ (0.7)/D1 and AACZ (0.7)/D2 samples, as in the study by Tišler et al. [53], very rapid adsorption occurred and the maximum amount of CO2 was adsorbed in a short time. This rapid adsorption was because the leached samples had a larger specific surface area of SBET and a larger pore volume (Table 4). The pores were cleaned by acid leaching and became available for CO2 adsorption.
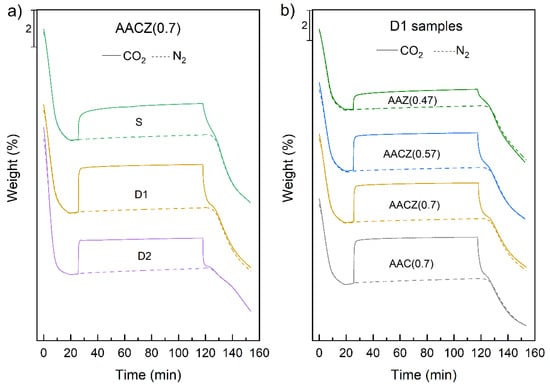
Figure 9.
Thermogravimetric records of CO2 and N2 sorption of AACZ (0.7) (a) and D1 samples (b).
Table 5 shows the adsorbed amounts of CO2, showing that the AACZ (0.7)/S sample adsorbed only 1.93 wt% CO2, while the AACZ (0.7)/D1 sample increased to 2.58 wt%. This increase was related to the increase in the SBET and larger pore volume. In contrast, the D2 leaching of the AACZ (0.7)/D2 sample resulted in a decrease in adsorbed CO2. At the same time, there was a large increase in the Si/Al ratio for the D2 leached samples, indicating that the CO2 adsorption capacity decreases with increasing Si/Al ratio and the presence of less Al3+ in the framework, due to the smaller number of exchangeable cations [54]. This decrease in CO2 sorption capacity may be related, among other things, to the leaching of alkalis from the sample, which are responsible for the formation of basic sites [53].
Table 5.
Adsorbed CO2 (wt%; mmol/g) of prepared samples determined by TGA and comparison with samples from other publications.
Since the AACZ (0.7)/D1 sample, which was modified by D1 leaching, showed the highest basicity, differently prepared alkali-activated zeolite foams were compared with each other only after D1 leaching (Figure 9b). Almost all samples showed rapid adsorption of CO2, unlike sample AZ (0.47)/D1, which was slower to adsorb CO2, and this sample absorbed only 1.36 wt% CO2 in total and thus had the lowest adsorption of all measured samples. The lower adsorbed amount of CO2 was due to the poorer availability of basic sites (low SBET) and lower Al3+ content in the framework (Table A1).
Our prepared D1 materials had CO2 adsorption capacities in the range of 0.3–0.7 mmol/g, whereas, for example, the Geopolymer-hydrotalcite composites that were investigated for CO2 capture had adsorption capacities in the range of 0.11–0.46 mmol/g [55]. Further comparisons with other published materials [50,55,56] are shown in Table 5. Comparison of adsorption capacity with other publications showed that alkali-activated zeolite foams had a higher adsorption capacity than natural zeolite (clinoptilolite) and geopolymers, but, on the other hand, a lower adsorption capacity than synthetic zeolites, which are more expensive to prepare. Adsorption material suitable for industrial applications should exhibit an adsorption capacity in the range of 3–4 mmol/g at a cost of less than $10/kg [57]. Although alkali-activated zeolite foams had a lower CO2 adsorption capacity than 3–4 mmol/g, their easy availability and low production cost (we estimate $4.5/kg) make them potential materials for CO2 capture.
Natural zeolite-based materials are mainly used in the construction industry, but due to their easy availability and low cost, there are efforts to use these materials in other sectors such as adsorption and catalytic applications. As our study showed, the alkaline activation and subsequent modification of natural zeolite (clinoptilolite) improved the properties of the materials used. In our study, blast-furnace slag, commonly added to fly ash and metakaolin-based materials to increase the strength of the material, was mixed with natural zeolite, followed by alkaline activation and then modified by acid leaching. The results showed that mixing CLI and slag improved the cutting edge strength, SBET and porosity. The sample with a higher water coefficient w had higher porosity and, on the contrary, lower strength due to the entrapment of water in the C–S–H and N(K)–A–S–H binding gel. Acid leaching further increased porosity and decreased strength in the cutting edge strength. D1 leaching further improved the CO2 sorption capacity of alkali-activated zeolite foams. The measured data suggest that the alkali-activated mixture of CLI and slag is a promising and inexpensive material for many applications. Further surface modification of these materials and thus a possible increase in CO2 sorption capacity is proposed in follow-up studies.
4. Conclusions
The alkaline activation of natural zeolites containing slag leads to significant changes in properties. The most noticeable change is the increase in strength and changes in texture. There was also an improvement in the excludability of the elements.
The elemental composition and Si/Al ratio, determined by XRF, showed that most elements were leached from the D2 samples. The D2 samples showed a decrease in the Al3+ content in the framework and a significant increase in the Si/Al ratio. The highest increase in the Si/Al ratio was in the samples containing slag. This increase was related to the presence of the C–S–H phase, which is easily excluded. Furthermore, the presence of the C–S–H phase caused a higher proportion of mesopores in leached samples containing slag, as shown by N2 physisorption and Hg porosimetry. Of all the S samples, the sample AACZ (0.7)/S containing slag had the highest surface area and pore volume, and D2 leaching increased the surface area up to 240 m2/g from the original 20 m2/g. XRD analysis showed that the AACZ samples containing CLI and slag had lower crystallinity than the samples prepared by alkaline activation of CLI (AAC). The decrease in crystallinity in samples containing slag was probably due to the better dissolution of the particles into the binder matrix, which is largely composed of the C–S–H phase, apart from the N(K)–A–S–H phase. Furthermore, the D1 samples showed a slight increase in crystallinity, probably due to the “purification” of the samples. However, leaching using 3 M HCl led to a significant decrease due to the attack on zeolite structures. On the other hand, samples containing slag had much better cutting edge strength and higher density. The strength increased twice, and when using a lower water coefficient w, up to three times. D1 samples had the best CO2 adsorption properties due to the larger SBET and pore volume. The sample AAC (0.7)/D1 had the highest basicity, hence the adsorption of CO2. However, the D2 samples showed a decrease in CO2 adsorption capacity, which was related to the increase in Si/Al ratio and the presence of less Al3+ in the framework.
The properties of the materials were affected by the addition of slag, reduction of the water coefficient w and acid leaching. The sample with the higher water coefficient w had the highest mesopore content due to the entrapment of water in the C–S–H and N(K)–A–S–H binding gel. After the removal of water, the pores remained in the structure, which resulted in a decrease in the cutting edge strength in addition to an increase in porosity. D2 leaching removed much of the elements from the structure (Si and some Al were not removed) and left a very porous aluminosilicate skeleton consisting of zeolite and other mineral components that were not disturbed by the effect of strong acid. However, the increase in porosity in D2 samples resulted in a decrease in the cutting edge strength.
The obtained data showed that samples containing slag and subsequently modified by leaching showed an improvement of some properties and extension of the potential applicability of these materials in the chemical industry, especially for catalytic and adsorption applications.
Author Contributions
Conceptualization, K.S. and Z.T.; methodology, Z.T.; software, K.S.; validation, Z.T.; formal analysis, K.P., N.S. and M.M.; investigation, N.S. and M.M.; data curation, K.S. and Z.T.; writing—original draft preparation, K.S.; writing—review and editing, Z.T., K.P. and E.S.; visualization, K.S., Z.T. and E.S.; supervision, Z.T. All authors have read and agreed to the published version of the manuscript.
Funding
The publication is a result of the project which was carried out within the financial support of the Ministry of Industry and Trade of the Czech Republic with institutional support for the long-term conceptual development of the research organization. The result was achieved using the infrastructure included in the project Efficient Use of Energy Resources Using Catalytic Processes (LM2018119) which has been financially supported by MEYS within the targeted support of large infrastructures.
Conflicts of Interest
The authors declare no conflict of interest. The funders had no role in the design of the study, in the collection, analyses or interpretation of data, in the writing of the manuscript or in the decision to publish the results.
Appendix A
Table A1.
Elemental composition determined by XRF analysis.
Table A1.
Elemental composition determined by XRF analysis.
| Sample | SiO2 | Al2O3 | K2O | Fe2O3 | CaO | Na2O | MgO | TiO2 | SUM | Si/Al 1 | MSi 2 |
|---|---|---|---|---|---|---|---|---|---|---|---|
| AAC (0.7)/S | 71.60 | 10.60 | 8.60 | 1.34 | 3.25 | 3.61 | 0.67 | 0.16 | 99.83 | 5.73 | 5.13 |
| AAC (0.7)/D1 | 76.70 | 11.30 | 5.68 | 1.43 | 3.05 | 0.67 | 0.65 | 0.20 | 99.68 | 5.76 | 8.48 |
| AAC (0.7)/D2 | 89.90 | 6.17 | 1.44 | 0.89 | 0.76 | 0.26 | 0.32 | 0.19 | 99.93 | 12.36 | 32.11 |
| AACZ (0.7)/S | 60.30 | 8.51 | 8.00 | 0.91 | 14.10 | 4.69 | 2.38 | 0.23 | 99.12 | 6.01 | 2.11 |
| AACZ (0.7)/D1 | 67.50 | 9.77 | 5.22 | 1.01 | 12.60 | 0.83 | 2.24 | 0.25 | 99.42 | 5.86 | 3.16 |
| AACZ (0.7)/D2 | 93.90 | 3.15 | 0.93 | 0.63 | 0.60 | 0.14 | 0.20 | 0.21 | 99.75 | 25.29 | 49.28 |
| AACZ (0.57)/S | 60.60 | 8.56 | 8.06 | 0.91 | 14.00 | 4.48 | 2.31 | 0.23 | 99.15 | 6.01 | 2.14 |
| AACZ (0.57)/D1 | 66.90 | 9.64 | 5.67 | 0.97 | 12.50 | 1.28 | 2.17 | 0.28 | 99.41 | 5.89 | 3.06 |
| AACZ (0.57)/D2 | 93.40 | 3.34 | 0.98 | 0.63 | 0.65 | 0.20 | 0.24 | 0.23 | 99.67 | 23.73 | 44.31 |
| AAZ (0.47)/S | 47.50 | 6.72 | 7.17 | 0.55 | 26.30 | 4.84 | 4.88 | 0.32 | 98.27 | 6.00 | 1.06 |
| AAZ (0.47)/D1 | 54.20 | 7.48 | 4.53 | 0.59 | 24.80 | 2.36 | 4.53 | 0.35 | 98.84 | 6.15 | 1.40 |
| AAZ (0.47)/D2 | 94.30 | 1.47 | 0.67 | 0.25 | 1.58 | 0.26 | 0.29 | 0.31 | 99.12 | 54.43 | 32.53 |
1 Si/Al is the molar ratio; 2 MSi is the silicate modulus.
References
- Tišler, Z.; Horáček, J.; Šafář, J.; Velvarská, R.; Pelíšková, L.; Kocik, J.; Gherib, Y.; Marklova, K.; Bulanek, R.; Kubicka, D. Clinoptilolite foams prepared by alkali activation of natural zeolite and their post-synthesis modifications. Microporous Mesoporous Mater. 2019, 282, 169–178. [Google Scholar] [CrossRef]
- Abukhadra, M.R.; Mohamed, A.S. Adsorption Removal of Safranin Dye Contaminants from Water Using Various Types of Natural Zeolite. Silicon 2019, 11, 1635–1647. [Google Scholar] [CrossRef]
- Margeta, K.; Zabukovec Logar, N.; Šiljeg, M.; Farkaš, A. Natural Zeolites in Water Treatment—How Effective is Their Use. In Water Treatment; Elshorbagy, W., Kabir Chowdhury, R., Eds.; inTech: London, UK, 2013; pp. 81–112. [Google Scholar]
- Thi Tran, Y.; Lee, J.; Kumar, P.; Kim, K.H.; SooLee, S. Natural zeolite and its application in concrete composite production. Compos. Part B Eng. 2019, 165, 354–364. [Google Scholar] [CrossRef]
- Pavelić, S.K.; Medica, J.S.; Gumbarević, D.; Filošević, A.; Przulj, N.; Pavelić, K. Critical Review on Zeolite Clinoptilolite Safety and Medical Applications in vivo. Front. Pharmacol. 2018, 9, 1350. [Google Scholar] [CrossRef]
- Polat, E.; Karaca, M.; Demir, H.; Onus, A.N. Use of Natural Zeolite (Clinoptilolite) in Agriculture. J. Fruit Ornam. Plant Res. 2004, 12, 183–189. [Google Scholar]
- Mastinu, A.; Kumar, A.; Maccarinelli, G.; Bonini, S.A.; Premoli, M.; Aria, F.; Gianoncelli, A.; Memo, M. Zeolite Clinoptilolite: Therapeutic Virtues of an Ancient Mineral. Molecules 2019, 24, 1517. [Google Scholar] [CrossRef]
- Hailu, Y.; Tilahun, E.; Brhane, A.; Resky, H.; Sahu, O. Ion exchanges process for calcium, magnesium and total hardness from ground water with natural zeolite. Groundw. Sustain. Dev. 2019, 8, 457–467. [Google Scholar] [CrossRef]
- Vocciante, M.; D’Auris, A.D.F.; Finocchi, A.; Tagliabue, M.; Bellettato, M.; Ferrucci, A.; Reverberi, A.P.; Ferro, S. Adsorption of ammonium on clinoptilolite in presence of competing cations: Investigation on groundwater remediation. J. Clean. Prod. 2018, 198, 480–487. [Google Scholar] [CrossRef]
- Li, Y.; Yan, Y.; Yan, W.; Shi, W.; Xu, R. Removal of Zn2+, Pb2+, Cd2+, and Cu2+ from aqueous solution by synthetic clinoptilolite. Microporous Mesoporous Mater. 2019, 273, 203–211. [Google Scholar] [CrossRef]
- Zabochnicka-Świątek, M.; Malinska, K. Removal of Ammonia by Clinoptilolite. Glob. Nest J. 2010, 12, 256–261. [Google Scholar] [CrossRef]
- Kannan, A.D.; Parameswaran, P. Ammonia adsorption and recovery from swine wastewater permeate using naturally occurring clinoptilolite. J. Water Process. Eng. 2021, 43, 10223. [Google Scholar] [CrossRef]
- Bilim, C. Properties of cement mortars containing clinoptilolite as a supplementary cementitious material. Constr. Build. Mater. 2011, 25, 3175–3180. [Google Scholar] [CrossRef]
- Burris, L.E.; Juenger, M.C.G. Milling as a pretreatment method for increasing the reactivity of natural zeolites for use as supplementary cementitious materials. Cem. Concr. Compos. 2016, 65, 163–170. [Google Scholar] [CrossRef]
- Burris, L.E.; Juenger, M.C.G. Effect of calcination on the reactivity of natural clinoptilolite zeolites used as supplementary cementitious materials. Constr. Build. Mater. 2020, 258, 11998. [Google Scholar] [CrossRef]
- Faghihian, H.; Talebi, M.; Pirouzi, M. Adsorption of nitrogen from natural gas by clinoptilolite. J. Iran. Chem. Soc. 2008, 5, 394–399. [Google Scholar] [CrossRef]
- Hao, X.; Hu, H.; Li, Z.; Wu, L.; Liu, X.; Zhang, Y. Adsorption Properties of Modified Clinoptilolite for Methane and Nitrogen. Materials 2018, 11, 2024. [Google Scholar] [CrossRef]
- Wahono, S.K.; Prasetyo, D.J.; Jatmiko, T.H.; Pratiwi, D.; Suwanto, A.; Hernawan; Vasilev, K. Multi-stage dealumination for characteristic engineering of mordenite-clinoptilolite natural zeolite. AIP Conf. Proc. 2019, 2085, 020044. [Google Scholar] [CrossRef]
- Provis, J.L. Alkali-activated materials. Cem. Concr. Res. 2018, 114, 40–48. [Google Scholar] [CrossRef]
- Nikolov, A.; Rostovsky, I.; Nugteren, H. Geopolymer materials based on natural zeolite. Case Stud. Constr. Mater. 2017, 6, 198–205. [Google Scholar] [CrossRef]
- Tišler, Z.; Klegová, A.; Svobodová, E.; Šafář, J.; Strejcová, K.; Kohout, J.; Šlang, S.; Pacultová, K.; Rodríguez-Padrón, D.; Bulánek, R. Cobalt Based Catalysts on Alkali-Activated Zeolite Foams for N2O Decomposition. Catalysts 2020, 10, 1398. [Google Scholar] [CrossRef]
- Heah, C.Y.; Kamarudin, H.; Mustafa Al Bakri, A.M.; Bnhussain, M.; Luqman, M.; Nizar, I.K.; Ruzaidi, C.M.; Liew, Y.M. Study on solids-to-liquid and alkaline activator ratios on kaolin-based geopolymers. Constr. Build. Mater. 2012, 35, 912–922. [Google Scholar] [CrossRef]
- Nikolov, A.; Nugteren, H.; Rostovsky, I. Optimization of geopolymers based on natural zeolite clinoptilolite by calcination and use of aluminate activators. Constr. Build. Mater. 2020, 243, 11825. [Google Scholar] [CrossRef]
- Oguz, E. Removal of phosphate from aqueous solution with blast furnace slag. J. Hazard. Mater. 2004, 114, 131–137. [Google Scholar] [CrossRef]
- Pal, S.C.; Mukherjee, A.; Pathak, S.R. Investigation of hydraulic activity of ground granulated blast furnace slag in concrete. Cem. Concr. Res. 2003, 33, 1481–1486. [Google Scholar] [CrossRef]
- Cheng, T.W.; Chiu, J.P. Fire-resistant geopolymer produced by granulated blast furnace slag. Miner. Eng. 2003, 16, 205–210. [Google Scholar] [CrossRef]
- Shahmansouri, A.A.; Yazdani, M.; Ghanbari, S.; Akbarzadeh Bengar, H.; Jafari, A.; Ghatte, H.F. Artificial neural network model to predict the compressive strength of eco-friendly geopolymer concrete incorporating silica fume and natural zeolite. J. Clean. Prod. 2021, 279, 123697. [Google Scholar] [CrossRef]
- Kuwahara, Y.; Ohmichi, T.; Kamegawa, T.; Mori, K.; Yamashita, H. A novel conversion process for waste slag: Synthesis of a hydrotalcite-like compound and zeolite from blast furnace slag and evaluation of adsorption capacities. J. Mater. Chem. 2010, 20, 5052–5062. [Google Scholar] [CrossRef]
- Hrachovcová, K.; Tišler, Z.; Svobodová, E.; Šafář, J. Modified Alkali Activated Zeolite Foams with Improved Textural and Mechanical Properties. Minerals 2020, 10, 483. [Google Scholar] [CrossRef]
- Beers, A.E.W.; van Bokhoven, J.A.; de Lathouder, K.M.; Kapteijn, F.; Moulijn, J.A. Optimization of zeolite Beta by steaming and acid leaching for the acylation of anisole with octanoic acid: A structure–activity relation. J. Catal. 2003, 2182, 239–248. [Google Scholar] [CrossRef]
- Stanciakova, K.; Ensing, B.; Göltl, F.; Bulo, R.E.; Weckhuysen, B.M. Cooperative Role of Water Molecules during the Initial Stage of Water-Induced Zeolite Dealumination. ACS Catal. 2019, 9, 5119–5135. [Google Scholar] [CrossRef]
- van Donk, S.; Janssen, A.H.; Bitter, J.H.; de Jong, K.P. Generation, Characterization, and Impact of Mesopores in Zeolite Catalysts. Catal. Rev.-Sci. Eng. 2003, 45, 297–319. [Google Scholar] [CrossRef]
- Mansouri, N.; Rikhtegar, N.; Panahi, H.A.; Atabi, F.; Shahraki, B.K. Porosity, characterization and structural properties of natural zeolite-Clinoptilolite-As a sorbent. Environ. Prot. Eng. 2013, 39, 139–152. [Google Scholar] [CrossRef]
- Tišler, Z.; Hrachovcová, K.; Svobodová, E.; Šafář, J.; Pelíšková, L. Acid and Thermal Treatment of Alkali-Activated Zeolite Foams. Minerals 2019, 9, 719. [Google Scholar] [CrossRef]
- Elaiopoulos, K.; Perraki, T.; Grigoropoulou, E. Monitoring the effect of hydrothermal treatments on the structure of a natural zeolite through a combined XRD, FTIR, XRF, SEM and N2-porosimetry analysis. Microporous Mesoporous Mater. 2010, 134, 29–43. [Google Scholar] [CrossRef]
- Valdés, H.; Riquelme, A.L.; Solar, V.A.; Azzolina-Jury, F.; Thibault-Starzyk, F. Removal of chlorinated volatile organic compounds onto natural and Cu-modified zeolite: The role of chemical surface characteristics in the adsorption mechanism. Sep. Purif. Technol. 2021, 258, 11808. [Google Scholar] [CrossRef]
- Belmokhtar, N.; Ammari, M.; Brigui, J.; Ben Allal, L. Comparison of the microstructure and the compressive strength of two geopolymers derived from Metakaolin and an industrial sludge. Constr. Build. Mater. 2017, 146, 621–629. [Google Scholar] [CrossRef]
- Catauroa, M.; Papale, F.; Lamanna, G.; Bollino, F. Geopolymer/PEG Hybrid Materials Synthesis and Investigation of the Polymer Influence on Microstructure and Mechanical Behavior. Mater. Res. 2015, 18, 698–705. [Google Scholar] [CrossRef]
- Perná, I.; Šupová, M.; Hanzlíček, T. The characterization of the Ca-K geopolymer/solidified fluid fly-ash interlayer. Ceramics-Silikáty 2017, 61, 26–33. [Google Scholar] [CrossRef][Green Version]
- Cakicioglu-Ozkan, F.; Ulku, S. The effect of HCl treatment on water vapor adsorption characteristics of clinoptilolite rich natural zeolite. Microporous Mesoporous Mater. 2005, 77, 47–53. [Google Scholar] [CrossRef]
- Chen, L.; Wang, Z.; Wang, Y.; Feng, J. Preparation and Properties of Alkali Activated Metakaolin-Based Geopolymer. Materials 2016, 9, 767. [Google Scholar] [CrossRef]
- Krivácsy, Z.; Hlavay, J. A simple method for the determination of clinoptilolite in natural zeolite rocks. Zelites 1995, 15, 551–555. [Google Scholar] [CrossRef]
- Lancellotti, I.; Catauro, M.; Ponzoni, C.; Bollino, F.; Leonelli, C. Inorganic polymers from alkali activation of metakaolin: Effect of setting and curing on structure. J. Solid State Chem. 2013, 200, 341–348. [Google Scholar] [CrossRef]
- Schneider, P. Adsorption isotherms of microporous-mesoporous solids revisited. Appl. Catal. A 1995, 129, 157–165. [Google Scholar] [CrossRef]
- Muttakin, M.; Mitra, S.; Thu, K.; Ito, K.; Saha, B.B. Theoretical framework to evaluate minimum desorption temperature for IUPAC classified adsorption isotherms. Int. J. Heat Mass Transfer 2018, 122, 795–805. [Google Scholar] [CrossRef]
- Schneider, D.; Attallah, A.G.; Wassersleben, S.; Wenzel, M.; Matysik, J.; Krause-Rehberg, R.; Enke, D. Advanced textural characterization of biogenic silica by nitrogen physisorption, positron annihilation lifetime spectroscopy and hyperpolarized 129Xe NMR spectroscopy. Microporous Mesoporous Mater. 2020, 307, 11051. [Google Scholar] [CrossRef]
- Thommes, K.; Kaneko, K.; Neimark, A.V.; Olivier, J.P.; Rodriguez-Reinoso, F.; Rouquerol, J.; Sing, K.S.W. Physisorption of gases, with special reference to the evaluation of surface area and pore size distribution (IUPAC Technical Report). Pure Appl. Chem. 2015, 87, 1051–1069. [Google Scholar] [CrossRef]
- Tang, X.; Jiang, Z.; Li, Z.; Gao, Z.; Bai, Y.; Zhao, S.; Feng, J. The effect of the variation in material composition on the heterogeneous pore structure of high-maturity shale of the Silurian Longmaxi formation in the southeastern Sichuan Basin, China. J. Nat. Gas Sci. Eng. 2015, 23, 464–473. [Google Scholar] [CrossRef]
- Rachman, R.A.; Martia, U.T.I.; Aulia, W.; Iqbal, R.M.; Widiastuti, N.; Kurniawan, F. Combination of microbial fuel cell and zeolite Na-Y adsorption for chromium removal. AIP Conf. Proc. 2018, 2049, 020073. [Google Scholar] [CrossRef]
- Strejcová, K.; Tišler, Z.; Svobodová, E.; Velvarská, R. Characterization of Modified Natural Minerals and Rocks for Possible Adsorption and Catalytic Use. Molecules 2020, 25, 4989. [Google Scholar] [CrossRef]
- Silva, J.A.C.; Schumann, K.; Rodrigues, A.E. Sorption and kinetics of CO2 and CH4 in binderless beads of 13X zeolite. Microporous Mesoporous Mater. 2012, 158, 219–228. [Google Scholar] [CrossRef]
- Abdelhamid, H.N. Zinc hydroxide nitrate nanosheets conversion into hierarchical zeolitic imidazolate frameworks nanocomposite and their application for CO2 sorption. Mater. Today Chem. 2020, 15, 10022. [Google Scholar] [CrossRef]
- Tišler, Z.; Šafář, J.; Velvarská, R.; Pelíšková, L. Modifikované alkalicky aktivované zeolitové pěny: Příprava a charakterizace. Chem. Listy 2019, 113, 111–116. [Google Scholar]
- Megías-Sayago, C.; Bingre, R.; Huang, L.; Lutzweiler, G.; Wang, Q.; Louis, B. CO2 Adsorption Capacities in Zeolites and Layered Double Hydroxide Materials. Front. Chem. 2019, 7, 551. [Google Scholar] [CrossRef]
- Papa, E.; Medri, V.; Paillard, C.; Contri, B.; Natali Murri, A.; Vaccari, A.; Landi, E. Geopolymer-hydrotalcite composites for CO2 capture. J. Clean. Prod. 2019, 237, 11773. [Google Scholar] [CrossRef]
- Minelli, M.; Medri, V.; Papa, E.; Miccio, F.; Landi, E.; Doghieri, F. Geopolymers as solid adsorbent for CO2 capture. Chem. Eng. Sci. 2016, 148, 267–274. [Google Scholar] [CrossRef]
- Rodríguez, E.; García, R. Low-cost hierarchical micro/macroporous carbon foams as efficient sorbents for CO2 capture. Fuel Process. Technol. 2017, 156, 235–245. [Google Scholar] [CrossRef]
Publisher’s Note: MDPI stays neutral with regard to jurisdictional claims in published maps and institutional affiliations. |
© 2021 by the authors. Licensee MDPI, Basel, Switzerland. This article is an open access article distributed under the terms and conditions of the Creative Commons Attribution (CC BY) license (https://creativecommons.org/licenses/by/4.0/).