1. Introduction
Mineral sands, also commonly known as heavy minerals because of their relatively high specific density compared to sand (more than 4 kg/m3), are an important source of various titanium raw materials and zircon. These metals and their oxides have become extremely important for various sectors of industry.
Heavy minerals naturally occur in relatively small concentrations, so that specialized preparation systems equipped with spiral separators, electrostatic separators and magnetic separators are required for concentration and separation.
Mineral beneficiation relies on quantitative knowledge of phases present in the process streams. This information is necessary to optimize each step from the flowsheet in
Figure 1 to process and upgrade the mined heavy mineral sand. Often X-ray fluorescence (XRF) or wet chemistry are used to obtain elemental information which assists the metallurgists to estimate the mineral processing performance. When more accurate mineral phase information is needed, X-ray diffraction (XRD) is the most useful technique as a fast and accurate alternative to time consuming scanning electron microscopy. Due to the diverse applications and the improvements in speed, accuracy, and flexibility of the analysis, during the last two decades, XRD has become a standard tool in industries, such as cement or aluminium production [
1,
2,
3].
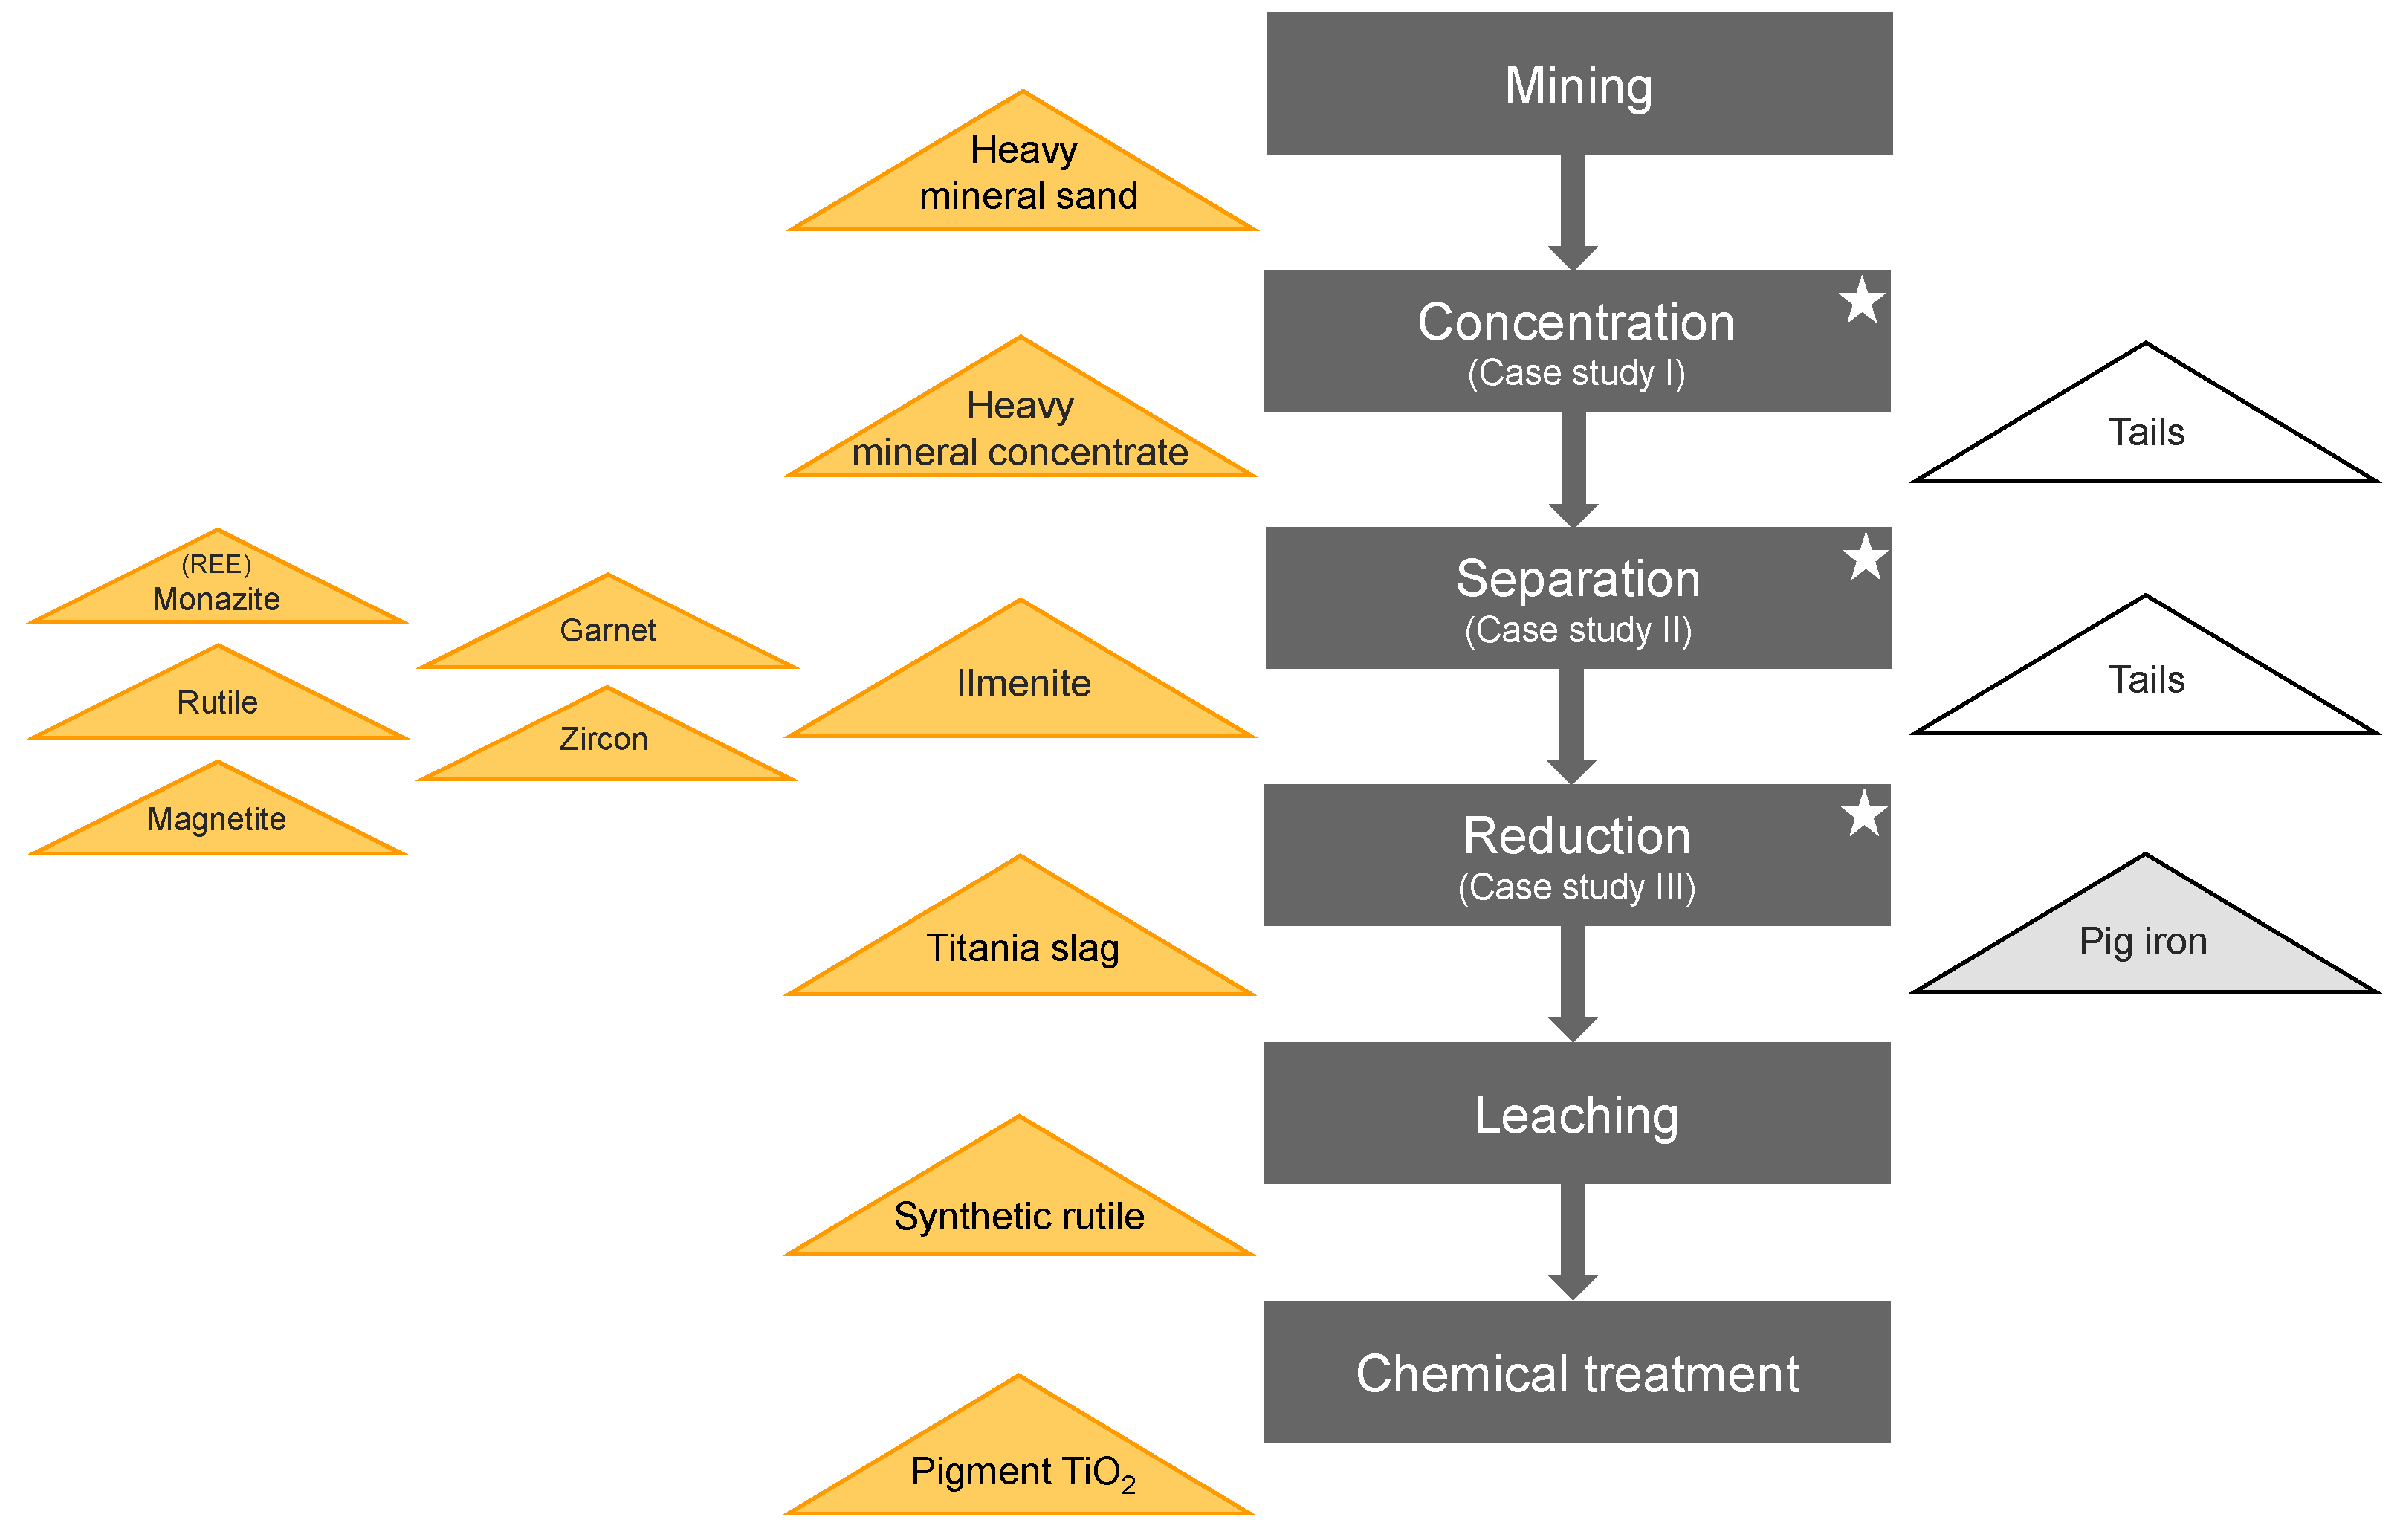
Figure 1 simplifies a typical process flow for the extraction of TiO
2 from heavy mineral sands, as well as further products of interest. Separation of the valuable heavy minerals from the primary ore is carried out in two stages: (a) wet concentration, utilizing sizing and gravity differentiation between heavy minerals, clay and quartz, and (b) dry separation, exploiting the magnetic and electrostatic properties of the minerals of interest. Case studies I and II deal with the fast analysis of heavy mineral concentrates improving the efficiency of the separation processes. Case study III demonstrates the use of XRD for checking the performance of the ilmenite smelting (reduction) process.
Ilmenite as well as rutile are the principal feedstocks for titanium dioxide production. Titanium dioxide is used as pigment for the manufacture of paints, coatings and plastics and also in other applications such as pharmaceutical, paper, cosmetics (e.g., sunscreen), toothpaste, inks and fibres. Titanium dioxide can be used in specialist applications including welding rods and the production of titanium metal for industrial and aerospace applications.
Zircon is used in the manufacture of ceramic products including tiles, sanitaryware and tableware, and as an opacifier in surface glazes and pigments. Zircon is also the main component in the production of zirconium chemicals used in antiperspirants, paper coatings, paint driers and catalysts. Zircon can also be used as foundry sand, cathode ray tube television glass and in refractories.
Most garnet is mined for industrial uses such waterjet cutting purposes, abrasive blasting media, water filtration granules and abrasive powders.
The objective of the three case studies in this paper is to demonstrate that X-ray diffraction (XRD) can be used as fast and reliable process control tool for heavy mineral sand concentration and beneficiation.
2. Materials and Methods
The three case studies form part of the typical process flow for the extraction of TiO2 from heavy mineral sands. Case study I describes the monitoring of the concentration of heavy mineral sands using statistical cluster analysis. Case study II demonstrates the mineralogical quantification of the different material streams during separation of the various heavy minerals. The use of XRD for process control during ilmenite smelting is discussed in case study III.
2.1. Samples and Sample Preparation
For case studies I and III, samples were prepared as pressed pellets using automatic sample preparation equipment for minimized preferred orientation and to guarantee a constant sample preparation quality. All powder samples were milled for 30 s and pressed for 30 s at 10 tons into steel ring sample holders. Constant sample preparation and the highest sample throughput could be realized using fully automated preparation and analysis setups.
For case study II samples were prepared using a backloading preparation technique. These samples were milled for 10 min in a Cr-steel milling vessel as it was found to be the optimum time for these Heavy Mineral Concentrate (HMC) samples.
2.2. X-ray Diffraction (XRD)
X-ray diffraction (XRD) is a versatile, nondestructive analytical method for identification and quantitative determination of crystalline phases present in powdered and bulk samples. Establishing which phases are present in a sample is usually the first step of a whole series of analyses and forms the basis of investigations on how much of each phase is present (quantitative phase analysis).
All crystalline materials have their own unique, characteristic X-ray fingerprint based on their crystal structure. When diffraction data for a particular sample are compared against a database of known materials, the crystalline phases within the sample can be identified. For this study the Crystallography Open Database (COD) was used [
4]. Data evaluation was performed with the software package HighScore Plus version 4.9 [
5]. Diffractograms were measured with a Malvern Panalytical Aeris Minerals diffractometer with a PIXcel detector, fixed slits and Fe-filtered Co-Kα radiation. The instrument was optimized for the rough needs of mineral industry environments (remote control possible), featuring measurement times of 5–10 min per scan. The samples were measured under room temperature within a range of 10 to 80°2θ and a step size of 0.02°2θ. Compared with traditional XRD approaches, the capabilities of high-speed XRD detectors allow measurements within minutes instead of hours.
2.3. Rietveld Quantification
The mineral quantification of all samples was determined using the Rietveld method [
6,
7,
8]. Modern XRD quantification analysis techniques such as Rietveld analysis are attractive alternatives to classical peak intensity or area-based methods since they do not require any standards or monitors. The Rietveld method offers impressive accuracy and speed of analysis. The knowledge of the exact crystal structure of all minerals present in the samples is mandatory for the Rietveld refinements. An example of the accuracy of the results is given in
Section 3.2, using a comparison of TiO
2 content recalculated from Rietveld refinement results with TiO
2 content determined by X-Ray Fluorescence Spectroscopy (XRF). A quality indicator of a Rietveld refinement is the weighted profile R-value (R
wp), which is minimized. The weighting is such that higher intensity data is more important than lower intensity data. Therefore, fitting the peaks is more important than fitting the background. In general, this value should be less than 10, [
8]. Amounts below 0.5 w%, may, however, be unreliable. The advantage of using Rietveld analysis over automated quantitative scanning electron microscope analysis for the analysis of HMC samples, such as speed of analysis, sample size, and cost effectiveness, is demonstrated in [
2].
2.4. Cluster Analysis
To handle large amounts of data achieved by rapid data collection using a linear detector, “cluster analysis” is a useful tool to group different XRD measurements into similar clusters, [
9,
10]. The method can be used to sort different ore grades with different mineralogical composition and thus varying process behavior or to detect instabilities during processing.
Cluster analysis greatly simplifies the analysis of large amounts of data. It automatically sorts all (closely related) scans of an experiment into separate groups and marks the most representative scan of each group as well as the most outlying scans within each group. Cluster analysis is basically a three-step process, but it contains optional visualization and verifications steps as well:
Comparison of all scans in a document with each other. The result is a correlation matrix representing the distances (or dissimilarity) of all data points of any given pair of scans.
Agglomerative hierarchical cluster analysis puts the scans in different classes defined by their similarity. The output of this step is displayed as a dendrogram, where each scan starts at the left side as an individual cluster. The clusters amalgamate in a stepwise fashion until they are all united in one single group.
The best possible grouping (=number of separate clusters) is estimated by the KGS test, named after Kelley, Gardner, Sutcliffe [
9], or by the largest relative step on the dissimilarity scale. Additionally, the most representative scan and the two most outlying scans within each cluster are determined and marked.
As well as hierarchical clustering, independent tools such as Principal Components Analysis (PCA) can be used to define clusters. The PCA method finds systematic large variances in the set of observations, i.e., the so-called principal components or “eigenvalues”. It uses the correlation matrix as input and displays the three most important principal components in a pseudo-3D plot. They explain the major part of the total overall variance in the correlation matrix.
3. Results
3.1. Case Study I: Cluster Analysis of Heavy Minerals Concentrates
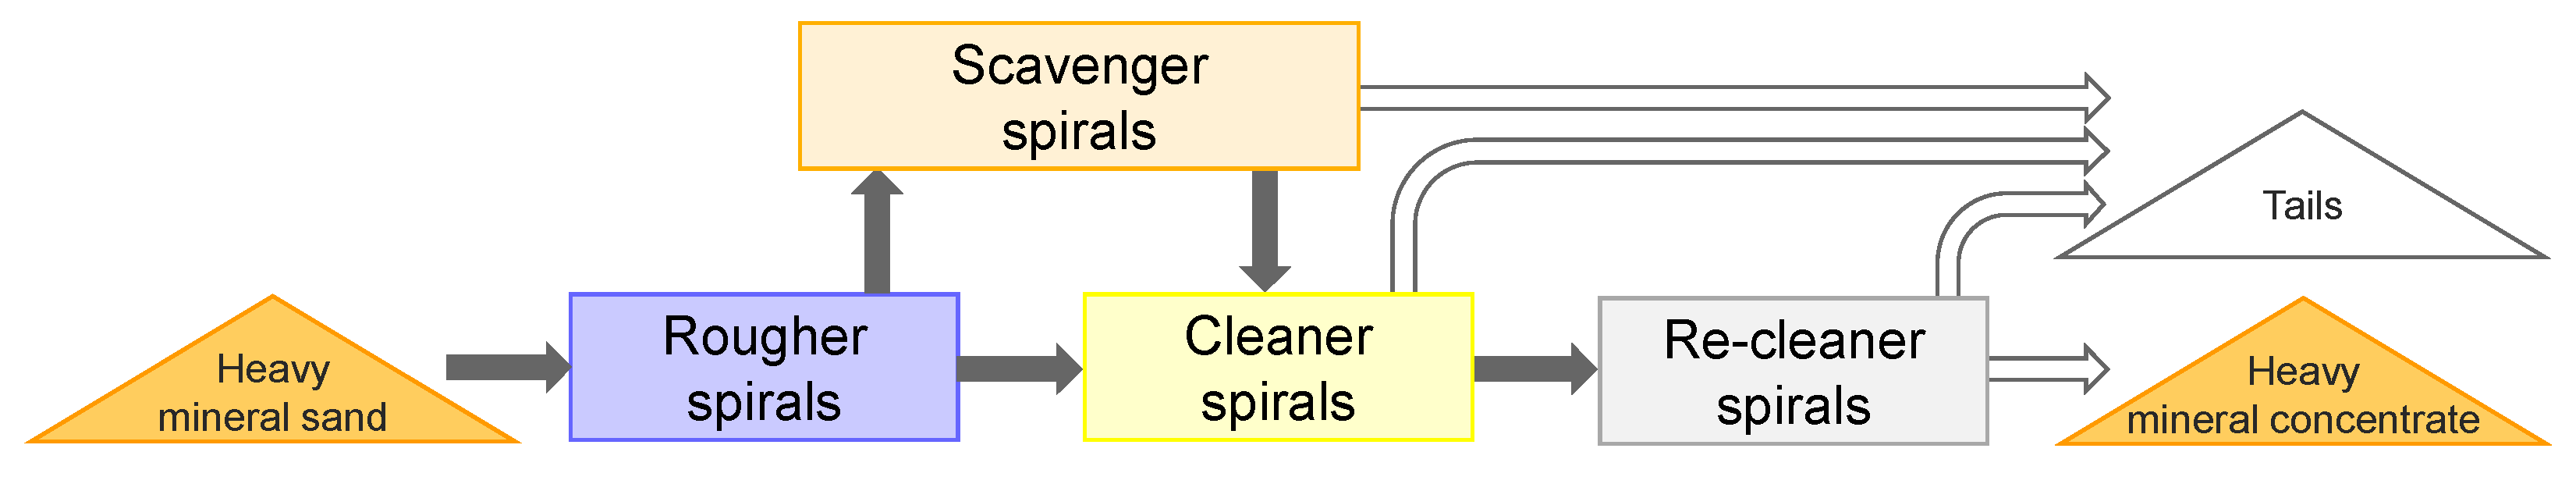
For this case study, cluster analysis was used to classify heavy mineral concentrates from different spiral stages of the concentration process at a wet concentration plant. Gravity separation with spirals was performed after the ore had passed scrubbing and screening. The wet concentration process consists of several stages: rougher spiral, cleaner spiral, scavenger spirals, and re-cleaner spirals, as shown in
Figure 2. Intermediate heavy minerals concentrate from each spiral stage passes to the next stage to be further concentrated.
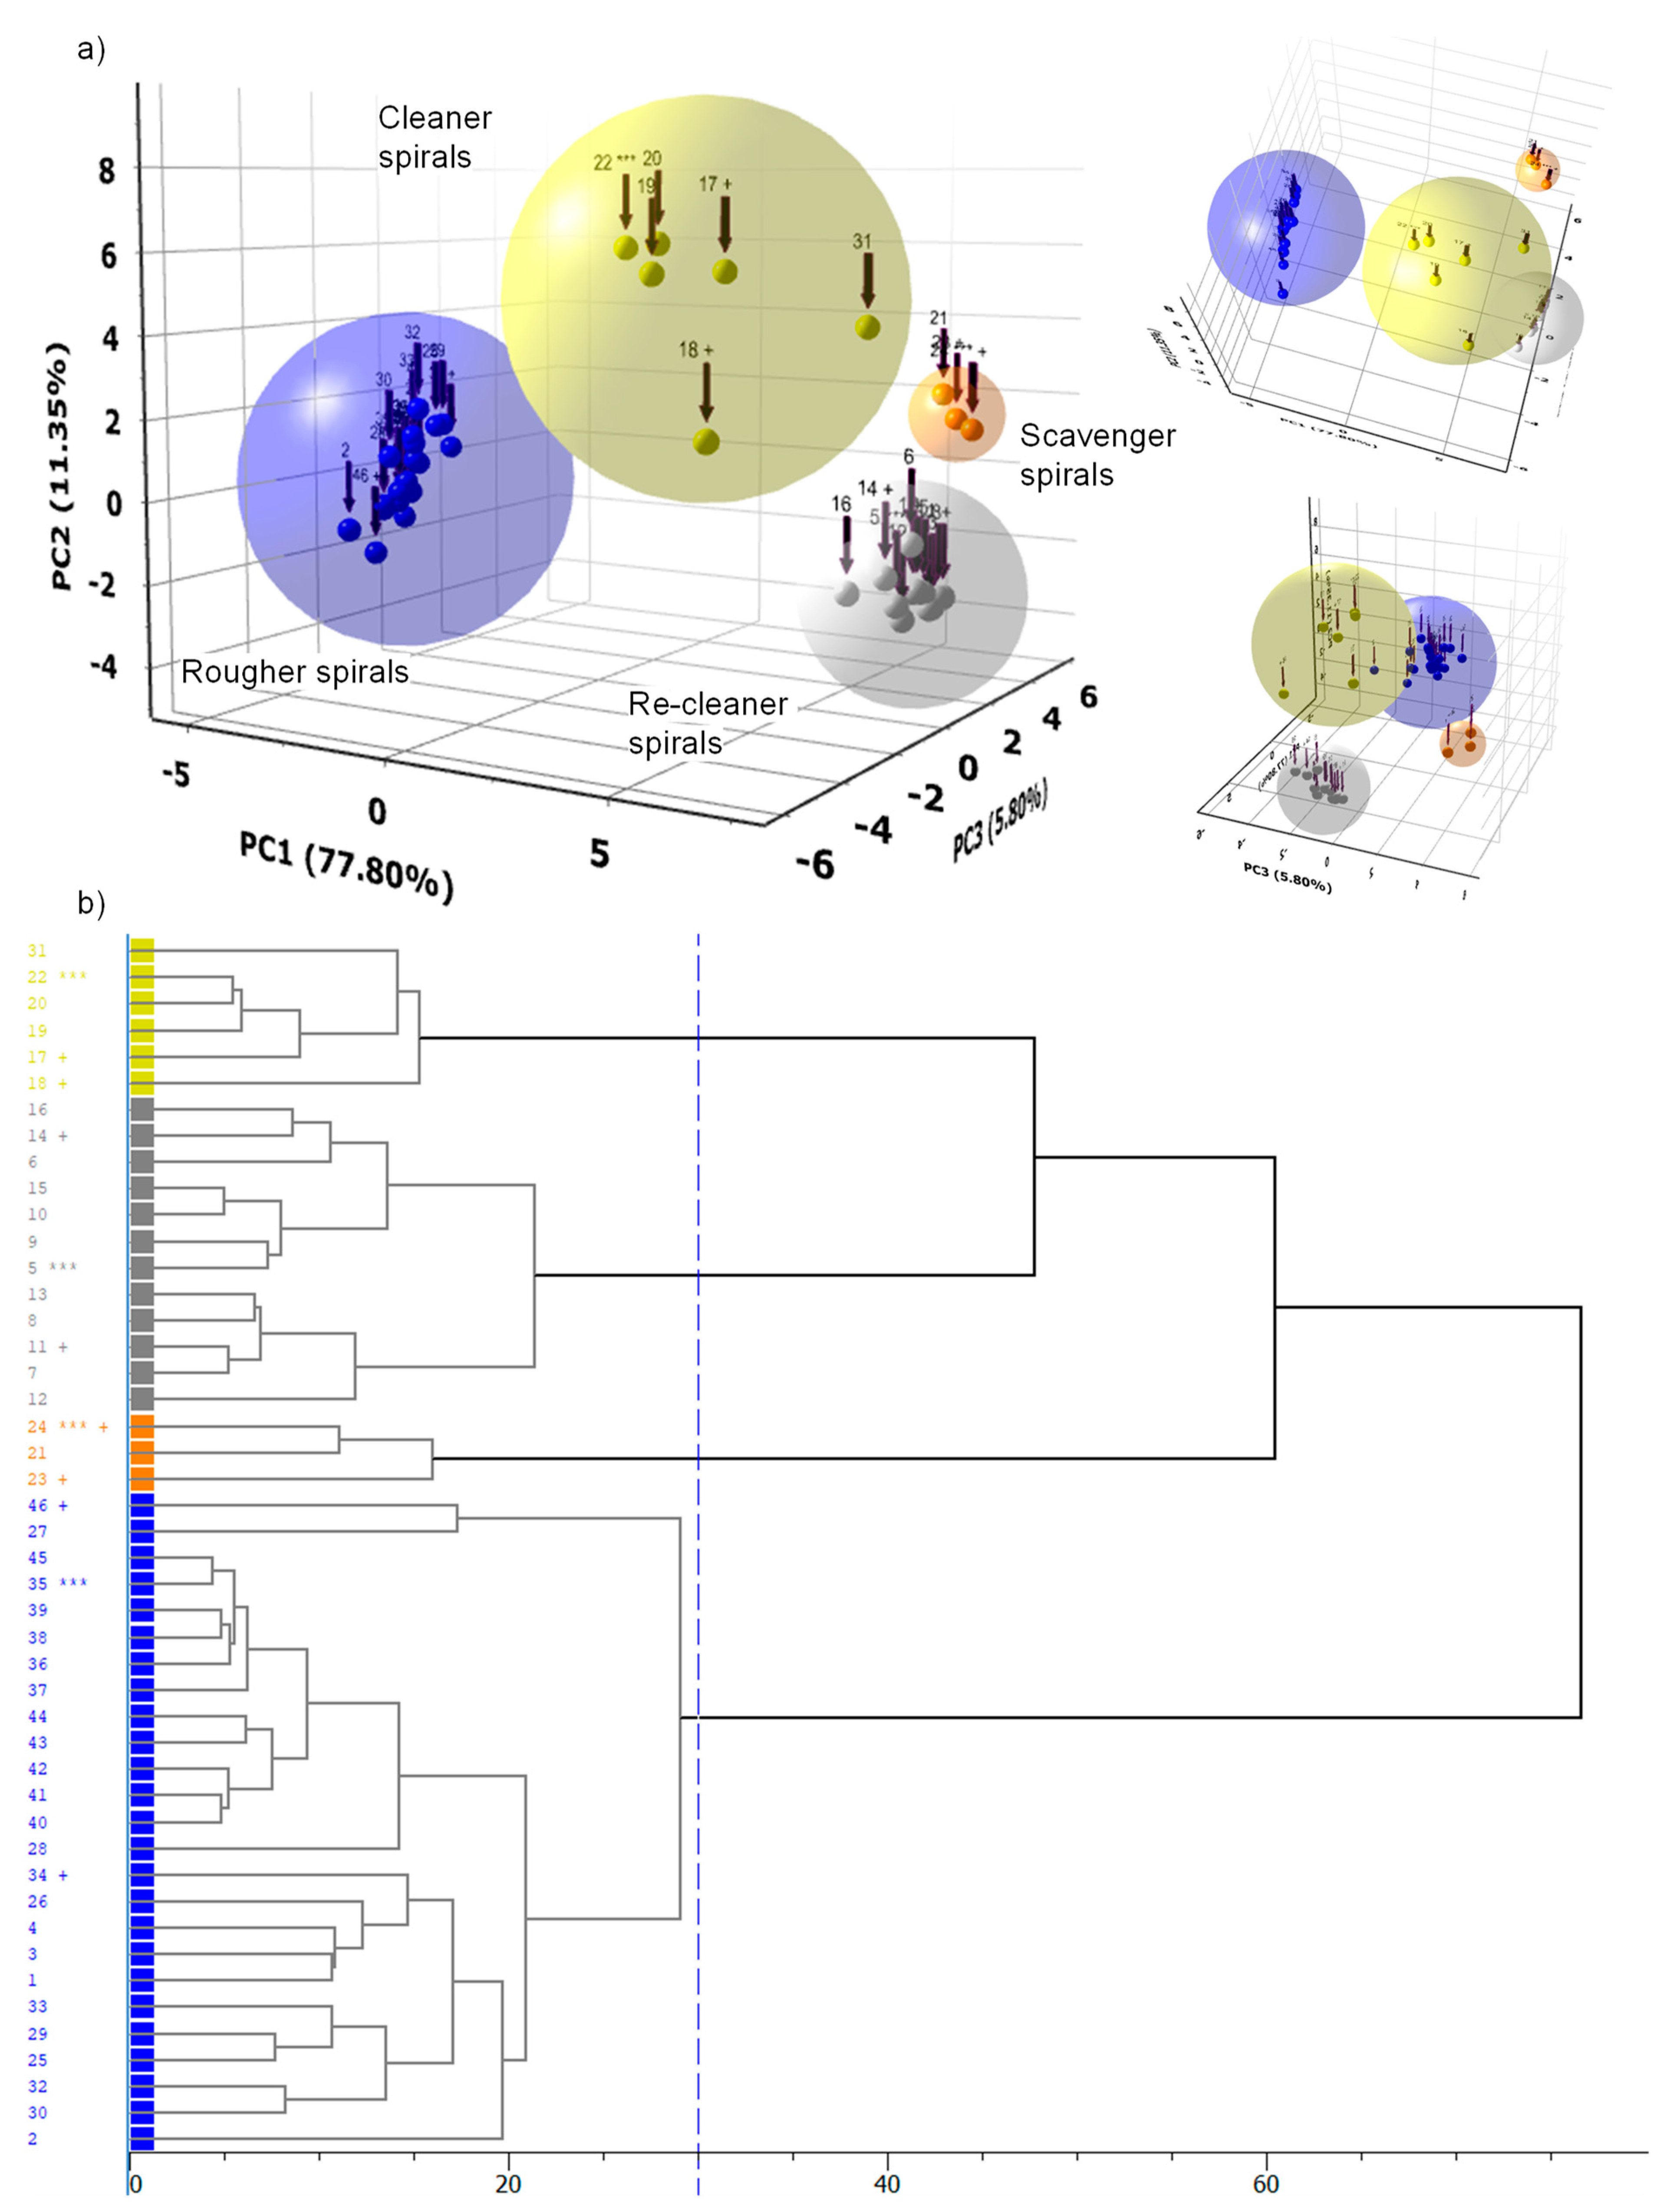
The XRD pattern of 46 samples from the four different spiral stages were collected. Without further processing, a cluster analysis was performed on the measurement. The principal component analysis (PCA) score plot in
Figure 3 shows four groups of samples.
The four clusters represent the four different spirals. The spread of the data points indicates the diversity in the mineralogical phase content in the clusters. Samples from the rougher spirals have a more diverse mineralogical composition compared to the other three clusters. Most similar are the samples coming from the re-cleaner spirals.
Generally, a larger spread within the cluster illustrates either varying compositions of heavy mineral concentrates or unstable separation conditions within the spirals. Outliers, which do not belong to any cluster, usually signal problems in the processing step. As a result, cluster analysis can be used as a fast tool to immediately control and adjust the efficiency and accuracy of the spiral stages. This enables fast responses to changes in raw materials or process conditions and with that, a greater focus on profitability. Cluster analysis not only allows producers to standardize and monitor concentration processes objectively, but it enables them to compare spiral performance across different processing plants quickly and easily.
Cluster analysis can be performed before further investigations on measurements, such as phase identification and quantification. The most representative scan and the scans that differ most within a cluster can be used as starting points for more detailed investigations.
3.2. Case Study II: Quantification of Heavy Minerals Concentrates
Samples for this case study originated from a heavy mineral sand mine in South Africa. The Heavy Minerals Concentrate (HMC) was split into three commercial products through various processes in the mineral processing plant. There were three concentrate product streams: ilmenite concentrate, high grade zircon/rutile and high-grade garnet concentrate (almandine).
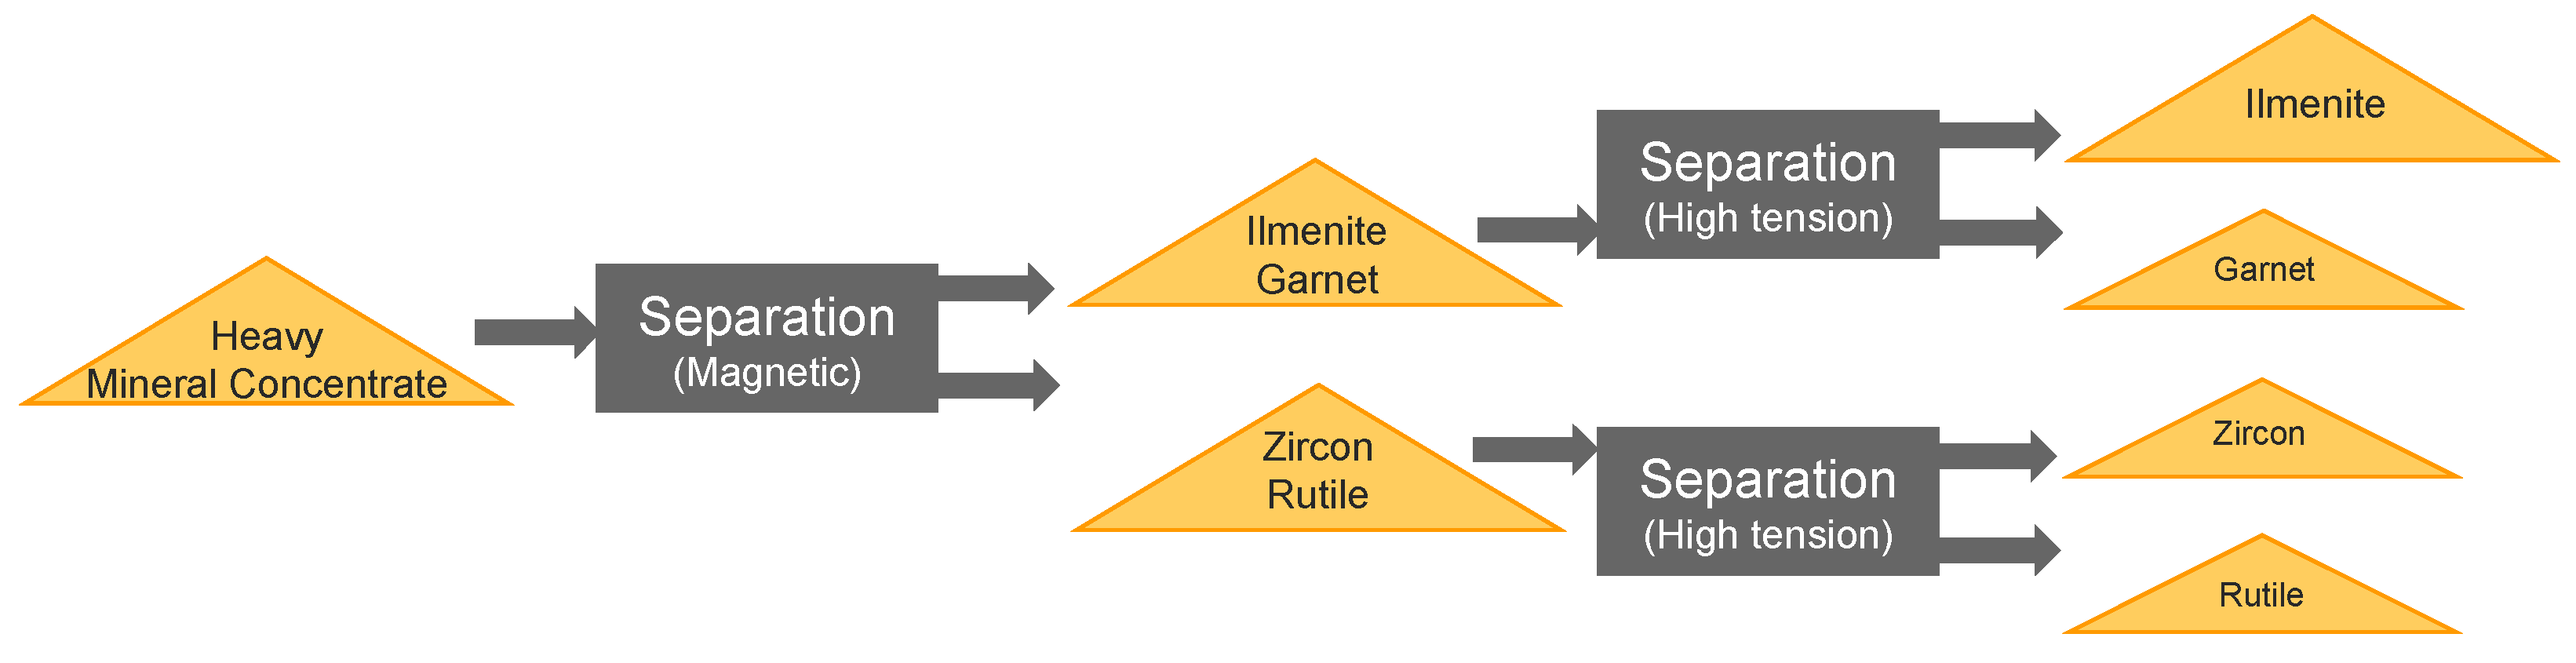
This study focuses on these three streams as they are the main commodities for the mine. Minor additional products such as magnetite concentrates are also marketed. REE minerals only occur as traces and are currently not commercialized. Heavy mineral sands are mined in a free dig operation using conventional trucking and excavation using mobile excavators, front-end loaders and trucks. The ore is processed via a Primary Bulk Concentrator (PBC), where the minerals are separated by a chemical-free gravity process. Subsequently garnet is separated at a garnet stripping plant and the nonmagnetic material is separated from the heavy mineral concentrate as shown in
Figure 4.
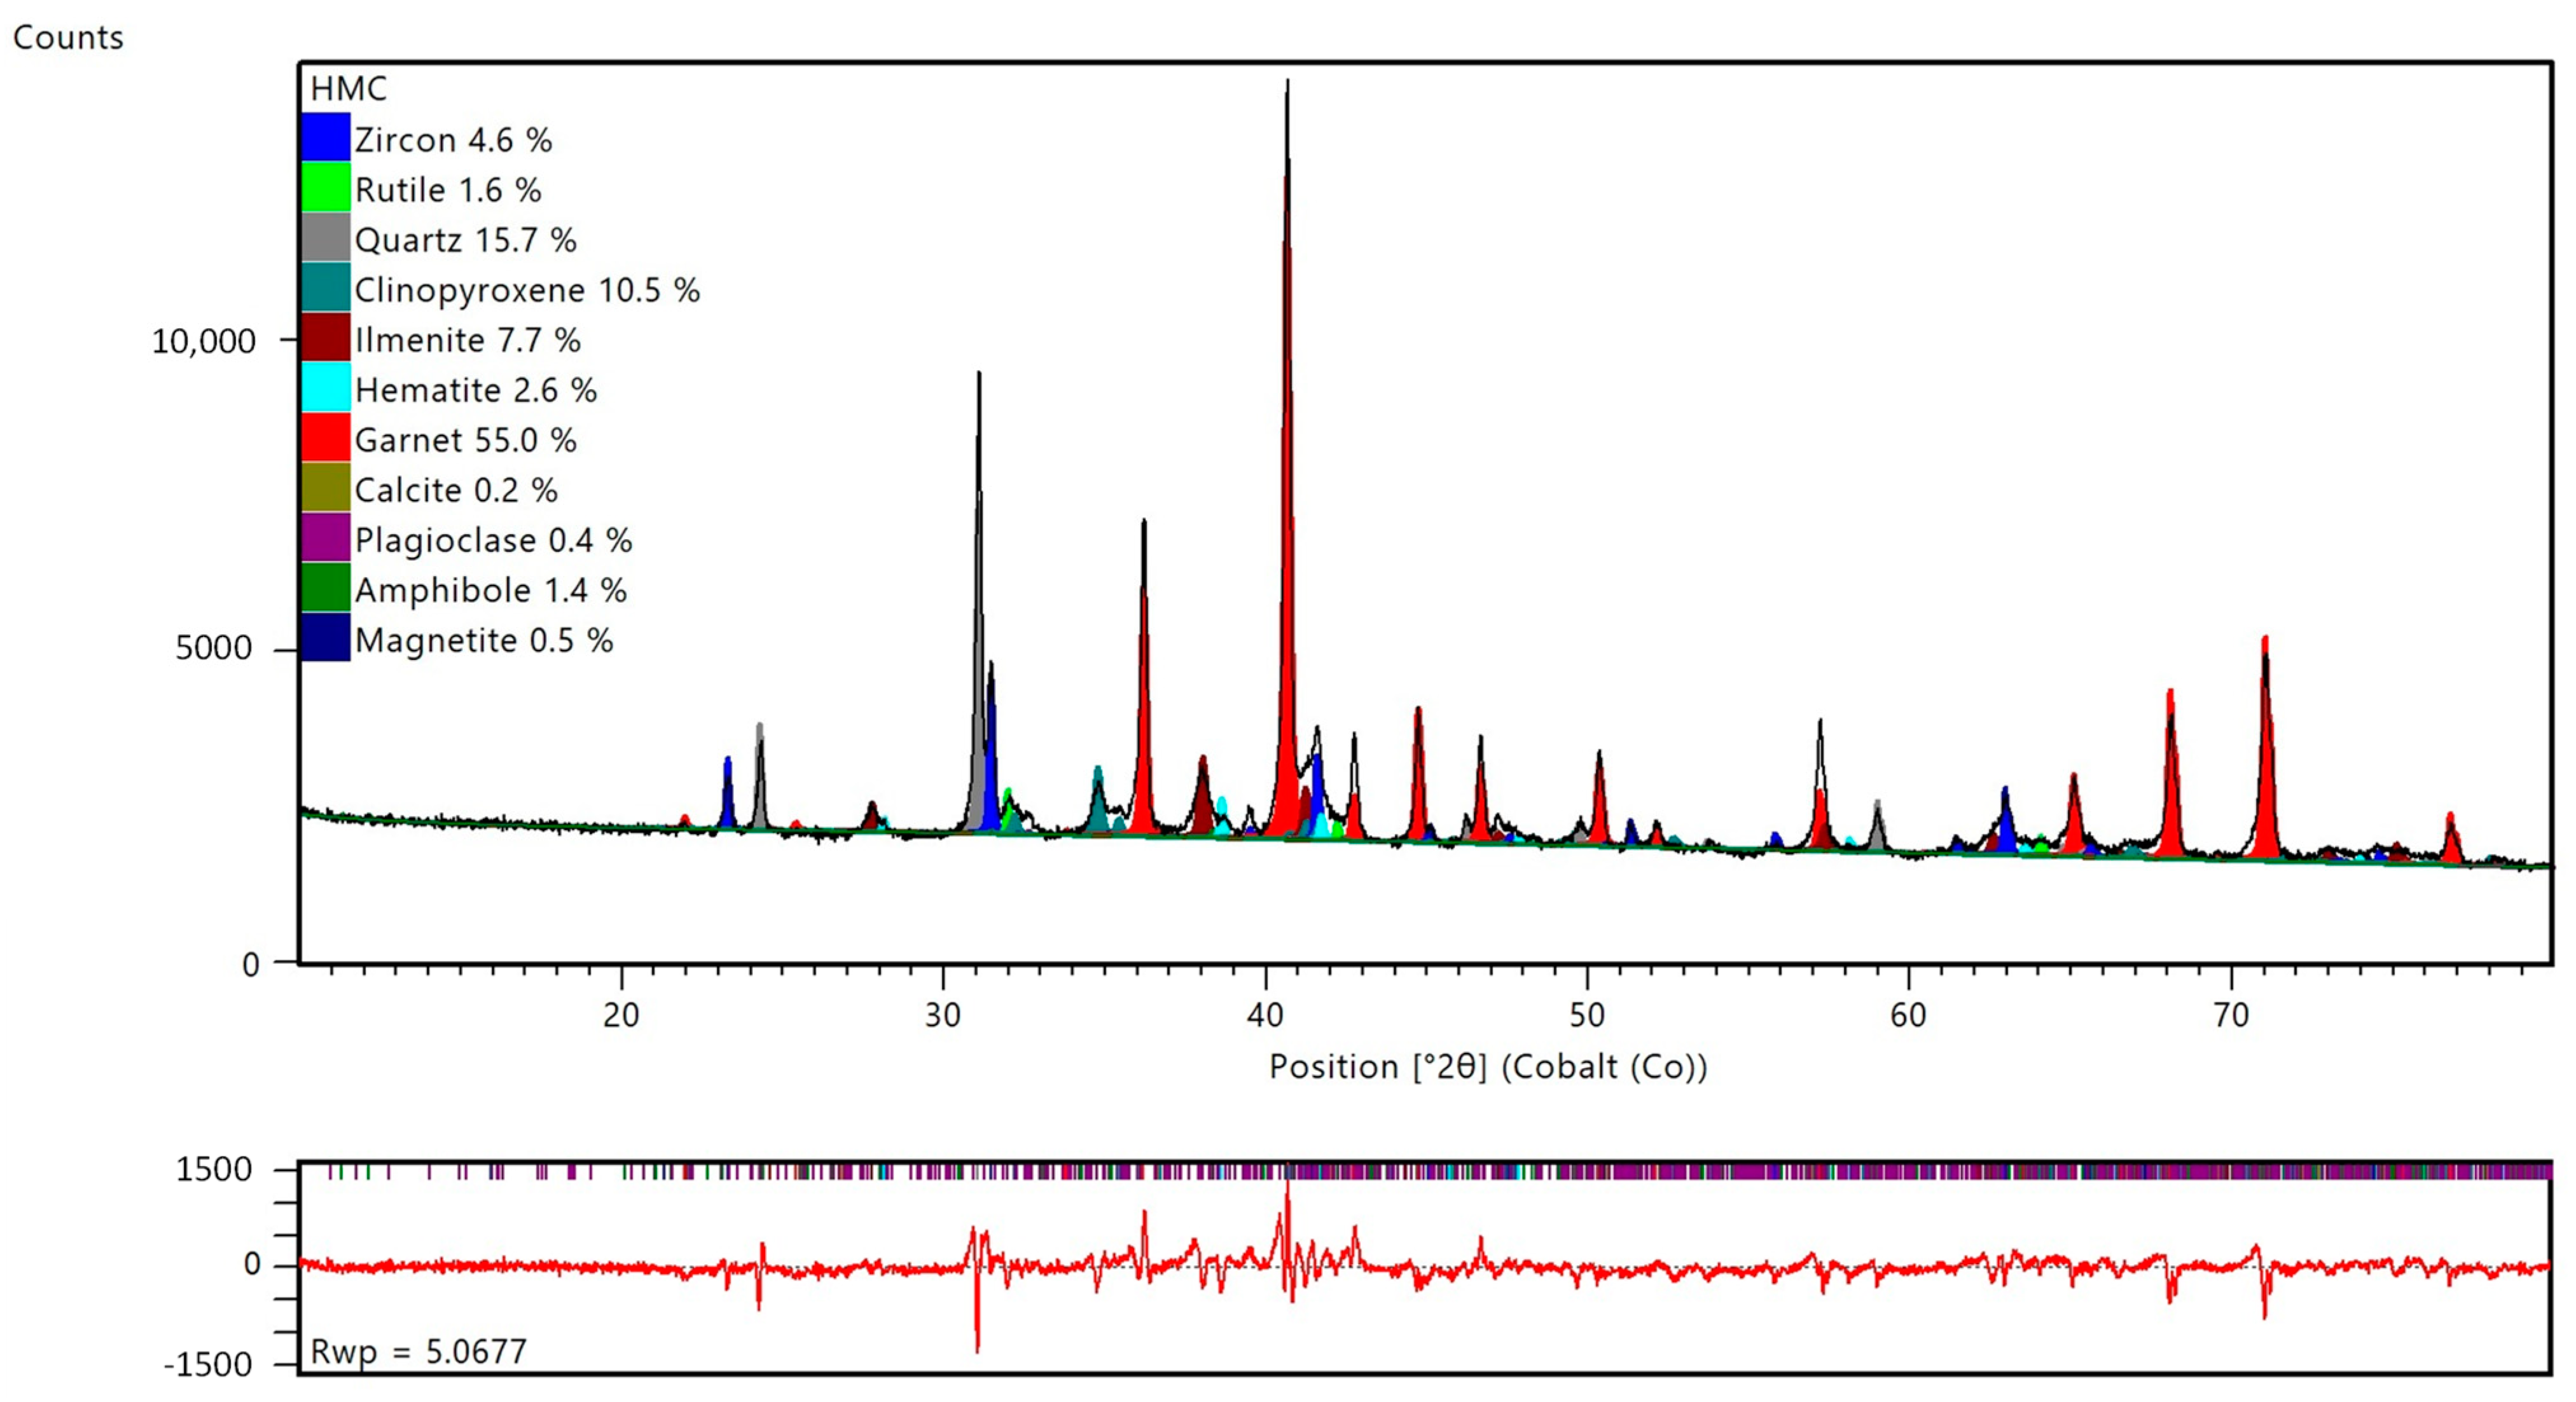
The HMC quantified in
Figure 5 is the product of density separation of beach sand composites. The typical amount of total heavy minerals ranges between 10% and 45%.
After separation each of the product streams must fulfill predefined specifications not only based on chemical composition but also mineral quantities. Frequent monitoring of the mineral composition allows for estimation of stockpile compositions and optimal blending of materials to achieve the quality targets before shipment. XRD together with Rietveld quantification is a fast and easy method that can be completely automated.
Figure 5,
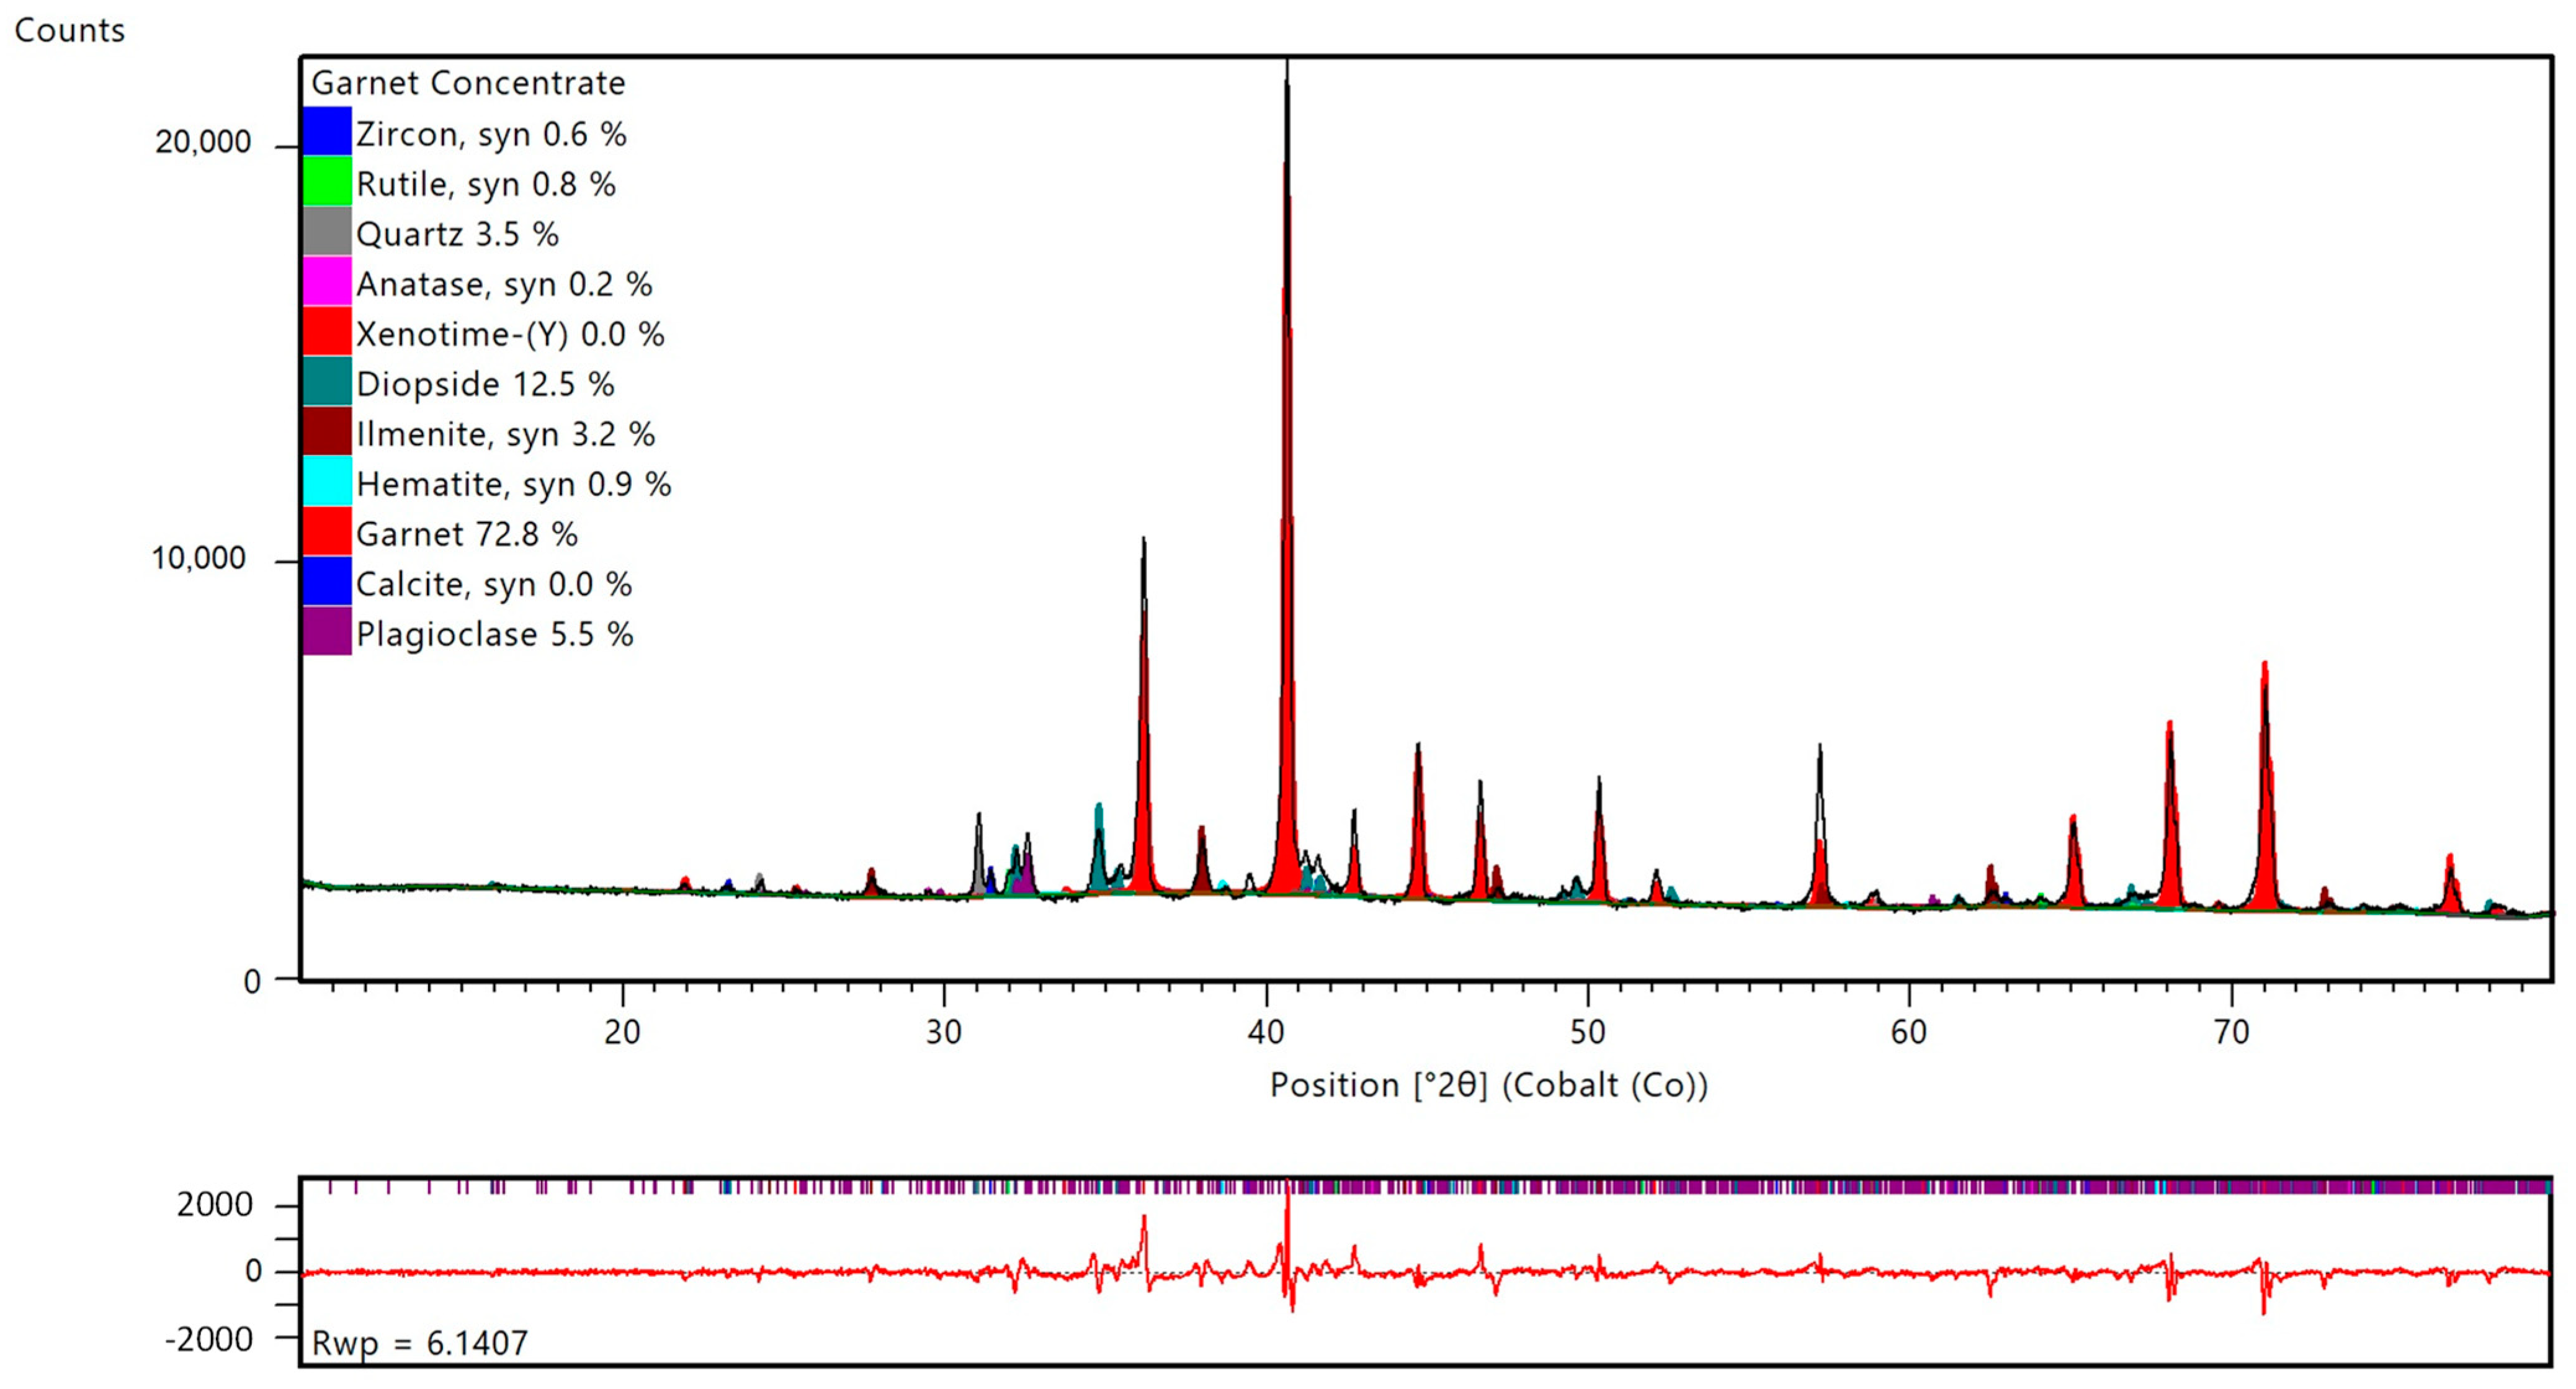
Figure 6,
Figure 7 and
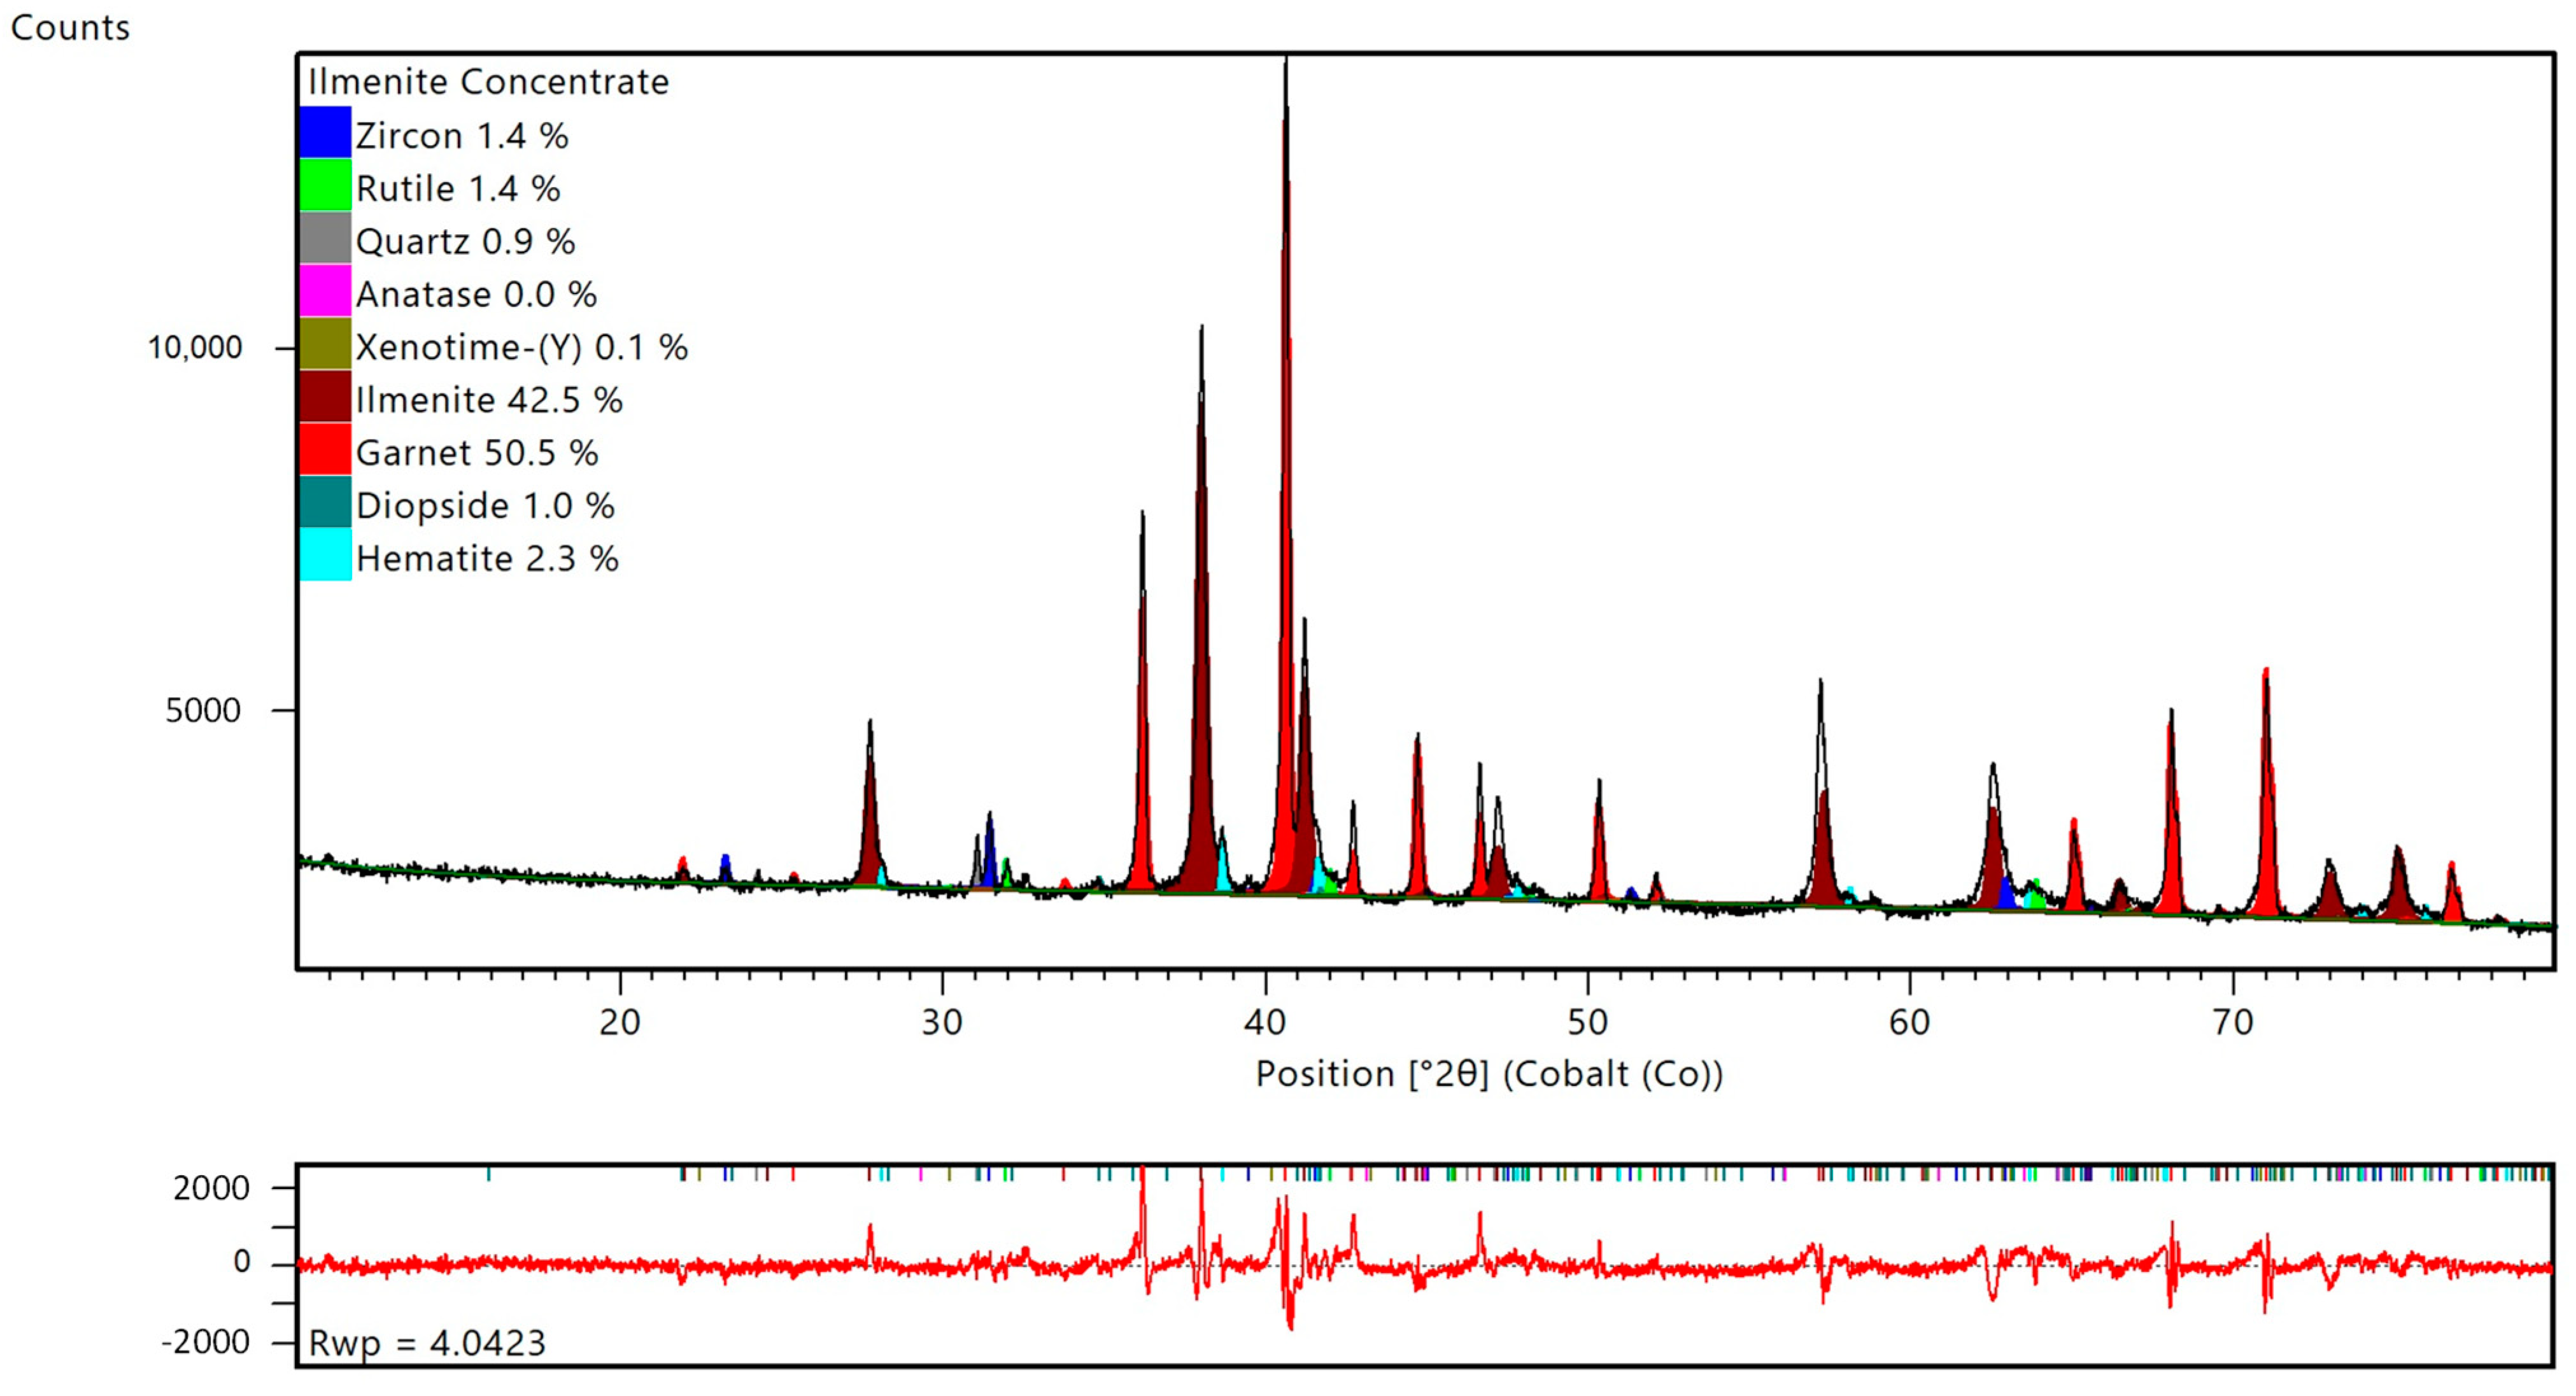
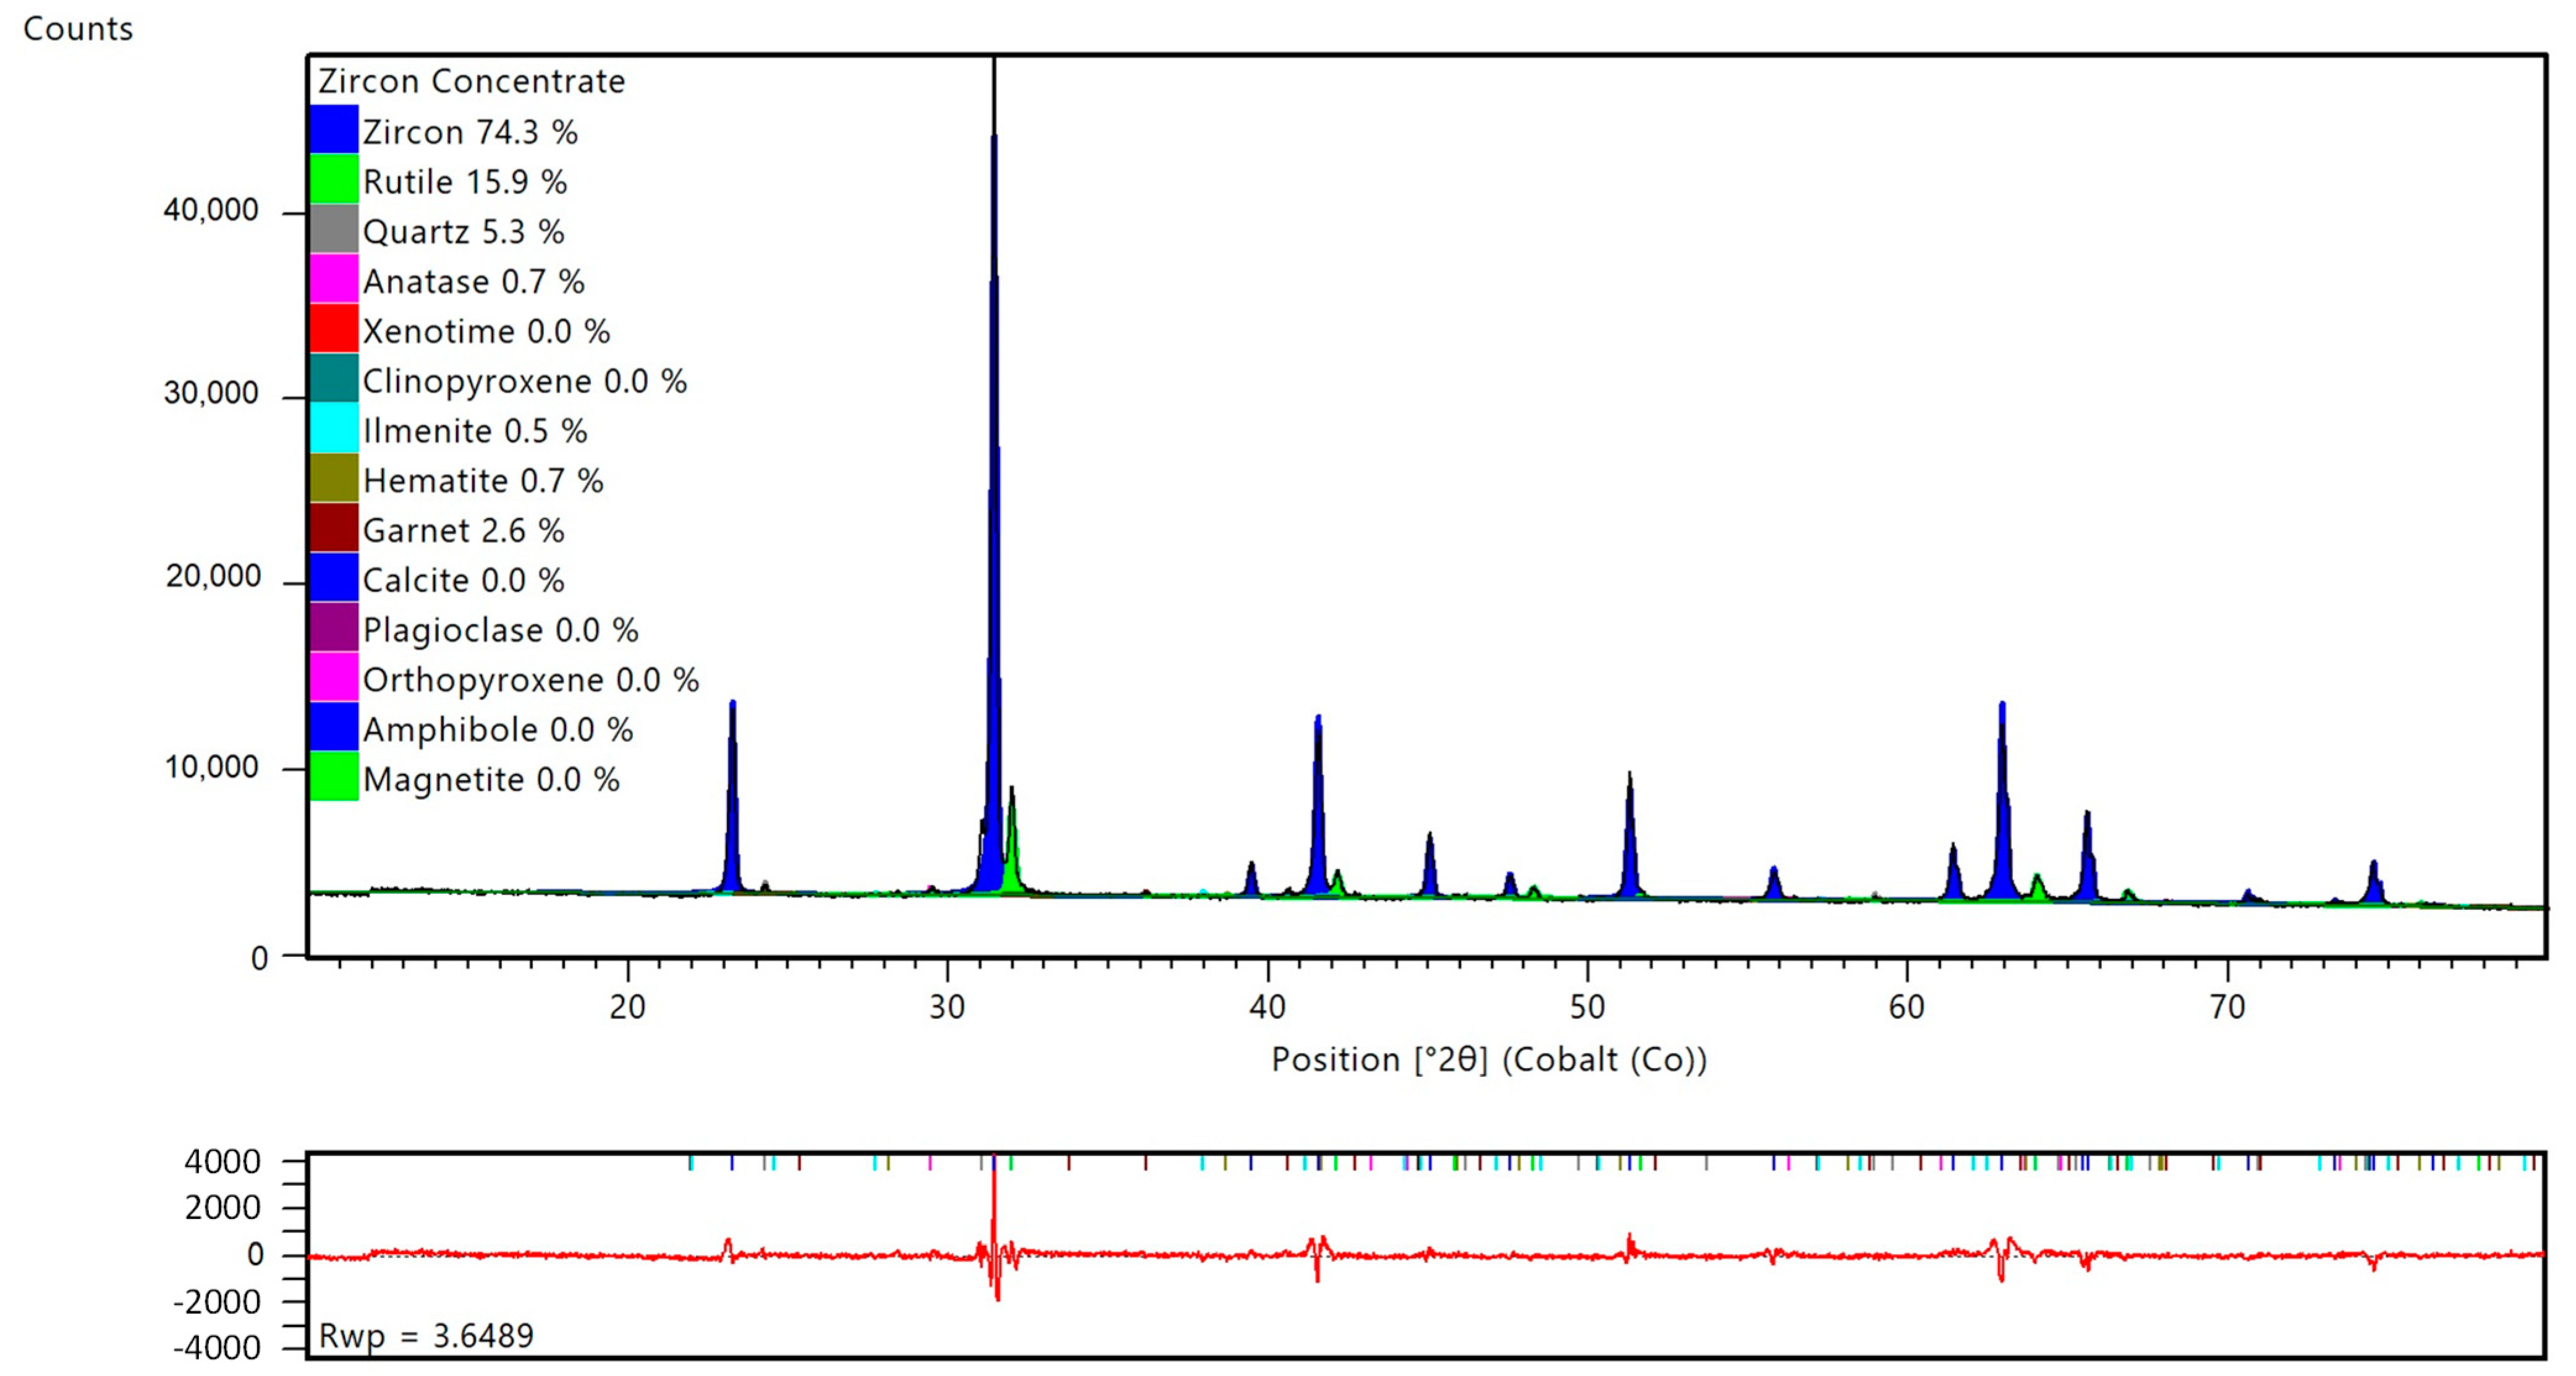
Figure 8 show examples of Rietveld quantifications of a typical heavy mineral concentrate (HMC), ilmenite, garnet and zircon concentrates. Each concentrate represents a weekly composite sample of 21 subsamples.
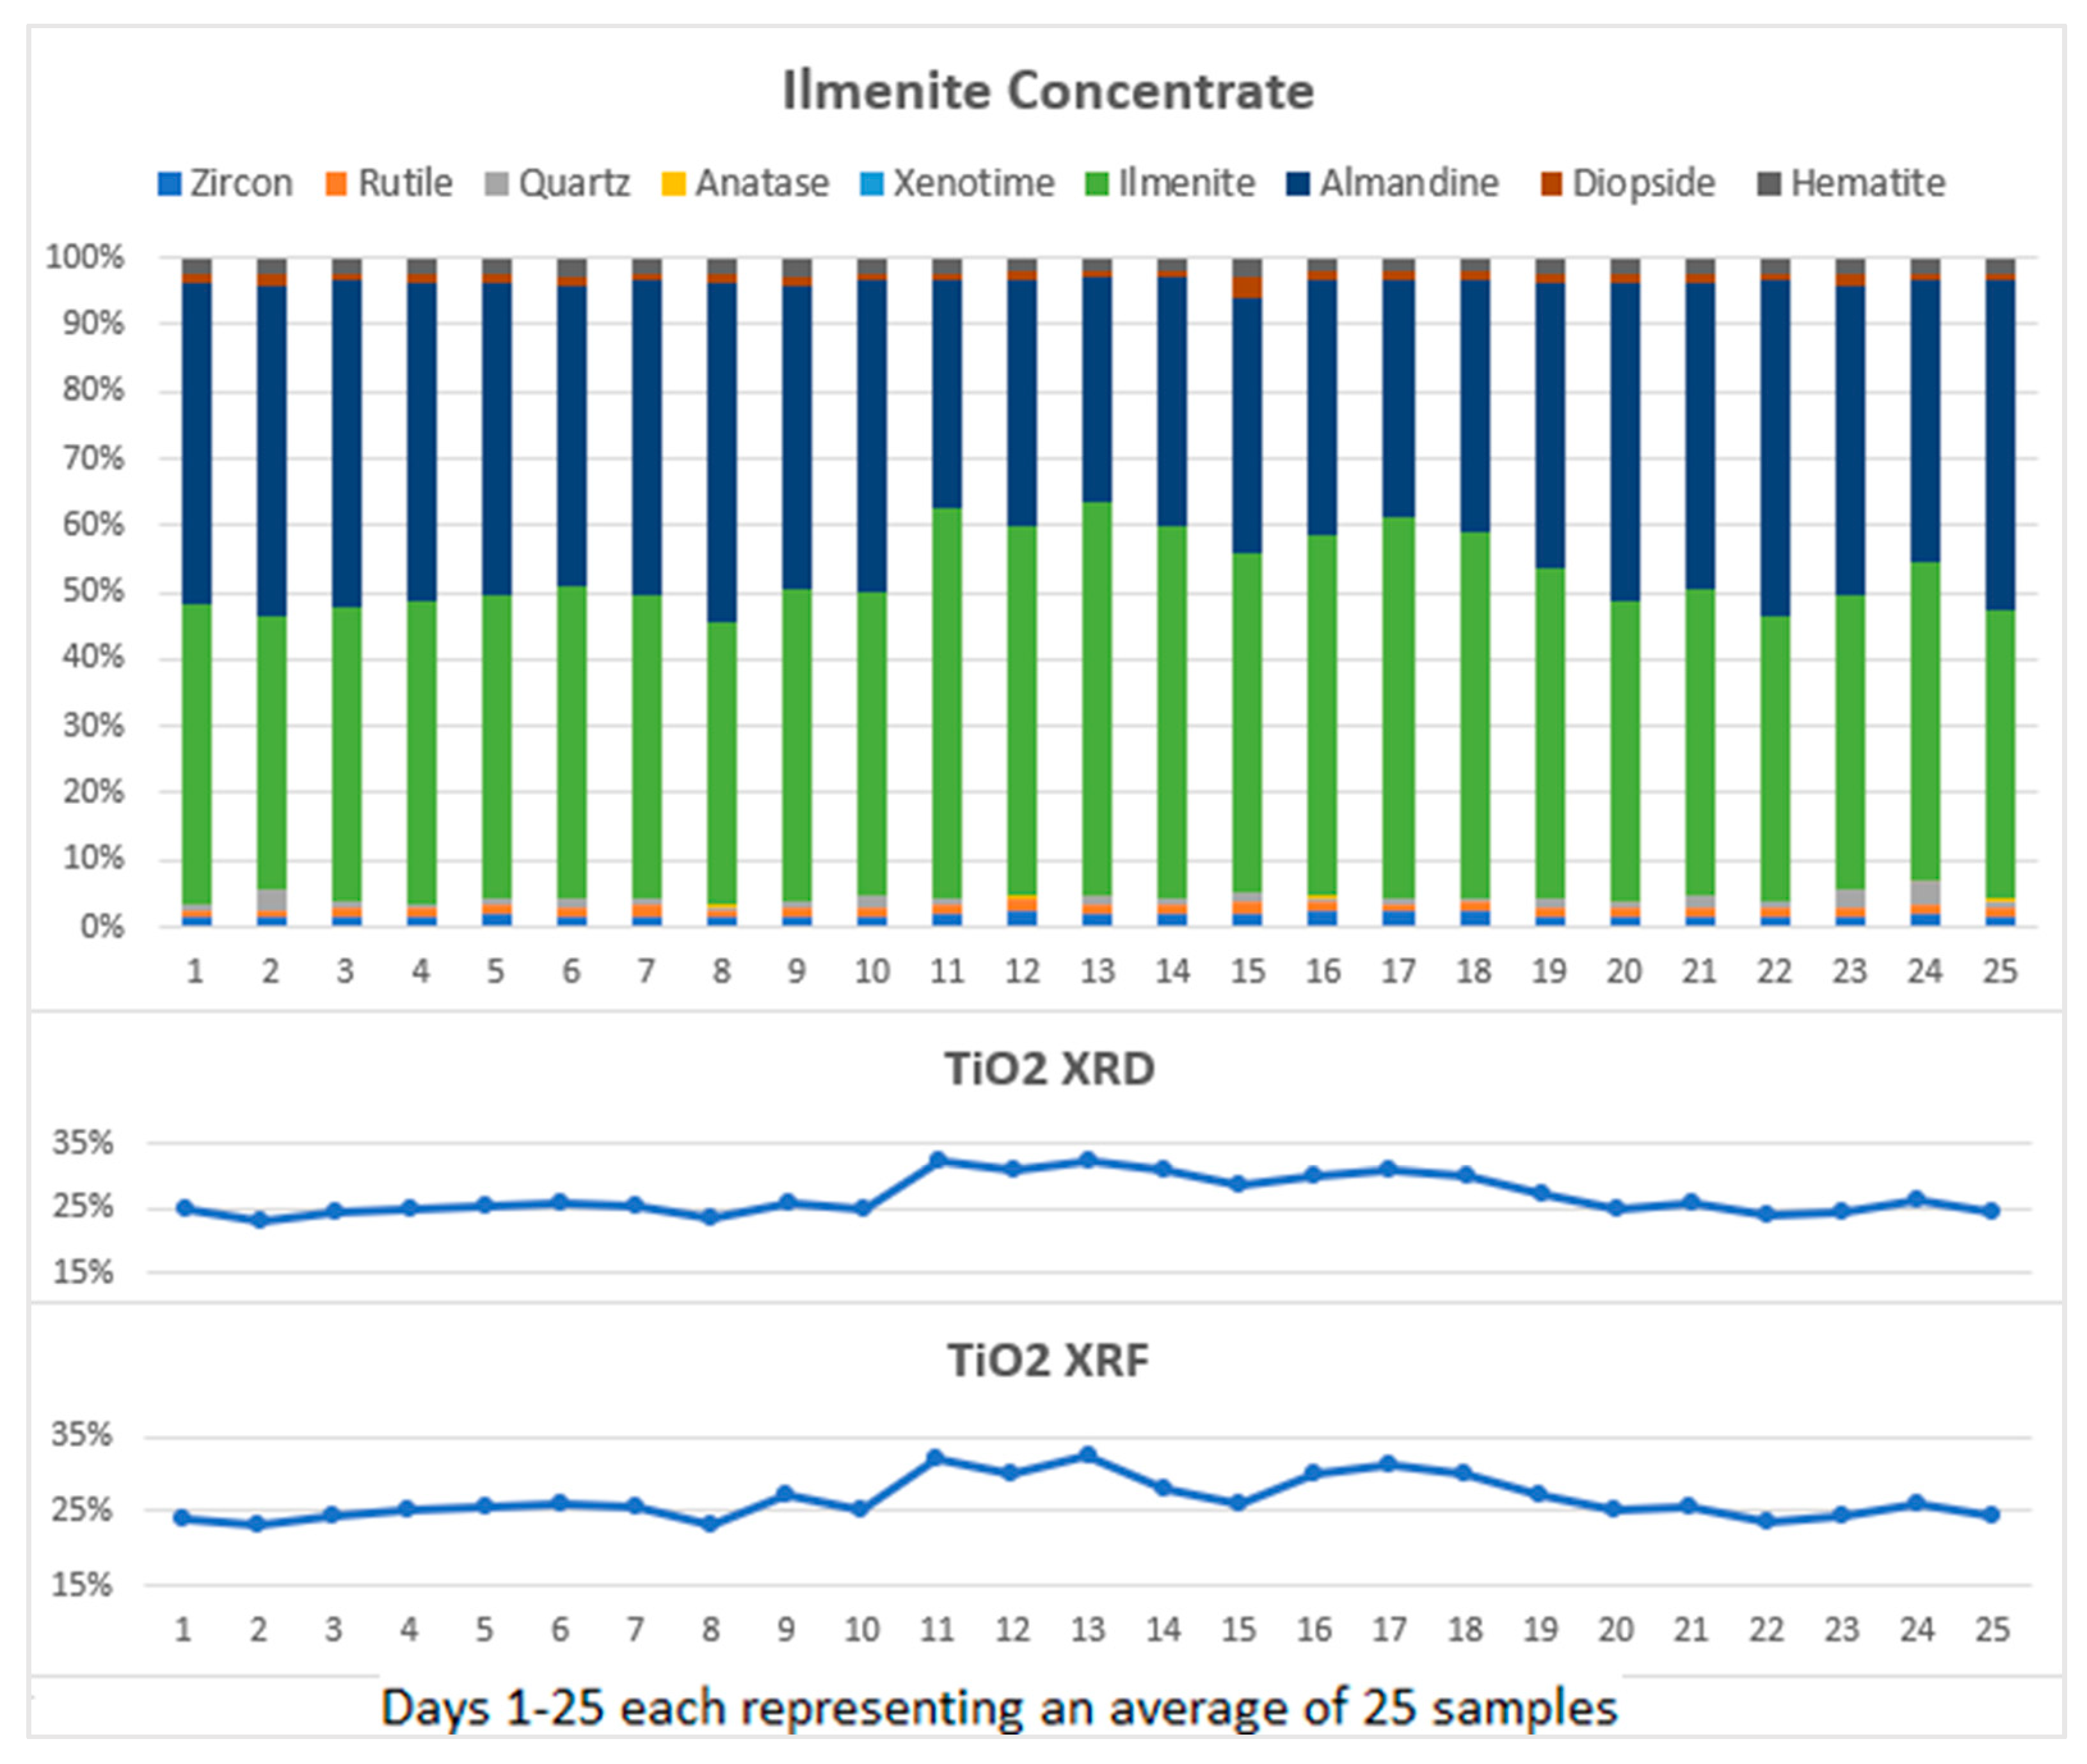
Figure 9 shows the quantitative results of the heavy minerals content in the ilmenite product over several days. In this example of samples mainly containing ilmenite and garnet, the comparison of weight % TiO
2 between XRF analysis and TiO
2 content recalculated from Rietveld refinement results is a suitable indicator of the accuracy and relevance of using XRD for quantification of mineral content.
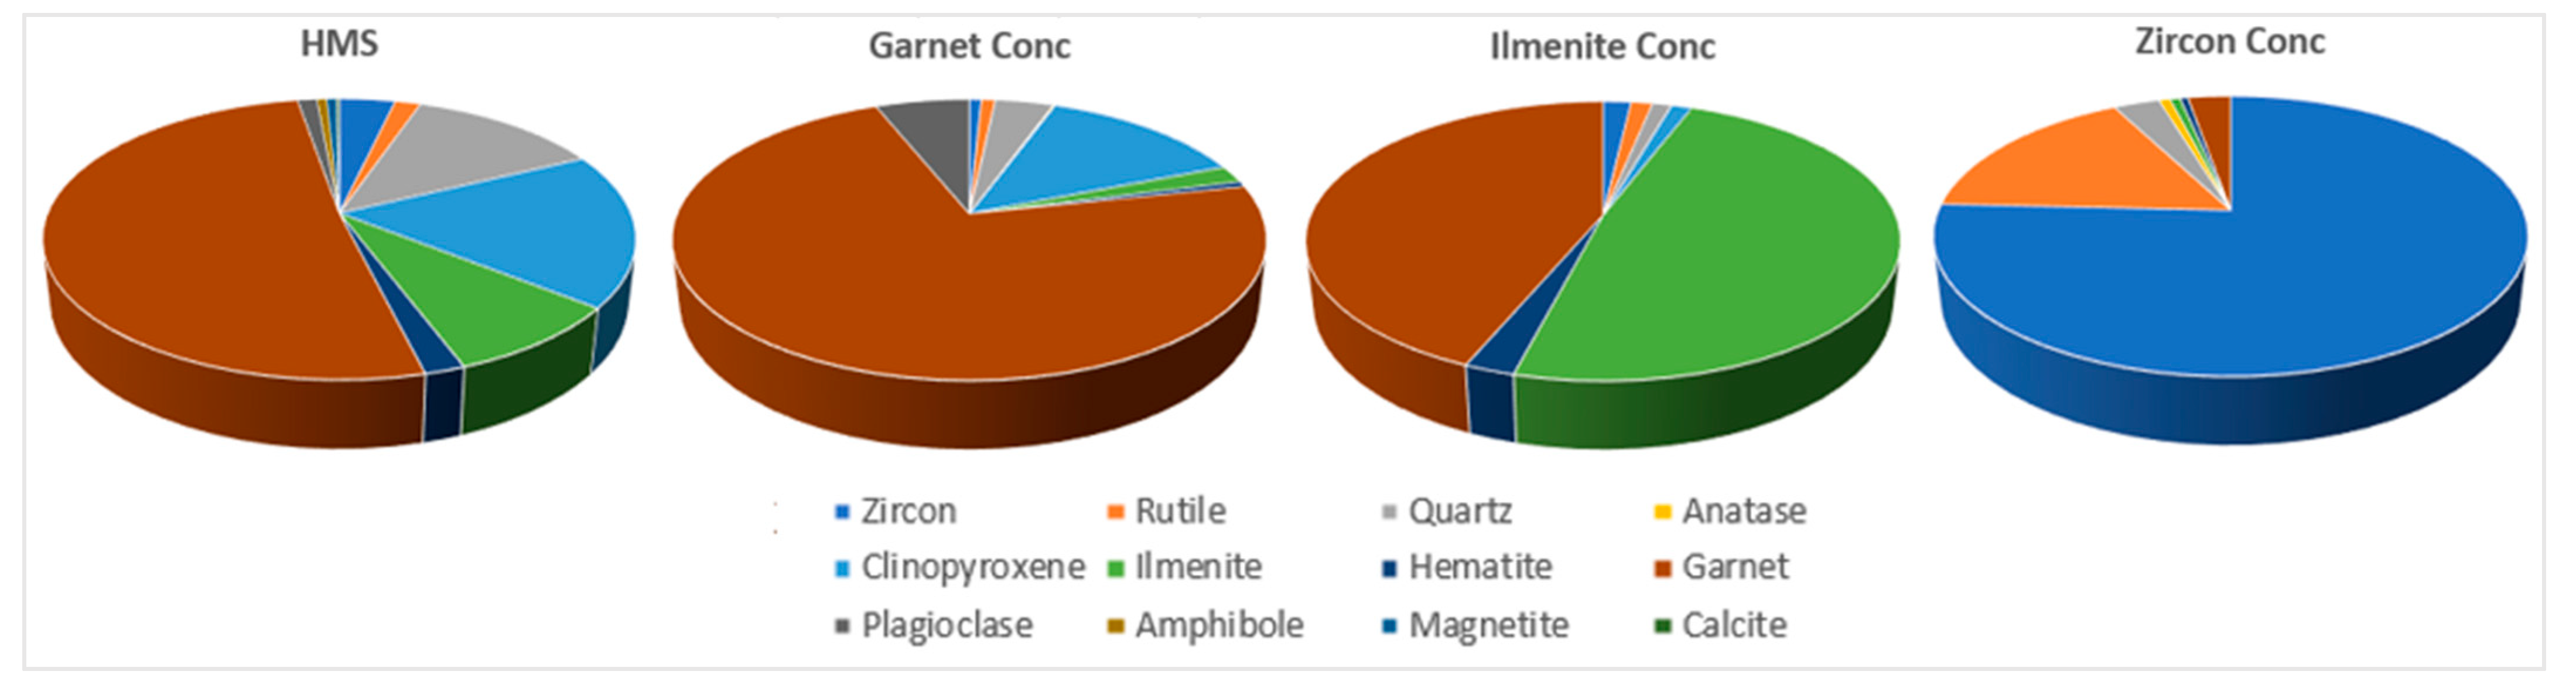
Similar scenarios apply to the garnet and zircon products. Average mineral abundances obtained over time can be used to predict and optimize shipment blends and compositions to match target values (see
Figure 10 and
Table 1).
3.3. Case Study III: Process Control during Ilmenite Smelting
Ilmenite smelting is one of the methods to upgrade the iron-titanium oxide mineral ilmenite (FeTiO
3) to a high-titanium feedstock for rutile pigment manufacture. In ilmenite smelting, the FeO content of the feed material (FeO·TiO
2) is decreased by reduction with carbon. In a parallel reaction, a significant amount of TiO
2 is reduced to Ti
2O
3. The amount of Ti
2O
3 is an important parameter to control the smelting process to produce an acceptable slag product on a consistent basis, [
11,
12,
13]. Improving the understanding of a slag product, and the factors relevant in the production of a liquid slag leads to more efficiency in the smelting process.
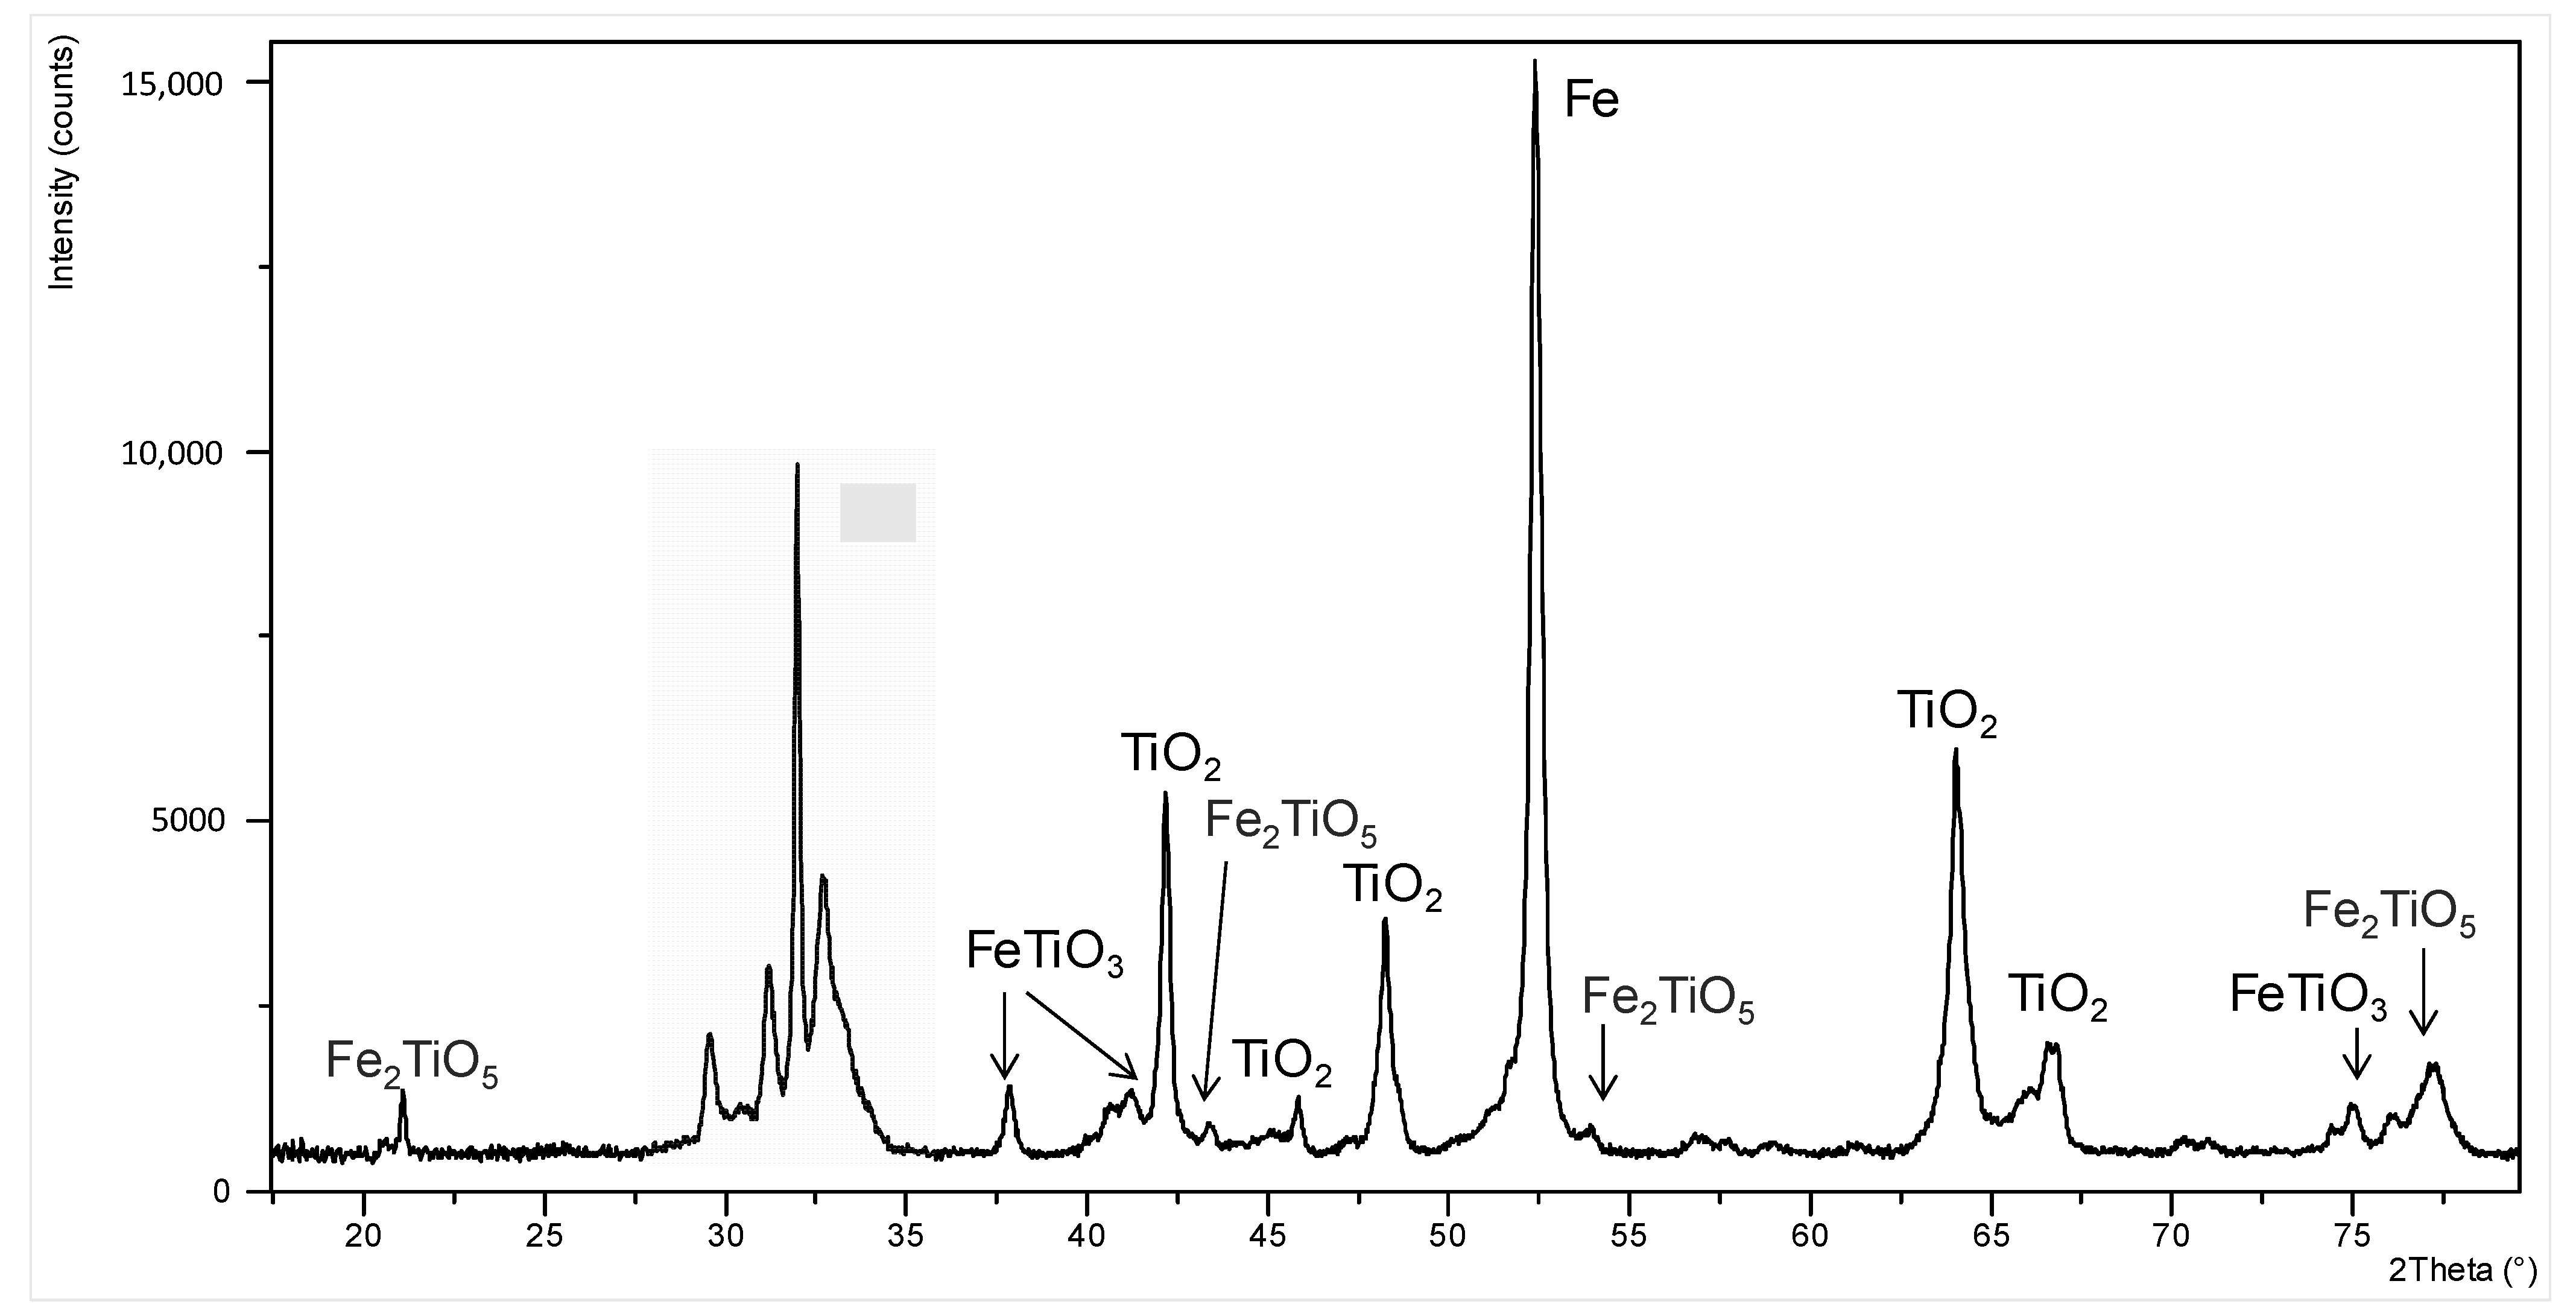
The XRD pattern shown in
Figure 11 represents a pattern of a reduced ilmenite sample. Ilmenite was reduced to predominantly rutile (TiO
2) and metallic iron. Besides metallic Fe (peak at approximately 52.5°2θ) most phases in the reduced ilmenite are titanium-based.
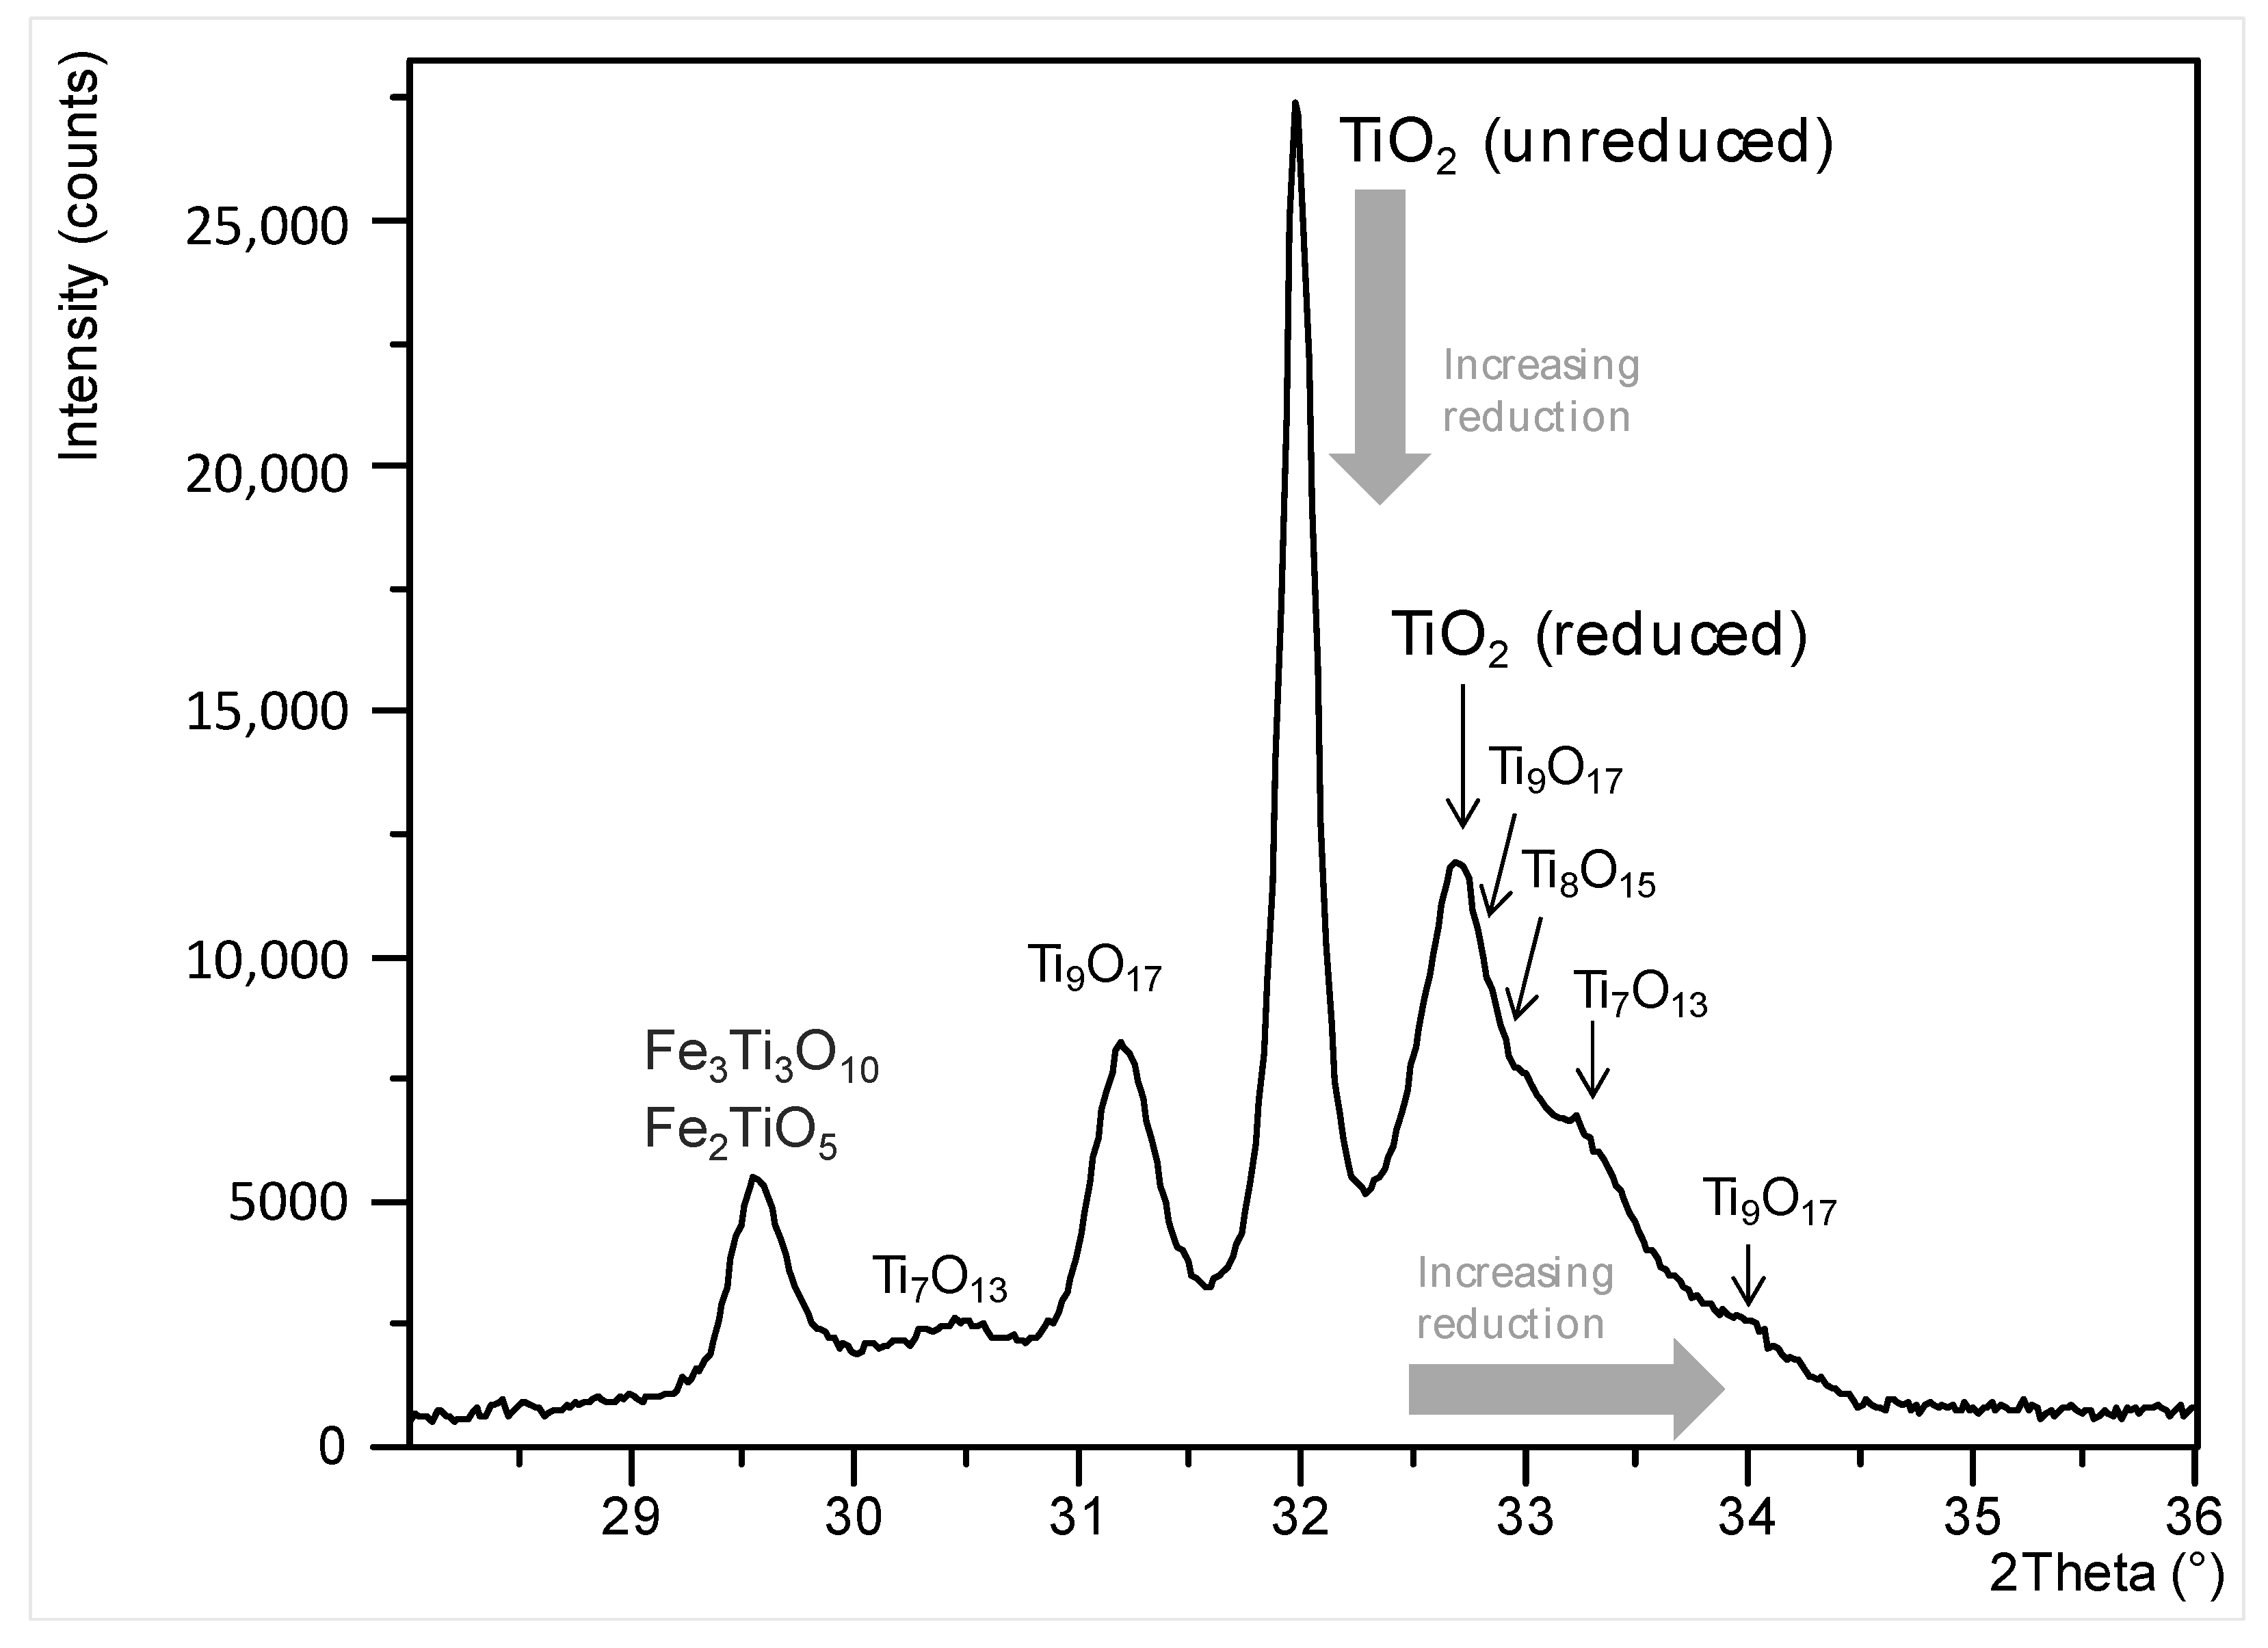
A significant variation in the different titanium phases was observed in the range 29° ≤ 2θ ≤ 35°. In the zoomed view in
Figure 12 series of satellite reflections, so-called Magnéli phase reflections [
14] are detected around the main unreduced rutile peak. These subpatterns are partly superposed. Magnéli phases are a suite of super-lattices derived from the rutile structure due to systematic oxygen vacancies. They have stoichiometries of Ti
nO
2n−1 where n ≥ 4. In the limit of large n, the stoichiometry approaches that of rutile. Magnéli phases form in high temperatures under reducing kiln conditions, which are required to produce synthetic rutile of higher grade (i.e., higher titanium content) at commercially reasonable throughputs [
15]. In a well-run kiln, the unreduced rutile peak at 32.0°2θ is less intense than the satellite peaks from partially reduced rutile. The peak at approximately 32.6°2θ is caused by reduced rutile. As the degree of reduction increases, the peak shift to higher 2θ values and forms doublets with highly reduced material. Therefore, the degree of reduction during the smelting process can be estimated by:
- (a)
Intensity ratio between the unreduced rutile peak and the reduced rutile peaks
- (b)
Peak position of the reduced rutile peak and the shifts of the Magnéli peaks towards higher 2θ values.
Future work will focus on a full pattern Rietveld quantification of the different titanium oxides, especially the various Magnéli phases. This requires structural data of all phases present. A quantification of the different phases will enable even more efficiency during Ti slag production.
4. Conclusions
All three case studies demonstrated that XRD is a fast, accurate and flexible method to monitor heavy mineral mining and processing. Cluster analysis can be used to monitor and control the performance of spirals for heavy mineral concentration. The quantification of the heavy minerals during separation ensures optimal product quality and efficient stockpiling and processing. Knowledge about the degree of reduction during ilmenite smelting ensures optimal kiln operation and energy consumption. Monitoring of the different titanium oxide phases can help to produce high-quality titanium slag.
Insights into the mineralogical composition of material streams during heavy mineral processing allows fast counteractions on changing raw materials and process conditions during concentration, separation and smelting.
Author Contributions
Conceptualization, U.K. and S.M.C.V.; methodology, U.K. and S.M.C.V.; validation, U.K. and S.M.C.V.; formal analysis, U.K. and S.M.C.V.; investigation, U.K. and S.M.C.V.; resources, U.K. and S.M.C.V.; data curation, U.K. and S.M.C.V.; writing—original draft preparation, U.K. and S.M.C.V.; writing—review and editing, U.K. and S.M.C.V.; visualization, U.K. and S.M.C.V.; supervision, U.K. and S.M.C.V.; project administration, U.K. and S.M.C.V. All authors have read and agreed to the published version of the manuscript.
Funding
This research received no external funding.
Data Availability Statement
All data were gathered and treated at XRD Analytical and Consulting in Pretoria (South Africa) and Malvern Panalytical B.V laboratories in Almelo (The Netherlands).
Conflicts of Interest
The authors declare no conflict of interest.
References
- König, U.; Spicer, E. X-ray Diffraction (XRD) as fast industrial analysis method for heavy mineral sands in process control and automation–Rietveld refinement and data clustering. In Proceedings of the 6th International Heavy Minerals Conference, Zulu Hluhluwe, South Africa, 10–14 September 2007; pp. 189–195. [Google Scholar]
- Spicer, S.M.C.; Verryn, S.; Deysel, K. Analysis of Heavy Mineral Sands by Quantitative X-Ray Powder Diffraction and Mineral Liberation Analyser—Implications for Process Control. ICAM Aust. 2008, 1, 8–10. [Google Scholar]
- König, U. Applications of X-ray diffraction in heavy mineral processing–Potential implications for concentration and ilmenite reduction. In Proceedings of the 9th International Heavy Minerals Conference, Visakhapatnam, India, 27–29 November 2013; paper 1315. Volume 1. 10p. [Google Scholar]
- Available online: http://www.crystallography.net/cod/ (accessed on 13 August 2021).
- Degen, T.; Sadki, M.; Bron, E.; König, U.; Nénert, G. The HighScore suite. Powder Diffr. 2014, 29 (Suppl. S2), S13–S18. [Google Scholar] [CrossRef] [Green Version]
- Rietveld, H.M. A profile refinement method for nuclear and magnetic structures. J. Appl. Cryst. 1969, 2, 65–71. [Google Scholar] [CrossRef]
- Rietveld, H.M. Line profiles of neutron powder diffraction peaks for structure refinement. Acta Crystallogr. 1967, 22, 151–152. [Google Scholar] [CrossRef]
- Young, R.A. The Rietveld Method; International Union of Crystallography; Oxford University Press: Oxford, UK, 1993; 298p. [Google Scholar]
- Kelley, L.A.; Gardner, S.P.; Sutcliffe, M.J. An automated approach for clustering an ensemble of NMR-derived protein structures into conformational-related subfamilies. Protein Eng. 1996, 9, 1063–1065. [Google Scholar] [CrossRef] [PubMed] [Green Version]
- Liao, B.; Chen, J. The application of cluster analysis in X-ray diffraction phase analysis. J.Appl. Cryst. 1992, 25, 336–339. [Google Scholar] [CrossRef] [Green Version]
- Zietsman, J.H.; Pistorious, P.C. Process mechanism in ilmenite smelting. J. South Afr. Inst. Min. Metall. 2004, 105, 653–660. [Google Scholar]
- Pistorius, P.C. Ilmenite smelting: The basics. J. South Afr. Inst. Min. Metall. 2008, 108, 35–43. [Google Scholar]
- Gupta, A.K.; Aula, M.; Pihlasalo, J.; Mäkelä, P.; Huttula, M.; Fabritius, T. Preparation of synthetic titania slag relevant to the industrial smelting process using an introduction furnace. Appl. Sci. 2021, 11, 1153. [Google Scholar] [CrossRef]
- Anderson, S.; Collen, B.; Kruuse, G.; Kuylenstierna, U.; Magneli, A.; Pestmalis, H.; Asbrink, S. Identification of titanium oxides by X-ray powder patterns. Acta Chem. Scand. 1957, 11, 1653. [Google Scholar] [CrossRef]
- Pax, R.A.; Steward, G.A. Quantitative determination of phases using Mossbauer spectroscopy and X-ray diffraction: A case study of the Fe-Ti-O system. In Proceedings of the 36th Annual Condensed Matter and Materials Meeting 2012, Wagga Wagga, NSW, Australia, 31 January–3 February 2012. [Google Scholar]
Figure 1.
Simplified flowsheet for the process of heavy mineral separation and TiO2 production. Left triangles = intermediate and final products, middle = process flow, right triangles = by-products or waste. Stars indicate the case studies investigated in this paper.
Figure 1.
Simplified flowsheet for the process of heavy mineral separation and TiO2 production. Left triangles = intermediate and final products, middle = process flow, right triangles = by-products or waste. Stars indicate the case studies investigated in this paper.
Figure 2.
Simplified flow sheet of spiral separation of heavy minerals.
Figure 2.
Simplified flow sheet of spiral separation of heavy minerals.
Figure 3.
(a) 3D PCA score plot for the cluster analysis of 46 samples from a wet concentration plant, illustrated in three views. The three axes represent the three most important principal components explaining a major part of the total overall variance in the correlation matrix. The covered total variance is 94.95%. (b) Corresponding dendrogram with agglomerative hierarchical cluster analysis showing the scans in different classes defined by their similarity and vertical cut-off lines. Each dataset is connected by a tie bar to another dataset or to a cluster. The horizontal length of the tie bars is proportional to the dissimilarity (x-axis). The color of the spheres indicates the cluster they belong to. The *** after a scan name indicates the most representative scan of a cluster. The + after a scan name indicates the two most different (outlying) scans within one cluster. Each dot represents one measurement. All measurements are compared with each other to find similarities.
Figure 4.
Simplified flow sheet of heavy mineral separation.
Figure 4.
Simplified flow sheet of heavy mineral separation.
Figure 5.
Typical Heavy Mineral Concentrate (HMC). Rietveld quantification (top) including the difference plot between measured and calculated profiles, as well as the Rwp (bottom).
Figure 5.
Typical Heavy Mineral Concentrate (HMC). Rietveld quantification (top) including the difference plot between measured and calculated profiles, as well as the Rwp (bottom).
Figure 6.
Typical ilmenite concentrate. Rietveld quantification (top) including difference plot between measured and calculated profiles, as well as the Rwp (bottom).
Figure 6.
Typical ilmenite concentrate. Rietveld quantification (top) including difference plot between measured and calculated profiles, as well as the Rwp (bottom).
Figure 7.
Typical garnet concentrate. Rietveld quantification (top) including difference plot between measured and calculated profiles as well as the Rwp (bottom).
Figure 7.
Typical garnet concentrate. Rietveld quantification (top) including difference plot between measured and calculated profiles as well as the Rwp (bottom).
Figure 8.
Typical zircon concentrate. Rietveld quantification (top) including difference plot between measured and calculated profiles as well as the Rwp (bottom).
Figure 8.
Typical zircon concentrate. Rietveld quantification (top) including difference plot between measured and calculated profiles as well as the Rwp (bottom).
Figure 9.
Variation of mineral compositions (wt%) of ilmenite concentrate, TiO2 content (wt%) calculated from XRD results, as well as determined by XRF of 25 samples representing 25 days, (x-axis).
Figure 9.
Variation of mineral compositions (wt%) of ilmenite concentrate, TiO2 content (wt%) calculated from XRD results, as well as determined by XRF of 25 samples representing 25 days, (x-axis).
Figure 10.
Average mineral abundancies of HMC and product streams of 25 weekly composite samples each.
Figure 10.
Average mineral abundancies of HMC and product streams of 25 weekly composite samples each.
Figure 11.
Phase identification for a reduced ilmenite sample, gray = detailed view
Figure 12.
Figure 11.
Phase identification for a reduced ilmenite sample, gray = detailed view
Figure 12.
Figure 12.
Detailed measurement showing different titanium oxides of a reduced ilmenite sample.
Figure 12.
Detailed measurement showing different titanium oxides of a reduced ilmenite sample.
Table 1.
Average mineral abundancies (weight%) of 25 weekly composite samples each, and target values.
Table 1.
Average mineral abundancies (weight%) of 25 weekly composite samples each, and target values.
| | Ilmenite Concentrate | Garnet Concentrate | Zircon Concentrate |
|---|
| | Product Average | Target Value | Product Average | Target Value | Product Average | Target Value |
|---|
| Zircon | 2 | 0–4 | 1 | | 76 | >67 |
| Rutile | 1 | 0–3 | 1 | | 17 | >15 |
| Quartz | 1 | | 4 | | 3 | |
| Anatase | 0 | | 0 | | 1 | |
| Clinopyroxene | 1 | | 13 | | 0 | |
| Ilmenite | 46 | 35–55 | 2 | | 1 | |
| Hematite | 2 | | 1 | | 1 | |
| Garnet | 46 | 45–54 | 72 | 70–75 | 3 | |
| Plagioclase | 0 | | 6 | | 0 | |
| Publisher’s Note: MDPI stays neutral with regard to jurisdictional claims in published maps and institutional affiliations. |
© 2021 by the authors. Licensee MDPI, Basel, Switzerland. This article is an open access article distributed under the terms and conditions of the Creative Commons Attribution (CC BY) license (https://creativecommons.org/licenses/by/4.0/).


