Article

Intermittent Beginning to the Formation of Hydrogenous Ferromanganese Nodules in the Vast Field: Insights from Multi-Element Chemostratigraphy Using Microfocus X-ray Fluorescence

1
Ocean Resources Research Center for Next Generation (ORCeNG), Chiba Institute of Technology, Chiba 275-0016, Japan
2
Frontier Research Center for Energy and Resources (FRCER), School of Engineering, The University of Tokyo, Tokyo 113-8656, Japan
3
Department of Systems Innovation, School of Engineering, The University of Tokyo, Tokyo 113-8656, Japan
4
Graduate School of Human and Environmental Studies, Kyoto University, Kyoto 606-8501, Japan
*
Author to whom correspondence should be addressed.
Minerals 2021, 11(11), 1246; https://doi.org/10.3390/min11111246
Submission received: 22 September 2021 / Revised: 30 October 2021 / Accepted: 7 November 2021 / Published: 10 November 2021

Abstract

:
Vast ferromanganese nodule fields have been found on the deep-sea floor of all oceans worldwide. They have received attention because they potentially provide high-grade metal resources to develop future high- and green-technology. However, how these vast nodule fields were formed and developed owing to their widespread nature or tendency to be denser with an increasing number of nodules has not yet been established. In this study, the fine-scale inner structure of nodules of various sizes was analyzed on the basis of chemical mapping using microfocus X-ray fluorescence. We found that nodules distributed in the vast field around Minamitorishima (Marcus) Island have several types of innermost layers, which correspond to different chemostratigraphic layers of nodules that have been previously reported by us in this region. As nodules grow in order from the center to the outside, the different types in the innermost layer indicate a difference in the timing of the beginning of their growth. Moreover, because the differences in the chemical features of each layer reflect differences in the composition of the original deep-sea water, our results imply that the beginning of nodule formation occurred intermittently at each time of a water mass replacement due to new deep-sea currents flowing into this region. We recognized that the northern part of the study area was dominated by large nodules that started to grow in relatively earlier times, while the southern part tended to have many nodules that grew in relatively later times. Based on these observations, we hypothesize that the intermittent beginning of nodule formation is governed by the northward inflow of the deep-sea current that originated from the Lower Circumpolar Deep Water for an extended time to form the vast nodule field. Because patterns in the timing of nodule formation were different in the eastern and western regions, we thus further propose that the topographic framework, i.e., the arrangement of individual large seamounts and the cluster of small knolls and petit-spot volcanoes, strongly regulates the flow path of the deep-sea current, even if the position of the entire seamount changes owing to plate motion. The deep-sea current might supply some materials to be nuclei, resulting in the nodule formation at the beginning of the process.

1. Introduction

Ferromanganese nodules are considered a prospective resource for critical metals, particularly for Co, Ni, Mo, W and rare-earth elements. Large nodule fields have been found in the Clarion–Clipperton Zone, the Peru and Penrhyn–Samoa Basins, the region around Minamitorishima (Marcus) Island in the Pacific Ocean, and the Central Indian Ocean basin [1,2,3,4,5]; However, the mechanism of the formation of these vast nodule fields has not been elucidated. Although several styles of the grain size distribution (e.g., homogeneous or bimodal) for the dense nodule field were observed [5,6,7,8,9,10], the critical factor has not yet been constrained.
The Japanese exclusive economic zone (EEZ) surrounding Minamitorishima Island (Figure 1), hereafter referred to as the Minamitorishima EEZ, is located on the northern margin of the Prime Crust Zone in the western Pacific [11,12]. The Minamitorishima EEZ is considered to be one of the most prospective areas of the field that is densely covered by hydrogenous ferromanganese nodules [3]. Recent fine-scale chemostratigraphic observations on the basis of microfocus X-ray fluorescence (µ-XRF) mapping of the entire cross-section of hydrogenous nodule samples [13] revealed that Fe, Mn, and Ti distributions represent major oxide or oxyhydroxide phases. On the other hand, the distribution of P, Si, and Cu represent the contribution of biogenic or pelagic sediment components filling the non-oxide and -oxyhydroxide portions. Based on these chemical fingerprints, it has been demonstrated that element(s) characterizing the individual ferromanganese layers of nodules can be visualized by a “multichemical feature map” which is constructed by merging the compositional maps for Fe, Mn, Ti, P, Si, and Cu into a single map. While identifying each layer using a multichemical feature map it was evident that a general pattern of the layer structure, forming nine chemically characteristic layers, was common throughout the growth history of the nodules in the entire regions of Minamitorishima EEZ [13]. As discussed by Machida et al. [14], the structure of the ferromanganese layers of nodules in the Minamitorishima EEZ is the same as that of the ferromanganese crust on seamounts or knolls in the Prime Crust Zone [15,16,17,18,19]. This implies that a common deep-sea water mass had contributed to the formation of hydrogenous nodules and crusts across a vast region of the western Pacific. Currently, the Lower Circumpolar Deep Water (LCDW), flowing through the southern edge of the Minamitorishima EEZ region, acts as the western branch current of the Deep Western Boundary Current (DWBC) (Figure 1) [20,21,22]. Although the main DWBC flows into the region from the southern direction and flows out in the northwest, descendent flow is expected to pass through the area from the south to the north. In this study, we evaluated whether the water-mass transformation history of the LCDW can be represented as the structural change of ferromanganese nodules in this region.
A recent exhaustive structural analysis of nodules collected from the Minamitorishima EEZ using X-ray computed tomography (CT) revealed that the size of nodules is regulated by the total thickness of the ferromanganese layers of the nodules [23]. This leads us to consider that, if we can identify the innermost layer (i.e., the layer around the nuclei) of each different-sized nodule using the multichemical feature map, we can examine the relationship between the timing of initiation of nodule formation and the water-mass transformation history of the DWBC in this region. Here, we report the results of µ-XRF mapping of the cross-section of nodule samples covering the observed size variation around Minamitorishima Island. Based on the results, we discuss the causality of the beginning of nodule formation in terms of deep-sea currents to form the vast nodule field around Minamitorishima Island.

2. Materials and Methods

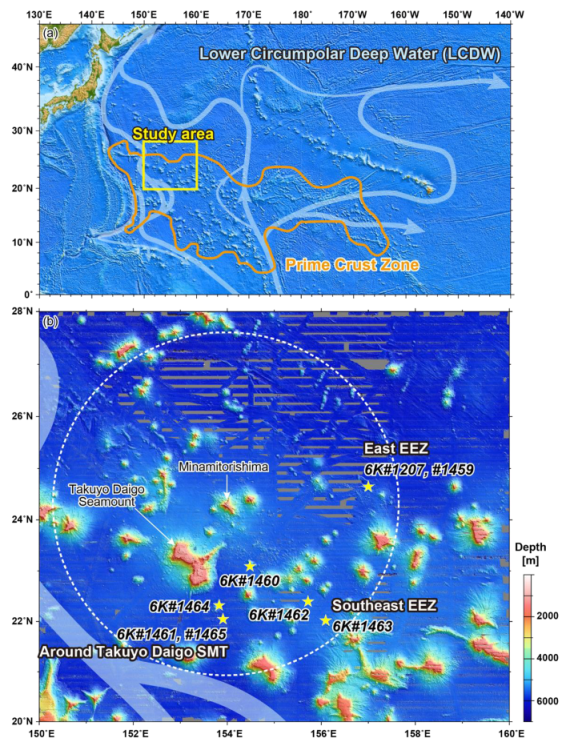
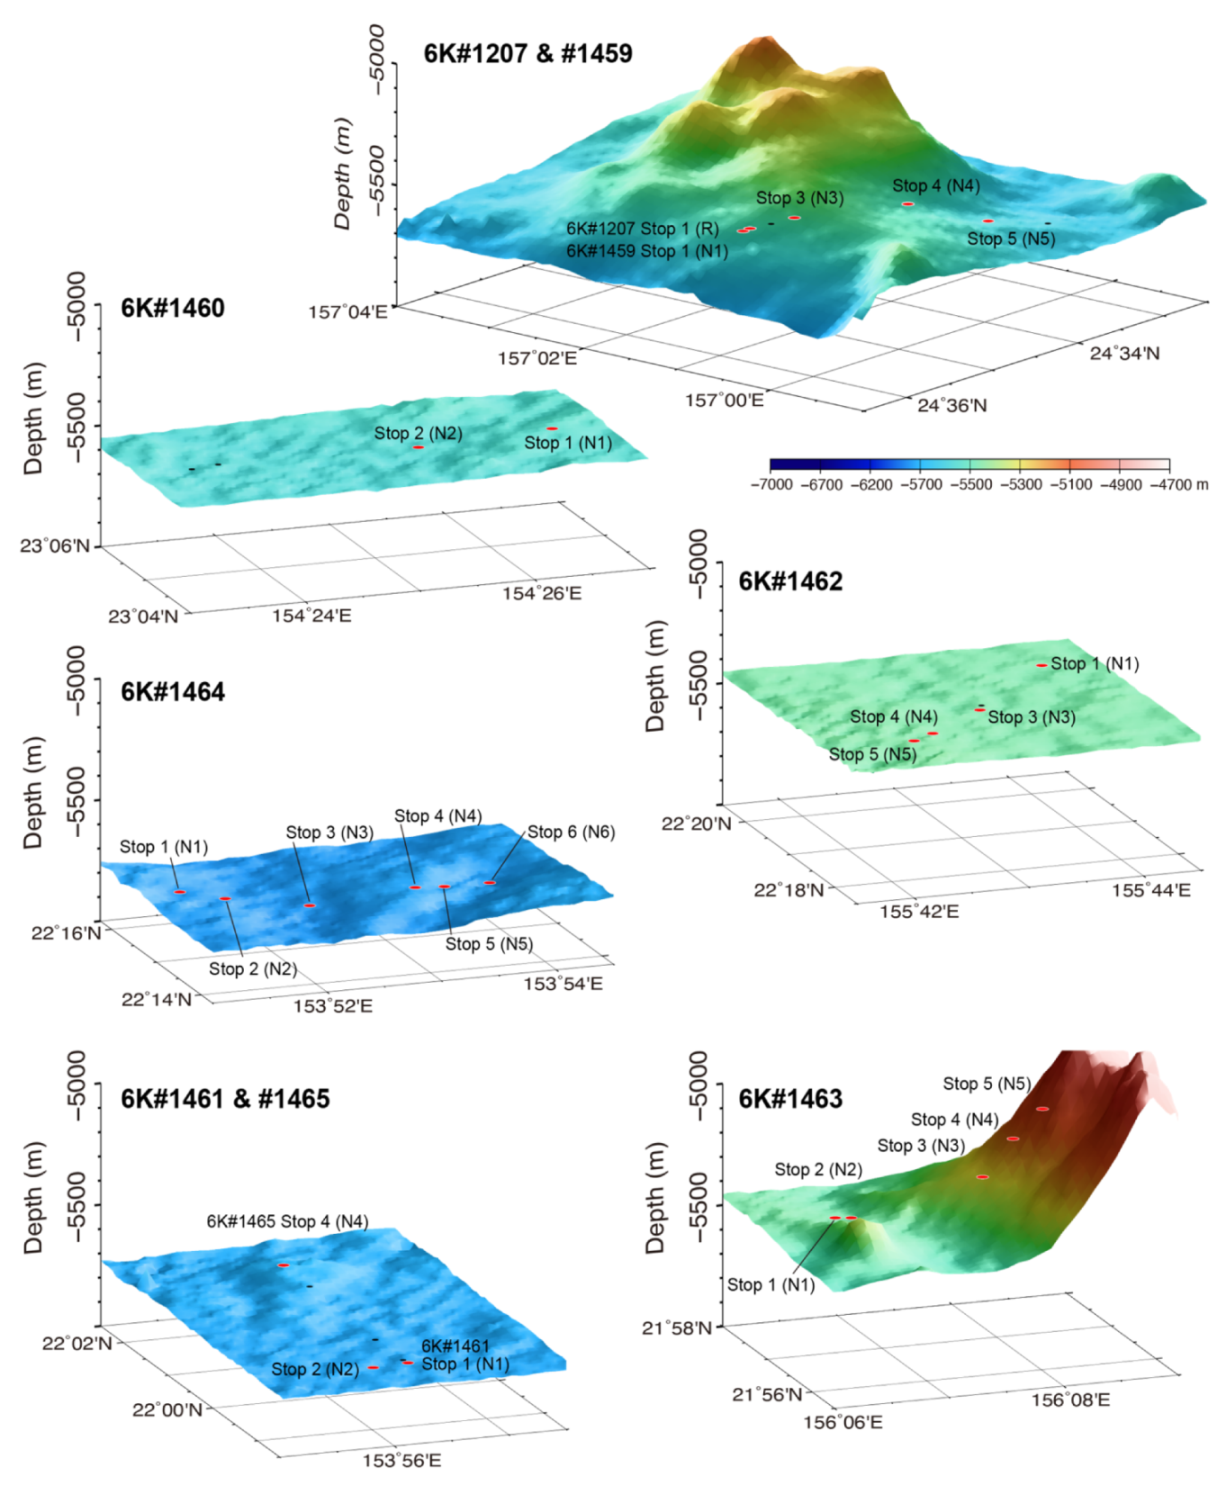
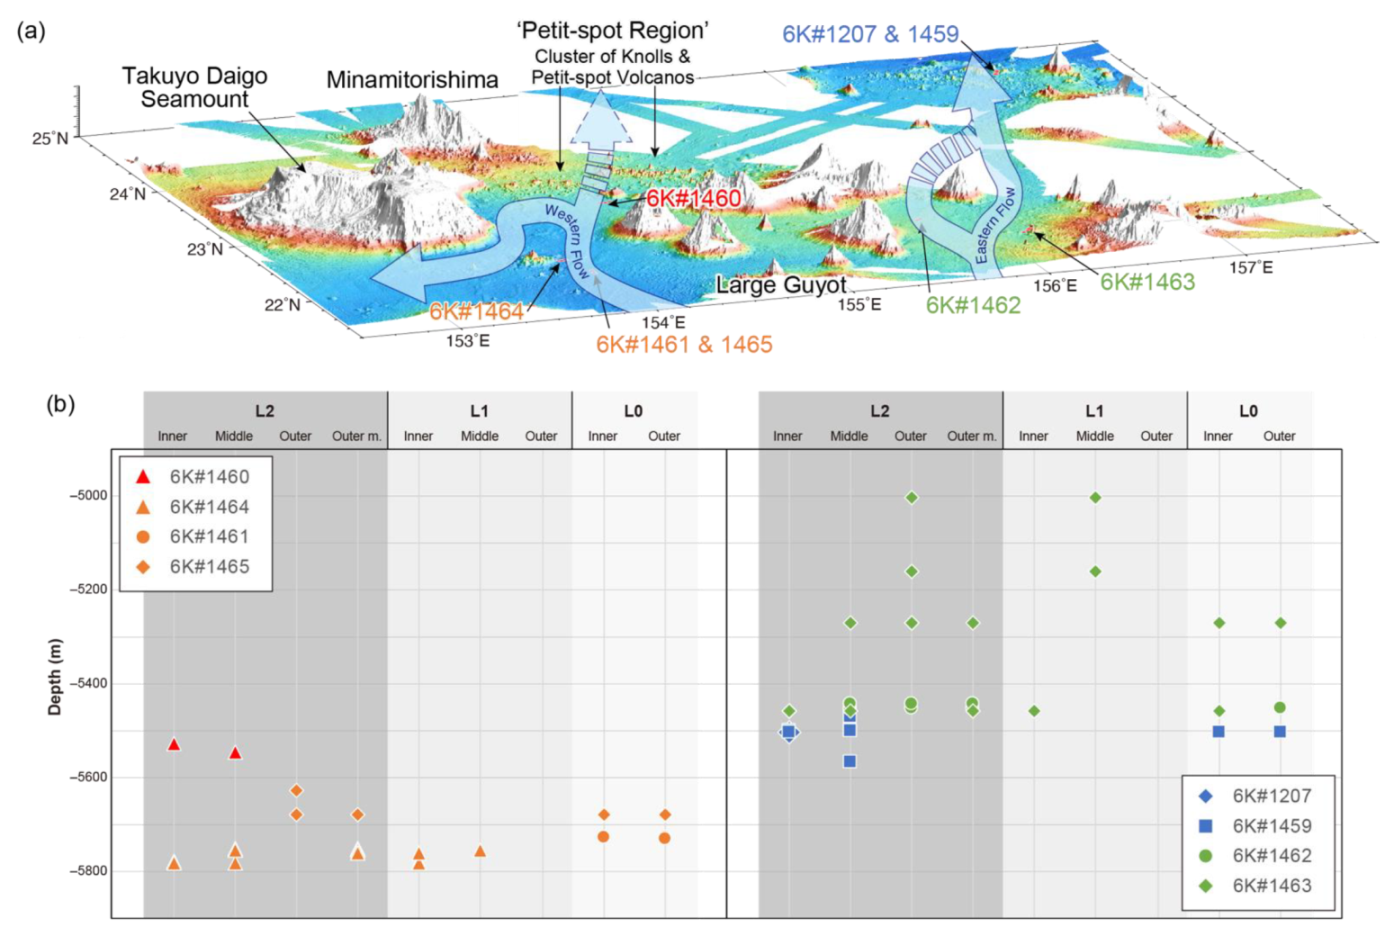
2.1. General Description of the Sampling Sites

The samples analyzed in this study were collected during seven dives of the submersible SHINKAI 6500 during cruise YK16-01 of the R/V Yokosuka in the Minamitorishima EEZ (Figure 1 and Figure 2) [3,13]. The 6K#1459, 6K#1462 and 6K#1463 dives sampled from the nodule-dense area (i.e., high acoustic backscatter intensity area), which lies near the eastern to southeastern edge of the EEZ, hereafter are referred to as the “East EEZ region” and “Southeast EEZ region” as according to Machida et al. [13]. In contrast, the 6K#1460, 6K#1461, 6K#1464 and 6K#1465 dives sampled from the nodule-dense area of the eastern to southeastern region of the Takuyo Daigo seamount are hereafter referred to as “Around Takuyo Daigo Seamount region” as according to Machida et al. [13]. As described in the following section, we covered representative samples with various layer thicknesses collected from each site. The size of the nodules was described on board, where Max.: maximum length, Med.: medium length, and Min.: minimum length (Table 1). In the following sections, we summarize the results obtained during dives at individual areas and the structure of the samples obtained in this study.

2.1.1. East and Southeast EEZ Regions

Areas of high acoustic backscatter intensity are widely distributed in the East and Southeast EEZ regions [5]. Our submersible observations indicate that these represent fields densely covered by ferromanganese nodules. Most of the sampling sites, except for stop 5 of the 6K#1459 dive and stop 4 of the 6K#1463 dive, are classified as Type-H or Type-V facies, which are characterized by high to almost complete coverage by rounded nodules [5]. The other areas were classified as Type-L (stop 5 of the 6K#1459 dive) or Type-M (stop 4 of the 6K#1463 dive) facies, which are characterized by coverage of smaller nodules compared to those in the areas classified as Type-H or Type-V facies [5] (Table 1). Although smaller nodules are also distributed in the areas classified as Type-H or Type-V facies, no small samples were recovered at stops 1–3 of the 6K#1459 dive, the reason for which is because we could not use a scoop for sampling [23].
At Site 6K#1462, there was relatively minor change in the water depth along the dive track (Table 1 and Figure 2). In contrast, during dives 6K#1459 and 6K#1463, variable water depths were observed along the track (Figure 2). In the case of dive 6K#1459, we observed that only small nodules were distributed at deeper parts of the slope of the knoll (stop 5; Table 1 and Figure 2). This is in contrast to dive 6K#1463, where the shallower part of the knoll slope was covered exclusively by small nodules (Table 1 and Figure 2).

2.1.2. Around Takuyo Daigo Seamount Region

Areas of high acoustic backscatter intensity, representing the fields densely covered by ferromanganese nodules, are distributed particularly from east to south of the Takuyo Daigo seamount [5]. Most of the sampling sites, except for stops 1 and 2 of the 6K#1461 dive and stop 4 of the 6K#1465 dive, are classified as Type-H or Type-V facies [5]. Such regions are characterized by high to almost complete coverage by rounded nodules. The areas classified as Type-L facies (stops 1 and 2 of the 6K#1461 dive) and Type-M facies (stop 4 of the 6K#1465 dive) are sparsely covered by small and large nodules, respectively (Table 1). Although small nodules are also distributed in the areas classified as Type-H or Type-V facies, no small samples were recovered at stops 1 and 2 of the 6K#1460 dive. This is because we could not use a scoop for sampling [23], due to strong anchoring of the nodules to the below sediment.
In the Around Takuyo Daigo Seamount region, there is only a minor change in water depth along the dive tracks (Table 1 and Figure 2). Moreover, as demonstrated by Machida et al. [5], we did not observe any systematic correlation between the topographic features (i.e., moat or mound) and distribution density or size variation of the nodules.

2.2. Microfocus X-ray Fluorescence (µ-XRF) Mapping
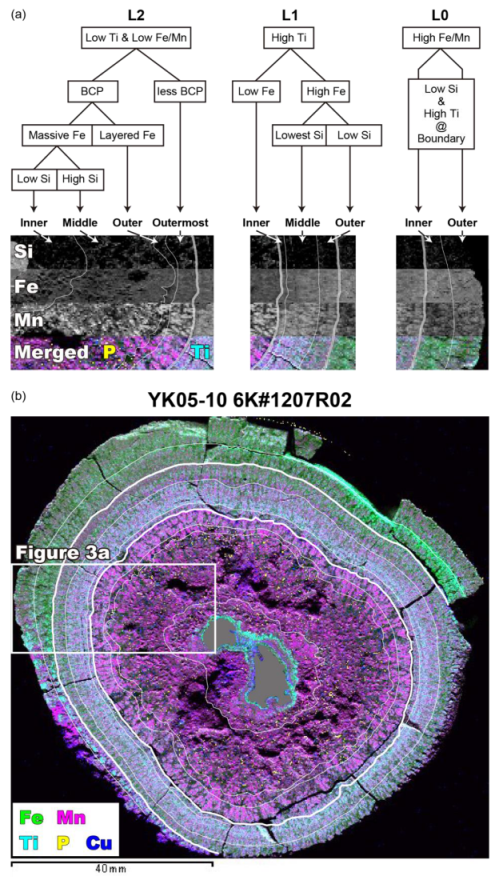
To select samples for µ-XRF mapping, the results of the comprehensive structural observation using X-ray CT scanning [23] were carefully investigated. Nakamura et al. [23] revealed that four distinct layers, which exhibit different ranges of CT numbers (layers I, II, III, and IV) and correspond to different petrological features, are identifiable for all nodules in this region. Accordingly, we selected samples to cover the variation in nodule size and the related structural features (i.e., the number of layers obtained by the CT number criterion proposed by Nakamura et al. [23]) at an individual dive site.
Sample preparation prior to µ-XRF mapping was conducted by the following strategy adopted by Machida et al. [13]. To create a representative cross-section for each sample, the results of the CT scanning [23] were also carefully evaluated for sample sawing. The underside (sediment side) of the nodule was recognized on the basis of sediment attachment on the surface and/or surficial structure of the ferromanganese portion, as observed in the samples taken by the push core [23]. In addition, the vertical and horizontal directions of the sample were determined and reconstructed before CT scanning. Subsequently, all samples were cut vertically; however, in the case of samples consisting of multiple nuclei, priority was given to cutting them along the cross-section through the center of all nuclei, and therefore, some samples could not be cut vertically. Subsequently, the cut surface was ground with a 120-µm diamond disc to eliminate sawing scuff, followed by polishing with a 70-µm diamond disc. Finally, the polished samples were allowed to dry naturally in a well-ventilated location for up to one week.
The μ-XRF analysis was conducted at Kyoto University. The intensities of Al, Ca, Cu, Fe, K, Mg, Mn, Ni, P, Si and Ti were determined using an energy-dispersive X-ray spectrometer (EDS) attached to a µ-XRF spectroscopy (XGT7000V; Horiba, Kyoto, Japan). The analyses were carried out following the methods described by Machida et al. [13]. Multiple measurements were conducted using a tube voltage of 50 kV, a tube current of 0.9 A, and an X-ray beam of 100 µm in vacuo. The samples were scanned at approximately 90–178 µm intervals (pixel size) depending on the range of the mapping area (Table 1). Intensity was determined from the cumulative intensity of the repeated analyses (more than 10 times and up to 15 times), with a total analysis time of 76–543 ms/pixel (Table 1). The analysis results were exported as TIFF-formatted files using the instrument’s operation program. The elemental maps were analyzed using the Image J program.
To create a multichemical feature map of each sample, we conducted the following strategy proposed by Machida et al. [13]. At first, the Fe, Mn, Ti, P, Si, and Cu intensity maps were assigned to colored channels: green, magenta, cyan, yellow, gray, and blue, respectively. They were subsequently merged into a multi-colored map, followed by adjusting the level of each element in the merged image. As mentioned in Machida et al. [13], the Si signals were minimized, consequently improving the visualization of the fundamental ferromanganese oxide layer features and any other elemental stratigraphy.

3. Results

In this section, we describe the results of the layer identification of the nodules using a multichemical feature map. As defined by Machida et al. [13], the nodules from all the regions considered in this study were composed of nine common types of ferromanganese layers (Figure 3). The chemical features defining each layer were elucidated by Machida et al. [13] as follows (Figure 3): The first-order ferromanganese oxide layers (termed “L0”, “L1”, and “L2”) were divided on the basis of Fe, Mn, and Ti content, where the outermost layer L0 was Fe-enriched (high Fe/Mn); the intermediate layer L1 exhibited high-Ti laminations; and the innermost layer L2 was Mn-enriched (low Fe/Mn). The concentration of Mn and the feature on the columnar structure of δ-MnO2 (exhibited by Mn) are the most critical proxies for defining the first-order layers. The first-order layers, L0, L1, and L2, were, respectively, subdivided into two (termed “L0 Outer” and “L0 Inner”), three (termed “L1 Outer”, “L1 Middle”, and “L1 Inner”), and four (termed “L2 Outermost”, “L2 Outer”, “L2 Middle” and “L2 Inner”) layers on the basis of a combination of features observed in the distribution of Fe, Mn, Ti, P, and Si [13] (Figure 3). As mentioned in Machida et al. [13], layer L1 might represent a key layer. In particular, we note that layer L1 Inner was easy to identify because it exhibits unique features such as high-Ti and the lowest-Si content. In contrast, a large number of small particles of biogenic calcium phosphate (BCP) (high P spots) is a useful indicator of the inner sublayers of L2 (i.e., from L2 Inner to L2 Outer). These layer definition criteria are the basis for deconvolution of the multichemical feature map. The multichemical feature maps of the representative samples are shown in Figure 4, and all samples are shown in Figures S1–S5. A summary of the layer identification process using the multichemical feature map is presented in Figure 5.

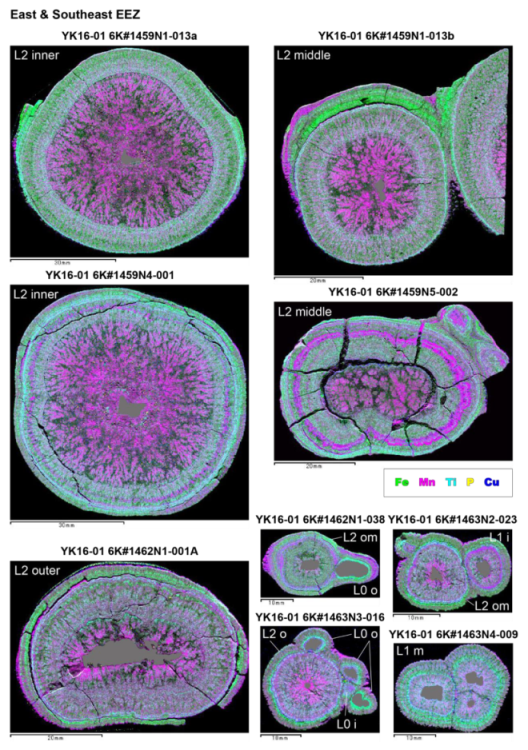
3.1. East and Southeast EEZ Regions

Although the innermost layer of the large nodules from sites 6K#1207 and 6K#1459 in the East EEZ region should be the layer L2 Inner, as described in Machida et al. [13,14], the multichemical feature map clearly demonstrated that several samples (e.g., 6K#1459N1-007 and 6K#1459N1-013b) lacked the layer L2 Inner (Figure 4 and Figure S1). In the case of 6K#1459N1-013 (Figure 4), the layer L0 Outer was found to envelope the outermost layers of the two different types of nodules with varying innermost layers. Some large samples are missing in the layer L1 Inner (Table 1, Figure 4, Figure 5 and Figure S1). The missing portion of the layer L0 Outer from one side (lower, sediment side) is commonly observed among the large nodules [13]. The growth of small samples collected from the deeper parts of the knoll slope (Stops 4 and 5; Figure 2) were found to have initiated from L2; however, the high-Mn layer at the L0/L1 boundary, corresponding to high Al and Si intensities, indicated that pelagic sediments are thickly wedged between L0 and L1. Moreover, it should be noted that the thicknesses of the layers L1 and L0 of these samples were thin. The smallest sample was composed of only the layer L0 Outer.
The western part of the Southeast EEZ region is represented by site 6K#1462, where it is also covered by large nodules. The multichemical feature maps indicate that although the growth of most samples had started from L2, the innermost sublayer was variable among these nodules (Table 1, Figure 4, Figure 5 and Figure S2). The layers, L2 Middle and L2 Outer, were the innermost layers of the larger nodules (e.g., N1-001 and N1-005) and the layers, L2 Outermost and L0 Outer, were found to be the innermost layers of the smaller nodules (e.g., N1-031 and N1-038). The missing portion of the layer L0 Outer from one side (lower, sediment side) was commonly observed among the larger nodules. The completely missing portions of the layers, L1 Middle and/or L1 Outermost, were observed in samples N1-038 and N5-006. The smallest sample (N1-039) was composed of only the layer L0 Outer, similar to site 6K#1459.
The size distribution of the collected nodules from site 6K#1463 in the eastern part of the Southeast EEZ region was the most variable among all the studied sites (Table 1 and Figure 5). The multichemical feature map revealed that all sublayers except the layer L1 Middle can form an innermost sublayer of nodules (Figure 4 and Figure S3). Aggregates of several nodules with the same or different innermost layers were commonly observed at site 6K#1463 (e.g., sample N3-016). The lack of sublayer(s) of L1, L2 Outermost, and L0 Outer was observed in several small nodules (e.g., N3-007). The smallest sample (N3-016b,c,d) was composed of only the layer L0 Outer, similar to the samples collected from site 6K#1459.

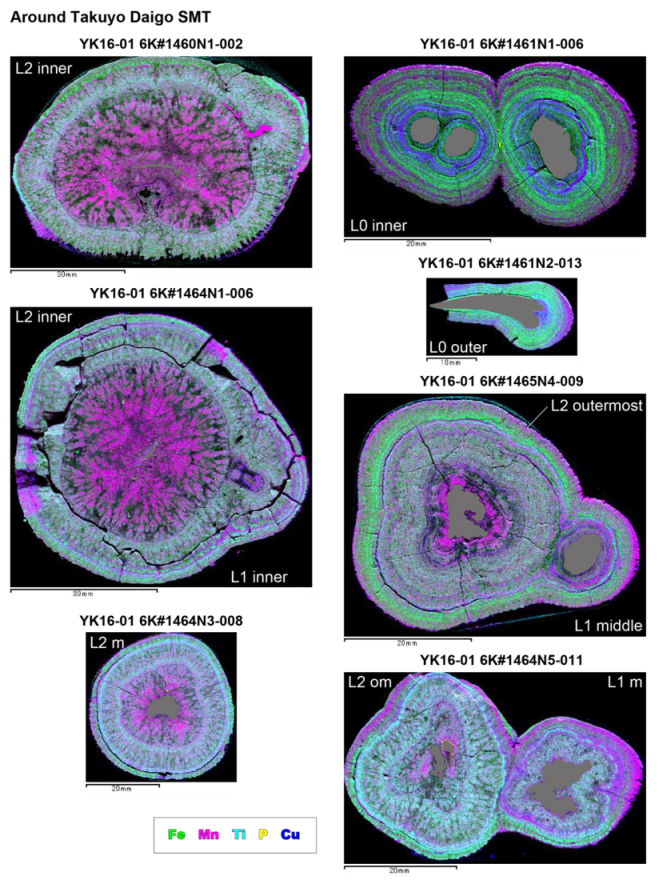
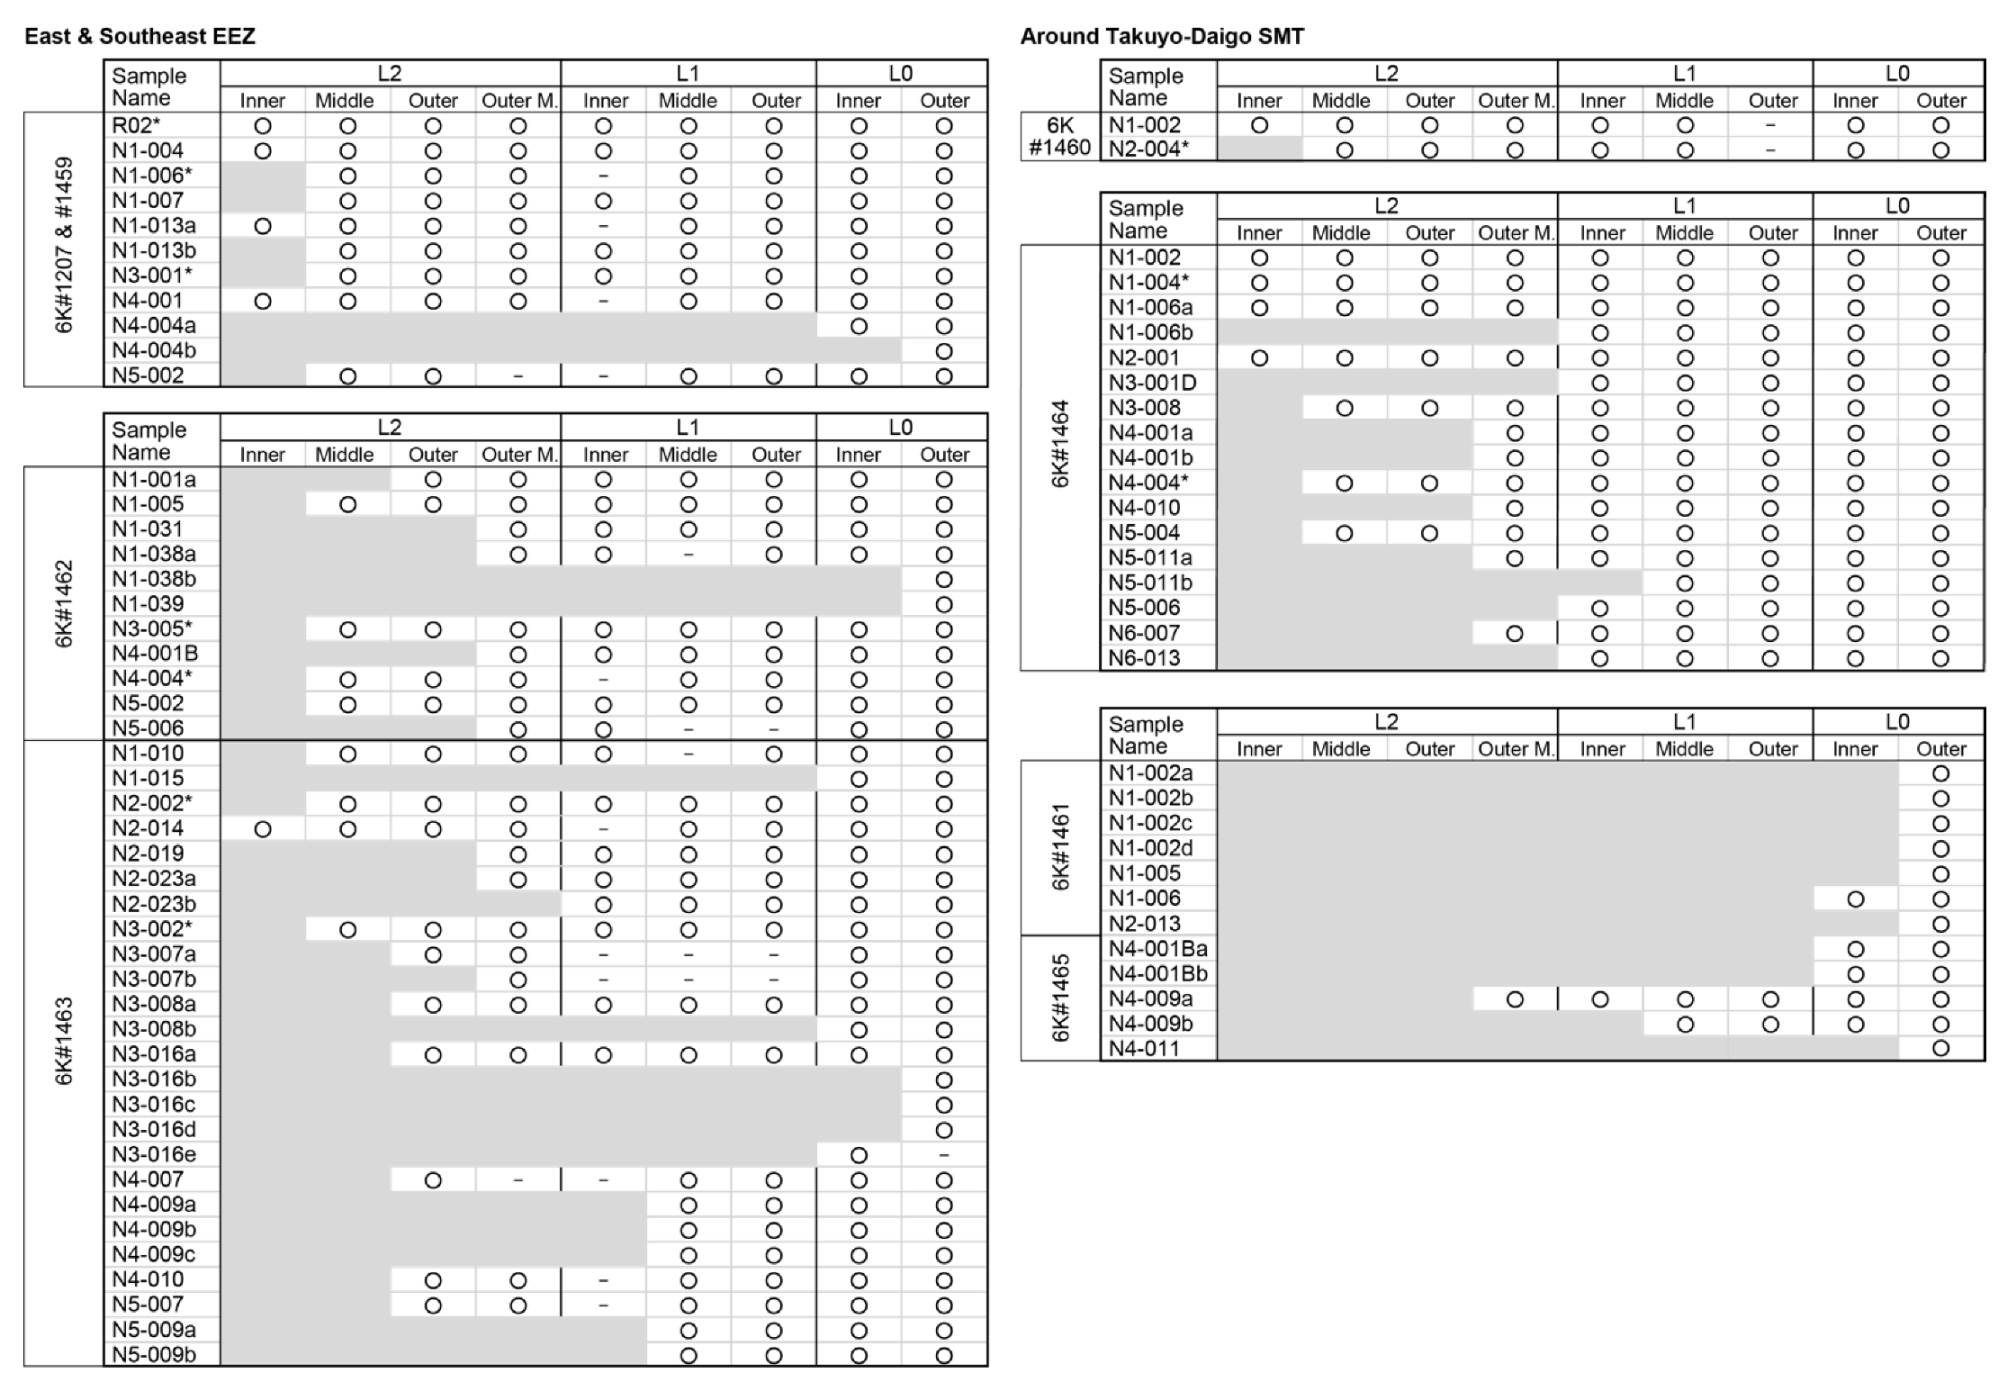
3.2. Around Takuyo Daigo Seamount Region

During diving at site 6K#1460 in the northern part of the Around Takuyo Daigo Seamount region, we collected several large nodules using a manipulator. Sample N1-002 is characterized by the layer L2 Inner as the innermost layer, in contrast to sample N2-004 reported by Machida et al. [13]. The complete absence of the layer L1 Outer and the missing portion of the layer L0 Outer from one side (lower, sediment side) of the nodule were observed in both the samples. The latter is also a feature of large samples from sites 6K#1459 (6K#1207) and 6K#1462, as mentioned in Section 3.1.
Site 6K#1464 had the most variable size distribution of the nodules in this region (Table 1 and Figure 5). As shown by the multichemical feature map, such a variable size distribution was regulated by differences in the innermost layer of the sublayers of L2 (Figure 4 and Figure S5). The innermost layers of the nodules at this site were identified at all sublayers except for the layer L2 Outer. Interestingly, the layer L2 Inner was only observed in samples from the western part of the survey track line of dive 6K#1464 (Stop 1), and the innermost layer of the nodule changed progressively from the inner to the outer layer along the eastward track line from Stop 1 to Stop 6 (Figure 5 and Figure S5).
Site 6K#1461 is located in the low acoustic backscatter intensity region, where small nodules distribute sparsely [5]. The innermost layer of most small nodules from Stops 1 and 2 of site 6K#1461 was the layer L0 Outer (Table 1, Figure 4, Figure 5 and Figure S4). A nodule with the innermost layer being the layer L0 Inner was rarely sampled from Stop 1. In contrast to site 6K#1461, we observed that large nodules were sparsely distributed at site 6K#1465, which is the top of the small mound at approximately three km north of site 6K#1461 (Figure 2). Although the innermost layer of the small nodules from site 6K#1465 (N4-001 and N4-011) was the layer L0 Inner or Outer, as with those from site 6K#1461, the larger nodules from site 6K#1465 (N4-009) mostly had the layers, L2 Outermost or L1 Middle.

4. Discussion

Figure 5 shows that all the sublayers, except the layer L1 Outer, are identified as the innermost layer of nodules distributed in this area. It is thought that a low sedimentation rate owing to the higher bottom current velocities is an important factor of growth of the ferromanganese layers [3,4]. Therefore, the different chemical characteristics of each sublayer imply that the chemistry of the deep-sea water mass that formed the hydrogenous nodules and crust had temporally changed in the study region [13]. Each sublayer of a nodule can be regarded as an isochronous plane of growth history from around a nucleus to the surface; however, since the combination of the innermost layers varied from site to site, we consider that there are regional variations on timing for the growth initiation of nodules.
Upon dividing the nodule field into northern (6K#1207/1459 in the East EEZ region and 6K#1460 in the Around Takuyo Daigo Seamount region) and southern (6K#1462 and 6K#1463 in the Southeast EEZ region, and 6K#1464 and 6K#1461/1465 in the Around Takuyo Daigo Seamount region) sides, we found that the variation in the innermost layer was larger on the southern side of the field in each region compared to that on the northern side (Figure 5). Our data further indicated that the formation of nodules in the northern side of the field started at the stage when the layers, L0 Inner and Outer, occurred solely on the eastern side of the field (6K#1207/1459). This implies that the beginning of nodule formation occurred more frequently at the south of each region. Therefore, we consider that the deep-sea current always flowed into the region from the southern direction, and that it passed between the seamounts to the northern direction (Figure 6). Consequently, a field of large nodules was formed by the continuous growth of each ferromanganese oxide sublayer with different chemical composition characteristics. The distribution density of nodules was intermittently increased particularly in the southern part of the vast field.
Furthermore, our detailed examination revealed different patterns of nodule formation in each eastern or western region, which is described as follows. In the Southeast EEZ region, nodules with the layer L1 as the innermost layer were present at site 6K#1463, and not at site 6K#1462. This suggests that the western side, where the adjacent seamounts are close, is less prone to ocean currents. Deep-sea currents always characterize the flow line toward the eastern side; however, as discussed earlier, additional nodule formation at site 6K#1270/1459 in the northern part of the nodule field (the East EEZ region) is rare. On the other hand, in the Around Takuyo Daigo Seamount region, the nodule formation started at the L2 stage at site 6K#1460, which corresponds to the southern end of the region where there are several knolls [25]. However, in the L1 stage, the additional nodule formation was limited at site 6K#1464, and it was negligible at site 6K#1460. Hirano et al. [25] reported that one knoll in the region north of site 6K#1460 was formed by petit-spot volcanism (hereafter referred to as the ‘petit-spot region’; Figure 6). Furthermore, Machida et al. [5] reported that the acoustic backscatter intensity decreases from the petit-spot region to the north (the eastern region off Minamitorishima), indicating that the nodule density area does not extend downstream of the deep-sea current. Thus, we considered that the mainstream deep-sea current in this region turned westward in the south of the petit-spot region and subsequently flowed northwestward, thereby avoiding the Takuyo Daigo Seamount. Indeed, a high reflection intensity area extends to the southeast of the Takuyo Daigo seamount, and the distribution of nodule-dense areas has been confirmed [5]. In the future, it is necessary to conduct the same analysis that has been conducted in this study in nodules collected from regions surrounding the Takuyo Daigo Seamount, to clarify the western flow path of deep-sea currents.
Kawabe et al. [20] reported that the mainstream of the DWBC gets bifurcated by a large seamount situated at 15° N and 155° E (Figure 1a). The eastern bifurcated current flows toward the Minamitorishima EEZ, and further flows from southeast to southwest in the southern direction of our study area (Figure 1a; [21,22]). Figure 1b shows that a large guyot is situated at the southern tip of the Minamitorishima EEZ (21° N and 155° E). Therefore, we consider that this guyot can further bifurcate the eastern current to form two smaller magnitude branch currents of the DWBC. Indeed, as discussed earlier, the deep-sea currents flowing in the studied area are divided into two flows: one flows from the south through the Southeast EEZ region to the East EEZ region on the eastern side of the study area (the eastern flow), and the other flows from the south into the Around Takuyo Daigo Seamount region and outward toward the northwestward direction (the western flow). Accordingly, we propose that the headwaters of both flows in this region were originated from the LCDW, and the two flows obtained in this study (the eastern and western flows; Figure 6) belong to the small-scale branched LCDW. On the other hand, our results indicate that the deep-sea currents in the studied area followed similar routes in the past. Therefore, we can suggest that the arrangement of individual seamounts strongly regulates the flow path of the LCDW, even if the position of the entire group of seamounts might have changed due to plate motion. We note a fact never recognized before that even the cluster of small petit-spot volcanoes (knolls) could provide a critical constraint on the flow path of deep-sea currents.
Figure 6 shows the relationship between water depth and the timing of the initiation of nodule growth at each sampling site. We found that nodule formation started at a shallow depth at site 6K#1463 during the stage of the L2 of the eastern flow. Moreover, the range of depth seems to have gradually increased to the stage of the layer L2 Outer, and subsequently decreased to the later stage. These observations suggest that the flow volume is larger than that of the other stages of the L2; however, since there is no information on the shallow water depth of the western flow, it is not clear whether the relationship between the depth and the timing of nuclei supply in the eastern flow is common in the Minamitorishima EEZ region. Further systematic sampling and analyses are required to confirm this relationship.
For the initiation of ferromanganese nodule growth, the nucleus, which is mainly composed of clay lumps, rock chips, fish teeth, other skeletal remains, and fragments of older nodules and crust, is essential [3]. Therefore, our lines of discussion can propose a hypothesis that the materials to be the nuclei of the nodules were supplied every time the water mass of the LCDW switched and a new deep-sea current entered the regions. As a result, a vast area densely covered by ferromanganese nodules was formed. Future studies in other nodule fields are required to verify whether our hypothesis is applicable to explain the geology of the field and the relationship between the distribution of the nodule field and deep-sea current, which is essentially regulated by the topographic framework of the seafloor.
We conducted nondestructive fine-scale inter-structural observations of hydrogenous ferromanganese nodules using µ-XRF analysis. An important point of our analysis is that the systematic sample selection was based on comprehensive observation using CT. Our results provide essential information for examining the nuclei supply and oxide layer growth processes in terms of the oceanography of deep-sea currents. Such a multidisciplinary analysis for the other nodule fields and the ferromanganese crust on the seamounts has the potential to critically constrain the complex relationship between the formation of ferromanganese oxides, the temporal and global-scale evolution of the LCDW, and the deep-sea environment.

5. Conclusions

A µ-XRF analysis was conducted to define the chemostratigraphy of hydrogenous ferromanganese nodules distributed in the regions from the southern to the eastern part of the Minamitorishima EEZ. Based on the results, eight types of sublayers (L2 Inner, L2 Middle, L2 Outer, L2 Outermost, L1 Inner, L1 Middle, L0 Inner, and L0 Outer), previously defined by Machida et al. [13], were identified as the innermost layers of nodules in the study area. This indicates that the intermittent initiation of nodule formation and the resulting increase in the number of nodules lead to both wider spreading across the field and denser growth within the field. Moreover, the type of the innermost layer was more variable in samples from the southern part of the study area than in those from the northern part. These facts are consistently explained by the following hypothesis: (1) the materials to be the nucleus of the nodules were supplied every time the water mass switched, and a new deep-sea current entered the regions from the south; (2) the deep-sea current originated from the LCDW; and (3) the nodules began to grow owing to the participation of source materials/elements from an oxic deep-sea current to form hydrogenous ferromanganese layers around the nuclei/nucleus. We expected that the two small-scale branched LCDWs were bifurcated by a large guyot at 21° N and 155° E and flowed separately into the western and eastern regions of the study area. This further suggests that topography strongly regulates the flow path of the deep-sea current through the time of nodule growth.

Supplementary Materials

The following are available online at https://www.mdpi.com/article/10.3390/min11111246/s1, Figure S1: Merged multichemical feature map of the samples analyzed in this study collected from site 6K#1459 in the East EEZ region during the cruise YK16-01. Figure S2: Merged multichemical feature map of the samples analyzed in this study collected from site 6K#1462 in the Southeast EEZ region during the cruise YK16-01. Figure S3: Merged multichemical feature map of the samples analyzed in this study collected from site 6K#1463 in the Southeast EEZ region during the cruise YK16-01. Figure S4: Merged multichemical feature map of the samples analyzed in this study collected from sites 6K#1460, 6K#1461, and 6K#1465 in the Around Takyo Daigo Seamount. Figure S5: Merged multichemical feature map of the samples analyzed in this study collected from site 6K#1464 in the Around Takyo Daigo Seamount region during the cruise YK16-01.

Author Contributions

Conceptualization, S.M. and K.N.; methodology, S.M., K.N. and T.K.; formal analysis, S.M., R.S. and T.K.; investigation, S.M. and R.S.; resources, S.M.; data curation, S.M.; writing—original draft preparation, S.M.; writing—review and editing, all authors; visualization, S.M. and R.S.; supervision, Y.K.; project administration, S.M.; funding acquisition, S.M., K.N. and Y.K. All authors have read and agreed to the published version of the manuscript.

Funding

This research was funded by the cross-ministerial Strategic Innovation Promotion Program (SIP) of Japan and JSPS through the Grant-in-Aid Scientific Research (S) No. 15H05771, (A) No.17H01361, and (A) No.21H04667.

Data Availability Statement

Data are shown in all figures and tables of the main text and in the Supplementary Materials. Raw data and compositional map of each analyzed elements (Al, Ca, Cu, Fe, K, Mg, Mn, Ni, P, Si and Ti) using µ-XRF can be provided from the corresponding author upon request.

Acknowledgments

We gratefully acknowledge the captains, crews and shipboard scientific parties of the R/V Yokosuka, and operating team of the SHINKAI 6500 for their efficient work during the cruise YK16-01. The research cruise was conducted in the SIP of Japan.

Conflicts of Interest

The authors declare no conflict of interest. The funders had no role in the design of the study; in the collection, analyses, or interpretation of data; in the writing of the manuscript, or in the decision to publish the results.

References

  1. Hein, J.R.; Petersen, S. The geology of manganese nodules. In Deep Sea Minerals: Manganese Nodules: A Physical, Biological, Environmental and Technical Review; Baler, E., Beaudoin, Y., Eds.; Secretariat of the Pacific Community: Noumea, New Caledonia, 2013; Volume 1B, pp. 7–18. [Google Scholar]
  2. Hein, J.R.; Koschinsky, A.; Kuhn, T. Deep-ocean polymetallic nodules as a resource for critical materials. Nat. Rev. Earth Environ. 2020, 1, 158–169. [Google Scholar] [CrossRef]
  3. Glasby, G.P.; Stoffers, P.; Sioulas, A.; Thijssen, T.; Friedrich, G. Manganese nodule formation in the Pacific Ocean: A general theory. Geo-Marine. Lett. 1982, 2, 47–58. [Google Scholar] [CrossRef]
  4. Nishimura, A. Sedimentation and hiatuses in the Central Pacific basin: Their relationship to manganese nodule formation. In Geology and Offshore Mineral Resources of the Central Pacific Basin; Keating, B.H., Bolyon, B.R., Eds.; Circum-Pacific Council for Energy and Mineral Resources, Earth Sciences Series; Springer: Berlin/Heidelberg, Germany, 1992; Volume 14, pp. 179–203. [Google Scholar]
  5. Machida, S.; Sato, T.; Yasukawa, K.; Nakamura, K.; Iijima, K.; Nozaki, T.; Kato, Y. Visualisation method for the broad distribution of seafloor ferromanganese deposits. Mar. Georesour. Geotechnol. 2021, 39, 267–279 (published on line in 2019). [Google Scholar] [CrossRef] [Green Version]
  6. Sorem, R.K.; Reinhart, W.R.; Fewkes, R.H.; McFarland, W.D. Occurrence and character of manganese nodules in DOMES Sites A, B, and C, east equatorial Pacific Ocean. In Marine Geology and Oceanography of the Pacific Manganese Nodule Province; Bischoff, J.L., Piper, D.Z., Eds.; Plenum Publishing Corp.: New York, NY, USA, 1979; pp. 475–527. [Google Scholar]
  7. Heath, G.R. Burial rates, growth rates, and size distributions of deep- sea manganese nodules. Science 1979, 205, 903–904. [Google Scholar] [CrossRef] [PubMed]
  8. Usui, A. Regional variation of manganese nodules facies on the Wake-Tahiti transect: Morphological, chemical and mineralogical study. Mar. Geol. 1983, 54, 27–51. [Google Scholar] [CrossRef]
  9. Bolton, B.R.; Bogi, J.; Cronan, D.S. Geochemistry and Mineralogy of ferromanganese nodules from the Kiribati region of the Eastern Central Pacific. In Geology and Offshore Mineral Resources of the Central Pacific Basin; Keating, B.H., Bolyon, B.R., Eds.; Circum-Pacific Council for Energy and Mineral Resources, Earth Sciences Series; Springer: Berlin/Heidelberg, Germany, 1992; Volume 14, pp. 247–260. [Google Scholar]
  10. Kuhn, T.; Wegorzewski, A.; Rühlemann, C.; Vink, A. Composition, Formation, and Occurrence of Polymetallic Nodules. In Deep-Sea Mining; Sharma, R., Ed.; Springer: Berlin/Heidelberg, Germany, 2017; pp. 23–63. [Google Scholar]
  11. Hein, J.R.; Conrad, T.A.; Dunham, R.E. Seamount characteristics and mine-site model applied to exploration and mining-lease-block selection for cobalt-rich ferromanganese crusts. Mar. Georesour. Geotechnol. 2009, 27, 160–176. [Google Scholar] [CrossRef]
  12. Hein, J.R.; Mizell, K.; Koschinsky, A.; Conrad, T.A. Deep-ocean mineral deposits as a source of critical metals for High and green-technology applications: Comparison with land-based resources. Ore Geol. Rev. 2013, 51, 1–14. [Google Scholar] [CrossRef]
  13. Machida, S.; Nakamura, K.; Kogiso, T.; Shimomura, R.; Horinouchi, K.; Okino, K.; Kato, Y. Fine-scale chemostratigraphy of cross-sectioned hydrogenous ferromanganese nodules from the western North Pacific. Isl. Arc 2021, 30, e12395. [Google Scholar] [CrossRef]
  14. Machida, S.; Fujinaga, K.; Ishii, T.; Nakamura, K.; Hirano, N.; Kato, Y. Geology and geochemistry of ferromanganese nodules in the Japanese Exclusive Economic Zone around Minamitorishima Island. Geochem. J. 2016, 50, 539–555. [Google Scholar] [CrossRef] [Green Version]
  15. Kim, J.; Hyeong, K.; Yoo, C.M.; Moon, J.W.; Kim, K.H.; Ko, Y.T.; Lee, I. Textural and geochemical characteristics of Fe-Mn crusts from four seamounts near the Marshall Islands, western Pacific. Geosci. J. 2005, 9, 331–338. [Google Scholar] [CrossRef]
  16. Kim, J.; Hyeong, K.; Jung, H.-S.; Moon, J.-W.; Kim, K.-H.; Lee, I. Southward shift of the Intertropical Convergence Zone in the western Pacific during the late Tertiary: Evidence from ferromanganese crusts on seamounts west of the Marshall Islands. Paleoceanography 2006, 21, PA4218. [Google Scholar] [CrossRef]
  17. Pan, J.; De Carlo, E.H.; Yang, Y.; Liu, S.; You, G. Effect of phosphatization on element concentration of cobalt-rich ferromanganese crusts. Acta Geol. Sin. 2005, 79, 349–355. [Google Scholar]
  18. Nozaki, T.; Tokumaru, A.; Takaya, Y.; Kato, Y.; Suzuki, K.; Urabe, T. Major and trace element compositions and resource potential of ferromanganese crust at Takuyo Daigo Seamount, northwestern Pacific Ocean. Geochem. J. 2016, 50, 527–537. [Google Scholar] [CrossRef] [Green Version]
  19. Azami, K.; Hirano, N.; Machida, S.; Yasukawa, K.; Kato, Y. Rare earth elements and yttrium (REY) variability with water depth in hydrogenetic ferromanganese crusts. Chem. Geol. 2018, 493, 224–233. [Google Scholar] [CrossRef]
  20. Kawabe, M.; Fujio, S.; Yanagimoto, D. Deep-water circulation at low latitudes in the western North Pacific. Deep-Sea Res. I Oceanogr. Res. Pap. 2003, 50, 631–656. [Google Scholar] [CrossRef]
  21. Kawabe, M.; Fujio, S.; Yanagimoto, D.; Tanaka, K. Water masses and currents of deep circulation southwest of the Shatsky Rise in the western North Pacific. Deep-Sea Res. I Oceanogr. Res. Pap. 2009, 56, 1675–1687. [Google Scholar] [CrossRef]
  22. Kawabe, M.; Fujio, S. Pacific Ocean circulation based on observation. J. Oceanogr. 2010, 66, 389–403. [Google Scholar] [CrossRef]
  23. Nakamura, K.; Terauchi, D.; Shimomura, R.; Machida, S.; Yasukawa, K.; Fujinaga, K.; Kato, Y. Three-dimensional structural analysis of ferromanganese nodules from the western North Pacific Ocean using X-ray Computed Tomography. Minerals 2021, 11, 1100. [Google Scholar] [CrossRef]
  24. Nakamura, K.; Machida, S.; Okino, K.; Masaki, Y.; Iijima, K.; Suzuki, K.; Kato, Y. Acoustic characterization of pelagic sediments using sub-bottom profiler data: Implications for the distribution of REY-rich mud in the Minamitorishima EEZ, western Pacific. Geochem. J. 2016, 50, 605–619. [Google Scholar] [CrossRef] [Green Version]
  25. Hirano, N.; Machida, S.; Sumino, H.; Shimizu, K.; Tamura, A.; Morishita, T.; Iwano, H.; Sakata, S.; Ishii, T.; Arai, S.; et al. Petit-spot volcanoes on the oldest portion of the Pacific plate. Deep-Sea Res. I Oceanogr. Res. Pap. 2019, 154, 103142. [Google Scholar] [CrossRef]
Figure 1. Topography of the regions surrounding the Minamitorishima island. (a) Light blue arrows indicate the present circulation of the Pacific Ocean in the lower deep layer originated from the Lower Circumpolar Deep Water (LCDW) [21,22]. The region outlined by the orange line indicates the Prime Crust Zone defined by [12]. Topographic data are from ETOPO1 (NOAA National Geophysical Data Center; https://www.ngdc.noaa.gov/mgg/global/, accessed on 8 November 2021). (b) The stars indicate the locations of the sampling sites (submersible SHINKAI 6500 dive sites) during the cruises YK10-05 (6K#1207) and YK16-01 (other dives) of the R/V Yokosuka. The colored fine-scale topographic data of a vessel equipped with a multiple narrow-beam echo sounder (MBES) were obtained by Nakamura et al. [24]. The white dashed line indicates the Japanese exclusive economic zone around Minamitorishima island.
Minerals 11 01246 g001
Figure 2. Three-dimensional maps portraying the detailed topography of the dive sites of the submersible SHINKAI 6500 during cruise YK16-01 of R/V Yokosuka. Map of the sites 6K#1207 and #1459 is viewed from N40°W. The other maps are viewed from S40°W. The topographic data of a vessel equipped with MBES were compiled with the published datasets by [13]. Red circles with alphanumeric annotation indicate the stop points for detailed observation and sampling of nodules investigated in this study. The stop numbers correspond to the sample name shown in parentheses. The black dots indicate the other stop points during the same dive.
Minerals 11 01246 g002
Figure 3. Definition criteria for chemostratigraphic layers determined by µ-XRF. (a) Flowchart to define the sublayers proposed by Machida et al. [13] (provided in Figure 7 of [13]); (b) An example of layer identification reported by Machida et al. [13] (modified from Figure 6 of [13]). The thick white lines indicate the boundaries of the layers L0, L1, and L2, and the thin white lines indicate the sublayer boundaries of each layer. The white box in (b) indicates the area shown in (a). The gray field indicates the nuclei of this sample.
Minerals 11 01246 g003
Figure 4. Merged multichemical feature map of the representative samples analyzed in this study. The name of the identified innermost layer around each nucleus is indicated by white text at the corner of panel. The gray field indicates the nucleus(nuclei) of each sample. i: inner; m: middle; o: outer; om: outermost.
Minerals 11 01246 g004aMinerals 11 01246 g004b
Figure 5. Observed layers for each sample collected from the nodule field around Minamitorishima Island. In this figure, the sites are arranged from north (upper) to south (lower) in each region. The identified sublayers in all samples, including samples previously reported by [13] and the samples shown as ‘*’ with the sample name, are indicated by circles (O) in each box. Layer identification is based on both µ-XRF mapping (the merged multichemical feature map) of the samples and the definition of each sublayer proposed by [13] (Figure 3). The box marked by ‘-𠆘 indicates the complete absence of the sublayer. The gray bar corresponds to the nuclei shown in Figure 4 and Figures S1–S5 to easily recognize the innermost layer of each sample. The alphabet ‘a’, ‘b’, ‘c’, ‘d’, and ‘e’ with the sample name indicate the samples consisting of multiple nuclei or aggregates of several nodules.
Minerals 11 01246 g005
Figure 6. Expected flow direction of deep-sea currents that had intermittently supplied materials to be the nuclei of nodules in the regions around Minamitorishima Island. (a) Three-dimensional map portraying detailed topography and sampling sites viewed from S40°W. Bathymetric data and the color scale as same as in Figure 2. (b) Relationships between depth of sampling site (Table 1 and Figure 2) and the innermost layer (i.e., layer around the nuclei) of each different-sized nodule (Figure 5).
Minerals 11 01246 g006
Table 1. Summary of sampling sites for collection of ferromanganese nodule samples, and parameters for μ-XRF analysis.
Dive NumberSample NameLocationSample SizeAnalysis Parameters
Latitude (N)Longitude (E)Depth (m)Max. (mm)Med. (mm)Min. (mm)X (mm)Y (mm)Pixel Size (μm)Total Analysis
Time (ms/pixel)
6K#14596K#1459N1-00424°35.69′157°00.96′−550172716671.68071.68014076
6K#1459N1-00771676572.70466.45614283
6K#1459N1-013a95655967.58459.98313286
6K#1459N1-013b53.24851.16810479
6K#1459N4-00124°34.36′157°00.49′−550364616062.46461.48812278
6K#1459N4-004a34261423.55213.39292162
6K#1459N4-004b31.23216.117122178
6K#1459N5-00224°33.99′156°59.97′−556763424058.36838.874114172
6K#14606K#1460N1-00223°05.01′154°26.55′−552780715778.84855.286154163
6K#14616K#1461N1-00221°59.04′153°56.33′−572838271838.40026.700150658
6K#1461N1-00534301534.81614.348136446
6K#1461N1-00640221940.96024.56080191
6K#1461N2-01321°59.00′153°56.01′−572932201429.69615.312116592
6K#14626K#1462N1-001A22°19.92′155°44.06′−545350403751.71237.168101159
6K#1462N1-00560474460.41644.01411884
6K#1462N1-03136323035.84029.680140101
6K#1462N1-03835252035.84020.44014094
6K#1462N1-03927261328.67213.328112985
6K#1462N4-001B22°18.34′155°42.49′−544437272536.86426.064144108
6K#1462N5-00222°18.17′155°42.26′−544389694887.04072.76017091
6K#1462N5-00631242031.74422.506124647
6K#14636K#1463N1-01021°57.15′156°06.65′−545850504752.22449.57210280
6K#1463N1-01528201926.11218.972102105
6K#1463N2-01421°57.10′156°06.77′−545752515051.20051.200100114
6K#1463N2-01926242427.64824.084108105
6K#1463N2-02323171725.08817.44498110
6K#1463N3-00721°56.85′156°07.82′−527145403845.56838.448178543
6K#1463N3-00845333246.08033.75090156
6K#1463N3-01629262229.18426.106114102
6K#1463N4-00721°56.81′156°08.07′−516125222123.04020.97090503
6K#1463N4-00927222028.16021.120110407
6K#1463N4-01024232223.04023.04090458
6K#1463N5-00721°56.74′156°08.30′−500421201920.99219.1888292
6K#1463N5-00925191925.60019.500100120
6K#14646K#1464N1-00222°15.45′153°51.38′−577872646370.65664.03213884
6K#1464N1-00662535261.44057.00012082
6K#1464N2-00122°15.15′153°51.66′−578196615660.41659.472118116
6K#1464N3-001D22°14.80′153°52.26′−578332282033.79222.04413294
6K#1464N3-00839393740.44840.132158461
6K#1464N4-00122°14.77′153°53.17′−575050332950.68833.26499116
6K#1464N4-01041333242.24033.990165347
6K#1464N5-00422°14.76′153°53.42′−575550494648.12848.1289484
6K#1464N5-01153353053.24833.80010484
6K#1464N6-00622°14.80′153°53.83′−576148403849.15239.936192379
6K#1464N6-00744444343.00843.008168458
6K#1464N6-01333333234.81631.756136117
6K#14656K#1465N4-001B22°01.67′153°56.27′−567937363037.88829.156148119
6K#1465N4-00946373747.10437.9049295
6K#1465N4-01148291743.52018.19017088
Publisher’s Note: MDPI stays neutral with regard to jurisdictional claims in published maps and institutional affiliations.

