Article

Optimal Thermal Treatment for Effective Copper Recovery in Waste Printed Circuit Boards by Physical Separation: Influence of Temperature and Gas

1
Center for Advanced Materials & Processing, Institute for Advanced Engineering (IAE), 175-28 Goan-ro 51, Yongin-si 17180, Korea
2
Department of Chemical and Biomolecular Engineering, Korea Advanced Institute of Science and Technology (KAIST), 291, Daehak-ro, Yuseong-gu, Daejeon 34141, Korea
3
Department of Earth Resources and Environmental Engineering, Hanyang University 222, Wangsimni-ro, Seongdong-gu, Seoul 04763, Korea
4
Resources Recovery Research Center, Mineral Resources Division, Korea Institute of Geoscience & Mineral Resources (KIGAM), 124, Gwahak-ro, Yuseong-gu, Daejeon 34132, Korea
5
Department of Energy and Resource Engineering, Chosun University, Gwagju 61452, Korea
6
Department of Resources Recycling, University of Science and Technology (UST), 217, Gajeong-ro, Yuseong-gu, Daejeon 34113, Korea
*
Authors to whom correspondence should be addressed.
These authors contributed equally to this work.
Minerals 2021, 11(11), 1213; https://doi.org/10.3390/min11111213
Submission received: 6 October 2021 / Revised: 23 October 2021 / Accepted: 27 October 2021 / Published: 30 October 2021
(This article belongs to the Special Issue Sustainable Production of Metals for Low-Carbon Technologies)

Abstract

:
Printed circuit boards (PCBs) are difficult to recycle because of the layered structure of non-metal (i.e., epoxy resin, glass fiber) and copper. In this work, we conducted a systematic investigation to effectively recover copper from PCB. A thermal treatment was employed for improving the crushing performance of PCB and conducted by varying the temperature and the gas. Then, the mechanical strength, degree of liberation (DL), and copper separation efficiency of the heat-treated and untreated PCBs were investigated. After heat treatment under a 300 °C air atmosphere, the mechanical strength of PCB decreased from 386.36 to 24.26 MPa, and copper liberation improved from 9.3% to 100% in the size range of a coarser size fraction (>1400 μm). Accordingly, when electrostatic separations were performed under these conditions, a high-Cu-grade concentrate and high recovery could be obtained. The results show that the change in the physical properties of the PCBs leads to an improvement in the DL following thermal decomposition at 300 °C in air. Our study elucidates the physical properties of PCBs and the DL under various heat treatment conditions. Furthermore, it shows that the heat treatment condition of 300 °C in air is ideal for recovering copper from the PCB.

1. Introduction

The quantity of electronic waste (e-waste) generated has increased with the growing use of electronic devices, increasing by approximately 4–5% every year [1]. At least 53.6 million tons of e-waste was produced in 2019 [2]. Most e-waste has a vital module—the printed circuit board assembly (PCBA)—which is designed to exchange electronic signals between the parts of an electronic device. Therefore, an increase in e-waste naturally leads to an increase in waste PCBA.
PCBA comprises printed circuit boards (PCB) and electronic components (ECs), and it consists of approximately 40% metal, 30% plastic, and 30% ceramic [3,4,5,6,7,8]. These components are arranged in a layered structure, with Cu being in particularly high amounts [9,10,11]. Among the metals present in PCBA, Au and Cu are the two most valuable metals, and their grade is much larger than the grade expected in gold and copper ore [12,13,14]. Accordingly, a large number of studies have been conducted on developing technologies to recover valuable metals through the proper treatment of waste PCBA. Metal recovery from PCBA by recycling has been conducted by mechanical, metallurgical, and incineration methods [15].
Generally, the ECs attached to the PCB are fixed with a metallic material such as lead; they can easily be detached following constant thermal exposure and simple surface damage [11,16,17]. However, because copper contained in PCB mainly exists in a laminated structure with epoxy resin and glass fiber, the copper should effectively be separated [17]. Cu in PCBs largely exists in a high-purity metallic state and is not chemically bonded with other metals. Thus, an efficient physical process to liberate and separate Cu should precede the metallurgical process. Accordingly, diverse studies have been conducted to increased metal liberation and separation efficiency from PCB waste [18,19,20].
PCB must be pulverized into particles to effectively liberate and separate Cu [18,21,22]. According to a previous study, it should be comminuted to approximately 150 μm or less (e.g., liberation size) [6,23,24]. However, because the liberation size is small, the grinding of PCB causes Cu loss and also consumes a lot of energy [23,24]. In addition, because of the large number of fine particles (i.e., smaller liberation size), the separation efficiency in the electrostatic separation process is greatly reduced. Accordingly, several studies have been conducted to find more favorable liberation size with the pretreatment before comminution, and liberation enhancement by thermal treatment has been reported as the most suitable method (see Figure 1) [25,26].
Jie et al. [23] studied PCB pyrolysis characteristics and mechanical strength changes under a nitrogen atmosphere at 300–700 °C. The pyrolysis affects the boundary of the layered structure and removes the adhesive between Cu and epoxy resin, facilitating the separation of metal from PCB. In addition, they analyzed the pyro-oil and pyro-gas that formed depending on the pyrolysis temperature and presented references on PCB pyrolysis according to the heat treatment temperature. Huang et al. suggested a microwave-based pyrolysis to recover metal from PCB. They implemented an acid-leaching process to skip the grinding process after thermal treatment [27]. Li et al. [28] focused on thermal analysis and kinetics of low-temperature PCB pyrolysis under nitrogen, air, and vacuum. Moreover, they calculated the activation energy of thermal decomposition and quantified the efficiency of the thermal decomposition process according to the heat treatment conditions. Li et al. [29] proposed heat treatment at 250 °C under vacuum by employing an existing physical treatment technique for high-efficiency metal recovery. They mentioned that the product strength decreased sharply with heat treatment, improving metal liberation and recovery.
Corona-induced electrostatic separation is the most efficient physical separation technique, where both metals and non-metals remain as a mixture after comminution [30,31,32]. This method has the advantage of a very high metal recovery performance and does not cause secondary pollution. Li et al. [33] proposed a metal recovery method consisting of crushing, screening, drying, and electrostatic separation. They found that a particle size of 0.6–1.2 mm was the most appropriate for the electrostatic separation of metals. Xue et al. [34] conducted the electrostatic separation of a mixture of Cu, epoxy resin, and glass fiber. They proposed a multistage separation for the effective separation of conductors, semiconductors, and nonconductors. Although a large volume of research has been conducted in the past/mentioned above, no study has focused on the relationship between strength, grindability, liberation properties, and the physical recovery of metal components of heat-treated PCB comminution products.
In this work, a systematic investigation was conducted on the physical separation process to obtain Cu-containing particles (i.e., Cu concentrates) separated from the thermally processed/treated PCB. First, we evaluated the mechanical strength of the PCB expanded by heat treatment. To confirm the optimum temperature for heat treatment, the particle size distributions and degree of liberation (DL) of the PCB under the same grinding conditions were analyzed. Finally, the electrostatic separation was attempted to demonstrate the superior separation efficiency of the PCB particles treated at the confirmed temperature than untreated PCB particles.

2. Materials and Methods

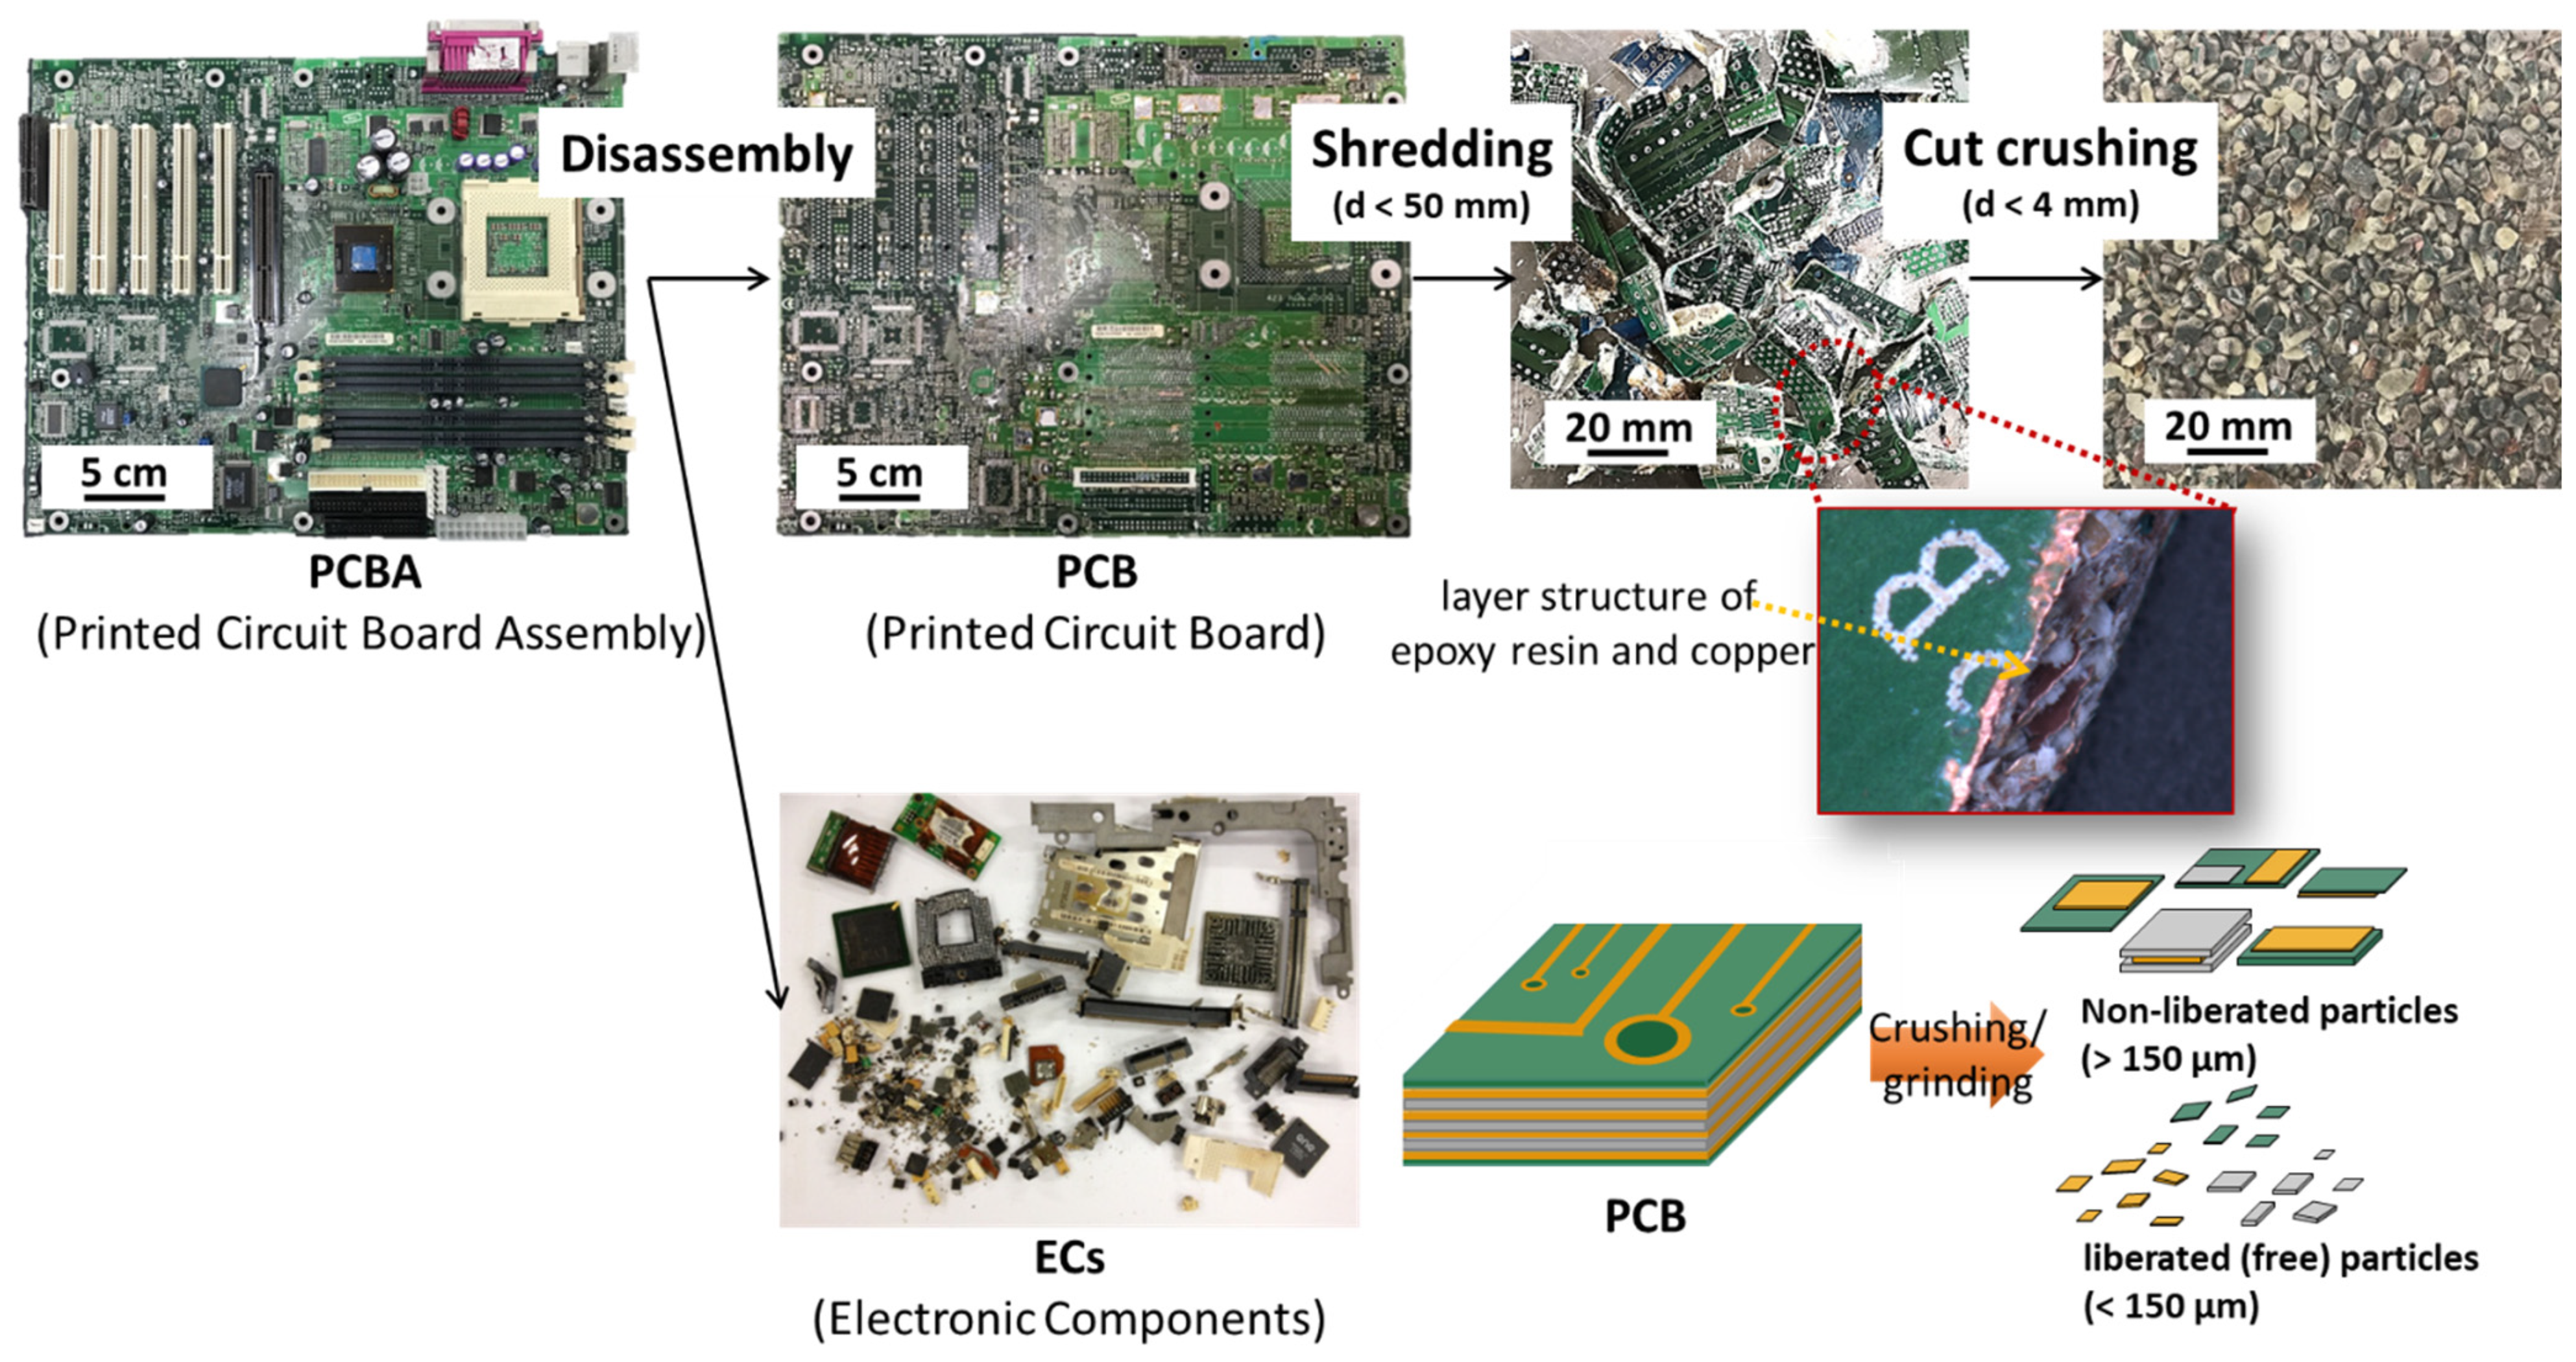
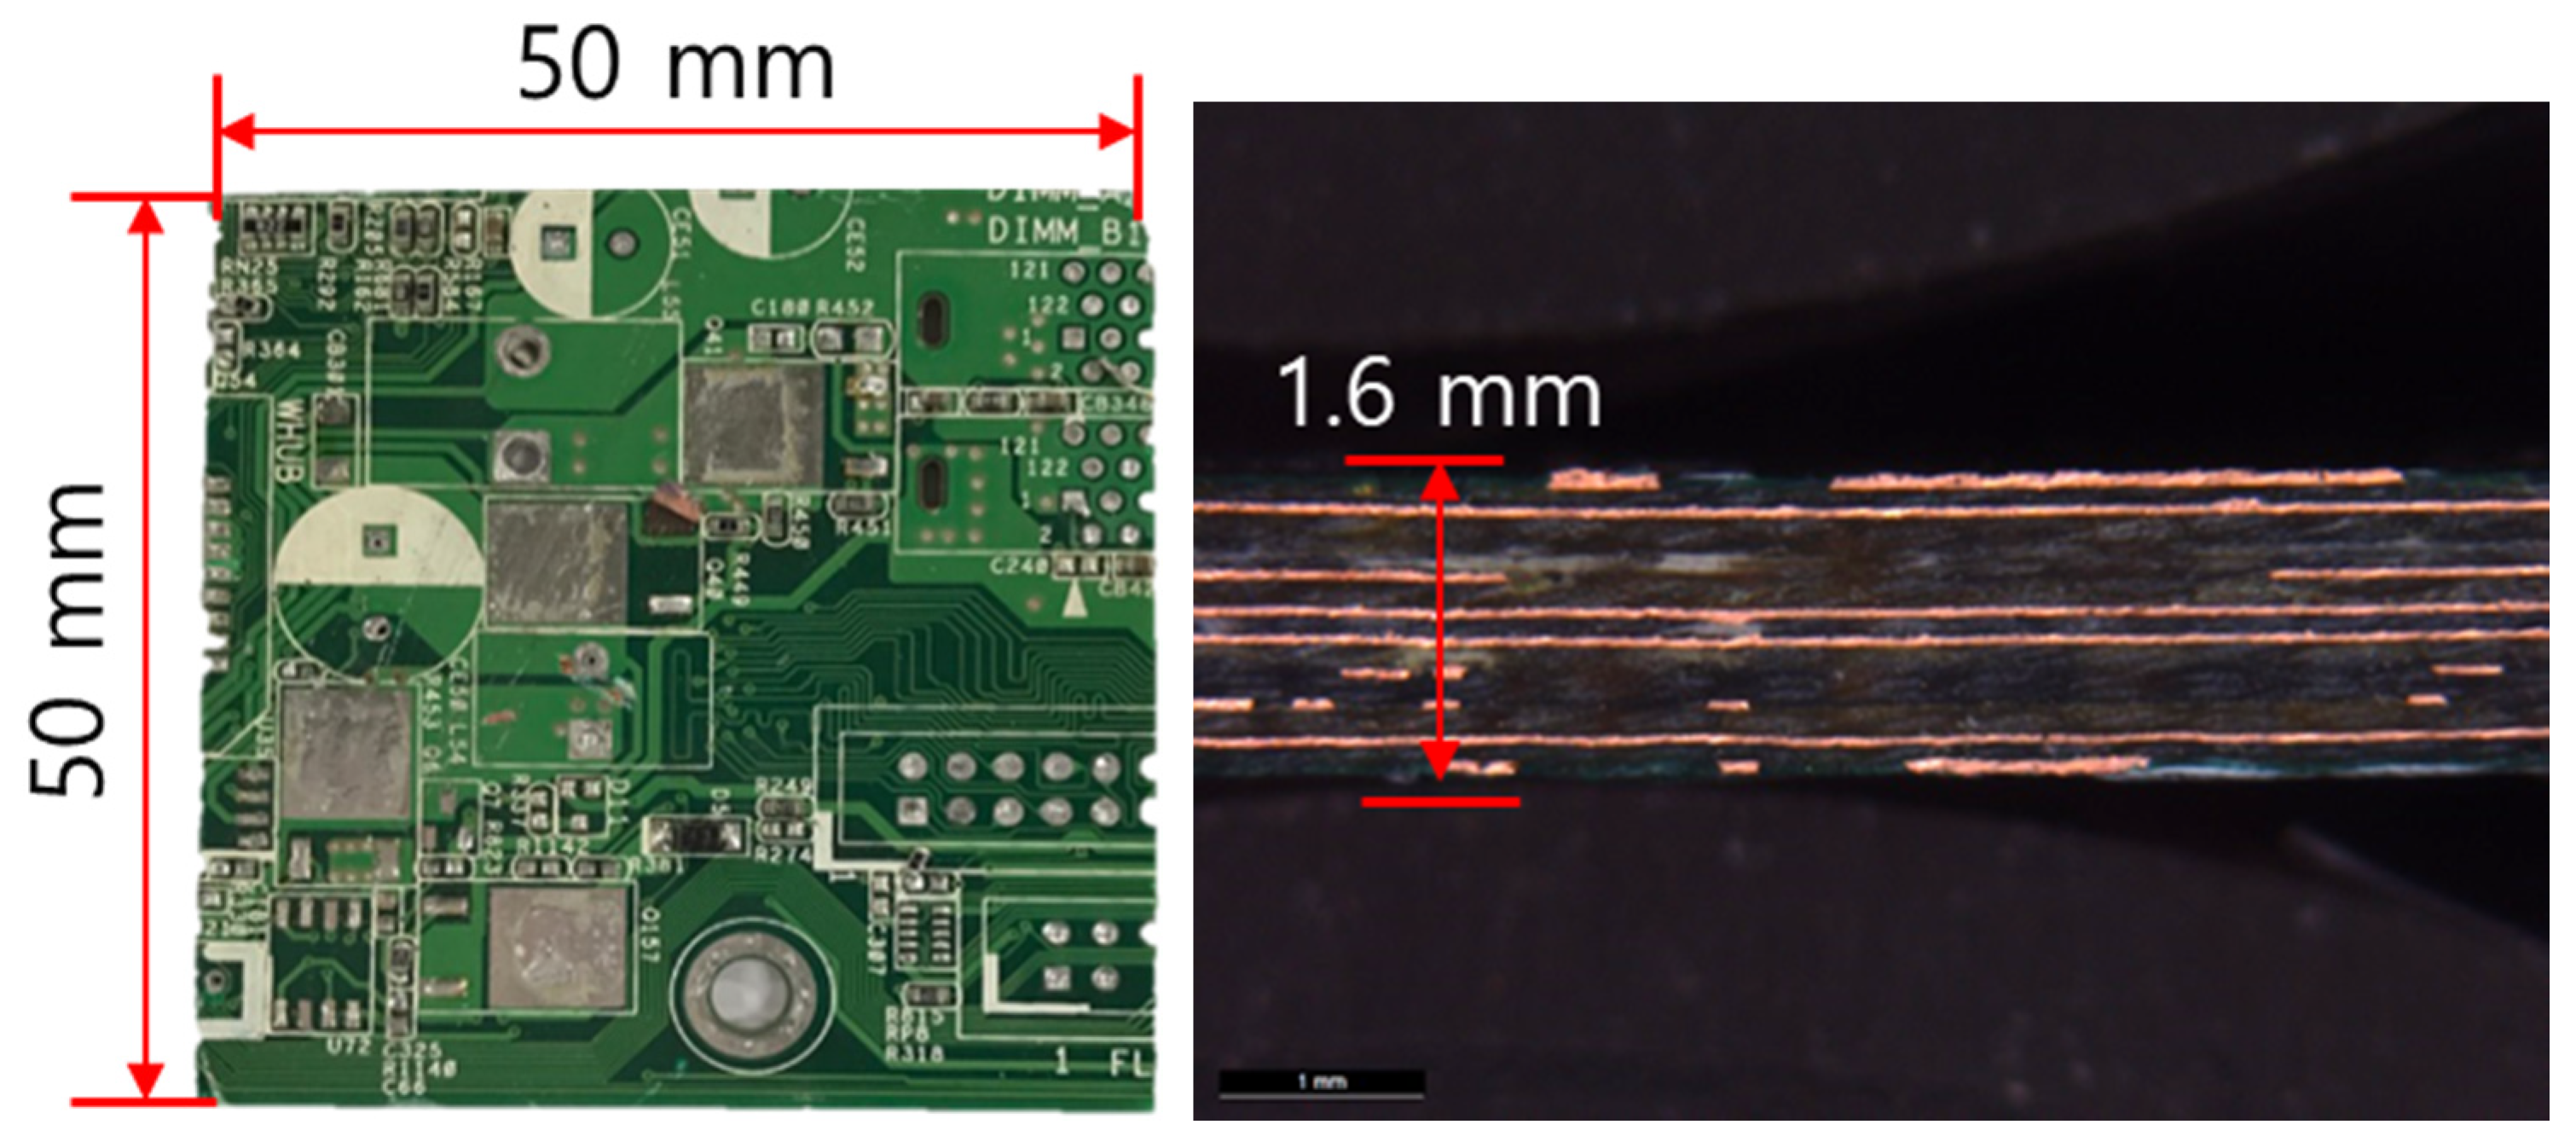
2.1. Printed Circuit Boards (PCBs)

PCBAs of waste computers were supplied by an e-waste recycling company (RTECH KOREA, Namyangju-si, Korea). From the supplied PCBAs, ECs were separated using a heating fan, and PCBs without ECs were used. As shown in Figure 2, the PCBs had a layer structure with a thickness of approximately 1.6 mm and contained a mixture of Cu and glass fiber-reinforced epoxy resin (FR-4). The Cu content in the PCBs was found to be 25.36 wt % using ICP-OES (iCAP 7000SERIES, Thermo Fisher Scientific, Waltham, MA, USA). To determine the conditions for heat treatment and thermal property changes, the thermal behavior of the PCBs was evaluated via thermogravimetric analysis (TGA, N-1000, Scinco, Seoul, Korea). In the TGA, the heating rate was set to 5 °C/min, and weight changes were observed while heating from 25 to 600 °C.

2.2. Thermal Treatment Conditions

An electrical furnace was used for thermal treatment. Harmful gas generated during the thermal treatment was minimized by connecting it to a precipitator equipped with a HEPA filter and activated charcoal filter. The PCBs were cut into 50 mm square samples. Twenty samples were placed in an electrical furnace. Heating was performed in air at a heating rate of 5 °C/min and temperatures of 200, 225, 250, 275, 300, and 325 °C. After reaching the target temperature, it was maintained for 30 min.

2.3. Evaluation of Flexible Strength and Degree of Liberation (DL)

To determine the changes in the physical properties of the PCB with thermal treatment, the expansibility and mechanical strength of the PCB were measured. Additionally, the comminution product particle size distribution and the DL of Cu were also evaluated.
Changes in PCB thickness according to thermal treatment conditions were measured using an optical microscope (Leica DVM2500, Leica VZ80) to determine the expansibility of the board. Mechanical strength was measured using a universal strength analyzer (H25KS, Tinius Olsen). For strength measurement, the samples used were 50 mm × 15 mm. A load was applied to the central part of the sample, and the load value at the moment of destruction was calculated using Equation (1) to calculate the bending strength σ (MPa) [35].
σ = 3 P l 2 b d 2
where P represents the load at the moment of destruction (N), l is the length of the support span cycle (m), b is the specimen width (m), and d is the specimen thickness (m). Ten bending strength values were obtained for each set of thermal treatment conditions. The PCBs were heat-treated until the bending strength dropped sharply. Then, they were utilized for the comminution process.
A shredder (TOP-2515-SH, Topcrusher, Gunpo-si, Korea) and cut crusher (TOP-10-CC, Topcrusher, Gunpo-si, Korea) were used in the comminution experiment. The comminution product was separated by sieving into 10 size categories in the range 4000–250 μm to evaluate particle size distribution. The particle size distribution was obtained from the Gates–Gaudin–Schuhmann (GGS) model (Equation (2)) and plotted.
F   ( D ) = ( D D * ) α
where D represents the particle size (μm); F   ( D ) represents the cumulative weight fraction undersize; α represents the distribution modulus; and D * represents the size modulus (μm). From Equation (2), the smaller α is, the broader the distribution of particle size, whereas the larger the D * , the larger will be the absolute size of a particle.
DL is defined as the proportion of effective components existing as liberated particles (free particles) among all the effective components. This is expressed in Equation (3).
D L D = p   ( g = 1 | D ) g = 0 1 g p   ( g | D ) . d g
In this equation, D L D is the DL of Cu in the particle size range D ; g is the Cu grade; p   ( g | D ) is the proportion of particles with Cu grade g in the particle size range D ; and p   ( g = 1 | D ) is the proportion of particles with Cu grade 1 in the particle size range D .
To check the DL of Cu in the PCB comminution product, the particles were sampled in the 355–500 μm, 710–1000 μm, 1400–2000 μm, and 2800–4000 μm size ranges. The ground PCB samples were produced using the cold-mounting method. The cutting plane of the ground pieces was captured using an electron microscope, from which the color representative value of the Cu component was extracted to calculate the total area of the Cu particles [36].
To quantitatively examine the Cu particle distribution, which in turn depends on the comminution product particle size, the Cu grade was analyzed using ICP-OES (iCAP 7000SERIES, Thermo Fisher Scientific). For particle size ranges with high-grade Cu, the entire range of elements was analyzed to improve data reliability, and all impurities except Cu were excluded from the whole metal grade to obtain the Cu grade.

2.4. Electrostatic Separation Experiment

The PCB comminution product was separated into metallic (Cu) and non-metallic particles using a corona discharge electrostatic separator (laboratory-type corona discharge electrostatic separator, ES 01/04S, Eriez, Erie, PA, USA). A corona discharge electrostatic separator consists of a rotating disk electrode, a corona electrode, and an induction electrode. For metallic particles, their high conductivity causes fast electric charge extinction, and the particles fall from the rotating electrode due to inertia. On the other hand, nonmetallic particles have poor conductivity, and charge extinction is very slow. This keeps them attached to the rotating disk electrode until they are separated by a brush. The operational conditions of the electrostatic separator are listed in Table 1.
Specimens with (325 °C) and without thermal treatment were subjected to electrostatic separation. Particles sizes ranged from 250 to 4000 μm. In the first electrostatic separation, the comminution product was separated into three types: conductor (metallic particle), middling, and nonconductor (non-metallic particle). The middling was further sorted into conductors and nonconductors. The separated samples were examined for their Cu particle distribution status according to thermal treatment using ICP-OES (iCAP 7000SERIES, Thermo Fisher Scientific). For the separated conductors and nonconductors, we evaluated their yield with respect to the input of each particle size. The Cu grade was analyzed for feed, conductor, and nonconductor products to determine the effect of thermal treatment on electrostatic separation.

3. Results

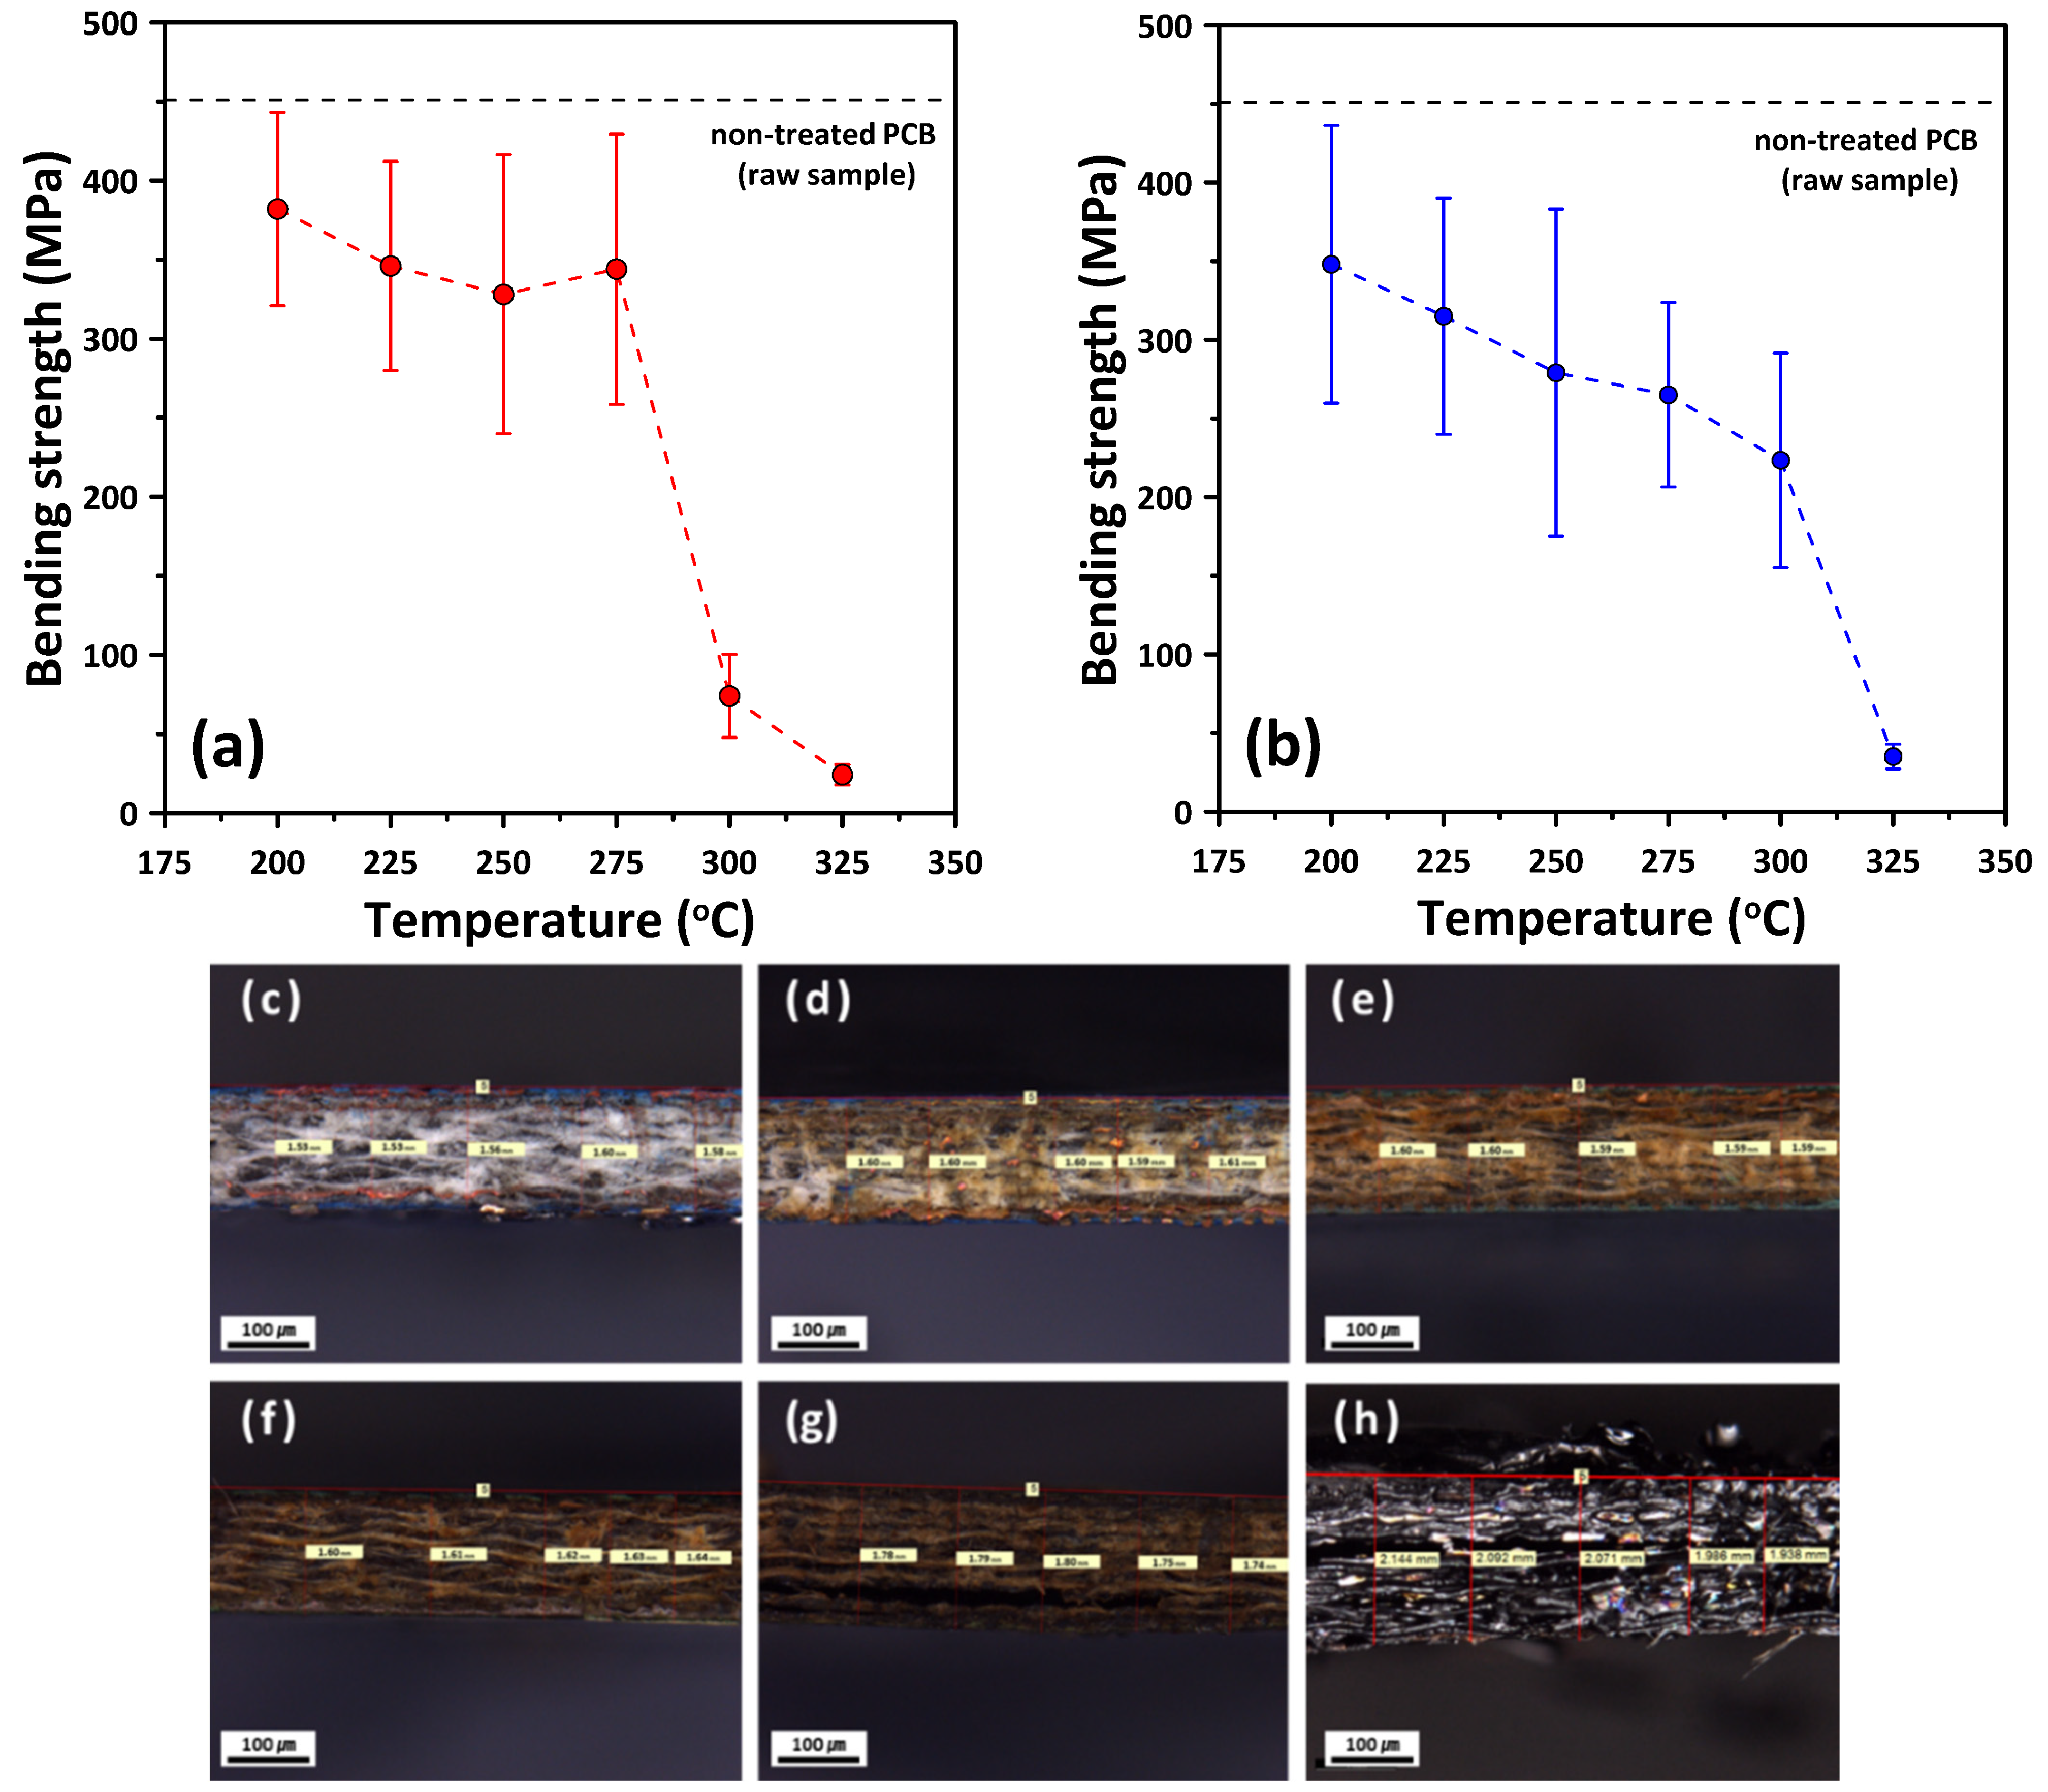
3.1. Thermal Behavior of the PCB

Figure 3 shows the TGA-DTA of changes in PCB mass with changes in temperature up to 600 °C under air and nitrogen. Pyrolysis occurred in two phases. The first phase involved conversion of the moisture content within the substrate to vapor and the formation of CO2 in the temperature range of 200–310 °C, resulting in a small decrease in the mass of the sample. The second phase was marked by the disintegration and carbonization of the epoxy resin at 310 °C or higher, causing a rapid reduction in the mass [26]. The temperature with the maximum mass reduction ( T m ) was 302 °C. The organic matter was completely decomposed to show no further change in mass at 600 °C or higher. After completion of the reaction, the mass of the specimen was approximately 70% of its initial mass.
The purpose of pyrolysis was to minimize the emission of organic matter from the PCB while improving the degree of Cu liberation. We expected that hazardous gas generation would increase and Cu would be oxidized at 325 °C or higher; thus, we set 325 °C as the upper limit for thermal treatment [37,38].
Figure 4 shows the results of the bending strength test of the PCB used in this study according to different temperatures and gas conditions. The PCBs were thermally treated according to each set of conditions, and their bending strengths were measured. For each temperature condition, 10 samples were used to measure the mechanical strength, and their means and standard deviations were calculated. The average bending strength of the boards without any heat treatment was 386.36 MPa. The average bending strengths of PCB-A300 and PCB-A325 were 74.52 MPa and 24.26 MPa respectively. In general, the higher the thermal treatment temperature, the lower is the strength to converge to a certain value. For each thermal treatment atmosphere, the temperature at which the strength rapidly drops (300 °C) was found to be similar to Tm (302 °C), as observed from the DTG analysis results above.
The PCBs were thermally treated from 200 to 325 °C at 25 °C intervals, and their cross-sectional enlargement was observed via optical microscopy, as shown in Figure 4c–h. The board thickness hardly changed from 200 to 275 °C. The board expanded by approximately 11% (1.6 to 1.77 mm) at 300 °C, and the enlargement was approximately 28% (1.6 to 2.04 mm) at 325 °C. Such PCB cross-sectional expansion seemed to have been caused by the fixed glass fiber, but it was eventually released as the epoxy resin disintegrated during pyrolysis. Such delaminated samples are expected to have structural defects inside and experience a mechanical strength drop. To verify this, the bending strength of the PCB was measured according to the thermal treatment conditions. The PCB thermally treated at 300 °C in air and nitrogen are referred to as PCB-A300 and PCB-N300, respectively. PCB without any thermal treatment is referred to as a PCB-WT.

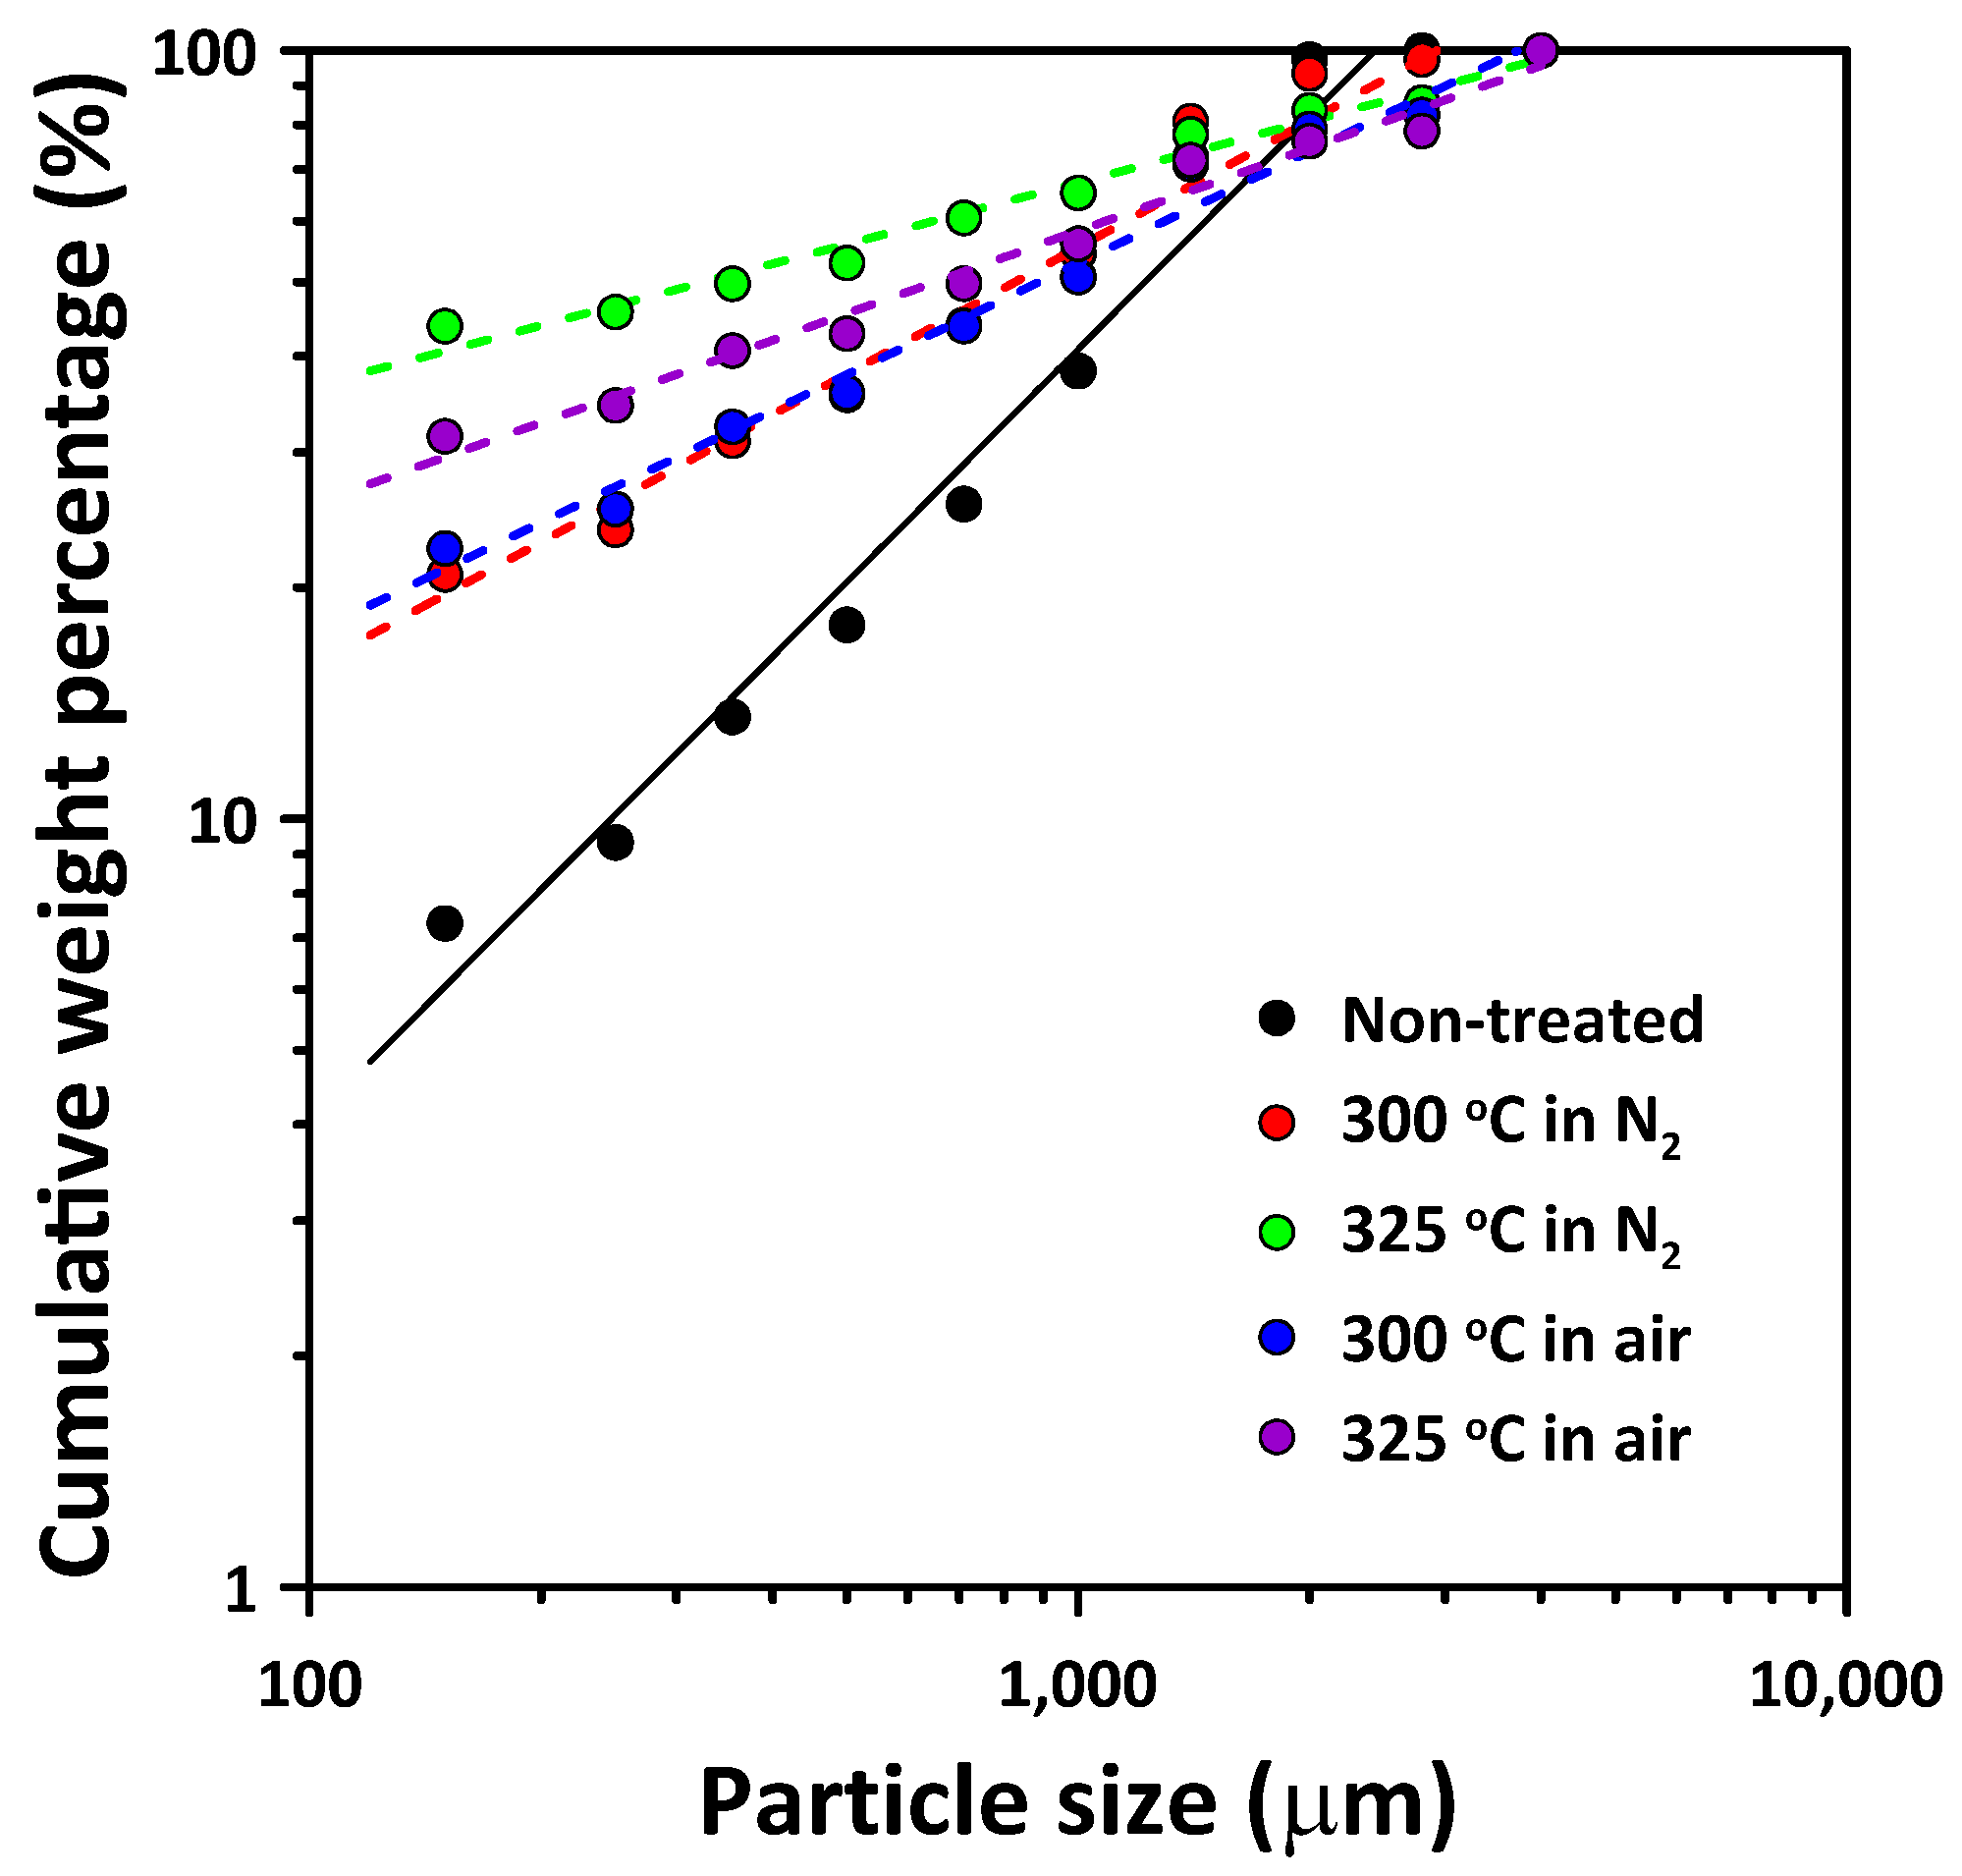
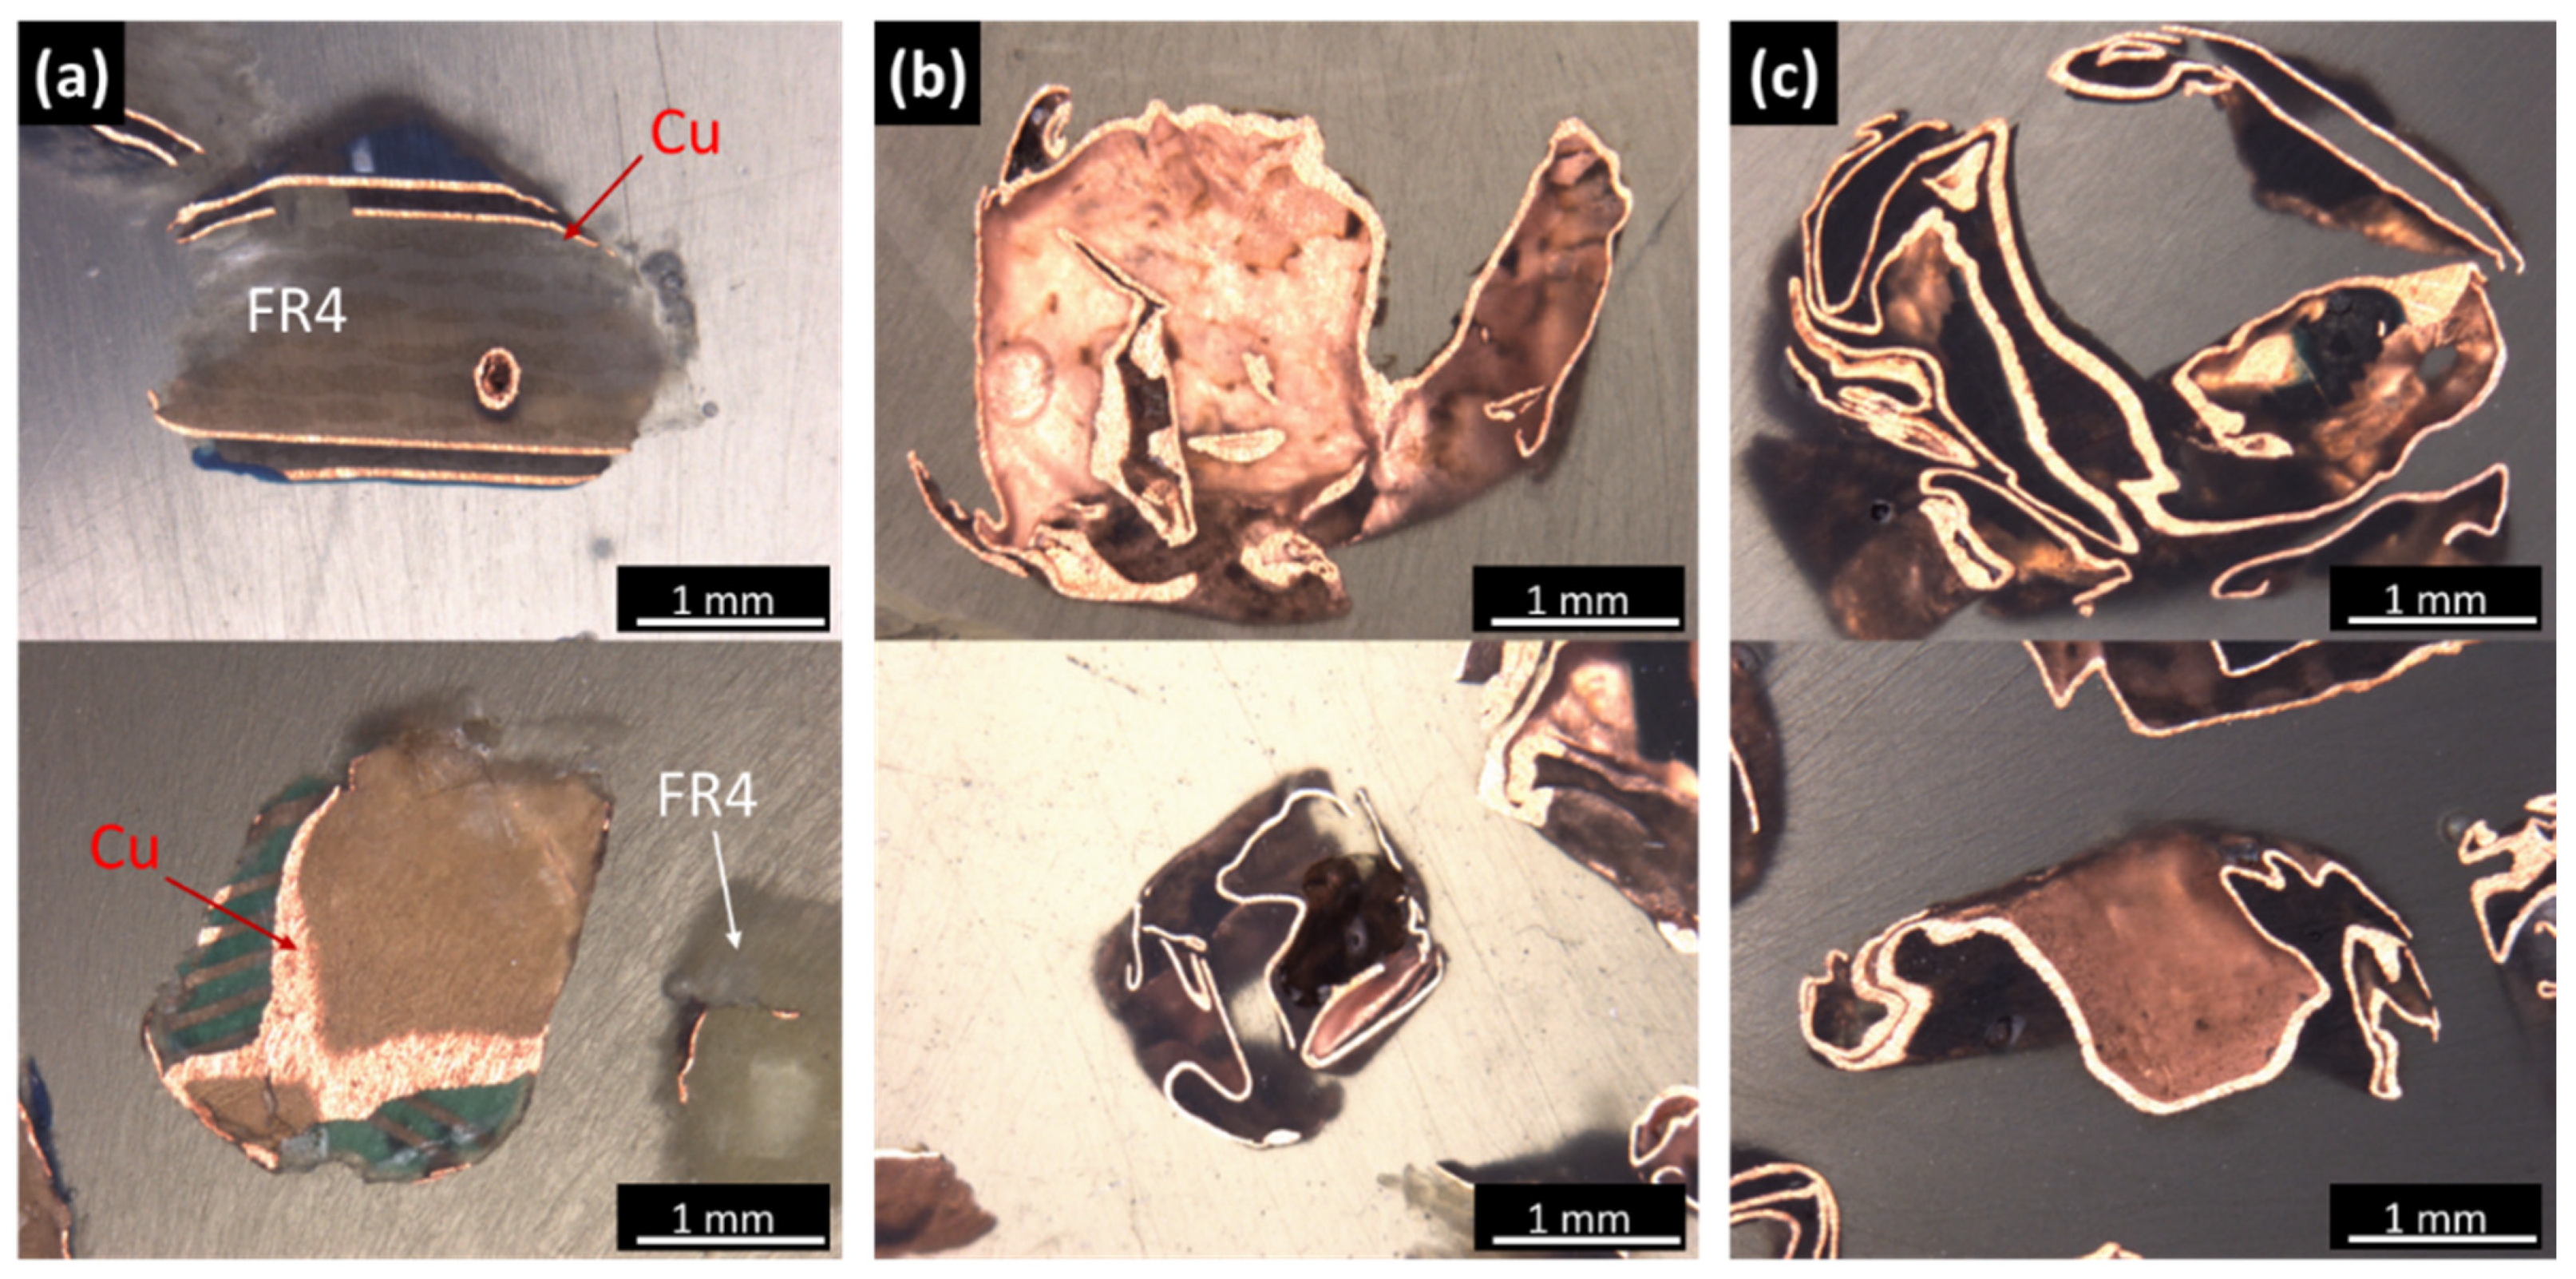
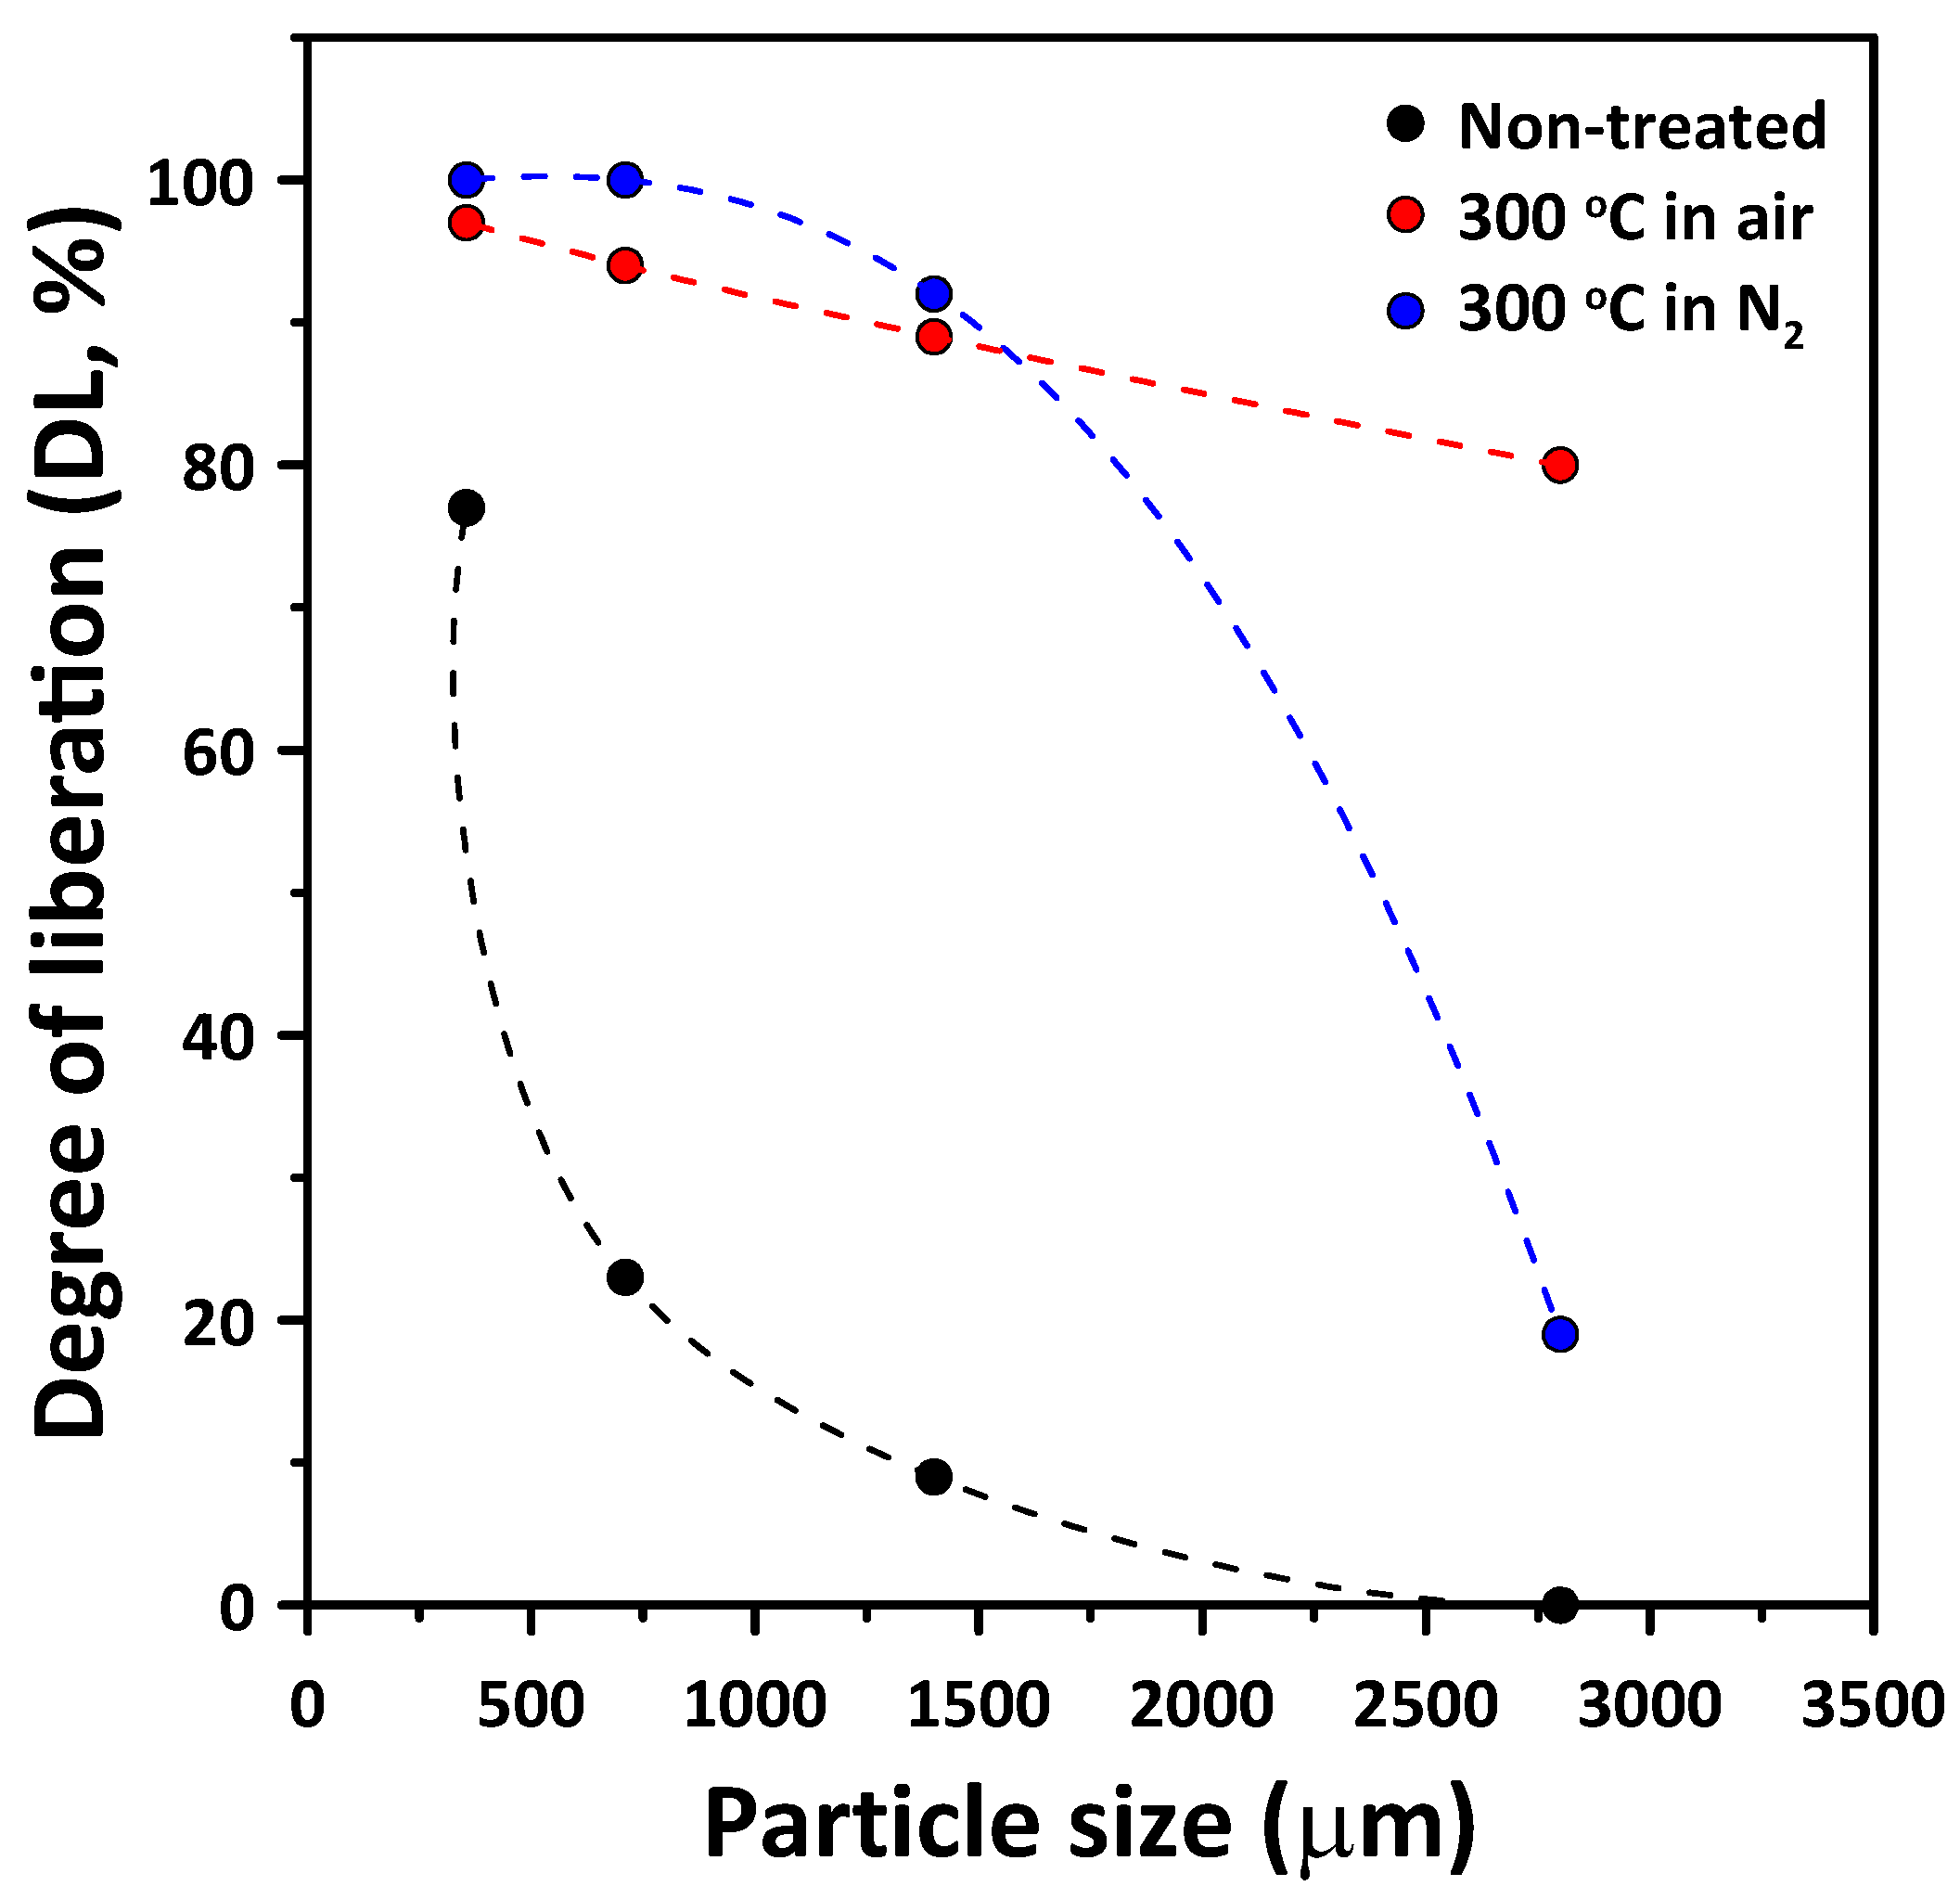
3.2. Comminution Behavior of Thermally Treated PCBs

Figure 5 shows the particle size distributions of the heat-treated PCB particles crushed by shredding and cut crushing according to the different temperatures and gas conditions. The PCB comminution product was sieved into 10 size categories ranging from 250 to 4000 μm, and their particle size distribution was identified. This model was applied to the GGS model. The higher the thermal treatment temperature, the lower the distribution modulus α, and the higher the size modulus D* because PCB-A300 and PCB-A325 were liberated with particle sizes larger than those of PCB-WT. In other words, the liberated FR-4 component was rapidly comminuted, owing to brittleness and high concentration in the size range of 250 μm or smaller, lowering the distribution modulus values. In contrast, the thin Cu plate liberated in the comminution process was ductile and produced with a larger particle size, resulting in higher size modulus values. The PCB-A300 and PCB-A325 also generated untied glass fibers that remained tangled during sieving and concentrated at particle sizes of 4000 μm or larger. Therefore, the maximum particle size also increased.
From the results of the size distribution of the crushed PCB particles according to the heat treatment, we determined that 300 °C is more suitable than a relatively high temperature (i.e., 325 °C). Therefore, among the comminution products of PCB-WT and PCB-A300, products ranging in size from 2800 to 4000 μm were used as test samples to show the degree of liberation (by image/optically). The particles were observed using an optical microscope, as shown in Figure 6. Of the PCB comminution products without thermal treatment, Cu was observed to remain in a layered structure together with FR-4. On the other hand, of the comminution products of PCB-A300, Cu was found as free particles with some irregular shapes, even in the 2800–4000 μm size range. This is because the liberated Cu particles were crumpled by shock inside the crusher, and it was indirectly verified that for this reason, the materials were separated from one another.
The images of PCB comminution products in the 355–500 μm, 710–1000 μm, 1400–2000 μm, and 2800–4000 μm size range were taken with a digital microscope, and the DL of Cu was assessed (see Figure 7). In the comminution products of PCB-WT, the DL of Cu was 0% in the range of 2800–4000 μm and less than 80% in the 355–500 μm range. On the other hand, PCB-A300 and PCB-N300 showed a significant increase in the DL of Cu in the comminution products. More specifically, for PCB-A300, the DL was 80.1% at 2800 μm or higher.
For PCB-N300, the DL was lower at particle sizes greater than 1400 μm. From this, it is expected that the PCB-A300 sample will have excellent Cu separation performance by electrostatic separation compared to the PCB-N300 sample.

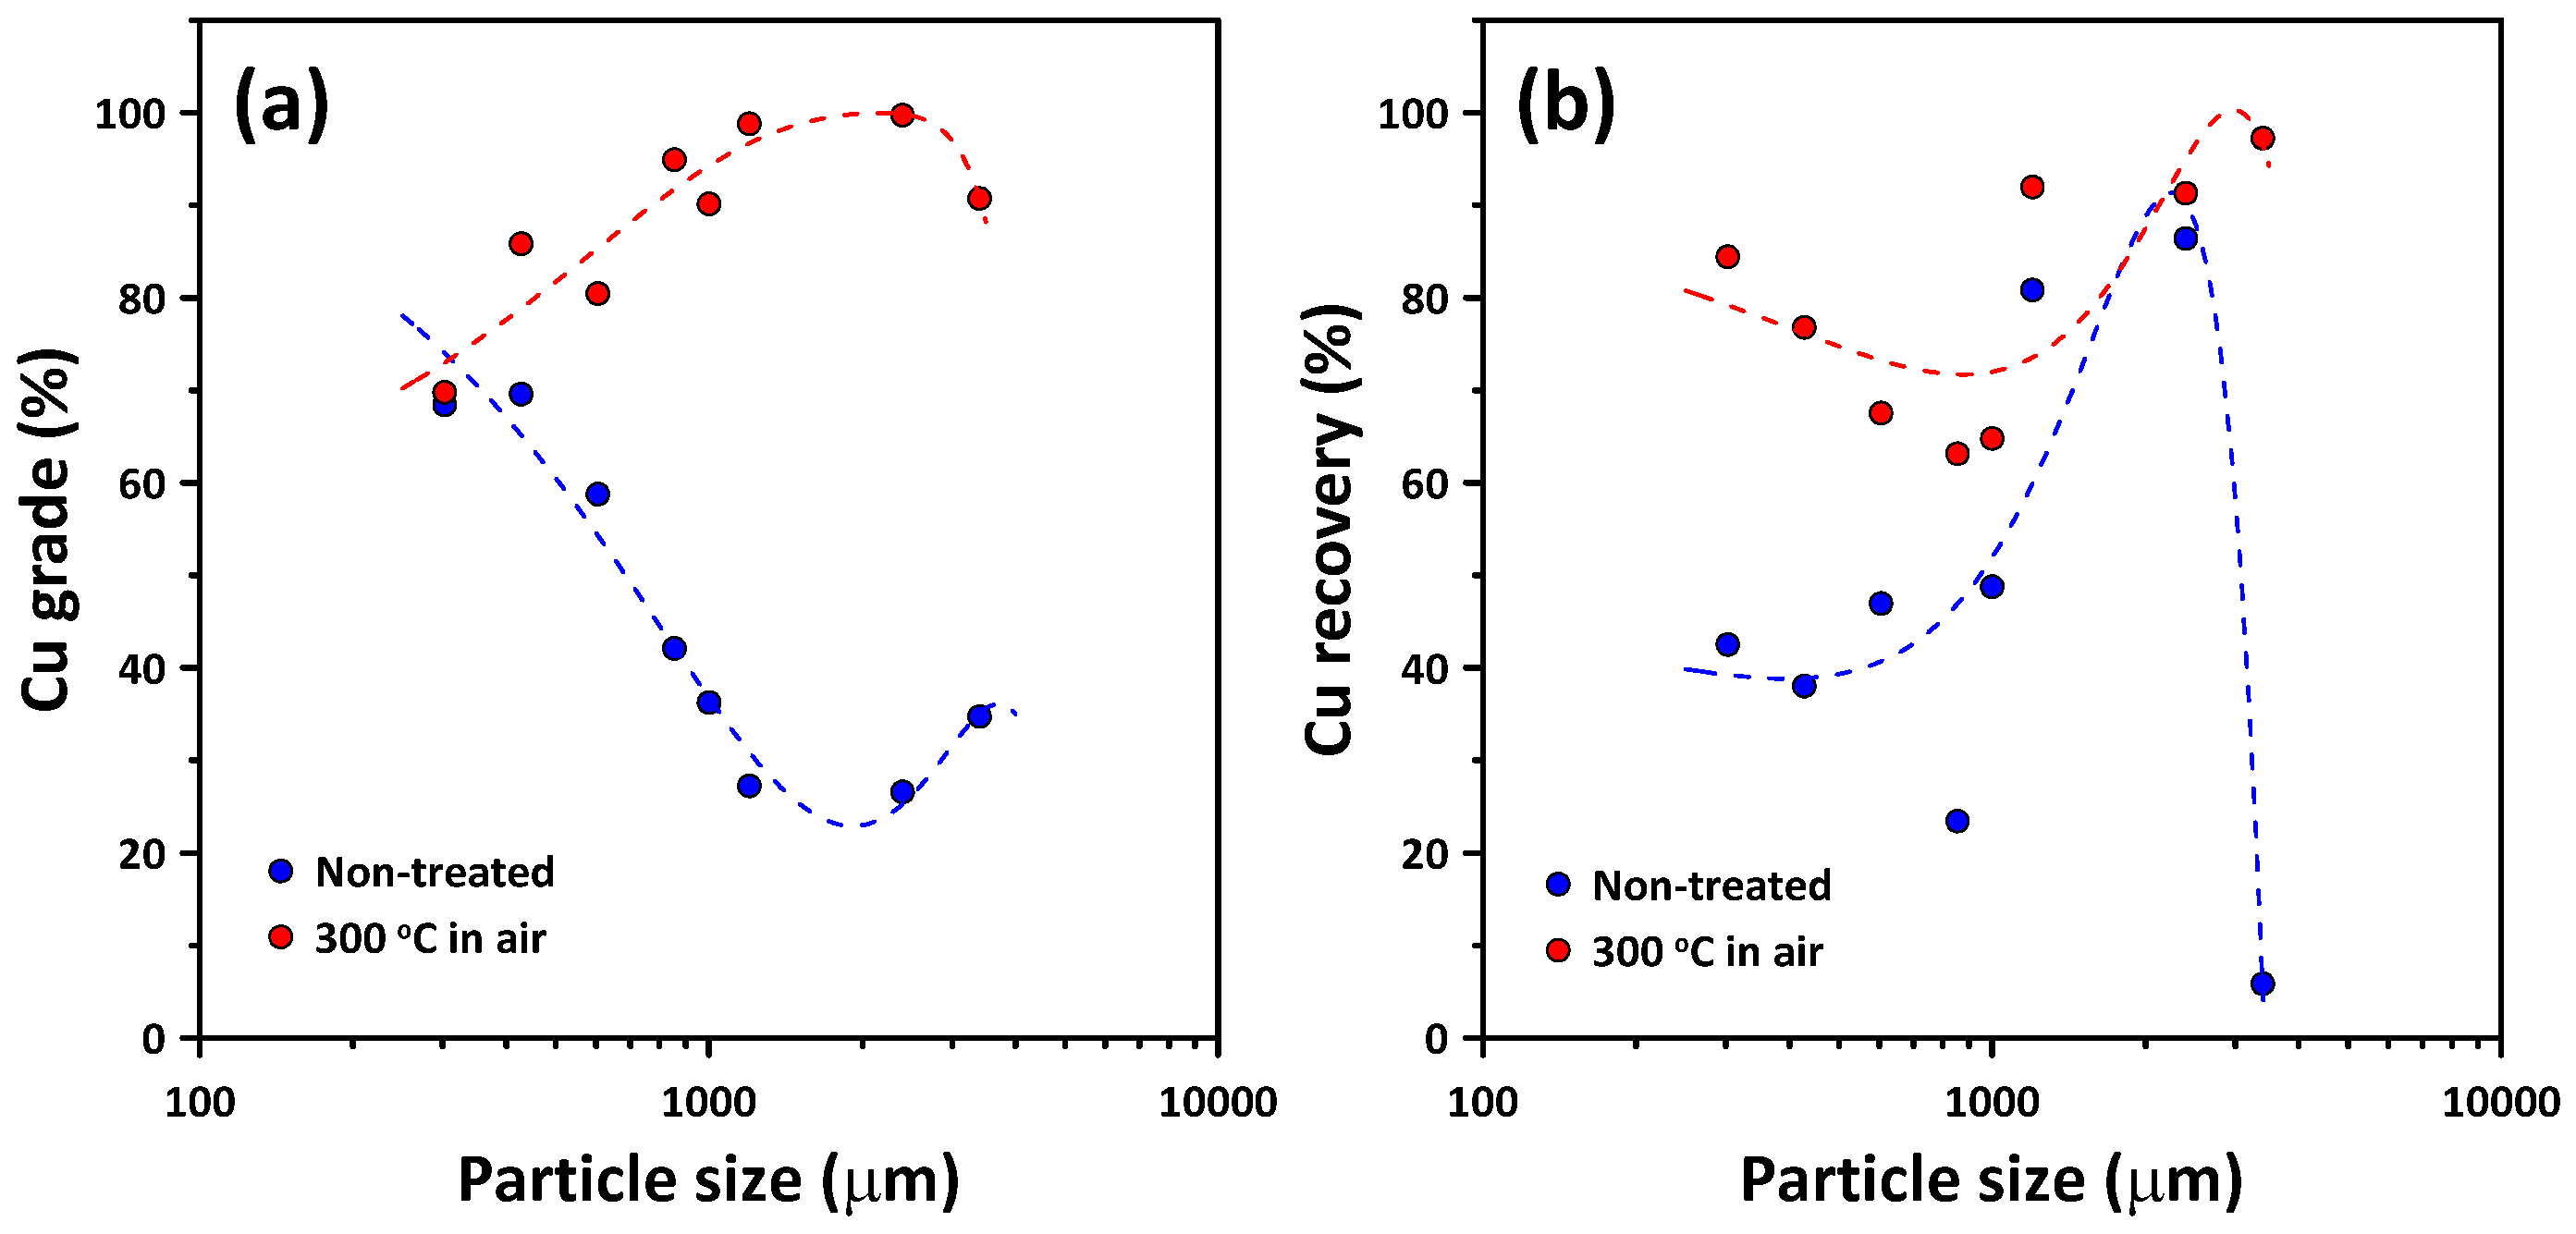
3.3. Cu Concentration by Electrostatic Separation

The above comprehensive results (e.g., particle size and liberation) indicate a high DL in the relatively large PCB-A300 particles. Therefore, the yield, Cu grade, and recovery evaluation through the electrostatic separation test were performed with PCB-A300 as well as with PCB-WT for comparison.
The comminution products of both PCB-WT and PCB-A300 in the 250–4000 μm particle size range were placed in an electrostatic separator. The yield of each product was calculated against the initial amount, as shown in Figure 8. PCB-WT showed no significant difference in yield between conductors and nonconductors. However, PCB-A300 exhibited a large difference in yield between conductor and nonconductor, and this difference was very apparent with particle size. At 500 μm or larger, the conductor ratio was very high, whereas for 500 μm or lower, the nonconductor ratio was high.
Figure 9 shows Cu grades of conductive particles according to the different heat treatment conditions. As seen in Figure 9a, for PCB-WT, the Cu grade of the conductor product increased with a decrease in the particle size and became the highest at 70 wt % in the 355–500 μm size range. For PCB-A300, the Cu grade was 70 wt % or more for all size ranges. The higher the particle size, the higher the Cu grade. In the particle size range of 710–1000 μm or more, the Cu grade was 90% or larger, and in the 2000–2800 μm range, the Cu grade was the highest at 99 wt %.
Figure 9b shows the recovery of PCB-A300 and PCB-WT. The PCB-WT first showed an increase in recovery with an increase in particle size, after which it fell sharply in the range of 2800–4000 μm. For PCB-A300, the recovery started at approximately 84 wt % in the 250–355 μm range; then, it gradually decreased until the 1400–2000 μm range, and then, it increased to 90 wt % or higher. Particles with a high DL were able to achieve a high recovery regardless of the particle size. Remarkably, the recovery increased compared to the recovery of non-thermally treated particles, which was low in the 2800–4000 μm size range.

4. Discussion

PCB layer separation according to thermal treatment can be explained by the differences in the coefficient of thermal expansion between the component materials of the PCB. The coefficients of thermal expansion of Cu, glass fiber, and epoxy resin that form the lamination structure of PCB are 16.7, 15–100, and 54 ppm/°C, respectively. When a PCB is heated, the differences in the thermal expansion ratios between the component materials lead to their expansion at mutually different expansion rates. In this process, internal shear stress is generated in the layers between them. When this internal stress exceeds the bonding strength between the board components, delamination occurs inside the board. If delamination does not occur, the components are still cooled to room temperature, and the internal stress remains in the PCB as residual stress to reduce the mechanical strength. This concept has already been proven both numerically and experimentally. Janáčová et al. [38] simulated the thermal expansion by employing the linear expansion ratios of epoxy resin and Cu that form PCB as well as the bond strength between the two. Through numerical analysis, they concluded that 350 °C was the optimal temperature for Cu layer separation. Li et al. [29] obtained SEM images of the cross-section of a PCB layer and found that micro delamination occurred after thermal treatment. They also found from the SEM micrographs of the epoxy resin interface that PCB thermal treatment helped epoxy resin to decrease the cohesive force between Cu and glass fiber that formed the laminar structure.
Materials consisting of conjugated substances, such as PCBs, have two markedly different properties. Such materials exhibit many unique characteristics during comminution. Ductility has the largest influence on comminution. In the grinding of a substance, its ductility determines the breakage rate (commonly called the specific rate of breakage in traditional mineral processing). Specifically, because Cu has a very high ductility, similar to any other metal components, it tends to be wrinkled rather than breakage during comminution. Thus, the particle size did not decrease easily. On the other hand, FR-4, a compound of epoxy resin and glass fiber, has a very low ductility (or has a very high brittleness, to put it differently). Therefore, once liberated, it was comminuted rapidly [39]. Park et al. [22] suggested that the comminution of objects consisting of two substances with mutually different ductilities shows the following behavior with a decrease in particle size.
(1) Only size reduction without liberation causes a grade change in each size fraction (e.g., Cu and FR-4 in the present study). (2) Liberation first increases the grade of the high-ductility substance (Cu in the present study) at coarser size fraction. (3) The high-ductility substance grade reaches its peak value and then decreases gradually at the fraction. (4) The high-ductility grade at the fraction of the substance reaches its minimum value and converges to a certain value. If the test particle sizes for moving from stage 1 to stage 2, stage 2 to stage 3, and stage 3 to stage 4 are D1, D2, and D3, respectively, the key of comminution preprocessing is to increase D1 and D2. In the present study, the PCBs without thermal treatment showed that D1—the particle size at which each component started to be liberated—was approximately 2000 μm; and D2, the particle size at which the Cu grade peaks, was approximately 800 μm. PCBs with potential layer separation through thermal treatment were rapidly liberated, even with a small impact. In the sieve separation with the size ranging between 250 and 4000 μm, D1 was not observed, and D2 was also indeterminate, suggesting that Cu liberation started from a particle size of 4000 μm or larger. The Cu and FR-4 liberated for large particle sizes had the maximum ductility difference, showing a large gap in each substance grade according to particle size. Given that it is difficult to physically separate the effective components from the ineffective ones in smaller particle groups [40,41], it is necessary to liberate the target component, Cu, from a large particle size range. In addition, for a particle size of 4000 μm or larger, a considerable amount of glass fibers remained tangled. Therefore, approximately 20.45% of the non-metal components could be removed by screening only. As shown above, under thermal treatment, Cu was liberated in particle sizes of a few millimeters only through crushing without fine grinding. This is a significant result in terms of energy savings and the reduction of metal loss by fine dust scattering.
Based on the electrostatic separation results, we could reaffirm the effect of thermal treatment on the liberation and separation efficiency enhancement. Compared with normal PCB comminution products, thermally treated PCB comminution products were found to have a marked contrast in yield between conductor and nonconductor for each particle size. This is evidently because of the Cu grade difference in the PCB comminution products depending on the particle size. Electrostatic separation enhancement can also be verified by the Cu grade in the conductor recovered via electrostatic separation under various conditions.
In the recovery studies, a reduction in Cu recovery for particles larger than 4000 μm of comminution products of PCB-NT was not expected. This can be explained as follows: In electrostatic separation, the selection efficiency is affected by the component through which a particle is attached to the rotation electrode. In other words, if a metal ingredient is attached to the electrode, the particles are collected in a conductor container. However, if a non-metal ingredient is attached, the particles are collected in a nonconductor container. If there is no delamination, only the nonconductor part of the particles is exposed, and then, the particles are collected in a nonconductor container. Therefore, many particles 4000 μm or larger were collected in the nonconductor container, resulting in decreased recovery. The PCB-A300 comminution products showed higher recovery than the comminution products of PCB-NTs for all sizes.
The collection of metal particles with large particle sizes is also beneficial in the metallurgy stage after physical separation. Specifically, it was reported that the increasing numbers of minute particles undermine the leaching efficiency because of increased particle–particle collision and severe attrition imposition. Furthermore, a problem is introduced in the filtration process following the leaching procedure [42,43,44]. Subsequently, the physical separation of coarse particles can be regarded as important for improving the efficiency of chemical processing after mechanical processing.
Therefore, after thermal treatment as a pretreatment step of comminution, the delamination of PCB increased the liberated particle size and drastically enhanced the physical separation efficiency. The thermal treatment temperature and conditions necessary for enhancing the liberation of metal/non-metal components in PCBs vary according to the origin of the PCB. Therefore, it is necessary to determine the properties of the corresponding samples. More studies are necessary to improve the physical separation process and purification process for Cu recovered in coarse size.

5. Conclusions

We implemented thermal treatment as a pretreatment to enhance Cu separation efficiency for waste PCBs from waste computers. We also investigated the changes in the properties of PCBs, DL, and separation efficiency, which depended upon the thermal treatment. The heat treatment of PCB was conducted at temperatures ranging from 200 to 325 °C under N2 and air atmospheres. TGA revealed that the largest mass reduction (Tm) occurred at 302 °C under both N2 and air. For PCB undergoing thermal treatment, delamination at 300 °C caused an increase in thickness. Moreover, at 300 °C, i.e., near the Tm, the bending strength decreased from approximately 386.36 to 74.52 MPa, and at 325 °C, it was approximately 24.26 MPa. The heat treatment has the effect of reducing the bonding strength between the glass fiber and the copper layer. This reduction in bonding force can play a role in improving the DL when crushing PCB. In this context, the PCB samples thermally treated at 300 °C were comminuted, which was followed by sieving to investigate the Cu liberation at various particle size ranges. The DL of copper was enhanced for all particle sizes. In particular, the DL increased significantly from 9.3% to 100% in the size range of 1400–2000 μm when the PCB was heat treated at 300 °C in air. Under these conditions, a high Cu grade concentrate with a high recovery could be obtained via electrostatic separation. As a result, this study elucidates the physical properties of PCBs and the DL under various heat treatment conditions. Heat treatment at 300 °C in air is found to be the most suitable for recovering copper from the PCB in terms of the DL.

Author Contributions

Conceptualization: B.K., S.H., S.P., D.-W.K., and Y.H.; methodology: B.K., S.H., S.P., M.J., S.K., H.-S.J., D.-W.K., and Y.H.; validation: B.K., S.H., S.P., M.J., S.K., and Y.H.; formal analysis: B.K., S.H., S.P.; investigation: B.K., S.H., S.P., M.J., C.-H.P., H.-S.J., and Y.H.; writing—original draft: B.K., S.H., S.P., S.K., M.J., and Y.H.; writing—review and editing: B.K., S.H., S.P., S.K., M.J., D.-W.K., and Y.H.; resources: C.-H.P., H.-S.J., D.-W.K., and Y.H.; supervision: D.-W.K., and Y.H. All authors have read and agreed to the published version of the manuscript.

Funding

This research was supported by the Basic Research Project (GP2020-013, 21-3212-1) of the Korea Institute of Geoscience and Mineral Resources (KIGAM) funded by the Ministry of Science, ICT, and Future Planning of Korea, and this work was also supported by the Korea Institute of Energy Technology Evaluation and Planning (KETEP) and the Ministry of Trade, Industry & Energy (MOTIE) of the Republic of Korea (No. 20206110100030).

Conflicts of Interest

The authors declare no conflict of interest.

References

  1. Li, J.; Xu, T.; Liu, J.; Wen, J.; Gong, S. Bioleaching metals from waste electrical and electronic equipment (WEEE) by Aspergil-lus niger: A review. Environ. Sci. Pollut. Res. 2021, 28, 1–16. [Google Scholar] [CrossRef] [PubMed]
  2. Cardamone, G.F.; Ardolino, F.; Arena, U. About the environmental sustainability of the European management of WEEE plastics. Waste Manag. 2021, 126, 119–132. [Google Scholar] [CrossRef] [PubMed]
  3. Behnamfard, A.; Salarirad, M.M.; Veglio, F. Process development for recovery of copper and precious metals from waste printed circuit boards with emphasize on palladium and gold leaching and precipitation. Waste Manag. 2013, 33, 2354–2363. [Google Scholar] [CrossRef]
  4. Fujita, T.; Ono, H.; Dodbiba, G.; Yamaguchi, K. Evaluation of a recycling process for printed circuit board by physical separation and heat treatment. Waste Manag. 2014, 34, 1264–1273. [Google Scholar] [CrossRef]
  5. Ghosh, B.; Ghosh, M.; Parhi, P.; Mukherjee, P.; Mishra, B. Waste Printed Circuit Boards recycling: An extensive assessment of current status. J. Clean. Prod. 2015, 94, 5–19. [Google Scholar] [CrossRef]
  6. Otsuki, A.; De La Mensbruge, L.; King, A.; Serranti, S.; Fiore, L.; Bonifazi, G. Non-destructive characterization of mechanically processed waste printed circuit boards-particle liberation analysis. Waste Manag. 2020, 102, 510–519. [Google Scholar] [CrossRef]
  7. Park, Y.J.; Fray, D.J. Recovery of high purity precious metals from printed circuit boards. J. Hazard. Mater. 2009, 164, 1152–1158. [Google Scholar] [CrossRef]
  8. Kim, S.; Park, S.; Han, S.; Han, Y.; Park, J. Silanol-rich ordered mesoporous silica modified thiol group for enhanced recovery performance of Au(III) in acidic leachate solution. Chem. Eng. J. 2018, 351, 1027–1037. [Google Scholar] [CrossRef]
  9. Cui, J.; Zhang, L. Metallurgical recovery of metals from electronic waste: A review. J. Hazard. Mater. 2008, 158, 228–256. [Google Scholar] [CrossRef]
  10. Hino, T.; Agawa, R.; Moriya, Y.; Nishida, M.; Tsugita, Y.; Araki, T. Techniques to separate metal from waste printed circuit boards from discarded personal computers. J. Mater. Cycles Waste Manag. 2009, 11, 42–54. [Google Scholar] [CrossRef]
  11. Lee, J.; Kim, Y.; Lee, J.-C. Disassembly and physical separation of electric/electronic components layered in printed circuit boards (PCB). J. Hazard. Mater. 2012, 241, 387–394. [Google Scholar] [CrossRef] [PubMed]
  12. Cucchiella, F.; D’Adamo, I.; Koh, S.L.; Rosa, P. Recycling of WEEEs: An economic assessment of present and future e-waste streams. Renew. Sustain. Energy Rev. 2015, 51, 263–272. [Google Scholar] [CrossRef] [Green Version]
  13. Cilek, E.C.; Tuzci, G. Flotation behavior of native gold and gold-bearing sulfide minerals in a polymetallic gold ore. Part. Sci. Technol. 2021, 1–9. [Google Scholar] [CrossRef]
  14. Jameson, G.J.; Emer, C. Coarse chalcopyrite recovery in a universal froth flotation machine. Miner. Eng. 2019, 134, 118–133. [Google Scholar] [CrossRef]
  15. Silvas, F.P.; Correa, M.M.J.; Caldas, M.P.; de Moraes, V.T.; Espinosa, D.C.; Tenório, J.A. Printed circuit board recycling: Physical processing and copper extraction by selective leaching. Waste Manag. 2015, 46, 503–510. [Google Scholar] [CrossRef] [PubMed]
  16. Duan, H.; Hou, K.; Li, J.; Zhu, X. Examining the technology acceptance for dismantling of waste printed circuit boards in light of recycling and environmental concerns. J. Environ. Manag. 2010, 92, 392–399. [Google Scholar] [CrossRef]
  17. Park, S.; Kim, S.; Han, Y.; Park, J. Apparatus for electronic component disassembly from printed circuit board assembly in e-wastes. Int. J. Miner. Process. 2015, 144, 11–15. [Google Scholar] [CrossRef]
  18. Cui, J.; Forssberg, E. Mechanical recycling of waste electric and electronic equipment: A review. J. Hazard. Mater. 2003, 99, 243–263. [Google Scholar] [CrossRef]
  19. Li, J.; Lu, H.; Guo, J.; Xu, Z.; Zhou, Y. Recycle Technology for Recovering Resources and Products from Waste Printed Circuit Boards. Environ. Sci. Technol. 2007, 41, 1995–2000. [Google Scholar] [CrossRef] [PubMed]
  20. Veit, H.M.; De Pereira, C.C.; Bernardes, A.M. Using mechanical processing in recycling printed wiring boards. JOM 2002, 54, 45–47. [Google Scholar] [CrossRef]
  21. Guo, C.; Wang, H.; Liang, W.; Fu, J.; Yi, X. Liberation characteristic and physical separation of printed circuit board (PCB). Waste Manag. 2011, 31, 2161–2166. [Google Scholar] [CrossRef] [PubMed]
  22. Park, S.; Kim, S.; Han, S.; Kim, B.; Kim, B.; Han, Y.; Park, J. Liberation Characteristics Assessment for Copper Component in PCB Comminution Product by Image Analysis. Mater. Trans. 2018, 59, 1493–1500. [Google Scholar] [CrossRef]
  23. Jie, G.; Ying-Shun, L.; Mai-Xi, L. Product characterization of waste printed circuit board by pyrolysis. J. Anal. Appl. Pyrolysis 2008, 83, 185–189. [Google Scholar] [CrossRef]
  24. Zhao, Y.; Wen, X.; Li, B.; Tao, D. Recovery of copper from waste printed circuit boards. Mining, Met. Explor. 2004, 21, 99–102. [Google Scholar] [CrossRef]
  25. Kang, K.D.; Ilankoon, I.M.S.K.; Dushyantha, N.; Chong, M.N. Assessment of Pre-Treatment Techniques for Coarse Printed Circuit Boards (PCBs) Recycling. Minerals 2021, 11, 1134. [Google Scholar] [CrossRef]
  26. Verma, H.R.; Singh, K.K.; Mankhand, T.R. Liberation of metal clads of waste printed circuit boards by removal of halogenated epoxy resin substrate using dimethylacetamide. Waste. Manag. 2017, 60, 652–659. [Google Scholar] [CrossRef]
  27. Huang, Y.F.; Pan, M.W.; Lo, S.L. Hydrometallurgical metal recovery from waste printed circuit boards pretreated by microwave pyrolysis. Resour. Conserv. Recycl. 2020, 163, 105090. [Google Scholar] [CrossRef]
  28. Li, J.; Duan, H.; Yu, K.; Liu, L.; Wang, S. Characteristic of low-temperature pyrolysis of printed circuit boards subjected to various atmosphere. Resour. Conserv. Recycl. 2010, 54, 810–815. [Google Scholar] [CrossRef]
  29. Li, J.; Duan, H.; Yu, K.; Wang, S. Interfacial and Mechanical Property Analysis of Waste Printed Circuit Boards Subject to Thermal Shock. J. Air Waste Manag. Assoc. 2010, 60, 229–236. [Google Scholar] [CrossRef] [Green Version]
  30. Hadi, P.; Xu, M.; Lin, C.S.; Hui, C.-W.; McKay, G. Waste printed circuit board recycling techniques and product utilization. J. Hazard. Mater. 2014, 283, 234–243. [Google Scholar] [CrossRef]
  31. Li, J.; Lu, H.; Liu, S.; Xu, Z. Optimizing the operating parameters of corona electrostatic separation for recycling waste scraped printed circuit boards by computer simulation of electric field. J. Hazard. Mater. 2008, 153, 269–275. [Google Scholar] [CrossRef] [PubMed]
  32. Veit, H.M.; Diehl, T.R.; Salami, A.P.; Rodrigues, J.d.S.; Bernardes, A.M.; Tenório, J.A.S. Utilization of magnetic and electro-static separation in the recycling of printed circuit boards scrap. Waste Manag. 2005, 25, 67–74. [Google Scholar] [CrossRef]
  33. Li, J.; Xu, Z.; Zhou, Y. Application of corona discharge and electrostatic force to separate metals and nonmetals from crushed particles of waste printed circuit boards. J. Electrost. 2007, 65, 233–238. [Google Scholar] [CrossRef]
  34. Xue, M.; Yan, G.; Li, J.; Xu, Z. Electrostatic Separation for Recycling Conductors, Semiconductors, and Nonconductors from Electronic Waste. Environ. Sci. Technol. 2012, 46, 10556–10563. [Google Scholar] [CrossRef]
  35. Han, Y.; Kim, S.B.; Kim, H. TiO2-Coated Silica Foams by In-Situ Sol-Gel Reaction. Mater. Trans. 2011, 52, 2245–2249. [Google Scholar] [CrossRef] [Green Version]
  36. Barontini, F.; Marsanich, K.; Petarca, L.; Cozzani, V. Thermal Degradation and Decomposition Products of Electronic Boards Containing BFRs. Ind. Eng. Chem. Res. 2005, 44, 4186–4199. [Google Scholar] [CrossRef]
  37. Chiang, H.-L.; Lo, C.-C.; Ma, S.-Y. Characteristics of exhaust gas, liquid products, and residues of printed circuit boards using the pyrolysis process. Environ. Sci. Pollut. Res. 2009, 17, 624–633. [Google Scholar] [CrossRef]
  38. Janáčová, D.; Kolomazník, K.; Vašek, V.; Křenek, J.; Uhlířová, M. Separation of printed circuit board by temperature shock. In Proceedings of the 5th WSEAS Conference on Heat Transfer, Thermal Engineering and Environment HTE’07, Athens, Greece, 25–27 August 2007. [Google Scholar]
  39. Koyanaka, S.; Endoh, S.; Ohya, H. Effect of impact velocity control on selective grinding of waste printed circuit boards. Adv. Powder Technol. 2006, 17, 113–126. [Google Scholar] [CrossRef]
  40. Richard, G.M.; Mario, M.; Javier, T.; Susana, T. Optimization of the recovery of plastics for recycling by density media separation cyclones. Resour. Conserv. Recycl. 2011, 55, 472–482. [Google Scholar] [CrossRef]
  41. Tuncuk, A.; Stazi, V.; Akcil, A.; Yazici, E.Y.; Deveci, H. Aqueous metal recovery techniques from e-scrap: Hydrometallurgy in recycling. Miner. Eng. 2012, 25, 28–37. [Google Scholar] [CrossRef]
  42. Huang, J.; Chen, M.; Chen, H.; Chen, S.; Sun, Q. Leaching behavior of copper from waste printed circuit boards with Brønsted acidic ionic liquid. Waste Manag. 2014, 34, 483–488. [Google Scholar] [CrossRef] [PubMed]
  43. Kamberović, Ž.; Korać, M.; Ivšić, D.; Nikolić, V.; Ranitović, M. Hydrometallurgical process for extraction of metals from electronic waste-part I: Material characterization and process option selection. Metall. Mater. Eng. 2018, 15, 231–243. [Google Scholar] [CrossRef]
  44. Jadhao, P.; Chauhan, G.; Pant, K.; Nigam, K. Greener approach for the extraction of copper metal from electronic waste. Waste Manag. 2015, 57, 102–112. [Google Scholar] [CrossRef] [PubMed]
Figure 1. Flowsheet and photo images of PCBA used in this study. PCB and ECs were separated in PCBA, and the ground particles were prepared from PCB by shredding and cut crushing. Schematic of liberation of copper and epoxy resin according to particle size by the typical crushing/grinding method.
Minerals 11 01213 g001
Figure 2. Front and side images of waste shredded PCB with EC disassembled for copper separation from waste PCB.
Minerals 11 01213 g002
Figure 3. TGA-DTA curves of the PCBs according to the nitrogen and air conditions. Solid lines represent the TGA curve and dotted lines represent the DTA curve.
Minerals 11 01213 g003
Figure 4. Bending strength results of PCB used in this study according the different temperatures and gas conditions: (a) air and (b) nitrogen. The black dotted line represents the nontreated PCB sample. The error bar denotes standard deviations. SEM images of the PCB cross-section treated from thermal process: (c) 275 °C in air, (d) 300 °C in air, (e) 325 °C in air, and (f) 275 °C in N2, (g) 300 °C in N2, and (h) 325 °C in N2.
Minerals 11 01213 g004
Figure 5. Particle size distributions of the thermally treated PCB particles crushed by shredding and cut crushing according to the different temperatures and gas conditions.
Minerals 11 01213 g005
Figure 6. SEM images of the crushed PCB particles in the range of −4000 to +2800 μm: (a) nontreated raw, (b) 300 °C in air, and (c) 300 °C in nitrogen.
Minerals 11 01213 g006
Figure 7. Degree of liberation (DL) of the thermally treated PCB particles at 300 °C in the various gas conditions (air and nitrogen).
Minerals 11 01213 g007
Figure 8. Yield of conductive and nonconductive particles after electrostatics separation for (a) the crushed PCB particles (PCB-WT) and (b) the crushed PCB particles treated at 300 °C in air (PCB-A300). Gray bar represents nonconductive yield, and red and blue represent conductive yield, respectively.
Minerals 11 01213 g008
Figure 9. Cu (a) grade and (b) recovery of the crushed PCB particles (PCB-WT) and (b) the crushed PCB particles by electrostatic separation treated at 300 °C in air (PCB-A300).
Minerals 11 01213 g009
Table 1. Operating parameters and conditions of corona discharge electrostatic separation for recycling copper from waste PCB particles.
Operating Parameters Operating Conditions
Supplied voltage (kV)−30
Rotation speed (rpm)30
Distance of induction electrode (m)0.3
Degree of induction electrode (o)20
Distance of corona electrode (m)0.3
Degree of corona electrode (o)60
Relative humidity (%)35 ± 5
Publisher’s Note: MDPI stays neutral with regard to jurisdictional claims in published maps and institutional affiliations.

