1. Introduction
The Kalahari Manganese Field (KMF) in South Africa is the largest land-based metallurgical grade manganese ore deposit in the world, containing 74% of known global manganese resources [
1]. The main South African manganese ores fall into two groups, carbonate-containing ore (Mamatwan-type), such as Mamatwan or Gloria ore mined at different mines, but from the same ore body, and high manganese and iron-containing ores (Wessels-type), such as Wessels or Nchwaning ore [
2,
3]. These ores are used across the world as feed material in carbothermic reduction processes, mainly SAF (Submerged Arc Furnaces) production units, to produce HCFeMn (High Carbon Ferromanganese) and SiMn (silico-manganese) alloys. Carbothermic reduction of manganese ores was extensively studied in the past [
4,
5,
6,
7,
8]. These studies illustrated the complex mineralogy changes, which occur as the ore reduction process proceeds. Manganese ore reduction is quite complex at intermediate reaction temperatures of 1100–1400 °C due to the formation of liquid oxide and/or alloy phases in varying phase proportions and distributions. Carbothermic reduction of MnO is expressed as in reaction (1).
Consisting of the combination of the Boudouard reaction and MnO reduction by CO:
< > = solid; ( ) = liquid; [ ] = gas
However, the Mn produced in the reduction reaction may form a liquid alloy phase or crystalline mixed Fe–Mn carbide phase, depending on the quantity of Fe and/or C incorporated in the Mn reduction product. Considering unit activities and 1 atm
to calculate the Gibbs energy for MnO reduction reactions, as displayed in
Figure 1, it is confirmed that reduction of pure MnO by pure C to form pure Mn metal as per reaction (1) can proceed at temperatures higher than 1407 °C. The minimum required temperature for reduction of pure MnO to the different manganese carbides is lower, ranging from 1345 °C for Mn
7C
3 formation to 1364 °C for Mn
23C
6 formation. Thermodynamic calculations show that, irrespective of the reaction product being pure manganese or manganese carbides, the reduction of MnO by CO in the absence of carbon cannot proceed in the temperature band displayed in
Figure 1 (1150–1450 °C). The data displayed in
Figure 1 are from calculations made in the reaction module of FactSage 6.4.
It has been shown that a lower manganese activity in the alloy phase (Fe-Mn-C) will drive reaction (1) to the right-hand side and lower the minimum required reaction temperature for a carbothermic reduction of MnO [
9,
10,
11]. Furthermore, if the MnO activity is high enough at a reaction temperature, and the Mn activity is low enough, then MnO is reduced by CO gas in the presence of carbon, and the function of carbon reductant is to maintain a low CO
2 partial pressure in the reaction system via the Boudouard reaction (2), [
11]. Various studies presented clear evidence that the initial iron metal prills formed in manganese ore reduction are subsequently enriched in Mn and C as manganese ore reduction proceeds [
4,
5,
6,
7,
8,
12,
13,
14]. Therefore, the initial reduction of MnO results in Fe-Mn-C alloy formation with a progression in %Mn and %C, and not the precise stoichiometry of the carbides, such as (Mn,Fe)
23C
6, (Mn,Fe)
3C, (Mn,Fe)
5C
2, and (Mn,Fe)
7C
3 of increasing carbon content levels of 5.4 %C, 6.8 %C, 8.0 %C, and 8.6 %C. It was clearly shown that MnO reduction rates at 1300 °C increased with increased ore iron content in Wessels ore [
7]. Comparison of South African ore reduction rates in terms of ore iron content seems to confirm this trend [
15].
The complex ore reaction system can be simplified by using chemically pure MnO in reduction experiments, and so liquid oxide formation is excluded below 1844 °C. This approach allows this study to focus on alloy phase formation and its effect on MnO reduction. The carbothermic reduction of pure MnO was studied in a few instances to better investigate MnO reduction mechanisms and the effect of compound additions on the reduction process [
16,
17]. The latter work studied the effect of increased amounts of metallic Fe on MnO reduction. Rankin and Van Deventer [
16] reacted pure MnO (−250 + 180 µm) with graphite (−180 + 125 µm) at 1200–1350 °C. The effect of individual oxide additions on the reduction process was studied at 1350 °C reaction temperature. It was found that the addition of iron oxide (Fe
2O
3) in small quantities (2.5–10% Fe
2O
3) increased the MnO reduction rate somewhat, whilst the addition of 2.5–10% SiO
2 decreased the MnO reduction rate due to the formation of the MnSiO
3 phase, which coated some of the MnO particle surfaces. The importance of reductant proximity in MnO reduction was clearly explained by Rankin and Wynnycki [
18], in considering experimental results in the prior work of Rankin and Van Deventer [
16], in which pure MnO-graphite mixtures were reacted at 1250 to 1425 °C. The authors used modelling to show that the rate-controlling step in most of the MnO-graphite reduction experiments was the intrinsic transport of CO
2 from MnO particle surfaces to the carbon reductant surface, and not the Boudouard reaction as previously thought.
Liu et al. [
19] studied the reduction of MnO
2-Fe
2O
3 mixtures under methane-hydrogen gas at 900–1300 °C. The alloy products formed fall within the Fe-Mn-C alloy products of importance to this study, although the reduction system is much more reducing due to the methane gas input. Kim and Jung [
17] studied the carbothermic reduction of MnO in the presence of increased additions of metallic iron (0, 5, 15, and 25 mass% Fe addition) at 1100, 1200, and 1300 °C for a 180 min reaction time under Argon gas. Reagent grade MnO (−250 + 63 µm), synthetic pure graphite of 5 µm, and metallic iron of 150 µm were used as input materials. A large MnO reduction rate increase was observed at 25 mass% Fe additions at a 1300 °C reaction temperature, whilst the effect was much smaller at 1100 and 1200 °C. The addition of 25 mass% Fe to MnO reacted at 1100 °C resulted in the same reduction rate as pure MnO (with no Fe addition) reacted at 1300 °C for the same time period. XRD (X-ray diffraction) analyses were used to identify phases in reduced samples at 25 mass% Fe additions and 0 mass% Fe additions. In the absence of metallic iron additions, the only carbide phase formed was Mn
7C
3 at 1100–1300 °C reaction temperatures. In the presence of 25 mass% Fe additions, various carbide phases formed. At 1100 and 1200 °C, only (Mn,Fe)
3C formed, and at 1300 °C (Mn,Fe)
3C and (Mn,Fe)
5C
2 formed. The authors did not report any individual carbide phase analyses by SEM (Scanning electron microscopy); therefore, the level of substitution of Fe for Mn in (Mn,Fe)
3C and (Mn,Fe)
5C
2 was assumed to be at the input level of iron addition (25 mass% Fe). This assumption is most likely inaccurate since the level of MnO reduction in these experiments never reached the endpoint of 100%. In addition, it is well known from manganese ore reduction studies that there is a progression in alloy composition with increased levels of MnO reduction, from the initial pure Fe phase formed, which is subsequently enriched in Mn and C as MnO reduction proceeds to form the Fe-Mn-C alloy and/or carbides [
4,
5,
6,
7,
8,
12]. Quantitative analyses of the Fe-Mn-C alloy phase compositions will provide much-needed information on the reduction alloy phase composition changes with changing experimental conditions. The objective of this study is to identify and thermodynamically analyse iron-manganese-carbon phase formation at low temperatures (1000–1200 °C) in carbothermic reduction of pure MnO at different levels of iron addition. The levels of iron addition were selected to present approximate iron levels in typical Wessels-type and Mamatwan-type ore analyses of 15 mass% Fe in Wessels ore and 5 mass% Fe in Mamatwan ore [
12].
2. Materials and Methods
Reagent grade MnO (100%−150 μm), graphite (100%−45 μm), and iron metal powder (100%−50 µm) were used as input materials to prepare pressed pellets of 15 g each. The input material proportions and reaction temperatures used in the experiments are illustrated in
Table 1. Each pellet was reacted under Argon gas in a retort tube furnace. The pellet was loaded into the reactor tube, and the reactor tube was closed and positioned in the furnace heating space. Then the reactor tube was flushed with Argon gas whilst still at room temperature. Whilst the Argon gas flow rate of 1100 cm
3/minute was maintained through the reactor tube volume, the furnace heating cycled from room temperature to the target temperature started. The reactor tube was heated to the target temperature at 13 °C per minute and held at the target temperature for 60 min, and then the furnace was switched off to let the reactor tube cool down in the furnace volume under Argon gas flow through the reactor tube. Once the reactor tube cooled to room temperature, it was opened, and the pellet recovered. The pellet mass was recorded before and after the reaction to calculate the percentage MnO reduction, assuming that the pellet mass loss was due to CO formation according to reaction (1). The pellet was split lengthwise into subsamples submitted for analyses by XRD (X-ray diffraction) and SEM-WDS (Scanning electron microscopy-Wavelength dispersive spectroscopy).
XRD samples were prepared according to the standardised Panalytical backloading system, which provides a nearly random distribution of the particles. The samples were analysed using a PANalytical X’Pert Pro powder diffractometer (Malvern Panalytical, Almelo, The Netherlands) in a θ–θ configuration with an X’Celerator detector and variable divergence and receiving slits with Ni filtered Cu-Kα radiation (λ = 1.5406 Å). The mineralogy was determined by selecting the best–fitting pattern from the ICSD database to the measured diffraction pattern, using X’Pert Highscore plus software (version 4.9).
SEM-WDS analyses of carbon coated polished sections were performed in 15 kV and 30–40 nA. Reference materials were used to calibrate for the analysed elements. Alloy phase analyses of the elements Mn, Fe, Si, Ca, and S were calibrated by using elemental reference materials and P from GaP reference material. For oxide phase analyses, the following elements were calibrated for by using oxide materials standards: Na, Al, Mg, Si, P, S, K, Ca, Ba, Ti, Mn, and Fe. The alloy carbon content was calculated as the difference between the alloy analysis and 100%. Similar alloy analyses were performed previously for manganese alloy phase areas in reduced manganese ore samples with the SEM-WDS calibrated against standards for the individual main alloying elements and carbon. With this procedure, a carbon detection limit of 1% was achieved [
12]. Here the same procedure was followed, except for the exclusion of carbon from the elemental calibration. Therefore, the only unknown analysis quantity in the alloy SEM-WDS analyses should be %C.
3. Results
The results in
Figure 2a confirm that limited MnO reduction occurred at 1000 and 1100 °C, as compared to 1200 °C. The trend of increased reduction extent with increased Fe addition is shown in
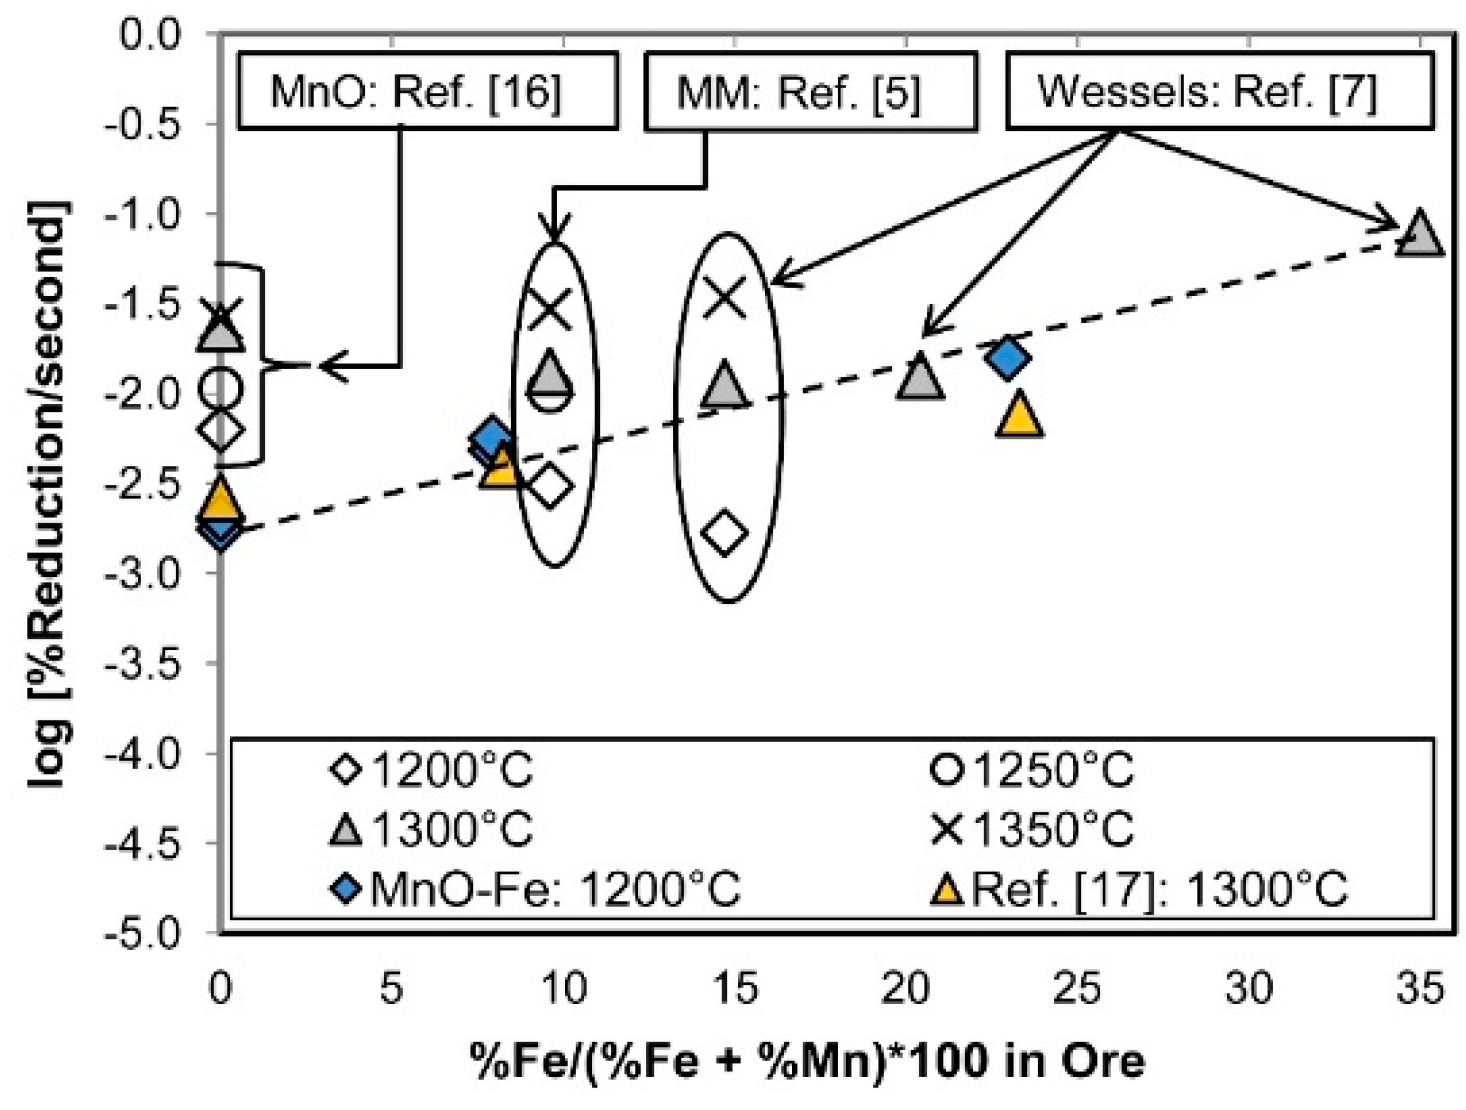
Figure 2b for a 1200 °C reaction temperature. The reaction time at the temperature was 60 min for each sample. Reduction rate data from this work and from the literature are compared in
Figure 3. The reduction data from this study was translated to reduction rate numbers by assuming the MnO reduction vs. time plot follows a straight line at 1200 °C, similar to previously reported MnO reduction trends at low temperatures [
12,
17]. The rates are presented as a function of iron content in ores and MnO-C mixtures reacted at intermediate temperatures of 1000−1350 °C. All the studies reported %Reduction vs. time information based on the %Reduction calculated from mass loss measurements, assuming only CO evolved from the reduction reactions. It is seen that the reduction rate values from this work (blue filled diamond icons) correspond to the work of Kim and Jung [
17], yellow filled triangles, for similar experiments done at 1300 °C for pure MnO-Fe-C mixtures. The reduction rates from Rankin and Van Deventer [
16] appear higher at all temperatures. Because of different reactant particle sizes used in the tests, and different ore mineralogy and consequently differing extent and chemistry of glass phase formation in the ores, conclusions on the trends in
Figure 4 should be made with caution. However, it appears that the trend of increased MnO reduction rates with increasing iron content holds.
The XRD patterns for samples A-E from the tests summarised in
Table 1 are illustrated in
Figure 4. The XRD analyses confirm the presence of Mn
7C
3 in samples B, C, and D. However, the XRD analyses are only qualitative; therefore, detailed phase analyses were performed to investigate phase formation and phase analyses in samples B, C, and D. Areas at the pellet centre and pellet surface were selected for SEM-WDS analyses.
Typical BSE (Backscattered electron) images of areas at the centre of each pellet are shown in
Figure 5a,
Figure 6a and
Figure 7a. The smaller analysed areas in each sample are shown in
Figure 5b,
Figure 6b and
Figure 7b, and the associated SEM-WDS analyses are shown in
Table 2,
Table 3 and
Table 4, respectively. The black areas are filled by graphite, although not clear from the BSE images because the graphite particles are below the polished surface. The MnO particles appear mostly porous, with few dense particles seen. The internal pores in the MnO particles are partially filled with alloy in samples B and C, which were reacted at 1200 °C with 5 mass% Fe and 15 mass% Fe added, but not in the case of sample D, which was reacted at 1100 °C. The alloy-filled MnO particles appear jagged at the edges, unlike the MnO particles, which are not alloy infiltrated. Larger scale alloy infiltration appears at the edges of the partially-consumed MnO particles, as indicated by the area marked by the square in
Figure 5b. This alloy must have been fluid at the reaction temperature to be able to flow into the larger MnO particle gaps. The alloy areas in
Figure 5 and
Figure 6 for 1200 °C reaction temperature appear homogeneous. The larger alloy areas in
Figure 7b for reaction at 1100 °C appear inhomogeneous due to significantly higher carbon contents at the rim (at points 7, 3, and 10) of the alloy areas compared to the inner alloy areas (at points 8, 4–6, 11, and 12).
4. Discussion
The alloy composition data plot in
Figure 8 illustrates that the alloy compositions in the MnO samples reacted at 1200 °C form a polynomial curve of increased %C with increased %Mn in the alloy. In contrast, the analyses for the MnO sample reacted at 1100 °C shows high %C, even though the alloy %Mn is below 10% Mn.
Figure 9 illustrates the alloy analyses for the alloy areas in the samples reacted at 1200 °C, classed according to their physical position inside vs. outside the MnO particles. It appears that the alloy areas inside the MnO particles are lower in %Mn and %C compared to the alloy areas outside the MnO particles. These differences are most likely due to the close proximity to reductant carbon in the case of the alloy areas external to the MnO particles, compared to the internal alloy areas not being in contact with the reductant carbon. This observation agrees with the high %C analysed in the alloy areas of the 1100 °C-reacted MnO since all these alloy areas were external to the MnO particles and thus in close proximity to the reductant carbon.
The alloy areas in
Figure 5,
Figure 6 and
Figure 7 appear fluid, as is seen from the alloy areas following the MnO particle contour lines at the outside edges of the MnO particles and the MnO porosity contours inside the MnO particles. To illustrate the important effect of alloy composition changes on MnO reduction due to changes in the Mn activity values, the Mn activity was calculated for each alloy composition point formed at the 1200 °C reaction temperature. FactSage 6.4, using the SGTE alloy database, was used to calculate the equilibrium phases and Mn activity values for each alloy analysis [
20]. The activity calculation results are summarised in
Figure 10 and
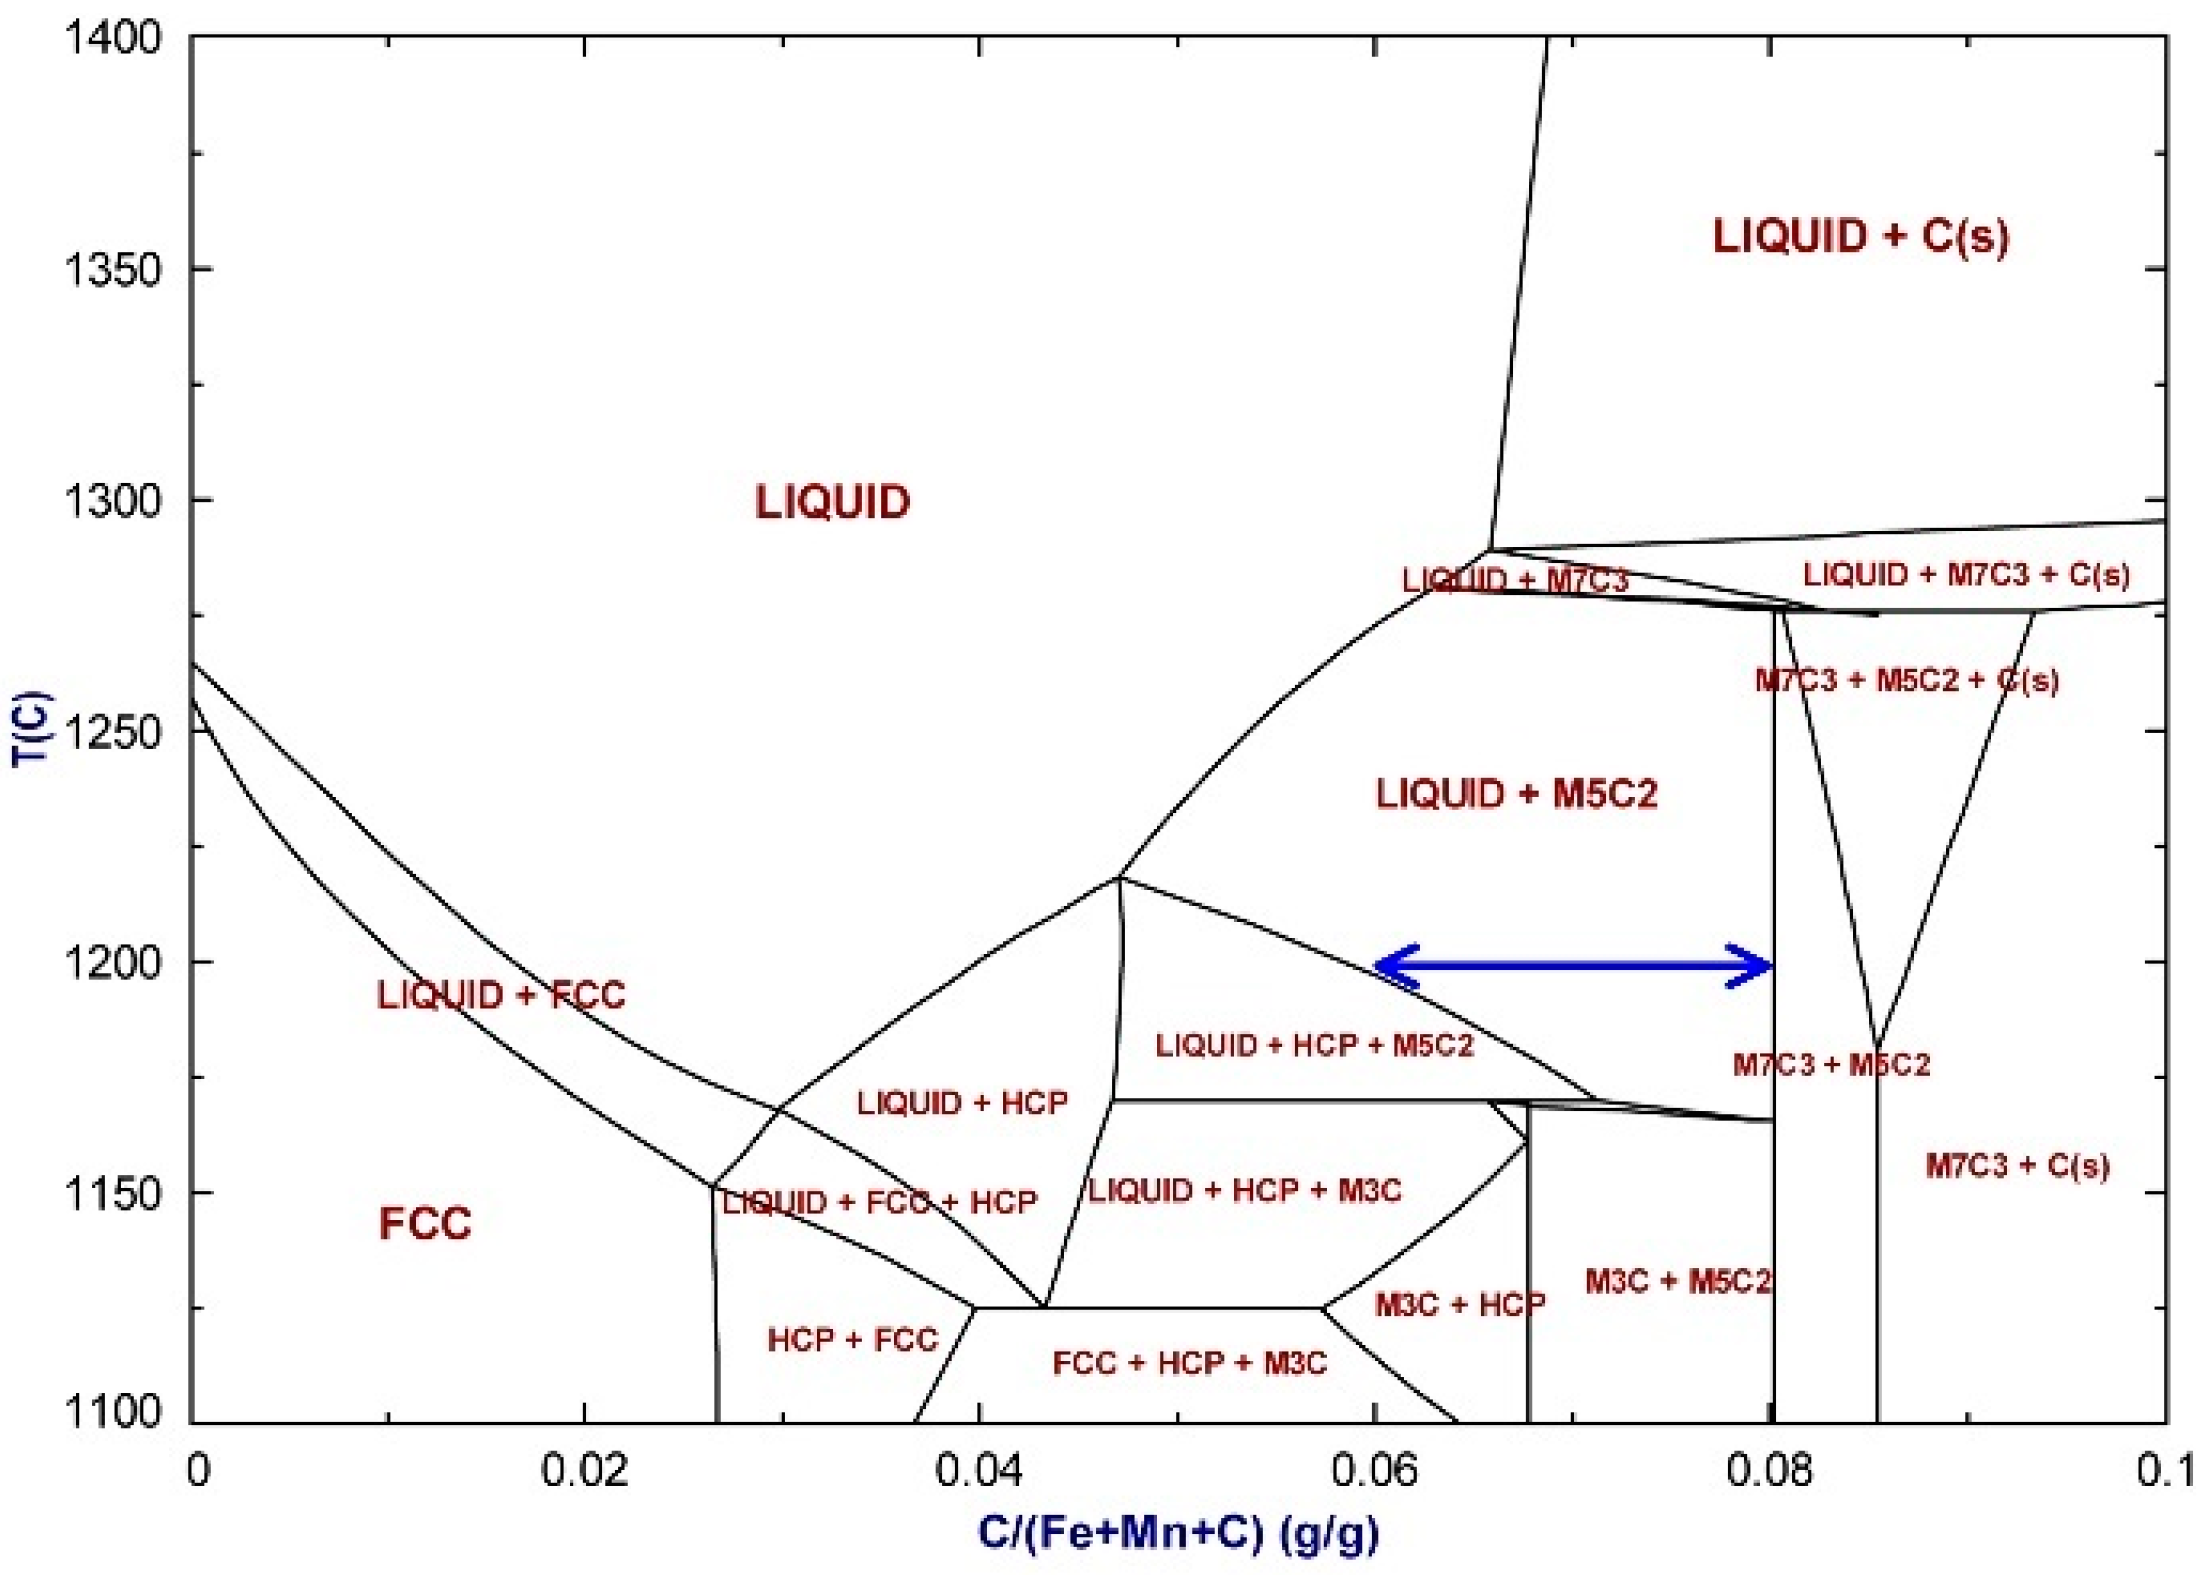
Figure 11 for the samples reacted at 1200 °C, superimposed on Mn activity lines calculated for different general bulk alloy compositions. The latter lines show the extent of Mn activity lowering due to increased %C in the bulk alloy at a constant %Mn in the bulk alloy. It is seen that the Mn activity data fall into a band of 0.2–0.3, even though the %Mn and %C in alloy areas vary widely. Most of the data points in
Figure 10 and
Figure 11 contain liquid alloy phase (points marked with a cross), with only a few points at low %C (<2% C) and low %Mn (<40% Mn) appearing as FCC iron-manganese alloy and some points at high %C (8–9% C) and high %Mn (57–71% Mn) consisting of solid M
5C
2 and/or M
7C
3 and graphite, and apparently no liquid alloy. To be noted is that the high %C analysis points shift to the liquid containing phase field of (liquid + M
5C
2) if the carbon content is lowered to less than 8% C, as indicated by the blue arrow in
Figure 12. Carbon analyses are not a precise indicator in the identification of the presence of the M
7C
3 phase because of the close carbon analysis for stoichiometric M
5C
2 and M
7C
3 at 8.0% C and 8.6% C, respectively. From the phase diagrams in
Figure 12,
Figure 13,
Figure 14 and
Figure 15, it is clear that M
7C
3 is only expected to form at high alloy manganese contents. These phase areas are all positioned external to the MnO particles and likely in close contact with the reductant particles.
Interestingly, the bulk of the data points internal to MnO particles appear to be fully liquid at 1200 °C. These alloy areas contain a range of manganese contents (30−50% Mn) and increasing %C (0−6% C) with increasing %Mn in the alloy. This is due to the low-temperature liquidus trough in the Mn-Fe-C ternary phase diagram at 2–5% C and 40–60% Mn, as displayed in the phase diagram sections in
Figure 13,
Figure 14 and
Figure 15. In addition, the carbon content range in which some liquid is present at 1200 °C is extended as the (liquid + M
5C
2) phase field increases with increased %Mn in the bulk alloy from 40% to 60%, as shown in
Figure 13,
Figure 14 and
Figure 15. Therefore, the progression of bulk alloy composition in terms of %C and %Mn uptake influences not only the activity of Mn in the alloy but also the fluidity of the alloy. The latter then influences the alloy phase mobility and wetting properties, which in turn may enhance reduction of MnO by changing the MnO-alloy contact area.
The activity data in
Figure 10 and
Figure 11 confirm the important effect of metallic Fe in MnO reduction to lower the activity of Mn and so drive the MnO reduction reaction to the right-hand side. This effect is quantified in
Figure 16, which shows the shift in the Gibbs energy line for reaction (1) due to lower Mn activity values.
Reaction (1) is only possible at unit activities of Mn, C, and 1 atm
, at temperatures above 1407 °C, as indicated by the dotted red line in
Figure 16. Lowering of the activity of Mn in reaction (1) reduces the minimum required temperature for MnO reduction to 1312 °C at a
Mn = 0.30 and 1236 °C at a
Mn = 0.10, see the solid red line and dotted blue line in
Figure 16. To lower the minimum required temperature for reaction (1) to 1200 °C requires the gas-phase reduction reaction to be considered, reaction (3). When the CO partial pressure is maintained at 1 atm, and the CO
2 partial pressure is lowered substantially by the Boudouard reaction, reaction (2), for illustration purposes selected here as 1.75 × 10
−4 atm from the Boudouard reaction equilibrium at 1400 °C, then the minimum required temperature for MnO reduction by CO gas is 1208 °C, as shown by the green dashed line in
Figure 16. Although the Boudouard reaction equilibrium CO
2 partial pressure at 1200 °C is higher (2.02 × 10
−3 atm) than at 1400 °C, the CO
2 partial pressure must be lowered to less than 1.75 × 10
−4 atm at the MnO reduction reaction interface to drive the MnO reduction reaction forwards at the lowered a
Mn of 0.30. From the lines in
Figure 16, it seems that gas-phase reduction of MnO must be at play at 1200 °C. Gas-phase reduction may also explain the pick-up in carbon in the alloy phase areas internal to the MnO particles via the reverse Boudouard reaction. However, the presence of Fe in the alloy internal to the MnO particles indicates alloy infiltration from the outer rims of the MnO particles into the interior of the MnO particles. Therefore, the fluidity of liquid alloy formed at low temperatures is likely an important factor in the MnO reduction process mechanisms at low temperatures.


