Article

Barite Scaling Potential Modelled for Fractured-Porous Geothermal Reservoirs

by
Morgan Tranter
1,2,*,†,
Marco De Lucia
1,† and
Michael Kühn
1,2,†
1
GFZ German Research Centre for Geosciences, Fluid Systems Modelling, Telegrafenberg, 14473 Potsdam, Germany
2
University of Potsdam, Institute of Geosciences, Karl-Liebknecht-Str. 24-25, 14476 Potsdam-Golm, Germany
*
Author to whom correspondence should be addressed.
Current address: Helmholtz-Zentrum Potsdam, Deutsches GeoForschungsZentrum GFZ, Telegrafenberg, 14473 Potsdam, Germany.
Minerals 2021, 11(11), 1198; https://doi.org/10.3390/min11111198
Submission received: 24 August 2021 / Revised: 22 October 2021 / Accepted: 25 October 2021 / Published: 28 October 2021
(This article belongs to the Special Issue Formation of Sulfate Minerals in Natural and Industrial Environments)

Abstract

:
Barite scalings are a common cause of permanent formation damage to deep geothermal reservoirs. Well injectivity can be impaired because the ooling of saline fluids reduces the solubility of barite, and the continuous re-injection of supersaturated fluids forces barite to precipitate in the host rock. Stimulated reservoirs in the Upper Rhine Graben often have multiple relevant flow paths in the porous matrix and fracture zones, sometimes spanning multiple stratigraphical units to achieve the economically necessary injectivity. While the influence of barite scaling on injectivity has been investigated for purely porous media, the role of fractures within reservoirs consisting of both fractured and porous sections is still not well understood. Here, we present hydro-chemical simulations of a dual-layer geothermal reservoir to study the long-term impact of barite scale formation on well injectivity. Our results show that, compared to purely porous reservoirs, fractured porous reservoirs have a significantly reduced scaling risk by up to 50 % , depending on the flow rate ratio of fractures. Injectivity loss is doubled, however, if the amount of active fractures is increased by one order of magnitude, while the mean fracture aperture is decreased, provided the fractured aquifer dictates the injection rate. We conclude that fractured, and especially hydraulically stimulated, reservoirs are generally less affected by barite scaling and that large, but few, fractures are favourable. We present a scaling score for fractured-porous reservoirs, which is composed of easily derivable quantities such as the radial equilibrium length and precipitation potential. This score is suggested for use approximating the scaling potential and its impact on injectivity of a fractured-porous reservoir for geothermal exploitation.

1. Introduction

Barite ( BaSO 4 ) scalings are a common cause of permanent formation damage to deep geothermal reservoirs. The continuous re-injection of priorly produced fluids may induce the sulfate mineral to precipitate in the host rock, as cooling reduces the solubility of barite [1]. Consequentially, these so-called mineral scalings may impair the well injectivity, a key performance indicator of geothermal power plants [2]. The scaling risk is particularly elevated when the geothermal fluids have a high mineralisation (>100 g / L ), and the cooling margin is high (>40 ° C ) [3]. When conceptualising a geothermal project, it is crucial to take scaling into account, as it can be a significant cause of expense or even the reason that a geothermal power plant fails [4,5].
In a previous numerical study, we investigated the barite scaling potential and its impact on injectivity for porous reservoirs [1]. Scaling potential was quantified for geothermal fluids representative of the North German Basin and the Upper Rhine Graben (URG). We came to the conclusion that, disregarding variations in reservoir type, geothermal sites in the North German Basin have a higher scaling risk, since the respective brines are significantly more mineralised. Many geothermal reservoirs, however, rely on natural or engineered fractures to achieve the economically viable hydraulic yields [6]. The overall fluid flow regime and inner surface area (reactivity) within fractured and fractured-porous media are fundamentally different, and need to be treated separately. This is where we follow up on in the present study.
The URG is an area of continuous interest for geothermal energy, where fracture networks in the sedimentary cover (Triassic/Permian sediments) and in the granitic basements (Paleozoic) play an essential role in brine circulation [7,8]. Fracture zones are often filled with secondary minerals and exhibit insufficient permeability [9,10]. One common approach to improve a well’s injectivity or productivity is to reactivate these natural fractures with hydraulic injection, which falls within the concept of Enhanced Geothermal Systems (EGS). Furthermore, a multi-horizon-concept was successfully applied to the commercial power plant Landau (Germany) [11,12]. The aim was to minimise exploration risk by crossing the fault system in the Buntsandstein, Perm and the granitic basement. These target horizons are located in Landau at depths of approximately 1900 m to 3000 m , exhibit temperatures of over 150 ° C , and hold brines with mineral contents of over 107 g / L [6,11]. The reservoir is classified as a fracture-porous aquifer, whereas the respective flow rate ratios of the porous and fracture components are hard to quantify.
Ngo et al. [13] investigated the potential dissolution and precipitation behaviour of minerals specifically in the Soultz-sous-Forêts geothermal system, which also lies in the URG-area. They identified that, based on saturation state, as a reservoir cools, barite among other minerals shows a tendency to precipitate. At the same site, fracture veins filled with barite were documented in core samples [14], which indicates the associated risk of barite precipitation reducing fracture permeability. A related kinetic model illustrates that open fractures can seal within months or days, depending on temperature. The clogging process of barite precipitation in porous and fractured reservoir rock was investigated recently at the laboratory scale, showing significant permeability loss by up to one order of magnitude of the core samples [15]. Fracture aperture is a key parameter here; a numerical study suggests that large fractures are less susceptible to scaling-induced permeability loss, due to the variations in specific reactive surface area [16].
Rock permeability evolution as a consequence of altering pore space is a most important aspect of subsurface utilisation and focus of many recent studies (e.g., [17,18,19,20]). Numerical studies of geochemical-reaction-driven transmissivity evolution in geothermal reservoirs include silica scaling in single-fracture models [21], barite precipitation in porous reservoir models [1], and acid stimulation in single- and double-porosity models [22]. The present study closes the gap for modelling barite-scaling-induced permeability loss in fractured-porous geothermal reservoirs. We coupled two one-dimensional, continuum-scale models (dual-layer) to study the impact of barite scaling on the injectivity of a geothermal well based on the Landau geothermal reservoir. By separating the fracture and porous aquifer into two individual layers, we investigate the influence of varying the uncertain hydraulic relevance of fractures. We applied a radial diverging flow field and barite precipitation kinetics, similar to Tranter et al. [1]. Moreover, we carried out a scenario analysis, in which the flow rate, amount of active fractures, and fluid chemistry were varied, to quantify the relationships between parameters. These provided the basis for an analytical scaling score, which can approximate the scaling potential for fractured-porous reservoirs without the need to run numerical simulations. This tool can be used to quickly assess whether a substantial scaling risk exists for a geothermal site, which is beneficial for an initial screening.

2. Materials and Methods

In this study, the Landau deep geothermal reservoir was taken as the basis for the parametrisation of our models. At Landau, a multi-reservoir approach was adopted, which aims to utilise the sandstone formations Buntsandstein and Rotliegendes, as well as the altered section of the granitic basement [11,12]. The sandstone formations are porous to fractured-porous aquifers, whereas the granitic basement is a purely fractured aquifer with negligible matrix permeability [8]. The open-hole section of the injection well Gt La2 begins at 2200 m and the total drilled length is 3170 m [6]. To simplify the modelling setup, a total utilised reservoir thickness of 1000 m was assumed, and subdivided into two horizontal aquifer layers of 500 m in thickness, each (Figure 1b). This dual-layer reservoir simulation setup consists of a homogeneous, sedimentary–porous aquifer (upper layer), and a granitic–fractured aquifer with variable sizes and different amounts of horizontal fractures (lower layer). These assumptions allow for the development of a radial-symmetric system that can be represented by a set of 1D models. Interaction or mass transfer between the reservoir layers was not taken into account; therefore, the approach using two parallel layers is viable. The total reservoir simulation time was ten years to model the lifecycle of a borehole until restoration is needed.

2.1. Reservoir Flow

Fluid flow from an injection well into an aquifer creates a radially diverging flow field that is advection-dominated in its proximity (Figure 1a) [23]. The flow-through area of the aquifer perpendicular to the horizontal axis increases with radial distance to the well. Let us assume a constant injection rate and quasi-stationary state, a negligible regional hydraulic gradient, and a homogeneous and isotropic medium. Darcy velocity then is a function of radial distance (Equation (1)).
q ( r ) = Q A ( r ) = Q 2 π r H
where q ( m / s ) is the Darcy flow velocity, r ( m ) is the radial distance from the well-centre, Q ( m 3 / s ) is the flow rate, and H ( m ) is the flow-through thickness. Now, let us further assume n horizontally layered aquifers with differing hydraulic properties. The respective flow share through a layer i (subscript por for porous or frac for fracture) corresponds to its transmissivity T ( m 3 ) share with respect to the reservoir transmissivity (Equation (2)).
Q i Q tot = T i T res
where Q tot is the total well’s injection rate, r e s refers to the screened section of the reservoir, and transmissivity, defined here as
T i = K i H i .
with the permeability K ( m 2 ) . The effective permeability of a reservoir for flow perpendicular to heterogeneity is the arithmetic mean of permeabilities of all layers (Equation (4)) [24].
K res = i = 1 n K i H i H res
This effective reservoir permeability for a confined reservoir was derived from well tests assuming a Darcy flow and quasi-stationary state. Dupuit–Thiem’s well equation [25] (Equation (5)), the measured injectivity index (Equation (6)), and the approximate hydraulic range of influence in the reservoir (Equation (7)) were used for this [26].
Q = 2 π s K ρ f g μ f H 1 ln r e / r w
J = Q P = Q s ρ f g
r e = 3000 s K ρ f g μ f
where ρ f ( kg / m 3 ) is the fluid density, g ( m / s 2 ) is the gravitational acceleration, μ f ( Pa s ) is the fluid viscosity, r w ( m ) is the well radius, r e ( m ) is the hydraulic range of influence, J ( m 3 / Pa s ) is the injectivity, P ( Pa ) is the pore pressure, and s ( m ) is the water column pressure.
For the Landau geothermal reservoir, we obtained the following [12,27]: with Q = 100 m 3 / h , H = 1000 m , J = 40 m 3 / h MPa ( s 240 m ), and constant fluid density and viscosity of 1050 kg / m 3 and 4 × 10 4 Pa s , respectively, the effective reservoir permeability and transmissivity are K = 5 · 10 15 m 2 and T = 5 · 10 12 m 3 , respectively. The well radius was set to r w = 0.22 m . The range of influence (Equation (7)) is approximately r e = 260 m , which had to be fitted iteratively since Equations (5) and  (7) cannot be readily resolved for K .
The rock permeability of a fracture-dominated aquifer is generally determined by its fracture properties, such as density, aperture, length, geometry, dip, and connectivity. The simple case of infinitely extending, horizontal, parallel plates was assumed here for the fracture layer. Consequently, the permeability of a single fracture was calculated with only its hydraulic aperture using the cubic law (Equation (8)) [28].
K frac = ( 2 δ ) 2 12
where δ ( m ) is the half-fracture aperture. The total flow-through height of an aquifer and its transmissivity with n frac uniform fractures assuming negligible matrix permeability was calculated with Equations (9) and (10), respectively [29].
H frac = ( 2 δ ) n frac
T frac = ( 2 δ ) 3 n frac 12
where n frac is the amount of fractures. Given a certain flow share with respect to a reservoir and the amount of uniform fractures, the hydraulic aperture and permeability was determined.

2.2. Reactive Transport

Three fluid samples were considered as input concentrations that are representative of deep geothermal reservoirs in the Upper Rhine Graben (Table 1). URG 2000 m and URG 3000 m are averaged samples from the respective depths [30]; LND is the fluid concentration of the Landau geothermal reservoir [31]. All three samples are Na - Cl -type waters. The shallow URG sample has the lowest ionic strength ( 1.3 M ), followed by LND ( 2.0 M ) and then URG 3000 m ( 2.3 M ). Each of these samples were modified using the phreeqc code v3.7 [32] to achieve equilibrium at initial reservoir conditions with minerals that are expected to be present in the reservoir rocks [1]. The pitzer.dat database was used to account for the high ionic strengths of the aqueous solutions.
Reactive transport modelling was done using the transport keyword of phreeqc, similar to Tranter et al. [1]. Each reservoir simulation consisted of two one-dimensional simulations, one for each aquifer layer, with 100 elements each. The flow rate was kept constant and the influence of porosity change on pore flow velocity caused by mineral reactions was not considered. Details of the implementation of radial flow in phreeqc are given in the Appendix A. The model inlet was set to the well exit ( r w = 0.22 m ) and the model length was derived for each simulation based on the approximated radial equilibrium length r eq ( m ) using Equation (11) (see Appendix B for its derivation).
r eq = 2 V c eq S k + r w 2
where V = Q / 2 π H , and c eq ( mol / m rock 3 ) is the fluid concentration of barium in equilibrium. Finally, the model end was set to min ( r e , 3 r eq ) to capture the relevant reactive flow section, but also not to extend over the range of influence. A constant boundary condition was set at the inlet using concentrations shown in Table 1, and flux boundary conditions at the outlet. The initial conditions of the aqueous solution in the domain were calculated based on the inlet chemistry, but in thermodynamic equilibrium with barite at domain P/T-conditions. Temperature and pressure were constant at 55 ° C and 30 MPa .
A general kinetic rate law was used to calculate barite precipitation with phreeqc (Equation (12)) [33].
d m d t = S k ( 1 SR )
where m ( mol / m rock 3 ) is the mineral amount, t ( s ) is time, S ( m 2 / m rock 3 ) is the specific reactive surface area, k ( mol / m 2 s ) is the rate constant, and SR ( ) is the saturation ratio, i.e., the ratio of the activity IAP and solubility product K sp . The surface area normalised reaction rate constant was calculated as a function of temperature T ( K ) and ionic strength I ( M ) with Equation (13) [1] based on data from [34].
log 10 k barite = 2532 T + 0.694 I + 0.29
Besides barite precipitation, the chemical system was considered to be inert. From a thermodynamic perspective, it was found that only barite, celestite, and quartz could precipitate from solution due to the temperature decrease during fluid circulation. Quartz is known to have a negligible low precipitation rate at the respective injection temperatures [35]. Celestite may co-precipitate [36,37], although the saturation ratio of celestite for the respective geothermal fluids at 55 ° C is about 1 or below; thus, it is not expected to precipitate in noteworthy amounts, if at all. Solid-solutions were not taken into account as the additional precipitation potential is assumed to be comparably small for the same reason.
The initial porosity of the porous layer was φ 0 , por = 0.2 ; the fracture open space of the fracture layer was φ 0 , frac = 1.0 . The reactive surface area of barite S barite ( m 2 / m rock 3 ) (Equation (14)) was calculated based on the inner specific surface area of the rock S S ( m 2 / m rock 3 ) and an additional scaling factor SF ( ) to account for reduced mineral accessibility, armouring, and surface roughness [38].
S barite = φ barite · S S , i · SF i
where φ barite ( ) is the volume fraction of barite in the rock. The initial volume fraction of barite in the rock was 5 × 10 5 [1,39] for all aquifers. The inner surface area of the porous aquifer was set to S S , por = 3 × 10 4 m 2 / m rock 3 [40]. For the fracture aquifer, it was calculated from its respective fracture aperture ( S S , frac = 1 / ( 2 δ ) ). The scaling factors for the porous and fracture aquifer were set to SF por = 0.05 and SF frac = 0.1 , respectively [38]. The fracture scaling factor is higher to account for fracture surface roughness [41]. The reactive surface area of each mineralogical component in the rock that is accessible to circulating fluids is extremely hard to quantify [38,41,42,43,44,45], especially for the hardly accessible rocks of deep geothermal reservoirs. The uncertainty may be significant and is investigated in more detail in a previous work by the authors [1].
To relate porosity and permeability change, the Kozeny–Carman relationship [46,47] was used for the porous layers (Equation (15)). It is widely accepted for the use in porous media and is comparably simple, as only the initial porosity needs to be assumed [20]. The cubic law holds for flow between two parallel plates; thus, it was applied to the fracture layer (Equation (16)).
K 1 K 0 = φ 1 3 ( 1 φ 0 ) 2 φ 0 3 ( 1 φ 1 ) 2
K 1 K 0 = φ 1 2 φ 0 2
where φ ( ) is the porosity of the layer, and subscripts 0 and 1 refer to the initial state and state after time t. The effective permeability of a layer for flow parallel to heterogeneity in a radial diverging flow field was calculated with the log-harmonic mean of the permeabilities of its elements (Equation (17)) [24,48].
K = ln r e r w j = 1 n ln r j r j 1 K j
where subscript j refers to a grid element. Here, the range of influence r e from Equation (7) was used for all layers, whereas the undisturbed section, if r e > r eq , was also taken into account. The effective permeability loss L (Equation (18)) was taken as a measure for injectivity loss (Equation (18)).
L = 1 K 1 K 0

2.3. Scenarios

Injectivity loss was investigated in detail with a scenario analysis using variables and their ranges, given in Table 2. The impact of fluid chemistry was taken into consideration using three different fluid samples (Table 1). The total injection flow rate was varied significantly from the mean rate of 100 m 3 / h , which is usually an approximate target value [11]. Moreover, the flow rate fraction of the fracture layer, as well as the amount of fractures, were varied significantly.

3. Results

3.1. Reservoir Simulation Scenarios

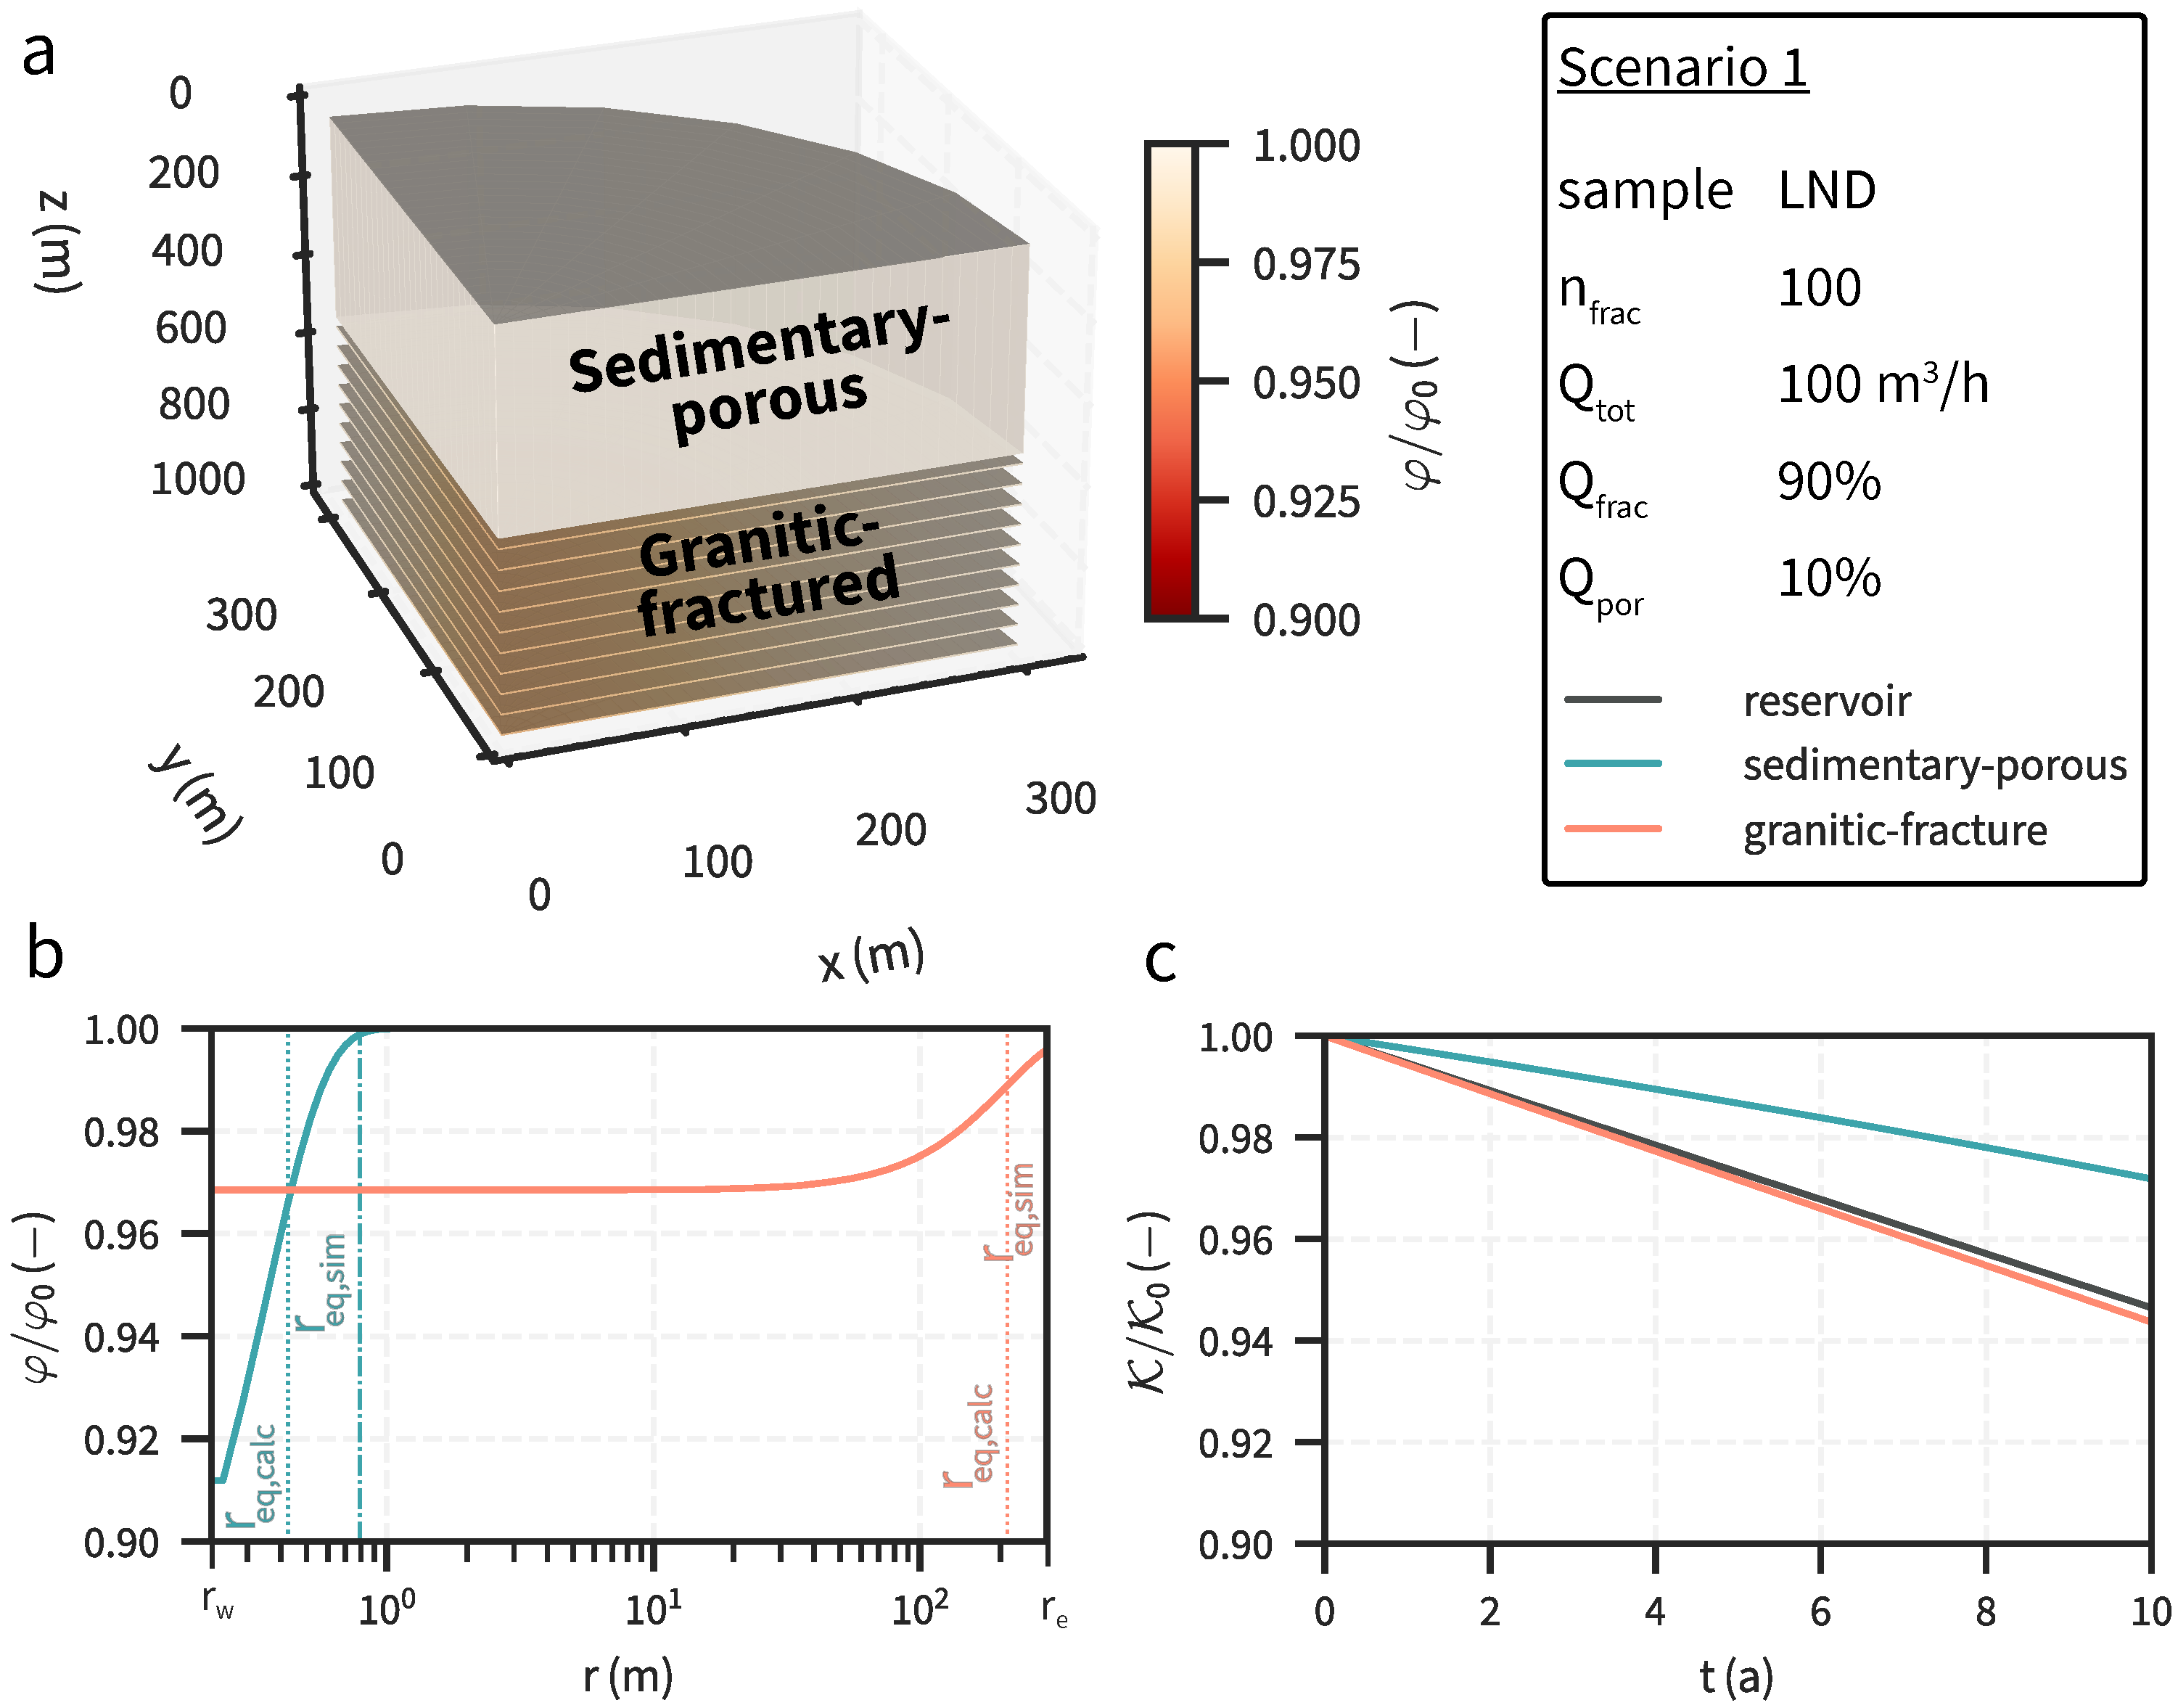
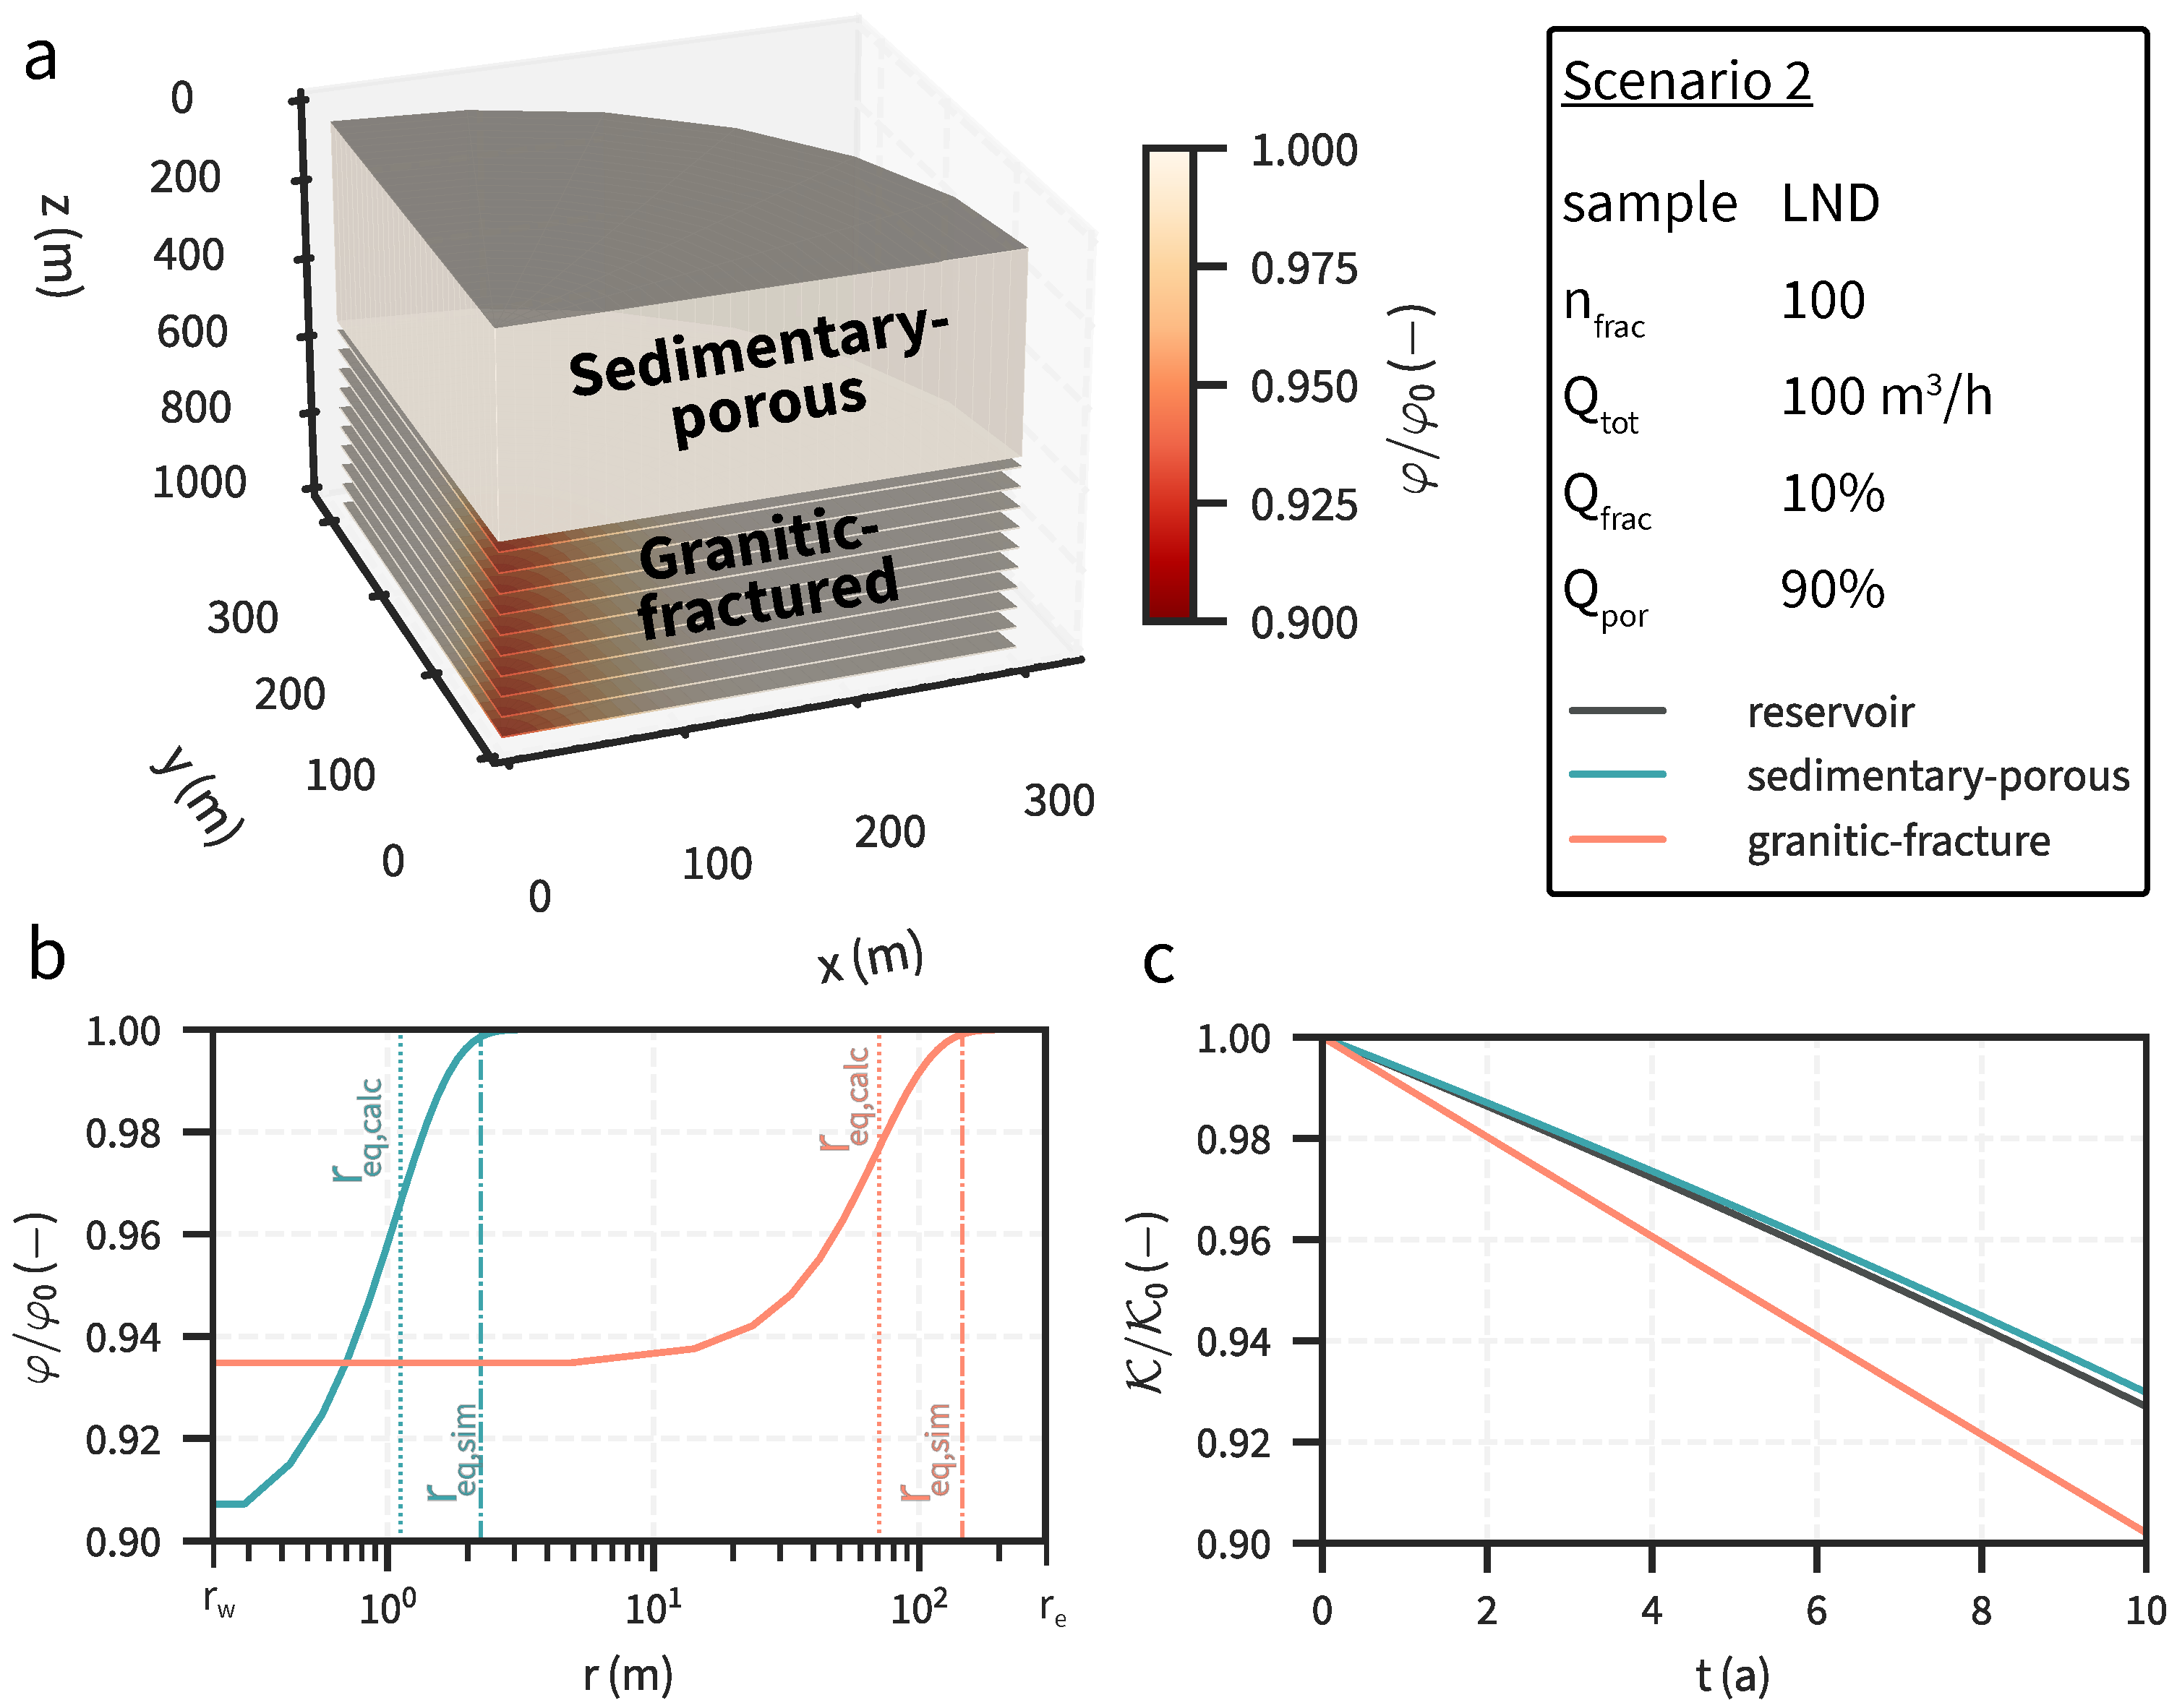
The results of two of the 81 reservoir simulation scenarios are shown in detail in Figure 2 and Figure 3. Both are based on the same input sample (LND), amount of fractures (100), and a total well injection rate of 100 m 3 / h . They differ in their flow rate fraction with respect to the porous and fracture aquifers. Figure 2 shows scenario 1, where the fracture layer drains 90 % of the total injection volume. This corresponds to a fracture aquifer permeability of 9 × 10 15 m 2 with a mean fracture aperture of 80 μ m , and a permeability of the porous layer of 1 × 10 15 m 2 . Scenario 2 is shown in Figure 3, which has a fracture aquifer flow rate ratio of 10 % , corresponding to a permeability of 1 × 10 15 m 2 and a mean fracture aperture of 40 μ m .
The rock porosity changes along the horizontal axis after the final simulation time of ten years are shown in Figure 2b and Figure 3b. In both scenarios and in each layer, the maximum porosity change is close to the well and decreases with various gradients along the r-axis. The porous aquifers of both scenarios have a similar maximum porosity reduction of about 9 % and an affected range of only 1 m to 2 m around the well. The fracture aquifer with the higher flow rate has a maximum porosity loss of 3 % , while the lower flow rate scenario has a higher maximum porosity loss of slightly more than 6 % . The respective affected ranges are orders of magnitudes higher than the porous layers: scenario 1 (higher flow rates) has a range of 300 m and scenario 2 (lower flow rates) about 150 m .
Changes in effective permeabilities are shown in Figure 2c and Figure 3c. Over the period of the simulation time, effective permeabilities decrease almost linearly for all layers and reservoirs. In both scenarios, the respective fracture layer has a stronger decline in effective permeability than the porous layer. Moreover, a main difference between aquifer types is that permeability loss is greater for fracture layers if the flow rate is lower. Reducing the flow rate ratio of the fracture layer from 90 % to 10 % increases its final permeability loss from 6 % to 10 % . The opposite applies to the porous layers, where the permeability loss is proportional to flow rate. As a consequence, however, the loss in effective permeability of the reservoir varies less (Equation (4)): it is about 5 % for high fracture layer flow rates (scenario 1) and about 7 % for high porous layer flow rates (scenario 2).

3.2. Scenario Analysis

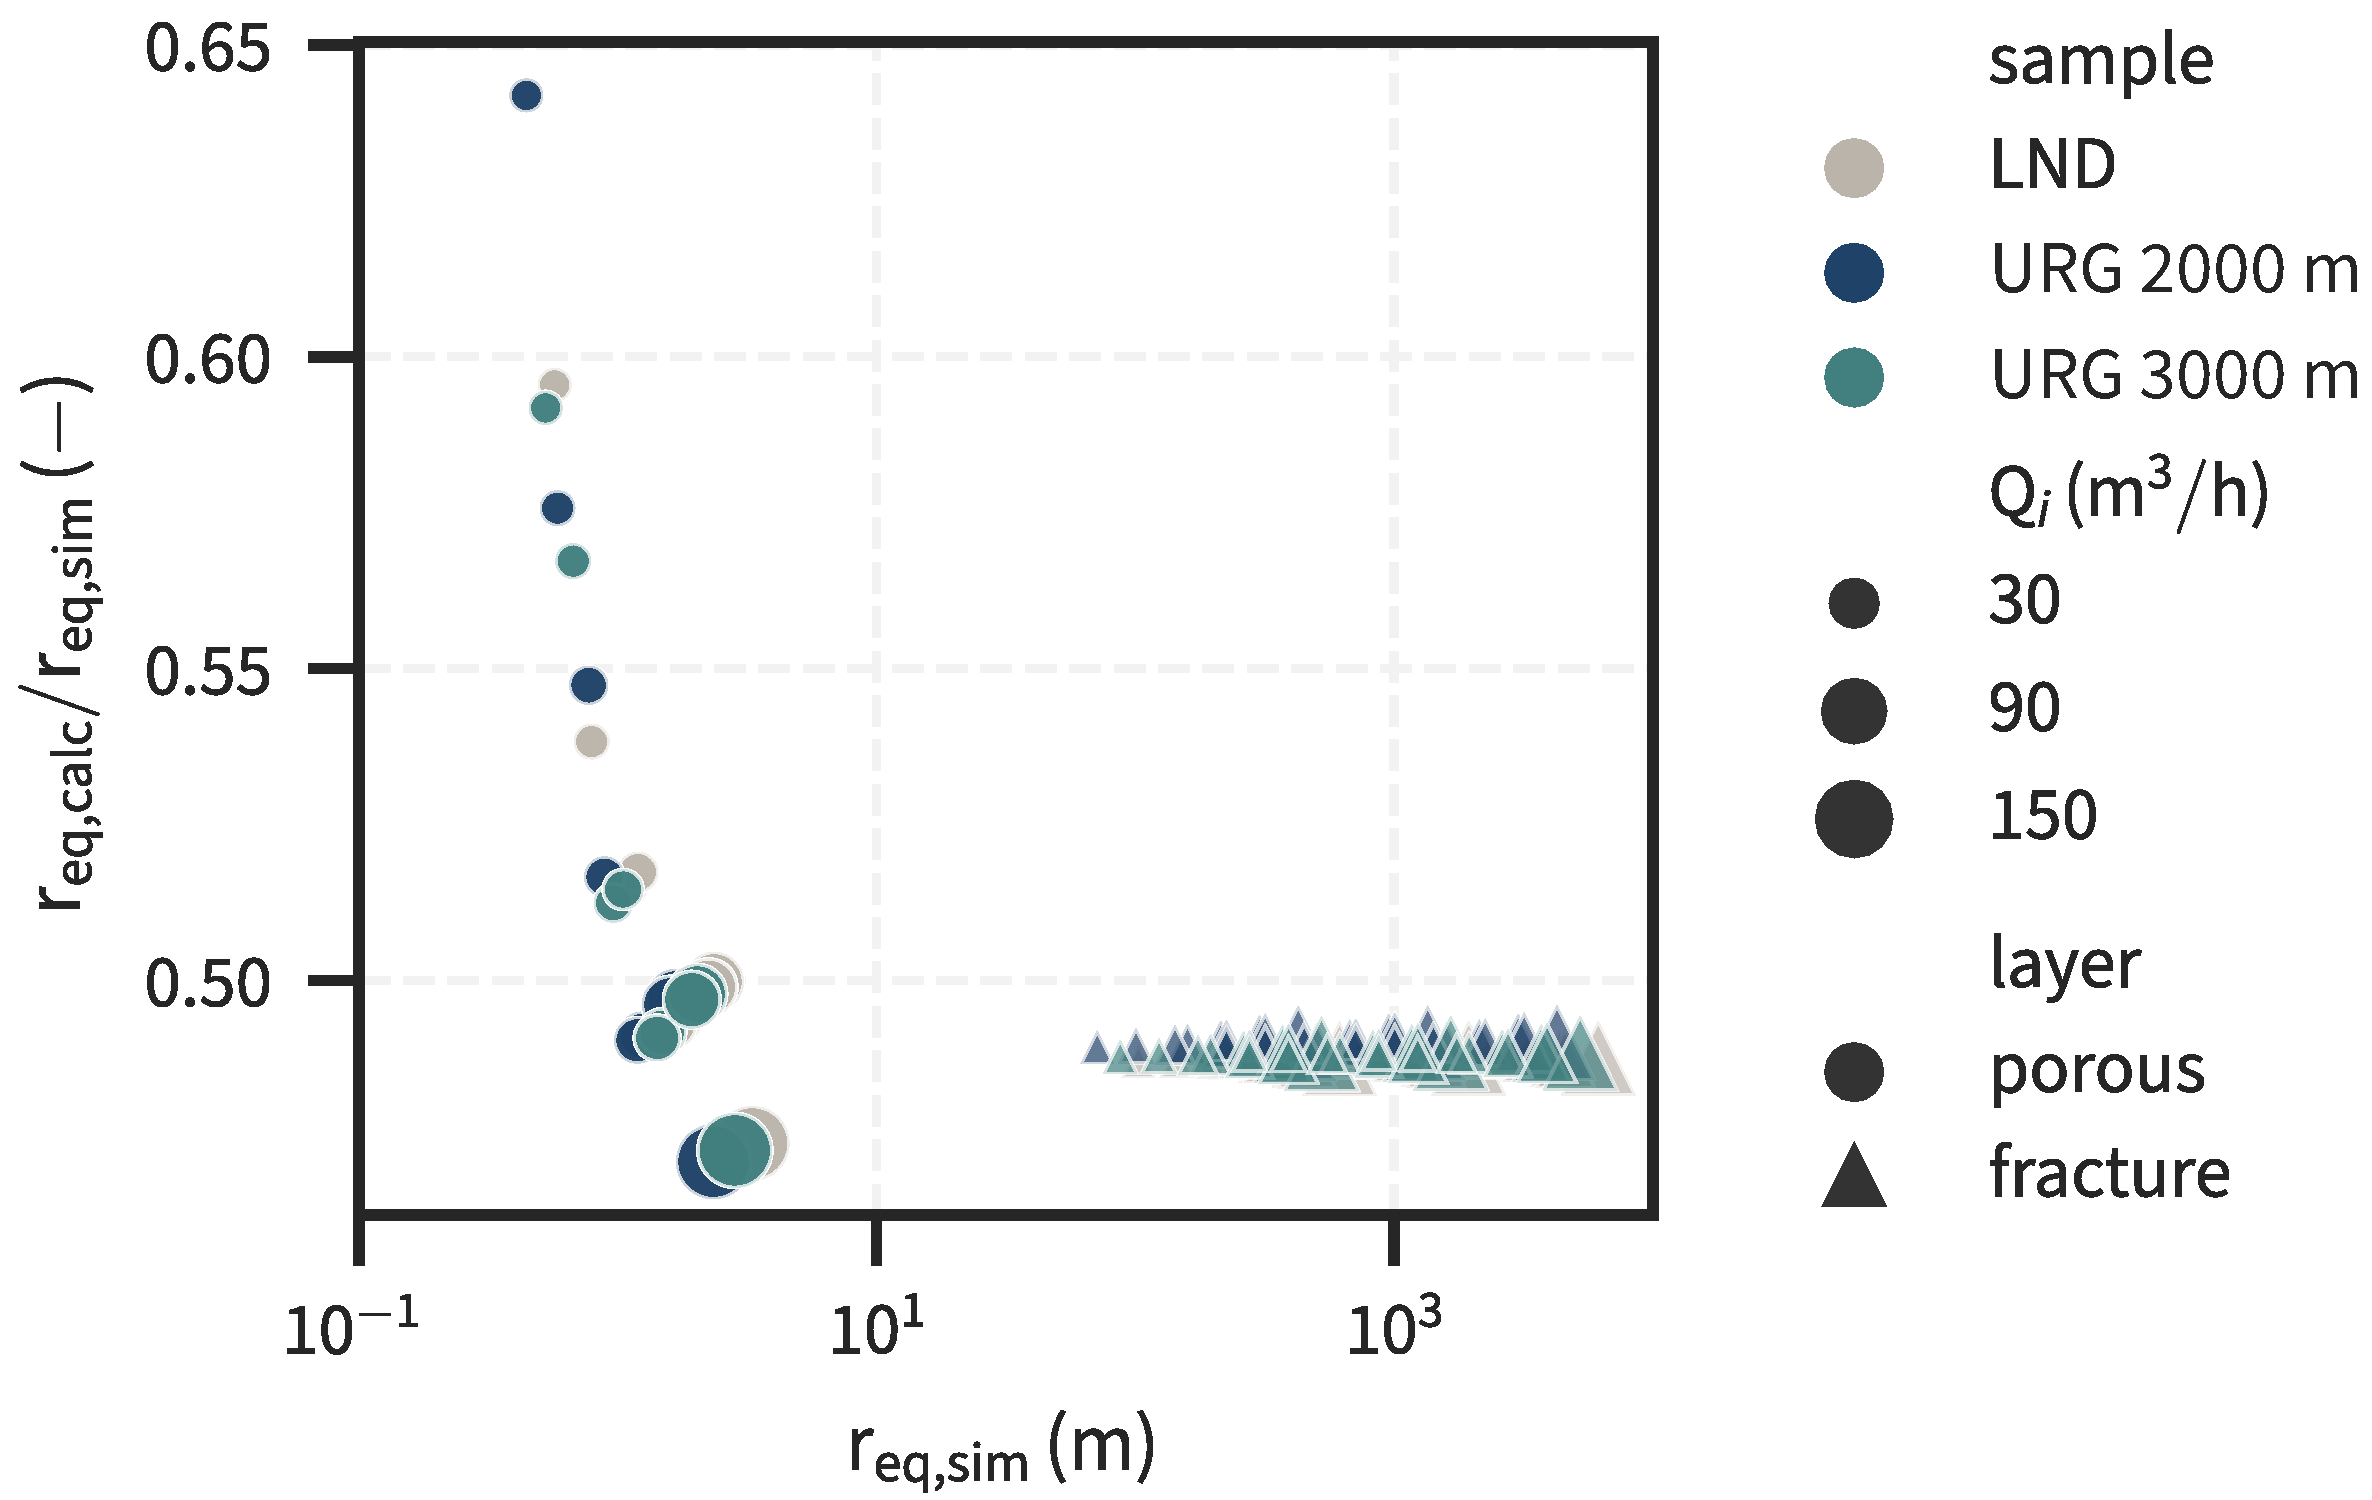
For all scenarios, the calculated equilibrium lengths using Equation (11) underestimate the simulated values, as shown in Figure 4. The simulated equilibrium length was defined as the point where the initial saturation ratio has decreased by 99 % . The previously calculated and the simulated scenarios are also shown as vertical lines in Figure 2b and Figure 3b. In general, the equilibrium length is correlated with the flow rate. The fracture layers are consistently underestimated by slightly less than half. For the porous layers, the calculated lengths lie between 65 % and 45 % of the simulated values and decrease proportionally to these. Furthermore, equilibrium lengths of all scenarios for the fracture layers range from 73 m to 660 m ; for the porous layers, the range is with 0.4 m to 3.3 m significantly lower. The various fluid samples have no impact on this relationship.
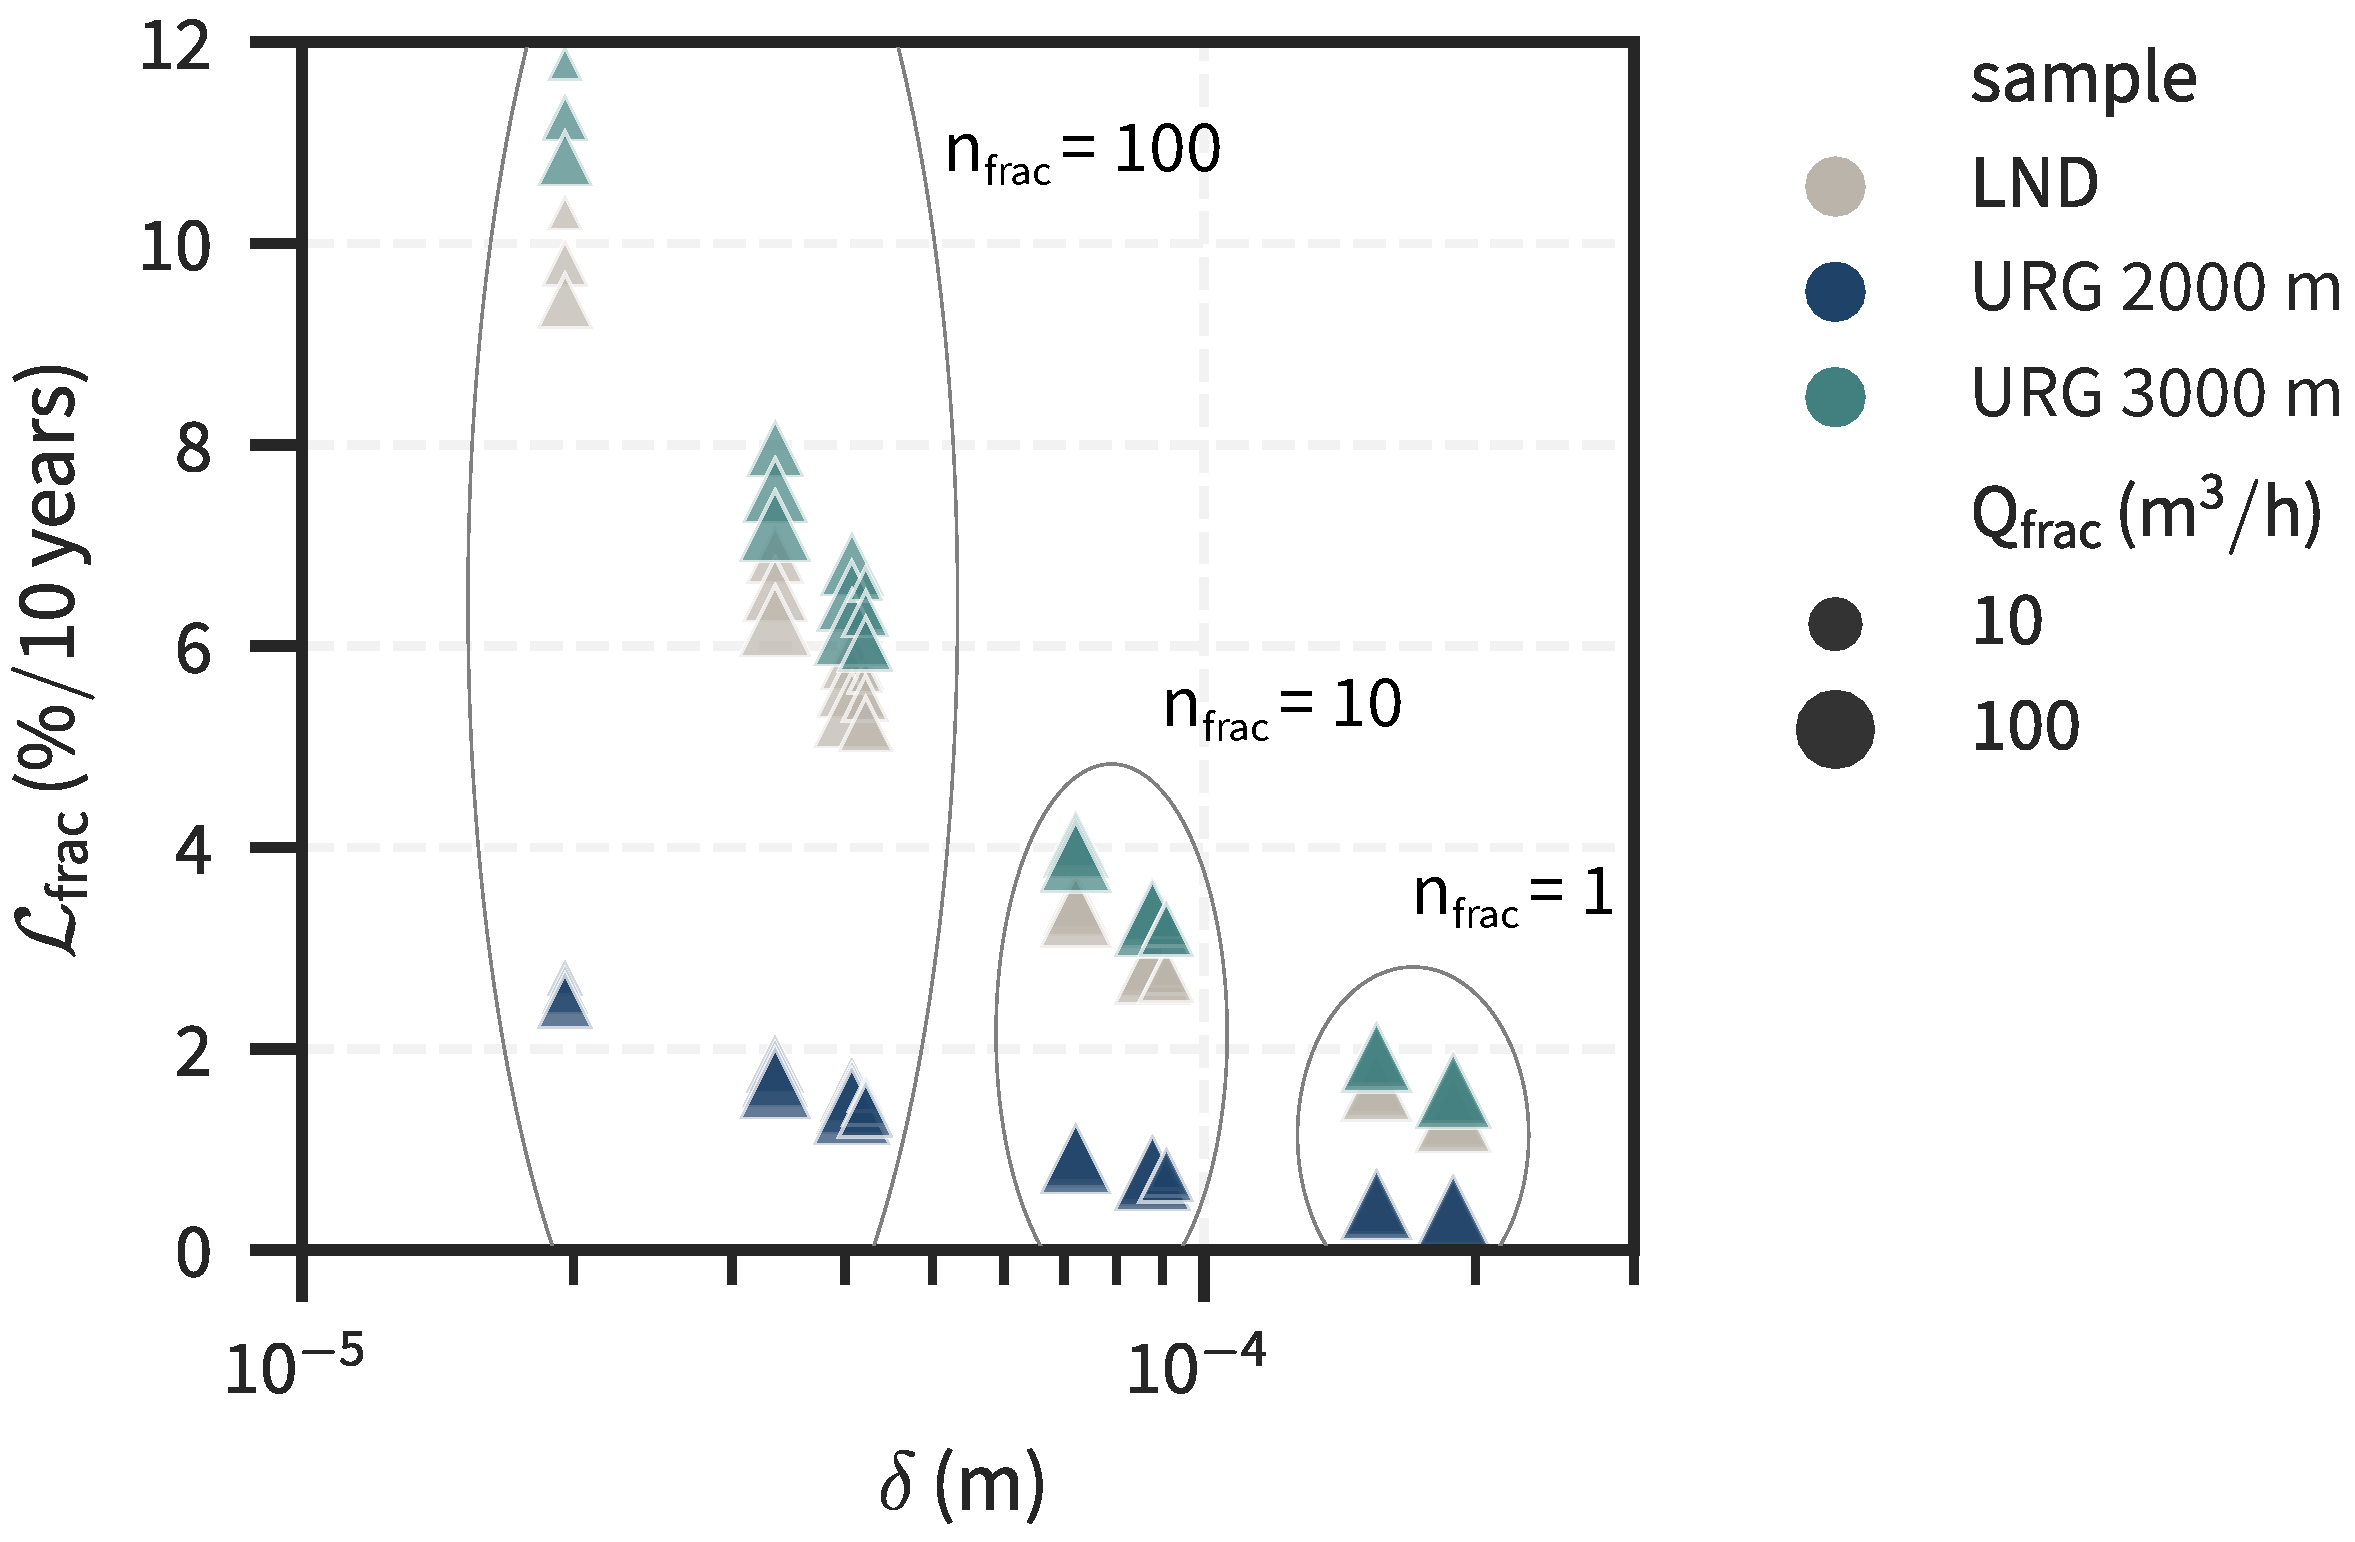
In Figure 5, the effective permeability losses of the fracture layers are shown against the respective mean fracture half-apertures. Firstly, fracture apertures directly correspond to the amount of fractures that were set, and the flow rate share. The mean fracture apertures lie between 40 μ m and 400 μ m . If more fractures are introduced, a lower mean fracture aperture suffices to reach the target transmissivity. The target transmissivity directly follows from the imposed flow rate share (Equation (2)). Thus, higher fracture apertures are needed to reach a certain flow rate. The permeability loss of a fracture layer is generally lower if fracture apertures are larger, and the fewer fractures are introduced. Furthermore, the input fluid sample has a significant impact on the loss factor. While the deep mean sample URG 3000 m has similar, but slightly higher losses ( 1.5 12 % ) compared to the LND sample ( 1.3 10 % ), the shallow mean sample URG 2000 m has significantly lower losses, with a range of only 0.4 2.7 % .
Figure 6 shows the flow rate share of the fracture layer in relation to the effective reservoir permeability loss. Only the scenarios with the base injection flow rate of 100 m 3 / h are shown. Most notably, if sample URG 2000 m is applied as an input concentration, the absolute lowest losses were recorded. URG 3000 m and LND are again similar, with LND-scenarios having slightly lower losses. Generally, the reservoir permeability loss is lower if the flow rate share of the fracture layer is higher. On average, loss is reduced by about 50 % if the flow rate share of the fracture layer increases from 10 % to 90 % . For the URG 2000 m sample, this reduction is slightly smaller. Furthermore, increasing the amount of fractures in the model always increases the final loss. This relationship becomes more prevalent as the fracture flow rate share increases. At a flow rate share of 10 % , this effect is negligible. If the flow rate share is high, an increase of active fractures by one order of magnitude almost doubled the loss. The highest reservoir permeability loss of 8 % was calculated with the scenario using the sample URG 3000 m, 100 fractures, and a fracture flow rate share of 10 % . The scenario with the sample URG 2000 m, 1 fracture, and a fracture flow rate share of 90 % had the lowest loss of 0.4 % .

3.3. Scaling Score

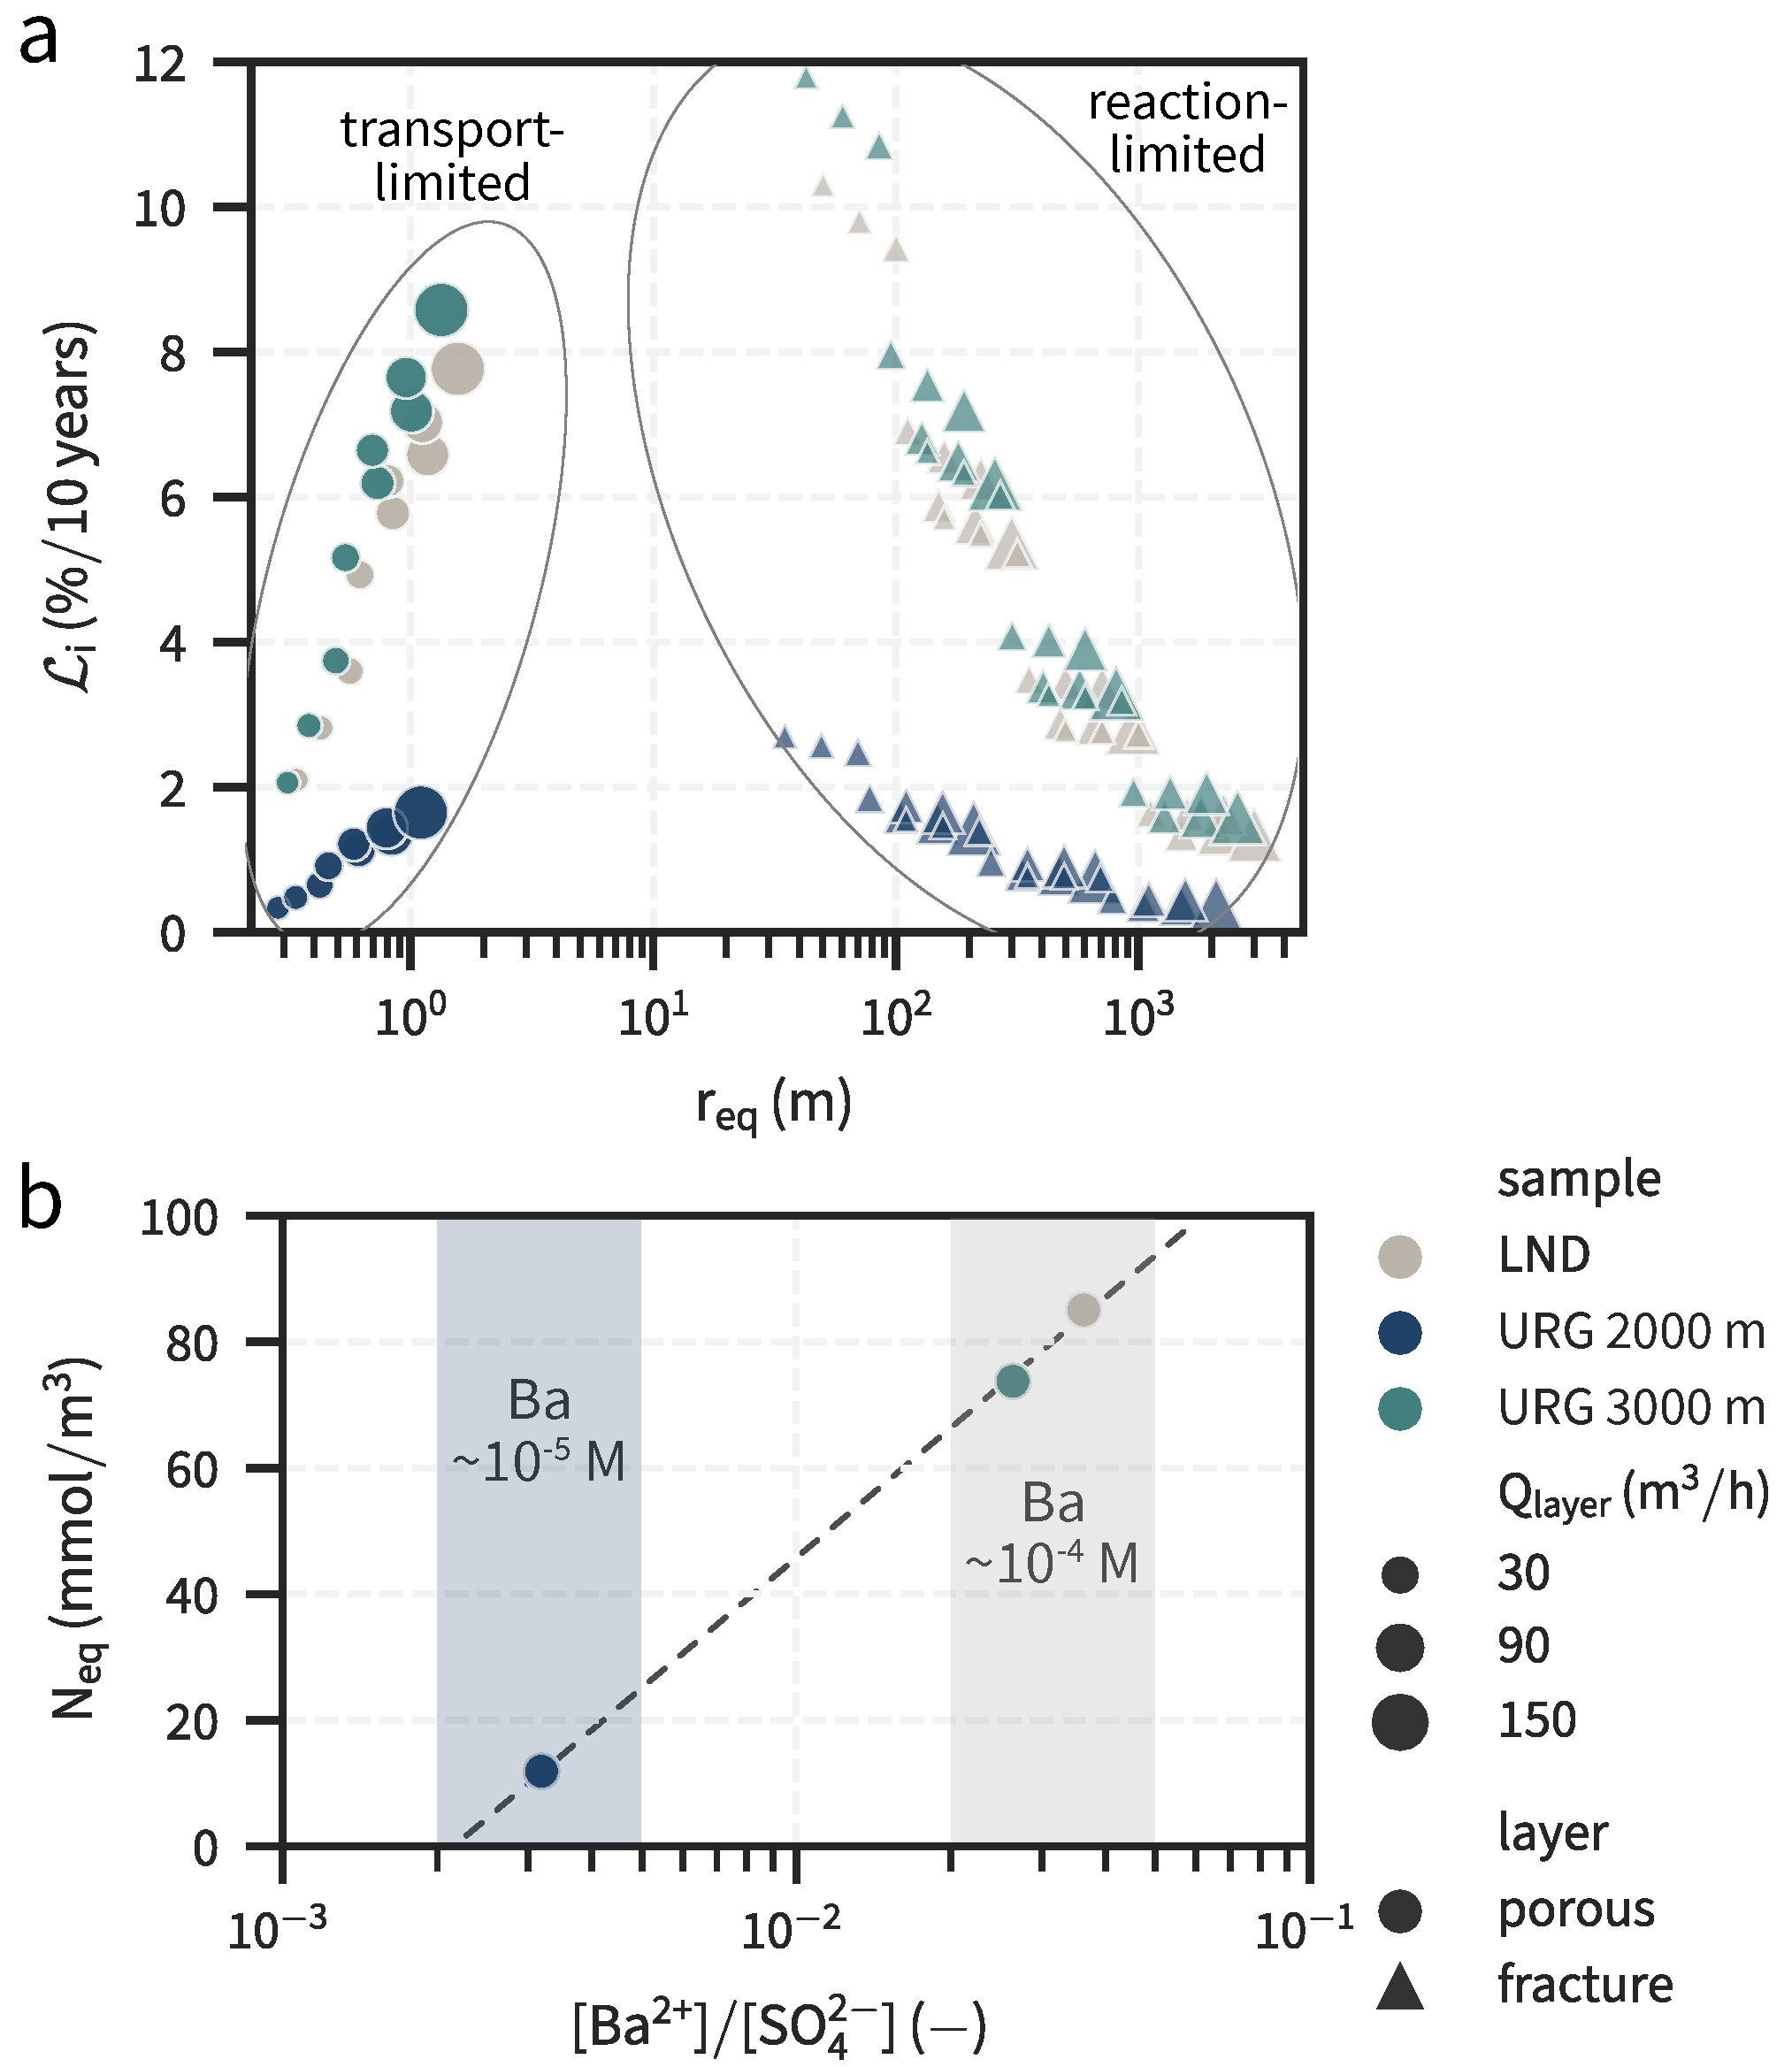
Parameter relationships are examined in more detail based on the reported simulation results and the scenario analysis. The calculated radial equilibrium lengths for layers of all scenarios are shown in Figure 7a. If plotted against the respective layer permeability losses, the relationship is different, depending on the considered layer type (fractured or porous). While for the porous layer, losses are positively correlated to r eq , the corresponding fracture layer losses are negatively correlated. The figure also shows that flow rate comparably increases loss, irrespective of layer type. Furthermore, fluid chemistry has a significant impact on permeability loss. In this regard, the initial ion ratio of Ba 2 + to SO 4 2 of the fluid sample affects the precipitation (or scaling) potential N eq ( mol / m 3 ) , i.e., the amount of barite that can precipitate from a cubic metre of injected fluid, assuming equilibrium is reached. The closer the ion ratio is to unity, the higher the precipitation potential indicated for the three considered samples in Figure 7b. Lastly, from Figure 5 it was previously derived that a higher flow-through thickness reduces the resulting permeability loss. If these relationships are combined into a single statement, we can obtain a definition for a predictive scaling score X for a layer i (Equation (19)).
X i = N eq Q i r eq a H i φ i , 0
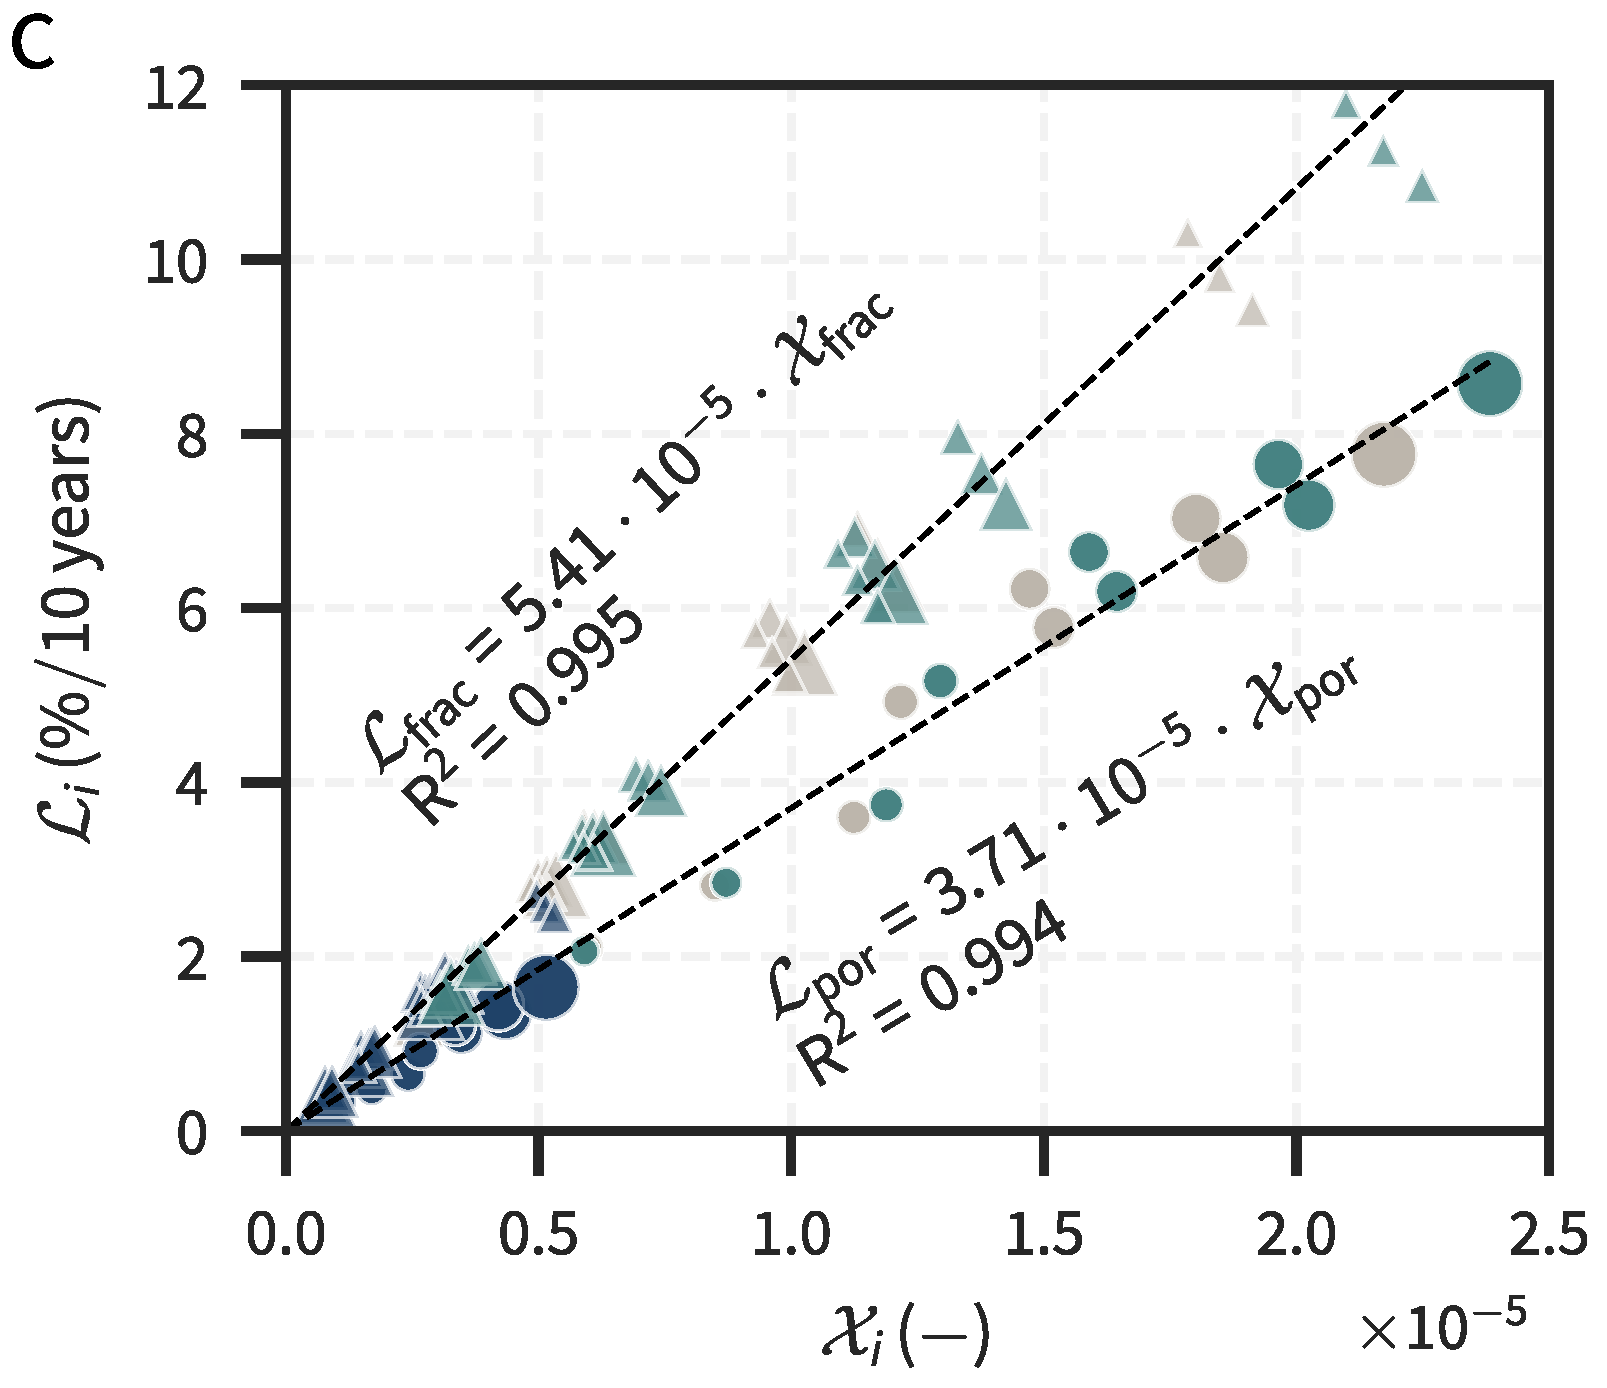
where a is an exponent that depends on the considered layer type. Using linear regression, a was fitted to 1.5 for the porous layers and to 1.9 for the fracture layers. The scaling score then linearly relates the a priori known input parameters of a reservoir and its layers to the simulated layer permeability losses. The resulting linear relationships are shown in Figure 7c, which both have a very high R 2 correlation coefficient of over 0.99 . To yield the total reservoir permeability loss, one can then take the arithmetic mean of the layer losses with the respective flow rate ratio as weights (Equation (20)).
L res = n = 1 i L i Q i / Q tot

4. Discussion

Our aim for the present study was to investigate the barite scaling potential and the corresponding injectivity loss of wells within fractured-porous reservoirs. We assumed the modelled reservoir consisted of two separate, horizontal aquifers, one porous and one fractured layer. With this, we build upon a previous study, in which we assessed the situation for purely porous media, focussing on fluid compositions and temperature variations representative of deep geothermal systems in Germany and restricting precipitation to pure barite [1], i.e., disregarding solid-solution and other potential mineral scaling agents [3,36]. Open fractures, natural or engineered, are needed for many geothermal reservoirs to achieve the economically viably hydraulic yield, since porous matrix permeability is often insufficient. We expected that fractures crossing a well, provided they make up a significant amount of the total reservoir’s transmissivity, will decrease the impact of scalings compared to purely porous reservoirs. Open fractures are essentially preferential flow paths, with higher local flow velocities compared to the matrix flow, and thus mineral scalings are distributed more along the flow path. Our simulation results confirm this hypothesis, in which reservoirs with a 90 % transmissivity share regarding fractures had, on average, only half the injectivity loss compared to a fracture transmissivity-share of 10 % under otherwise equal conditions.

4.1. Simulation Results

We value the overall simulated injectivity losses of the Landau geothermal system as low (<8% after ten years), compared to effects related to, for example, mechanical fault compaction or non-sustainable, hydraulically induced fractures. Experiments on the laboratory and reservoir scale show that this can happen within an even shorter timeframe and could account for losses by more than a factor of three [49,50]. We also showed that scaling is a creeping process that occurs linearly in the investigated time frame, principally allowing for time to react with countermeasures. Furthermore, a crucial value for the interpretation of our results is the precipitation potential of barite ( N eq ), i.e., the maximum amount of barite that can precipitate from a defined volume of fluid. This mainly depends on fluid chemistry and temperature reduction [1]. Here, we assumed it to be located in the upper range of what is possible. Precipitation within the technical system [4] and fluid re-heating in the rock due to thermal conduction could both reduce the potential, but were not taken into account. While temperature variations will play a progressively smaller role, as the injection location will cool down over time, the precipitated amount in the well, pipes, and above-ground system is hard to quantify. A comprehensive assessment would need to take precipitation kinetics within the whole system into account (e.g., [51]), although studies have shown that barite can be kinetically inhibited in this environment [52], justifying our approach.
It is known that barite and celestite form slightly non-ideal regular solid-solution [36,37], which could increase the precipitation potential compared to the sum of the end members; this is a source of uncertainty when modelling only the pure mineral phases. Sr -bearing barite scales have been reported for various geothermal sites [3,5], and the abilities of modelling solid-solutions in reactive transport simulators has been demonstrated in a recent study [53]. The saturation ratio of celestite for the here considered cooled geothermal fluids at injection conditions is either negligibly supersaturated ( SR < 1.1 ) or slightly undersaturated. The precipitation potential of pure celestite can thus be assumed to be negligible. Using parameters for the ( Ba , Sr ) SO 4 solid-solution given in Vinograd et al. [37], the additional precipitation amount, compared to modelling only barite precipitation, is approximated to be around 20 % . This is within acceptable limits for the present study, but preliminary results show that this may be even more at higher injection temperatures ( 70 ° C ). For more detailed and site-specific assessments, solid-solutions can be subject to future work in this context.
The presented results strongly depend on the assumed reservoir thickness and reactivity. In this study, the reservoir was based on the Landau geothermal reservoir, using a comparably large porous aquifer thickness of 500 m . If the same fluid samples are applied to a purely porous reservoir with a thickness of only 20 m , representative of the North German Basin (e.g., [54]), losses are higher by a factor from three to four [1]. For the same reason, the fracture layers, which had flow-through areas of four orders of magnitude lower than their porous counterparts, systematically exhibited higher permeability losses. Mineral scaling locations are concentrated more vertically along the well-axis, although this is opposed to some degree by the higher flow rates and increased horizontal distribution in the rock. While one could come to the conclusion that a larger flow-through area reduces scaling related injectivity loss, the relationship is further dependent on the overall reactivity of the aquifer. The accessible barite surface area in the rock, which controls the overall precipitation rate, is notoriously hard to quantify [43], and primarily depends on the barite content in the rock and the inner rock surface area, both of which can vary significantly between and within stratigraphic layers [38,39,40]. Moreover, the scaling itself provides further reactive surface area, which was not taken into account here.
Our dual-layer simulation approach is an abstraction of the multi-horizon reservoir at the Landau geothermal system. The underlying model framework follows from the limited data that are available on the subsurface. Foremost, the assumption of radial-symmetry facilitates one-dimensional transport models, which are reasonable considering the adopted conditions of isotropic hydraulic behaviour. However, if it becomes evident that mass transfer between and within aquifer units significantly contributes to the overall flow regime, the model could be improved by taking the interaction between layers into account. An example of complexity being added in this way is the dual-porosity approach (e.g., [22,41]). However, the matrix permeability of the granitic basement in the URG is negligible [6,55], and thus dual-porosity approaches appear unfounded.

4.2. Scenario Analysis

The calculated equilibrium length (Equation (11)) was used to approximate the radial area of interest around an injection well concerning barite scaling. On this basis, the model lengths for the reactive transport simulations were determined. Given that its derivation (Appendix B) is based on a first-order chemical reaction [56], compared to the second-order mineral reaction of barite used in the simulations [34], the results correspond exceptionally well to the simulated equilibrium lengths. This is due to the fact that the Ba 2 + concentration is about two orders of magnitude lower than that of SO 4 2 for the considered fluid samples. Consequentially, the sulfate concentration changes during barite precipitation are almost negligible in comparison, resulting in a practically pseudo-first order reaction. For the fracture layers, the calculated and simulated lengths are related by merely a constant, making it an excellent predictive value for the presented cases. For the porous layers, a dependency on the flow rate seems apparent, though the overall fluctuation of the relationship is small. We hypothesise that this is a grid effect resulting from the high-flow velocities close to the well ( v 1 / r ). In a separate test (not shown), decreasing the grid elements increased the discrepancy, providing support for this assumption. Although there is no apparent dependency on the fluid sample, it remains unclear whether the calculated equilibrium length is generally applicable for other fluid compositions.
In case of the Landau geothermal reservoir, the Buntsandstein was more permeable prior to stimulation, but the granitic fractures provide the most productive zones afterwards (derived from temperature logs) [12]. However, it is unclear if this shift is permanent or if circulation over a longer period could change the flow regime again. The impedance of the injection well is known to reduce slightly [27,50], at least in the first months of circulation, but self-propping fractures may close again over time due to the mechanical failure of asperities [50]. The scenario analysis, covering the range of flow fractions of fractures and porous matrix, showed that activating the granitic fractures would reduce barite-scaling-related injectivity loss. Thus, ensuring fractures are the dominant flow path is favourable in this sense, e.g., by the use of proppants [6,12,50].
The amount and, coincidentally, the aperture of hydraulically active fractures in the aquifer both influence permeability loss. It was shown that one order of magnitude more fractures doubles the scaling induced loss. Furthermore, smaller apertures were associated with an increased scaling risk. This finding corresponds to a numerical study for single fractures on the laboratory scale [16], where low fracture aperture was identified as the most important parameter, next to barite supersaturation. This was attributed to the specific inner surface area, which is inversely related to the aperture for an idealised fracture. These characteristic values are usually hard to determine in situ, and thus constitute uncertainties for the models [6,10,14]. Genter et al. [10] carried out a fracture analysis at the Soultz geothermal site and found that only about 30, 1 % of the total recorded fractures were open and unsealed. The measured apertures were of the order of a few mm , about one or two orders of magnitude larger than the calculated apertures in this study. The latter were derived from hydraulic apertures, but using the cubic law and assuming infinitely extending horizontal plates parallel to flow. In reality, fractures may not be ideally connected within a fracture zone and may be oriented divergent to flow. Further, they could be partly sealed, and thus exhibit significant aperture fluctuations [10]. The corresponding inner surface area of fracture zones are expected to be higher, thus actual permeability losses may be underestimated. However, there are indications that flow, especially in stimulated fractured reservoirs, is determined by a discrete set of individual fractures [12,27,57], in accordance with our assumptions.

4.3. Scaling Score and Implications for Geothermal Systems

We presented an analytical scaling score, which combines the investigated parameter relationships of the scenario analysis to approximate mono-mineralogical-scaling-induced permeability losses in fractured–porous media. A similar approach was presented in a previous study [1] for a porous reservoir type representative of the North German Basin. There, the local Damköhler number was used to quantify the influenced range along the flow path. Here, we extended this score to be generically applicable to fractured and porous aquifers with varying thicknesses and porosity. Furthermore, the radial equilibrium length was identified to be exceptionally suitable to approximate the range of scaling influence around an injection well under the assumption of quasi-stationary state. Compared to the Damköhler number, this does not depend on an arbitrary characteristic length, and, therefore, yields an easily, interpretable value. The main benefit of an analytical scaling score is that it enables a quick initial screening of geothermal sites to assess the scaling risk in advance. Elaborate numerical simulations can be carried out at a later stage of a geothermal project, when more detailed information is available on the subsurface and reservoir parameters.
The scaling score was demonstrated with the single mineral precipitation reaction of barite, but it may be applicable to other scaling minerals in fractured-porous geothermal reservoirs, such as quartz [21,58], celestite [5,59], or calcite [60]. The radial equilibrium length must be adapted accordingly to account for the kinetic rate law of the respective mineral. If multiple minerals are anticipated to precipitate in the reservoir, one score for each mineral must be calculated and the effects can be simply summed to yield a first approximation. This, however, does not account for any interaction of the chemical reaction system, which could lead to non-linear effects. One example is the aforementioned solid-solution barite–celestite, which may lead to an increased precipitation potential compared to the sum of the endmembers. Another example would be the dissolution of anhydrite within the reservoir due to cool water injection, which could facilitate further barite and celestite precipitation due to the release of sulfate into solution [61]. A comprehensive assessment of the chemical system and possible interaction effects may be needed for specific sites, and is subject to future work.
There are two essential differences between the fractured and porous layers, which the scaling score takes into account with the exponent a for the radial equilibrium length. Firstly, the loss factor must be seen in light of the respectively applied porosity–permeability relationship. The Kozeny–Carman relationship was used for porous media and the cubic law was used for the fractures. While these idealised model approaches are commonly used in this regard [20], significant deviations are possible under certain conditions (e.g., [17,19,38,62]). For fractures, many characteristics can be attributed to a departure from the cubic law, including aperture fluctuations, surface roughness, and pore fluid exchanges with the surrounding matrix [63]. The porosity–permeability relationship for porous rocks may become strongly non-linear, for example, if pore-throats are preferentially closed [17].
Poonoosamy et al. [19] used flow-through column experiments involving the concurrent dissolution of celestite and precipitation of barite to demonstrate that the Kozeny-Carman relationship does not hold for the investigated case, but that the relationship proposed by Verma and Pruess [64] provides better estimates. One drawback of this relationship is that it introduces an additional, potentially highly uncertain parameter: the critical porosity, below which the permeability is zero. Furthermore, barite supersaturation was orders of magnitude higher (this study: SR < 10 , experiment: SR 1000 ). Thus, nucleation was an important precipitation process in the experiments [19,65], but there is evidence that it is negligible for this study [1] (and references therein). Microstructural rock alteration patterns are, therefore, expected to be distinctly different; accordingly, we used the Kozeny–Carman relationship as a default. Ultimately, the choice of porosity–permeability law can be adapted according to specific site conditions. However, this is reflected in the a exponent, and thus each law needs to be calibrated with additional reactive transport simulations. It may be an interesting topic for future work to systematically investigate the relationship of the a exponent and the applied porosity–permeability. Ideally, an analytical relationship can be derived to completely bypass the numerical simulations.
The second difference is that the investigated porous layers are transport-limited, while the fractured layers exhibit reaction-limited precipitation. This can be derived from Figure 7a, where radial equilibrium length and loss factor are positively correlated for porous, but negatively correlated for fractured, layers. An increase of the radial equilibrium length corresponds to an increase in flow rate, which, in turn, means a higher solute influx, but also an increased distribution of precipitates along the flow path the further scaling happens away from the well; however, its influence on injectivity decreases logarithmically (Equation (17)). An increase in solute influx thus only increases the loss of the porous layer, but not that of the fracture layers, which have a spatial scaling reach into the reservoir that is about two orders of magnitude higher.

5. Conclusions

The present study assessed the barite scaling potential, and the related injectivity loss for geothermal wells within fractured-porous reservoirs, particularly for the expected fluids encountered at the Landau geothermal site in the Upper Rhine Graben. We highlight here the beneficial role of natural and engineered fractures with respect to mitigating the impact of barite scaling in this context. Preferential flow paths, while resulting in concentrated solute influx into the reservoir, cause mineral scaling to be more spatially spread within the reservoir. Our simulation results show that cases with a high fracture flow share are affected by up to 50 % less regarding injectivity loss compared to purely porous reservoirs. The numerical results of a previous study quantified the injectivity loss for Landau after ten years of circulation as around 20 % , but fractures were disregarded in that case. Here, we yielded lower losses of 3 8 % , depending on the amount, aperture, and flow rate share of the applied fractures. Increasing aperture and flow rate share generally decreased, whereas more fractures increased injectivity loss. Overall, we rate the barite-scaling-related injectivity loss in the Upper Rhine Graben to be small over the entire lifetime of a geothermal power plant compared to other known risks, such as the mechanical closing of fractures.
An analytical scaling score was developed for fractured–porous reservoirs. It features a quick screening method for geothermal sites to assess the associated scaling risk based on easily derivable reservoir and transport parameters, which can be conducted during the exploration phase. We identified the radial equilibrium length to be a key parameter to quantify the range of scaling influence around an injection well. After calibration to account for the respectively applied porosity–permeability relationship, there was excellent agreement with the simulation results. This confirms that this is a valuable tool to anticipate the barite scaling influence under expected system conditions, which is of practical importance for the conceptualisation of future geothermal power plants. As a next step, this conceptual model is planned to include a more complex geochemical system, including solid-solutions and multi-mineral reactions, to take potential non-linear effects into account.

Author Contributions

Conceptualization, M.T. and M.K.; Formal Analysis, M.T.; Funding Acquisition, M.K.; Investigation, M.T.; Methodology, M.T., M.D.L. and M.K.; Project Administration, M.K.; Software, M.T.; Supervision, M.K.; Writing—Original Draft, M.T.; Writing—Review and Editing, M.T., M.D.L. and M.K. All authors have read and agreed to the published version of the manuscript.

Funding

This research was supported by the Federal Ministry for Economics and Energy of Germany BMWi (grant no. 0324244C, project ReSalt). MDL acknowledges funding from Helmholtz project “Reduced Complexity Models” (grant no. ZT-I-0010).

Acknowledgments

Three anonymous reviewer are thanked for critically reading the manuscript and suggesting substantial improvements.

Conflicts of Interest

The authors declare no conflict of interest.

Abbreviations

The following abbreviations are used in this manuscript:
AbbreviationDescriptionUnit
EGSEnhanced Geothermal System
LNDLandau
NGBNorth German Basin
URGUpper Rhine Graben
AAquifer cross-sectional area m 2
Da Damköhler number
HAquifer thickness m
IIonic strength M
IAP Ionic activity product
JInjectivity m 3 / Pa s
K Permeability m 2
K sp Solubility constant
L Permeability/injectivity loss 1 / s
NPrecipitation potential mol / m sol 3
PPressure Pa
QFlow rate m 3 / s
RReaction rate mol / m rock 3 s
SSpecific reactive surface area m 2 / m rock 3
SF Scaling factor for reactive surface area
SR Saturation ratio ( = IAP / K sp )
S S Specific inner rock surface area m 2 / m rock 3
T Transmissivity m 3
TTemperature K
VFlow proxy ( = Q / 2 π H ) m 2 / s
X Scaling score
δ Fracture aperture half-width m
cSolute concentration mol / m rock 3
g Gravitational acceleration m / s 2
kRate constant mol / m 2 s
k Volumetric rate constant ( = k · S ) mol / m rock 3 s
μ Dynamic viscosity Pa / s
φ Porosity or volume fraction
qDarcy flow velocity m / s
q Normalised Darcy flow velocity m / s
rRadial distance from well-centre m
r e Range of influence m
r w Well radius m
ρ Density kg / m 3
sWater column m
tSimulation time s
τ A Advective time s
τ R Reactive time s
vPore velocity ( = q / φ ) m / s
xDistance m
0Subscript: initial value at t = 0
1Subscript: value at t > 0
c Subscript: characteristic
eq Subscript: equilibrium
f Subscript: fluid
frac Subscript: fracture layer
iSubscript: variable entity (solute, layer, etc.)
jSubscript: model grid node
mSubscript: mineral phase
por Subscript: porous layer
rad Subscript: radial
res Subscript: reservoir

Appendix A. Numerical Implementation of the Radial Diverging Flow Field

For a radially diverging flow field, where flow velocity is a function of radial distance to the well, conservation of mass for solute transport is given by the following advection-reaction equation [23]:
t ( φ c i ) = V r c i r + φ R .
with
V = Q 2 π H
and where c ( mol / m rock 3 ) is the solute concentration, and R ( mol / m rock 3 s ) is the reaction rate. Given that phreeqc only accepts constant flow velocities, Equation (A1) cannot be readily solved with its transport module because q ( r ) = V / r . There are two options to resolve the issue: (1) a non-uniform grid is used, where each grid step length corresponds to the mean flow velocity of the respective cell in order to fulfil the Courant-Friedrichs-Lewy stability criteria q ( r ) / φ Δ r / Δ t . Flow velocity decreases with r, so we see that grid step lengths have to decrease with r. The main downside to this is that the grid is coarse close to the well and gets increasingly finer with r; however, it is especially important to resolve this section highly, as the closer permeability change happens to the well, the larger the impact on injectivity. (2) Another option, which was adopted here, is to assume quasi-stationary state (Equation (A2)) and to multiply the equation with q / q ( r ) (constant for t > 0 , Equation (A3)).
q ( r ) c i r φ R = 0
q c i r q q ( r ) φ R = 0
where q ( m / s ) is the substitute Darcy velocity. It should be in the range q ( r ) med q q ( r ) max to avoid numerical errors. q med was used here to get the largest possible time steps. By making this adaption, the advection term is constant and the reaction term changes with r. This is easily implementable in phreeqc by using separate kinetics blocks for each cell and varying the respective reaction volume and reactive surface area. Calculated mineral phase changes using this method were rescaled after the simulation with d φ m = d φ m * V / r q .

Appendix B. Derivation of the Radial Equilibrium Length

The Damköhler number relates the characteristic solute transport time to reactive time and corresponds numerically to the advection-reaction equation (Equation (A1)). In general, its value is used to determine whether the dominant part of reaction happens within the flow section. In a one-dimensional, advection-dominated flow column on the length section [ 0 , l c ] , the advective time τ A ( s ) is defined with Equation (A4).
τ A = φ 0 l c 1 q ( x ) d x
where l c ( m ) is the characteristic length and x ( m ) is the flow distance. If q ( x ) is constant over x, we get the commonly cited term τ A = φ l c / q [66]. The reactive time τ R ( s ) depends on the kinetic rate law and the respective reaction order of the considered mineral. Using a first-order rate law of the form given in Equation (A5), an approximate solution can be yielded (Equation (A6)).
c t = k ( c / c eq 1 )
τ R = φ c eq k
where k ( mol / m rock 3 ) is the volumetric rate constant. A solution for the actually considered second-order rate law (Equation (12)) cannot be readily found, as it depends on the two non-equimolar reacting species SO 4 2 and Ba 2 + . Equation (A6) is used as an approximate solution here.
We now yield the advective Damköhler number Da ( ) with Equation (A7) assuming constant k over [ 0 , l c ] .
Da = τ A τ R = l c k q c eq
The equilibrium length l eq ( m ) can then be derived assuming quasi-stationary state [56]. It gives the approximate magnitude of flow length over which a transported solute has reached equilibrium. For its derivation, we set the characteristic length to the unknown equilibrium length when calculating the advective time (Equation (A8)) and also set the Damköhler number to 1, i.e., characteristic advective time and reactive time are balanced out (Equation (A9)).
τ A , eq = ϕ q 0 l eq d x = ϕ l eq q
Da eq = l eq k q c eq = 1
l eq = q c eq k
If q ( x ) is non-constant over x, however, it needs to be integrated over the considered flow section to get the time for a solute entity to travel this distance. Thus, the advective time in a radial diverging flow field τ A , rad ( m ) is given by Equation (A11).
τ A , rad = φ r w r c 1 q ( r ) d r = φ V r w r c r d r = φ 2 V ( r c 2 r w 2 )
Note that instead of integrating over [ 0 , l c ] , we consider the flow section from the well exit to a characteristic flow radius [ r w , r rc ] . Again, assuming a constant reaction rate, we get the radial Damköhler number (Equation (A12)).
Da rad = τ A , rad τ R = k 2 V c eq ( r c 2 r w 2 )
The radial equilibrium length (Equation (A15)) can be derived analogously to the linear case.
τ A , rad , eq = φ r w r eq 1 q ( r ) d r = φ 2 V ( r eq 2 r w 2 )
Da rad , eq = k 2 V c eq ( r eq 2 r w 2 ) = 1
r eq = 2 V c eq k + r w 2

References

  1. Tranter, M.; De Lucia, M.; Wolfgramm, M.; Kühn, M. Barite Scale Formation and Injectivity Loss Models for Geothermal Systems. Water 2020, 12, 3078. [Google Scholar] [CrossRef]
  2. Agemar, T.; Weber, J.; Schulz, R. Deep Geothermal Energy Production in Germany. Energies 2014, 7, 4397–4416. [Google Scholar] [CrossRef]
  3. Wolfgramm, M.; Rauppach, K.; Thorwart, K. Mineralneubildungen Und Partikeltransport Im Thermalwasserkreislauf Geothermischer Anlagen Deutschlands. Z. Für Geol. Wiss. 2011, 39, 213–239. [Google Scholar]
  4. Scheiber, J.; Seibt, A.; Birner, J.; Genter, A.; Moeckes, W. Application of a Scaling Inhibitor System at the Geothermal Power Plant in Soultz-Sous-Forêts: Laboratory and On-Site Studies. In Proceedings of the European Geothermal Congress, Pisa, Italy, 3–7 June 2013. [Google Scholar]
  5. Regenspurg, S.; Feldbusch, E.; Byrne, J.; Deon, F.; Driba, D.L.; Henninges, J.; Kappler, A.; Naumann, R.; Reinsch, T.; Schubert, C. Mineral Precipitation during Production of Geothermal Fluid from a Permian Rotliegend Reservoir. Geothermics 2015, 54, 122–135. [Google Scholar] [CrossRef]
  6. Vidal, J.; Genter, A. Overview of Naturally Permeable Fractured Reservoirs in the Central and Southern Upper Rhine Graben: Insights from Geothermal Wells. Geothermics 2018, 74, 57–73. [Google Scholar] [CrossRef]
  7. Guillou-Frottier, L.; Carrė, C.; Bourgine, B.; Bouchot, V.; Genter, A. Structure of Hydrothermal Convection in the Upper Rhine Graben as Inferred from Corrected Temperature Data and Basin-Scale Numerical Models. J. Volcanol. Geotherm. Res. 2013, 256, 29–49. [Google Scholar] [CrossRef] [Green Version]
  8. Bächler, D.; Kohl, T.; Rybach, L. Impact of Graben-Parallel Faults on Hydrothermal Convection––Rhine Graben Case Study. Phys. Chem. Earth Parts A/B/C 2003, 28, 431–441. [Google Scholar] [CrossRef]
  9. Dezayes, C.; Genter, A.; Valley, B. Structure of the Low Permeable Naturally Fractured Geothermal Reservoir at Soultz. Comptes Rendus Geosci. 2010, 342, 517–530. [Google Scholar] [CrossRef] [Green Version]
  10. Genter, A.; Traineau, H.; Dezayes, C.; Elsass, P.; Ledesert, B.; Meunier, A.; Villemin, T. Fracture Analysis and Reservoir Characterization of the Granitic Basement in the HDR Soultz Project (France). Int. J. Rock Mech. Min. Sci. Geomech. Abstr. 1996, 33, A69. [Google Scholar] [CrossRef]
  11. Baumgärtner, J.; Teza, D.; Hettkamp, T.; Hauffe, P. Stimulierung Tiefer Geothermischer Systeme. BBR Fachmagazine Fur Brunn. Und Leitungsbau 2010, 61, 14. [Google Scholar]
  12. Schindler, M.; Baumgärtner, J.; Gandy, T.; Hauffe, P.; Hettkamp, T.; Menzel, H.; Penzkofer, P.; Teza, D.; Tischner, T.; Wahl, G. Successful Hydraulic Stimulation Techniques for Electric Power Production in the Upper Rhine Graben, Central Europe. In Proceedings of the World Geothermal Congress, Bali, Indonesia, 25–30 April 2010; p. 7. [Google Scholar]
  13. Ngo, V.V.; Lucas, Y.; Clément, A.; Fritz, B. Modeling the Impact of Temperature on the Saturation State and Behavior of Minerals in the Soultz-Sous-Forêts Geothermal System. Geothermics 2016, 64, 196–208. [Google Scholar] [CrossRef]
  14. Griffiths, L.; Heap, M.; Wang, F.; Daval, D.; Gilg, H.; Baud, P.; Schmittbuhl, J.; Genter, A. Geothermal Implications for Fracture-Filling Hydrothermal Precipitation. Geothermics 2016, 64, 235–245. [Google Scholar] [CrossRef]
  15. Orywall, P.; Drüppel, K.; Kuhn, D.; Kohl, T.; Zimmermann, M.; Eiche, E. Flow-through Experiments on the Interaction of Sandstone with Ba-Rich Fluids at Geothermal Conditions. Geotherm. Energy 2017, 5, 20. [Google Scholar] [CrossRef] [Green Version]
  16. Tranter, M.; De Lucia, M.; Kühn, M. Numerical Investigation of Barite Scaling Kinetics in Fractures. Geothermics 2021, 91, 102027. [Google Scholar] [CrossRef]
  17. Wetzel, M.; Kempka, T.; Kühn, M. Diagenetic Trends of Synthetic Reservoir Sandstone Properties Assessed by Digital Rock Physics. Minerals 2021, 11, 151. [Google Scholar] [CrossRef]
  18. Wetzel, M.; Kempka, T.; Kühn, M. Hydraulic and Mechanical Impacts of Pore Space Alterations within a Sandstone Quantified by a Flow Velocity-Dependent Precipitation Approach. Materials 2020, 13, 3100. [Google Scholar] [CrossRef]
  19. Poonoosamy, J.; Klinkenberg, M.; Deissmann, G.; Brandt, F.; Bosbach, D.; Mäder, U.; Kosakowski, G. Effects of Solution Supersaturation on Barite Precipitation in Porous Media and Consequences on Permeability: Experiments and Modelling. Geochim. Cosmochim. Acta 2020, 270, 43–60. [Google Scholar] [CrossRef]
  20. Hommel, J.; Coltman, E.; Class, H. Porosity–Permeability Relations for Evolving Pore Space: A Review with a Focus on (Bio-)Geochemically Altered Porous Media. Transp. Porous Media 2018, 124, 589–629. [Google Scholar] [CrossRef] [Green Version]
  21. Pandey, S.; Chaudhuri, A.; Rajaram, H.; Kelkar, S. Fracture Transmissivity Evolution Due to Silica Dissolution/Precipitation during Geothermal Heat Extraction. Geothermics 2015, 57, 111–126. [Google Scholar] [CrossRef]
  22. Lucas, Y.; Ngo, V.V.; Clément, A.; Fritz, B.; Schäfer, G. Modelling Acid Stimulation in the Enhanced Geothermal System of Soultz-Sous-Forêts (Alsace, France). Geothermics 2020, 85, 101772. [Google Scholar] [CrossRef]
  23. Bear, J. Dynamics of Fluids in Porous Media; Dover Books on Physics and Chemistry; Dover: New York, NY, USA, 1988. [Google Scholar]
  24. Renard, P.; de Marsily, G. Calculating Equivalent Permeability: A Review. Adv. Water Resour. 1997, 20, 253–278. [Google Scholar] [CrossRef] [Green Version]
  25. Dupuit, J. Études Théoriques et Pratiques Sur Le Mouvement Des Eaux Dans Les Canaux Découverts et à Travers Les Terrains Perméables; Technical Report; Dunod: Paris, France, 1863. [Google Scholar]
  26. Genske, D.D. Ingenieurgeologie: Grundlagen und Anwendung; Springer: Berlin/Heidelberg, Germany, 2006. [Google Scholar]
  27. Tischner, T.; Pfender, M.; Teza, D. Hot Dry Rock Projekt Soultz: Erste Phase der Erstellung Einer Wissenschaftlichen Pilotanlage; Abschlussbericht 0327097; BGR: Berlin, Germany, 2006. [Google Scholar]
  28. Witherspoon, P.A.; Wang, J.S.Y.; Iwai, K.; Gale, J.E. Validity of Cubic Law for Fluid Flow in a Deformable Rock Fracture. Water Resour. Res. 1980, 16, 1016–1024. [Google Scholar] [CrossRef] [Green Version]
  29. Paillet, F.L.; Hess, A.E.; Cheng, C.H.; Hardin, E. Characterization of Fracture Permeability with High-Resolution Vertical Flow Measurements During Borehole Pumping. Ground Water 1987, 25, 28–40. [Google Scholar] [CrossRef]
  30. Wolfgramm, M.; Seibt, A. Zusammensetzung von Tiefenwässern in Deutschland und ihre Relevanz Für geothermische Anlagenteile; DGK: Los Angeles, CA, USA, 2008; pp. 503–516. [Google Scholar]
  31. Sanjuan, B.; Millot, R.; Innocent, C.; Dezayes, C.; Scheiber, J.; Brach, M. Major Geochemical Characteristics of Geothermal Brines from the Upper Rhine Graben Granitic Basement with Constraints on Temperature and Circulation. Chem. Geol. 2016, 428, 27–47. [Google Scholar] [CrossRef]
  32. Parkhurst, D.L.; Appelo, C. Description of Input and Examples for PHREEQC Version 3: A Computer Program for Speciation, Batch-Reaction, One-Dimensional Transport, and Inverse Geochemical Calculations; Report 6-A43; USGS: Reston, VA, USA, 2013.
  33. Lasaga, A.C. Kinetic Theory in the Earth Sciences; Princeton Series in Geochemistry; Princeton University Press: Princeton, NJ, USA, 1998. [Google Scholar]
  34. Zhen-Wu, B.; Dideriksen, K.; Olsson, J.; Raahauge, P.; Stipp, S.; Oelkers, E. Experimental Determination of Barite Dissolution and Precipitation Rates as a Function of Temperature and Aqueous Fluid Composition. Geochim. Cosmochim. Acta 2016, 194, 193–210. [Google Scholar] [CrossRef]
  35. Rimstidt, J.; Barnes, H. The Kinetics of Silica-Water Reactions. Geochim. Cosmochim. Acta 1980, 44, 1683–1699. [Google Scholar] [CrossRef]
  36. Heberling, F.; Schild, D.; Degering, D.; Schäfer, T. How Well Suited Are Current Thermodynamic Models to Predict or Interpret the Composition of (Ba,Sr)SO4 Solid-Solutions in Geothermal Scalings? Geotherm. Energy 2017, 5, 9. [Google Scholar] [CrossRef] [Green Version]
  37. Vinograd, V.; Kulik, D.; Brandt, F.; Klinkenberg, M.; Weber, J.; Winkler, B.; Bosbach, D. Thermodynamics of the Solid Solution—Aqueous Solution System (Ba,Sr,Ra)SO4 + H2O: I. The Effect of Strontium Content on Radium Uptake by Barite. Appl. Geochem. 2018, 89, 59–74. [Google Scholar] [CrossRef] [Green Version]
  38. Beckingham, L.E. Evaluation of Macroscopic Porosity-Permeability Relationships in Heterogeneous Mineral Dissolution and Precipitation Scenarios. Water Resour. Res. 2017, 53, 10217–10230. [Google Scholar] [CrossRef] [Green Version]
  39. Bruss, D. Zur Herkunft der Erdöle im Mittleren Oberrheingraben und ihre Bedeutung für die Rekonstruktion der Migrationsgeschichte und der Speichergesteinsdiagenese; Number 3831 in Berichte des Forschungszentrums Jülich; Forschungszentrum Jülich GmbH Zentralbibliothek, Verlag: Jülich, Germany, 2000. [Google Scholar]
  40. Rabbani, A.; Jamshidi, S. Specific Surface and Porosity Relationship for Sandstones for Prediction of Permeability. Int. J. Rock Mech. Min. Sci. 2014, 71, 25–32. [Google Scholar] [CrossRef]
  41. Deng, H.; Spycher, N. Modeling Reactive Transport Processes in Fractures. Rev. Mineral. Geochem. 2019, 85, 49–74. [Google Scholar] [CrossRef] [Green Version]
  42. Seigneur, N.; Mayer, K.U.; Steefel, C.I. Reactive Transport in Evolving Porous Media. Rev. Mineral. Geochem. 2019, 85, 197–238. [Google Scholar] [CrossRef] [Green Version]
  43. Beckingham, L.E.; Mitnick, E.H.; Steefel, C.I.; Zhang, S.; Voltolini, M.; Swift, A.M.; Yang, L.; Cole, D.R.; Sheets, J.M.; Ajo-Franklin, J.B.; et al. Evaluation of Mineral Reactive Surface Area Estimates for Prediction of Reactivity of a Multi-Mineral Sediment. Geochim. Cosmochim. Acta 2016, 188, 310–329. [Google Scholar] [CrossRef] [Green Version]
  44. Deng, H.; Steefel, C.; Molins, S.; DePaolo, D. Fracture Evolution in Multimineral Systems: The Role of Mineral Composition, Flow Rate, and Fracture Aperture Heterogeneity. ACS Earth Space Chem. 2018, 2, 112–124. [Google Scholar] [CrossRef] [Green Version]
  45. Deng, H.; Molins, S.; Trebotich, D.; Steefel, C.; DePaolo, D. Pore-Scale Numerical Investigation of the Impacts of Surface Roughness: Upscaling of Reaction Rates in Rough Fractures. Geochim. Cosmochim. Acta 2018, 239, 374–389. [Google Scholar] [CrossRef]
  46. Carman, P.C. Fluid Flow through Granular Beds. Trans. Inst. Chem. Eng. 1937, 15, 150–166. [Google Scholar] [CrossRef]
  47. Kozeny, J. Über Kapillare Leitung Des Wassers Im Boden. Sitzungsberichte Wien. Akad. 1927, 136, 271–306. [Google Scholar]
  48. King, P. The Use of Renormalization for Calculating Effective Permeability. Transp. Porous Media 1989, 4, 37–58. [Google Scholar] [CrossRef]
  49. Kluge, C.; Blöcher, G.; Barnhoorn, A.; Schmittbuhl, J.; Bruhn, D. Permeability Evolution During Shear Zone Initiation in Low-Porosity Rocks. Rock Mech. Rock Eng. 2021, 54, 5221–5244. [Google Scholar] [CrossRef]
  50. Blöcher, G.; Reinsch, T.; Henninges, J.; Milsch, H.; Regenspurg, S.; Kummerow, J.; Francke, H.; Kranz, S.; Saadat, A.; Zimmermann, G.; et al. Hydraulic History and Current State of the Deep Geothermal Reservoir Groß Schönebeck. Geothermics 2016, 63, 27–43. [Google Scholar] [CrossRef]
  51. Banks, J. Sulfate Mineral Scaling during the Production of Geothermal Energy from Sedimentary Basin Formation Brines: A Case Study at the Groß Schönebeck in-Situ Geothermal Laboratory, Germany. Ph.D. Thesis, Freie Universität Berlin, Berlin, Germany, 2013. [Google Scholar]
  52. Canic, T.; Baur, S.; Adelhelm, C.; Rauppach, K.; Wolfgramm, M. Kinetik von Barytausfällungen Aus Geothermalwasser—Einfluss Der Scherung; DGK: Los Angeles, CA, USA, 2011. [Google Scholar]
  53. Poonoosamy, J.; Wanner, C.; Alt Epping, P.; Águila, J.F.; Samper, J.; Montenegro, L.; Xie, M.; Su, D.; Mayer, K.U.; Mäder, U.; et al. Benchmarking of Reactive Transport Codes for 2D Simulations with Mineral Dissolution—Precipitation Reactions and Feedback on Transport Parameters. Comput. Geosci. 2021, 25, 1337–1358. [Google Scholar] [CrossRef]
  54. Franz, M.; Barth, G.; Zimmermann, J.; Budach, I.; Nowak, K.; Wolfgramm, M. Geothermal Resources of the North German Basin: Exploration Strategy, Development Examples and Remaining Opportunities in Mesozoic Hydrothermal Reservoirs. Geol. Soc. Lond. Spec. Publ. 2018, 469, 193–222. [Google Scholar] [CrossRef]
  55. Bär, K.M. Untersuchung Der Tiefengeothermischen Potenziale von Hessen. Ph.D. Thesis, Technische Universität, Darmstadt, Germany, 2012. [Google Scholar]
  56. Lichtner, P.C. The Quasi-Stationary State Approximation to Coupled Mass Transport and Fluid-Rock Interaction in a Porous Medium. Geochim. Cosmochim. Acta 1988, 52, 143–165. [Google Scholar] [CrossRef]
  57. Zimmermann, G.; Moeck, I.; Blöcher, G. Cyclic Waterfrac Stimulation to Develop an Enhanced Geothermal System (EGS)—Conceptual Design and Experimental Results. Geothermics 2010, 39, 59–69. [Google Scholar] [CrossRef] [Green Version]
  58. Kumar, G.S.; Ghassemi, A. Numerical Modeling of Non-Isothermal Quartz Dissolution/Precipitation in a Coupled Fracture–Matrix System. Geothermics 2005, 34, 411–439. [Google Scholar] [CrossRef]
  59. Nitschke, F.; Scheiber, J.; Kramar, U.; Neumann, T. Formation of Alternating Layered Ba-Sr-Sulfate and Pb-Sulfide Scaling in the Geothermal Plant of Soultz-Sous-Forêts. Neues Jahrb. Für Mineral. Abh. 2014, 191, 145–156. [Google Scholar] [CrossRef]
  60. Wanner, C.; Eichinger, F.; Jahrfeld, T.; Diamond, L.W. Causes of Abundant Calcite Scaling in Geothermal Wells in the Bavarian Molasse Basin, Southern Germany. Geothermics 2017, 70, 324–338. [Google Scholar] [CrossRef] [Green Version]
  61. Forjanes, P.; Astilleros, J.M.; Fernández-Díaz, L. The Formation of Barite and Celestite through the Replacement of Gypsum. Minerals 2020, 10, 189. [Google Scholar] [CrossRef] [Green Version]
  62. Poonoosamy, J.; Haber-Pohlmeier, S.; Deng, H.; Deissmann, G.; Klinkenberg, M.; Gizatullin, B.; Stapf, S.; Brandt, F.; Bosbach, D.; Pohlmeier, A. Combination of MRI and SEM to Assess Changes in the Chemical Properties and Permeability of Porous Media Due to Barite Precipitation. Minerals 2020, 10, 226. [Google Scholar] [CrossRef] [Green Version]
  63. Blöcher, G.; Kluge, C.; Milsch, H.; Cacace, M.; Jacquey, A.B.; Schmittbuhl, J. Permeability of Matrix-Fracture Systems under Mechanical Loading – Constraints from Laboratory Experiments and 3-D Numerical Modelling. Adv. Geosci. 2019, 49, 95–104. [Google Scholar] [CrossRef] [Green Version]
  64. Verma, A.; Pruess, K. Thermohydrological Conditions and Silica Redistribution near High-Level Nuclear Wastes Emplaced in Saturated Geological Formations. J. Geophys. Res. 1988, 93, 1159. [Google Scholar] [CrossRef] [Green Version]
  65. Tranter, M.; Wetzel, M.; De Lucia, M.; Kühn, M. Reactive Transport Model of Kinetically Controlled Celestite to Barite Replacement. Adv. Geosci. 2021, 56, 57–65. [Google Scholar] [CrossRef]
  66. Steefel, C.I. Geochemical Kinetics and Transport. In Kinetics of Water-Rock Interaction; Brantley, S.L., Kubicki, J.D., White, A.F., Eds.; Springer: New York, NY, USA, 2008; pp. 545–589. [Google Scholar] [CrossRef]
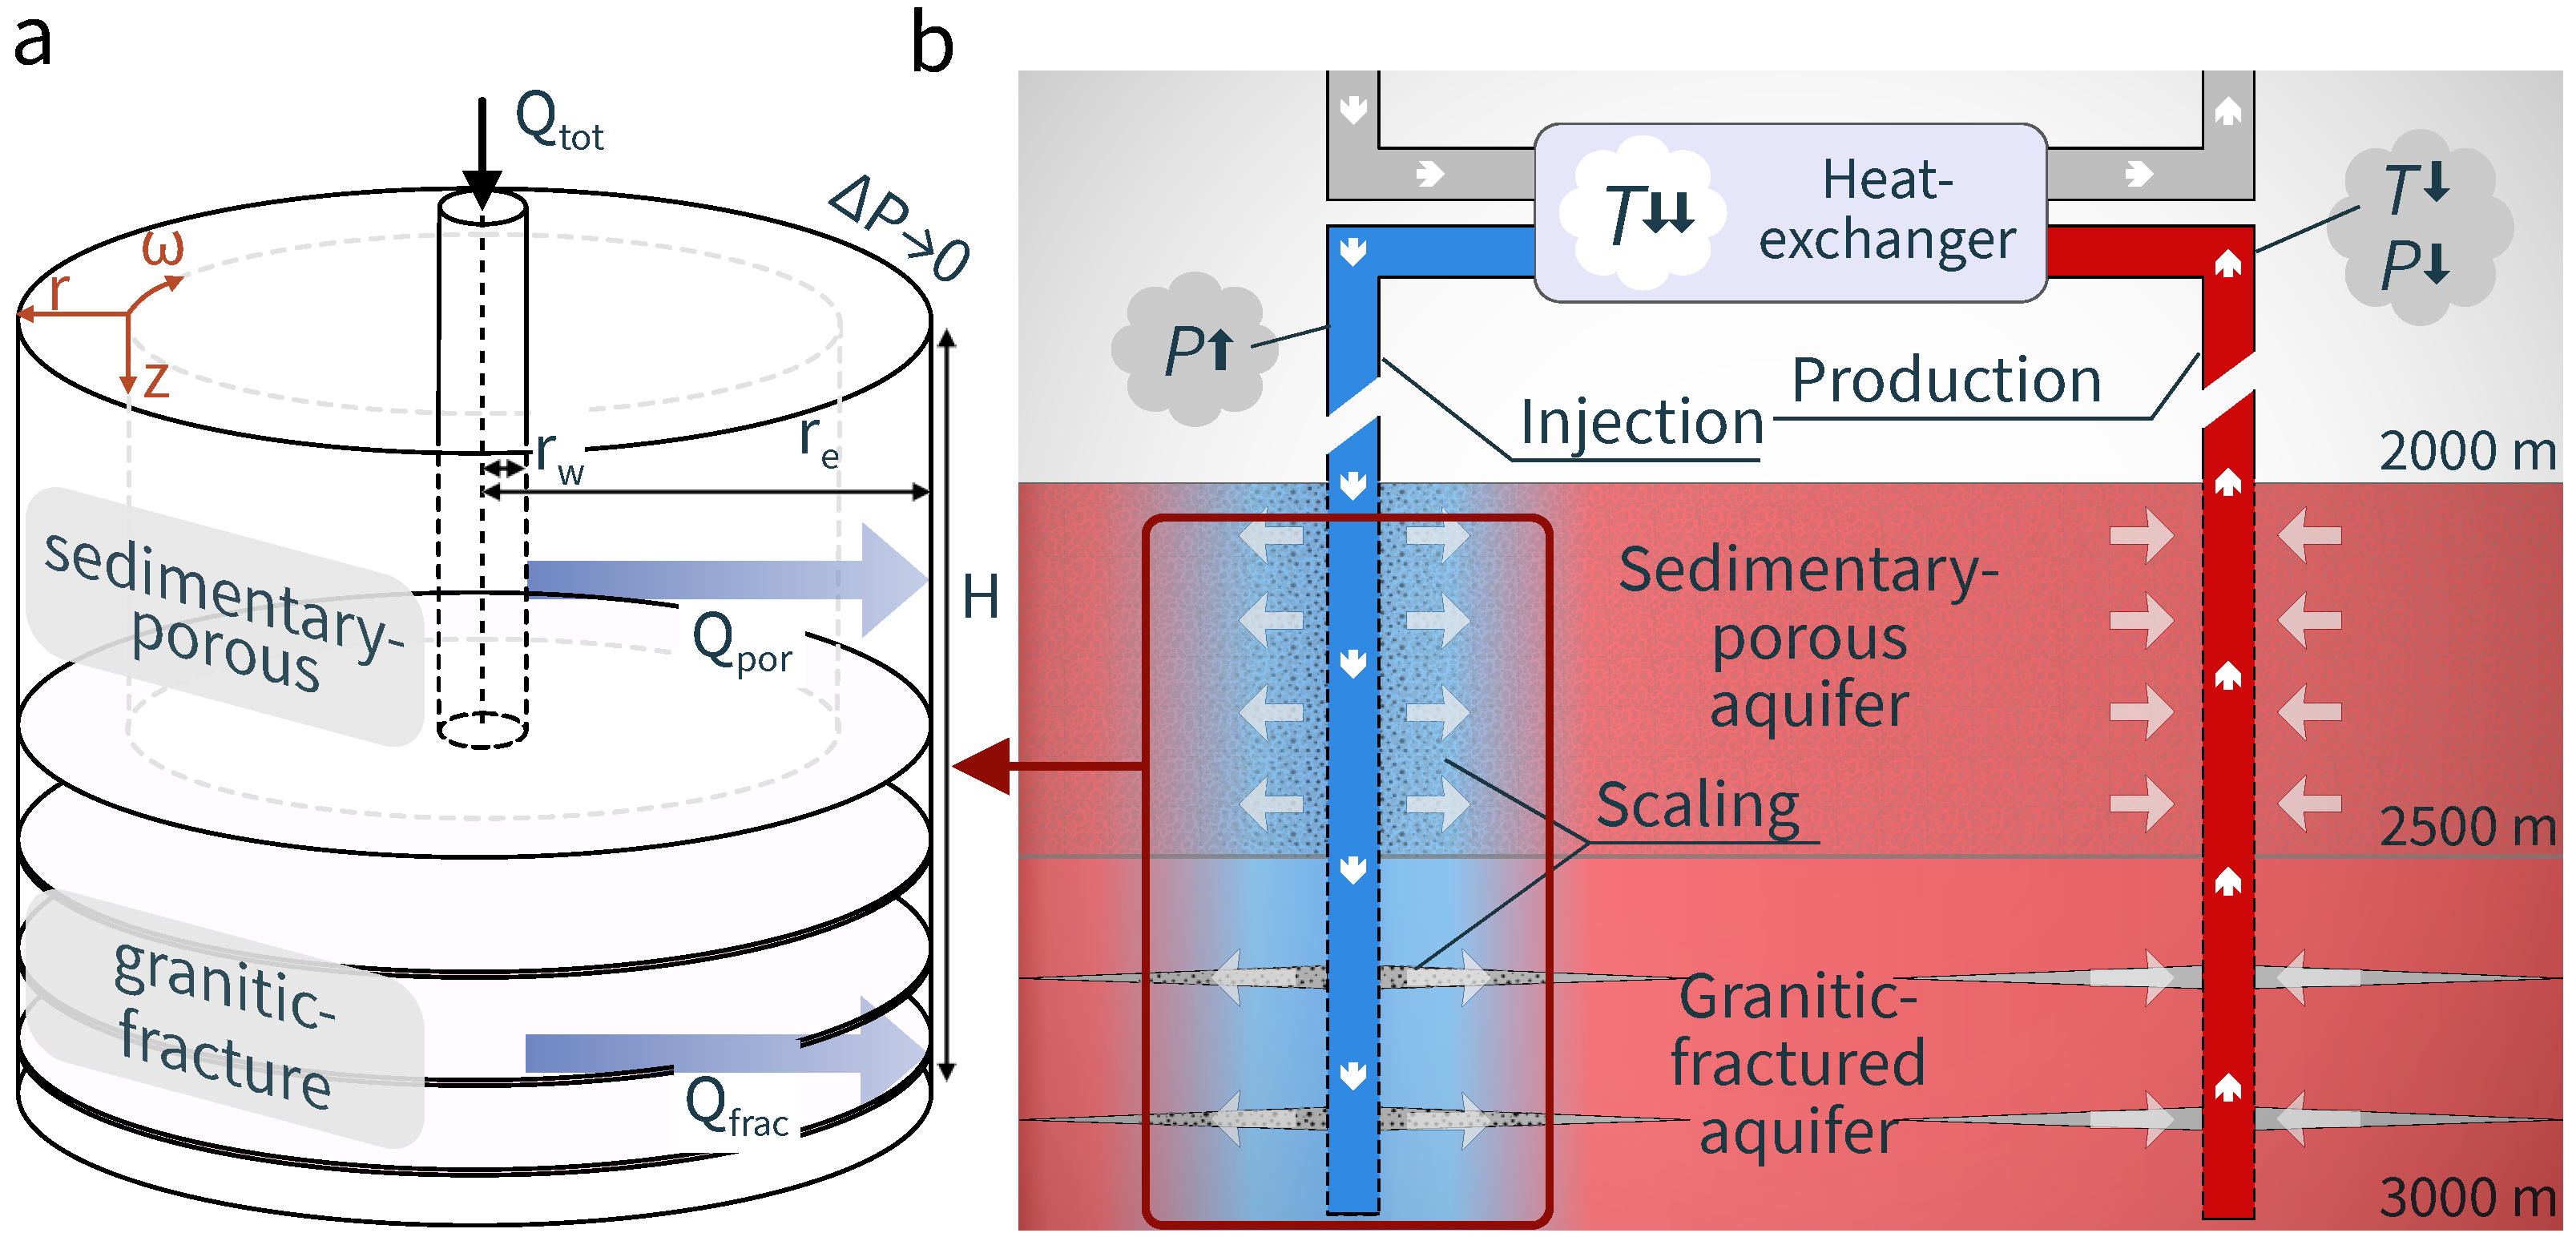
Figure 1. Conceptual model of radially diverging groundwater flow near an injection well of a geothermal system. (a) Injection flow components are split into two parts for the sedimentary–porous aquifer (upper layer) and the granitic–fractured aquifer with variable sizes and different amounts of horizontal fractures (lower layer). The boundary is the range of influence, i.e., where the induced pressure difference moves towards zero. (b) Produced fluids, originating from the deep reservoir, are cooled and depressurised along the flow path through the heat exchanger. Thermodynamically disequilibrated fluids are then re-injected via the injection well, where scaling and formation damage are anticipated.
Minerals 11 01198 g001
Figure 2. Reservoir simulation results of scenario 1. (a) Conceptual view of the reservoir model with the injection well at the origin. (b) Porosity change along the horizontal flow axis at the end of the simulation, as well as the previously calculated and simulated equilibrium lengths. (c) Effective permeability change in the layers and the reservoir over the duration of the simulation.
Minerals 11 01198 g002
Figure 3. Reservoir simulation results of scenario 2. (a) Conceptual view of the reservoir model with the injection well at the origin. (b) Porosity change along the horizontal flow axis at the end of the simulation as well as the previously calculated and simulated equilibrium lengths. (c) Effective permeability change in the layers and the reservoir over the duration of the simulation.
Minerals 11 01198 g003
Figure 4. Previously calculated ( r eq , calc , Equation (11)) and simulated equilibrium lengths ( r eq , sim ) are correlated. r eq , calc can thus be used as a predictive parameter. Q i refers to the flow rate of the respective porous or fractured layer.
Minerals 11 01198 g004
Figure 5. Permeability loss of the fracture layer ( L frac ) is dependent on the fracture half-aperture ( δ ), amount of fractures ( n frac ), flow rate ( Q frac ), and fluid sample, i.e., fluid chemistry. The relationships are shown for all scenarios after the final simulation time of ten years.
Minerals 11 01198 g005
Figure 6. Effective reservoir permeability loss ( L res ) decreases as the flow rate ratio of the fracture layer ( Q frac / Q tot ) increases. Only the scenario with the base injection flow rate of 100 m 3 / h are shown after the final simulation time of ten years. The average losses for each input fluid sample are indicated as dashed lines.
Minerals 11 01198 g006
Figure 7. (a) The porous layers show clear signs of being transport-limited with respect to loss due to scaling, whereas the fracture layers are rather reaction-limited. (b) Initial ion ratios for the considered samples versus the precipitation potential ( N eq ), i.e., the maximum amount of barite that can precipitate, provided thermodynamic equilibrium is reached, show a positive correlation. (c) The final layer permeability loss can be fitted with an analytical scaling score (Equation (19)). The upper dashed line for the fracture layers is a linear regression using an exponent a = 1.9 . The lower dashed line is for the porous layers and uses an exponent of a = 1.5 .
Minerals 11 01198 g007aMinerals 11 01198 g007b
Table 1. Chemical compositions of the geothermal fluids samples given as total elemental concentrations. All concentrations are given in (mM), except for pH . LND is a sample from the Landau geothermal reservoir [31]. URG 2000 m and URG 3000 m are averaged samples from the Upper Rhine Graben at respective depths [30]. The samples have been further modified to achieve equilibrium with respect to the common reservoir minerals barite, quartz, anhydrite, celestite, and calcite at reservoir conditions; chloride was fitted to reach charge balance [1].
SampleLNDURG 2000 mURG 3000 m
K 106 78.8 133
Na 12708941590
Ca 196104177
Mg 3.25 4.23 4.29
Sr 10.6 2.7 8.83
Ba 0.11 0.0189 0.0953
Fe 0.403 1.84 3.73
Cl 179011802100
Br 2.84 1.29 2.61
S ( 6 ) 3.02 5.93 3.61
C ( 4 ) 4.14 4.04 7.42
Si 2.12 1.09 1.89
pH 5.41 5.66 5.28
I201013202310
Table 2. The reservoir simulation variables and ranges that were considered for the exhaustive scenario analysis. Each unique parameter combination represents a scenario ( 3 4 = 81 scenarios).
VariableRange
Sample[LND, URG 2000 m, URG 3000 m]
Q tot [50, 100, 200] m 3 / h
Q frac / Q tot [ 0.1 , 0.5 , 0.9 ]
n frac [1, 10, 100]
Publisher’s Note: MDPI stays neutral with regard to jurisdictional claims in published maps and institutional affiliations.