Article

Linking Automated Scanning Electron Microscope Based Investigations to Chemical Analysis for an Improved Understanding of Ash Characteristics

1
Institute of Chemical Technology, Technische Universität Bergakademie Freiberg, 09599 Freiberg, Germany
2
Institute of Mineralogy, Technische Universität Bergakademie Freiberg, 09599 Freiberg, Germany
*
Author to whom correspondence should be addressed.
Minerals 2021, 11(11), 1182; https://doi.org/10.3390/min11111182
Submission received: 22 July 2021 / Revised: 14 October 2021 / Accepted: 19 October 2021 / Published: 26 October 2021

Abstract

:
The movements and efforts of a circular economy, aiming to tap into the resource potential of ash, require an intimate knowledge of the material; often, target elements within this material are part of complex ash phases. This work shows how automated SEM investigations measure up to other laboratory techniques for the analysis of elemental composition and particle size. Three sewage sludge ash (SSA) samples have been studied in this comparison, showing material variation for SSA and highlighting the strengths and shortcomings of the methods chosen. Inductively coupled plasma optical emission spectroscopy (ICP-OES), X-ray fluorescence (XRF) and scanning electron microscopy with energy dispersive X-ray analysis (SEM-EDX) show relevant phosphate phases, but also a number of other elements. The extent of the accompanying elements, most likely hindering efficient phosphorus (P) recovery, varies. Propensities for detection in fine-grained and largely amorphous material such as ash vary, as is explored in this thorough comparison. ICP-OES data suffers from incomplete sample mobilization, and XRF-derived values suffer from matrix effects. Both are the only techniques studied which show trace elements, such as potentially toxic elements. SEM-EDX automated mineralogy delivers more reliable data for main elements while not reporting traces. By showing SEM-EDX automated mineralogy particle size distributions, alongside laser diffraction derived particle size distributions, the extent of the strain ash puts on traditional techniques is visible. Ashes tend to agglomerate, and the porous nature of particles hinders accurate detection. This work highlights where SSA recycling needs to be careful and hints at the extent of discrepancies between different methods. When understanding ash as a potential resource and designing efficient extraction strategies, this knowledge is crucial.

1. Introduction

Ashes form the residue of incomplete combustion and, thus, are true anthropogenic sediments, long handled and used by humanity and ultimately reflective of human activity. Investigations of ash have revealed information on human societies that dates back to ca. one million years ago when humans first controlled fire [1]. Among prehistoric records, the uses of ash center around its application as a pesticide in prehistoric Egypt [2]. Later, analysis of the residual ash from samples of organic matter became a staple technique for material characterization. Early reports of plant ash garnered interest and were cited and built upon [3], which shows an early example of analytical development and the refinement of ash studies. As part of the yearly review in science, Mitscherlich’s private report on wet chemical ash analysis is published [4]. This presents the state-of-the-art ash analysis of the 19th century, in which organic waste material (beer brewing yeast residue) has been incinerated. Later ash analysis techniques relied on spectroscopy, based on the pioneering work of coal fly ash analysis [5], which made extensive use of ICP-OES (inductively coupled plasma optical emission spectroscopy). As XRF (X-ray fluorescence) was established for studying the elemental content of ash [6], it was suggested by those building SEM-EDX (scanning electron microscope coupled with energy dispersive X-ray spectroscopy) that it should be used for the ‘validation’ of XRF results [7]. Despite this work, the mere characterization of ash is still a challenge due to the fine-grained, largely amorphous and heterogeneous nature of the material [8,9]. A good observation of this instance is found in [10], where the authors state, “We, geotechnical engineers, have to improve our skills for the chemical analysis!”. In a way, this paper presents an answer to this cry: a geoscience-based response to analytical variations in chemical analysis. In this work, ICP-OES data is compared to X-ray fluorescence and automated mineralogy SEM-EDX results. Thus, the advances that automated SEM-EDX mineralogy enables when examining industrial ashes are highlighted—presenting the next step in the analysis of anthropogenic sediments.
An improved understanding of ash has led to more applications and uses, such as additives in building and ceramic materials [11]. Investigations of coal fly ash and red mud for treating acid mine drainage [12] also used SEM-EDX based automated mineralogy, underlining the potential of these systems as waste-to-resource candidates.
Early fertilizer uses of ashes were as traditional in-situ biomass burning, which in the context of industrial farming has been replaced by phosphate addition. Most phosphate fertilizers are generated from rock phosphate. Fifty million of the 69 million tonnes of world reserves lie in Morocco and Western Sahara, indicating a significant imbalance in supply and demand [13]. There are no substitutions for phosphorus in agriculture. Similar to water, phosphorus is cycled through the geosphere. Here, anthropogenic influences are already visible; preparing global agriculture for a rising population calls for the improved management of resources. A step towards balancing the biogeochemical phosphorus flow is developing technologies that enable societies around the world to recycle phosphorus from ubiquitous materials, such as human waste/sewage sludge. This would enhance the productivity of local agricultural areas and reduce dependence on rock phosphate imports. Thus, sewage sludge ashes (SSA) have been the ash type that is studied for its phosphorus contents, as well as potentially toxic accompanying elements. Resembling other types of ash, this material is fine-grained and largely amorphous, considerably impacting analytical techniques. Inspired by the paucity of ash data in the scientific literature that discusses method-specific biases, a comparison of the analytics of three types of ash subjected to several standard techniques is hereby added to the scientific literature. Other authors have opted for XRF combined with SEM-EDS [14] or ICP-OES (inductively coupled plasma atomic emission spectroscopy) and laser diffractometric particle analyzers [15] to characterize ash. This work compares the different analytical techniques for SSA characterization.

2. Materials and Methods

2.1. Sample Description

The SSA investigated in this study originate from the experimental sewage sludge mono-combustion plant VERENA in Pirna, Saxony. Here, the sewage sludge was incinerated after reaching a target temperature (800–900 °C) in excess oxygen. In order to ensure this temperature range, auxiliary firing of fuel oil was employed, and roughly 10 L/hr fuel oil were used. Sludge was sourced from three municipal wastewater treatment plants serving the cities of Leipzig, Dresden and Chemnitz, all in Saxony, Germany; sampled on the same day. Thereby, the sample set is controlled for the region, season and incineration regime.

2.2. X-ray Fluorescence (XRF)

The X-ray fluorescence (XRF) analyses were carried out using a Spectro XEPOS III instrument (SPECTRO Analytical Instruments GmbH, Kleve, Germany), and the data were analyzed using an X-LabPro 5 software (Version 5.1). The measurements were performed under a helium atmosphere (82 g/L), and the SSA samples were pressed into tablets instead of direct powder analysis. Sample preparation consisted of sieving the SSA powder to 63 µm and subsequent blending with a cellulose-based binder called CEREOX® (Fluxana GmbH & Co. KG, Bedburg-Hau, Germany). A total of 4 g of SSA powder and 1 g of the binder were intensively mixed using a Mixer Mill MM 400 (Retsch GmbH, Haan, Germany) with a frequency of 30/s for 5 min. The tablet was formed by a manual hydraulic press (GS15011, Specac Ltd., Orpington, UK) using 10 t. The analyses were carried out in triplicate, whiskers in diagrams show variations.

2.3. X-ray Diffraction (XRD)

X-ray diffraction (XRD) analyses were performed with a Bruker D2 Phaser with a Lynxeye® detector (Bruker Inc., Billerica, MA, USA) using Cu Kα radiation; λ = 1.541 Å, 40 kV, 30 mA with an opening angle of 5° 2θ. The X-ray tube was operated at 30 kV and 10 mA. The XRD patterns were collected with a step of 0.02°and 1s dwell time. The qualitative analysis was assessed with the use of DIFFRAC.EVA software (Version 5.2) and the Powder Diffraction File (PDF-2) database [16].

2.4. Scanning Electron Microscopy with Energy Dispersive X-ray Analysis (SEM-EDX)

For the automated SEM mineralogy analyses, an MLA (Mineral Liberation Analyzer, by FEI INC., by Thermo Fisher Scientific, Waltham, MA, USA) was used. Three powder samples were collected and subjected to two different preparation procedures: (1) horizontal grain mounts and (2) vertical grain mounts (Figure 1). For the grain mount preparation, dried sample powder was mixed 1:1 with graphite (for particle separation) and stirred into epoxy in 30 mm diameter Teflon containers. The resultant epoxy blocks were generated, whetted, polished and carbon coated for measurement. The vertical preparation procedure cuts blocks generated as before and rotates the slices by 90° to show the whole spectrum of particle sizes [17]. Thus, two aliquots of the same sample were prepared and measured. In studies of the elemental composition, the differences between these two measurements of the same material were plotted using tick marks in the bar chart. The samples were introduced into the vacuum chamber of the SEM, and beam acceleration was set at 15 kV with a current of 10 nA. For the acquisition of the grayscale BSE image, Cu was selected as the BSE grayscale standard (materials with a Z value of Cu or higher appear as 256 (very bright), all other materials turn out darker, respectively). Spectral data were obtained using the GXMAP procedure; particles were automatically detected and covered with a grid of measurement points. Particles smaller than 20 pixels were identified by a single measurement point; particles may be composed of multiple grains (Table 1). Software operations used MLA datasuite Version 3.1.4.686. In this study, sewage sludge ashes are analyzed with respect to their phosphorus content, using the target component grouping proposed by the authors [10]. Spectra were collected with 11,000 counts minimum. Therefore, this method tries to meet the general accuracy challenges of EDX with statistical significance. Less than 0.9 % of the sample area that remained was classified as unknown, with no X-ray counts, or unspecified due to a low number of counts.

2.5. Inductively Coupled Plasma—Optical Emission Spectrometry (ICP-OES)

The elemental composition of each SSA was obtained by atomic emission spectrometry with inductively coupled plasma (ICP-OES, Optima 4300 DV, PerkinElmer, Waltham, MA, USA). The SSA was treated with aqua regia in a liquid:solid ratio (L:S) of 10 at 90 ± 2 °C for 2 h. The procedure was repeated three times for each SSA, accounting for possible inhomogeneities and enabling data presentation with deviations.

2.6. Laser Diffractometry

Particle size distribution was measured using a Beckman Coulter laser diffractometer, LS 13 320, by Beckman Coulter, Brea, CA, USA. The universal liquid module was used with the Fraunhofer.rf780d optical model.

3. Results and Discussion

The analyses all show the same trends, indicating that the analytical challenges in ash analyses do indeed apply to more than one sample. For XRD, the detection of phases is hindered by the amorphous portion of ashes. In the diffractograms shown (Figure 2), the baseline has been adjusted (removing the amorphous mound, a curvature of the baseline due to the amorphous content) to provide an improved baseline to the patterns. While it is possible to match the derived patterns databases, the interpreted diffractogram shows overlapping signals and weak signals. For instance, it is highly debatable whether the signal for “Anhydrite” is clear enough to allow for this interpretation. Reliably interpreted patterns seem to be Quartz and Fe2O3 at best. Matching this to the modal mineralogy, as derived from MLA (Table 2), does not seem helpful when hunting down phosphate phases for P-recycling and potentially toxic elements to assess the suitability of a material for recycling (and/or adjust processes regarding health and safety). While these diffractograms highlight that iron is part of the mix, it does not reflect the phosphate content in a way that would lead to material classification for efficient P-recycling. This is an interesting discrepancy that has already been encountered by others [18], who detected a P total of 5.2% (detected by ICP-OES) and 70% of whitlockite-like components (XRD). Surely a material of 70% whitlockite-like components (with ~ 20% P) would lead to the expectation of a P content of 70% of whitlockite (~12 % P).

3.1. Elemental Compositions

Standard geochemical analyses were augmented by MLA calculated assay data. For these calculations, the surface area of the polished epoxy grain mount was analyzed using the EDX spectra based on calculated densities. From this, the software derives a calculated assay of elemental composition. Trace elements and elements too light for detection are not represented. For major elements in SSA, the MLA calculated assay data are plotted in comparison to ICP-OES and XRF and show good agreement (Figure 3). Error bars show the variation of three measurements for ICP-OES and XRF and the variation of two measurements for MLA. The elements presented are ordered alphabetically within the bar charts. Tables showing numerical data can be found in the supplementary information (Table S2). As it is sometimes customary to present XRF data as oxides of elements, this data format can also be found in the appendix (Table S1). Although it is safe to assume that all elements are oxides in combustion products such as ash, [10,19] found that the material associations in SSA are more complex than that. For example, EDX data showed distinct material phases containing Ca-P-Fe-Si-Al-O, so representing the elemental content of SSA as oxides is slightly misleading. Using automated mineralogy, we found 0% MgO. Instead, the Mg content of SSA is dispersed in 17 different phases. Overall, we found 2.11–2.36% Mg, which is significantly more than the XRF data shows. For example, 2.11% Mg should be 3.5% MgO. This is an additional shortcoming of XRF data in this case, on top of suggesting that MgO would be a constituting phase of SSA. As stated in the conclusions of this article, the calculated difference to 100% lies in elements not detected. Previous authors [20] explain this loss by chemisorbed water. For this dataset, it would not be accurate to report this value as “loss on ignition” as a pressed tablet has been measured; therefore, there was no ignition. In Table S1, please note that detecting Hg using ICP requires slightly different sample preparation. Thus, this measurement is different from the other ones. Detecting Hg in XRF influenced this sample preparation and led to this analysis, showing that in this material, Hg seems to be greatly overrepresented in XRF.
MLA calculated assay, ICP-OES and XRF analyses show minor differences in elemental composition. Standard XRF systems, such as the one used here, cannot detect elements lighter than sodium. In both MLA and XRF elemental analysis, the difference between the sum of elements detected and 100% is given as oxygen. This “oxygen content” needs caution in evaluations, as undetected elements might hide here. A major drawback of ICP-OES analysis is the challenge of solubilizing the material. The standard aqua regia preparation of 0.1 g sample results in a “partial digestion”, which is not helpful for SSA. The ICP-OES data (see Figure 3) shows little variation for main elements, but in comparison to XRF and MLA data, Al is underrepresented, and Si is not detected. This is a direct result of silicates and alumosilicates being difficult to digest—hence, the absence of Si data for ICP analyses. Comparing these values for SSA to the findings of colleagues in the field [18,21], they seem within the normal spectrum of SSA. XRF and MLA show a better representation of Al and Si. At the same time, underrepresenting some elements may result in an overrepresentation of others, which is the case for Fe, Ca and P here. Colleagues [22] reported that all elements measured higher values for SEM-EDX, which, analytically, is the same instrumentation that MLA uses. This is an observation for bottom ash and thus is not directly comparable. In their analysis of fly ash, XRF and SEM-EDX data are compared, and XRF values are similar to, or higher than, SEM-EDX (except for Ca and Fe). These phases are easily acid accessible, thereby fully deported to liquid phase and thus reliably analyzed in absolute numbers. This data shows how MLA data reconciles main element contents, showing the extent of mismatch between ICP and XRF.
The Si and Al inventory of ashes clearly call for a better representation of these than ICP is able to deliver, which automated SEM-based mineralogy systems can provide. Roughly 28% of the sample’s Si content is represented by the mineral Quartz. This information is part of the MLA dataset, where the material is analyzed as distinct EDX material phases. Other large portions of the overall Si content are in multi-element material phases. If these phases have not been digested, as the non-existent Si values for ICP-OES measurement suggest, other elements would be affected as well. For example, at least a third of the P content would be missing. This is not the case. Comparing these two datasets shows that these complex material phases are not digested in an all-or-nothing scenario—acid digestion does selectively solubilize elements. It also addressed Fe and Ca, both highly represented in ICP-OES data. However, MLA data shows higher P content.
Taking matrix effects (affecting XRF analytics) into account, the MLA-derived data are deemed to represent the silicate contents most accurately. At the same time, XRF data for trace elements (Figure 4) always reports higher values than ICP-OES. The Hg values (0.001176 mg/kg in the Leipzig sample according to ICP-OES) are a particularly striking example. As discussed above, this could be a result of the incomplete solubilization of the material. This is interesting, as arsenic, which was detected in XRF but hardly showed up in ICP, is preferentially associated with silicates/aluminosilicates. The values derived for trace elements are well within line for SSA as deigned by [23] but present higher values for all trace elements. This is also interesting as they used United States Environmental Protection Agency (USEPA) 3050 sample preparation procedures that would have solubilized less than the aqua regia digestion used here. Largely similar values for main ash elements and trace elements were found in a study adding HF to the digestion acid for sample preparation and ICP-MS analysis [19]. An inventory of Polish SSA [21] showed similar values as well. This work highlights the heterogeneity of SSA as a material within Poland.

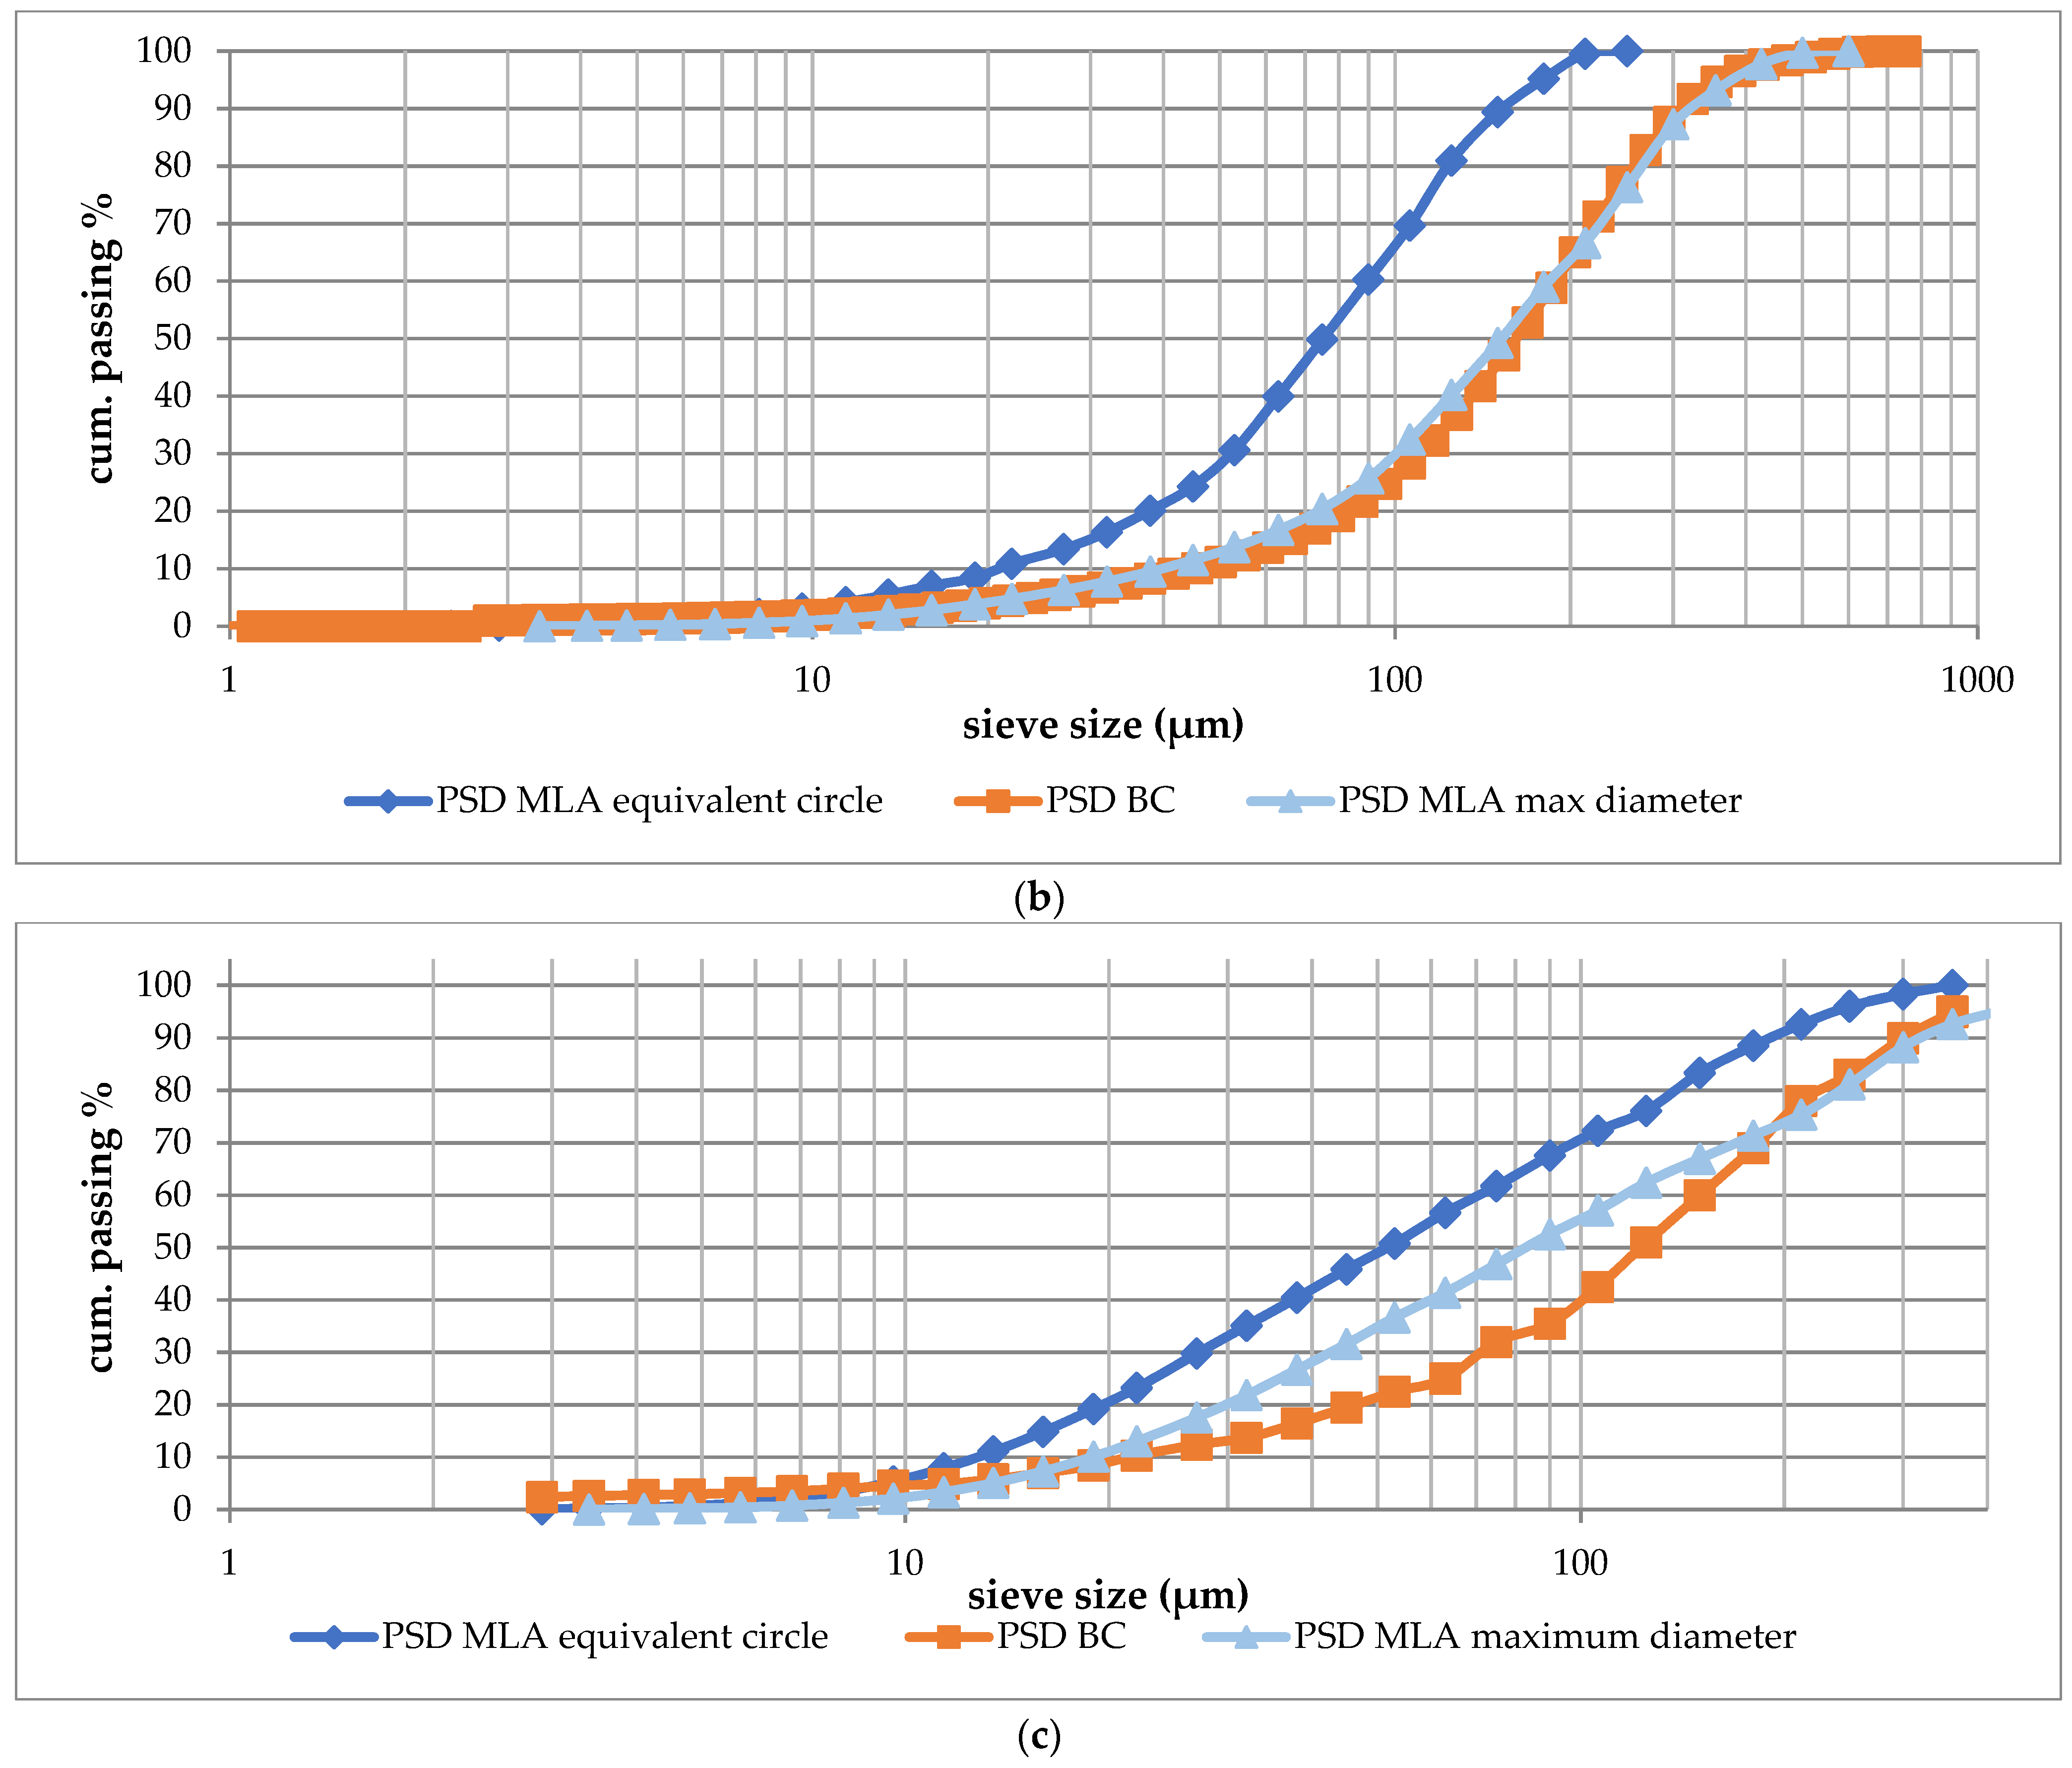
3.2. Particle Size Distribution Curves (PSD)

For laser-supported (LS) particle size distributions, particles may be incorrectly detected as one of the material agglomerates, thus shifting measured PSD towards coarser sizes. The extent of this effect has been uncovered by comparing it to MLA-derived PSD data. Another possible challenge when using LS to work on ash is the porous nature of some components. This will hinder accurate measurements. MLA sample preparation will affect the particle sizes measured—during epoxy hardening, gravitational settling will fractionate particle sizes (Figure 1). Here, the trans-vertical samples, which should give an account of the full particle size distribution, are compared with the LS measurements (Figure 5). The LS measurement detects some coarser particles, which may be agglomerations. Instrument-wise, the smallest particles measured using MLA were 1 µm, whereas the smallest channels of the laser sizer were 0.04 µm. In MLA sample preparation, the material was mixed with graphite flakes to separate particles and counter the tendency of the material to form agglomerations. While the PSD calculated from MLA measurements reach a maximum size of 355 µm, the laser sizer detects a maximum cumulative passing at 824 µm, seen as a sign of agglomerations formed. If the MLA data evaluation software is set to calculate PSD using the maximum diameter of particles, the PSD curve for the Dresden sample will lie on top of the laser diffractometric data. As a standard calculation model, the MLA software uses “equivalent circle”. For “equivalent ellipse”, the curve moves towards the finer end of the chart. While one sample shows good agreement for laser diffractometric PSD and maximum diameter MLA-derived PSD (Dresden), the other two do not—agglomerations of ash particles are blamed. For MLA analysis, particle mixing with graphite during sample preparation counters this effect. A study investigating the differences between horizontal/vertical preparation [24] showed that the effect of sample preparation for SSA is minute.

4. Conclusions

The main message from this data is: beware of method-specific misrepresentation. None of the analytical approaches shows the full spectrum; to date, ash still presents challenges. However, methods can augment each other and ash studies should take the strengths and weaknesses of each method into account. ICP suffers from incomplete digestion, XRF from matrix effects and automated mineralogy does not report trace elemental data. When looking at particle size distributions (PSD), laser-supported PSD seems to overestimate the coarser end, as porous particles and agglomerations of the material hinder accurate detection.
For ash, the high silicate content leads to elaborate sample preparation procedures for ICP-OES analyses. Thus, XRF analyses are encouraged as an addition for elemental composition data—since SEM-EDX analyses show complex material phases [10,24], it is advised to gather data by element, not oxides. The actual risk resulting from potentially toxic elements needs to be addressed carefully, depending on the use of ash. Ash behavior during technical processes may be studied on a particle morphological level using an automated mineralogy system, which may also validate and assist with main element analysis and particle size distributions. Comparing several laboratory analytical techniques, an ICP-OES/XRF combination is advised for elemental composition (including trace elements) and automated mineralogy for thorough particle analyses.
Future work should strive to investigate whether these discrepancies between analytical strategies also appear in municipal solid waste incineration and coal fly ashes. In addition, authors are encouraged to choose analyses according to their needs—if the process relies on accurate trace element detection, XRF is not the method of choice.

Supplementary Materials

The following are available online at https://www.mdpi.com/article/10.3390/min11111182/s1, here, we report tabulated data of XRF measurements (Table S1) and ICP data (Table S2). Regarding XRF data, this is a representation of oxides. Table S1: XRF data of SSA studied in oxide form; Table S2: ICP data for Dresden, Leipzig and Chemnitz samples.

Author Contributions

Following an idea of M.B. and B.S., conceptualization by B.S. and M.B. was followed by S.P. overseeing XRF, ICP-OES and laser diffractometric measurements and evaluation. A.C.G. evaluated automated mineralogy data, compared them to other data and drew conclusions. Draft preparation and writing were done by A.C.G., S.P., M.B. and B.S. All authors have read and agreed to the published version of the manuscript.

Funding

Financial support by the German Federal Ministry of Education and Research (Grant number 03WKDI2C, project start date: 1 April 2019) is gratefully acknowledged.

Acknowledgments

Dipl.-Geol. Sabine Gilbricht is acknowledged for SEM-MLA measurements, Andrea Schneider for assisting with ICP-OES analysis and Gabriele Herrmann for assisting with laser diffractometry. The authors are grateful for Hannah Zeumer and team (project partners at Technical University Dresden, Institute for waste management and circular economy) who are running the VERENA plant and supplied the samples. Lastly, the patience and careful review of Derek Wilton significantly improved this manuscript—thank you!

Conflicts of Interest

The authors declare no conflict of interest. The funders had no role in the design of the study; in the collection, analyses, or interpretation of data; in the writing of the manuscript, or in the decision to publish the results.

References

  1. Berna, F.; Goldberg, P.; Horwitz, L.K.; Brink, J.; Holt, S.; Bamford, M.; Chazan, M. Microstrati-graphic evidence of in situ fire in the Acheulean strata of Wonderwerk Cave, Northern Cape province, South Africa. Proc. Natl. Acad. Sci. USA 2012, 10, E1215–E1220. [Google Scholar] [CrossRef] [Green Version]
  2. Hakbijl, T. The Traditional, Historical and Prehistoric Use of Ashes as an Insecticide, with an Experimental Study on the Insecticidal Efficacy of Washed Ash. Environ. Archaeol. 2002, 7, 13–22. [Google Scholar] [CrossRef]
  3. Palmer, T. On the ASH of tillandsia usneoides. J. Frankl. Inst. 1889, 127, 131–133. [Google Scholar] [CrossRef]
  4. Berzelius, J. Analyse der Asche. Arch. Pharm. Pharm. Med. Chem. 1847, 100, 177–181. [Google Scholar]
  5. Nadkarni, R.A. Multitechnique multielemental analysis of coal and fly ash. Anal. Chem. 1980, 52, 929–935. [Google Scholar] [CrossRef]
  6. Chand, P.; Kumar, A.; Gaur, A.; Mahna, S.K. Elemental analysis of ash using X-ray fluo-rescence technique. Asian J. Chem. 2009, 21, 220–224. [Google Scholar]
  7. An, S.; Norlin, B.; Hummelgård, M.; Thungström, G. Comparison of Elemental Analysis Tech-niques for Fly Ash from Municipal Solid Waste Incineration using X-rays and Electron Beams. IOP Conf. Ser. Earth Environ. Sci. 2019, 337, 12007. [Google Scholar] [CrossRef]
  8. Schulz, B.; Sandmann, D.; Gilbricht, S. SEM-based Automated Mineralogy and its Application in Geo- and Material Sciences. Minerals 2020, 10, 1004. [Google Scholar] [CrossRef]
  9. Guhl, A.C.; Greb, V.-G.; Schulz, B.; Bertau, M. An Improved Evaluation Strategy for Ash Analysis Using Scanning Electron Microscope Automated Mineralogy. Minerals 2020, 10, 484. [Google Scholar] [CrossRef]
  10. Kamon, M.; Hartlen, J.; Katsumi, T. Reuse of waste and its environmental impact. In Proceedings of the International Conference on Geotechnical and Geological Engineering (GeoEng2000), Melbourne, Australia, 19–24 November 2000; Volume 1, pp. 1095–1123. [Google Scholar]
  11. Ahmaruzzaman, M. A review on the utilization of fly ash. Prog. Energy Combust. Sci. 2010, 36, 327–363. [Google Scholar] [CrossRef]
  12. Keller, V.; Stopic, S.; Xakalashe, B.; Ma, Y.; Ndlovu, S.; Mwewa, B.; Simate, G.; Friedrich, B. Effectiveness of Fly Ash and Red Mud as Strategies for Sustainable Acid Mine Drainage Management. Minerals 2020, 10, 707. [Google Scholar] [CrossRef]
  13. US Geological Survey. Mineral Commodity Summaries 2020; US Geological Survey: Reston, VA, USA, 2020. Available online: https://pubs.usgs.gov/periodicals/mcs2020/mcs2020.pdf (accessed on 18 October 2021).
  14. Guo, C.; Zou, J.; Ma, S.; Yang, J.; Wang, K. Alumina Extraction from Coal Fly Ash via Low-Temperature Potassium Bisulfate Calcination. Minerals 2019, 9, 585. [Google Scholar] [CrossRef]
  15. Hower, J.C.; Groppo, J.G.; Joshi, P.; Preda, D.V.; Gamliel, D.P.; Mohler, D.T.; Wiseman, J.D.; Hopps, S.D.; Morgan, T.D.; Beers, T.; et al. Distribution of Lanthanides, Yttrium, and Scandium in the Pilot-Scale Beneficiation of Fly Ashes Derived from Eastern Kentucky Coals. Minerals 2020, 10, 105. [Google Scholar] [CrossRef] [Green Version]
  16. Gates-Rector, S.; Blanton, T. The Powder Diffraction File: A Quality Materials Characterization Database. Powder Diffr. 2019, 34, 352–360. [Google Scholar] [CrossRef] [Green Version]
  17. Bartzsch, A.; Gilbricht, S.; Bachmann, K.; Heinig, T. A Method of Preparing a Sample Preparation, Sample Preparation, and Method of Assaying a Sample Material; Helmholtz-Zentrum Dresden Rossendorf: Dresden, Germany, 2017; eV on 17.01.2017. [Google Scholar]
  18. Kleemann, R.; Chenoweth, J.; Clift, R.; Morse, S.; Pearce, P.; Sajorj, D. Comparison of phosphorus recovery from incinerated sewage sludge ash (ISSA) and pyrolysed sewage sludge char (PSSC). Waste Manag. 2016, 60, 201–210. [Google Scholar] [CrossRef] [Green Version]
  19. Benassi, L.; Zanoletti, A.; Depero, L.; Bontempi, E. Sewage sludge ash recovery as valuable raw material for chemical stabilization of leachable heavy metals. J. Environ. Manag. 2019, 245, 464–470. [Google Scholar] [CrossRef]
  20. Anderson, M. Encouraging prospects for recycling incinerated sewage sludge ash (ISSA) into clay-based building products. J. Chem. Technol. Biotechnol. 2002, 77, 352–360. [Google Scholar] [CrossRef]
  21. Smol, M.; Adam, C.; Kugler, S.A. Inventory of Polish municipal sewage sludge ash (SSA)—Mass flows, chemical composition, and phosphorus recovery potential. Waste Manag. 2020, 116, 31–39. [Google Scholar] [CrossRef]
  22. Baldi, M.; Martinotti, A.; Sorlini, S.; Katsoyiannis, I.; Abbà, A.; Miino, M.C.; Collivignarelli, M. Extraction and Purification of Phosphorus from the Ashes of Incinerated Biological Sewage Sludge. Water 2021, 13, 1102. [Google Scholar] [CrossRef]
  23. Prabhakar, A.K.; Mohan, B.C.; Tay, T.S.; Lee, S.S.C.; Teo, S.L.M.; Wang, C.H. Incinerated Sewage Sludge Bottom Ash- Chemical pro-cessing, Leaching patterns and Toxicity testing. J. Hazard. Mater. 2020, 402, 123350. [Google Scholar] [CrossRef]
  24. Guhl, A.C.; Gilbricht, S.; Pätzold, C.; Schulz, B.; Bertau, M. Wastewater treatment plant processes affect P-phases in sewage sludge ashes. Miner. Eng. 2021, 173, 107138. [Google Scholar] [CrossRef]
Figure 1. Horizontal and vertical grain mounts of ashes. Gravitational settling might lead to a bias in ash analysis, vertical preparation helps address this bias. (a) Horizontal section with polishing plane indicated by red stippled line. (b) Vertical section with slices 1–5 of vertical cuts, indicated by red stippled lines. (c) Polished surfaces of grain mount blocks with graphite-loaded epoxy raisin; horizontal cut to the left and embedded vertical cuts 1–5 to the right.
Minerals 11 01182 g001
Figure 2. XRD diffractograms of samples. Complete with peak interpretation. Note that amorphous mound has been deleted. Qz: Quarz (SiO2); CaAl: Ca9Al(PO4)7; Hem: Hematite (Fe2O3); Anh: Anhydrite (CaSO4); CaFe: Ca9Fe(PO4)7; Crs: Cristobalite high (SiO2).
Minerals 11 01182 g002
Figure 3. Compositional distributions of main elements. Error bars are based on standard deviation of three measurements for ICP-OES and XRF data, while error bars on MLA calculated assay values are based on standard deviation between two different sample preparation methods. (a): Leipzig (LPZ), (b): Dresden (DRS), (c): Chemnitz (CHE). Scale on y-axis varies, as elemental content varies.
Minerals 11 01182 g003
Figure 4. Trace element contents as determined by ICP-OES and XRF measurements, averages of three measurements ((a) Leipzig data, (b) Dresden data, (c) Chemnitz data).
Minerals 11 01182 g004
Figure 5. Particle size distribution curves (PSD) as measured by laser diffractometry (PSD BC) and calculated from MLA data (PSD MLA). (a) Leipzig, (b) Dresden, (c) Chemnitz.
Minerals 11 01182 g005aMinerals 11 01182 g005b
Table 1. Number of particles and grains measured per sample, per preparation type.
SampleParticles, HorizontalParticles, VerticalGrains, HorizontalGrains, Vertical
Leipzig17,53623,803142,299188,810
Dresden14,13915,742170,342187,086
Chemnitz30,21732,452169,603173,353
Table 2. XRD-detected phases and their quantification in MLA, the latter values are sums of data that can be attributed to both quartz and cristobalite high (Si-O).
PhaseXRDMLA
LeipzigDresdenChemnitz
Quartzdetected7.58%10.54%9.09%
Cristobalite highdetected
Iron Oxidedetected0.46%0.25%0.63%
Ca9Al(PO4)7detectedNot foundNot foundNot found
Ca9Fe(PO4)7detected0.59%0.51%0.23%
Publisher’s Note: MDPI stays neutral with regard to jurisdictional claims in published maps and institutional affiliations.

