Article

X-ray Fluorescence and Laser-Induced Breakdown Spectroscopy Analysis of Li-Rich Minerals in Veins from Argemela Tin Mine, Central Portugal

1
Department of Geosciences, Ambient and Spatial Planning, Faculty of Sciences, University of Porto, 4169-007 Porto, Portugal
2
Institute of Earth Sciences, ICT, Pole of University of Porto, 4169-007 Porto, Portugal
3
Department of Physics and Astronomy, Faculty of Sciences, University of Porto, 4169-007 Porto, Portugal
4
INESC TEC, Campus da FEUP, 4200-465 Porto, Portugal
*
Author to whom correspondence should be addressed.
Minerals 2021, 11(11), 1169; https://doi.org/10.3390/min11111169
Submission received: 25 September 2021 / Revised: 17 October 2021 / Accepted: 19 October 2021 / Published: 22 October 2021
(This article belongs to the Section Mineral Exploration Methods and Applications)

Abstract

:
In this work, X-ray fluorescence (XRF) and Laser-induced breakdown spectroscopy (LIBS) analyses were applied to samples of quartz, montebrasite, and turquoise hydrothermal veins in the Argemela Tin Mine (Central Portugal). Montebrasite (LiAl(PO4)(OH,F)) is potentially the main ore mineral; with its alteration, lithium (Li) can disseminate into other minerals. A hand sample was cut and analyzed by XRF and LIBS for several elements of interest including Cu, P, Al, Si, and Li. Although XRF cannot measure Li, results from its analysis are effective for distinguishing turquoise from montebrasite. LIBS analysis complemented this study, making it possible to conclude that turquoise does not contain any significant Li in its structure. The difference in spot size between the techniques (5 mm vs. 300 µm for XRF and LIBS, respectively) resulted in a poorer performance by XRF in accurately identifying mixed minerals. A thin section was petrographically characterized and mapped using LIBS. The mapping results demonstrate the possibility of the successful identification of minerals and their alterations on a thin section. The results of XRF analysis and LIBS mapping in petrographic sections demonstrate the efficacy of these methods as tools for element and mineral identification, which can be important in exploration and mining phases, complementing more traditional techniques.

1. Introduction

Raw materials are the basis for most industrial sectors, being present in the manufacturing process and a broad range of goods used in modern technologies and everyday life. These raw materials are essential to Europe’s economy, thus, the European Commission carried out an assessment with the main goal of identifying raw materials of high economic importance and the potential for supply chain shortages. This list includes the rare earth elements Nb, Ta, Sb, Be, W, and Li, among others [1]. In addition to being of critical importance, most of these elements are not domestic to Europe and need to be imported. Lithium, for example, in the processing stage, is mainly produced in Chile (44%), China (39%), and Argentina (13%). The main sourcing countries for the European Union are Chile (78%), the United States (8%), and Russia (4%), meaning that the European Union has a Li import reliance of 100% [1]. Due to this dependence, re-assessment of the European Li resource potential is essential to meet the proposed digital and climate-neutral economy goal of the European Union.
There are two main types of Li deposits around the world: (1) brine deposits and (2) hard-rock deposits [2].
Brine deposits, sometimes referred to as salt flats (also commonly known as “salares”, a Spanish term), are present in enclosed and tectonically active basins that contain Li-rich lacustrine evaporites. The main brine-type deposits are situated in the Central Andes (South America) and China, with minor deposits in the United States [2].
Hard-rock deposits contain several types of Li mineralization related to magmatic processes (magmatic rock), processes of weathering, and supergene alteration and transport (sedimentary rocks). The main hard-rock deposits are situated in Australia, where spodumene-bearing lithium–cesium–tantalum pegmatites are being mined (such as in Greenbushes) [3].
On the Iberian Peninsula, principally in the Central Iberian Zone (CIZ), it is common to find Li mineralizations associated with pegmatites, leucogranitic domes, and quartz-rich hydrothermal veins [4]. Quartz-rich hydrothermal veins are often associated with leucocratic granitic bodies (Argemela: Charoy and Noronha [5]; Golpejas: Martín-Izard et al. [6]; Valdeflores: Pesquera et al. [7]; El Trasquilón: Gallego Garrido [8]; Massueime: Carvalho and Farinha [9]). The sub-vertical veins can be hosted in fractures inside granites or in metasedimentary country rocks with a thickness of less than one meter. The main lithium-bearing mineral is montebrasite, and it is associated with quartz, alkali feldspars, and cassiterite (an Sn-bearing mineral). Common accessory minerals are Nb-Ta oxides and phosphates (e.g., turquoise).
The occurrence of turquoise in quartz–montebrasite hydrothermal mineralizations was first reported by Gallego Garrido [8]. The author describes that the presence of turquoise in fractures of the veins is due to the process of neoformation from montebrasite. Pirard et al. [10] studied the Montebras pegmatite to establish the alteration sequence of aluminum phosphates. In that work, the authors noted that turquoise was present in the alteration sequence, in the last stage.
In Argemela, the presence of turquoise in fractures of the quartz–montebrasite hydrothermal veins was mentioned by Neto de Carvalho and Hamilton [11], but no petrographic analysis or other analytical method was used.
To better evaluate a potential deposit (Argemela Tin Mine), information on geological factors such as Li content and mineralogy is essential to better estimate resources and reserves. The alteration of montebrasite into turquoise can be problematic in the evaluation of a deposit, since it can cause a decrease in the Li content of the ore. Techniques such as X-ray fluorescence (XRF) and laser-induced breakdown spectroscopy (LIBS) are viable options for exploration and mining companies because they allow for the rapid detection of different elements in minerals. Combining these techniques with petrography can promote a more efficient characterization of deposits. The XRF technique involves exciting a sample with an X-ray beam. This interaction leads to the ejection of an electron from a fully occupied inner shell, producing a vacancy that is filled by an electron from an outer shell with higher energy. This recombination results in the emission of a fluorescent X-ray, indicating the specific element present in the sample [12,13]. The LIBS technique consists of focusing a pulsed laser, with high energy density and short pulse duration (frequently in the nanosecond range), into a sample surface, producing a plasma. This laser–matter interaction causes atomic excitation, ionization, and recombination. When de-excitation occurs, there is light emission, containing the spectral information of the sample, which can be recorded by a spectrometer. Through adequate spectral analysis, the sample composition can be determined [14,15,16,17].
Several studies have been reported in which both techniques are used for geochemical exploration, supporting their usefulness (e.g., XRF: Gazley et al. [18], Jones et al. [19], Sarala et al. [20]; LIBS: Guimarães et al. [21], Harmon et al. [22], McMillan et al. [23], Streubel et al. [24]).
In this work, a petrographic study of the quartz–montebrasite veins of the Argemela Tin Mine was performed, with special emphasis on turquoise and montebrasite minerals. A combination of XRF and LIBS techniques (applied to the sample and also to the petrographic section) were used to determinate the presence of Si, Cu, Al, and P as well as the possible content of Li in the turquoise mineral.

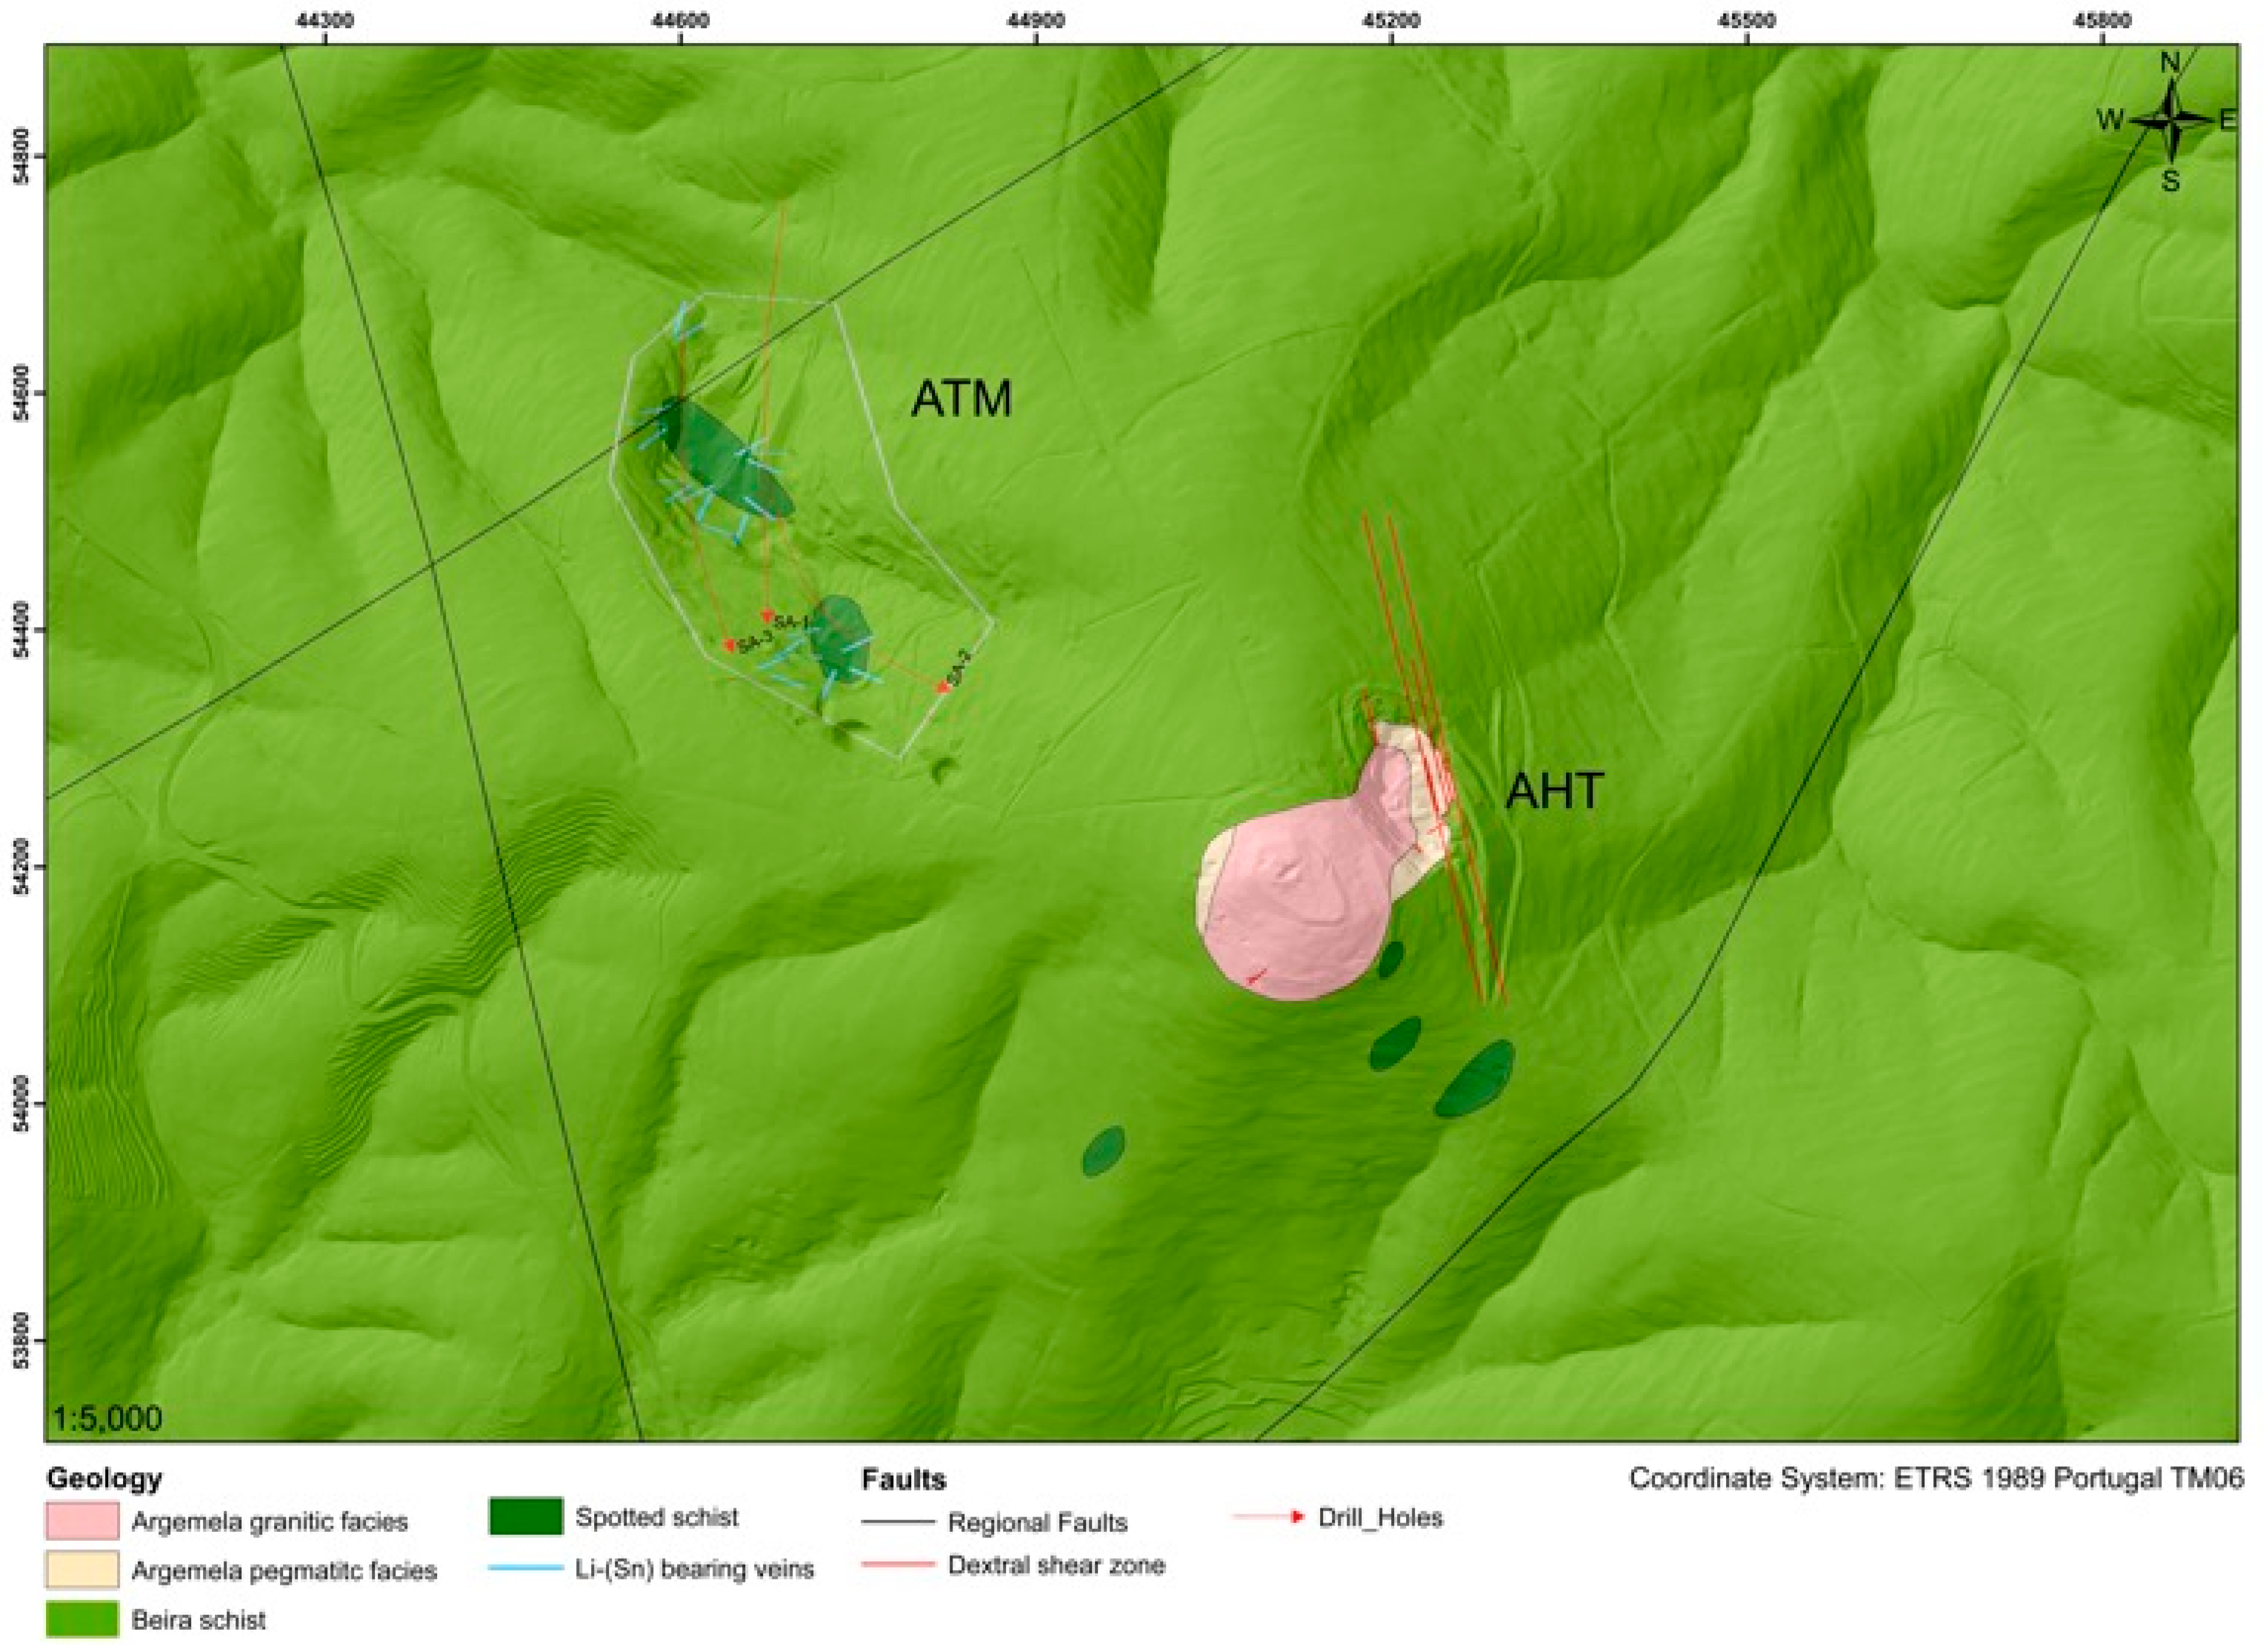
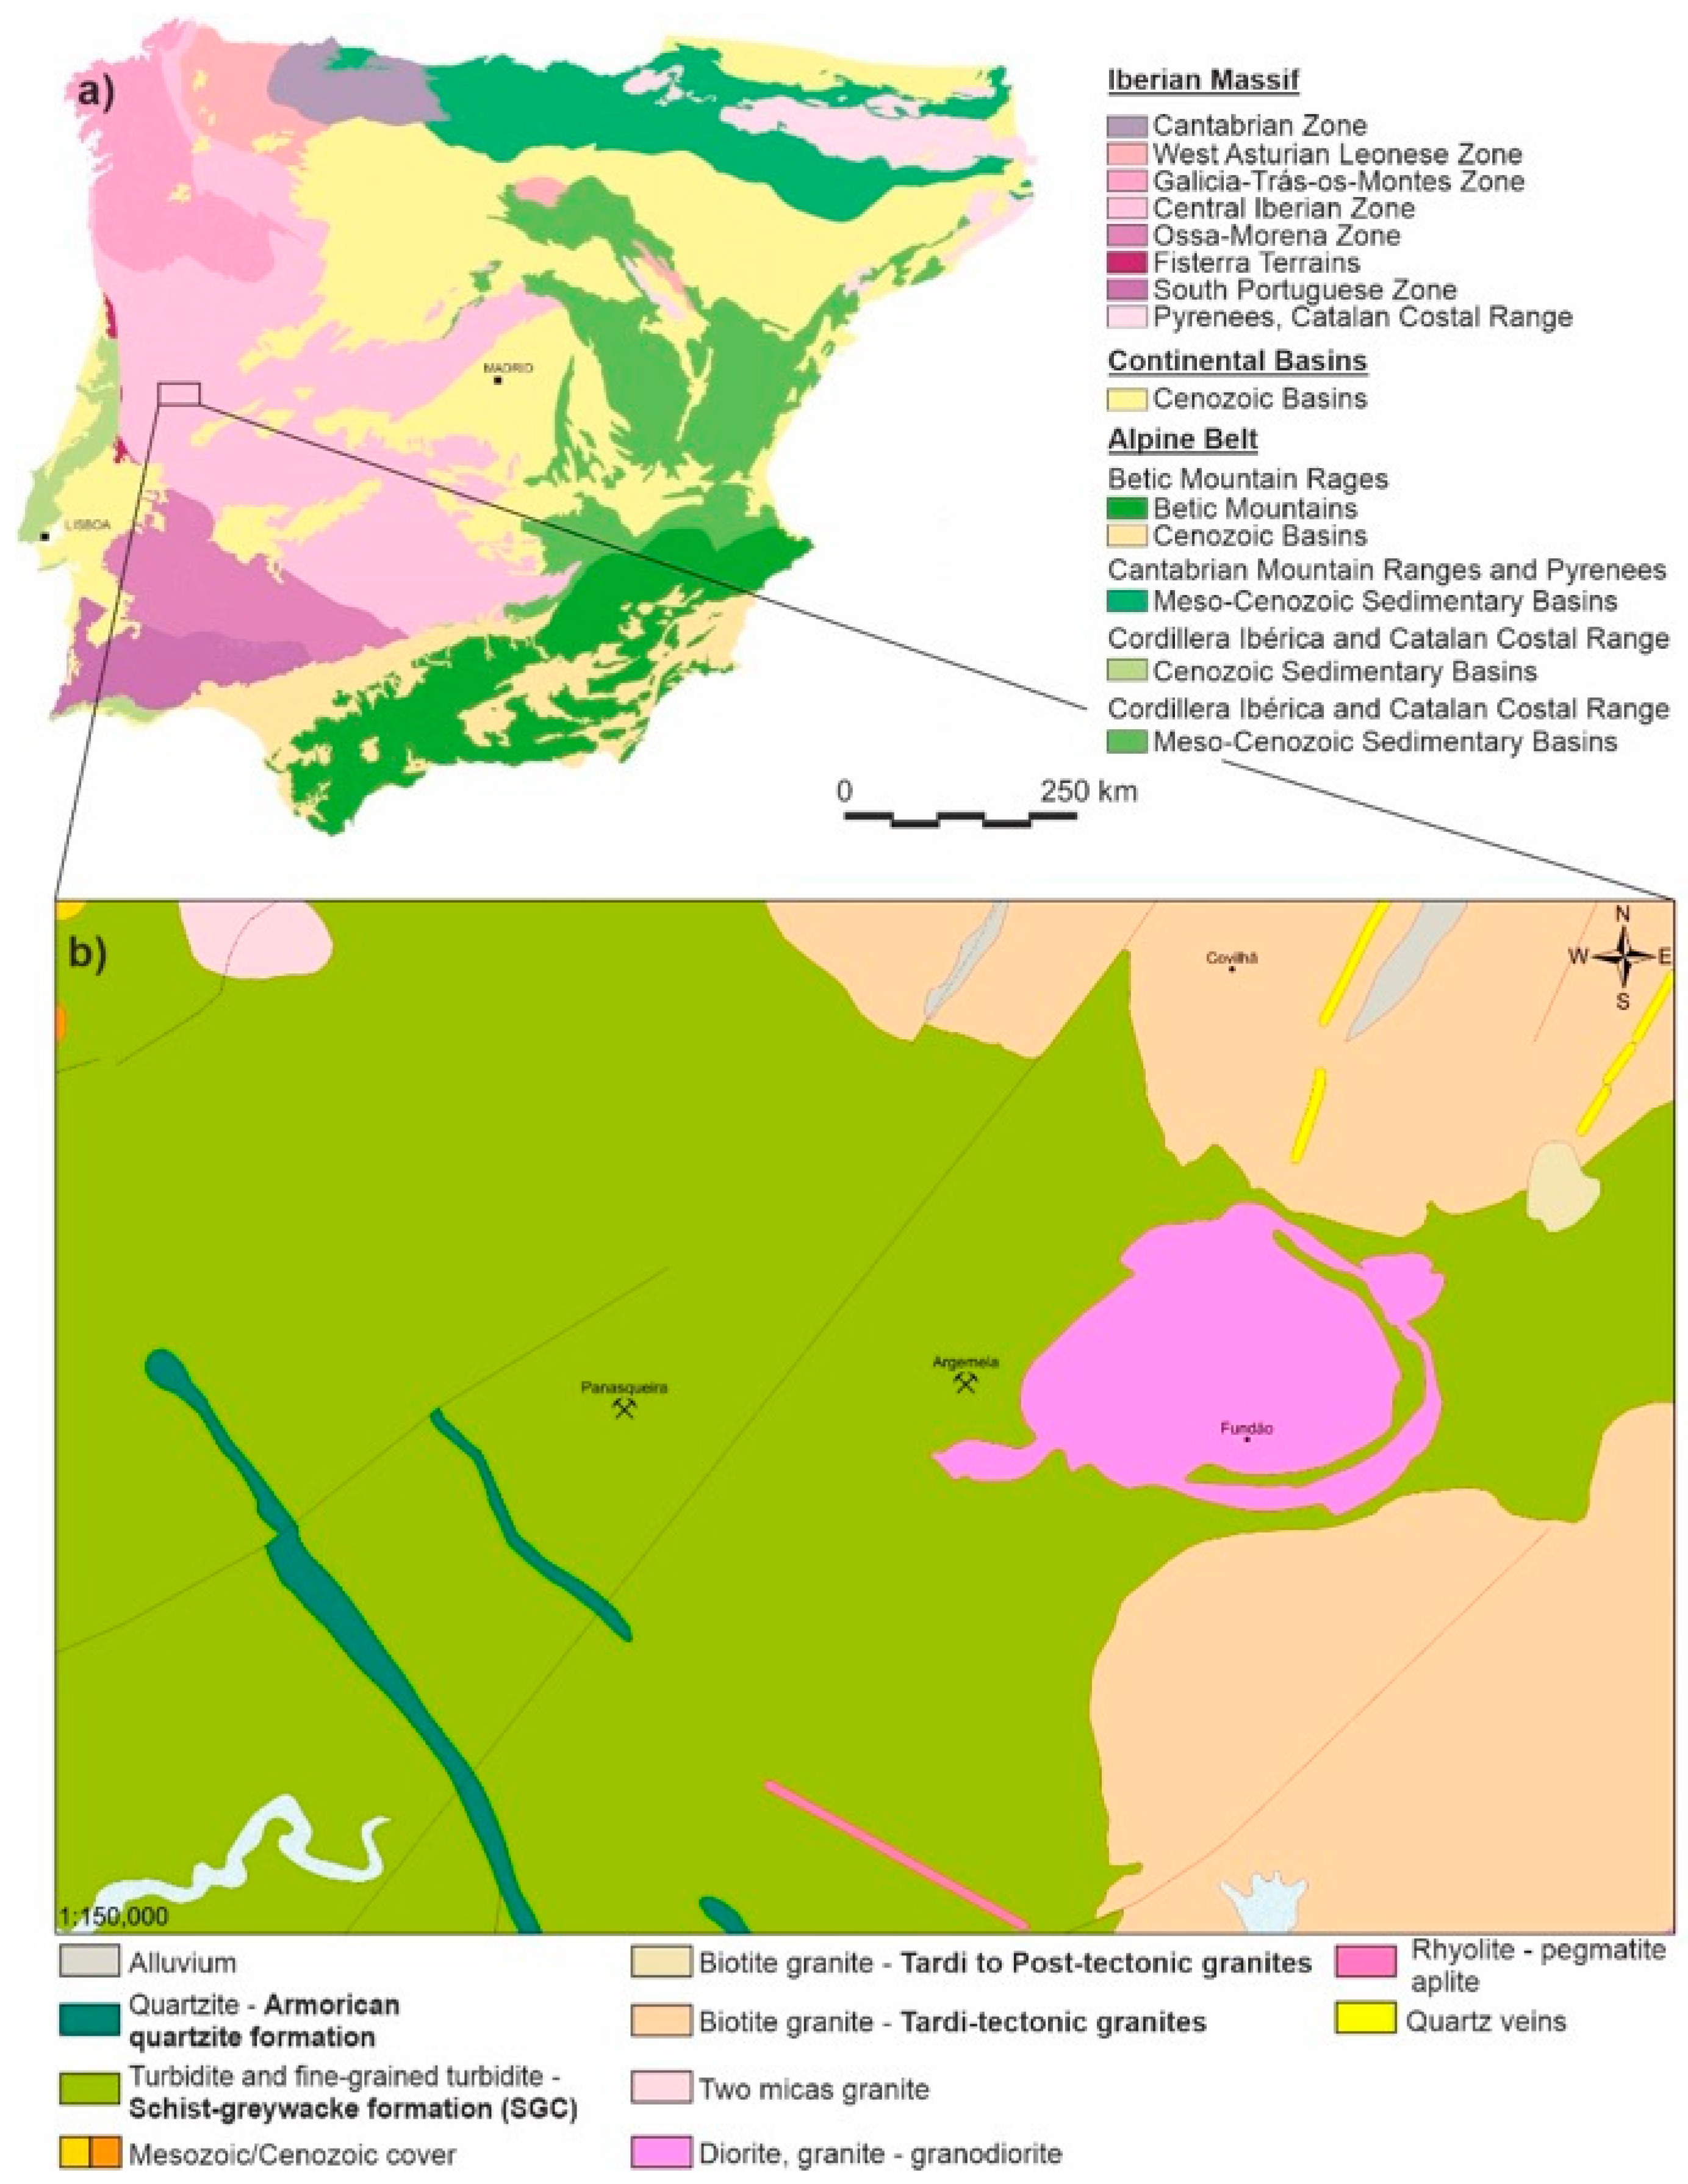
2. Geological Setting

The Iberian Massif is the most western part of the European Variscan Belt, and it is the result of the collision of two ancient continents, Gondwana and Laurasia. Five different geotectonic zones were proposed by Julivert et al. [25]. Later, Farias et al. [26] proposed the differentiation of the Central Iberian Zone into the Central Iberian Zone and Galiza Trás-os-Montes Zone. Taking into account differences in geology, petrology, and structural characteristics, six zones are recognized: the Cantabrian Zone, the West Asturian-Leonese Zone, the Galiza Trás-os-Montes Zone, the Central Iberian Zone, the Ossa-Morena Zone, and the South Portuguese Zone.
The Argemela area is localized in the southern part of the Central Iberian Zone (CIZ), and is characterized by metasediments of Neoproterozoic to Cambrian age (Schist-Greywacke Complex; SGC) and Ordovician Armorican quartzites that are intruded by several Variscan granitic plutons [27] (Figure 1). It also includes the formation of an ENE–WSW strike-slip fault system and NW–SE dextral sub-vertical shear zones [28]. The Argemela district (Figure 2) can be divided into two main areas: (1) Argemela Hill Top and (2) Argemela Tin Mine.
The Argemela Rare Metal Granite (RMG) is a leucocratic rock that presents a porphyritic texture; it is located in the Argemela Hill Top. It displays a small elliptical shape intrusion (300 m by 200 m), where the northeastern border is affected by a dextral shear zone [30]. This RMG presents two facies. The first and main facies shows a microgranitic texture, with snowball quartz and white micas. The second facies appears in the border areas and displays a pegmatitic texture. All facies contain lithium phosphate minerals (amblygonite–montebrasite series), cassiterite, and columbite–tantalite minerals [5].
The Argemela Tin Mine is located less than 500 m away from the Argemela Hill Top. The mine consists of a swarm of sub-vertical veins that cross-cut the schists of the SGC [31].
The sub-vertical veins are composed mainly of montebrasite and quartz. Cassiterite occurs occasionally. This cassiterite occurs mostly on the margin of the veins as inclusions in the quartz. Cassiterite is sometimes transformed in stannite (Sn sulfide), and montebrasite is associated with other phosphates such as planerite (part of the phosphate turquoise group), suggesting that the vein is invaded by late phosphates and sulfides [32].

3. Methodology

3.1. Samples

Samples of a quartz–montebrasite hydrothermal vein were collected from the Argemela Tin Mine. Two hand samples were cut using a diamond saw blade to obtain flat surfaces. One of these samples was used for XRF and LIBS analysis, and the other was prepared as a thin section and a polished section for petrography and LIBS mapping.

3.2. Petrography

A thin section of approximately 30 µm thickness and a polished section of about 30 µm thickness were made. The petrographic analysis was carried out using a Nikon ECLIPSE E400 POL (ECLIPSE E400 POL, Nikon Corporation, Minato-Ku, TKY, Japan) polarizing microscope with transmitted and reflected light, coupled with a Carl Zeiss AxioCam MRc digital camera (AxioCam MRc, Carl Zeiss AG, Oberkochen, BW, Germany). LIBS analysis was also performed directly on the petrographic plate.

3.3. XRF Instrumentation

For XRF analysis, a Bruker S1 Titan Portable X-Ray Fluorescence (S1 Titan 600—120.0007, Bruker AXS Handheld, Inc., Kennewick, WA, USA) with a rhodium anode and an excitation source of 4 W was used. This instrument allows voltages from 15 to 50 kV and currents from 5 to 100 µA and has a spot size of 5 mm. The spot of interest was screened with three energy beams that corresponded to three different phases—15 (phase 3), 30 (phase 1), and 50 keV (phase 2)—to enhance peak intensities and improve sensitivity. The sample characteristic radiation was detected by a silicon drift detector (SDD). Measurements of a 90 s duration were made in eleven different spots (Figure 3) using the inbuilt GeoMining mode (P/N: 730.0203, Bruker AXS Handheld, Inc, Kennewick, WA, USA) from the attached analytical evaluation software. The manufacturer limits of detection and the upper range for each element are shown in Table 1. Each spot was measured once. At the eleventh spot, five measurements were made to estimate the precision of the analysis. To assess the portable XRF performance, several measurements of a quality control (QC) sample were made, using the GeoMining mode, during the sample analysis run. The QC was a geo/soil sample provided by the manufacturer of the XRF to assess its performance.

3.4. LIBS Instrumentation

LIBS analysis was performed at the same spots as XRF, although with a smaller spot size (~300 µm), as shown in Figure 3. The system used was assembled in-house. It used a Q-Switched Nd:YAG (neodymium-doped yttrium aluminum garnet) laser operating at the fundamental wavelength (1064 nm) with an 8 ns pulse duration and a maximum adjustable energy of 200 mJ. A set of lenses and mirrors were arranged for focusing the laser pulses on the sample surface. Two crossed visible diode laser pointers were aligned with the focal point of the main laser, allowing positioning of the region of interest of the sample at the ideal height and X–Y coordinates.
The sample holder was based on three high-precision translation stages, where X and Y were controlled by an automated motion controller, and the adjustment in the Z direction was performed manually using a precision knob.
Eight optical fibers, coupled with collimators aligned with the system focal point, were used for collecting and guiding the plasma light into an eight-channel CCD spectrometer (Avantes), which enabled spectral detection in the wavelength range of ~180 to 920 nm, with a resolution between 0.06 nm and 0.18 nm.
The system was fully automated: the laser and the motion controller received the laser shot parameters and movement instructions through Python scripts. To collect the data, Avasoft software was used. A representative scheme of the LIBS setup is shown in Figure 4.
In this study, three distinct approaches were investigated with the LIBS tool: areas of interest analysis, hand sample mapping, and thin section mapping. As the main goal was to assess whether the turquoise mineral had a Li content, it was critical to excite the sample with a high enough energy pulse to allow examination of exclusive spectral lines of Li such as the 812.62 nm line [34].
First, a LIBS qualitative analysis was performed for 10 of the 11 areas represented in Figure 3. For this purpose, a low-energy cleaning shot with 6.9 mJ was first performed, followed by an analysis consisting of five consecutive shots with an energy of 122 mJ. This protocol was applied at three different spots at each area of interest.
For the hand sample mapping, which was performed in a rectangular area (Figure 3), a Python routine, developed for this purpose, was used to drive the motion controllers through a pre-defined sampling matrix, in synchrony with the laser shots. This area was composed of montebrasite, turquoise, and quartz, as shown in Figure 3. A grid of 26 columns and 11 lines was rendered, with 1 mm between spots, to obtain a good visualization of the distribution of Li, Cu, Al, and P in the three minerals under study.
Finally, a thin section with a thickness of about 30 μm was mapped using LIBS. As the section was extremely thin and fragile, the laser energy had to be drastically decreased to avoid ablation of the substrate and cracking. A shot energy of 21 mJ was selected to ensure minimal damage while still allowing for the observation of the lines of interest. In this instance, the cleaning shot was not applied. A grid of 40 columns and 18 lines, with a step of 1 mm, was rendered. To control the depth of penetration of the laser into the thin section, a 2D profilometry was made along six of the analysis points of the 18th map column, using a BRUKER Dektak XT Mechanical Profilometer. The system was set to a scan resolution of 0.14916 μm, a scan length of 17,899.2 μm, and a stylus force of 3 mg.

4. Results

4.1. Petrography and Mineralogy

The quartz–montebrasite hydrothermal vein sample (Figure 3) presented irregular gray to white masses of montebrasite in the middle (spots 3 and 5). The montebrasite masses, near fractures, were altered and replaced by turquoise. Turquoise is presented as a mass with a bluish color. The quartz occurred as a transparent to gray irregular mass in the top right corner (spot 4) and in the bottom part of the sample (bellow spot 1). In terms of physical properties, montebrasite is characterized by a perfect cleavage on plane {100} and a good on plane {110}, making it possible to differentiate from turquoise, which has a perfect cleavage on plane {001} and a good cleavage on plane {010}. The density between these two minerals is different, with montebrasite having a density between 2.98 to 3.04 and turquoise having a density of 2.86 or less if massive.
The quartz–montebrasite sample (Figure 5) contained montebrasite and turquoise. The montebrasite had a tabular shape, exhibiting characteristic polysynthetic twinning. In cross-polarized light (Figure 5a), the montebrasite presented a pink to brownish color, and in plane polarized light (Figure 5b), it was transparent. The turquoise was altered from montebrasite and had a fine granular shape, with a blue to green color in cross-polarized light (Figure 5a) and showing transparency in plane polarized light (Figure 5b).

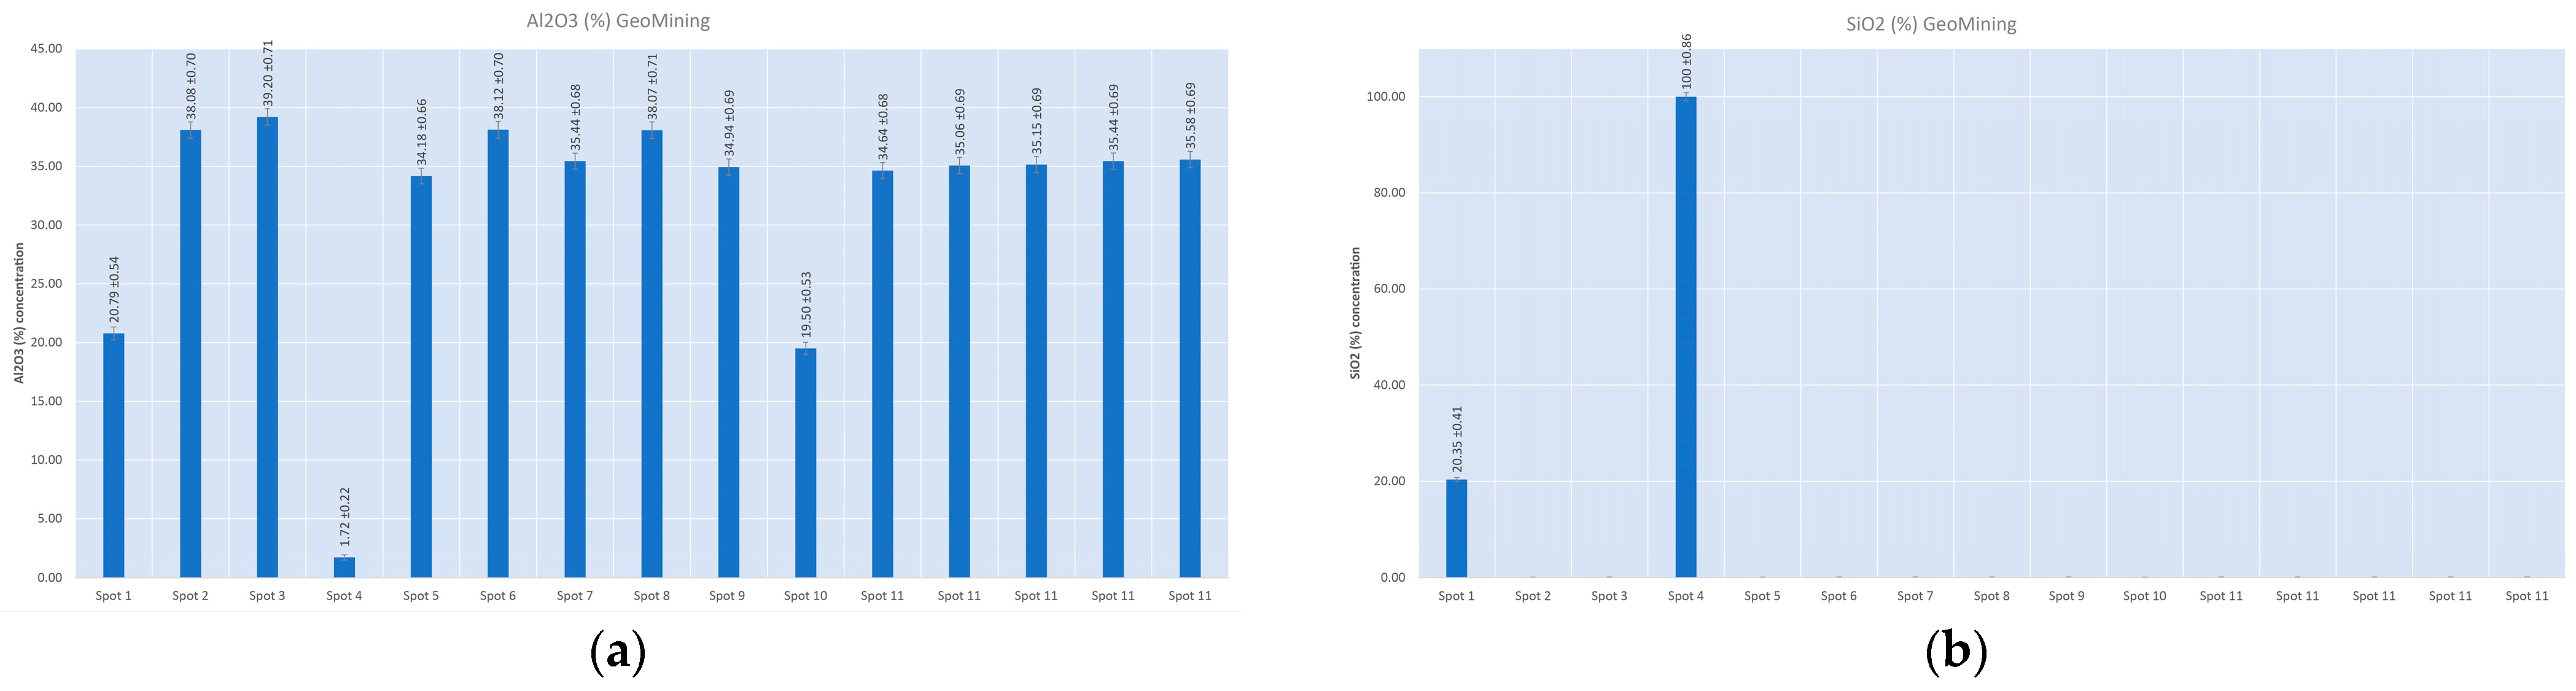
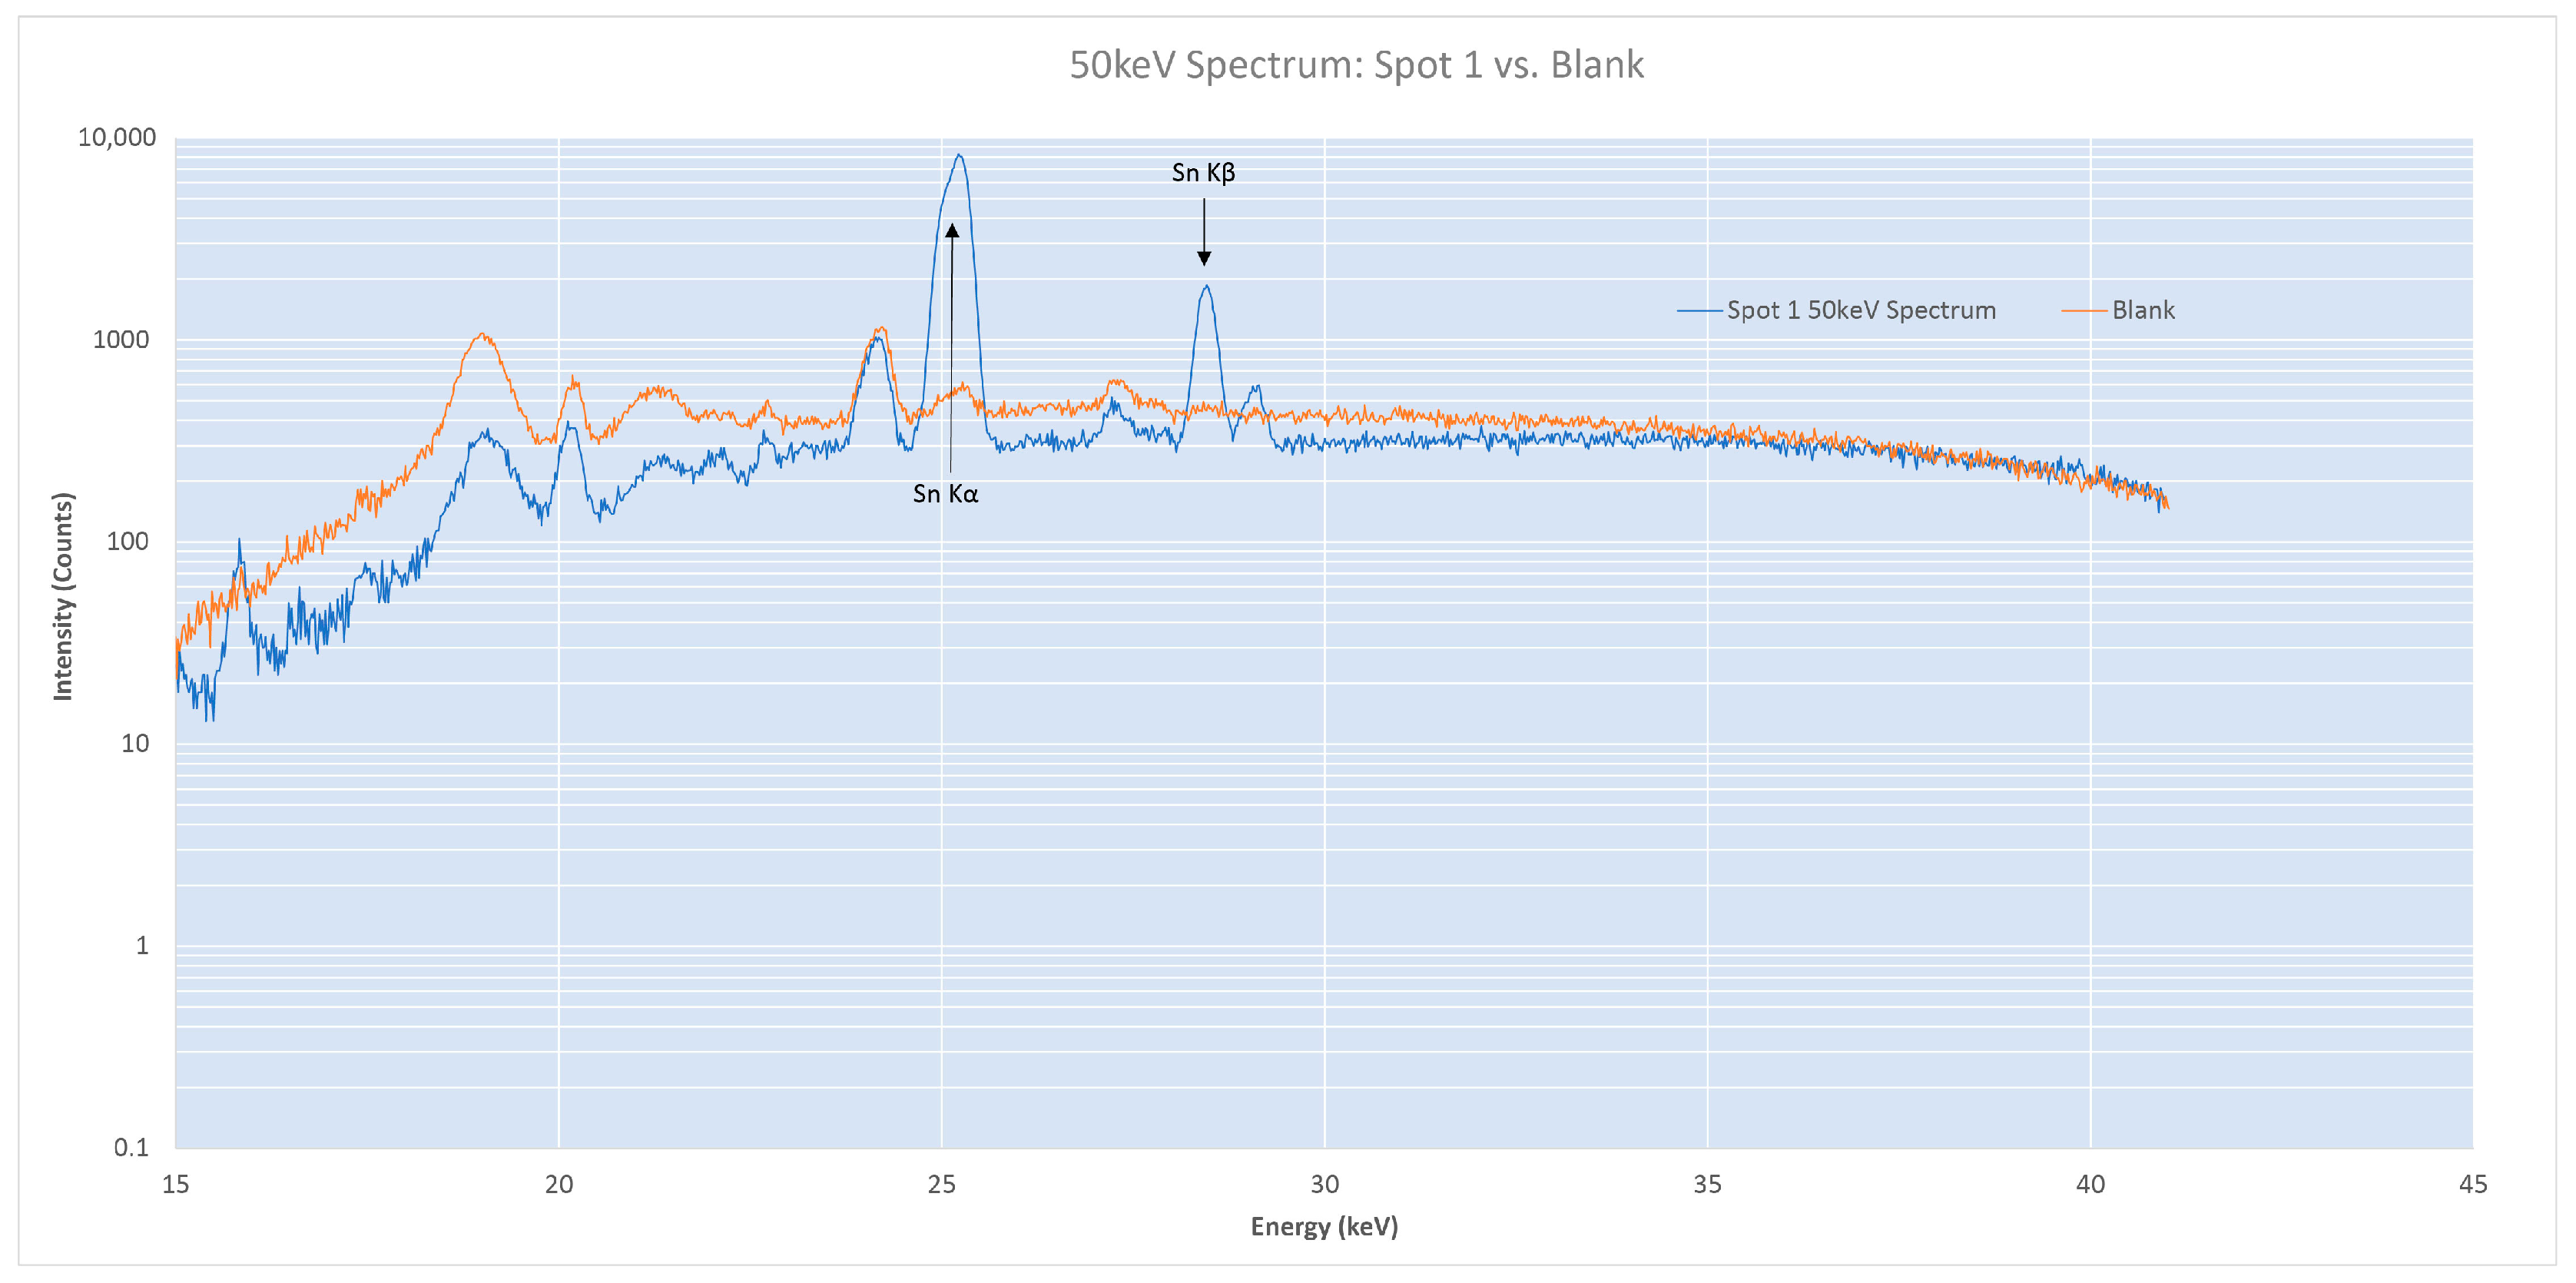
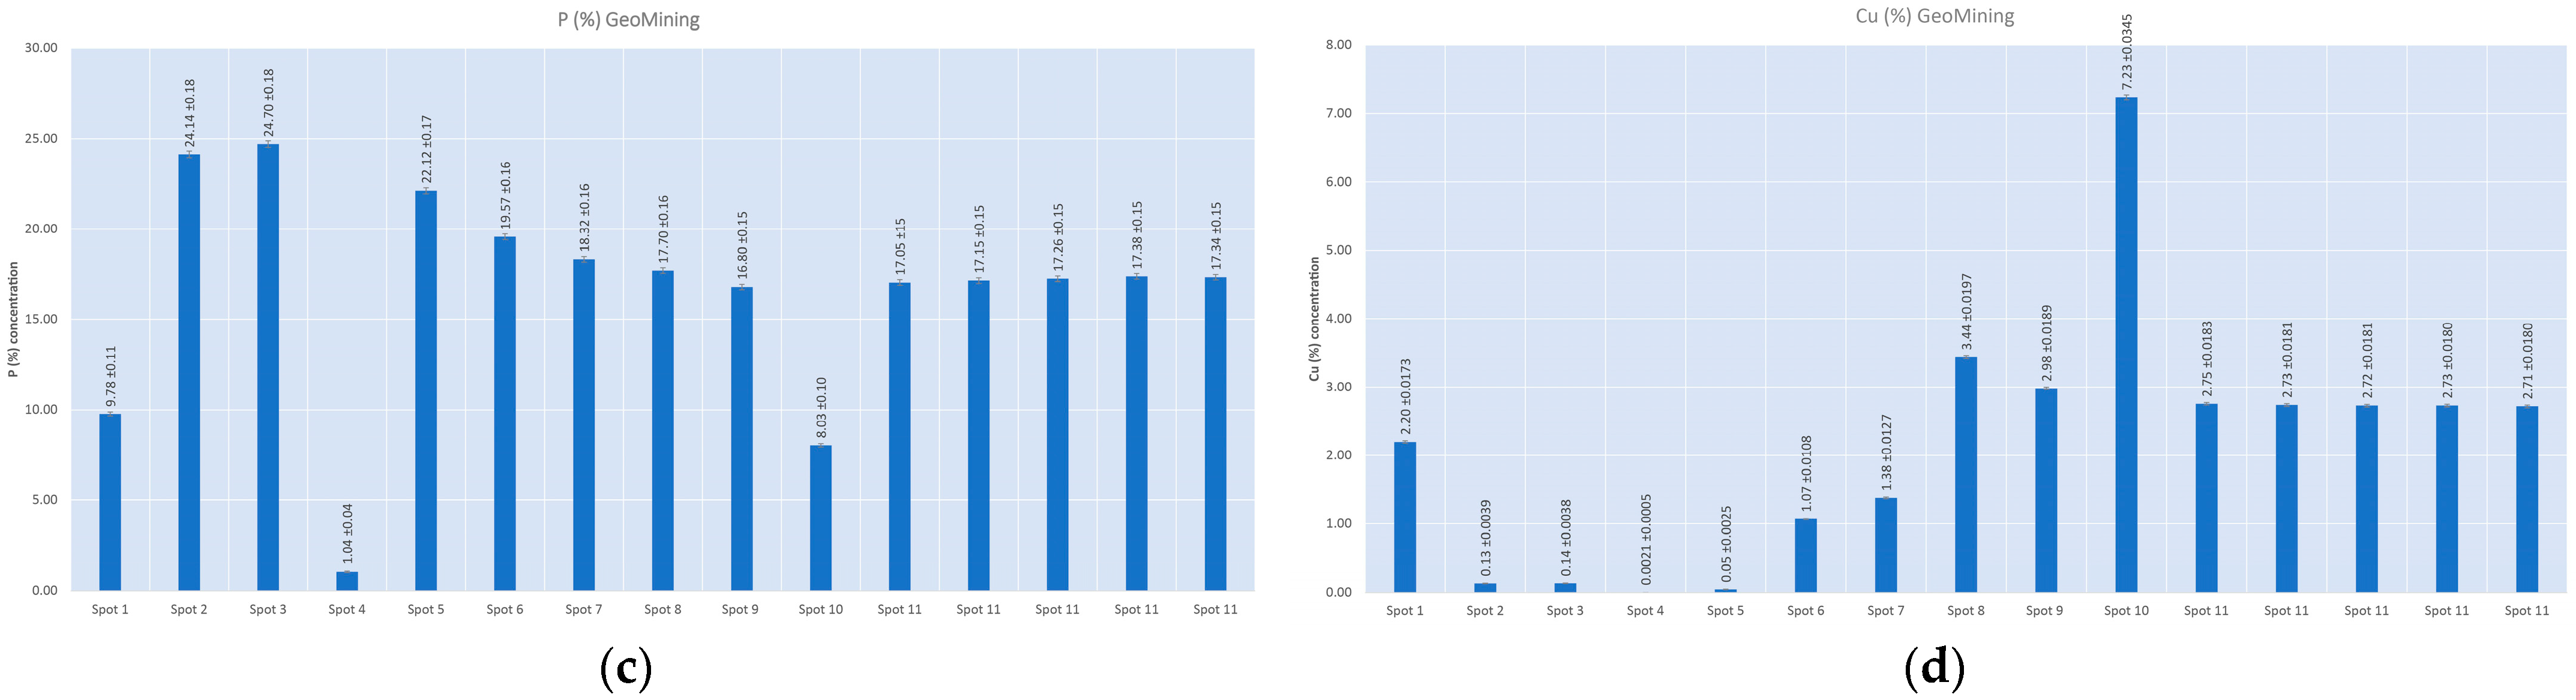
4.2. X-ray Fluorescence Quantitative Analysis

To assess the performance of the XRF instrument, a geo/soil QC sample was measured. The results presented in Table 2 show that the measurements were within the expected target values, particularly for the elements of interest, Al, Si, and Cu. To study the precision of the equipment for the elements of interest, five replicates were made in spot 11. For Al, the precision over the five measurements was 1%, and for P and Cu, it was 0.8% and 0.5%, respectively. For Si, it was not possible to calculate the precision of the instrument, because the spot did not contain quartz, only turquoise and montebrasite. Nonetheless, because this element was present in high concentrations, the precision was expected to maintain the same order of magnitude.
Taking into account the mineralogy of the sample (quartz, montebrasite, and turquoise), 11 spots were selected (Figure 3), though the XRF spot size of 5 mm made it difficult to analyze a single mineral at a time. The major elements of each mineral are presented in Table 3.
Analyzing Figure 3 and Figure 6, it is possible to clearly identify spot 4 as quartz, with a high value of SiO2 (100%). On the other hand, spot 1 had a lower content of SiO2, but showed the presence of P and Cu, indicating the existence of quartz, montebrasite, and turquoise. However, the presence of a brownish inclusion on the quartz was worth further investigation. By analyzing the 50 keV spectrum of spot 1 (Figure 7), it was also possible to observe the presence of Sn (quantified as 5.30%), evidencing the presence of cassiterite, as expected in an ancient tin mine. For the remaining spots, taking in account that the content of SiO2 is below the limit of detection, it is possible to conclude that quartz is not present. Spots 2, 3, and 5 had a low content of Cu, suggesting only the presence of montebrasite. Spot 10 had a high concentration of Cu (7.23%), indicating only the presence of turquoise. The other spots (1, 6, 7, 8, 9 and 11) had what can be considered as an intermediate concentration of Cu (0.43% to 3.44%), suggesting the presence of a mixture of montebrasite and turquoise.

4.3. LIBS Qualitative Analysis

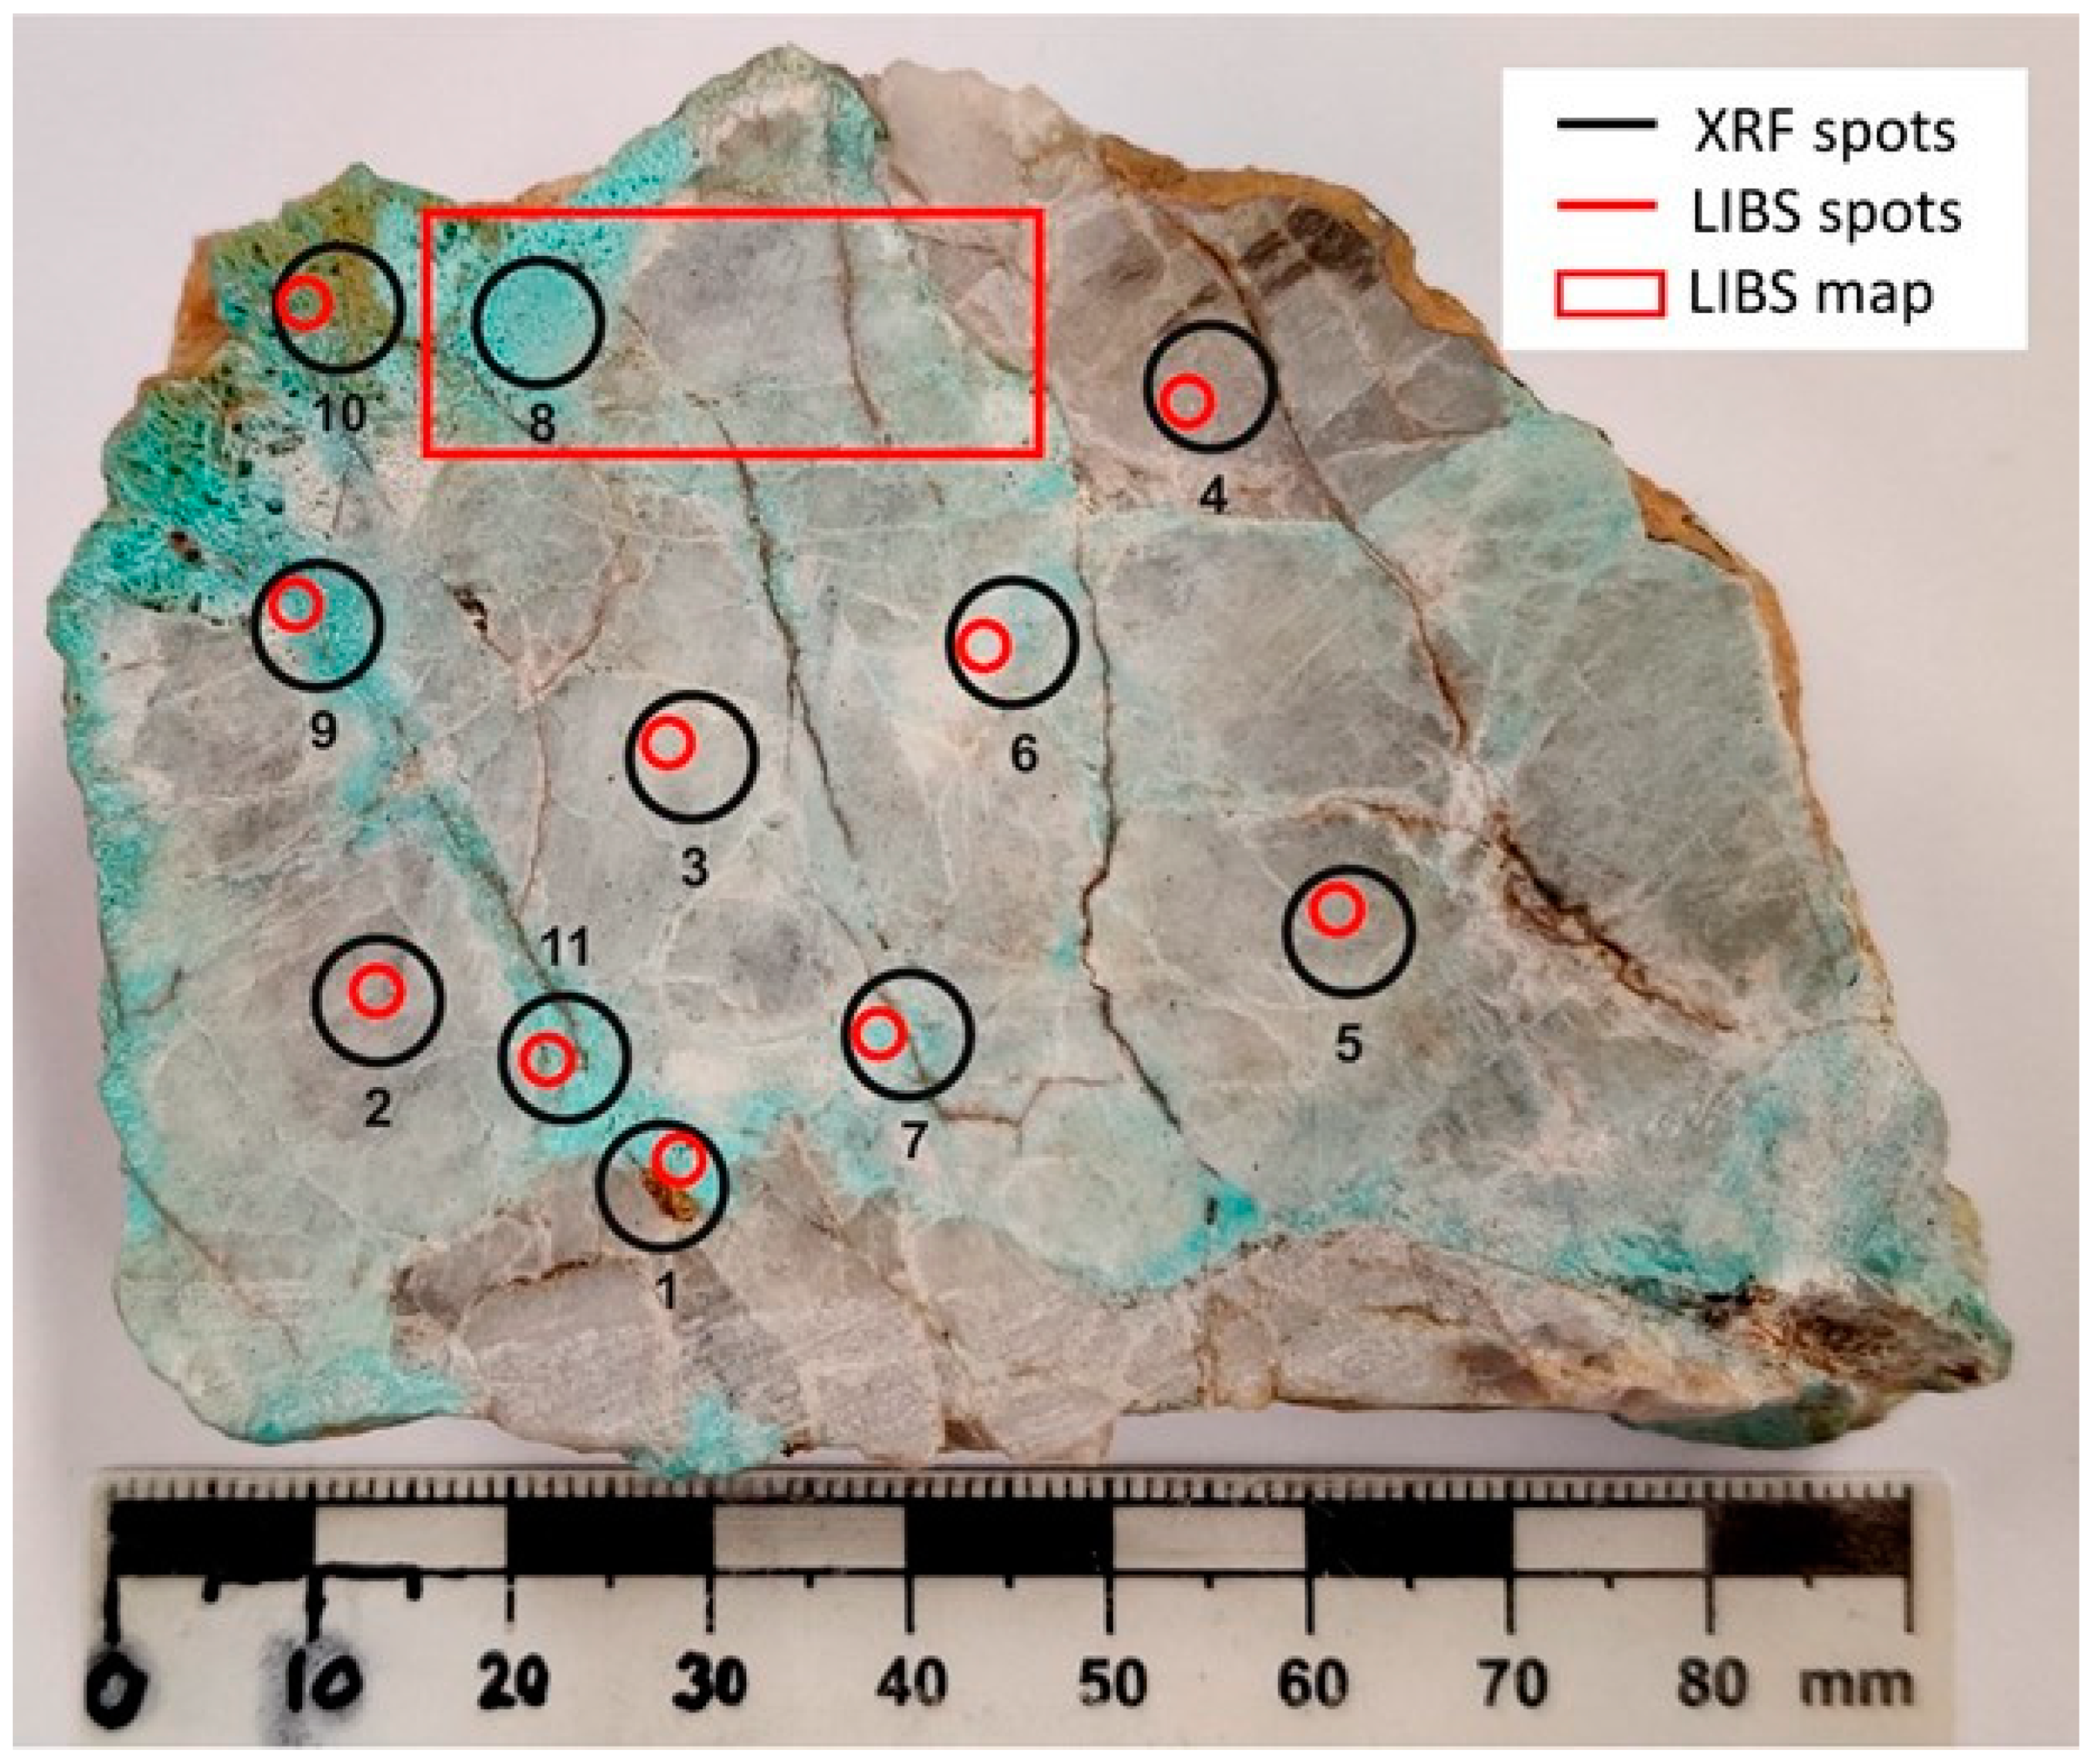
4.3.1. Hand Sample: Individual Spots

The average counts of the 15 shots performed in each area of interest and the corresponding error bars are presented in Figure 8. Values were normalized to the maximum average value. Analyzing Figure 3 and Figure 7, it can be concluded that spots 2, 3, 5, and 6 correspond to montebrasite, displaying Li values close to the maximum; this was expected due to montebrasite having a high percentage of Li. In contrast, bluish areas 1, 9, 10, and 11, with Li values close to zero, corresponded to turquoise. In comparison, spot 4 also had a low Li content, as expected for quartz, deeming the Li content in turquoise to be negligible.
Spot 7 showed an intermediate value, which can be justified as a mixed composition of montebrasite and turquoise.
When comparing these results with XRF, spots 6 and 9, evaluated as having montebrasite and turquoise simultaneously by XRF, were classified as montebrasite and turquoise, respectively, by LIBS analysis. This might be a consequence of the LIBS spot size being smaller than the XRF and the light pulse penetration depth being only in the order of dozens of μm, thus making it more likely that only one mineral was being analyzed in each area.

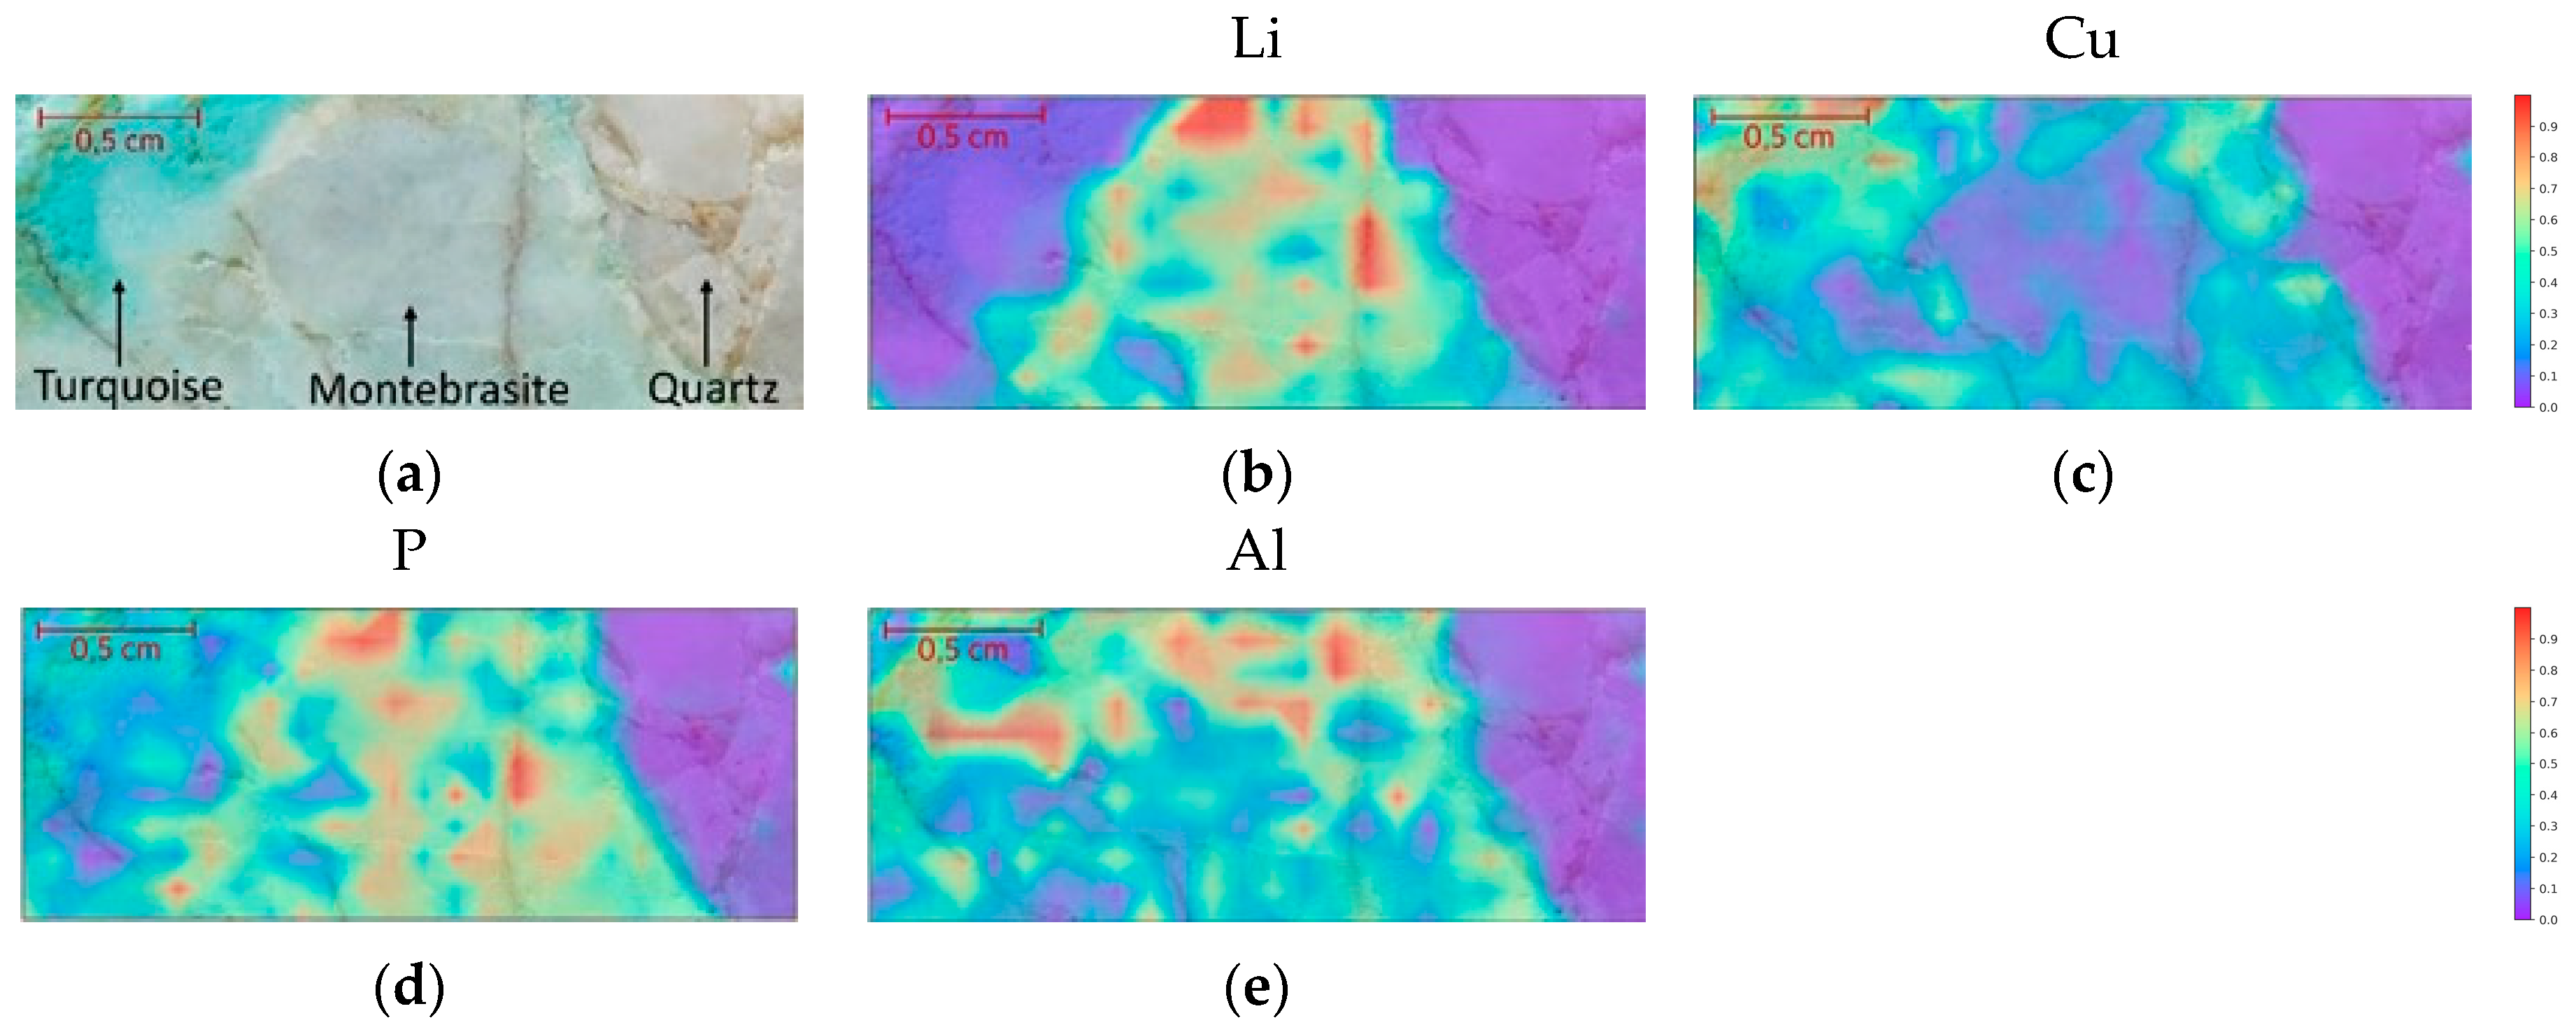
4.3.2. Hand Sample: Mapping

LIBS mapping analysis of a particular area of the hand sample containing the three different minerals (Figure 9a) was performed. Observing the Li map in Figure 9b, the turquoise and quartz areas showed extremely low counts, in contrast to the montebrasite area, with counts closer to the saturation value (maximum intensity that can be measured by the spectrometer), which is in accordance with previous study of the areas of interest.
The map of Cu (Figure 9c) shows higher counts in the turquoise area, as expected. However, there are also some intermediate counts, which can be an indicator that slight alterations of montebrasite toward turquoise have already occurred.
Looking at the P map (Figure 9d), it is possible to see that this element is present in all minerals, with the exception of quartz. The counts relative to montebrasite are higher than turquoise, which is due to montebrasite having a higher theoretical concentration of this chemical element (Table 3). Aluminum (Figure 9e) is present in both minerals.
Globally, the mapping results were in accordance with the mineral composition, clearly distinguishing the three different minerals as well as the transition zones, which are barely observable using other techniques.

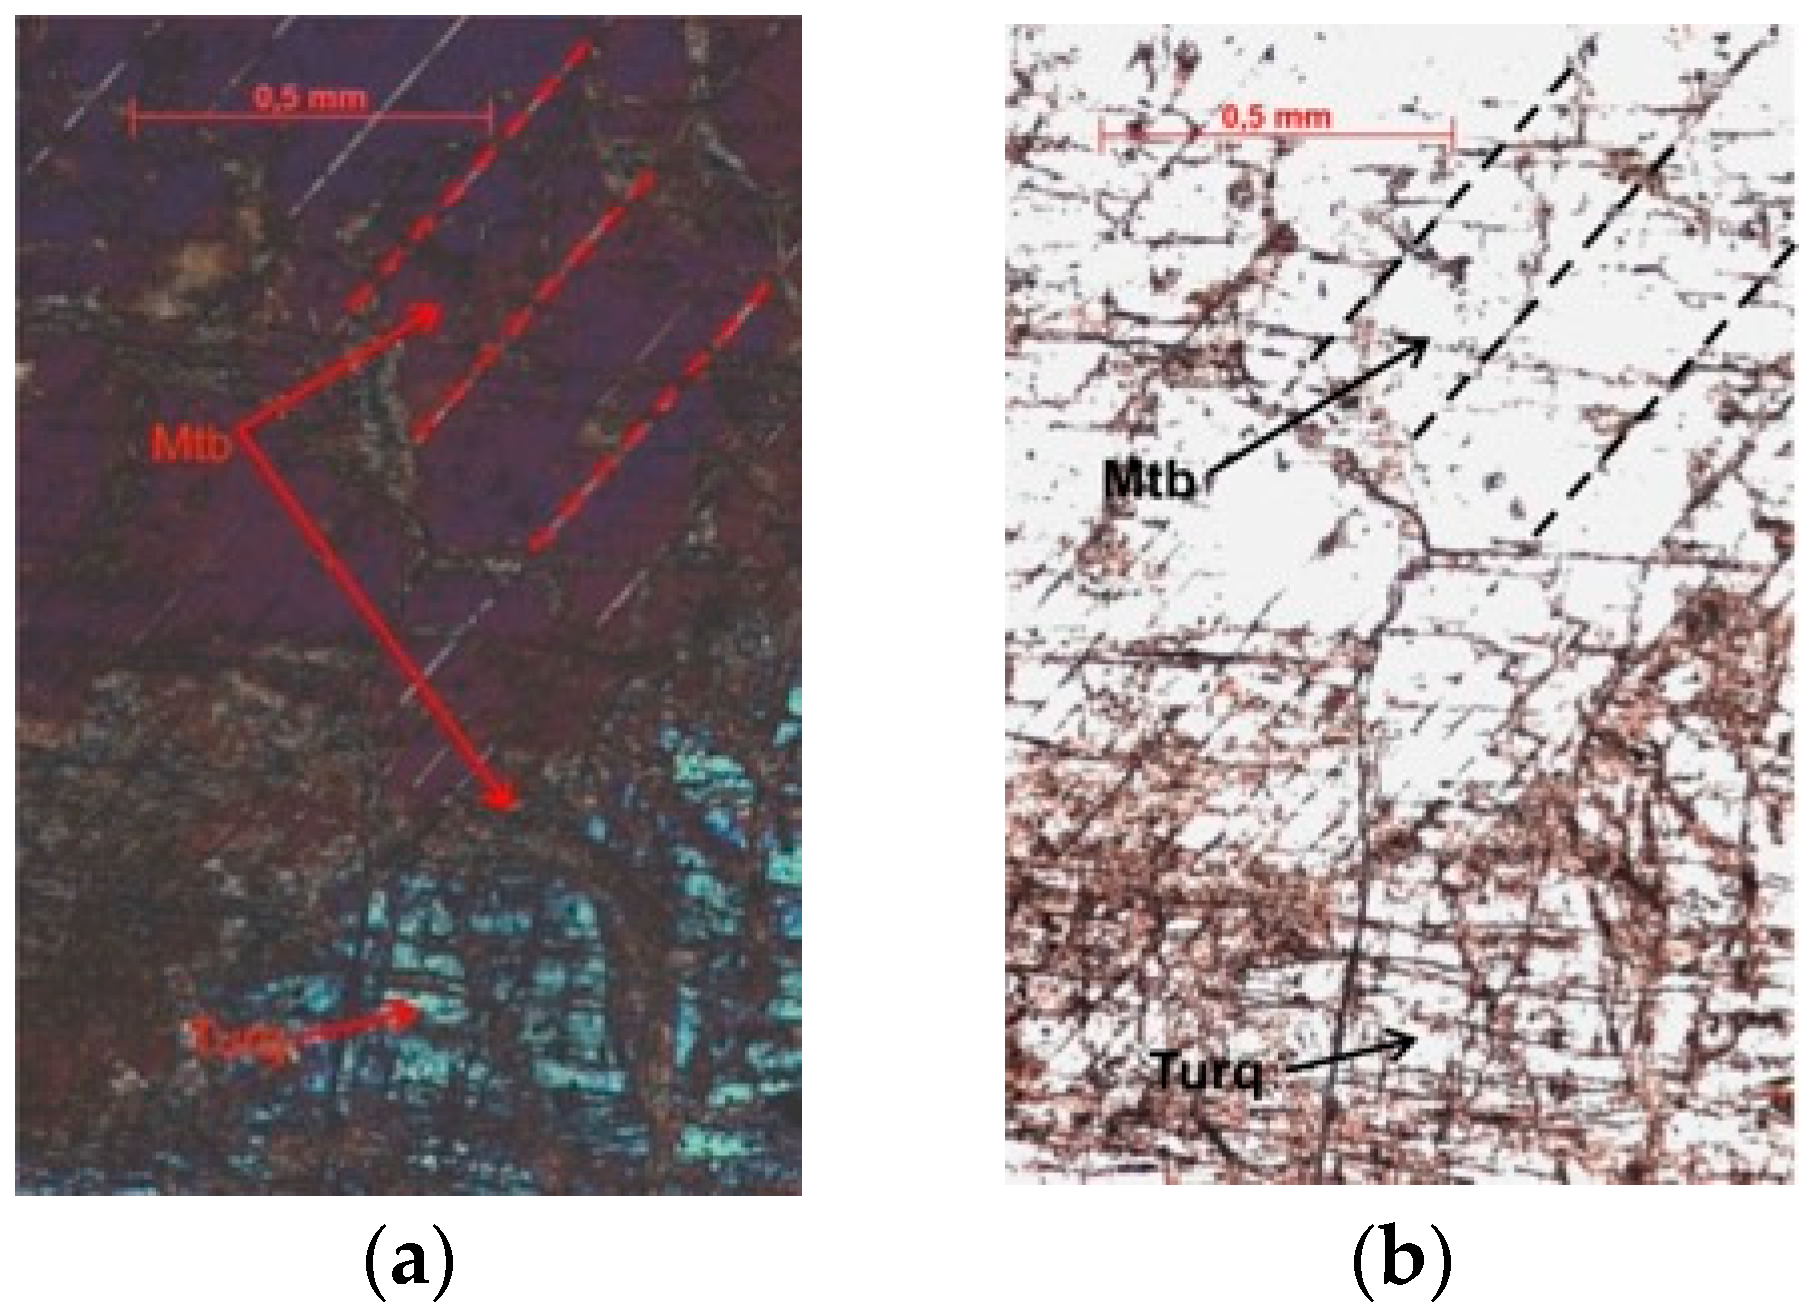
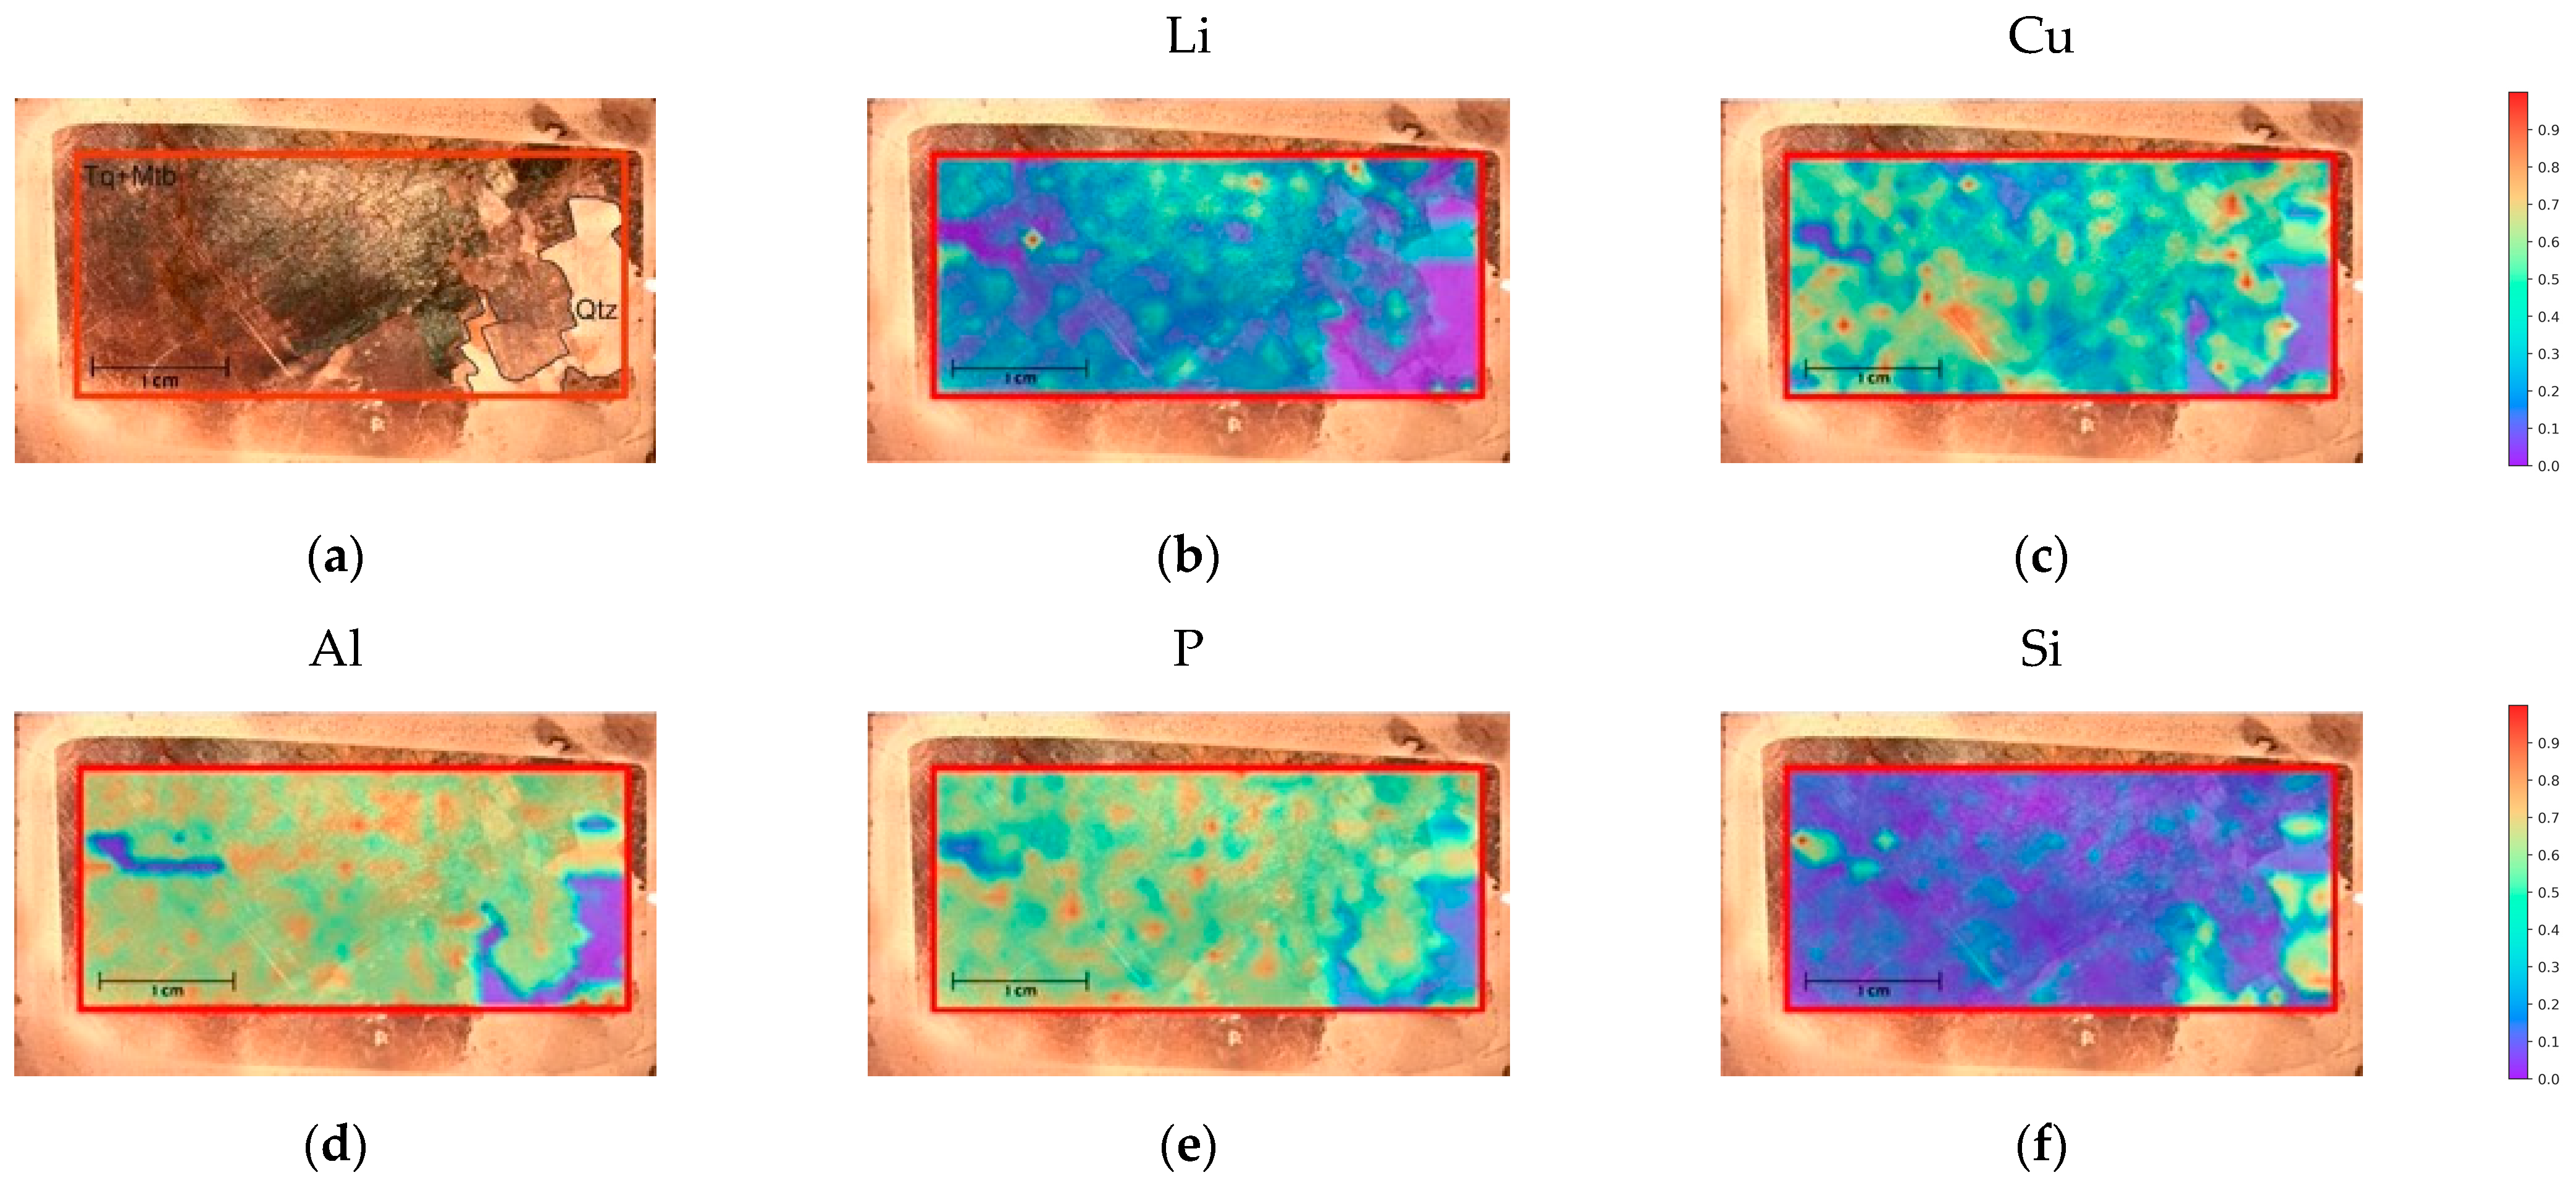
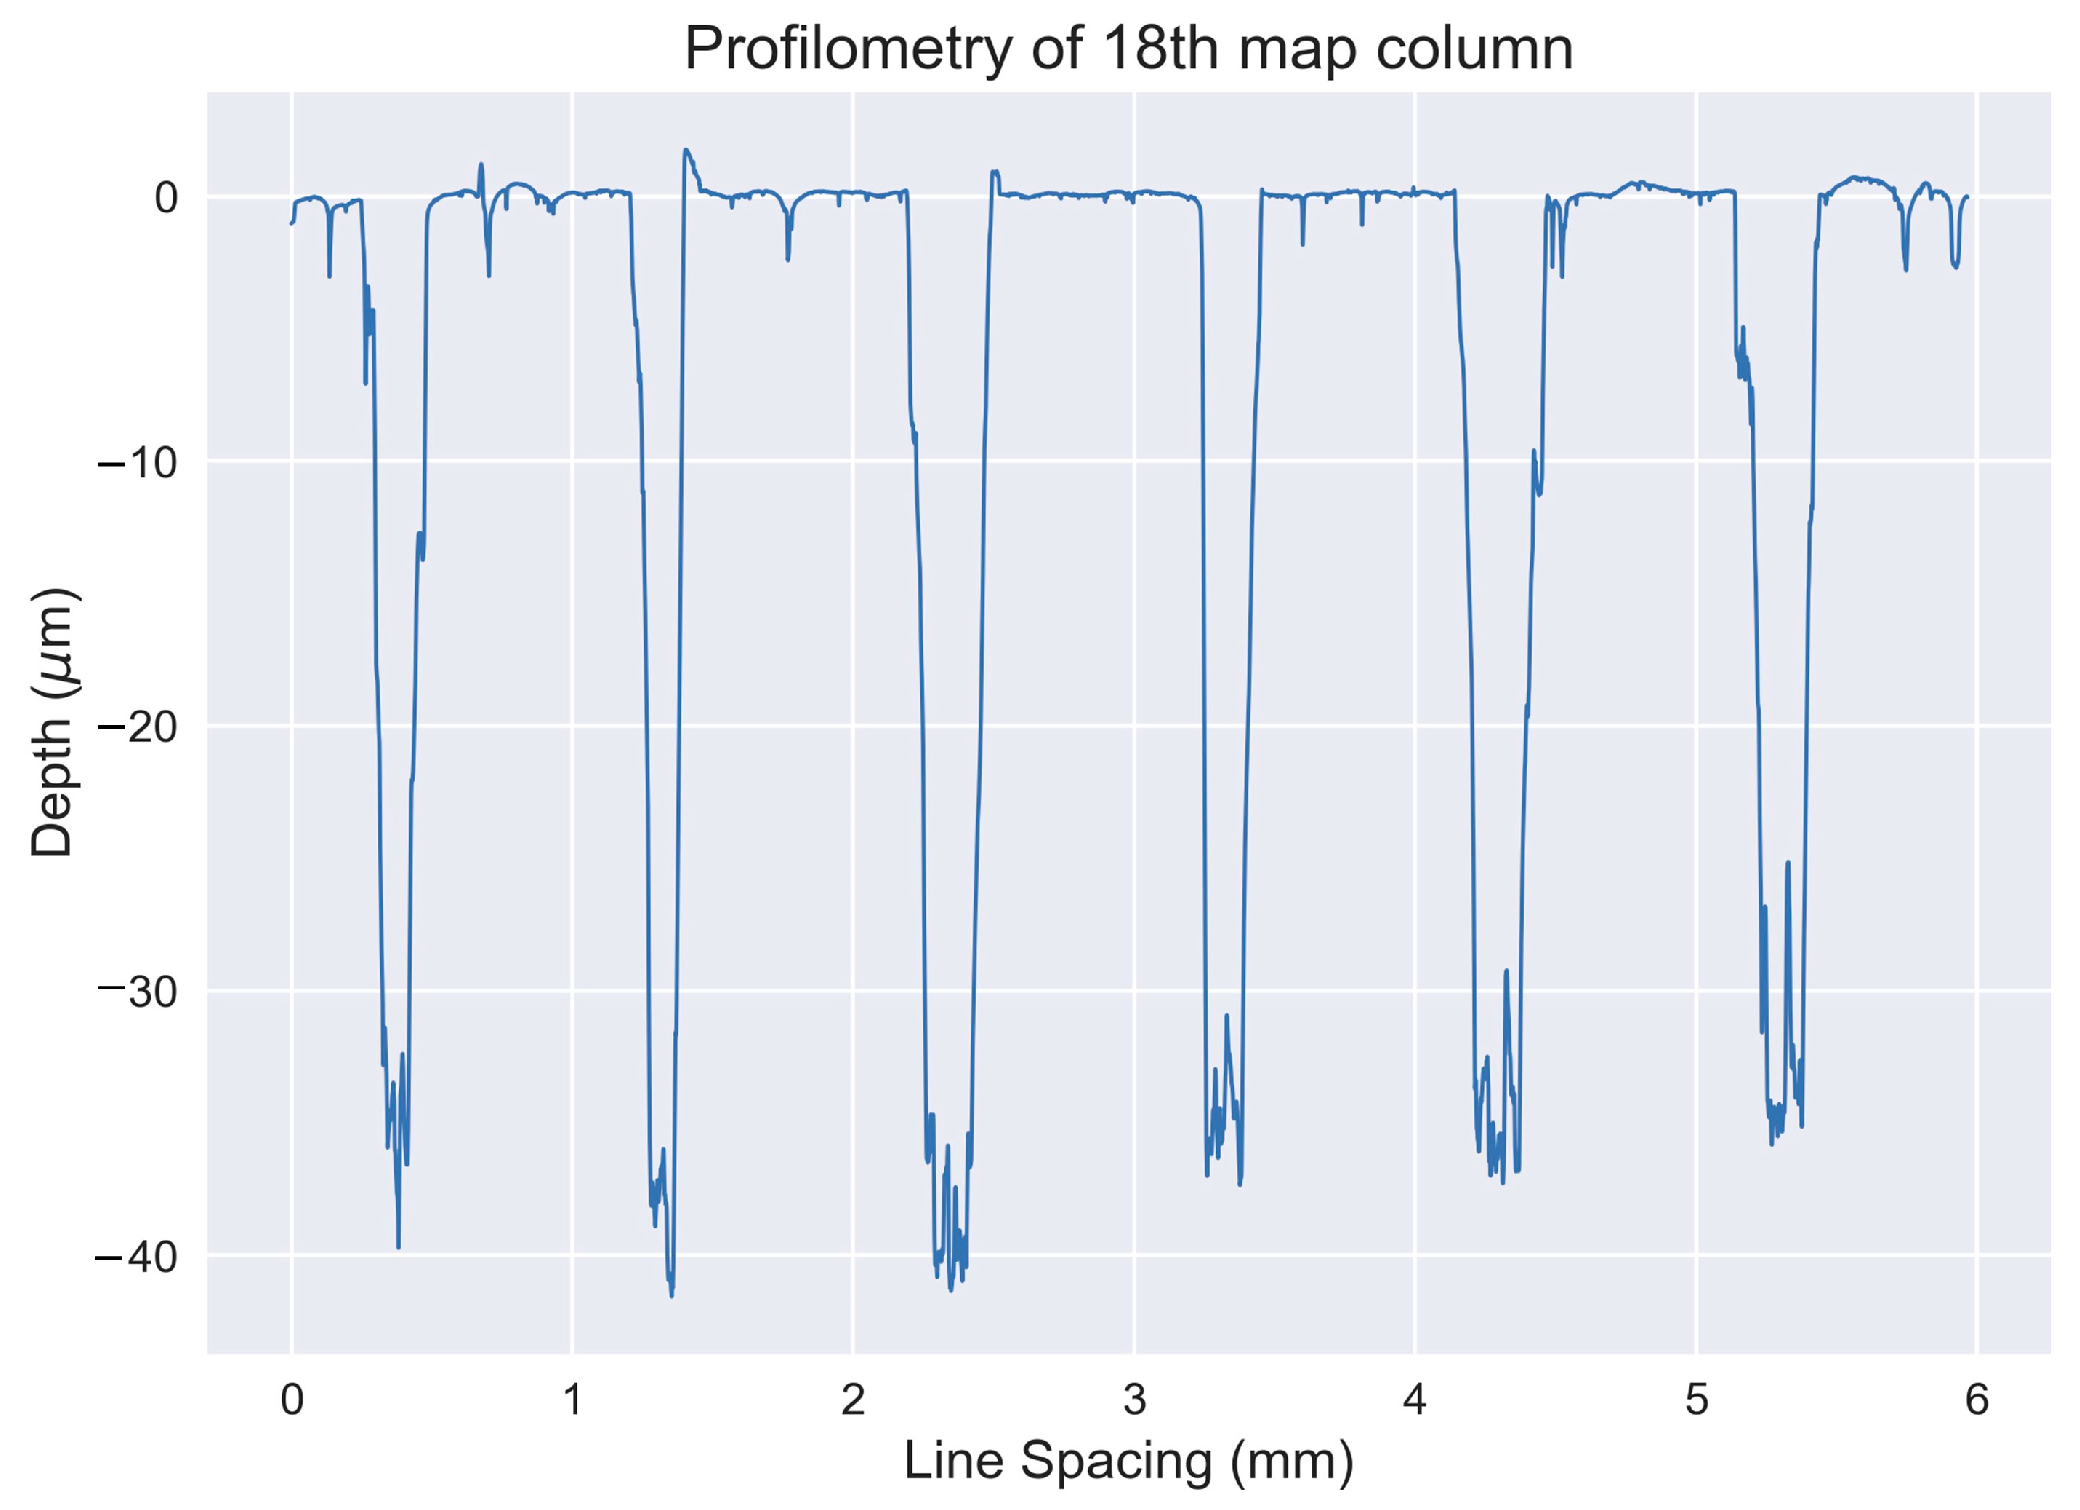
4.3.3. Thin Section Mapping

The capability of LIBS to perform mapping in thin sections is of high importance for mineralogical studies as it provides a highly detailed analysis of the chemical distribution, which can then be compared with the petrographic results.
In Figure 10, the thin section can be seen in cross-polarized light. As the montebrasite is in a higher stage of alteration, the montebrasite and turquoise are very well mixed along the section. The only well-defined zone corresponds to quartz, which is in the bottom right corner.
To our knowledge, this is the first time a thin section has been mapped using LIBS.
From inspection of the results of the elemental mapping (Figure 10), it can be seen that Li, Cu, P, and Al are present all over the area related to montebrasite mixed with turquoise; these have natural variations in intensity, which is in accordance with their mineralogical composition. Regarding the quartz zone, these elements had low counts, and Si appeared with high counts. The results are concordant with what was expected, representing another benefit of using LIBS in this novel approach.
To ensure that the LIBS results were not affected by contributions from the section substrate (glass consisting predominantly of Si), the profilometry results were analyzed. Figure 11 shows the variable crater depths with values between 35 and 41 μm.

5. Interpretation and Discussion

In the Argemela Tin Mine, montebrasite was formed during the transition of the magmatic stage to the hydrothermal stage. Michaud [30] proposed the existence of a late stage containing covellite (sulfide copper), explaining that Cu was added to the system, forming Cu minerals. Pirard et al. [10] published a work detailing the alteration sequence of aluminum phosphates in the Montebras deposit, showing that a later hydrothermal stage added Cu to the system, forming turquoise in the process. The use of different techniques can provide an insight into the evaluation of this transformation of montebrasite into turquoise.

5.1. Hand Sample Analysis

For the hand sample, XRF and LIBS techniques were applied. The main difference between the two techniques is the spot size and the inability of XRF to analyze light elements (e.g., lithium). In Figure 3, it is possible to observe an illustration of the XRF’s larger spot size (5 mm) compared to the LIBS spot size. This difference explains some discrepancies in the analytical results. For example, spots 6 and 9 were classified by XRF as areas that contain montebrasite and turquoise simultaneously, while the LIBS analysis classified spot 6 as montebrasite and spot 9 as turquoise. Another example of the difference in spot size is the result from the analysis of spot 1. According to XRF, spot 1 had 5.30% of Sn, indicating the presence of cassiterite. However, LIBS analysis did not measure any Sn content, because the smaller spot size of LIBS did not detect the cassiterite.
LIBS mapping (Figure 9) is important to show the spatial distribution of the different minerals present in the sample, but also to show the contact between them. It is possible to verify the large discrepancy between Li counts obtained for montebrasite in comparison to turquoise and quartz. Examining Figure 9b,c it was observed that there was no overlap between the Li and Cu content on the left part of the hand sample, making it possible to discard the possibility of Li content in turquoise. In addition, this mapping shows that the transformation to turquoise from montebrasite is taking place near the minor fractures. These techniques offer the advantage of giving fast qualitative/semi-quantitative results, with little or no sample preparation, when compared to the laborious process of preparing a thin section.

5.2. Thin Section Mapping

One of the more traditional techniques in mineralogical identification is petrography. After preparation of the thin section, identification of montebrasite (when polysynthetic twinning is visible) and turquoise is relatively easy because of the different characteristics of the minerals (Figure 5). However, to better identify different minerals, to validate the identification, and to study the possible alterations or inclusions within each mineral, complementary techniques are needed. Figure 10 shows a thin section where quartz can be easily identified (bottom right corner), but the montebrasite and turquoise are difficult to distinguish. Only by using greater magnification is it possible to differentiate the two minerals (Figure 5). With the LIBS technique, elemental maps can be made for all thin sections (Figure 10), providing a better understanding of possible alterations and a better definition of the minerals in the sample. For example, the lower content of Li (Figure 10b) and the higher content of Cu (Figure 10c) show the prevalence of turquoise over montebrasite. These results provide evidence of a higher state of alteration of montebrasite toward turquoise in this sample. Considering that the thickness of the thin section was estimated to be about 30 μm, this indicates that the LIBS shot barely reached the substrate. Even if this is the case, the expected contribution of the ablated substrate to the overall plasma in such conditions is most likely to be negligible due to the effect of shadowing by the crater walls. This can be confirmed by observing the Si mapping (Figure 10f). In general cases, the Si intensities are in the noise levels, except in the quartz area, as expected. This means that no Si signal from the substrate contributes to the overall LIBS signal. This way, the results confirm the suitability of the system used to map thin sections using LIBS.
Thus, it is possible to conclude that the LIBS analysis can be a complementary technique to petrography, allowing for a fast and more detailed qualitative analysis that can be used for double-checking the petrography results.

6. Main Conclusions

This work demonstrates the effectiveness of LIBS and XRF as analytical tools for elemental and mineral identification, which may be used to complement more traditional techniques such as petrography and other analytical methods. The minimal preparation of samples facilitates the use of these two techniques, and the combination of the LIBS mapping and the profilometry results demonstrates that even when the thin section substrate is ablated, there is no influence on the analytical results.
LIBS results of the hand sample demonstrate that turquoise and montebrasite can be differentiated and that turquoise has no Li content. However, in the thin section mapping, due to a mix of montebrasite and turquoise, the differentiation between these minerals is more difficult. Refining the grid resolution during the analysis can improve the results and identify both minerals with more accuracy.
LIBS mapping can be applied to other Li-rich rock samples; some early studies were presented in the 2019 EMSLIBS conference [35], where an analysis of two distinct samples was performed: one on lithium micas and the other on lithium aluminosilicates. The results show that LIBS can differentiate the minerals in these samples.
While the mapping was based on a qualitative analysis, a study was made using samples with controlled concentrations and well homogenized mixtures to evaluate the Li detection limit of our LIBS system. For the Li spectral line at 812.62 nm, used for the mapping, a detection limit of 65 ppm was attained. These figures were obtained with a laser energy of 21 mJ, which was the optimum operation point of our system, where better signal-to-noise ratio was obtained while avoiding saturation or self-absorption effect. When using more complex ore samples, these values may vary depending on the sample complexity and matrix effects, but should be of comparable order of magnitude. On the other hand, in thin sections, due to its reduced thickness, to avoid ablation of the substrate it was limited to a lower energy range. Furthermore, the reduced thickness also results in a reduced ablated mass, therefore, it is expected for the detection limit to be higher (above 65 ppm). Nevertheless, it should be stated that this is not an intrinsic limitation of the technique but rather of the specific setup. Using, for instance, detection systems with higher sensitivity and lower noise (cooled CCD), the limits of detection can be further improved. Values below 1 ppm were reported in the highest performing systems [36]. XRF analyses and LIBS mapping of key elements have potential applications in all stages of exploration and mining. During the exploration phase, it is important to increase the geological knowledge of a potential deposit including geological factors (Li content and mineralogy), shape, and size. This geological knowledge is essential to better estimate resources and reserves of a certain deposit, and XRF and LIBS techniques can be successfully applied to this task.
In the mining industry, rapid information on mineralogy and content can be critical for grade control during the mining and assessment of the concentrate grade after the separation and beneficiation process.

Author Contributions

Conceptualization, R.R., D.G. and A.L.; Methodology, R.R., D.G. and A.L.; Software, D.C., M.F., R.M. and D.G.; Formal analysis, R.R., D.C., M.F., D.G. and A.L.; Investigation, R.R., D.C., D.G. and A.L.; Resources, R.M., P.J., D.G. and A.L.; Data curation, R.R. and D.C.; Writing—original draft preparation, R.R. and D.C.; Writing—review and editing, All remaining authors; Visualization, R.R. and D.C.; Supervision, R.M., P.J., D.G. and A.L.; Project administration, P.J., D.G. and A.L.; Funding acquisition, P.J. and A.L. All authors have read and agreed to the published version of the manuscript.

Funding

This work was funded by National Funds through FCT—Portuguese Foundation for Science and Technology, Reference PTDC/EEI-EEE/31165/2017, and FEDER funds through the COMPETE 2020 Program under the project number POCI-01-0145-FEDER-031165. The work was also supported by National Funds through the FCT project UIDB/04683/2020 and UIDP/04683/2020–ICT (Institute of Earth Sciences). Ricardo Ribeiro and Miguel Ferreira are financially supported within the compass of their respective PhD theses (ref. SFRH/BD/140266/2018 and SFRH/BD/130680/2017), by national funds from MCTES through FCT, and co-financed by the European Social Fund (ESF) through POCH—Programa Operacional Capital Humano—and the NORTE 2020 regional program.

Data Availability Statement

The data are not publicly available due to confidentiality reasons.

Acknowledgments

The authors gratefully acknowledge the comments of four anonymous reviewers, which led to improvement in the manuscript.

Conflicts of Interest

The authors declare no conflict of interest.

References

  1. European Commission. Communication from the Commission to the European Parliament, the Council, the European Economic and Social Committee and the Committee of the Regions, Critical Raw Materials Resilience: Charting a Path towards Greater Security and Sustainability; European Commission: Brussels, Belgium, 2020; p. 23. [Google Scholar]
  2. Kesler, S.E.; Gruber, P.W.; Medina, P.A.; Keoleian, G.A.; Everson, M.P.; Wallington, T.J. Global lithium resources: Relative importance of pegmatite, brine and other deposits. Ore Geol. Rev. 2012, 48, 55–69. [Google Scholar] [CrossRef]
  3. Gourcerol, B.; Gloaguen, E.; Melleton, J.; Tuduri, J.; Galiegue, X. Re-assessing the European lithium resource potential—A review of hard-rock resources and metallogeny. Ore Geol. Rev. 2019, 109, 494–519. [Google Scholar] [CrossRef] [Green Version]
  4. Roda-Robles, E.; Pesquera, A.; Gil-Crespo, P.P.; Vieira, R.; Lima, A.; Garate-Olave, I.; Martins, T.; Torres-Ruiz, J. Geology and mineralogy of Li mineralization in the Central Iberian Zone (Spain and Portugal). Mineral. Mag. 2016, 80, 103–126. [Google Scholar] [CrossRef] [Green Version]
  5. Charoy, B.; Noronha, F. Multistage Growth of a Rare-Element, Volatile-Rich Microgranite at Argemela (Portugal). J. Petrol. 1996, 37, 73–94. [Google Scholar] [CrossRef]
  6. Martín-Izard, A.; Reguilón, R.; Palero, F. Las mineralizaciones litiniferas del oeste de Salamanca y Zamora. Estud. Geológicos 1992, 48, 19–30. [Google Scholar] [CrossRef]
  7. Pesquera, A.; Torres-Ruiz, J.; Velilla, N.; Gil-Crespo, P.P. Chemistry and genetic implications of tourmaline and Li-F-Cs micas from the Valdeflores area (Caceres, Spain). Am. Mineral. 1999, 84, 55–69. [Google Scholar] [CrossRef]
  8. Gallego Garrido, M. Las Mineralizaciones de Litio Asociadas a Magmatismo Acido en Extremadura y su Encuadra en la Zona Centro-Iberica. Ph.D. Thesis, Universidad Complutense de Madrid, Madrid, Spain, 1992. [Google Scholar]
  9. Carvalho, J.M.F.; Farinha, J.A.L.B. Lithium Potentialities in Northern Portugal. In Proceedings of the 17th Industrial Minerals International Congress, Barcelona, Spain, 28–31 March 2004; pp. 1–10. [Google Scholar]
  10. Pirard, C.; Hatert, F.; Fransolet, A.-M. Alteration sequences of aluminium phosphates from Montebras pegmatite, Massif Central, France. In Proceedings of the Granitic Pegmatites: The State of the Art—International Symposium, Porto, Portugal, 6–12 May 2007. [Google Scholar]
  11. De Carvalho, C.N.; Hamilton, T.G. Notas Sobre a Ocorrência Excepcional de Turquesas (Fosfato Hidratado de Cobre e Alumínio) no Cabeço da Argemela (Fundão/Covilhã). AÇAFA On Line. 2018. Available online: https://www.researchgate.net/publication/325011942_NOTAS_SOBRE_A_OCORRENCIA_EXCEPCIONAL_DE_TURQUESAS_FOSFATO_HIDRATADO_DE_COBRE_E_ALUMINIO_NO_CABECO_DA_ARGEMELA_FUNDAOCOVILHA_Notes_on_the_Exceptional_Finding_of_Turquoises_Hydrated_Phosphate_of_Copper_link (accessed on 16 March 2020).
  12. Margui, E.; Van Grieken, R. X-ray Fluorescence Spectrometry and Related Techniques; Momentum Press: New York, NY, USA, 2013. [Google Scholar]
  13. Potts, P.J. X-ray Fluorescence Analysis: Principles and Practice of Wavelength Dispersive Spectrometry. In A Handbook of Silicate Rock Analysis; Blackie & Son Ltd.: London, UK, 1987; pp. 226–285. [Google Scholar]
  14. Cremers, D.A.; Radziemski, L.J. Handbook of Laser-Induced Breakdown Spectroscopy, 2nd ed.; John Wiley & Sons, Ltd: Hoboken, NJ, USA, 2013. [Google Scholar]
  15. Rai, V.N.; Thakur, S.N. Physics of plasma in laser-induced breakdown spectroscopy. In Laser-Induced Breakdown Spectroscopy; Elsevier: Amsterdam, The Netherlands, 2007; pp. 83–111. [Google Scholar]
  16. Anabitarte, F.; Cobo, A.; López-Higuera, J. Laser-Induced Breakdown Spectroscopy: Fundamentals, Applications, and Challenges. ISRN Spectrosc. 2012, 2012, 285240. [Google Scholar] [CrossRef] [Green Version]
  17. Shah, S.K.H.; Iqbal, J.; Ahmad, P.; Khandaker, M.U.; Haq, S.; Naeem, M. Laser induced breakdown spectroscopy methods and applications: A comprehensive review. Radiat. Phys. Chem. 2020, 170, 108666. [Google Scholar] [CrossRef]
  18. Gazley, M.F.; Tutt, C.M.; Fisher, L.A.; Latham, A.R.; Duclaux, G.; Taylor, M.D.; de Beer, S.J. Objective geological logging using portable XRF geochemical multi-element data at Plutonic Gold Mine, Marymia Inlier, Western Australia. J. Geochem. Explor. 2014, 143, 74–83. [Google Scholar] [CrossRef]
  19. Jones, M.C.; Williams-Thorpe, O.; Potts, P.J.; Webb, P.C. Using Field-Portable XRF to Assess Geochemical Variations Within and Between Dolerite Outcrops of Preseli, South Wales. Geostand. Geoanal. Res. 2005, 29, 251–269. [Google Scholar] [CrossRef]
  20. Sarala, P.; Taivalkoski, A.; Valkama, J. Portable XRF: An Advanced On-Site Analysis Method in Till Geochemical Exploration. Geol. Surv. Finl. 2015, 57, 63–86. [Google Scholar]
  21. Guimarães, D.; Ferreira, M.F.S.; Ribeiro, R.; Dias, C.; Lima, A.; Martins, R.C.; Jorge, P.A.S. Application of a novel LIBS prototype as an analytical grade tool for Li quantification in pegmatite samples. In Proceedings of the Fourth International Conference on Applications of Optics and Photonics, Lisbon, Portugal, 31 May–4 June 2019; Volume 11207, p. 1120725. [Google Scholar]
  22. Harmon, R.; Lawley, C.; Watts, J.; Harraden, C.; Somers, A.; Hark, R. Laser-Induced Breakdown Spectroscopy—An Emerging Analytical Tool for Mineral Exploration. Minerals 2019, 9, 718. [Google Scholar] [CrossRef] [Green Version]
  23. McMillan, N.J.; Rees, S.; Kochelek, K.; McManus, C. Geological Applications of Laser-Induced Breakdown Spectroscopy. Geostand. Geoanal. Res. 2014, 38, 329–343. [Google Scholar] [CrossRef]
  24. Streubel, L.; Jacobsen, L.; Merk, S.; Thees, M.; Rammlmair, D.; Meima, J.; Mory, D. Rapid Analysis of Geological Drill-Cores with LIBS. Opt. Photon. 2016, 11, 23–27. [Google Scholar] [CrossRef]
  25. Julivert, M.; Fontbote, J.M.; Ribeiro, A.; Conde, L. Mapa Tectónico de la Península Ibérica y Baleares E. 1:1.000.000; Servicio de Publicaciones del Ministerio de Industria: Madrid, Spain, 1972. [Google Scholar]
  26. Farias, P.; Gallastegui, G.; González Lodeiro, F.; Marquínez, J.; Martín Parra, L.M.; Martínez Catalán, J.R.; De Pablo Maciá, J.G.; Rodríguez Fernández, L.R. Aportaciones al conocimiento de la litoestratigrafia y estructura de Galicia Central. In IX Reunião Sobre a Geologia do Oeste Peninsular; Universidade do Porto, Faculdade de Ciências, Museu e Laboratório Mineralógico e Geológico: Porto, Portugal, 1987; Volume I, pp. 410–432. [Google Scholar]
  27. Thadeu, D. Hercynian paragenetic units of the portuguese part of the hesperic massif. Bol. Soc. Geológica Port. 1977, 20, 247–276. [Google Scholar]
  28. Pereira, E.; Ribeiro, A.; Meireles, C. Variscan shear zones and control of Sn-W, Au, U mineralizations in the central-Iberian Zone in Portugal. Cuad. Lab. Xeol. Laxe 1993, 18, 89–119. [Google Scholar]
  29. Rodríguez Fernández, L.R.; López Olmedo, F.; Oliveira, J.T.; Medialdea, T.; Terrinha, P.; Matas, J.; Martín-Serrano, A.; Martín Parra, L.M.; Rubio, F.; Marín, C.; et al. Mapa Geológico de la Península Ibérica, Baleares y Canarias a Escala 1/1.000.000. 2015. © Instituto Geológico y Minero de España (IGME); © Laboratório Nacional de Energia e Geologia (LNEG). Available online: https://info.igme.es/cartografiadigital/geologica/ (accessed on 29 January 2021).
  30. Michaud, J. Rare Metal Granites—Origin, Emplacement and Mechanisms of the Magmatic-Hydrothermal Transition. Ph.D. Thesis, University of Orleans, Orleans, France, 2019. [Google Scholar]
  31. Inverno, C.; Ribeiro, M.L. Fracturação e cortejo filoneano nas Minas da Argemela (Fundão). Comun. Serv. Geolo. Port. 1980, 66, 185–193. [Google Scholar]
  32. Braga, P.F.A.; França, S.C.A.; Gonçalves, C.C.; Ferraz, P.F.V.; Neumann, R. Extraction of lithium from a montebrasite concentrate: Applied mineralogy, pyro- and hydrometallurgy. Hydrometallurgy 2020, 191, 105249. [Google Scholar] [CrossRef]
  33. Michaud, J.; Gumiaux, C.; Pichavant, M.; Gloaguen, E.; Marcoux, E. From magmatic to hydrothermal Sn-Li-(Nb-Ta-W) mineralization: The Argemela area (Central Portugal). Ore Geol. Rev. 2019, 116, 103215. [Google Scholar] [CrossRef]
  34. Sweetapple, M.T.; Tassios, S. Laser-induced breakdown spectroscopy (LIBS) as a tool for in situ mapping and textural interpretation of lithium in pegmatite minerals. Am. Mineral. 2015, 100, 2141–2151. [Google Scholar] [CrossRef]
  35. Guimarães, D.; Ferreira, M.F.S.; Dias, C.; Ribeiro, R.; Lima, A.; Martins, R.C.; Jorge, P.A.S. Lithium bearing minerals differentiation using Laser-Induced Breakdown Spectroscopy. In Proceedings of the 10th Euro-Mediterranean Symposium on Laser-Induced Breakdown Spectroscopy (EMSLIBS 2019), Brno, Czech Republic, 8–13 September 2019; pp. 212–213. [Google Scholar]
  36. Wiens, R.; Maurice, S.; Lasue, J.; Forni, O.; Anderson, R.; Clegg, S.; Bender, S.; Blaney, D.; Barraclough, B.; Cousin, A.; et al. Pre-flight calibration and initial data processing for the ChemCam laser-induced breakdown spectroscopy instrument on the Mars Science Laboratory rover. Spectrochim. Acta Part B At. Spectrosc. 2013, 82, 1–27. [Google Scholar] [CrossRef]
Figure 1. Location and regional setting of Argemela. (a) Map of the Iberian Massif showing the main geological units, based on a 1:1,000,000 scale geological map [29]. (b) Regional geological map based on a 1:1,000,000 scale geological map [29].
Minerals 11 01169 g001
Figure 2. Geological map of the Argemela district showing the Argemela Tin Mine (ATM) and Argemela Hill Top (AHT) systems (modified from Inverno and Ribeiro [31], Charoy and Noronha [5] and Michaud et al. [33]).
Minerals 11 01169 g002
Figure 3. Hand sample of montebrasite, quartz and turquoise, with the different spots measured by XRF and LIBS. Within each LIBS spot, five shots were performed at three different points, giving a total of 15 shots.
Minerals 11 01169 g003
Figure 4. LIBS experimental setup.
Minerals 11 01169 g004
Figure 5. Microphotography of the quartz montebrasite hydrothermal vein. (a) Cross-polarized light of montebrasite (Mtb) with polysynthetic twinning and turquoise (Turq). (b) Plane polarized light of montebrasite (Mtb) with polysynthetic twinning and turquoise.
Minerals 11 01169 g005
Figure 6. (a) Concentration of Al2O3 (wt%) in each spot of the hand sample in GeoMining mode, using the pXRF. (b) Concentration of SiO2 (wt%) in each spot of the hand sample in GeoMining mode, using the pXRF. (c) Concentration of P (wt%) in each spot of the hand sample in GeoMining mode, using the pXRF. (d) Concentration of Cu (wt%) in each spot of the hand sample in GeoMining mode, using the pXRF.
Minerals 11 01169 g006aMinerals 11 01169 g006b
Figure 7. The 50 keV spectrum of spot 1 and of a blank. Highlighted is the energy of the X-ray emission of Sn: Kα1 25.2713 keV and Kβ1 28.486 keV.
Minerals 11 01169 g007
Figure 8. Average number of counts normalized to the maximum value for each sample, and the associated error bars.
Minerals 11 01169 g008
Figure 9. (a) LIBS mapping mineral distribution. (b) LIBS mapping overlaid the sample for Li (812.62 nm). (c) LIBS mapping overlaid the sample for Cu (327.37 nm). (d) LIBS mapping overlaid the sample for P (213.51 nm). (e) LIBS mapping overlaid the sample for Al (369.09 nm). Note: For (be), the color scale represents normalized intensity counts.
Minerals 11 01169 g009
Figure 10. (a) Thin section and mineral distribution. (b) LIBS mapping overlaid with thin section for Li (812.62 nm). (c) LIBS mapping overlaid with thin section for Cu (327.37 nm). (d) LIBS mapping overlaid with thin section for Al (369.09 nm). (e) LIBS mapping overlaid with thin section for P (213.51 nm). (f) LIBS mapping overlaid with thin section for Si (288.13 nm). Note: For (bf), the color scale represents normalized intensity counts.
Minerals 11 01169 g010
Figure 11. Profilometry along the first six craters of the 18th map column.
Minerals 11 01169 g011
Table 1. Bruker S1 Titan. GeoMining Calibration (P/N: 730.0203). Sample prep: All calibration samples were prepared as dry sample powders packed into a sample cup and measured through a 4 micron foil. Limit of detection (LOD) specified for SiO2 matrix in three sigma 99.7% confidence level and 180 s analysis time in 3-phase mode (60 s per phase). Calibration range: This is based on available reference materials and can be extrapolated up to 10% (relative) over the highest value. The calibration for Ba, La, and Ce was made using K-alpha and K-beta lines, and the other elements were calibrated using the K and L lines (Bruker 2017).
GeoMining (3 Phase Results)MgOAl2O3SiO2PSClK2OCaTiVCrMnFeCoNiCuZnGaAsSeRbSrYZr
LOD (ppm) on pure SiO2 matrix49001250N/A39601354435402216132036321321217
Upper range (wt%)706910013.241415.33160562745.47072.47980800.02760.050.071.020.2239
GeoMining (3 Phase Results)NbMoRhPdAgCdInSnSbTeBa(K)La(K)Ce (K)HfTaWPtAuHgTlPbBiThU
LOD (ppm) on pure SiO2 matrix
Upper range (wt%)
1
70
10
67
14
0.03
13
0.08
10
0.66
10
0.78
13
0
69
88
26
19
7
0.02
62
10.7
161
0.7
128
4.8
9
1.05
43
82
33
80
11
0.16
1
0.1
1
86
15
0.02
6
93
4
90
4
0.68
9
0.17
Table 2. Comparison between XRF QC analysis during the measurements (n = 1) of the hydrothermal sample and QC reference. Err corresponds to the absolute uncertainty of the reading reported by the instrument. All measurements are shown in weight percent.
Number of MeasurementsAl2O3 (wt%)Err (wt%)SiO2 (wt%)Err (wt%)K2O (wt%)Err (wt%)Mn (wt%)Err (wt%)Fe (wt%)Err (wt%)Cu (wt%)Err (wt%)Rb (wt%)Err (wt%)Pb (wt%)Err (wt%)
Measurements during the sample analysis111.80.470.10.74.900.040.1160.0071.770.020.0230.0020.01490.00090.0870.004
211.60.469.00.74.830.040.1190.0071.800.020.0220.0020.01420.00090.0930.004
311.00.466.50.74.770.040.1160.0071.810.020.0230.0020.01470.00090.1000.005
411.40.466.80.74.710.040.1180.0071.790.020.0230.0020.01430.00090.0950.005
511.80.468.90.74.830.040.1180.0071.800.020.0230.0020.01420.00090.0900.004
611.40.467.00.74.750.040.1130.0071.760.020.0220.0020.01450.00090.0980.005
711.60.468.20.74.800.040.1080.0061.750.020.0220.0020.01440.00090.0890.004
QC referenceTarget Mean11.82 68.79 4.78 0.110 1.75 0.0218 0.0142 0.0886
S. Deviation0.19 1.00 0.08 0.003 0.01 0.0006 0.0004 0.0026
Limit MIN10.89 63.82 4.36 0.095 1.70 0.0189 0.0122 0.0758
Limit MAX12.74 73.77 5.19 0.126 1.80 0.0247 0.0162 0.1013
Table 3. Chemical formula and theoretical chemistry of quartz, turquoise, and amblygonite–montebrasite.
QuartzChemical FormulaSiO
SiO246.74% 53.26%
TurquoiseChemical FormulaAlCuPHO
CuAl6(PO4)4(OH)8 4(H2O)19.90%7.81%15.23% 1.98% 55.07%
Ambligonite–MontebrasiteChemical FormulaLiAlPHOF
LiAl(PO4)(OH,F)4.74%18.43%21.16%0.52%51.91%3.24%
Publisher’s Note: MDPI stays neutral with regard to jurisdictional claims in published maps and institutional affiliations.

