Article

Application of Wavelet Filtering to Vibrational Signals from the Mining Screen for Spring Condition Monitoring

KGHM Cuprum Research and Development Centre Ltd., Gen. W. Sikorskiego 2-8, 53-659 Wroclaw, Poland
*
Author to whom correspondence should be addressed.
Minerals 2021, 11(10), 1076; https://doi.org/10.3390/min11101076
Submission received: 22 July 2021 / Revised: 24 September 2021 / Accepted: 26 September 2021 / Published: 30 September 2021

Abstract

:
The main task of mineral processing plants is to further process the raw material extracted in the mining faces into a concentrate with the highest possible concentration of the final product. In practice, it is a complex process in which several stages can be distinguished. After the ore has been transported to the surface by the skip shaft, one of the first steps is sieving the ore, which is typically performed using vibrating mining screens. In a typical Ore Enrichment Plant, the screening process is carried out by several such machines. This is a typical bottleneck in the technological chain. For this reason, the main challenge for users is to achieve the highest reliability and efficiency of these technical facilities. The solution is to focus on predictive maintenance strategies based on the development of monitoring and advanced diagnostic procedures capable of estimating the time of safe operation. This work was developed as part of an advanced diagnostic system ensuring comprehensive technical conditioning and early fault detection of components such as the engine, transmission, bearings, springs, and screen. This article focuses on vibration data. The problem of damage detection in the presence of periodically impulsive components resulting from falling feed material on the screen and its further screening process has been considered. These disturbances are of a non-Gaussian noise nature, the elimination of which is essential to extract the fault-related signal of interest. One solution may be to properly smooth and filter the raw signal. In this article, a wavelet filtering technique is applied. First, the wavelet filtering procedure is described. In the next step, the performance of a wavelet filter is investigated depending on its parameters. Then, the results of wavelet filtering are compared with such methods as low-pass filtering and smoothing using a moving average. Finally, the impact of wavelet filtering on the calculation of screen trajectories is investigated.

1. Introduction

Currently, in the mining sector, there is a rapid development of technology ensuring operational supervision of processes and technical facilities based on online monitoring. A typical mining enterprise wishing to remain competitive in the mineral resources market must plan the production process, maintenance, and materials management in advance based on real data. If we look at machinery systems as a network of interconnected vessels, the bottlenecks are one of the most critical. In order to avoid downtime and to carry out maintenance works in a controlled manner, it is crucial to develop advanced diagnostic systems [1]. The key is to provide appropriate sensors that significantly exceed the human senses but also to develop advanced procedures for the extraction of fault-oriented features, procedures for inferencing the diagnostic state of individual components, and procedures for estimating the residual lifetime. Currently, predictive maintenance is developed strongly based on the assumptions of the Industrial Internet of Things technologies, in which the sensed objects are connected to the Internet and can communicate with each other and the superior system [2,3,4,5,6,7].
In this article, one of the critical technical objects of the Ore Enrichment Plant—the vibrating screen used for the sieving process—is considered. The main purpose of sieving is to separate the fine fraction (suitable for milling) from the coarse fraction (requiring crushing). The horizontal schema of the vibrating screen is shown in Figure 1.
This process is the first stage to which the ore is subjected after direct transport to the surface, precisely before crushing and milling. At this stage, most of the metal components (e.g., anchors) are also captured using an electromagnet. The research was conducted in one of the Polish underground copper ore mines of KGHM, where the vibrating screens are located close to a mine shaft. Depending on the mining plant, the mesh size in the screen ranges from 20 to 40 mm. In all mines, the number of these objects is very limited (Polkowice—3, Lubin—3, Rudna—6); therefore, the vibrating screen is one of the typical bottlenecks in the entire processing plant. In practice, there are various types of vibrating screens. We can distinguish, among others, rotating vertical cylindrical screens and vibrating horizontal linear screens. The ore separation process in terms of grain size is based on induced vibrations. These vibrations are generated by one or two rotating shafts of unbalanced masses driven by drive units with belt transmission. A standard multi-deck vibrating screen is made of the main box and side plates which are connected by transverse reinforcing beams, upper and lower sieving decks, a deck under the screen, and multiple springs as supports. The feed is transferred to the plates by the conveyor and a dispenser located above the screen (Figure 2) [8].
The current demands of users of these devices are related to the development of monitoring systems and early response tools to the development of damage to components such as the engine, transmission, bearings, springs, or the screen itself [9]. Analyzing the literature, you can find many monitoring systems available on the market designed for processing machines; some of them are strictly dedicated to vibrating screens. Most of the commercial solutions [10,11,12,13,14] concern rolling bearings diagnostics based on vibration signals. Leading manufacturers also offer the expansion of the system with additional temperature sensors and lubrication oil particle (i.e., wear debris) counters. This device is exceptionally specific from a diagnostic point of view due to non-stationary operating conditions but also due to the presence of random high-impulse disturbances resulting from the grains bumping into the screen structure. If we do not separate the non-informative impulses from the informative pulses, the further diagnostic process will not be reliable. This issue has been strongly developed as a part of the project financed from EU funds under the acronym OPMO (Operation monitoring of mineral crushing machinery, [15]), which aims to build an advanced diagnostic system for selected mineral processing assets [16]. In this article, we will focus on the problem of diagnosing supporting springs that play a key role in the sieving process. Critical is their stiffness, which determines the effective operation of the entire screen. In the case of steel springs, a linear deformation characteristic up to a certain degree of deformation is observed. As the time of operation progresses, the stiffness of the springs is lost, which affects the amplitude and frequency of vibrations. Over time, they break as a result of high-cycle fatigue (HCF). Due to their complicated geometry and continuous movement during the screen operation, the number of possible diagnostic methods is limited. The optimal source of data can be vibration data, not only for the diagnosis of flexible springs but also for rolling bearings. One approach may be to plot orbits from two orthogonal vibration signals. Given this representation of the spring motion, it is possible to identify anomalous spring behavior with the knowledge of the correct operating parameters. In [8], the authors presented the main assumptions of such an approach. They described the dynamic model of the vibrating screen and paid special attention to the stochastic influence of the feed on the disturbance of the vibration signal, especially impacts from material falling on the upper deck and impacts from the material inside the screen. They also proposed a spring failure simulation procedure. The method was further developed in [17]. In the case of diagnosing the vibrating screen state, the key is to take into account two phenomena: time-varying load (due to the variable amount of feed on decks) as well as impulsive load considered to be impulsive background noise. In this article, we focus on the problem of signal denoising from these non-informative components. So far, this problem has been solved mainly in the field of diagnostics of rolling bearings, where the important issue is the detection of the cyclic impulse signal in the presence of non-cyclic impulse noise [18,19,20,21].
In this article, a wavelet filtering technique [22,23,24,25,26,27,28,29,30,31,32,33,34,35,36,37] was applied to vibrational signals collected in the ore processing plant from a mining screen. The main purpose was to compare the results of wavelet filtering to simple smoothing and filtering techniques, paying special attention to the difference in trajectory calculations. The structure of the article is as follows: In Section 2, the input data and the methods used for signal processing are described. In Section 3, all the main results are presented. First, the wavelet filtering is compared to moving-average and low-pass filters on raw signals. Then, the trajectory of the screen is calculated for the raw signal, low-pass-filtered signal, and wavelet-filtered signal. In Section 4, the obtained results are discussed, and our conclusions are drawn.

2. Materials and Methods

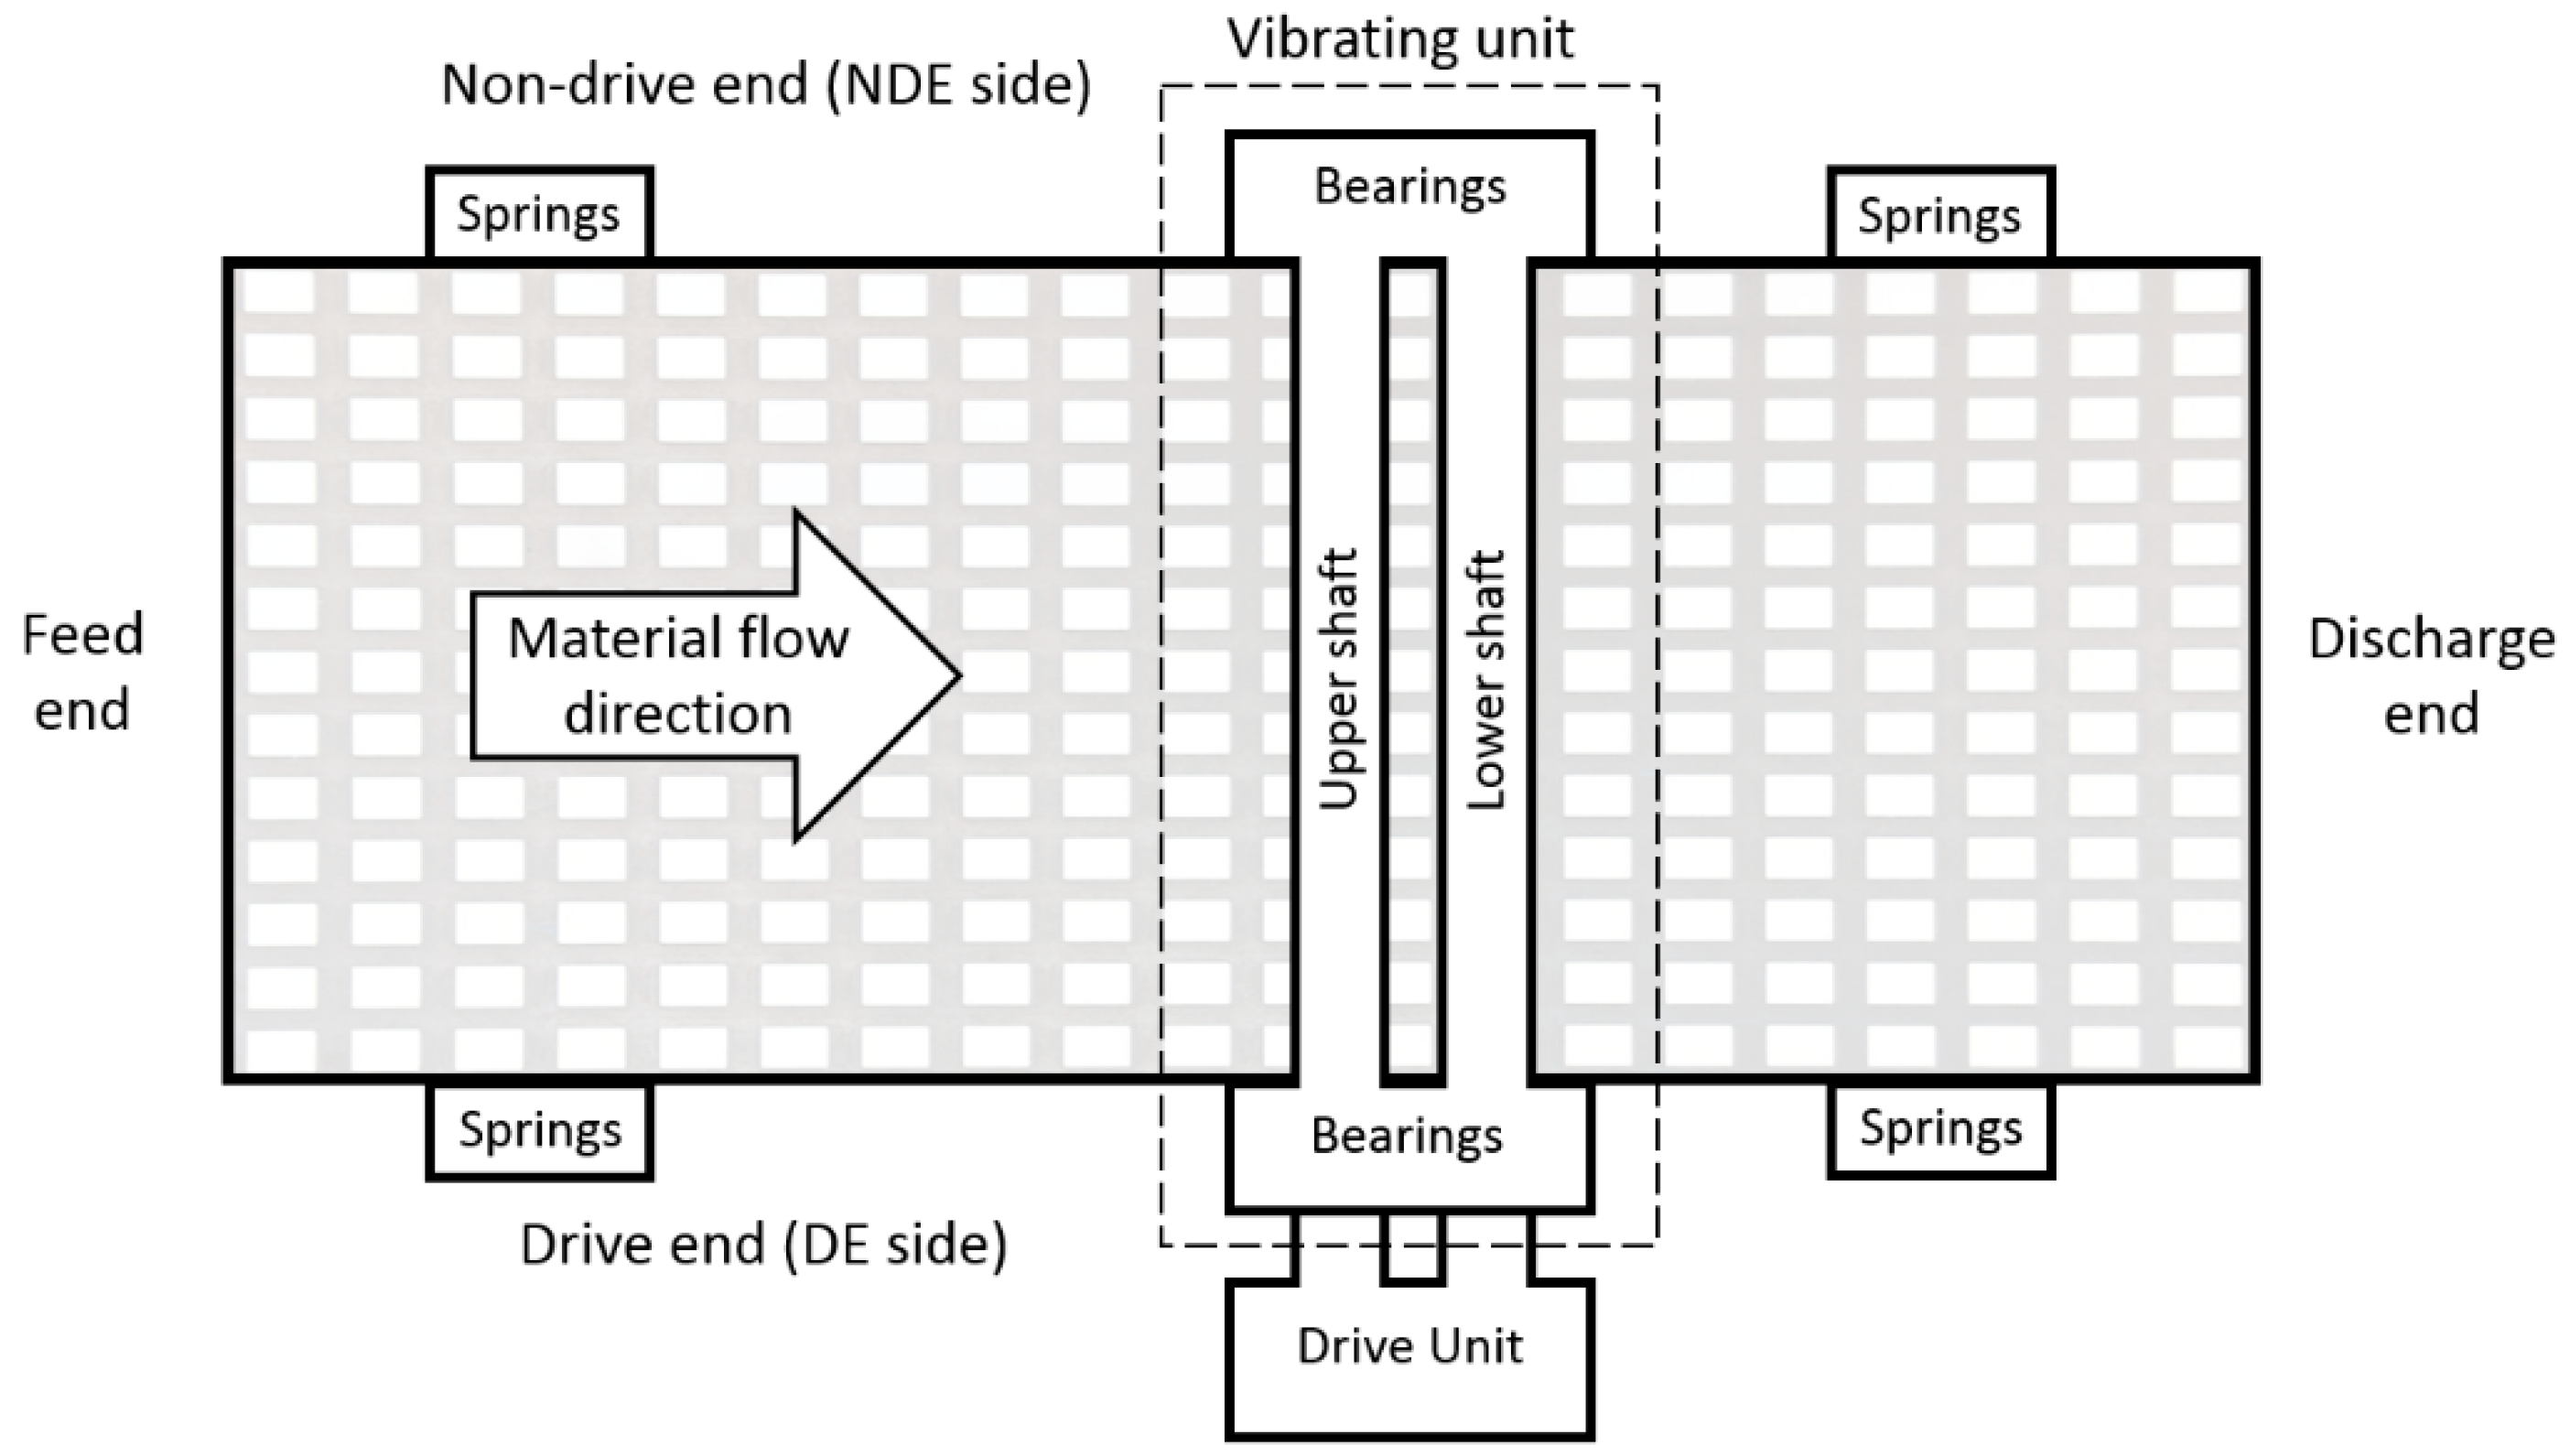
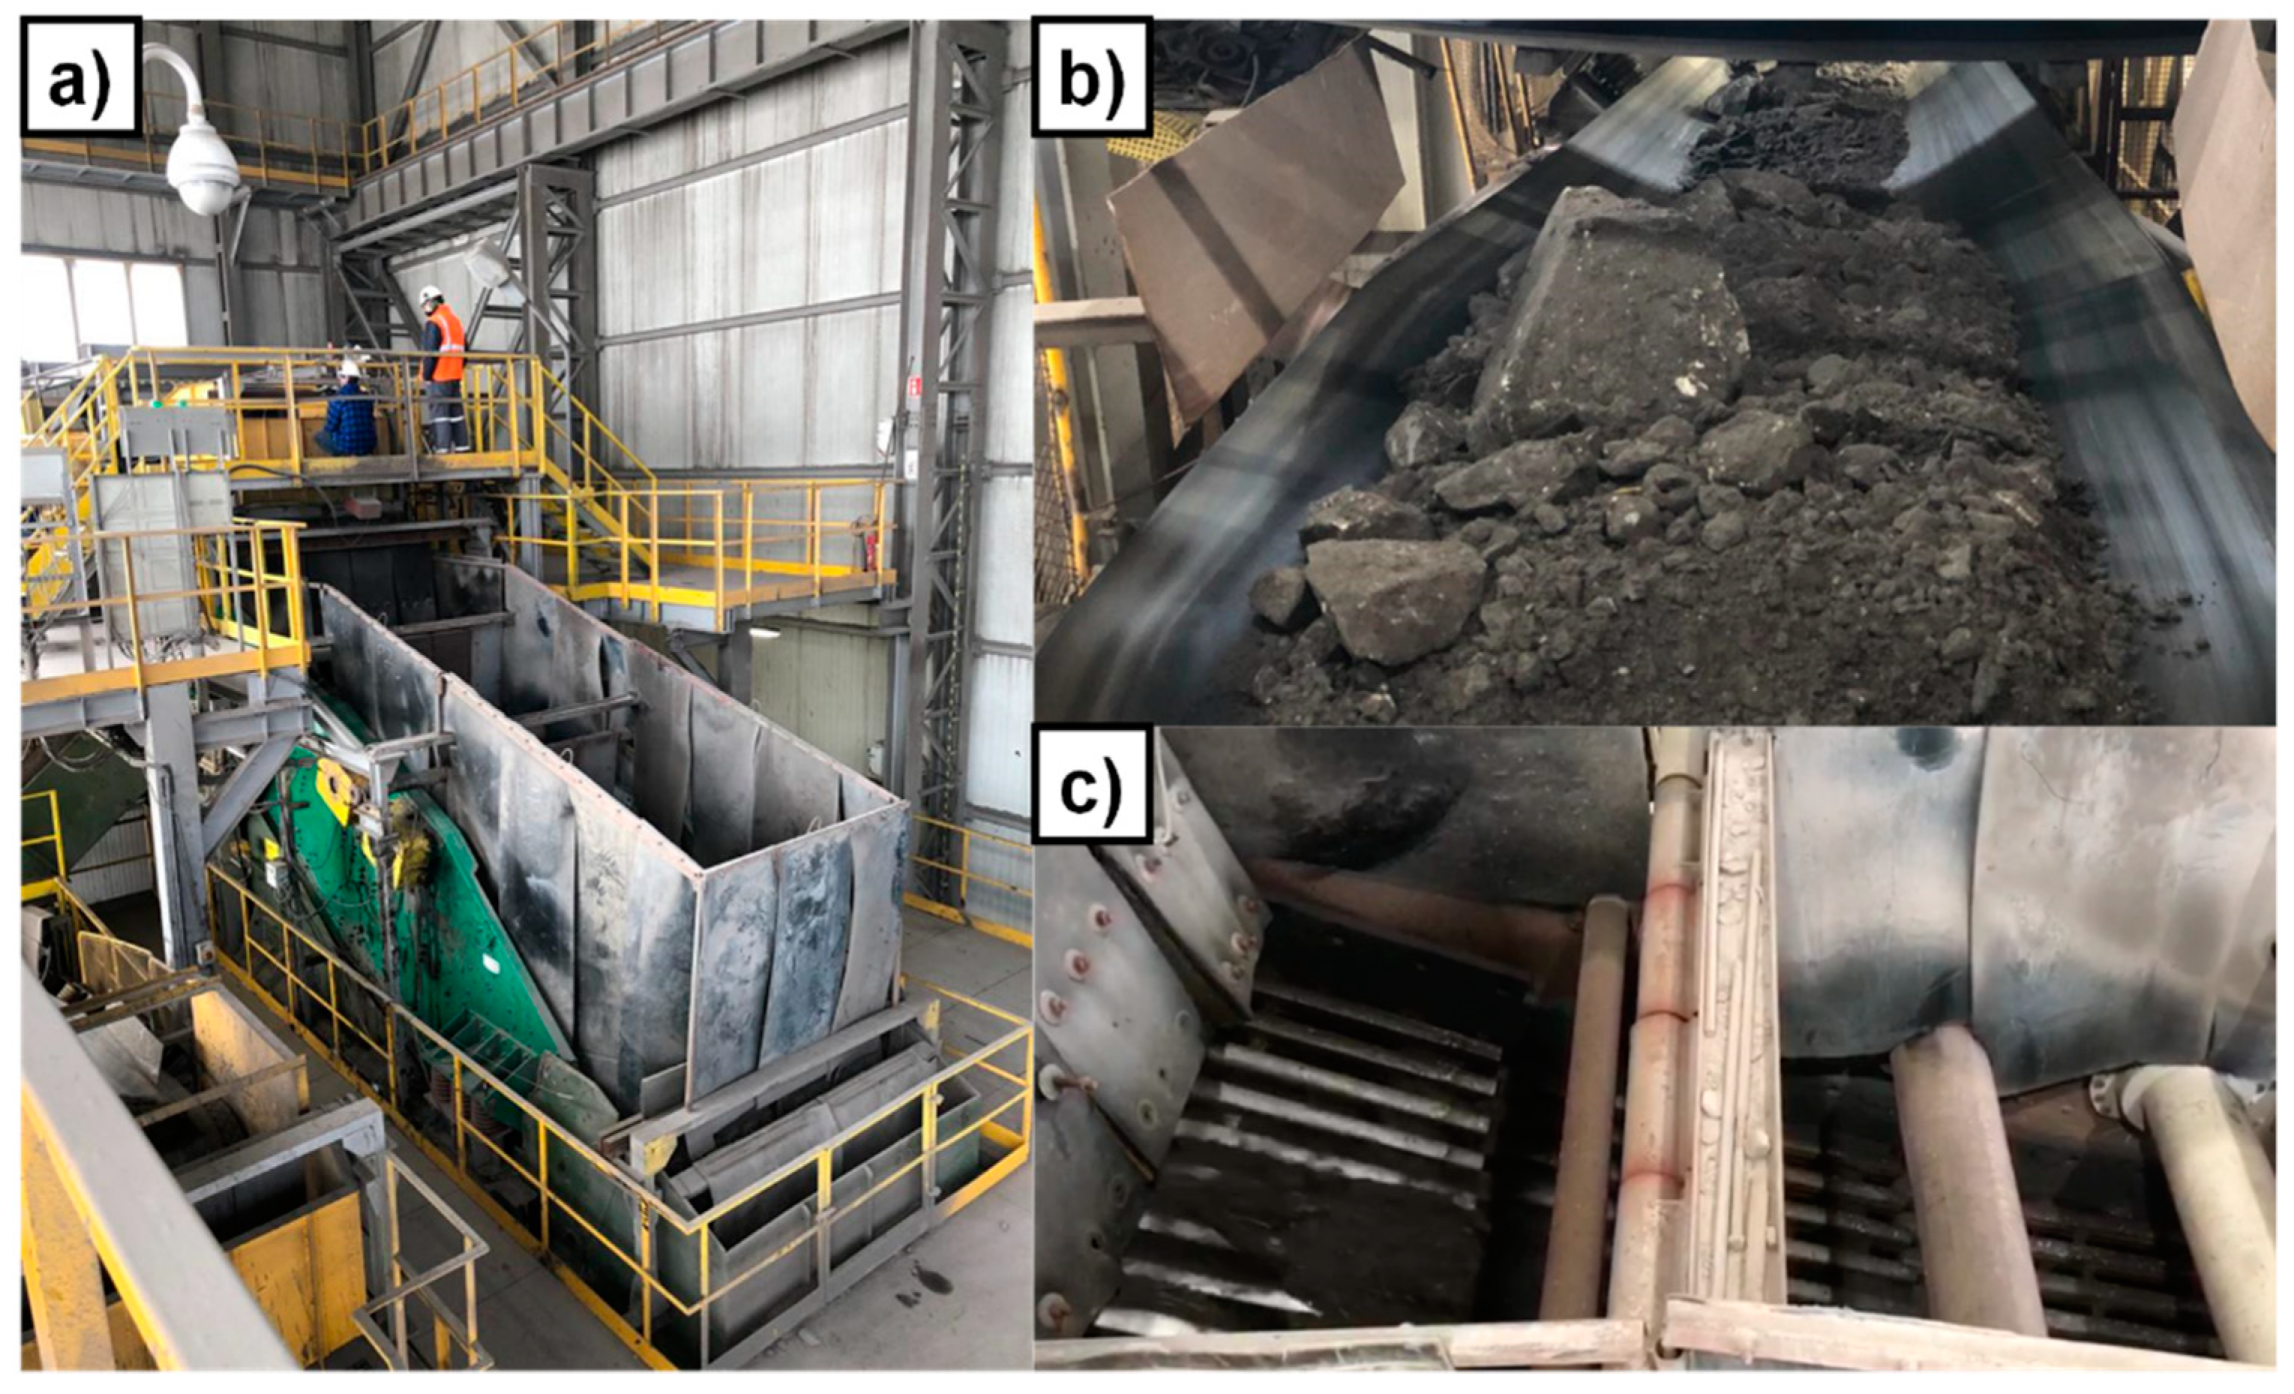
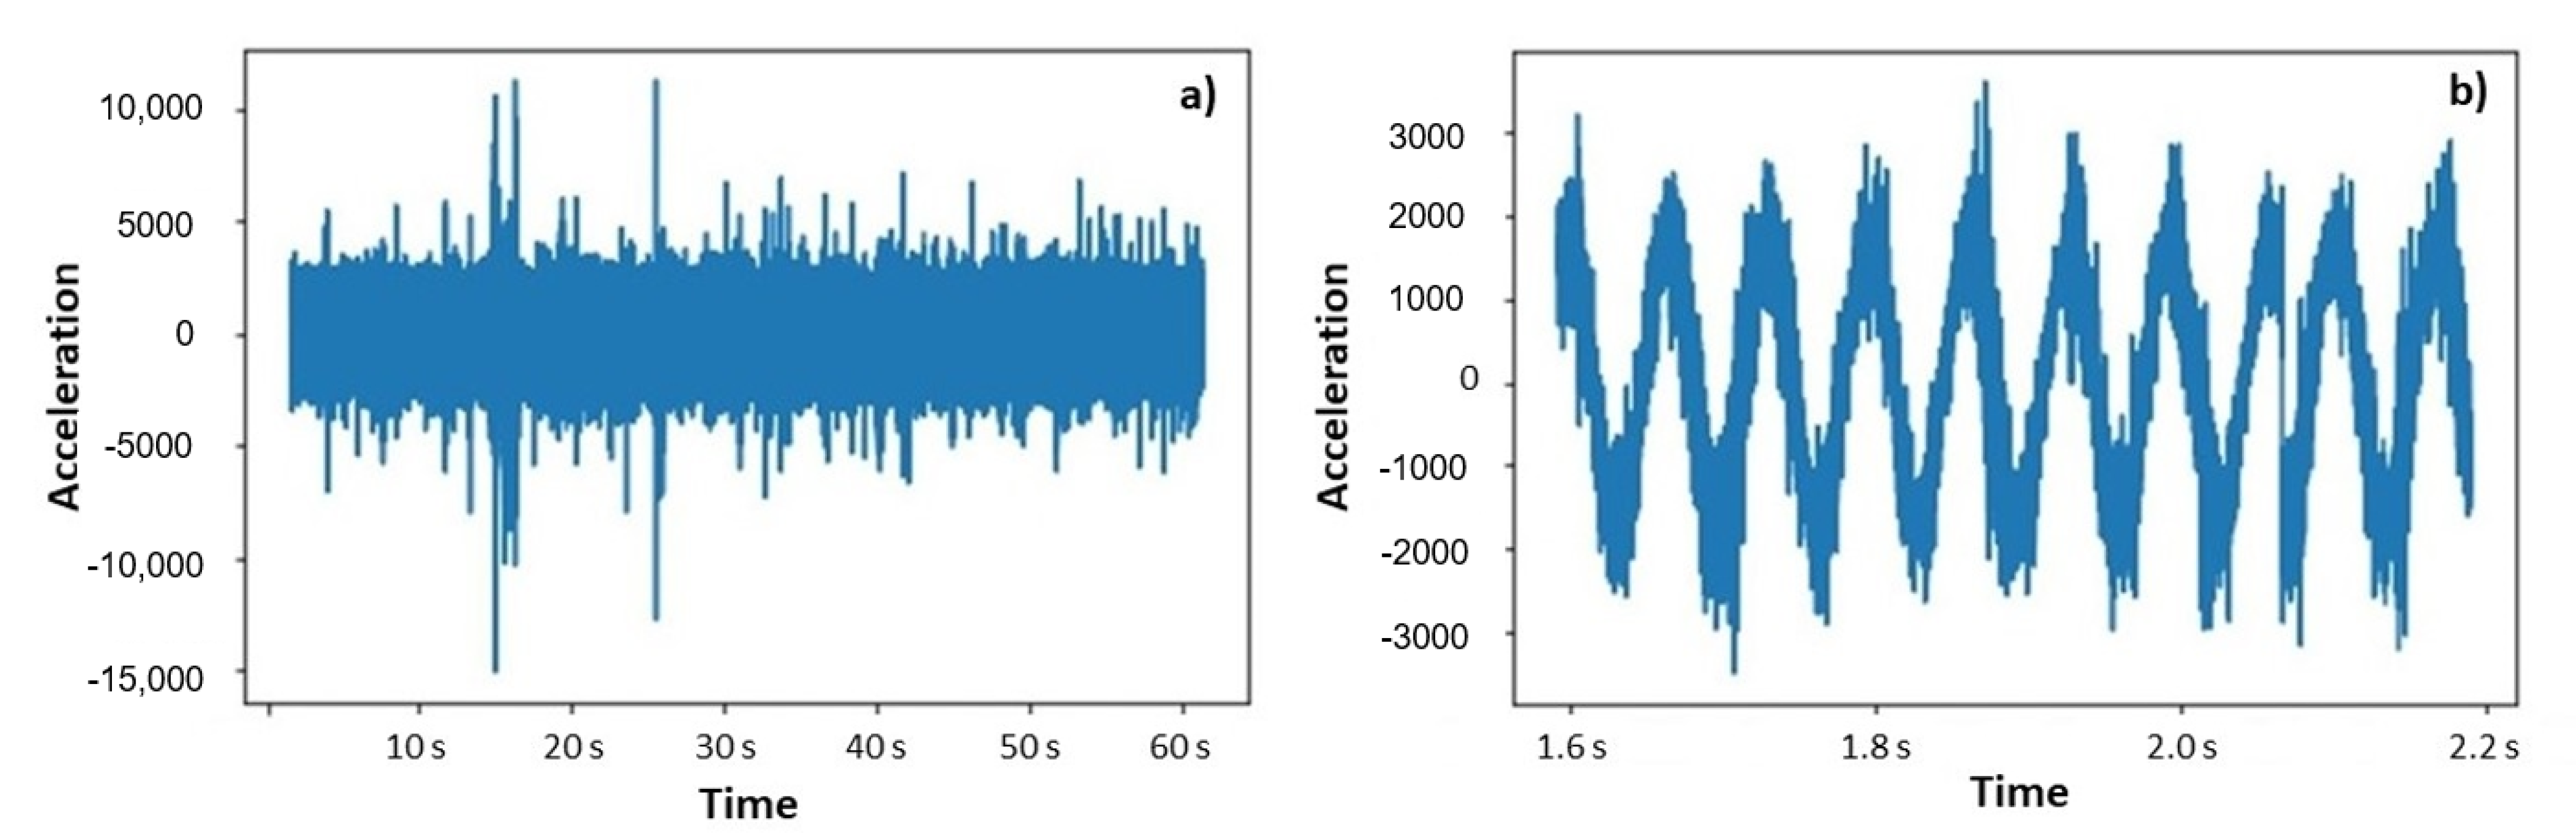
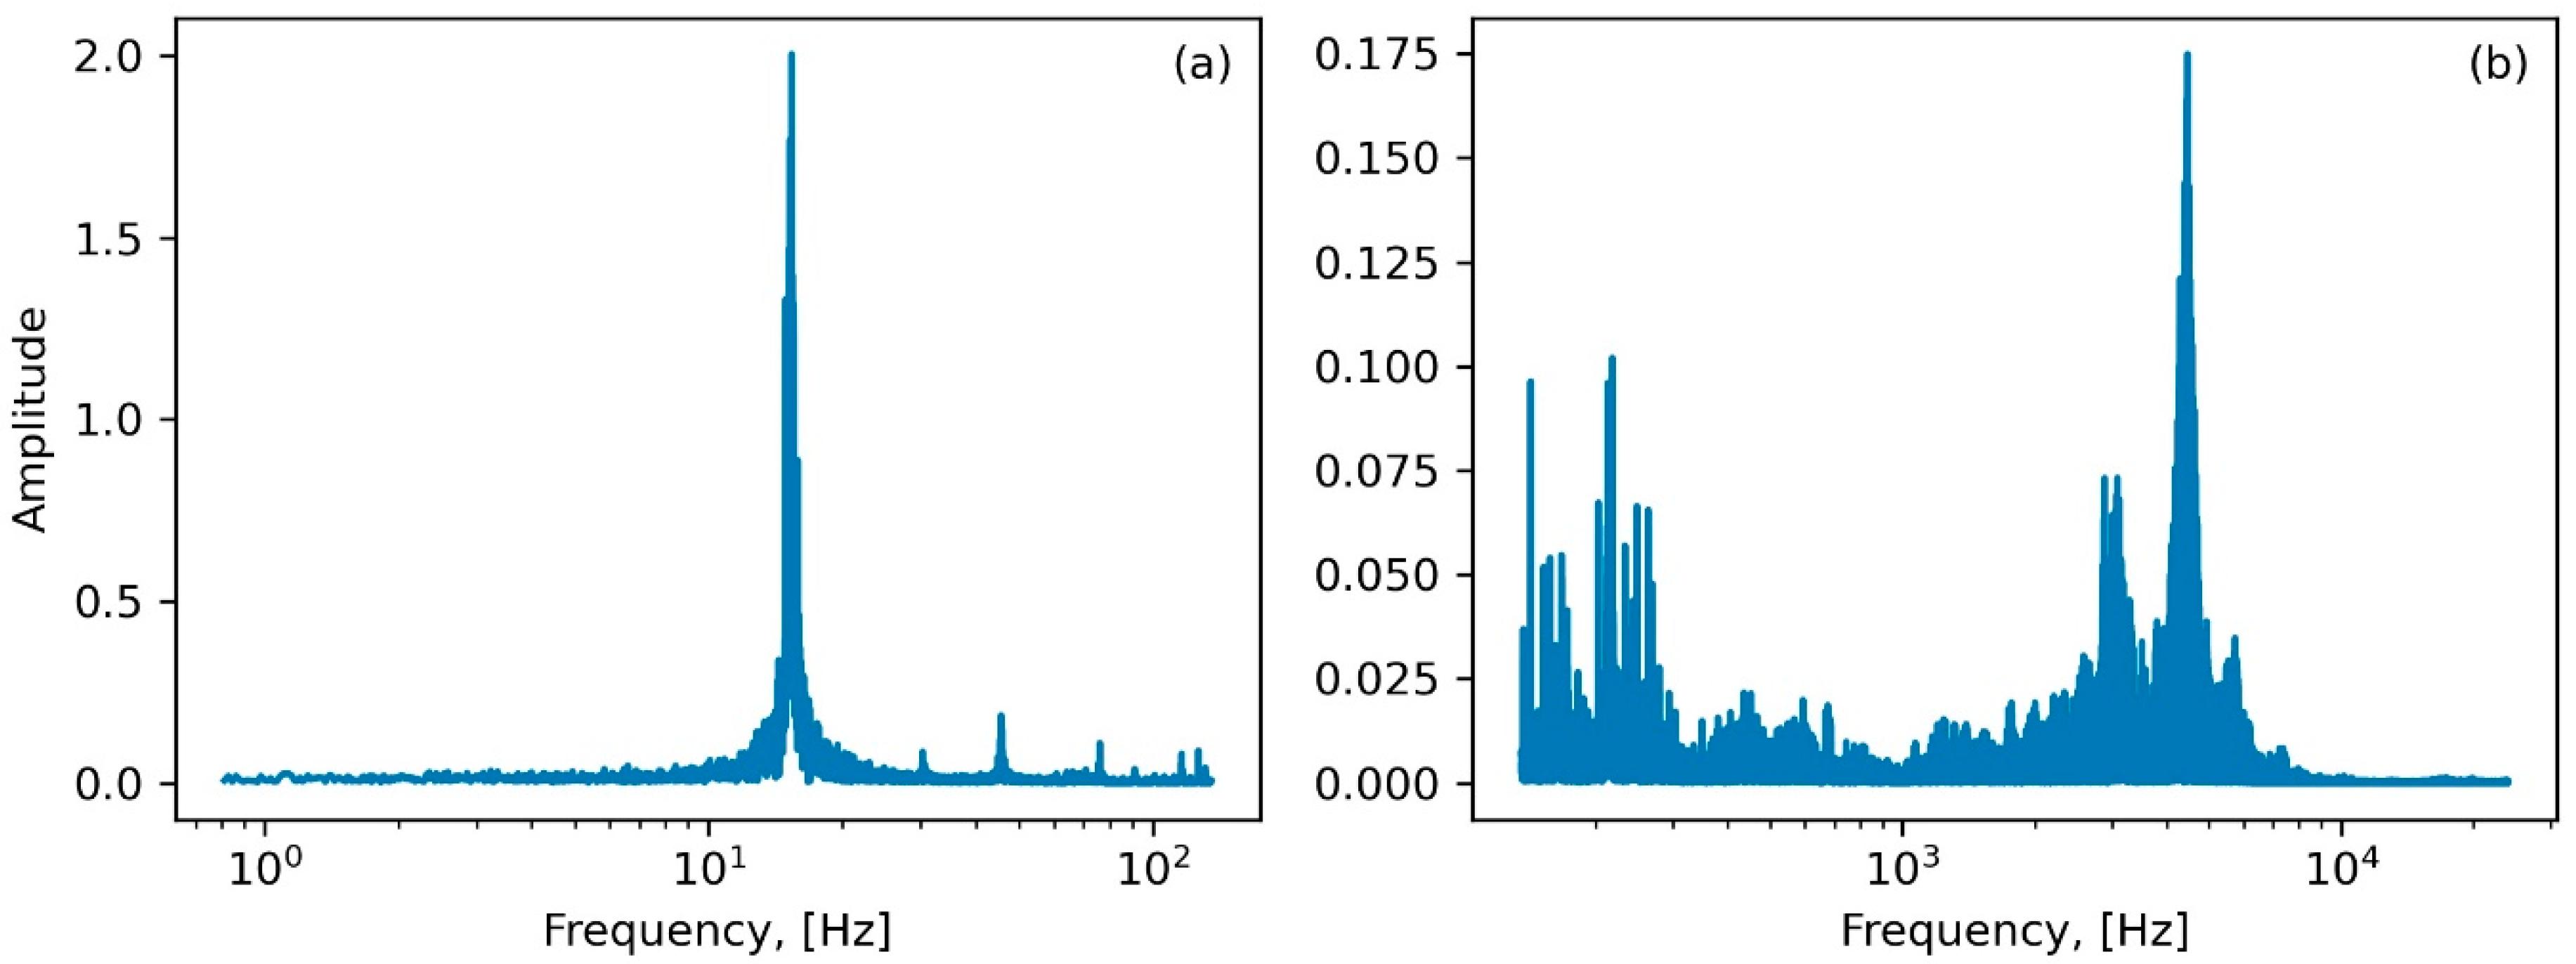
2.1. Input Data Description

An overall description of the diagnostic system installed on the investigated mining screen can be found in [18]. The vibrational data from the accelerometers were recorded with a sampling frequency of 16 or 48 kHz. There were 16 accelerometers, one vertical and one horizontal, for each of four bearings and four spring sets. In order to reduce the amount of stored data, a 1 min recording was taken every 15 min. An example of raw data is shown in Figure 3. Based on these data, the trajectory of the screen, which is a key characteristic for screen diagnostics and maintenance, as well as other diagnostic features, can be calculated.
On the left plot, one can see the whole signal recorded during a single measurement. Some significant excitation is observed around the fifteenth second of the measurement, which probably corresponds to a large piece of ore falling onto the screen. Such rocks can be detected using computer vision and audio processing technics based on recorded video signals of the incoming ore flow [22]. Based on the results of this detection, such excitation can be filtered out, which is planned in the future but has not been performed in this article due to the unavailability of video data for the studied period. On the right, a closer look at the same signal is shown, on which natural vibrations of the screen are visible.
The first step of data processing was the transformation of electric signals from the accelerometers into SI units (m/s2). The following formulas were used for springs:
a = 0.1733 · L S · g
where L is the measured value from the accelerometer, S is the sensitivity of the accelerometer ( S = 100 mV / g ), and g = 9.81   m / s 2 is the standard gravity.
The Fourier transformation of the signal for a spring set is shown in Figure 4. In Plot (a), the whole spectrum is shown. There is one dominating frequency of about 15 Hz, which corresponds to the rotation frequency of the shafts. Besides, some excitations are observed in the frequency range of 150–10,000 Hz, which are visible clearly in Plot (c). Generally, the amplitude of these excitations is much lower than the amplitude of the screen’s working frequency. For frequencies higher than 10 kHz, almost no excitations are observed, although this range could be important for bearings diagnostics.

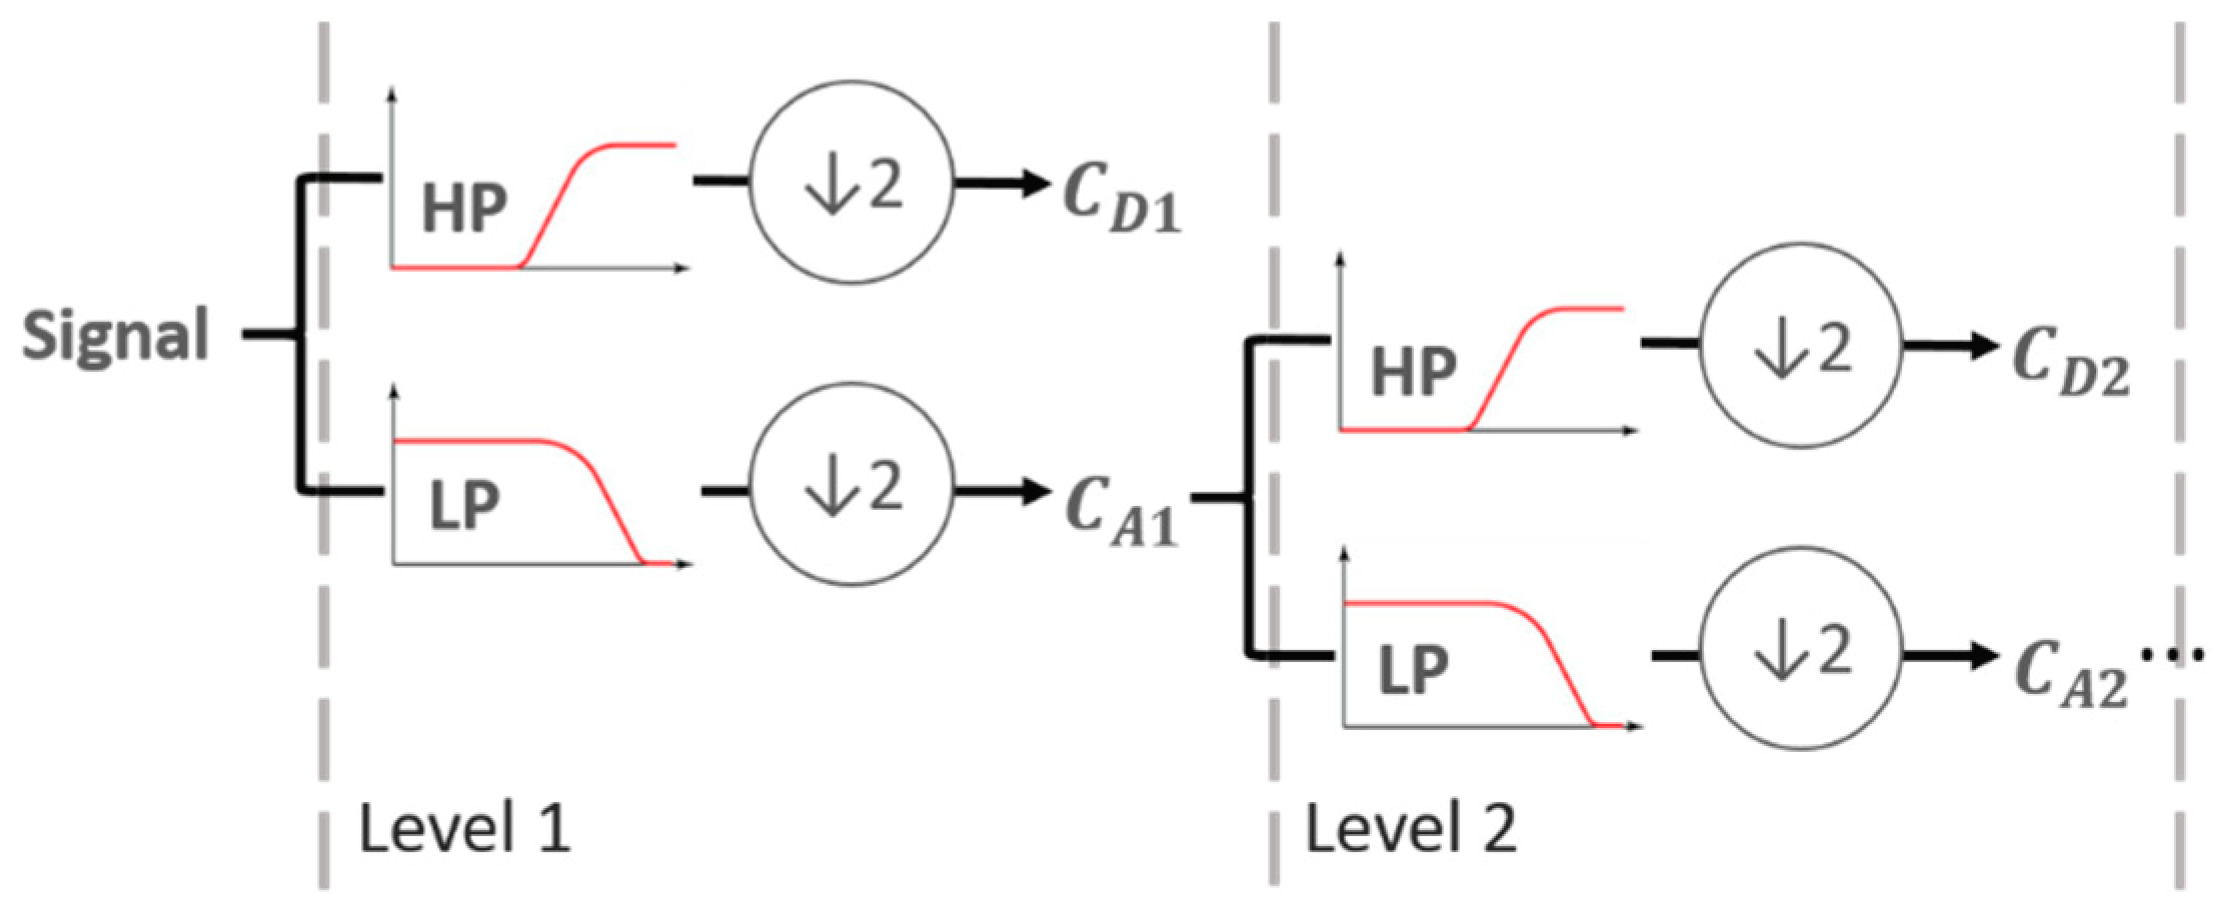
2.2. Wavelet Denoising Procedure

In this subsection, the procedure of wavelet filtering is described. The wavelet denoising procedure consists of three main steps (for more detail, read [23,24,25,26,27,28,29,30,31,32,33,34,35,36,37,38]):
  • Multilevel wavelet decomposition.
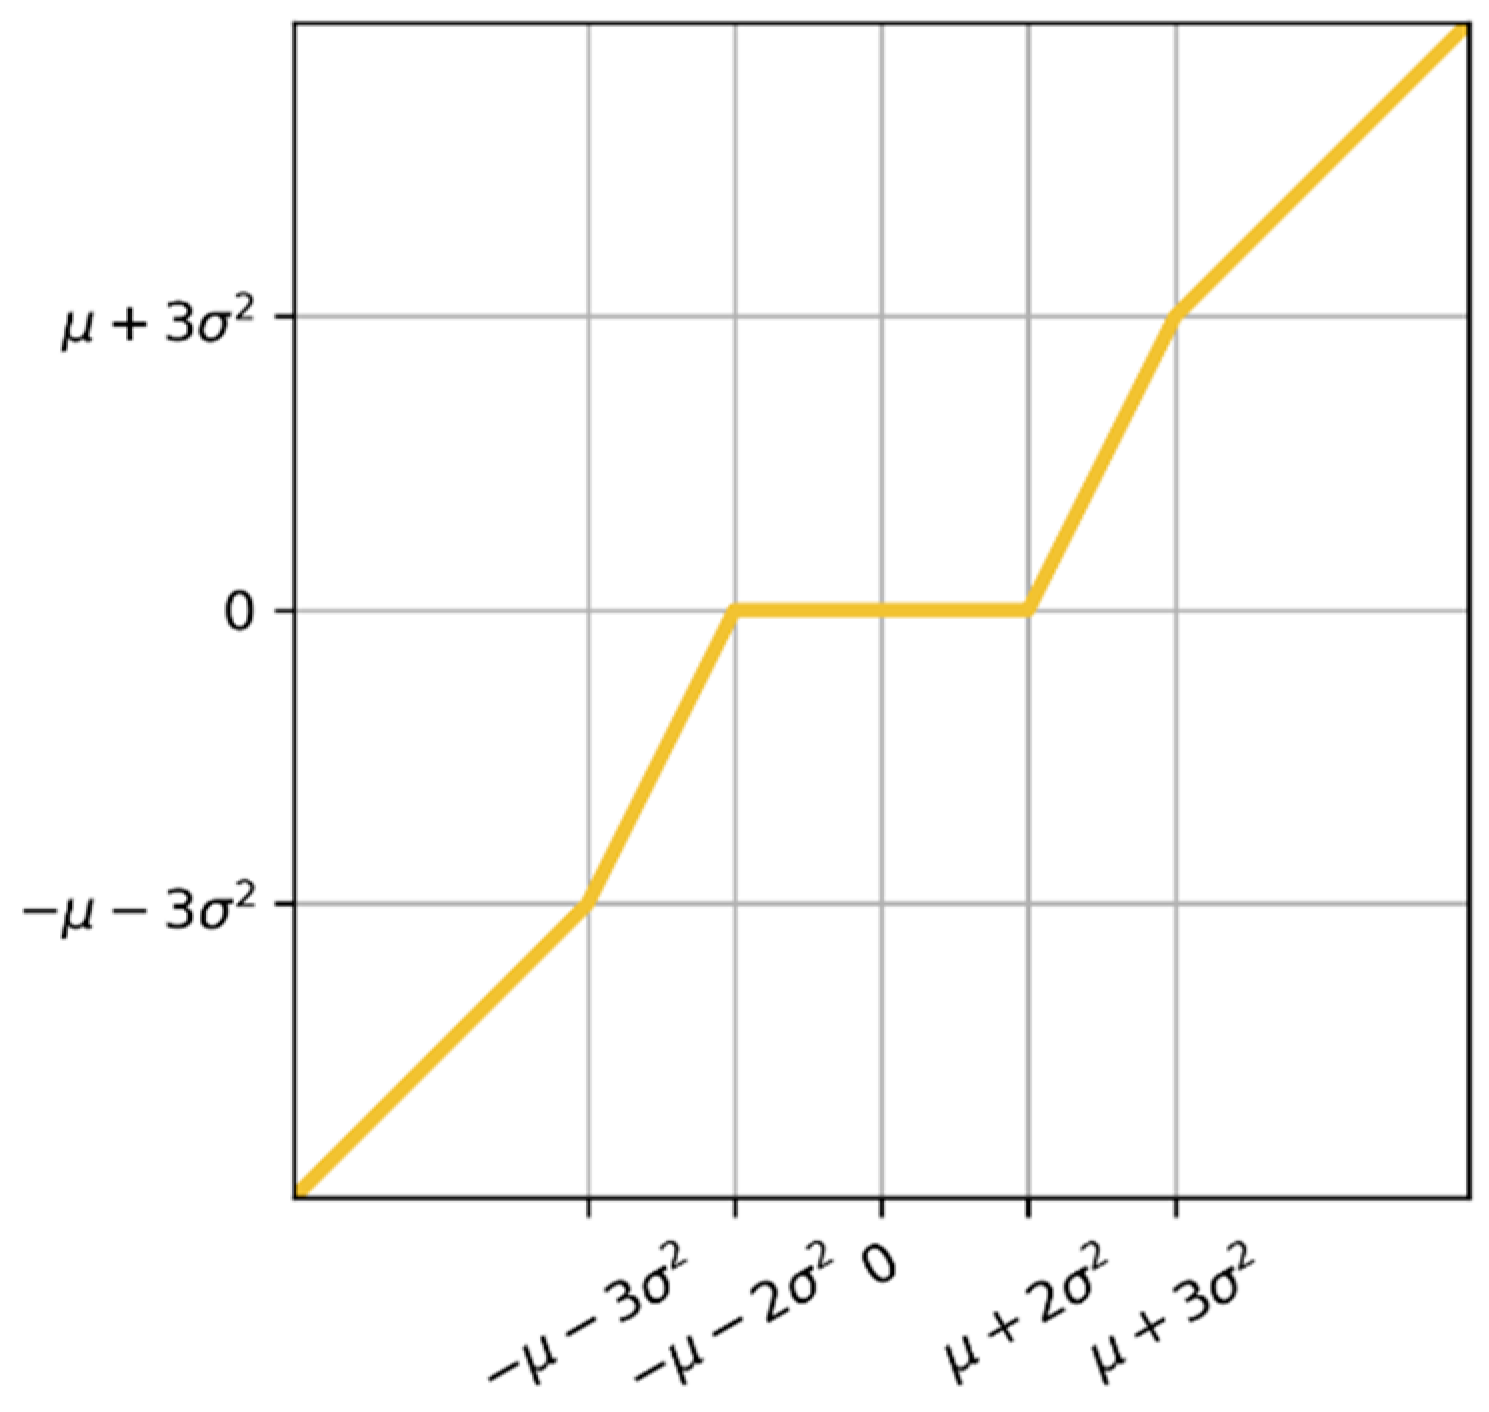
  • Finding thresholds for detail coefficients.
  • Reconstruction of the signal.
Wavelet transform is a tool that cuts up the signal into detail coefficients ( C D ), approximation coefficients ( C A ), and downsamples (Figure 5). The detail coefficients can be defined as high-frequency coefficients y h i g h [ n ] = i = s [ i ] h [ 2 n i ] , and the approximation coefficients can be defined as low-frequency coefficients y l o w [ n ] = i = s [ i ] g [ 2 n i ] , where i is a sampling data point, n is the size of the sampling data, s [ i ] is the raw signal, and g [ 2 n i ] and h [ 2 n i ] are low-pass and high-pass filters. The wavelet function is composed of the scaled and translated copies of the scaling function ϕ ( x ) = n h ( n ) 2 ϕ ( 2 x n ) and the mother wavelet function ψ ( x ) = n g ( n ) 2 ϕ ( 2 x n ) .
After signal decomposition into detail and approximation coefficients, it is necessary to threshold detail coefficients. One of the methods is hard thresholding, described by equation h λ ( x ) = x × 1 { | x | > λ } . The signal x remains unchanged if its values are lower than λ or greater than threshold λ ; otherwise, the values are replaced with zeros. Another method is soft thresholding s λ ( x ) = sign ( x ) × max ( | x | λ , 0 ) . Here, values greater in magnitude than the threshold are shrunk towards zero by subtracting the threshold from it. The method that is the combination of both methods explained is semi-soft thresholding, described by the equation below:
c λ ( x ) = { x , | x | > λ 2 , sign ( x ) × λ 2 ( | x | λ 1 ) λ 2 λ 1 , λ 1 | x | λ 2 , 0 , | x | < λ 1 .
Thresholds are calculated for each detail coefficient d j (i.e., noise). A common threshold choice is, for example, universal threshold λ = σ 2 log n , where n is the length of noise and σ is the median of absolute values from noise divided by 0.6745 [39]. Our threshold choice was λ 1 = μ + 2 σ 2 and λ 2 = μ + 3 σ 2 , where μ is the mean and σ 2 is the variance of the detail coefficient (Figure 6).
Other more widely used thresholding methods are adaptive threshold selection, using the principle of Stein’s Unbiased Risk Estimate (SURE) [40], and the minimax threshold [40]. (For more about thresholding, read [40,41,42].)
After thresholding, the signal can be reconstructed by inverse multilevel wavelet transform. The noise is the difference between the raw signal and the denoised signal.

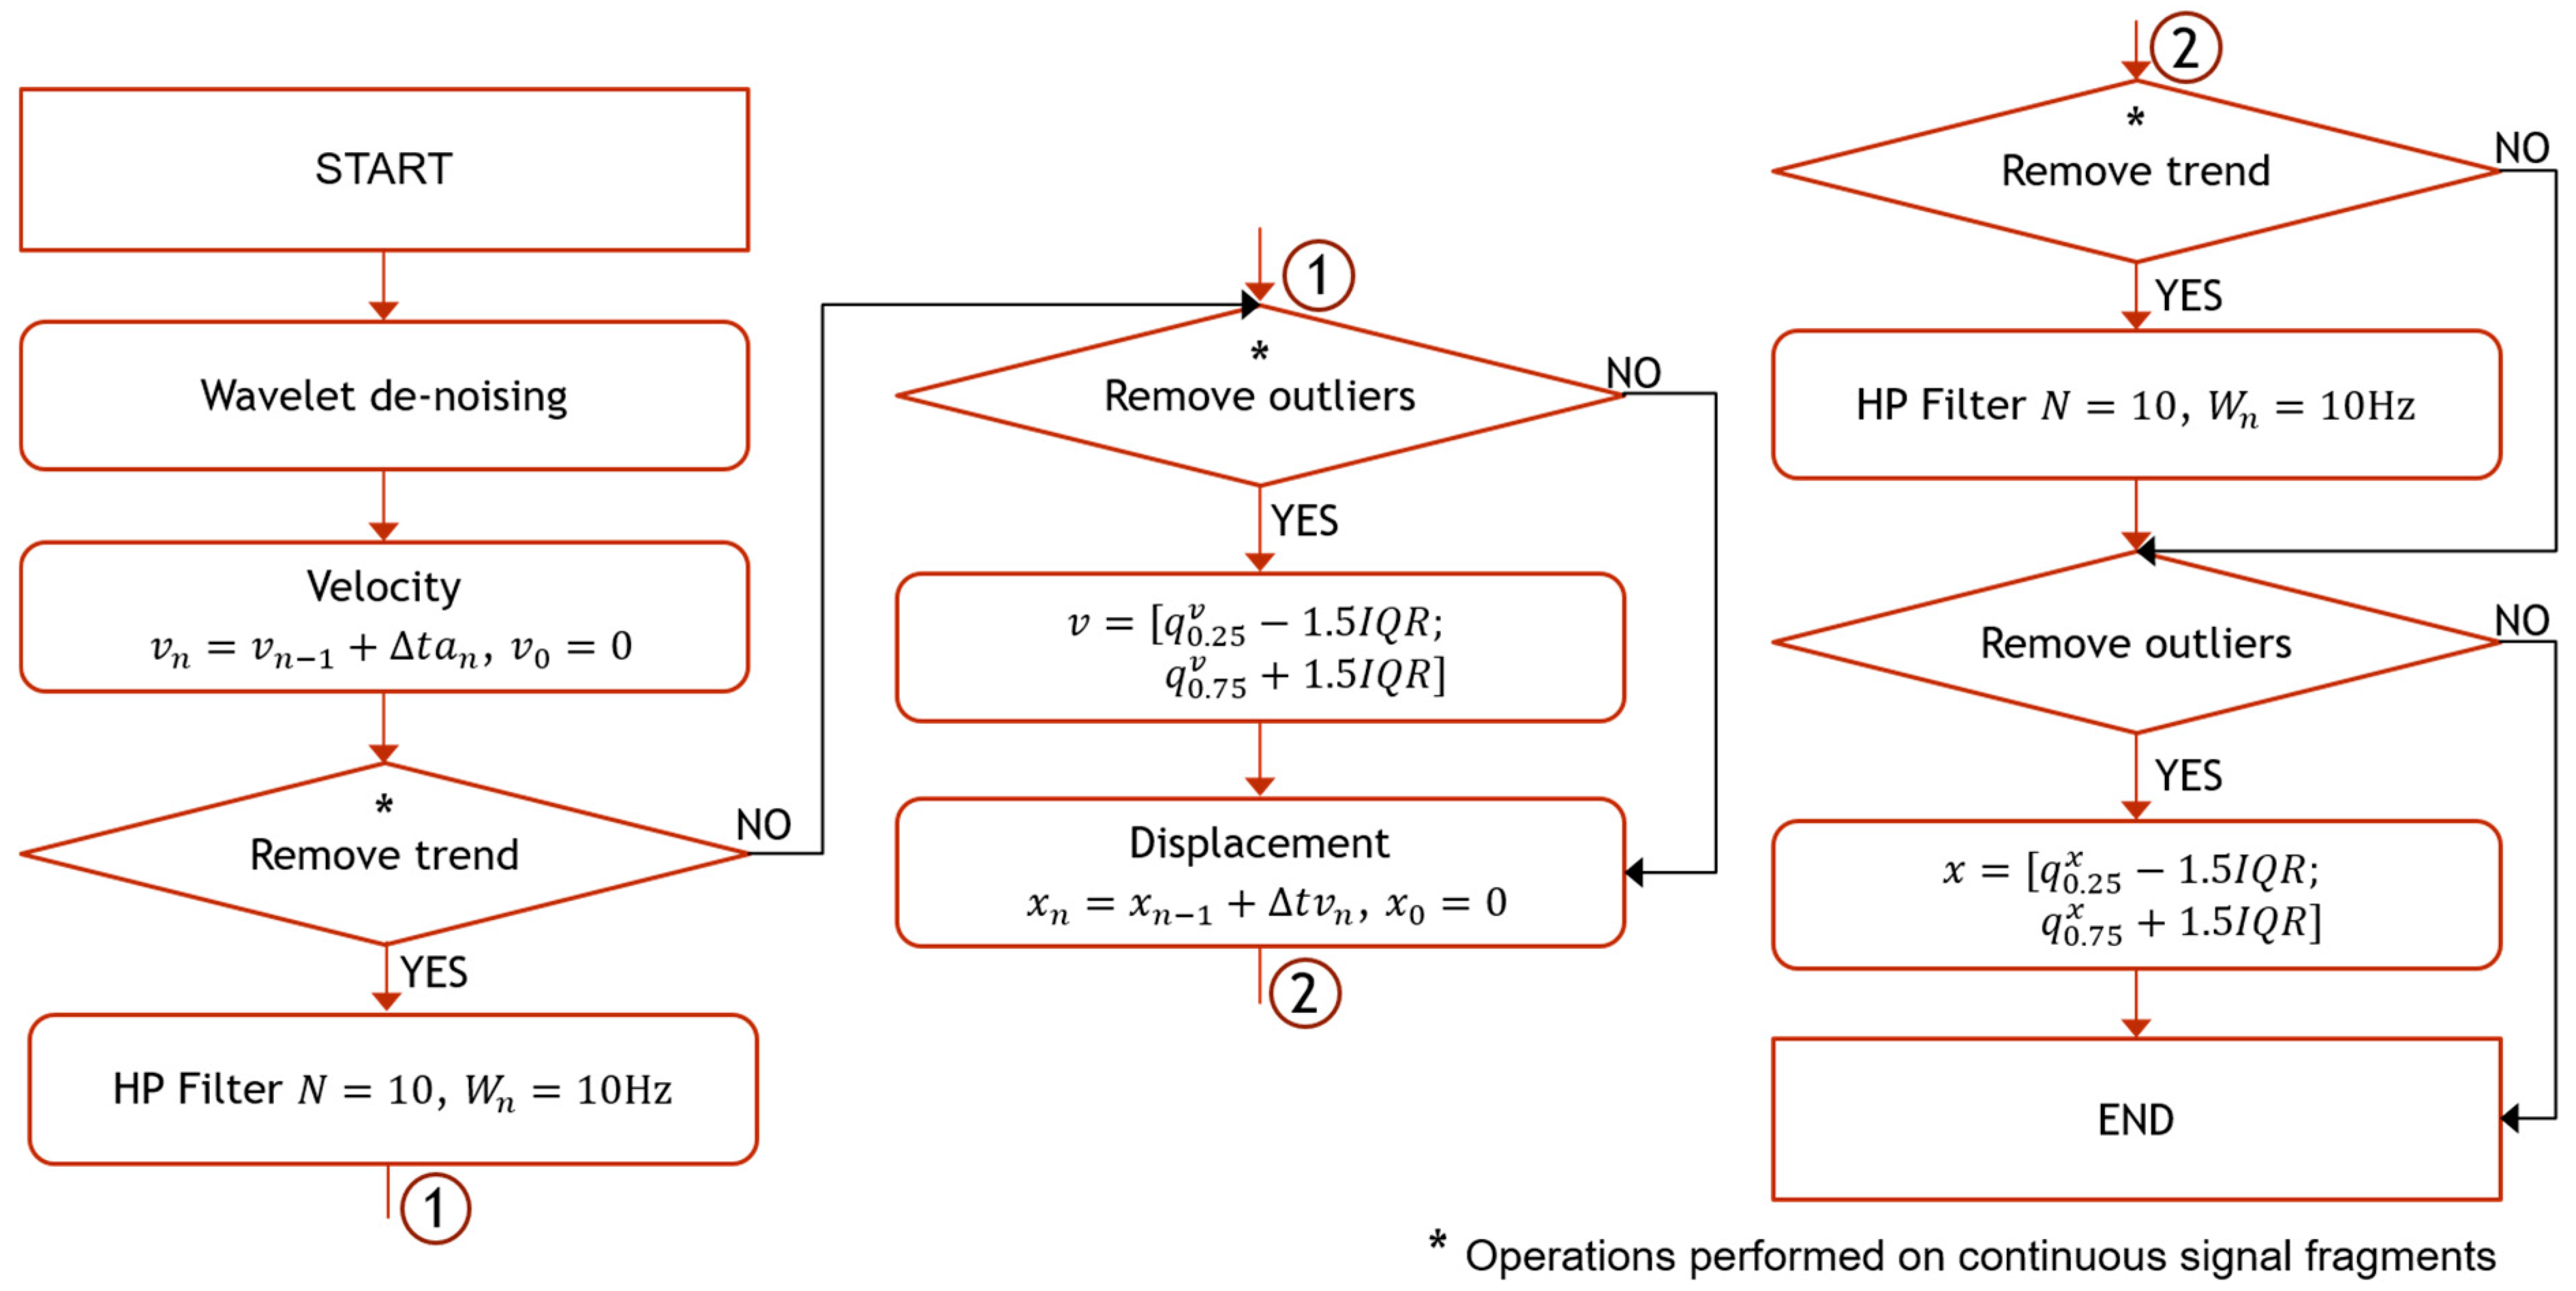
2.3. Trajectory Calculation Procedure
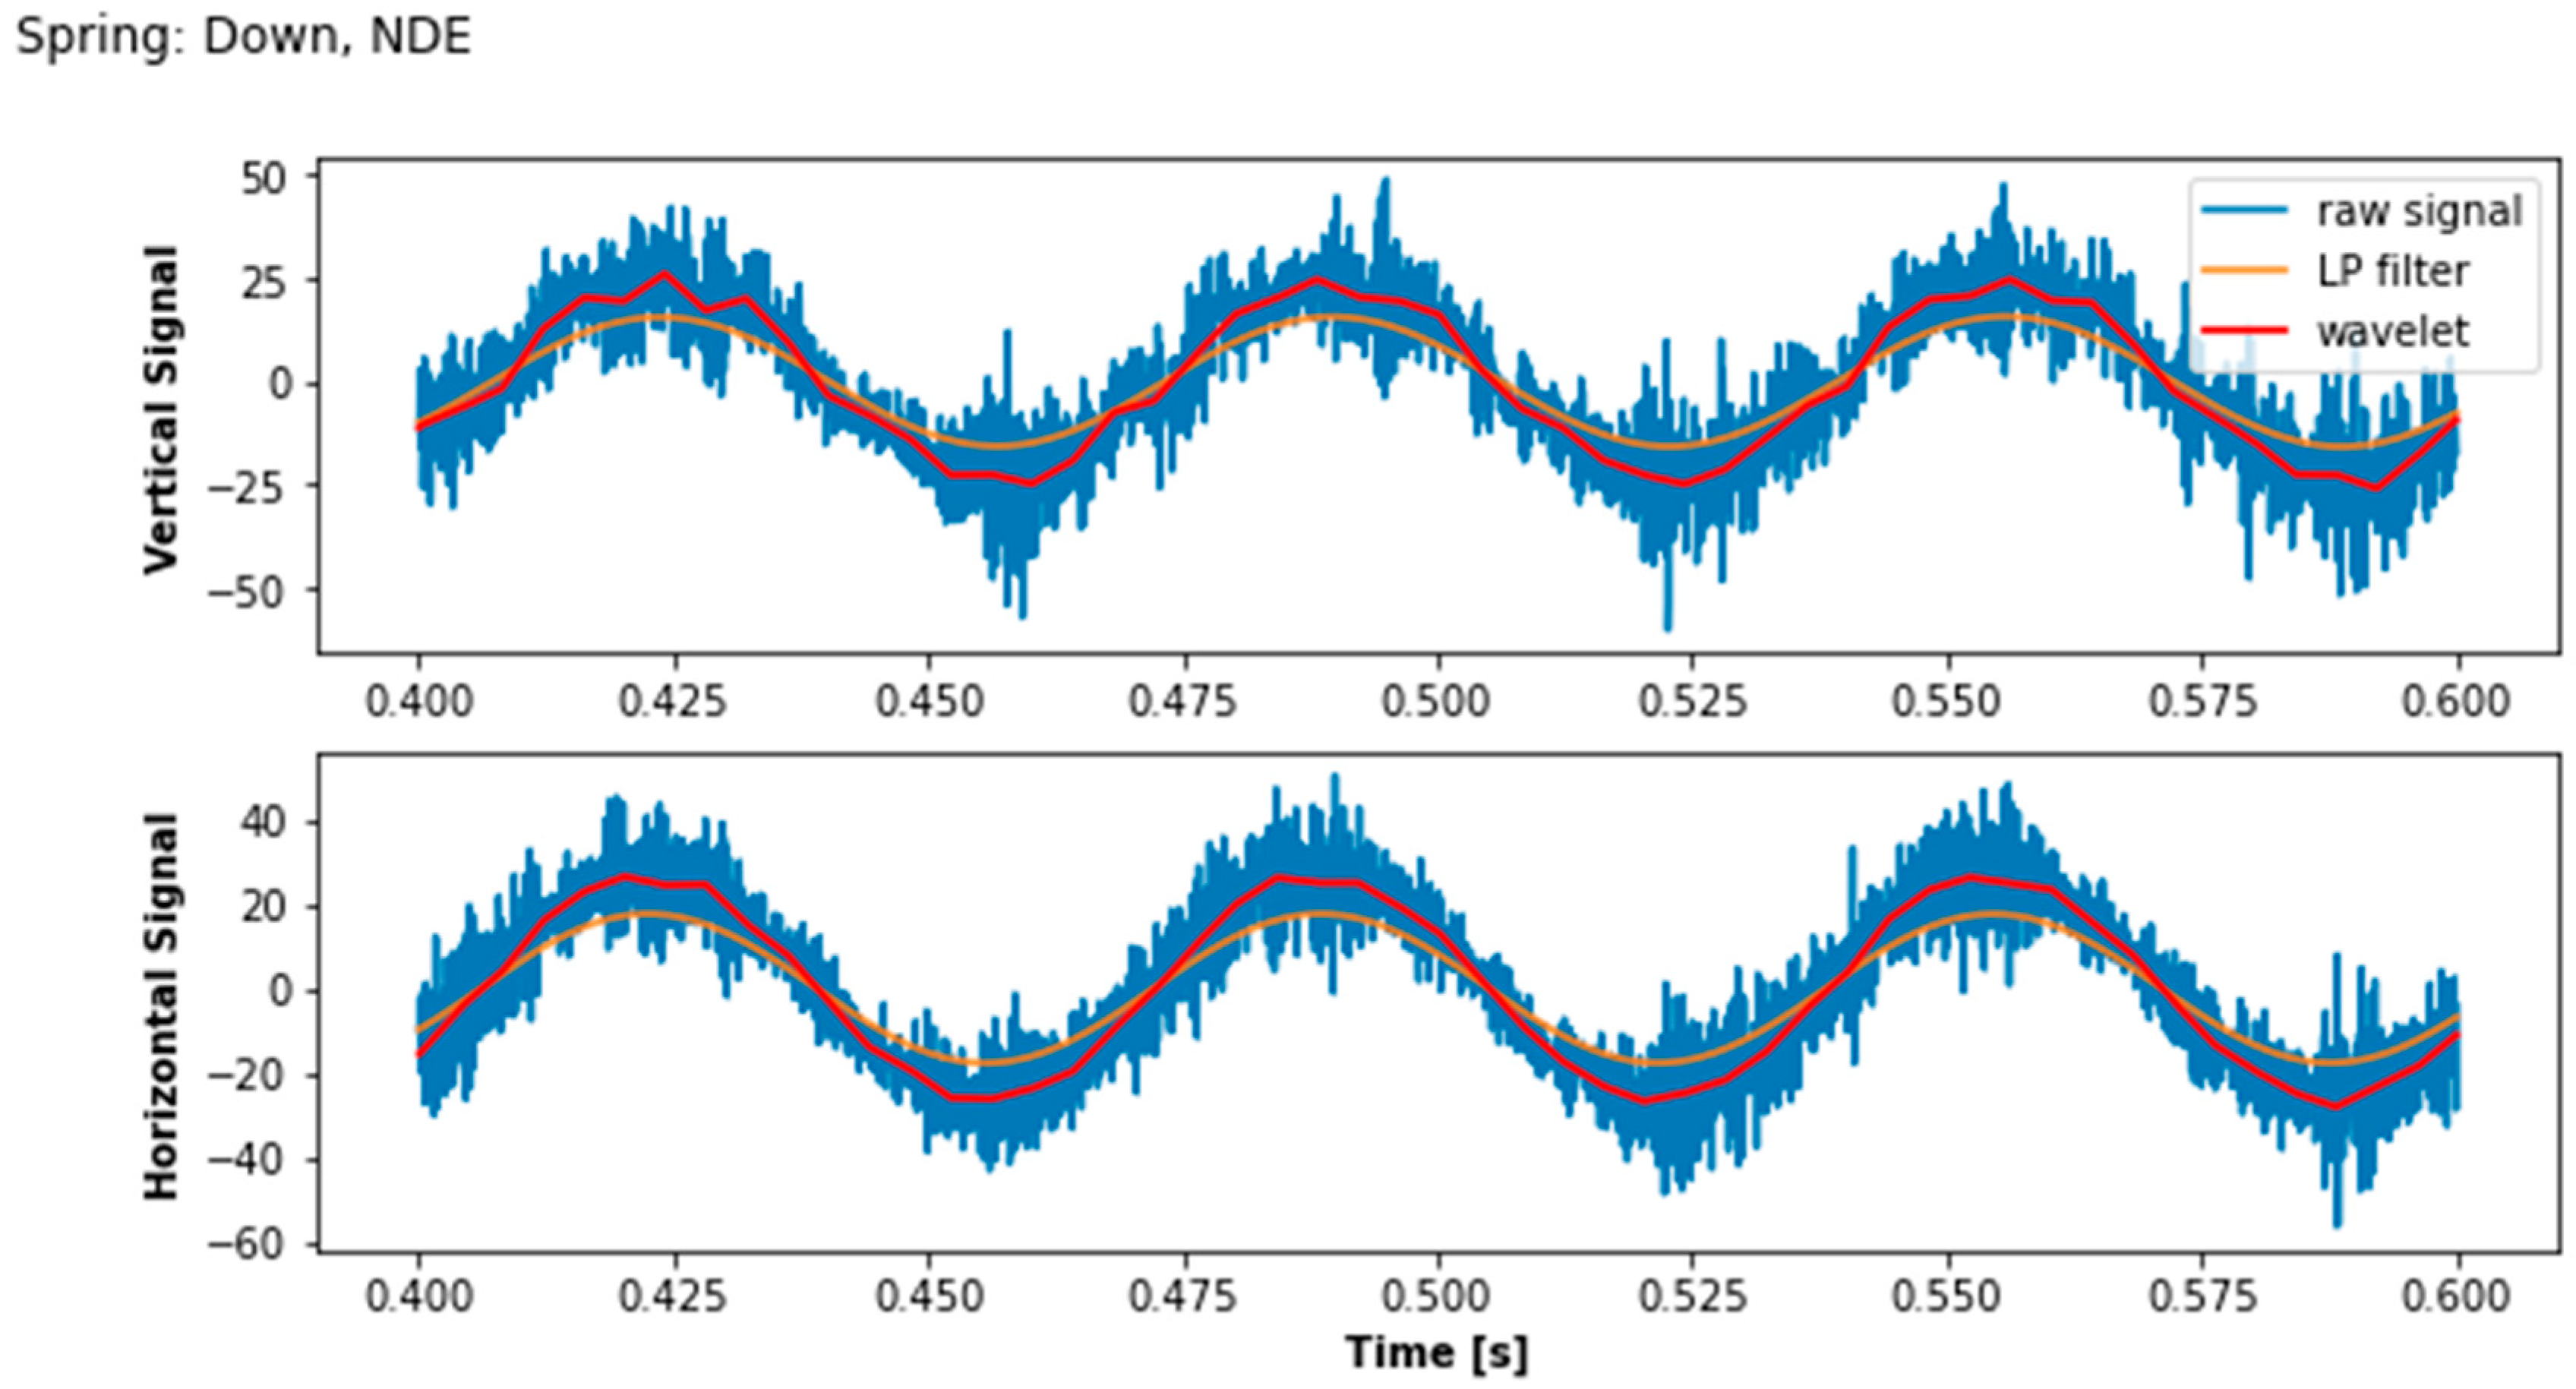
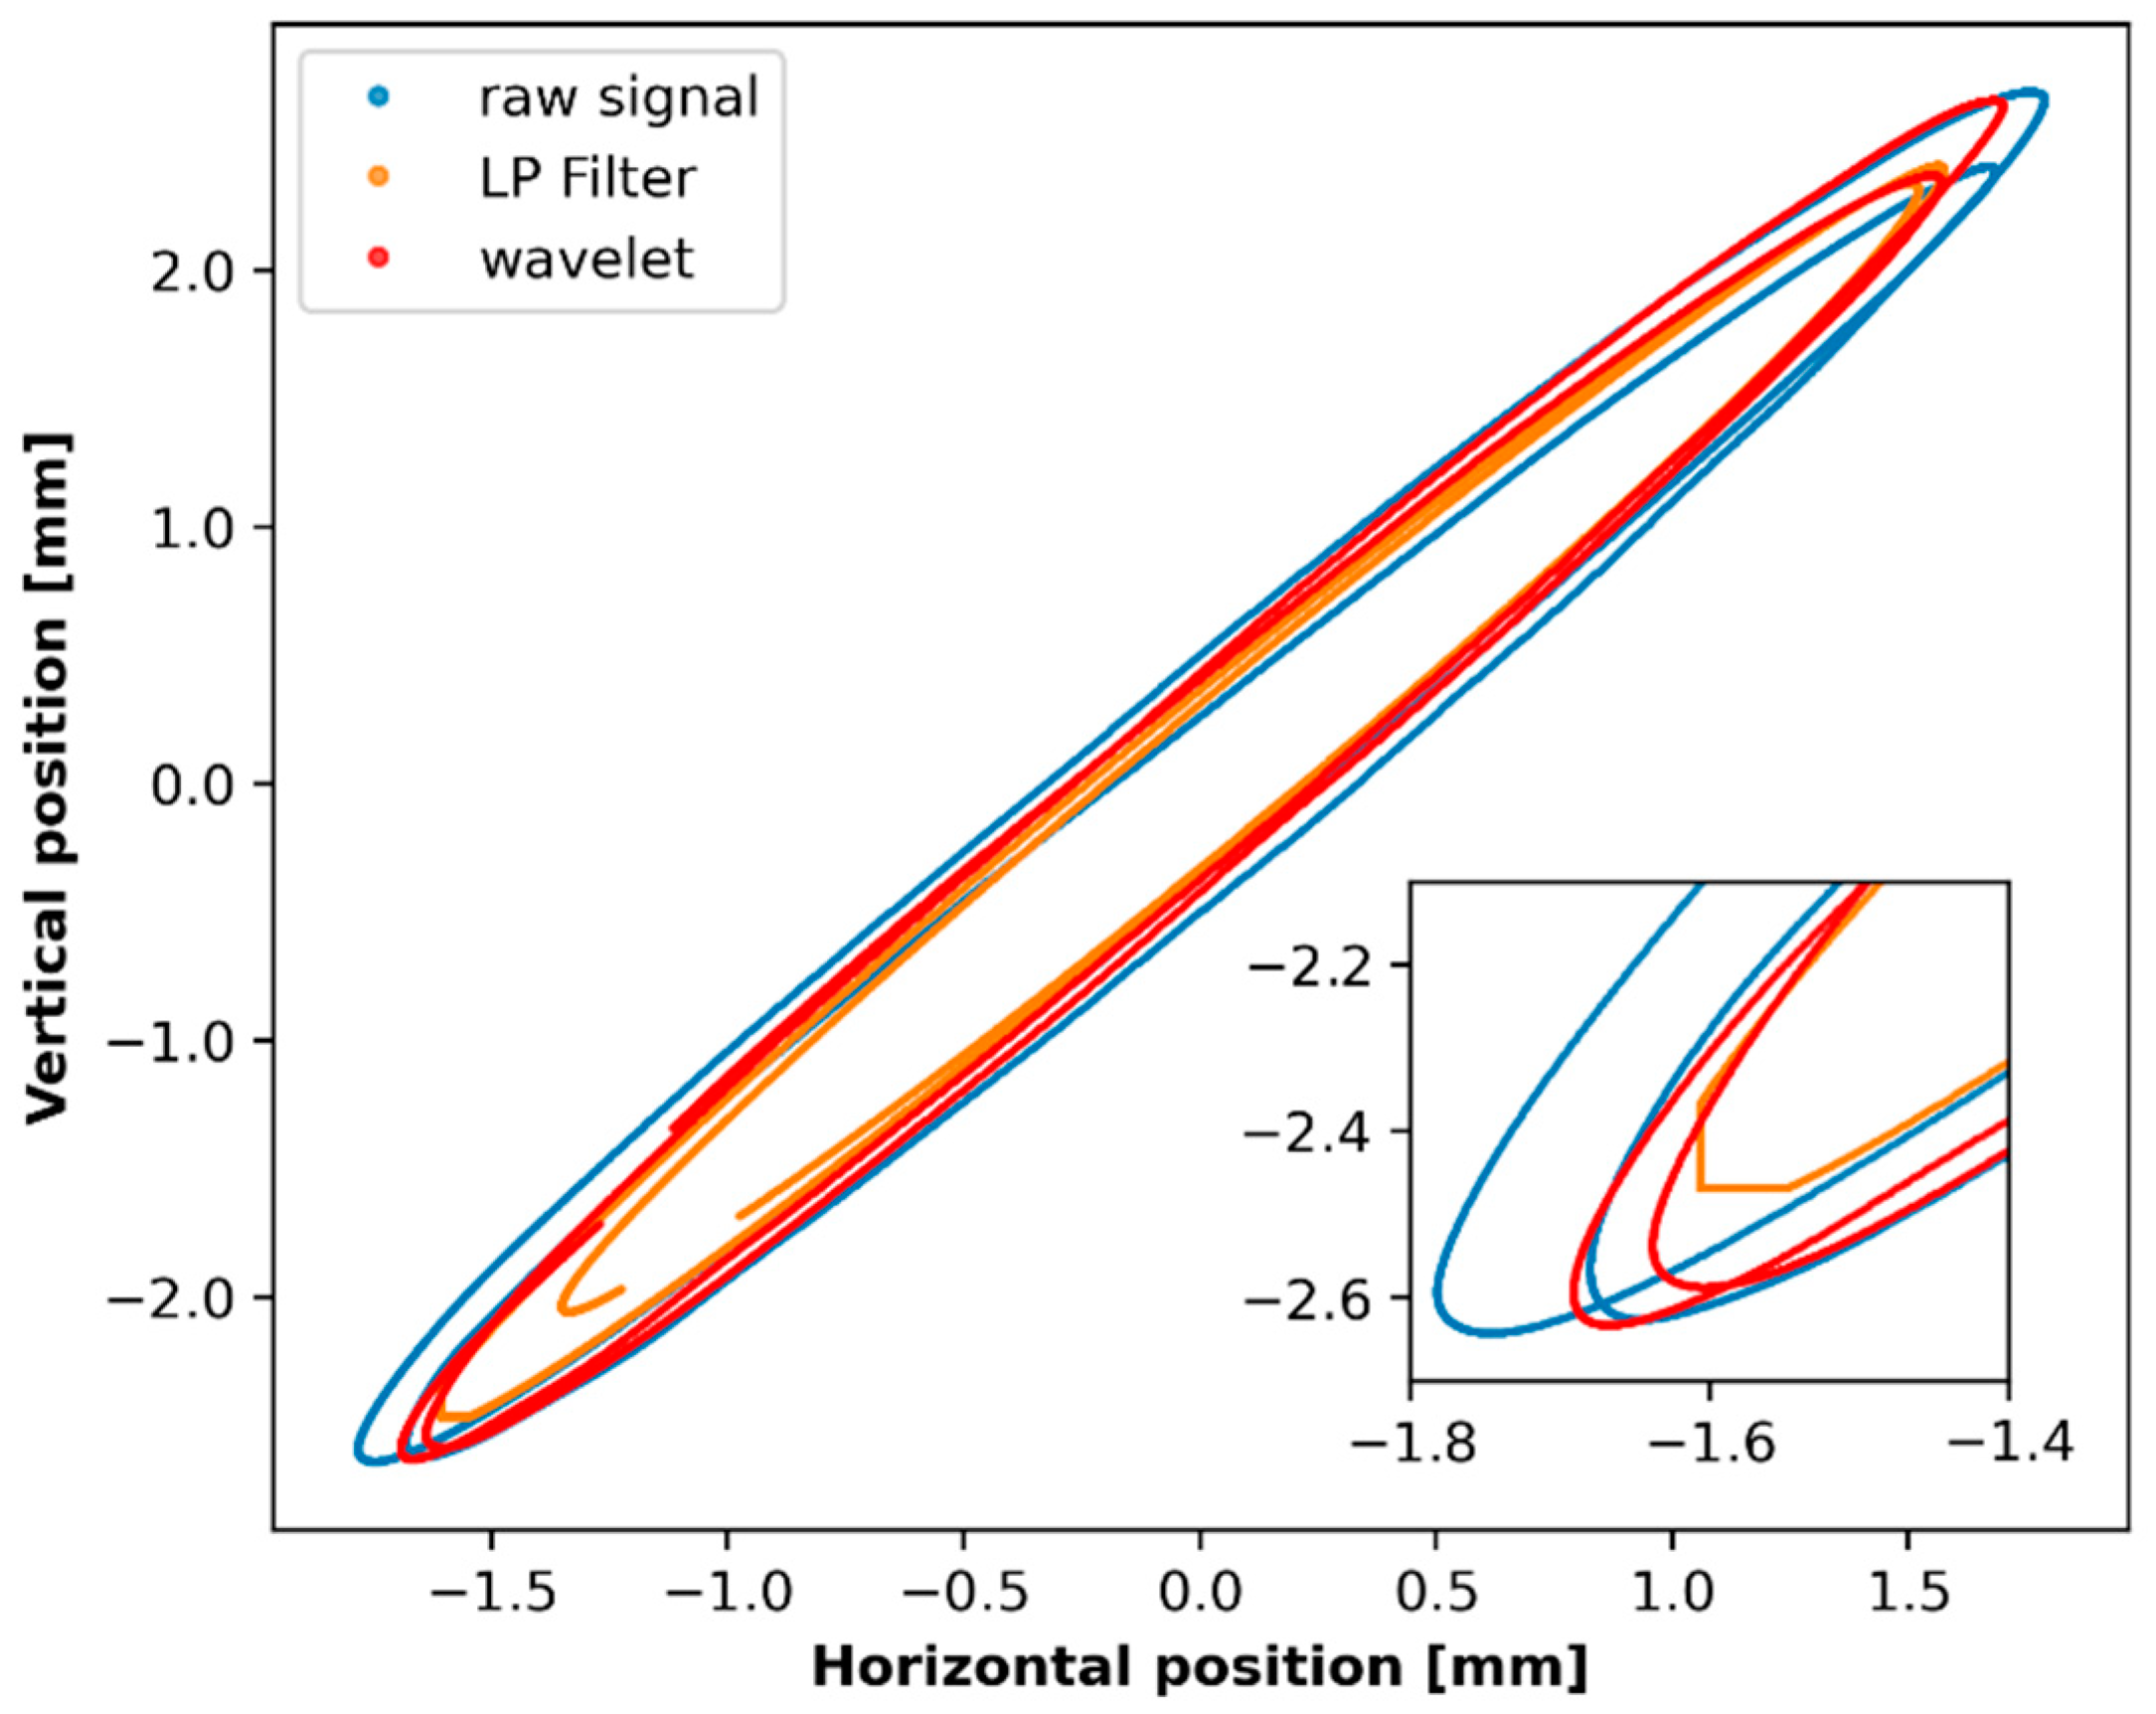
One of the most important diagnostic characteristics of the mining screen is its trajectory (also referred to as orbit). The trajectory of the mining screen can be determined by double integration of the original acceleration signal in vertical and horizontal directions. The processing steps for the vertical vibrations and the horizontal vibrations are shown in Figure 7. At the start, the input is the acceleration of the horizontal or vertical vibrations. The algorithm must be used separately for both directions. Next, outputs must be merged by time vectors to find trajectory.
The first step was denoising the signal. On the schema, the wavelet denoising is suggested, but some other methods and calculations without filtering at all will be compared later in this article. After wavelet denoising, the signal was integrated with the use of the Euler method, and the velocity was obtained. Then, the velocity values were filtered by a 10-order high-pass Butterworth filter to remove slowly changing trends in data, such as gravity. Significant outliers may appear due to possible breaks in the recorded acceleration signal. This is why Tukey’s fences technique [37] was applied to remove outliers. The signal was integrated once more with the use of the Euler method, and the coordinates of the screen were obtained. The trend and outliers in the coordinates were removed in the same way as in velocity signals.
After all the horizontal and vertical coordinates are connected by time vectors, the 2D vector of the position changed in time can be obtained for any period of time. The expected trajectory of the screen is an ellipse. For long-term trajectory analysis, the calculation of some key parameters of the ellipse can be useful. In order to achieve this, an ellipse equation was fitted to the trajectories obtained numerically. The following total least squares estimator for 2D ellipses was used:
{ x t = x c + a cos θ cos t b sin θ sin t y t = y c + a sin θ cos t + b cos θ sin t
d = ( x x t ) 2 + ( y y t ) 2 ,
where ( x t ,   y t ) is the closest point on the ellipse to (x, y). Thus, d is the shortest distance from the point to the ellipse. By minimizing d , the parameters of the elliptical trajectory can be calculated.

3. Results

In this section, the main results are shown. The results are presented for a selected spring set of a sieving screen.
The mother wavelet and level of decomposition were selected based on the Pearson correlation coefficient between the raw and denoised signals. The different methods of thresholding have been checked. Satisfactory results have been obtained for the biorthogonal 2.2 wavelet (bior2.2) with the sixth level of decomposition and the semi-soft thresholding method.
First, an example of filtering is shown, then the wavelet filtering is compared to some other method, and finally, the orbit calculation results are compared. In this article, we focus on the signals for springs, although similar analyses could be carried out for bearings. (See [26] for an interesting approach for bearings.) The wavelet filter was applied to the vibrational signal from the spring set of the sieving screen. In Figure 8, the signals before and after the wavelet denoising, as well as the noise, are presented.
In the first step of wavelet denoising, the acceleration signal was put into cascaded filters (see Figure 5) with the biorthogonal 2.2 wave. The bior2.2 wave is symmetric, not orthogonal, and biorthogonal. Next, for each detail coefficient, the semi-soft thresholding method was applied (Figure 6).
A key parameter that affects the performance of the wavelet filtering is the level of the filter, i.e., how many steps are performed in the procedure, shown in Figure 5. In Figure 8, a denoise level equal to 6 was chosen. In Figure 9, the denoising results obtained with different levels of wavelet decomposition are compared. As seen for lower values (n = 3), a significant amount of noise is present in the filtered signal. On the other hand, for higher values, either some details of the original signal are lost (n = 9), or the signal is distorted completely (n = 12). We have chosen an intermediate value (n = 6), which gives a smooth enough signal but does not distort it at the same time.
Next, the results of the wavelet filtering are compared with some other techniques of signal processing. In Figure 10, the wavelet denoising is compared with a moving-average filter (AVG), which is one of the obvious choices for smoothing data. The window size of the moving average was equal to 150 observations, which correspond to 0.003125 s. In general, wavelet filtering improves the signal-to-noise ratio of the original signal. It usually fits within the range of the original signal and, at the same time, provides a rather smooth line without small excitations. Slower changes in the signal are caught, while the faster excitations are filtered out. Although the output of the moving-average filter is also very smooth, it does not fit the original signal as well as the wavelet signal. In the case of larger excitations observed in the original signal, some major deviations between the original signal and the moving-average signal are observed. Those deviations seem to be small, but during further processing steps (for example, orbit calculations), such small errors can accumulate and lead to distorted results and inappropriate screen diagnostics.
Next, we compared the results of wavelet filtering with a low-pass filter. The original signal contains very slow excitation, corresponding to the movement of the whole screen with a frequency of 15 Hz. An obvious way to isolate these vibrations is to apply a low-pass filter. The results of the comparison are shown in Figure 11. The wavelet denoising is compared to a two-order low-pass Butterworth filter with a cutoff frequency equal to 18 Hz. The filter must be applied twice: once forward and once backward. The combined filter has a zero phase and a filter order twice that of the original. First of all, the results obtained by applying the low-pass filter are very smooth because, basically, it is a single harmonic excitation. On the other hand, the amplitude of the signal after low-pass filtering is lower, which can result in appropriate screen diagnostics. The wavelet results can be improved by smoothing or adaptive changing of the level or types of the wave.
Finally, the results obtained by filtering the original signal using different techniques were used to calculate the trajectory of the sieving screen. The trajectory was calculated using the procedure described before in Figure 6 using the raw signal, the signal processed by low-pass filtering, and the signal processed by wavelet filtering. The results are shown in Figure 12. The trajectory calculated on the raw signal is shown in blue, the one calculated after low-pass filtering in orange, and the one filtered by wavelets in red. Although the results are similar, some major differences may be observed. The main issue with the trajectory calculated based on the raw signal is the fact that it is diverging fast. The difference between the two rotations is significant, and it increases further with time. It is even more visible on a magnified plot. This can be explained by the accumulation of errors during the integration of the original signal. Both filtering techniques deal with this issue well: the divergence is much lower for both the low-pass and wavelet filters. Lower divergence of the trajectory will allow the use of longer parts of the signal for trajectory calculation, which will allow for the calculation of the parameters of a trajectory in a more reliable way.
When it comes to a comparison between the results of the low-pass filter and the wavelet filter, the main difference is the magnitude of the trajectory. The length of the trajectory in the case of low-pass filtering is significantly lower than in the case of wavelet filtering. This fact can lead to inappropriate diagnostics of the screen. Many methods for predictive maintenance rely on setting the alarm threshold for such parameters as the length of the trajectory. In the case of calculations using the low-pass filter, the measured parameters of the orbit may be lowered, which can potentially lead to unexpected failures due to the fact that the maximum safe magnitude was exceeded.

4. Discussion and Conclusions

In this paper, a novel procedure for technical condition monitoring of a vibrating screen in the presence of impulsive noise has been presented. The methods found in the literature are mainly dedicated to noise reduction for the purpose of detecting local damage to rolling bearings. In this paper, we have focused on springs. One of the popular methods of assessing the technical condition of springs is to analyze the trajectory of their movement. In order to estimate orbits, it is necessary to have access to two orthogonal vibration signals. Unfortunately, the presence of impulsive background noise due to large pieces of ore falling down distorts these estimates. One solution may be to properly smooth and filter the raw signal.
In this article, a wavelet filtering technique is applied for this purpose. The filtering procedure, as well as the procedures for orbit calculation and parametrization, were described. Then, these procedures were applied to vibrational data collected in an ore processing plant from a machine operating in industrial conditions. The results of wavelet filtering are compared with other methods, such as moving-average filtering and low-pass filtering. Next, the trajectory was calculated using different preprocessing techniques, and the results were compared.
Wavelet filtering has shown some improvement compared to both moving-average and low-pass filtering. When compared with the moving-average filter, the wavelet filtering better represents the original signal. The moving average was very sensitive to outliers in the original signal, while the wavelet-filtered signal was, in most cases, within the original signal. Compared to the low-pass filter, the wavelet filter better conserves the magnitude of the original signal.
When it comes to trajectory calculation, preprocessing using wavelet filtering also gave some advantages. Compared to the calculation based on unfiltered data, better convergence of the trajectory was obtained. It will allow for the use of more data for parametrization of the trajectory (fitting and calculation of an ellipse equation to numerically calculated trajectory), which will give more reliable results. On the other hand, compared to low-pass filtering, the magnitude of the orbit calculated using wavelet filtering is closer to the original one, which may allow one to avoid exceeding the working parameters of the screen.
Of course, wavelet filtering has some downsides. First of all, an appropriate decomposition scaling function and the level of the filter need to be chosen properly, which can be time-consuming. However, after optimization of these parameters, wavelet filtering gives good results compared to some other smoothing and filtering techniques. In the future, it is planned to compare the results with some more sophisticated filtering techniques.

Author Contributions

Conceptualization, N.D.-M., S.A. and P.S.; Data curation, N.D.-M. and S.A.; Formal analysis, P.S.; Investigation, S.A. and P.S.; Methodology, N.D.-M., S.A. and P.S.; Project administration, S.A. and P.S.; Software, N.D.-M. and S.A.; Supervision, S.A. and P.S.; Validation, S.A. and P.S.; Visualization, N.D.-M., S.A. and P.S.; Writing—original draft, N.D.-M., S.A. and P.S.; Writing—review and editing, S.A. and P.S. All authors will be informed about each step of manuscript processing, including submission, revision, revision reminder, etc., via emails from our system or the assigned Assistant Editor. All authors have read and agreed to the published version of the manuscript.

Funding

This research was funded by EIT RawMaterials GmbH under Framework Partnership Agreement No. 18253 (OPMO—Operation monitoring of mineral crushing machinery).

Data Availability Statement

Restrictions apply to the availability of these data. Data was obtained from KGHM Polska Miedź S.A. and are available from the authors with the permission of KGHM Polska Miedź S.A.

Conflicts of Interest

The authors declare no conflict of interest. The funders had no role in the design of the study; in the collection, analyses, or interpretation of data; in the writing of the manuscript; or in the decision to publish the results.

References

  1. Lanke, A.A.; Hoseinie, S.H.; Ghodrati, B. Mine production index (MPI)-extension of OEE for bottleneck detection in mining. Int. J. Min. Sci. Technol. 2016, 26, 753–760. [Google Scholar] [CrossRef]
  2. Gackowiec, P.; Podobińska-Staniec, M. IoT platforms for the Mining Industry: An Overview. Inżynieria Miner. 2019, 21, 530–550. [Google Scholar]
  3. Kruczek, P.; Gomolla, N.; Hebda-Sobkowicz, J.; Michalak, A.; Śliwiński, P.; Wodecki, J.; Stefaniak, P.; Wyłomańska, A.; Zimroz, R. Predictive maintenance of mining machines using advanced data analysis system based on the cloud technology. In Proceedings of the 27th International Symposium on Mine Planning and Equipment Selection-MPES, Santiago, Chile, 20-22 November, 2018; Springer: Cham, Switzerland, 2019; pp. 459–470. [Google Scholar]
  4. Gubbi, J.; Buyya, R.; Marusic, S.; Palaniswami, M. Internet of Things (IoT): A vision, architectural elements, and future directions. Future Gener. Comput. Syst. 2013, 29, 1645–1660. [Google Scholar] [CrossRef] [Green Version]
  5. Dong, L.; Mingyue, R.; Guoying, M. Application of internet of things technology on predictive maintenance system of coal equipment. Procedia Eng. 2017, 174, 885–889. [Google Scholar] [CrossRef]
  6. Molaei, F.; Rahimi, E.; Siavoshi, H.; Afrouz, S.G.; Tenorio, V. A comprehensive review on internet of things (IoT) and its implications in the mining industry. Am. J. Eng. Appl. Sci. 2020, 13, 499–515. [Google Scholar] [CrossRef]
  7. Schlemmer, G. Principles of Screening and Sizing; Quarry Acadamy: San Antonio, TX, USA, 2016. [Google Scholar]
  8. Krot, P.; Zimroz, R. Methods of Springs Failures Diagnostics in Ore Processing Vibrating Screens. In IOP Conference Series: Earth and Environmental Science; IOP Publishing: Bristol, UK, 2019; Volume 362, p. 012147. [Google Scholar]
  9. Kahraman, M.M.; Rogers, W.P.; Dessureault, S. Bottleneck identification and ranking model for mine operations. Prod. Plan. Control. 2020, 31, 1178–1194. [Google Scholar] [CrossRef]
  10. SKF—Evolution Technology Magazine from SKF Fault Detection for Mining and Mineral Processing Equipment. 2001. Available online: http://evolution.skf.com/fault-detection-for-mining-and-mineral-processing-equipment-2/ (accessed on 22 July 2021).
  11. Elmodis—Tool Created for Industry Official Website of the Manufacturer of Diagnostic Equipment. 2020. Available online: https://elmodis.com/en/# (accessed on 1 July 2021).
  12. Metso—ScreenWatch® Screen Condition Monitoring Brochure. 2020. Available online: https://pdf.directindustry.com/pdf/metso-corporation/screenwatch-screen-condition-monitoring-brochure/9344-774332.html (accessed on 22 July 2021).
  13. Schaeffler—FAG SmartCheck Machinery Moniroting for Every Machine. 2012. Available online: https://www.schaeffler.com/remotemedien/media/_shared_media/08_media_library/01_publications/schaeffler_2/tpi/downloads_8/tpi_214_en_us.pdf (accessed on 22 July 2021).
  14. SchenckPeocess—CONiQ® Condition Monitoring in Mineral Processing. The Power to Predict! 2020. Available online: https://www.schenckprocess.com/data/en/files/513/bvp2135en.pdf (accessed on 22 July 2021).
  15. OPMO: Operation Monitoring of Mineral Crushing Machinery EIT Raw Materials Website. 2020. Available online: https://eitrawmaterials.eu/project/opmo/ (accessed on 22 July 2021).
  16. Krot, P.; Zimroz, R.; Michalak, A.; Wodecki, J.; Ogonowski, S.; Drozda, M.; Jach, M. Development and Verification of the Diagnostic Model of the Sieving Screen. Shock. Vib. 2020, 2020, 1–14. [Google Scholar] [CrossRef]
  17. Gąsior, K.; Urbańska, H.; Grzesiek, A.; Zimroz, R.; Wyłomańska, A. Identification, decomposition and segmentation of impulsive vibration signals with deterministic components—A sieving screen case study. Sensors 2020, 20, 5648. [Google Scholar] [CrossRef] [PubMed]
  18. Cai, Z.; Xu, Y.; Duan, Z. An alternative demodulation method using envelope-derivative operator for bearing fault diagnosis of the vibrating screen. J. Vib. Control. 2018, 24, 3249–3261. [Google Scholar] [CrossRef]
  19. Nowicki, J.; Hebda-Sobkowicz, J.; Zimroz, R.; Wylomanska, A. Local Defect Detection in Bearings in the Presence of Heavy-Tailed Noise and Spectral Overlapping of Informative and Non-Informative Impulses. Sensors 2020, 20, 6444. [Google Scholar] [CrossRef]
  20. Wodecki, J.; Michalak, A.; Zimroz, R. Local damage detection based on vibration data analysis in the presence of Gaussian and heavy-tailed impulsive noise. Measurement 2021, 169, 108400. [Google Scholar] [CrossRef]
  21. Skoczylas, A.; Anufriiev, S.; Stefaniak, P. Oversized ore pieces detection method based on computer vision and sound processing for validation of vibrational signals in diagnostics of mining screen. SGEM 2020, 20, 829–839. [Google Scholar] [CrossRef]
  22. Aminghafari, M.; Cheze, N.; Poggi, J. Multivariate denoising using wavelets and principal component analysis. Comput. Stat. Data Anal. 2006, 50, 2381–2398. [Google Scholar] [CrossRef]
  23. Dautov, C.P.; Ozerdem, M.S. Wavelet transform and signal denoising using Wavelet method. In Proceedings of the 26th Signal Processing and Communications Applications Conference (SIU), Izmir, Turkey, 2–5 May 2018. [Google Scholar]
  24. Jiang, J.; Guo, J.; Fan, W.; Chen, O. An Improved Adaptive Wavelet Denoising Method Based on Neighboring Coefficients. In Proceedings of the 8th World Congress on Intelligent Control and Automation, Jinan, China, 6–9 July 2010. [Google Scholar]
  25. Jha, R.K.; Swami, P.D.; Singh, D. Comparison and Selection of Wavelets for Vibration Signals Denoising and Fault Detection of Rotating Machines Using Neighborhood Correlation of SWT Coefficients. In Proceedings of the International Conference on Advanced Computation and Telecommunication (ICACAT), Bhopal, India, 28–29 December 2018. [Google Scholar]
  26. Qin, Z.; Chen, L.; Bao, X. Wavelet Denoising Method for Improving Detection Performance of Distributed Vibration Sensor. IEEE Photonics Technol. Lett. 2012, 24, 542–544. [Google Scholar] [CrossRef]
  27. Gao, H.Y.; Bruce, A.G. Waveshrink with Firm Shrinkage. Stat. Sin. 1997, 7, 855–874. [Google Scholar]
  28. Galiana-Merino, J.J.; Rosa-Herranz, J.; Giner, J.; Molina, S.; Botella, F. De-noising of short-period seismograms by wavelet packet transform. Bull. Seismol. Soc. Am. 2003, 93, 2554–2562. [Google Scholar] [CrossRef]
  29. Botella, F.; Rosa-Herranz, J.; Giner, J.J.; Molina, S.; Galiana-Merino, J.J. A realtime earthquake detector with prefiltering by wavelets. Comput. Geosci. 2003, 29, 911–919. [Google Scholar] [CrossRef]
  30. Zhang, H.; Thurber, C.; Rowe, C. Automatic P-wave arrival detection and picking with multiscale wavelet analysis for single-component recordings. Bull. Seismol. Soc. Am. 2003, 93, 1904–1912. [Google Scholar] [CrossRef] [Green Version]
  31. Parolai, S.; Galiana-Merino, J.J. Effect of transient seismic noise on estimates of H/V spectral ratios. Bull. Seismol. Soc. Am. 2006, 96, 228–236. [Google Scholar] [CrossRef] [Green Version]
  32. Hafez, A.G.; Khan, M.T.; Kohda, T. Clear P-wave arrival of weak events and automatic onset determination using wavelet filter banks. Digit. Signal Process. 2010, 20, 715–723. [Google Scholar] [CrossRef]
  33. Beenamol, M.; Prabavathy, S.; Mohanalin, J. Wavelet based seismic signal denoising using Shannon and Tsallis entropy. Comput. Math. Appl. 2012, 64, 3580–3593. [Google Scholar] [CrossRef] [Green Version]
  34. Galiana-Merino, J.J.; Rosa-Herranz, J.L.; Rosa-Cintas, S.; Martinez-Espla, J.J. SeismicWaveTool: Continuous and discrete wavelet analysis and filtering for multichannel seismic data. Comput. Phys. Commun. 2013, 184, 162–171. [Google Scholar] [CrossRef]
  35. Gaci, S. The use of wavelet-based denoising techniques to enhance the first-arrival picking on seismic traces. IEEE Trans. Geosci. Remote. Sens. 2013, 52, 4558–4563. [Google Scholar] [CrossRef]
  36. Shang, X.; Li, X.; Weng, L. Enhancing seismic P phase arrival picking based on wavelet denoising and kurtosis picker. J. Seismol. 2018, 22, 21–33. [Google Scholar] [CrossRef]
  37. Tukey, J.W. Exploratory Data Analysis; Addison-Wesley: Boston, MA, USA, 1997; ISBN 978-0-201-07616-5. OCLC 3058187. [Google Scholar]
  38. Donoho, D. De-noising by soft-thresholding. IEEE Trans Inf Theory 1995, 41, 613–627. [Google Scholar] [CrossRef] [Green Version]
  39. Stein, C.M. Estimation of the mean of a multivariate normal distribution. Ann Stat. 1981, 9, 1135–1151. [Google Scholar] [CrossRef]
  40. To, A.C.; Moore, J.R.; Glaser, S.D. Wavelet denoising techniques with applications to experimental geophysical data. Signal Process. 2009, 89, 144–160. [Google Scholar] [CrossRef]
  41. Valencia, D.; Orejuela, D.; Salazar, J.; Valencia, J. Comparison Analysis Between Rigrsure, Sqtwolog, Heursure and Minimaxi Techniques Using Hard and Soft Thresholding Methods. In Proceedings of the 2016 XXI Symposium on Signal Processing, Images and Artificial Vision (STSIVA), Bucaramanga, Colombia, 31 August–2 September 2016; IEEE Xplore: New York, NY, USA, 2016; ISBN 978-1-5090-3798-8. [Google Scholar]
  42. Zhao, R.M.; Cui, H.M. Improved Threshold Denoising Method Based on Wavelet Transform. In Proceedings of the 7th International Conference on Modelling, Identification and Control (ICMIC 2015), Sousse, Tunisia, 18–20 December 2015. [Google Scholar]
Figure 1. The schema of the vibrating screen.
Minerals 11 01076 g001
Figure 2. The investigated technical object—vibrating screen: (a) view of the whole device; (b) feed; (c) upper sieving deck.
Minerals 11 01076 g002
Figure 3. Vibrational signal recorded from a single accelerometer installed on the vibrating screen during (a) one-minute-long measurement session (b) and a close-up look.
Minerals 11 01076 g003
Figure 4. The frequency spectrum of the acceleration signal: (a) low-frequency range; (b) high-frequency range.
Minerals 11 01076 g004
Figure 5. A conceptual schema of a multilevel wavelet decomposition procedure.
Minerals 11 01076 g005
Figure 6. Semi-soft thresholding.
Minerals 11 01076 g006
Figure 7. Procedure for determining the displacement based on a one-dimensional vibration acceleration signal (horizontal or vertical).
Minerals 11 01076 g007
Figure 8. Wavelet denoising of the vibrational signal recorded on the spring.
Minerals 11 01076 g008
Figure 9. Comparison of different levels of signal denoising using a multilevel wavelet transformation. Blue line shows the original signal; red line shows the filtered signal.
Minerals 11 01076 g009
Figure 10. Comparison of wavelet filtering to signal smoothing using the moving average filter for vertical and horizontal orientations of accelerometers.
Minerals 11 01076 g010
Figure 11. Comparison of wavelet filtering to low-pass filtering for vertical and horizontal orientations of accelerometers.
Minerals 11 01076 g011
Figure 12. Orbits calculated using different kinds of data filtering techniques: no filtering (blue line), low-pass filtering (orange line), and wavelet filtering (red line).
Minerals 11 01076 g012
Publisher’s Note: MDPI stays neutral with regard to jurisdictional claims in published maps and institutional affiliations.

