Article

Diagnosis and Optimization of Gold Ore Flotation Circuit via Linear Circuit Analysis and Mass Balance Simulation

1
Department of Chemical and Biomolecular Engineering, Korea Advanced Institute of Science and Technology (KAIST), 291 Daehak-ro, Daejeon 34141, Korea
2
Department of Earth Resources and Environmental Engineering, Hanyang University, 222 Wangsimni-ro, Seoul 04763, Korea
3
Resources Recovery Research Center, Mineral Resources Division, Korea Institute of Geoscience & Mineral Resources (KIGAM), 124 Gwahak-ro, Daejeon 34132, Korea
4
Gold Mining Division, Suncement Co., Ltd., Haenam-gun 59006, Korea
5
Department of Resources Recycling, University of Science and Technology (UST), 217 Gajeong-ro, Daejeon 34113, Korea
*
Authors to whom correspondence should be addressed.
These authors contributed equally to this work.
Minerals 2021, 11(10), 1065; https://doi.org/10.3390/min11101065
Submission received: 2 September 2021 / Revised: 25 September 2021 / Accepted: 27 September 2021 / Published: 29 September 2021
(This article belongs to the Special Issue Sustainable Production of Metals for Low-Carbon Technologies)

Abstract

:
The aim of this study is to diagnose and optimize a closed multistage gold ore flotation circuit in an operational industrial plant. Linear circuit analysis (LCA), a partition-based model, and a mass balance model using flotation first-order kinetics are employed to diagnose the current process. The result shows that the current circuit operates with high recovery but the gold grade of the final concentrate is low owing to the low buoyancy ratio. Hence, several alternative circuits with different streamlines and cell arrangements are proposed and simulated using LCA and a mass balance model. The result suggests that if the current process is changed to an alternative circuit in which the floated product stream of the rougher bank is changed, then the gold grade of the concentrate can be improved by 128%. Finally, the current circuit is optimized by changing it to an alternative circuit. This study provides a methodology for adapting the simulation of optimization for the flotation circuit of an industrial plant via LCA and mass balance simulation.

1. Introduction

Efficient metal production is in demand owing to an increase in metal demand worldwide and the depletion of resources. Accordingly, methods to improve the economic efficiency of metal production have garnered attention [1,2,3,4,5,6,7]. The production of metal from minerals involves the beneficiation process, i.e., mineral processing, which physically separates the target mineral (i.e., concentrate) and gangue (i.e., tailing). It comprises several unit processes, such as comminution, classification, and separation [8,9]. In the separation process, flotation is the final step that determines the efficient recovery of the concentrate, which is the final product of beneficiation [10,11,12]. In general, the flotation process comprises a complex multistage closed circuit, which improves the grade and recovery of concentrates such as roughers, scavengers, and cleaner circuits [13,14,15]. Hence, the installation and operation of a plant through an optimal design for a highly efficient separation process is crucial, particularly in the froth flotation step [16,17,18,19,20,21,22,23,24,25]. Therefore, it is believed that the overall energy-saving effect should be achieved through an optimized flotation process owing to the improvement in productivity. However, because most large-scale plant flotation processes in operation have been preinstalled and operate continuously, process optimization for an efficient concentrate production is difficult to control [1,4,15]. To optimize flotation, the floatability of unit cells was evaluated primarily via laboratory-scale experiments [3]. However, this method is prone to errors when scaled up to accommodate the plant. Furthermore, it is expensive to configure and test multiple plant-scale flotation circuits [14,19,26,27].
Hence, the diagnosis and optimization of circuits via computer simulations have been proposed [12,14,16,17,18,19]. A general diagnostic and optimization model of the flotation process includes a mass balance model based on flotation kinetics [2,28]. Furthermore, Noble and Luttrel [26] proposed a linear circuit analysis (LCA) as a process diagnosis and optimization model. This methodology is a partition-based separation model for estimating the arrangement and interconnection of unit processes in a circuit. This evaluation method does not require many experiments or knowledge associated with process variables, and it can represent the separation efficiency of the circuit as one indicator [26]. Therefore, the diagnosis and optimization of the flotation circuit can be performed easily and more accurately if a mass balance model and LCA are applied.
In this study, the flotation process of a beneficiation plant during operation was diagnosed and optimized using LCA and mass balance simulations. The target circuit was that of a flotation process in an industrial gold ore beneficiation plant in Jeollanam-do province, Korea. This beneficiation plant was first introduced by Lee et al. [29]. The plant was not optimized and diagnosed when it was initially installed. In addition, the flotation process was primarily operated based on the operator’s experience. Hence, it is difficult to predict the recovery and grade of the concentrate based on changes in the quality and throughput of the ore, and process optimizations such as circuit changes and flotation cell addition are futile. Therefore, the abovementioned target circuit was selected as the test bed for this study. The flotation circuit information, such as the mineral composition of ores, throughput, and cell size, was used in a mass balance simulation to calculate the gold grade of the concentrate and the recovery. The simulation results were validated by comparing them with industrial data. Subsequently, several alternative circuits for the flotation process were proposed for process optimization. Finally, the separation efficiency of the alternative circuits and the current process were compared and analyzed using LCA and mass balance simulations. The circuit was optimized by adopting the process that afforded the best separation efficiency.

2. Materials and Methods

2.1. Materials and Reagents

Gold ores were obtained from the Gasado gold mine in Jeollanam-do, Korea. It is known that the gold ore consists of pyrite, muscovite, and quartz [30]. The gold ores were initially crushed using a jaw crusher and a cone crusher, and then ground using a ball mill in the gold ore beneficiation plant. Water was obtained from the plants. The particle sizes of 50% passing (d50) and 80% passing (d80) were 35 and 94 μm, respectively. Potassium amyl xanthate (KAX, C5H11KOS2, TCI Co., Ltd., Tokyo, Japan) and Aeropromoter 3477 (AP3477, isobutyl dithiophosphates, Cytec Industries Inc., Woodland Park, NJ, USA) were used as collectors. Poly-propylene glycol (PPG; average molecular weight ~425, Sigma–Aldrich, St. Louis, MO, USA) was used as a frother.

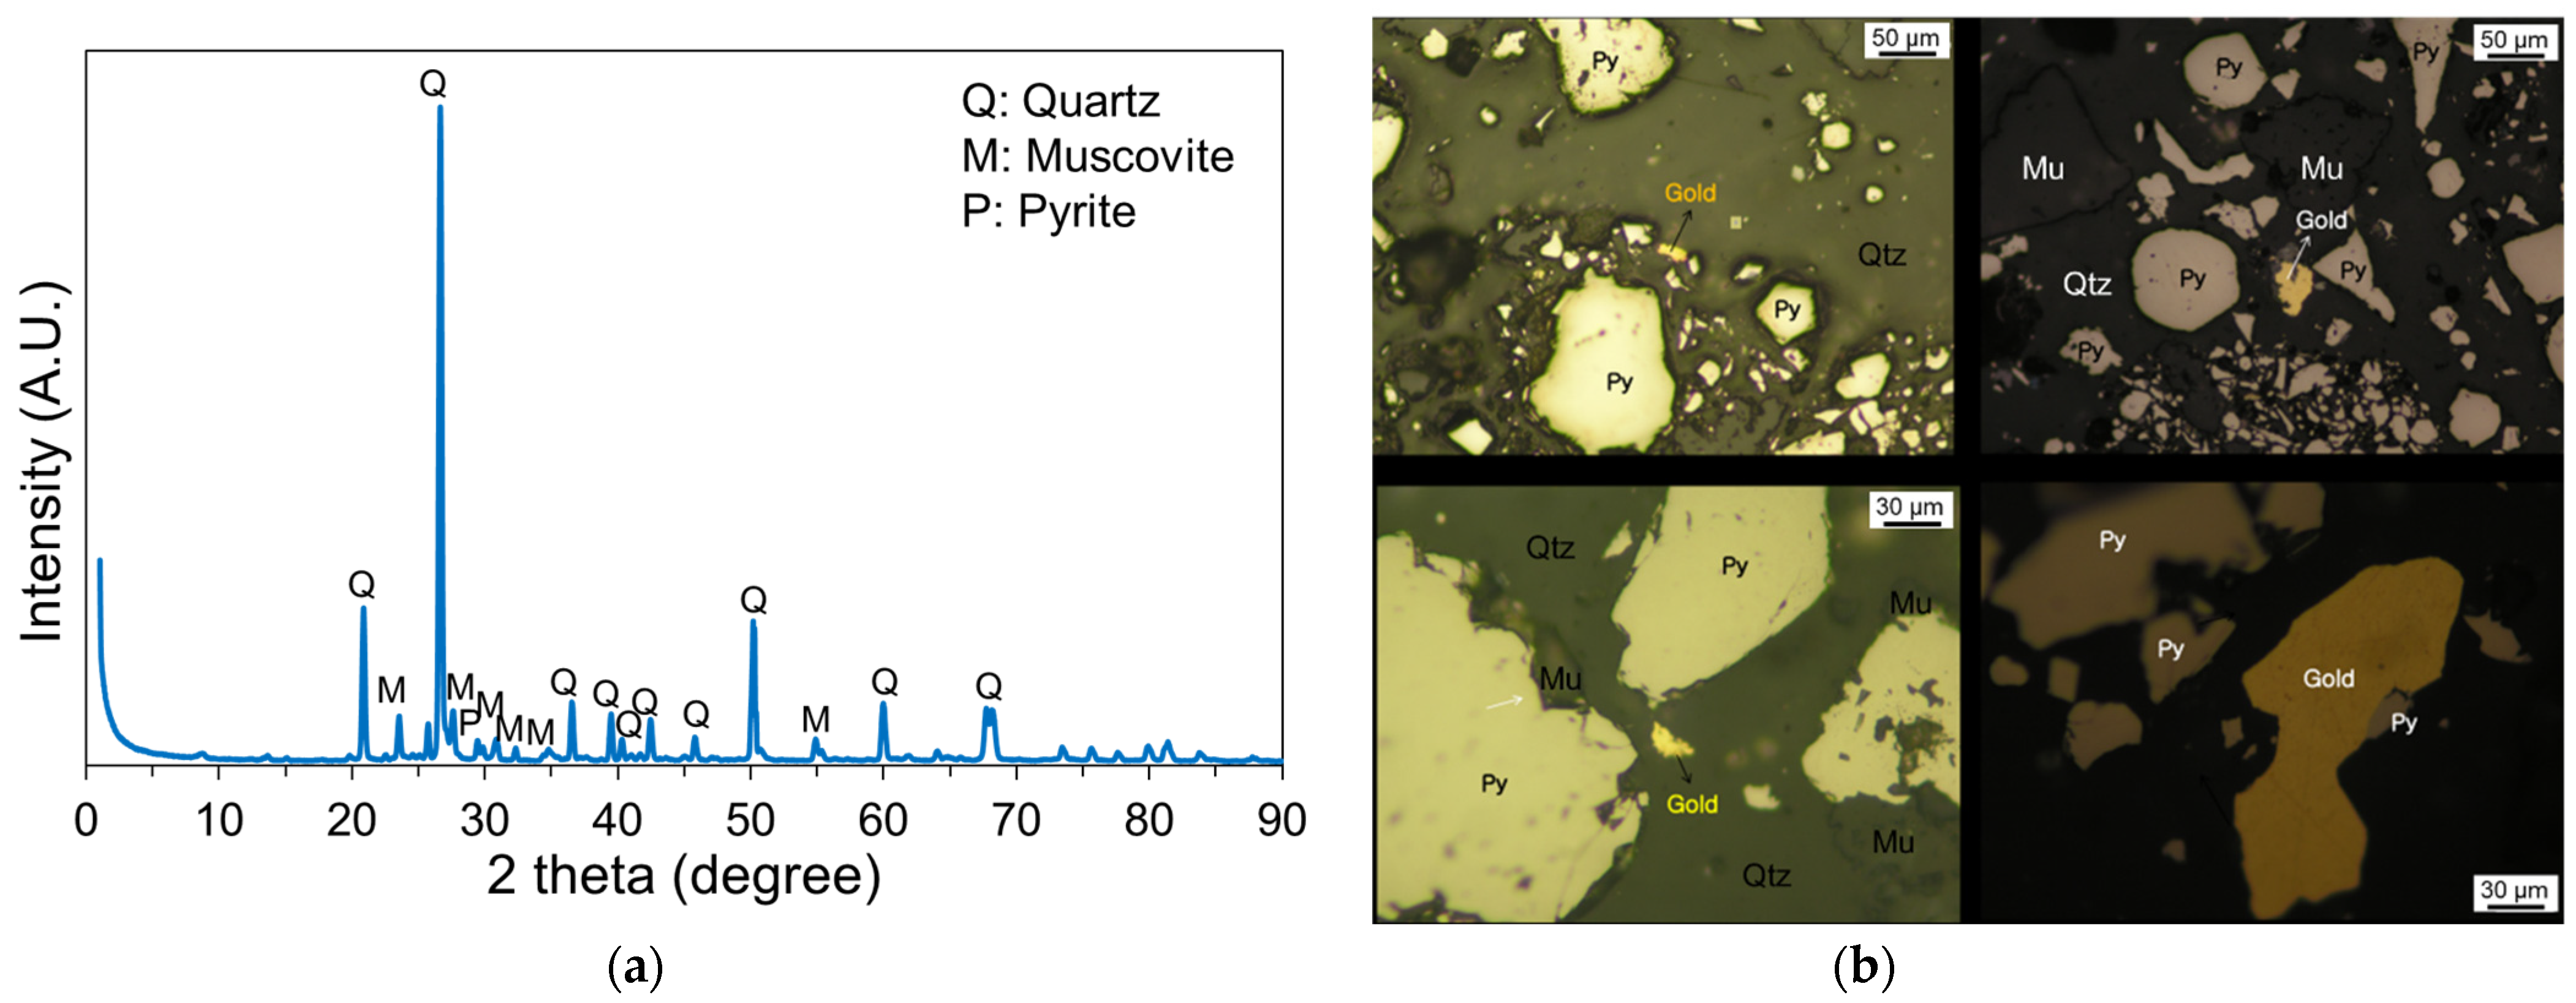
2.2. Characterization of Gold Ores

The gold ores processed by the target beneficiation plant were Gasado gold ores [29]. To evaluate the mineralogical properties of these gold ores, X-ray fluorescence spectrometry (XRF, PW2404, Phillips, Tokyo, Japan), X-ray diffraction (XRD, SmartLab, Rigaku, Tokyo, Japan), and density analysis (gas pycnometer, AccuPyc II, Micromeritics, Norcross, GA, USA) were performed. Gold in all ores was analyzed using the fire-assay technique. To obtain photographs of gold ore, gold ore specimens were prepared by cold mounting with an epoxy resin (KEM90 Resin, ATM GmbH, Mammelzen, Germany) and a hardener (KEM90 Hardener, ATM, Berlin, Germany). The specimens were polished using a polishing machine (SAPHIR 520m, ATM GmbH, Mammelzen, Germany) equipped with cloth pads and diamond suspensions. Subsequently, the gold ore specimens were directly observed using a digital optical microscope (DVM2500, Leica, Wetzlar, Germany), where a white LED was used as the light source.

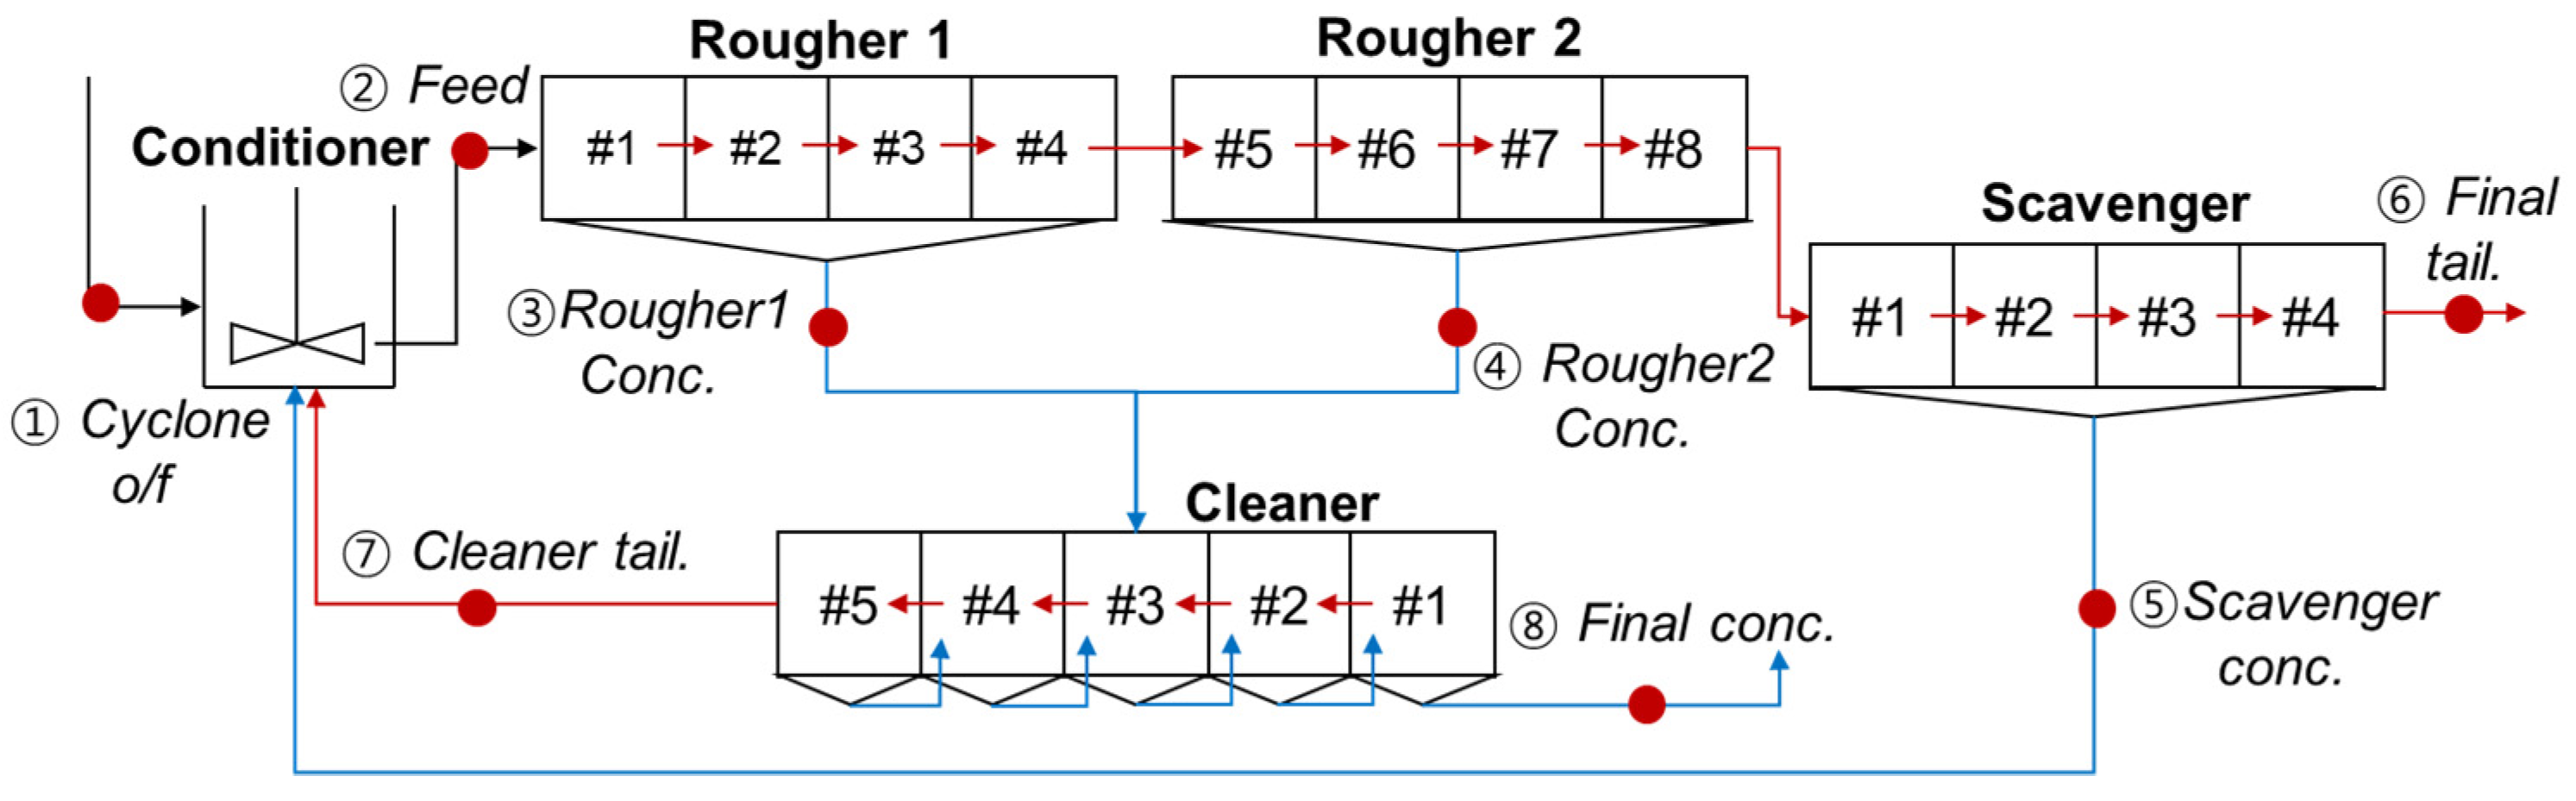
2.3. Flotation Circuit Description

The target flotation circuit is a beneficiation plant located in Haenam-gun, Jeollanam-do, Korea. The grinding and classification process of this plant was introduced by Lee et al. [29]. Currently, the throughput of this process is 170 t/d (7.08 t/h). All of the flotation machines are of the Denver sub-A type. Chemicals (collector: KAX, AP3477, frother: PPG) were simultaneously added to the conditioner. Modifiers such as activators and depressors were not used in this process. Groundwater was used as the process water, and its pH was 6–6.5.
The flowsheet is shown in Figure 1, and Table 1 lists the number of cells, cell size, and effective volume of this circuit. This flotation circuit comprised two rougher banks, a cleaner, and a scavenger. Each rougher bank contained four cells. The scavenger and cleaner were composed of four cells. The floated product of cleaner 1 bank was the final concentrate, and the sunk product of scavenger #4 cell was the final tailings. This process was designed to be cleaned three times by transferring the rougher concentrate to the cleaner #3 bank. Furthermore, it was designed as a closed circuit, in which the cleaner tailing and scavenger concentrate were fed back to the conditioner.
The final concentrate was delivered to a refinery (LS-Nikko Copper Inc., Ulsan, Korea), and gold was produced through pyrometallurgy. If the Au grade of the final concentrate is less than 100 g/t, then an economical gold production is impossible at the refinery owing to the high cost of refining gold. Therefore, the Au grade of the final concentrate should exceed 100 g/t. Gold is an extremely expensive precious metal that can maximize profits by improving the recovery of concentrates.

2.4. Measurement of Flotation Rate Constant

Flotation experiments were performed to calculate the floatation rate constant for minerals in the gold ore (pyrite, quartz, muscovite, and gold). The experimental conditions were matched with the industrial conditions of a plant during the flotation process. For the flotation tests, a gold ore slurry was prepared with 35 wt.% solid pulp density. The prepared pulps were mixed with 70 g/t of KAX, 35 g/t of AP3477, and 40 g/t of PPG for 10 min at 1200 rpm. The tests were performed in the first cell of the rougher 1 bank (#1 Rougher 1). The flotation cell was a Denver sub-A type (Metso, Finland). Air was injected into the cells. The flotation gas rate was 5 L/min, which was determined by the suction of air into the pulp through the impeller at 1200 rpm. The total flotation time was 8 min. The water used was maintained at room temperature (25 °C), and its pH was 6.5 after conditioning. Five concentrates were skimmed off after 0.5, 1, 2, 4, and 8 min. All solid samples obtained from the flotation tests were dried at 40 °C and then weighed. The gold grade of all the products was determined using the fire-assay method. The contents of other elements were analyzed using XRD and XRF. The first-order rate constant model was used in this study because the flotation process is generally regarded as a first-order process. The rate constant was calculated using Equation (1), as follows [9]:
R = R ( 1 exp ( k τ ) )
Here, R is the recovery of the target minerals, R the maximum recovery, k the rate constant, and τ the flotation time. The recovery of the target concentrate is expressed as shown in Equation (2) [9,31,32]:
R = C c F f × 100
C and c are the weight and grade of the concentrate, respectively; F and f are the weight and grade of the feed, respectively. The rate constant was calculated via nonlinear regression analysis using MATLAB 2021a (MATLAB, Natick, MA, USA).

2.5. Optimization of Process: Alternative Process Proposal
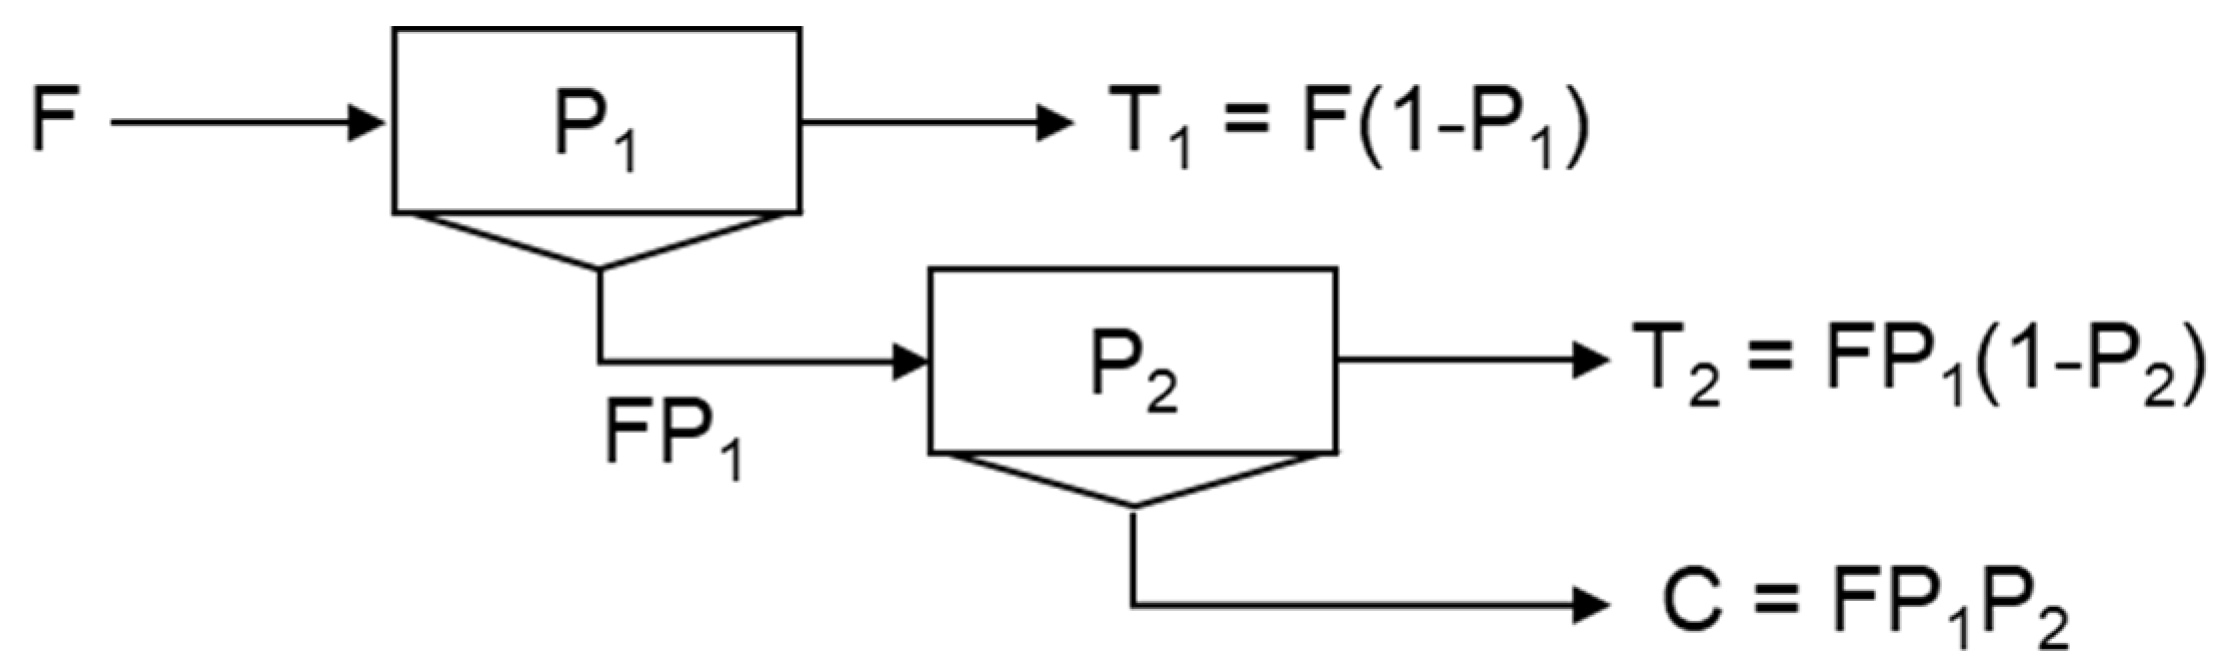
Herein, alternative circuits were proposed to optimize the current gold ore flotation process. The proposed alternative processes are illustrated in Figure 2. Considering the space problem and throughput of the plant, four alternative processes were proposed.
Case 1 involves a circuit that transfers the floated products from the rougher 1 bank to cleaner #3, and the floated products from the rougher 2 bank to cleaner #4. In the current circuit, the floated products of all rougher banks were transferred to cleaner #3. Therefore, the outstreams of the floated product of the rougher banks in Case 1 differed from that of the current process. Case 1 was proposed to increase the gold grade of the concentrate. In Case 2, a scavenger bank was added to increase the recovery rate of gold. Case 3 involves an open circuit with an additional cleaner bank, and it was proposed to significantly improve the gold grade of the final concentrate. Finally, Case 4 was designed as the closed-circuit version of Case 3.

2.6. LCA

LCA, which is based on partition-based separation, is effective for analyzing the connection and configuration of each unit [26,33,34]. In addition, because the circuit configuration allows the separation efficiency (SE) to be determined, the performance of circuits with different configurations can be evaluated easily [26]. The evaluation was performed by calculating the overall circuit concentrate-to-feed ratio (C/F) using the partition probability (P) of each unit process. The recovery of a unit is expressed as the probability of the unit process as a function of the experimental variable (Z). The recovery of the entire circuit can be expressed in the form of an algebraic expression using this P [26,33,34]. For example, as shown in Figure 3, if the recoveries of each process are P1 and P2, then the recovery (C/F) of the entire process becomes P1 × P2. In this process, if the recovery as a function of the experimental variable of the unit process is known, then a partition curve of the overall recovery with respect to the experimental variable can be constructed. Assuming that P is the same for each process, the SE of the entire process can be compared with the efficiency of the unit process based on the slope value (d(C/F)/dP, P = 0.5) at the point where P is 50% [26,35]. As shown in Figure 3, C/F is P2 when P1 = P2 = P; therefore, when P = 0.5, the slope value is 1, which is the same as the efficiency of the unit process. In the case of a complex process such as a multistage flotation circuit, it is difficult to calculate the algebraic expression directly. Therefore, the recovery and SE of the entire circuit were calculated using the matrix reduction algorithm proposed by Noble and Luttrell [26].

2.7. Simulation of Mass Balance

Using LCA, the recovery of the total circuit can be estimated as a function of the recovery of the unit bank. We simulated the mass balance to compare the performances of the current and alternative flotation circuits.
We assumed that the flotation process was in a steady state to simulate the mass balance, grade of concentrate, and recovery. This assumption is reasonable as the target flotation process has been in progress for a significant amount time, while the reagents and operating conditions were maintained. Therefore, in this study, the steady state was assumed for the diagnosis and optimization of the flotation circuit. The mass balance model based on flotation kinetics is expressed in Equation (3) [36].
Q ci = Q fi [ k i τ 1 + k i τ ]
In Equation (3), Qci is the mass flowrate of the concentrate (t/d), Qfi the mass flowrate of the feed (t/d), τ the flotation time (min), and ki the flotation kinetic constant (1/min) for each i component (kAu, kPy, kQtz, and kMu). To calculate the mass balance of each node, Equations (4)–(6) were applied [35].
Q f = Q A u + Q Py + Q M u + Q Q t z + Q w
Q c = Q ci + Q cw = i Q fi [ k i τ 1 + k i τ ] + Q cw
Q t = Q f Q c
Here, Qf is the feed mass rate; Qw is the water mass rate; Qc is the concentrate mass rate; Qcw is the water mass rate in the concentrate, which can be obtained from the pulp density; QAu, QPy, QQtz, and QMu are the throughputs of gold, pyrite, quartz, and muscovite, respectively, which can be obtained from each mineral grade of the ore; Qt is the flow rate of the tailings. The flotation residence time (τ) can be calculated using the volume of the cell occupied by the slurry (Vp) and the feed mass rate.
τ = V p Q f
To estimate the recovery and grade of the concentrate, the simulation was performed using the USIM-PAC 3.2 software (©Caspeo/BRGM, Orléans, France). Among the many available mineral processing software, USIM-PAC was selected because it enables the mass balance of the circuit to be predicted conveniently, and it contains all the considered flotation models [21]. An iterative calculation algorithm was applied to calculate the mass balance of the closed circuit, in which the in-stream and out-stream were repeated. In this algorithm, the convergence criterion was set to 10−4. Convergence is achieved when the sum of all the least-square differences between the calculated and previous iteration flow rates becomes less than the convergence criterion.
Based on this simulation, the mass balance of the current circuit was calculated to determine the performance of the current circuit. Subsequently, it was used to evaluate the performance of the proposed alternative process.

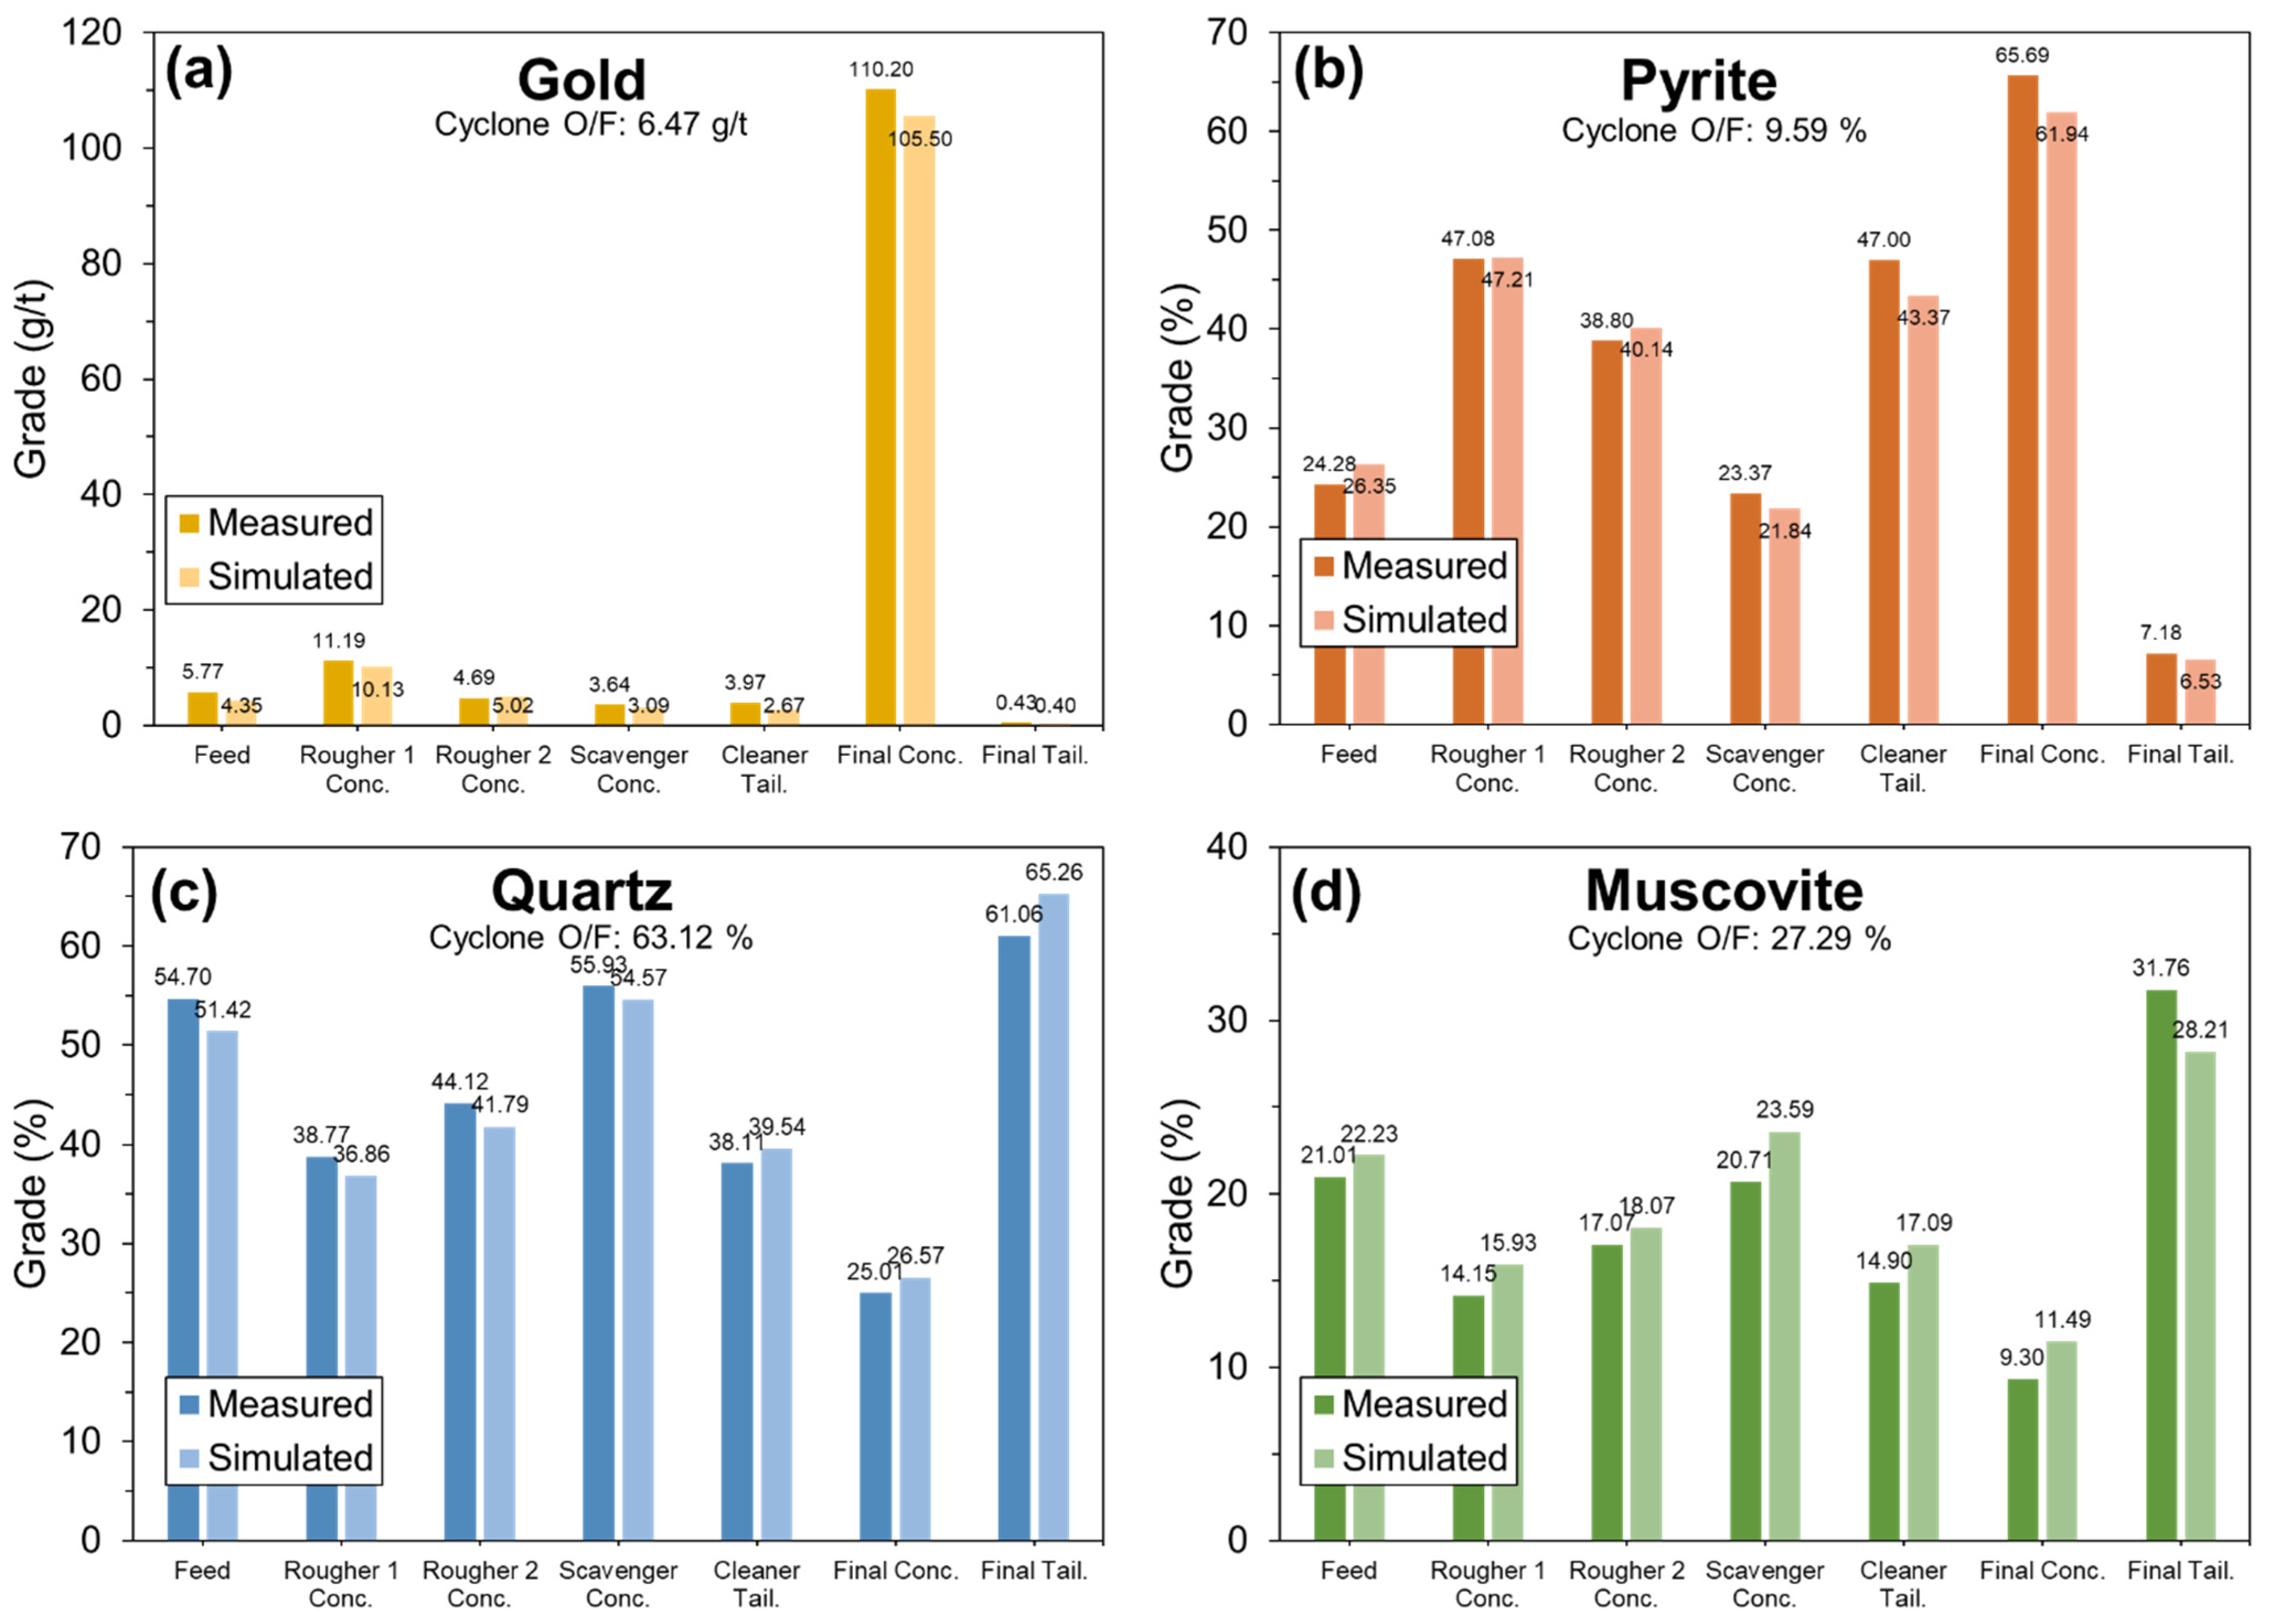
2.8. Validation of Simulation

In the industrial plant, samples were obtained from each node. Subsequently, the mineral composition of the collected samples was analyzed, and the results were compared with the simulated results to validate the recovery and grade estimated from the simulation. The sampling points are indicated by red points in Figure 1. Mineral composition analyses, as described in Section 2.2, were performed.

3. Results and Discussion

3.1. Characterization of Gold Ores

According to a geological survey, the Gasado gold ore used in this study is a hydrothermal deposit formed by volcanic activity at the end of the Cretaceous period, and that gold is a pyritic gold ore coexisting with pyrite [30,37,38,39,40]. Figure 4 shows the results of XRD analysis of the gold ore and micrographs of the gold ore specimens. Table 2 shows the mineral compositions measured via XRF analysis and the gold grade from fire-assay analysis. Mineral analysis revealed that the gold ore contained primarily quartz, muscovite, and pyrite. Therefore, gold, pyrite, quartz, and muscovite were selected as representative minerals of this gold ore, and the flotation circuit was diagnosed and evaluated based on the quality and recovery of these minerals.

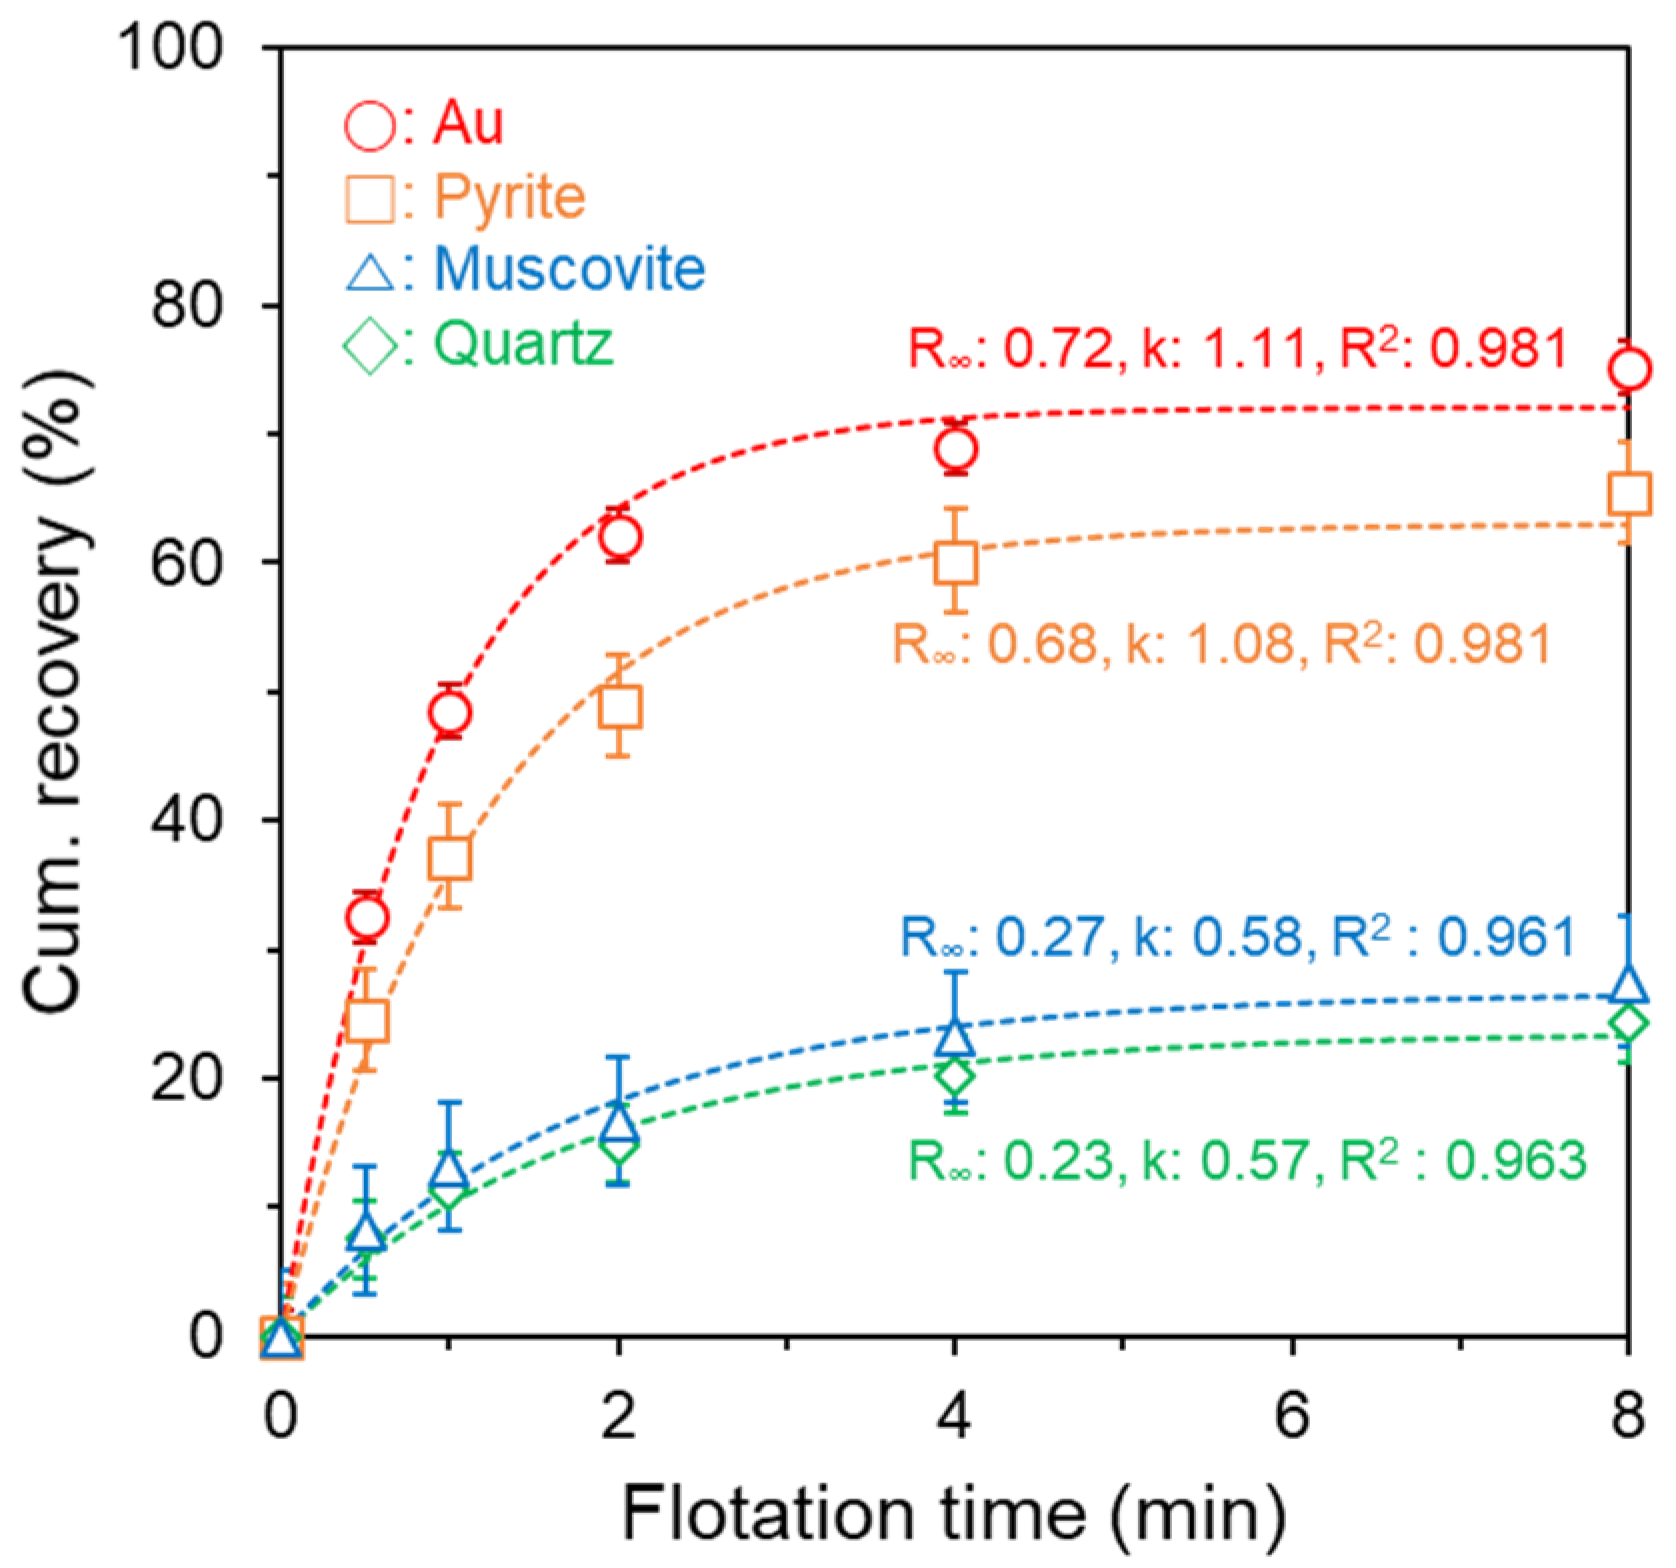
3.2. Flotation Kinetics
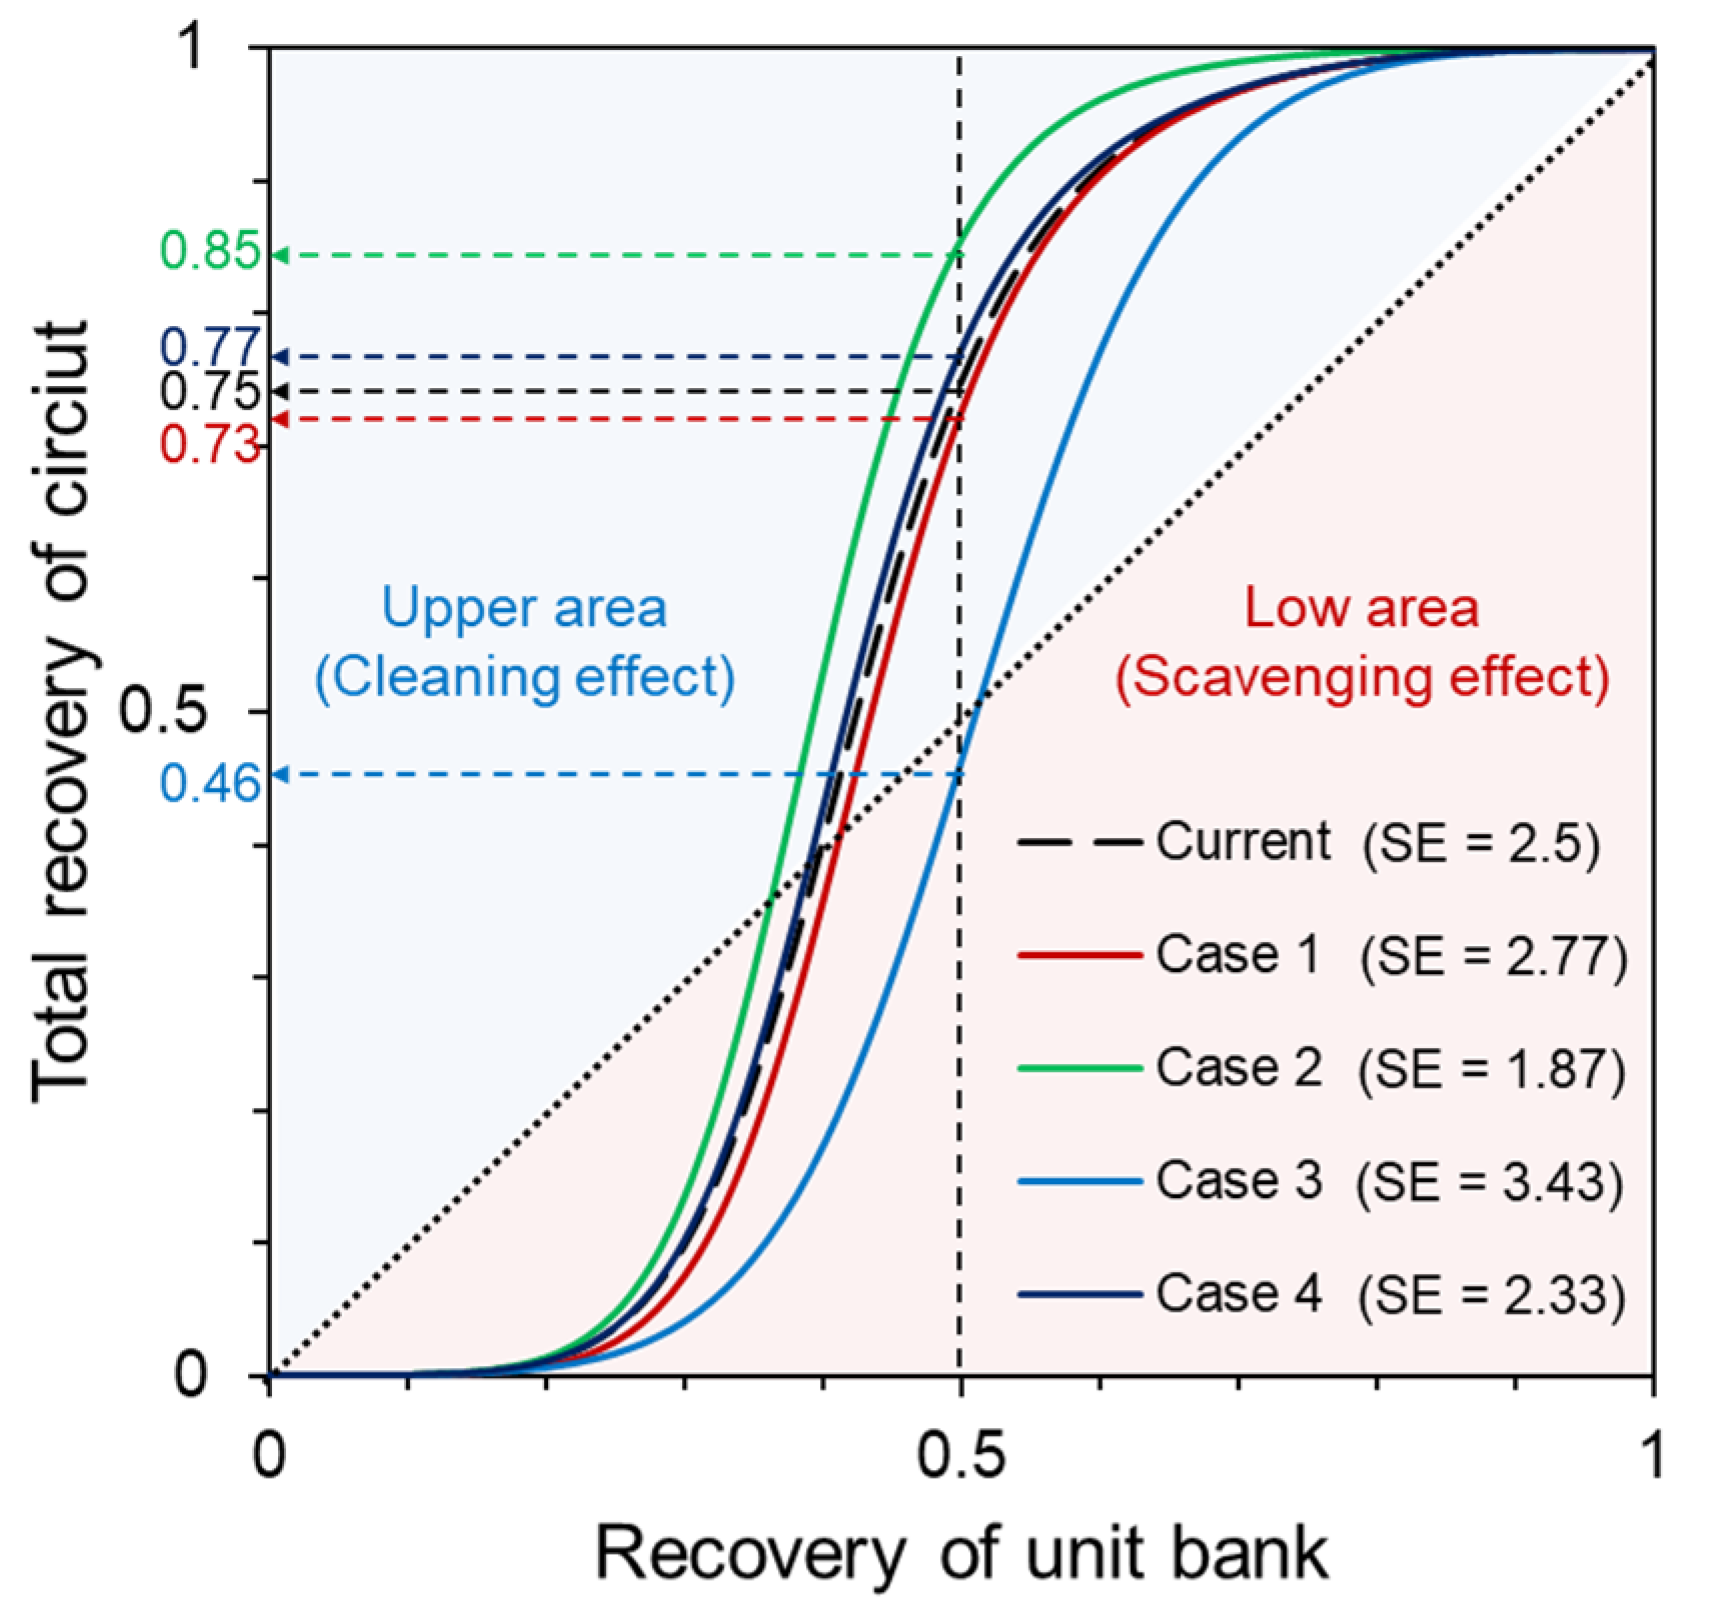
Figure 5 shows the flotation recovery of gold, pyrite, quartz, and muscovite as a function of the flotation time. The maximum recovery (R) and flotation kinetic rate constant (k) of the minerals were obtained by performing a nonlinear regression analysis of the experimental results using Equation (1). Because the coefficient of determination (R2) of all minerals was calculated to be 0.96 or more, the experimental results can be assumed to have correlated significantly with the first flotation kinetic model (Equation (1)) [27,41].
In general, the R and k values of gold and pyrite were higher than those of quartz and muscovite. The flotation rate constant was determined based on the bubble–particle interaction, which was dominated by the hydrophobicity of the mineral surface. Therefore, the high flotation rate constants of pyrite and gold were calculated because the hydrophobicity of their surfaces was increased by the thiol-type collectors (KAX, AP3477). In addition, hydrophilic minerals such as quartz and muscovite have low flotation rate constants. It is noteworthy that R is governed by the degree of liberation. If the degree of liberation is 100%, then the R of gold and pyrite, which are hydrophobic minerals, is 1. However, the photographs of the specimens presented in Figure 4b shows that the grain size of gold is less than 30 μm and that of pyrite is less than 50 μm. Because the d80 of the feed was 94 μm, the R of all minerals was between 0 and 1.
The k and R values obtained from this batch flotation experiment were used to simulate the mass balance of the flotation circuit.

3.3. LCAs

Figure 6 shows the LCA results of the current process and the alternative processes, where their partition functions and sharpness parameters are included. In this regard, the sharpness parameter is the SE, which is a frequently used indicator to technically evaluate separation processes and can be useful when the recovery and grade of two products are different [26]. The graph presented in Figure 6 can be demarcated by a diagonal line, where the upper area of the partition curve is associated with the scavenging effect, which increases the recovery, whereas the lower area is associated with the cleaning effect, which increases the grade [26]. In this context, assuming that the gold recovery of the unit bank is ≥0.5, and that of silica or mica, which is a gangue, is lower than 0.5, if the flotation circuit exhibits the scavenging effect when the recovery rate of the unit bank exceeds 0.5, and the cleaning effect when it is lower than 0.5, then the SE value should be high.
Comparing the current process with the other proposed processes, its SE (= 2.5) ranked third, and the flotation process efficiency can be improved by changing the circuit to Case 1 using a simple circuit arrangement and changing it to Case 3 using an open circuit. However, considering that the recovery of gold, an expensive metal, is critical, the process of Case 3 is difficult to apply because the recovery of the entire process (= 0.46) is extremely low. Finally, the circuit for Case 1 can be considered as a circuit that can increase the enrichment ratio while maintaining a high gold recovery. The enrichment ratio is the ratio of the concentrate grade to the feed grade. Comparing the other cases with the current process, the gold recovery did not differ significantly, and the SE value was low. Therefore, it was difficult to improve the quality of the concentrate.

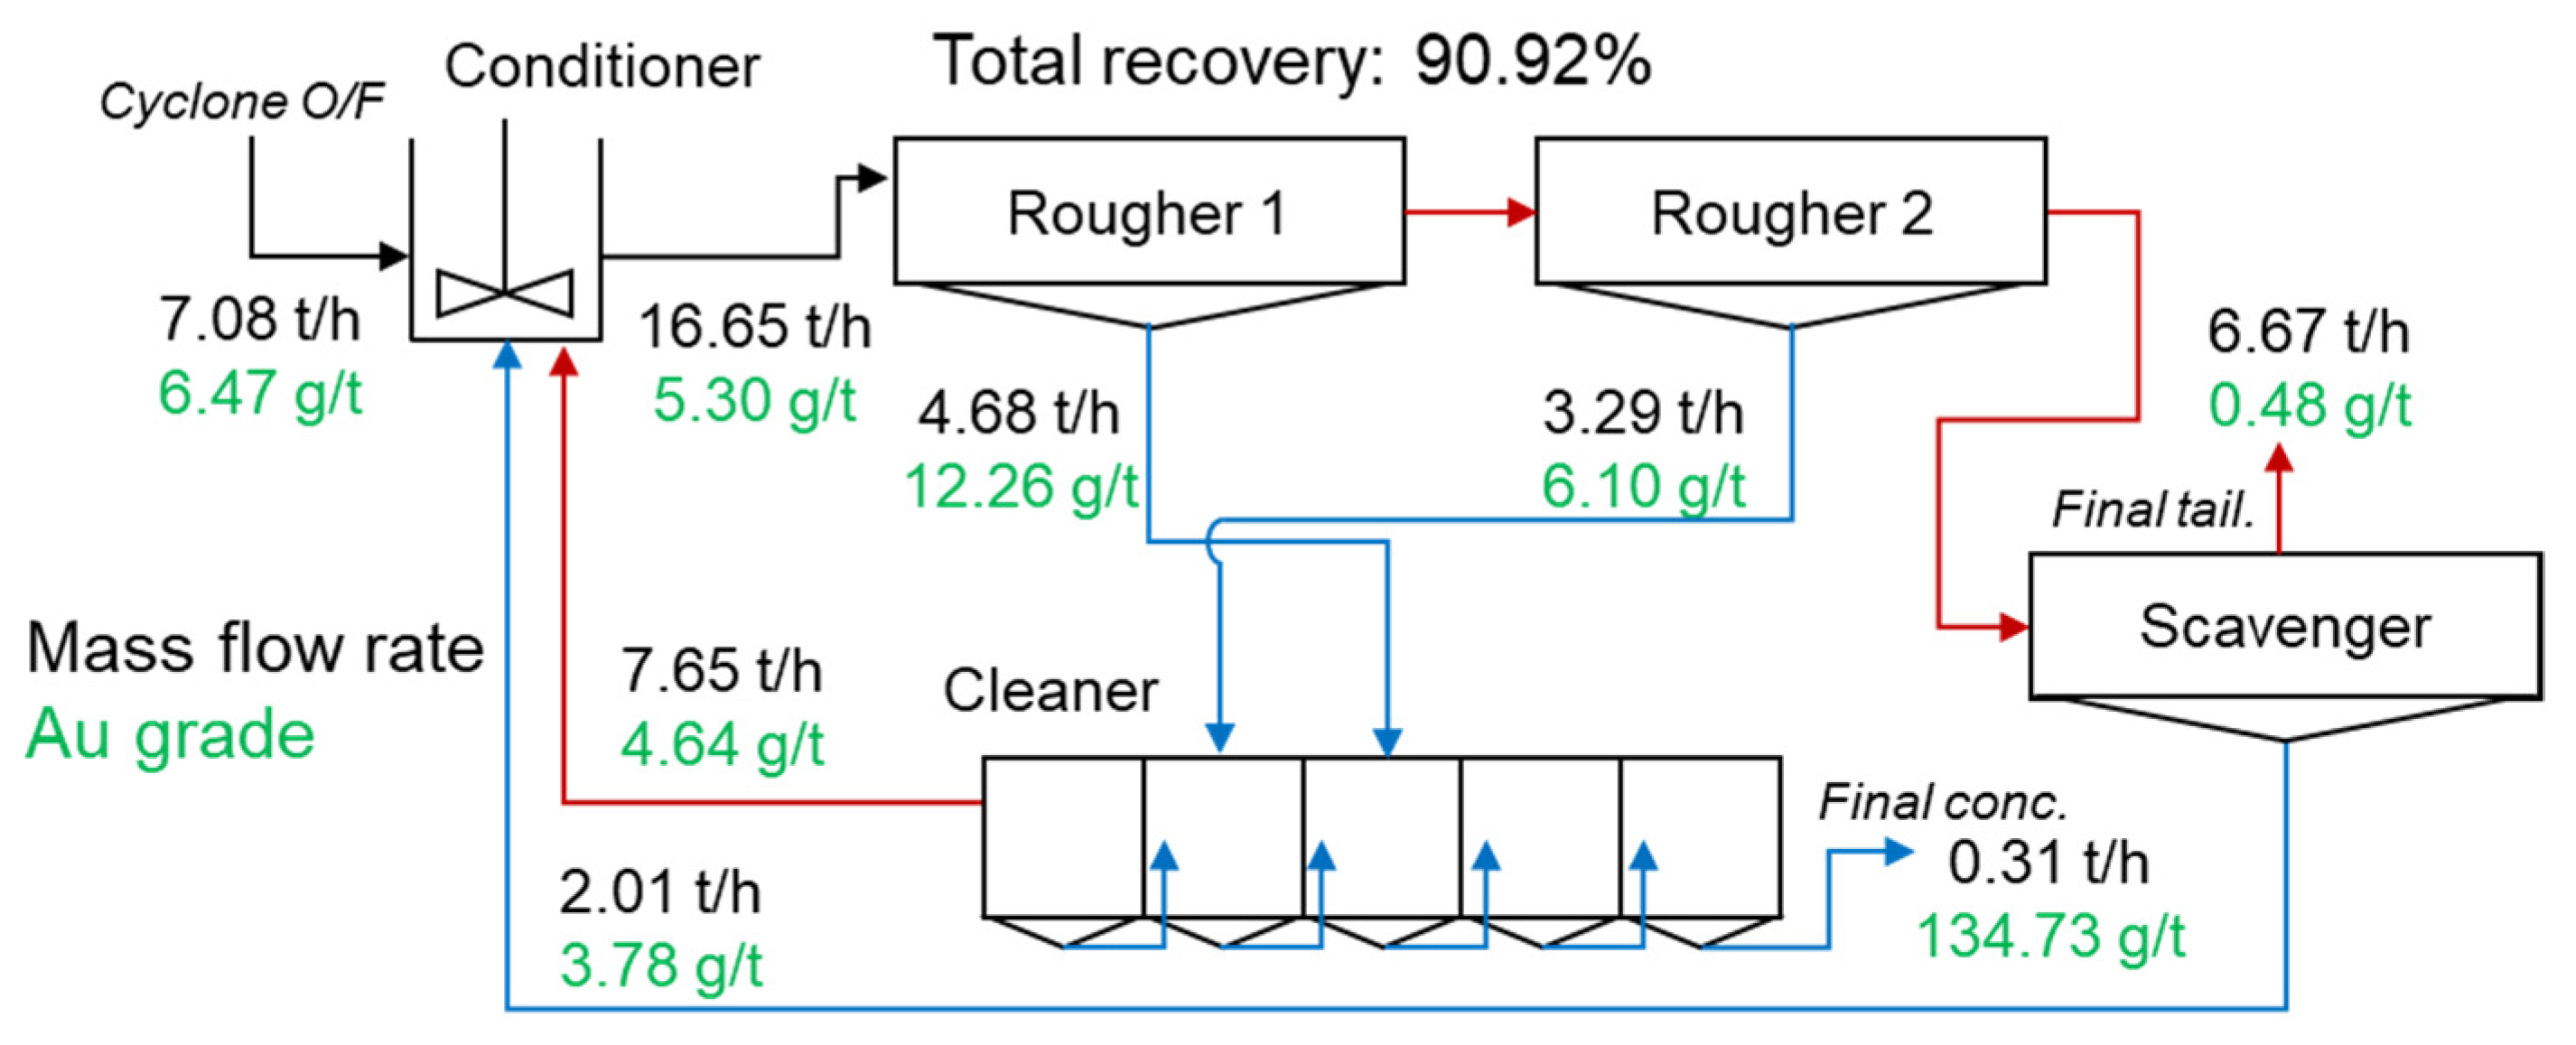
3.4. Mass Balance of Current Flotation Circuit

The recovery of each unit bank and the concentrate grade of the current circuit were simulated by applying the throughput, pulp density, flotation kinetic constant, and maximum recovery of the minerals to the mass balance model. The simulated distributions were compared with the industrial results for each stream to validate the simulation results. Figure 7 shows the grade of the minerals calculated via simulation and the content analysis results of minerals obtained from actual plants. Regarding the grade distribution shown in Figure 7, the simulated results agreed well with the industrial results. Therefore, the mass balance of the industrial plants was predicted via simulations [29].
Figure 8 shows the mass balance results for the current circuit. The concentrate product rate was estimated to be 0.4 t/h (9.6 t/d), and the gold grade was 105.5 g/t for this closed flotation circuit at a throughput of 7.08 t/h (= 170 t/d). The total recovery of the circuit was 94.92%, and the enrichment ratio was 16.3 (= 105.5/6.47). Hence, it was confirmed that the current process operated at an extremely high recovery rate. Mass balance analysis revealed that the current process is highly effective for recovering gold from pyrite, quartz, and muscovite. These results are similar to those estimated using LCA. The overall recovery is important because gold is a precious and expensive metal. However, the enrichment ratio of the process was low. If the gold grade of the ore decreases significantly as compared with that of the current ore, then the final concentrate grade may be less than 100 g/t. As mentioned in Section 2.3, when the gold grade of the concentrate is less than 100 g/t, the smelting cost is high. In this case, the process must be modified to increase the gold grade of the concentrate.

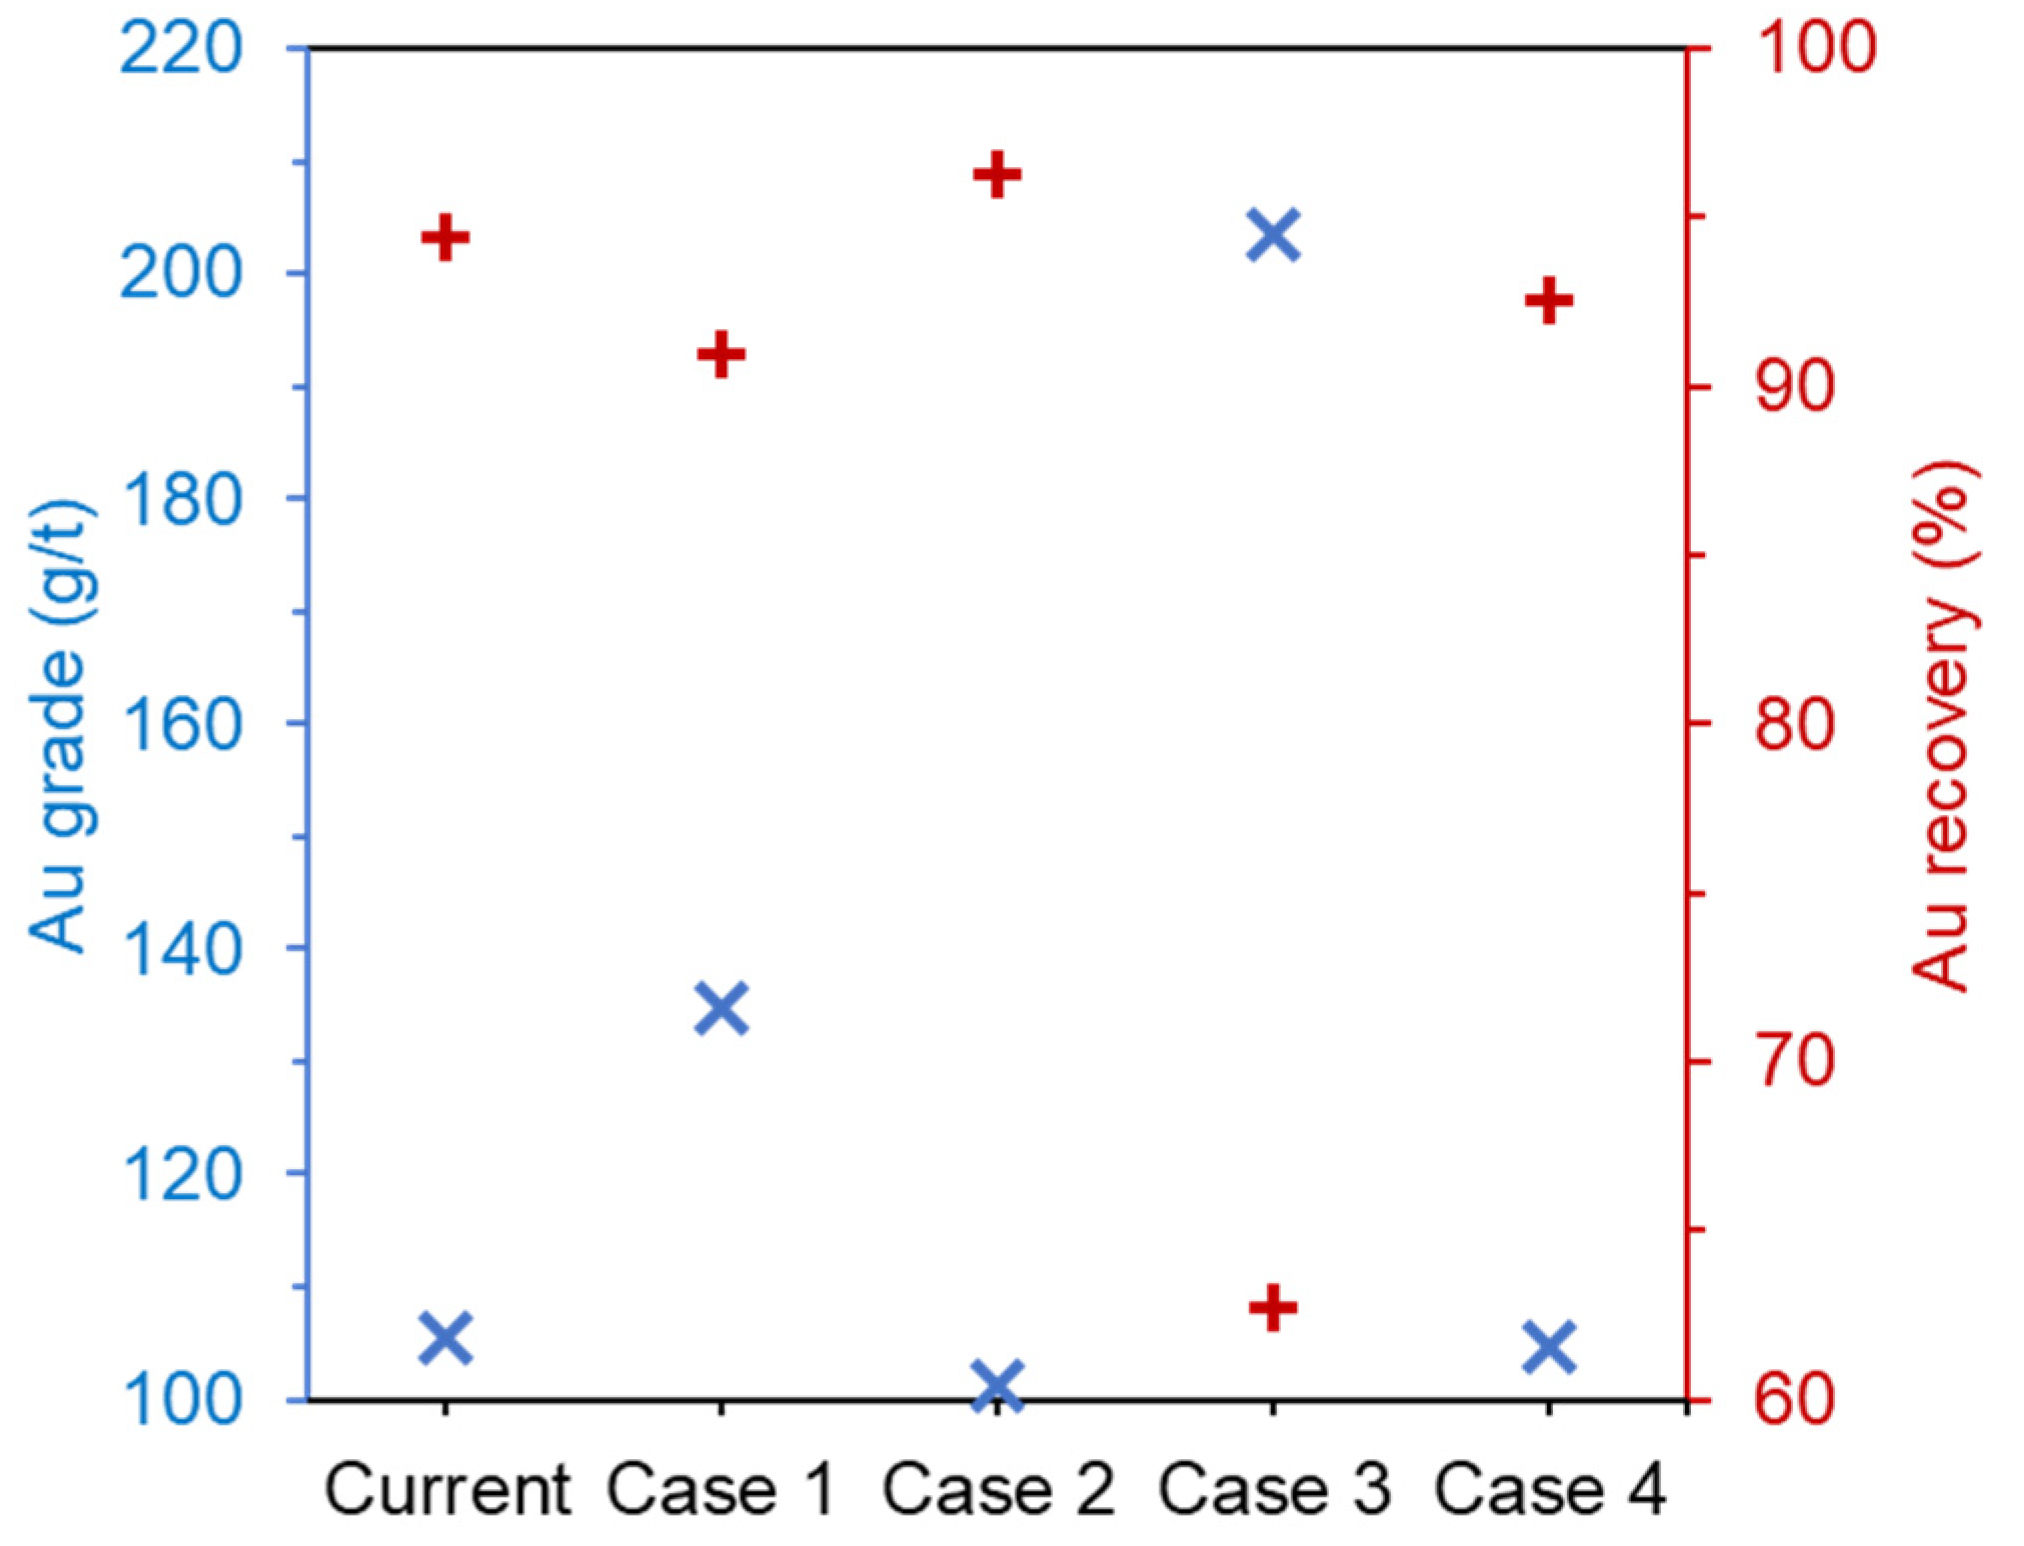
3.5. Comparison between Current Circuit and Alternative Circuits

Figure 9 shows a comparison of the recovery and concentrate grades for all alternative circuits. Case 1 does not involve the addition of a flotation bank to the existing process and does not incur additional equipment costs because it pertains to a circuit where the floated product stream of the existing rougher banks is changed. However, because of this change, the gold grade of the final concentrate improved from 105.5 to 134.7 g/t. The recovery was expected to be 90.92%. In Case 2, an alternative circuit with a scavenger bank added, and the overall recovery of 96.2%, which is slightly higher than 94.4% of the existing process. Because of the addition of scavenger trails, additional cost is incurred to change the process. In Case 3, which involves an alternative circuit designed as an open circuit, the gold grade of the final concentrate was 203.42 g/t, which yielded the highest-quality concentrate. However, the overall recovery was calculated to be as low as 62%. Meanwhile, Case 4, which involved the addition of only a cleaner unit bank to the existing process, did not differ significantly from the current process. Although the cleaner was added (which incurred additional cost), the economic efficiency did not increase as compared with that of the current process.
In summary, Cases 2 and 4, which are alternative processes involving additional unit banks, did not differ significantly from the current process. If the process is designed with an open circuit, as in Case 3, then the recovery will be reduced significantly. Hence, the open circuit is not suitable for the gold flotation process, where recovery is important. In Case 1, where the stream was changed without adding equipment to the current process, the grade of the concentrate improved by 128% (=134.7/105.5) compared to the gold grade of concentrate of current process., while a high recovery of 90.92% was maintained.
Figure 10 shows the simulated mass balance of the alternative process of Case 1. Compared with Figure 8, which shows the mass balance of the current process, the mass flow rate differed slightly, but it was confirmed that the final gold grade of the concentrate improved significantly. The enrichment ratio of the process of Case 1 was 20.8 (=134.73/6.47), which was a significant improvement compared with that of the current process. In particular, this process is more advantageous than the existing process when the gold quality of the ore is reduced.
Therefore, the alternative process of Case 1 is expected to yield a higher SE than the current process. This expectation is consistent with the LCA results. Therefore, based on the LCA and mass balance analysis, the flotation process should be changed to the alternative process of Case 1. Currently, the plant has adopted the Case 1 process.

4. Conclusions

In this study, the diagnosis and optimization of the flotation circuit of gold ore in an industrial plant were performed. Optimization was proposed to design an alternative process with an SE that is higher than that of the current process. The SE was evaluated via LCA based on partition-based separation and mass balance simulation using a flotation first-order rate constant model. Because the simulated grade distributions of each of the streams were consistent with the industrial results, the simulation results were considered reasonable. After diagnosing the current process, an operation with high gold recovery was achieved. However, the operation was unsuitable for processing low-grade ore because of the low enrichment ratio. Therefore, LCA and mass balance simulations were performed for various alternative processes. Based on the results obtained, it was discovered that the alternative process of Case 1 should be adopted instead of the current process, as the former maintained high recovery while improving the enrichment ratio. Therefore, the process of Case 1 was adopted in the plant. Finally, we demonstrated that an operating plant can be diagnosed and optimized using LCA and mass balance simulations. In conclusion, our study provides a methodology for adapting the simulation of flotation circuit optimization for industrial plants, and based on these results, future research to be applied to other plants with various minerals compositions will be needed.

Author Contributions

Conceptualization: S.H., M.J., G.-t.L. and Y.H.; methodology: S.H., M.J., W.L., S.K., H.-S.J., S.Q.C. and Y.H.; validation: S.H., M.J., W.L., S.K., K.L., S.Q.C. and Y.H.; formal analysis: S.H., M.J., W.L.; investigation: S.H., M.J., G.-t.L., K.L., H.-S.J. and Y.H.; writing original draft: S.H., M.J., W.L., S.K. and Y.H.; writing review and editing: S.H., M.J., S.K., S.Q.C. and Y.H.; resources: G.-t.L.; supervision: S.Q.C., Y.H. All authors have read and agreed to the published version of the manuscript.

Funding

This research was supported by the Basic Research Project (GP2020-013, 21-3212-1) of the Korea Institute of Geoscience and Mineral Resources (KIGAM) funded by the Ministry of Science, ICT, and Future Planning of Korea, as well as by the Basic Science Research Program through the National Research Foundation of Korea (NRF) funded by the Ministry of Education (2021R1A6A3A01087783) and this work was supported by the Korea Institute of Energy Technology Evaluation and Planning (KETEP) and the Ministry of Trade, Industry & Energy (MOTIE) of the Republic of Korea (No. 20216110100040).

Conflicts of Interest

The authors declare no conflict of interest.

References

  1. Hodouin, D. Methods for automatic control, observation, and optimization in mineral processing plants. J. Process Control 2011, 21, 211–225. [Google Scholar] [CrossRef]
  2. Mendez, A.; Galvez, E.; Cisternas, L. Modeling of grinding and classification circuits as applied to the design of flotation processes. Comput. Chem. Eng. 2009, 33, 97–111. [Google Scholar] [CrossRef]
  3. Irannajad, M.; Nuri, O.; Allahkarami, E. A new approach in separation process evaluation. Efficiency ratio and upgrading curves. Physicochem. Probl. Miner. Process. 2018, 54, 847–857. [Google Scholar]
  4. Hodouin, D.; Jamsa-Jounela, S.-L.; Carvalho, M.T.; Bergh, L. State of the art and challenges in mineral processing control. Control Eng. Pract. 2001, 9, 995–1005. [Google Scholar] [CrossRef] [Green Version]
  5. Han, Y.; Kim, H.; Park, J. Millimeter-sized spherical ion-sieve foams with hierarchical pore structure for recovery of lithium from seawater. Chem. Eng. J. 2012, 210, 482–489. [Google Scholar] [CrossRef]
  6. Kim, S.; Park, S.; Han, S.; Han, Y.; Park, J. Silanol-rich ordered mesoporous silica modified thiol group for enhanced recovery performance of Au(III) in acidic leachate solution. Chem. Eng. J. 2018, 351, 1027–1037. [Google Scholar] [CrossRef]
  7. Kim, Y.; Han, Y.; Kim, S.; Jeon, H. Green extraction of lithium from waste LAS glass ceramics using a water leaching processes. Process Saf. Environ. Protect. 2021, 148, 765–774. [Google Scholar] [CrossRef]
  8. Wills, B.A.; Finch, J. Wills’ Mineral Processing Technology: An Introduction to the Practical Aspects of Ore Treatment and Mineral Recovery; Butterworth-Heinemann: Oxford, UK, 2015. [Google Scholar]
  9. Rajamani, R.; Herbst, J. Optimal control of a ball mill grinding circuit—I. Grinding circuit modeling and dynamic simulation. Chem. Eng. Sci. 1991, 46, 861–870. [Google Scholar] [CrossRef]
  10. Han, Y.; Kim, S.; Go, B.; Lee, S.; Park, S.; Jeon, H. Optimized magnetic separation for efficient recovery of V and Ti enriched concentrates from vanadium-titanium magnetite (VTM) ore: Effect of grinding and magnetic Intensity. Powder Tech. 2021, 391, 282–291. [Google Scholar] [CrossRef]
  11. Bouchard, J.; Desbiens, A.; Villar, R.; Nunez, E. Column flotation simulation and control: An overview. Miner. Eng. 2009, 22, 519–529. [Google Scholar] [CrossRef]
  12. Mehrotra, S.P. Design of optimal flotation circuits—A review. Miner. Metall. Process. 1988, 5, 142–152. [Google Scholar] [CrossRef]
  13. Welsby, S.D.D.; Vianna, S.M.; Franzidis, J.-P. A continuous pilot-scale flotation rig for the systematic study of flotation variables. Miner. Eng. 2010, 23, 826–829. [Google Scholar] [CrossRef]
  14. Calisaya, D.; Lopez-Valdivieso, A. A strategy for the identification of optimal flotation circuits. Miner. Eng. 2016, 96–97, 157–167. [Google Scholar] [CrossRef]
  15. Liu, J.; MacGregor, J. Froth-based modeling and control of flotation processes. Miner. Eng. 2008, 21, 642–651. [Google Scholar] [CrossRef]
  16. Cisternas, L.; Lucay, F.; Acosta-Flore, R.; Galvez, E. A quasi-review of conceptual flotation design methods based on computational optimization. Miner. Eng. 2018, 117, 24–33. [Google Scholar] [CrossRef]
  17. Ferreira, J.P.; Loveday, B.K. An improved model for simulation of flotation circuits. Miner. Eng. 2000, 13, 1441–1453. [Google Scholar] [CrossRef]
  18. Bergh, L.; Yianatos, J. Control of rougher flotation circuits aided by industrial simulator. J. Process Control. 2013, 23, 140–147. [Google Scholar] [CrossRef]
  19. Vasebi, A.; Poulin, E.; Hodouin, D. Determining a dynamic model for flotation circuits using plant data to implement a Kalman filter for data reconciliation. Miner. Eng. 2015, 83, 192–200. [Google Scholar] [CrossRef]
  20. Vallejos, P.; Yianatos, J.; Grau, R.; Yanez, A. Evaluation of flotation circuits design using a novel approach. Miner. Eng. 2020, 158, 106591. [Google Scholar] [CrossRef]
  21. Villeneuve, J.; Guillaneau, J.-C.; Durance, M.-V. Flotation modelling: A wide range of solutions for solving industrial problems. Miner. Eng. 1995, 8, 409–420. [Google Scholar] [CrossRef]
  22. Yianatos, J.; Carrasco, C.; Bergh, L.; Vinnett, L.; Toress, C. Modelling and simulation of rougher flotation circuits. Int. J. Miner. Process. 2012, 112–113, 63–70. [Google Scholar] [CrossRef]
  23. Maldonado, M.; Araya, R.; Finch, J. Optimization flotation bank performance by recovery profiling. Miner. Eng. 2011, 24, 939–943. [Google Scholar] [CrossRef]
  24. Radmehr, V.; Shafaei, S.; Noaparast, M.; Abdollahi, H. Optimizing flotation circuit recovery by effective stage arrangements: A case study. Minerals 2018, 8, 417. [Google Scholar] [CrossRef] [Green Version]
  25. Gorain, B.K.; Franzidis, J.-P.; Manlapig, E.V. The empirical prediction of bubble surface area flux in mechanical flotation cells from cell design and operating data. Miner. Eng. 1999, 12, 309–322. [Google Scholar] [CrossRef]
  26. Noble, A.; Luttrell, G. The matrix reduction algorithm for solving separation circuits. Miner. Eng. 2014, 64, 97–108. [Google Scholar] [CrossRef]
  27. Seppälä, P.; Sorsa, A.; Paavola, M.; Ruuska, J.; Remes, A.; Kumar, H.; Leiviskä, K. Development and calibration of a dynamic flotation circuit model. Miner. Eng. 2016, 96, 168–176. [Google Scholar] [CrossRef]
  28. Yalcin, E.; Kelebek, S. Flotation kinetics of a pyritic gold ore. Int. J. Miner. Process. 2011, 98, 48–54. [Google Scholar] [CrossRef]
  29. Lee, W.; Jung, M.; Han, S.; Park, S.; Park, S. Simulation of layout rearrangement in the grinding/classification process for increasing throughput of industrial gold ore plant. Miner. Eng. 2020, 157, 106545. [Google Scholar] [CrossRef]
  30. Kim, C.; Choi, S.; Choi, S.; Lee, I. Hydrothermal alteration and its genetic implication in the Gasado volcanic-hosted epithermal gold-silver deposit: Use in exploration. J. Miner. Soc. Korea 2002, 15, 205–220. [Google Scholar]
  31. Kim, S.; Baek, S.; Han, Y.; Jeon, H. Laboratory testing of Scheelite flotation from raw ore in Sangdong mine for process development. Minerals 2020, 10, 971. [Google Scholar] [CrossRef]
  32. Han, Y.; Han, S.; Kim, B.; Yang, J.; Choi, J.; Kim, H.; You, K.; Kim, H. Flotation separation of quartz from apatite and surface forces in bubble-particle interactions: Role of pH and cationic amine collector contents. J. Ind. Eng. Chem. 2019, 70, 107–115. [Google Scholar] [CrossRef]
  33. Meloy, T. Analysis and optimization of mineral processing and coal-cleaning circuits—Circuit analysis. Int. J. Miner. Process. 1983, 10, 61–80. [Google Scholar] [CrossRef]
  34. Meloy, T. Optimizing for grade or profit in mineral processing circuits—Circuit analysis. Int. J. Miner. Process. 1983, 11, 89–99. [Google Scholar] [CrossRef]
  35. Noble, A.; Luttrrell, G.H.; Amini, S.H. Linear circuit analysis: A tool for addressing challenges and identifying opportunities in process circuit design. Mining. Metall. Explor. 2019, 36, 159–171. [Google Scholar] [CrossRef]
  36. Yianatos, J.; Vallejos, P.; Grau, R.; Yanez, A. New approach for flotation process modelling and simulation. Miner. Eng. 2020, 156, 106482. [Google Scholar] [CrossRef]
  37. Moon, D.; Koh, S.; Lee, K. Geochemistry of the Moisan epithermal gold-silver deposit in Haenam area. Econ. Environ. Geol. 2010, 43, 491–503. [Google Scholar]
  38. Han, I.; Ahn, Y.; Chi, S.; Bae, K.; Kim, H. Froth flotation of Au-Ag ore from epithermal deposit in Haenam. J. Korean Soc. Miner. Energy Resour. Eng. 2011, 48, 701–712. [Google Scholar]
  39. Lee, W.; Jung, M.; Han, S.; Park, S.; Lim, G.; Park, J. Mathematical modeling and computational simulation on ball milling in domestic goldsilver mineral processing plant. J. Korean Soc. Miner. Energy Resour. Eng. 2017, 54, 502–511. [Google Scholar]
  40. Han, S.; Jeong, M.; Lee, W.; Lim, G.; Park, J. Simulation of grinding/classification circuit in domestic gold ore processing plant using energy-based grinding model and mathematical classification model. J. Korean Soc. Miner. Energy Resour. Eng. 2018, 55, 8–19. [Google Scholar] [CrossRef]
  41. Han, S.; You, K.; Kim, K.; Park, J. Measurement of the attachment force between an air bubble and a mineral surface: Relationship between the attachment force and flotation kinetics. Langmuir 2019, 35, 9364–9373. [Google Scholar] [CrossRef]
Figure 1. Flowsheet of gold ore flotation circuit. Blue line represents stream of floated products, and red line represents stream of sinked products after flotation. Red point represents sampling point: ① cyclone overflow (o/f); ② feed; ③ rougher 1 concentrate; ④ rougher 2 concentrate; ⑤ scavenger concentrate ⑥ final tailing; ⑦ cleaner tailing; ⑧ final concentrate.
Minerals 11 01065 g001
Figure 2. Flow diagram of flotation circuit of alternative circuits. (a) Case 1: transfer float from rougher 1 bank to cleaner 3, transfer float from rougher 2 bank to cleaner 4; (b) Case 2: scavenger bank is added; (c) Case 3: open circuit with addition of cleaner bank; (d) Case 4: closed circuit with addition of cleaner bank. Blue line represents stream of floated products, and red line represents stream of sinked products after flotation. Green text represents changes in the existing process.
Minerals 11 01065 g002
Figure 3. Example of linear circuit analysis. F is the feed rate, T1 the sunk product rate, P1 and P2 the recovery for each unit bank, and C the concentrate rate.
Minerals 11 01065 g003
Figure 4. Mineralogical properties of gold ore: (a) XRD patterns and (b) photographs of gold ore (Py: pyrite, Qtz: quartz, Mu: muscovite).
Minerals 11 01065 g004
Figure 5. Cumulative flotation recovery of Gasado gold ore for gold (red circle), pyrite (orange rectangular), muscovite (blue triangle), and quartz (green diamond) as a function of flotation time. Dotted line represents flotation recovery calculated using Equation (1). R is the maximum recovery, k the flotation rate constant, and R2 the coefficient of determination.
Minerals 11 01065 g005
Figure 6. Circuit partition functions of current process (black line) and alternative process (cases 1–4). Dotted line represents diagonal line. SE is separation efficiency (d(C/F)/dP, P = 0.5).
Minerals 11 01065 g006
Figure 7. Comparison between experimental and simulated grade distributions of each stream in industrial plant: (a) Gold, (b) pyrite, (c) quartz, and (d) muscovite.
Minerals 11 01065 g007
Figure 8. Simulated mass balance of current circuit of gold ore flotation. Blue line represents stream of floated products, and red line represents stream of sinked products after flotation. Black text is the mass flow rate. Green text is the gold grade at each node.
Minerals 11 01065 g008
Figure 9. Simulated mass balance of current process for processing gold ore.
Minerals 11 01065 g009
Figure 10. Simulated mass balance of current process using alternative process of Case 1. Blue line represents stream of floated products, and red line represents stream of sinked products after flotation. Black text is the mass flow rate. Green text is the gold grade at each node.
Minerals 11 01065 g010
Table 1. Detailed information regarding flotation circuit in target beneficiation plant.
Number of BanksNumber of CellsCell Size, m3 * Effective Volume, m3
Conditioner-12.4 × 2.49.8
Rougher241.5 × 1.3 × 1.22.1
Scavenger141.5 × 1.4 × 1.2 2.1
Cleaner511.1 × 1.4 × 0.9 1.2
* Conditioner: diameter × higher; other cells: width × length × height.
Table 2. Mineral composition of gold ore.
Au (g/t)Pyrite (wt.%)Quartz (wt.%)Muscovite (wt.%)Others (wt.%)
gold ore6.8 ± 1.29.6 ± 0.663.1 ± 1.128.0 ± 1.30.5 ± 0.2
Publisher’s Note: MDPI stays neutral with regard to jurisdictional claims in published maps and institutional affiliations.

