Article

Procedures of Detecting Damage to a Conveyor Belt with Use of an Inspection Legged Robot for Deep Mine Infrastructure

KGHM Cuprum Research and Development Centre Ltd., Gen. W. Sikorskiego 2-8, 53-659 Wroclaw, Poland
*
Author to whom correspondence should be addressed.
Minerals 2021, 11(10), 1040; https://doi.org/10.3390/min11101040
Submission received: 7 September 2021 / Revised: 20 September 2021 / Accepted: 22 September 2021 / Published: 25 September 2021

Abstract

:
Conveying systems are responsible for a large part of continuous horizontal transportation in underground mines. The total length of a conveyor network can reach hundreds of kilometers, while a single conveyor usually has a route length of about 0.5–2 km. The belt is a critical and one of the most costly components of the conveyor, and damage to it can result in long unexpected stoppages of production. This is why proper monitoring of conveyor belts is crucial for continuous operation. In this article, algorithms for the detection of potential damage to a conveyor belt are described. The algorithms for analysis used video recordings of a moving belt conveyor, which, in case the of hazardous conditions of deep mines, can be collected, for example, by a legged autonomous inspection robot. The video was then analyzed frame by frame. In this article, algorithms for edge damage detection, belt deviation, and conveyor load estimation are described. The main goal of the research was to find a potential application for image recognition to detect damage to conveyor belts in mines.

1. Introduction

The availability of ready-to-use machines throughout industry is one of the main factors influencing effective production and ensuring its continuity. For this reason, the technical condition of infrastructure elements is regularly inspected. Operation and maintenance of mining assets are carried out by a properly trained maintenance worker with valid authorizations [1]. The schedule of periodic machine service strictly defines the scope of maintenance and repair activities for a given machine, carried out monthly, quarterly, semi-annually, and annually. Furthermore, daily inspections are performed before and after each machine start-up by the maintenance technician or machine operator. The main goal of the mining industry is maximum automation of the mining processes. Therefore, most of the assets are controlled by industrial automation. The devices are functionally connected with several other devices, creating an extensive network of technical objects. Each object has an assigned function, and there is a certain hierarchy of these objects and rules of cooperation. Such systems of “connected vessels” occur, among others, in conveyor transportation systems, in central air-conditioning, or in drainage systems. In such cases, the bottleneck objects are critical. For this type of cases, condition monitoring is developed, but in many cases, it is too expensive and provides only a limited amount of information regarding the technical and operational conditions of the mining assets.
Belt conveyors are commonly used devices in continuous horizontal transport of bulk material in mining. In underground mining, the length of a single conveyor usually fluctuates from several hundred meters to several kilometers (depending on the place and destination). Due to their role in the production process, their work should be undisturbed and uninterrupted. Therefore, the greatest challenge for a mine is to achieve full availability of these machines and a minimum percentage of unplanned events. Conveyor failure may stop the production process, which is unfavorable for economic or safety reasons. The repair of some failures may take a long time, which results from many components of mining staff operations such as failure diagnosis, area protection, first operational decisions, disassembly, transport of material, repair, and assembly. The critical components are primarily the belt (whole loop), the upper and lower rollers, and the drive.
For the automatic detection of belt defects, the solutions used are based on magnetic signals, RGB, and thermal images. These are usually portable measuring devices supporting inspection works [2,3,4].
In the case of the belt, damage may concern the top rubber cover, the core rubber (adhesive compound), steel cords, the bottom cover, and the rubber edge, which can take many forms (cuts, abrasions, tears, cracks, gouges). The genesis of belt damage, among others, may result from material impacts at the loading point [5,6]. The damages that this work focuses on are torn edges and belt deviation. Edge analysis can tell us the percentage of belt wear, and the problem is also partly the cause of belt deviation. Belt deflection is one of the most common defects, and it can have a variety of reasons [7,8,9], but long-term deviation is especially dangerous because it destroys the entire length of the belt, but it can also turn into a fire.
In the literature, there are many examples describing the diagnostics of the conveyor, mainly using stationary measuring stations that perform diagnostics using: laser [10,11], vibrations [12,13,14], thermovision [15], acoustics [16,17], radio-frequency identification (RFID) [18], and cameras [19,20]. Given a research problem regarding the damage presented, the state-of-the-art approaches focus mainly on cameras, with single cases of using other technologies, such as lasers [21]. When diagnostics are based on a camera image, the following techniques are used: Convolutional Neural Network (CNN) [22], machine vision methods such as Hough Transform [23,24], or with a modification using wavelet transform [25]. Unfortunately, the above-mentioned methods usually have one of two main disadvantages that prevented their use in our case: (1) the presented use cases concerned only experimental work in the laboratory; (2) stationary systems were used, observing a maximum of one conveyor at a time. In fact, there are known cases of using autonomous robots for conveyor diagnostics, such as Unmanned Aerial Vehicles (UAVs) [26,27], Unmanned Ground Vehicles (UAGs) [28,29], or other robots suspended above [30,31,32] or below conveyor belt [33]. Our approach involved the use of an UGV that would constantly monitor the belt condition of conveyors, in particular by searching for belt deviation and torn edges with the use of a camera and machine vision techniques. The novelty of our research is: (1) the use of an autonomous robot for monitoring the belt of conveyors in particularly dangerous and inaccessible places; (2) extending the applicability of the algorithm in various aspects of diagnosing the condition of the belt and its operation; (3) the application and adaptation of methods in a difficult operating environment of the conveyor in the industrial conditions of an underground mine (dust, humidity, poor lighting).
This paper is organized as follows: Section 2 describes the autonomous legged inspection robot that was used for this research and the inspection procedure. The methods for damage detection and the results are presented in Section 3. Finally, Section 4 presents our conclusions.

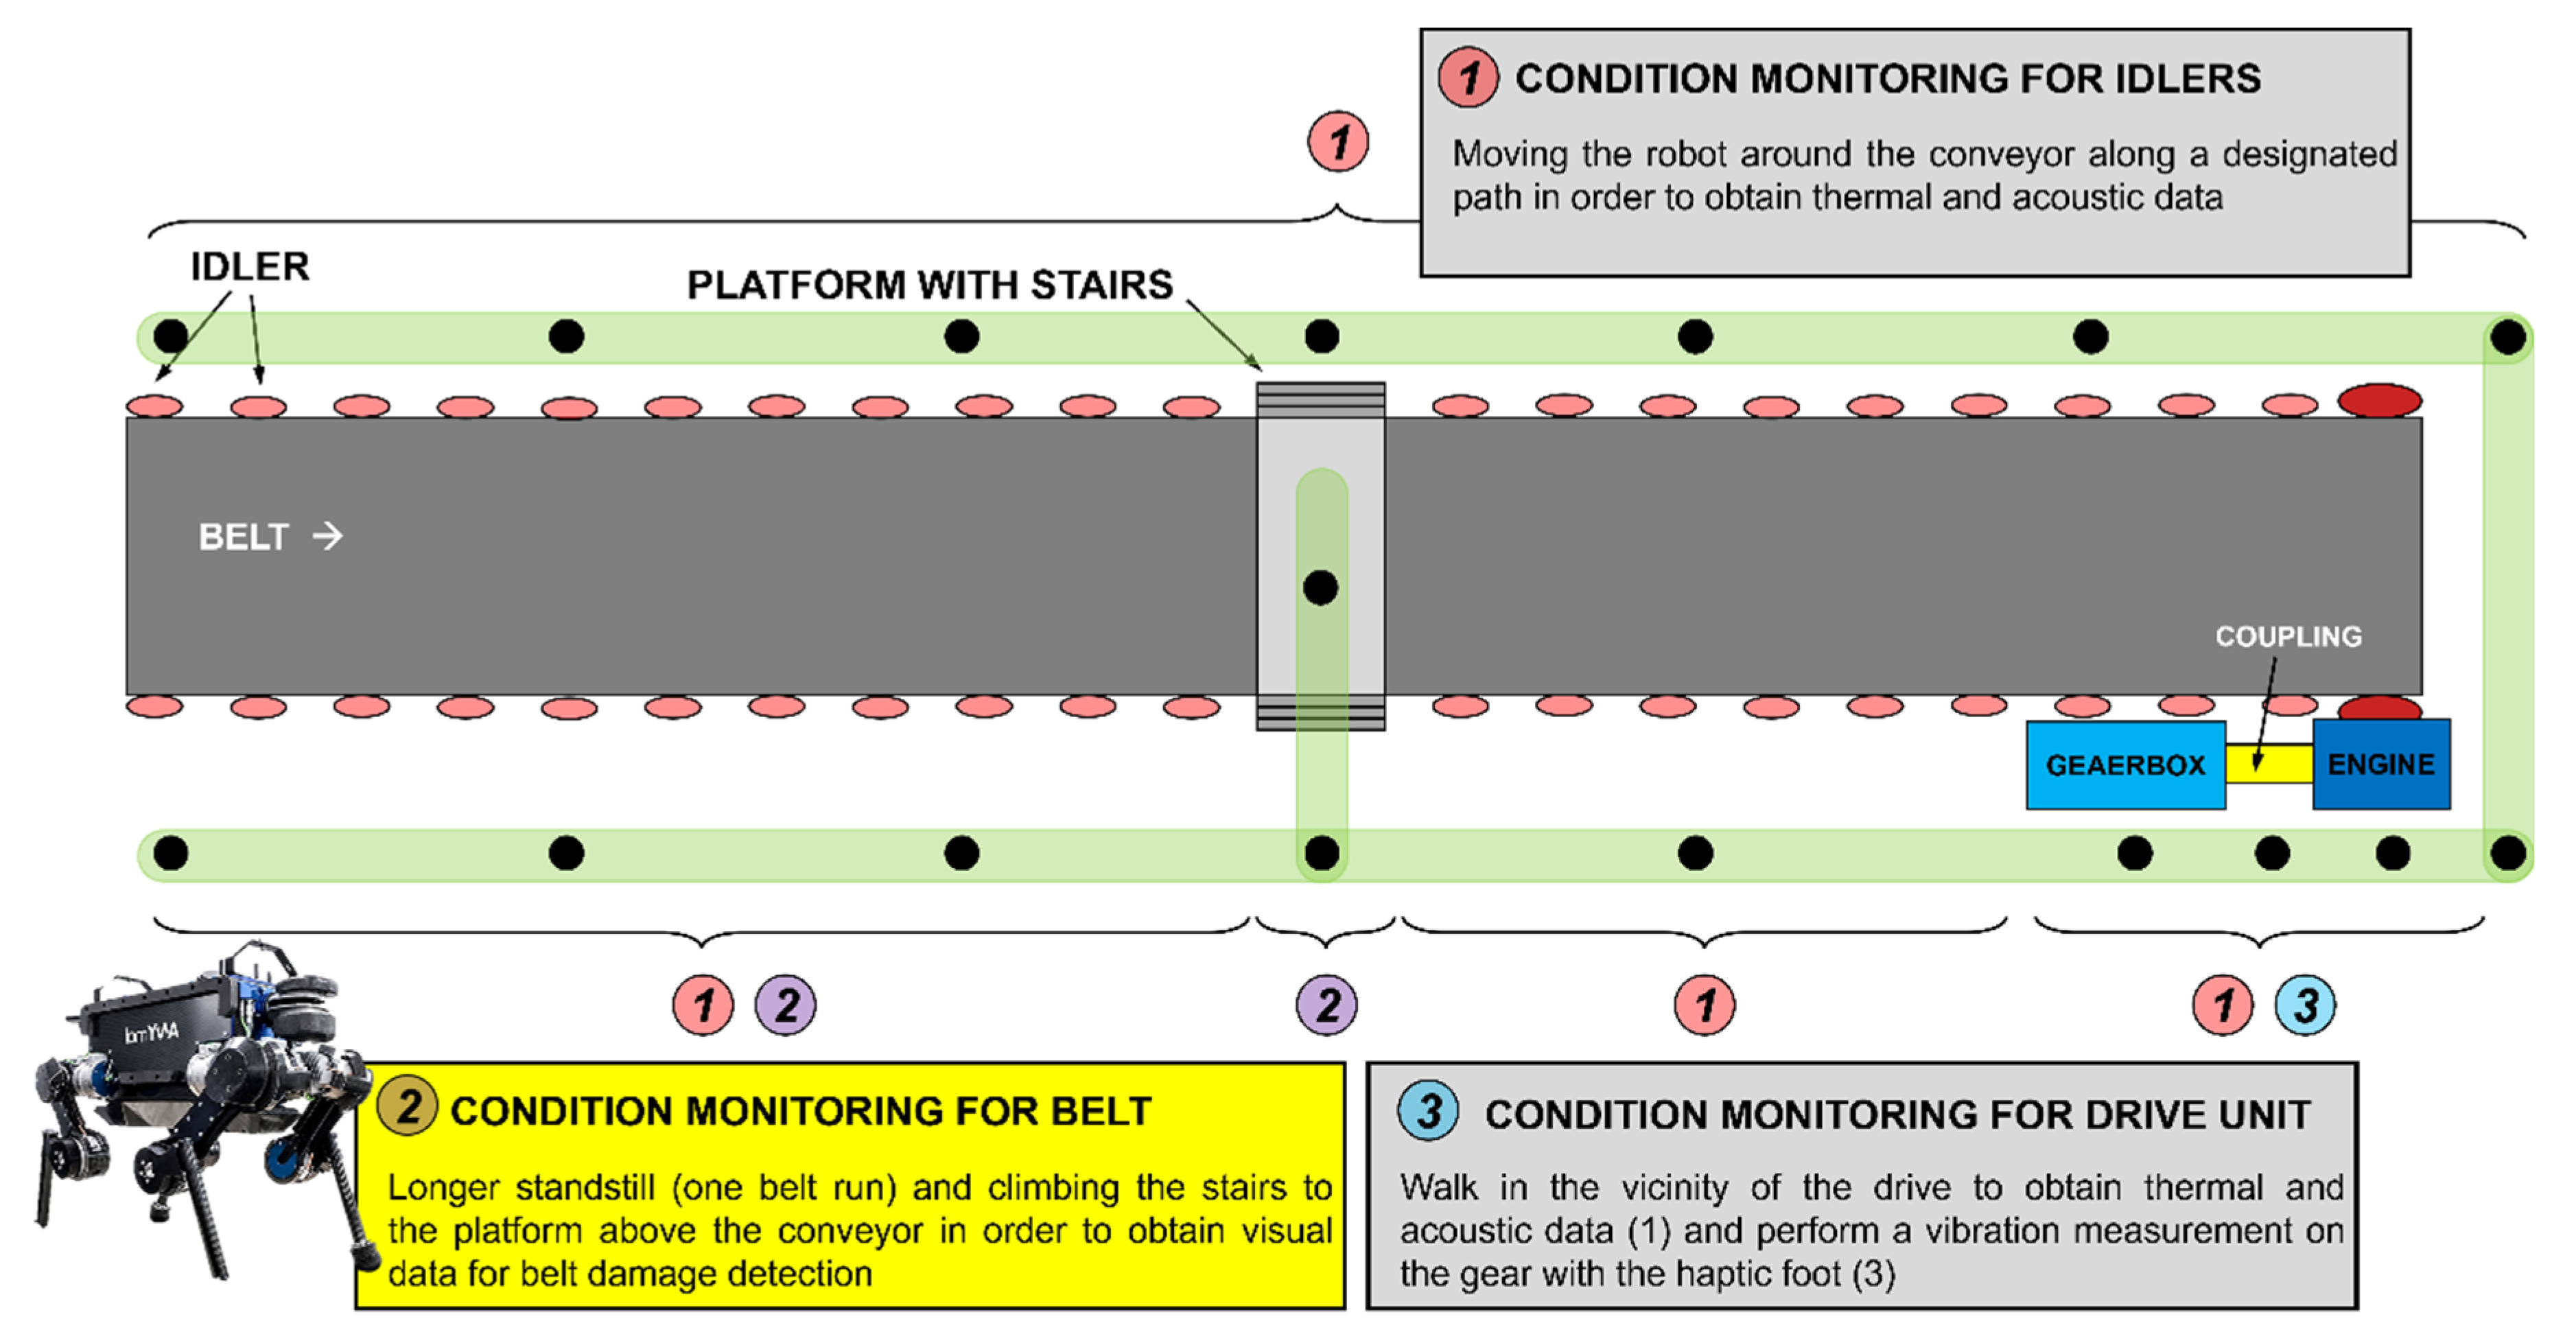
2. Autonomous Inspection Robot and Inspection Procedure

For development and testing of the algorithms, a video was used that was acquired by a semi-autonomous ANYmal legged robot (Figure 1). The main task of the robot was to evaluate the machines condition and the technical infrastructure in an underground mine. This work is a part of the THING (subTerranean Haptic INvestiGator) project, which involves using a modified commercial robot to take over the necessary monitoring processes currently performed by humans [34,35,36]. The inspection procedure, with the use of this apparatus together with the description of other algorithms (damage detection based on acoustics and thermovision), has been presented in the previous works [37,38].
For the purposes of the inspection, the robot walked around the conveyor route and recorded a video. A simplified path and whole procedure is shown in Figure 2. The inspection video captured the two main views of the conveyor belt: the top view and side view.
Based on the recordings of the conveyor belt and the planned road, it was possible to determine a set of algorithms that would monitor the technical condition of the edges of the belt and the transferred material. Different algorithms were used for each of the views and also differed depending on whether the conveyor belt was full or not. The inspection procedure is listed below:
  • Take a recording of the conveyor belt from one side:
    • Damaged edges detection algorithm for a conveyor belt: side view.
  • Ascent to the ramp.
  • Take a recording of the conveyor belt from above:
    • Detection of conveyor belt edges.
    • Verification of whether the conveyor is empty/filled (detection of load on the conveyor);
    If empty: damaged edges detection algorithm for a conveyor belt: top view;
    If filled: detection of conveyor belt deviation as uneven load distribution.
  • Descent to the other side.
  • Take a recording of the conveyor belt from the other side:
    • Damaged edges detection algorithm for a conveyor belt: side view.

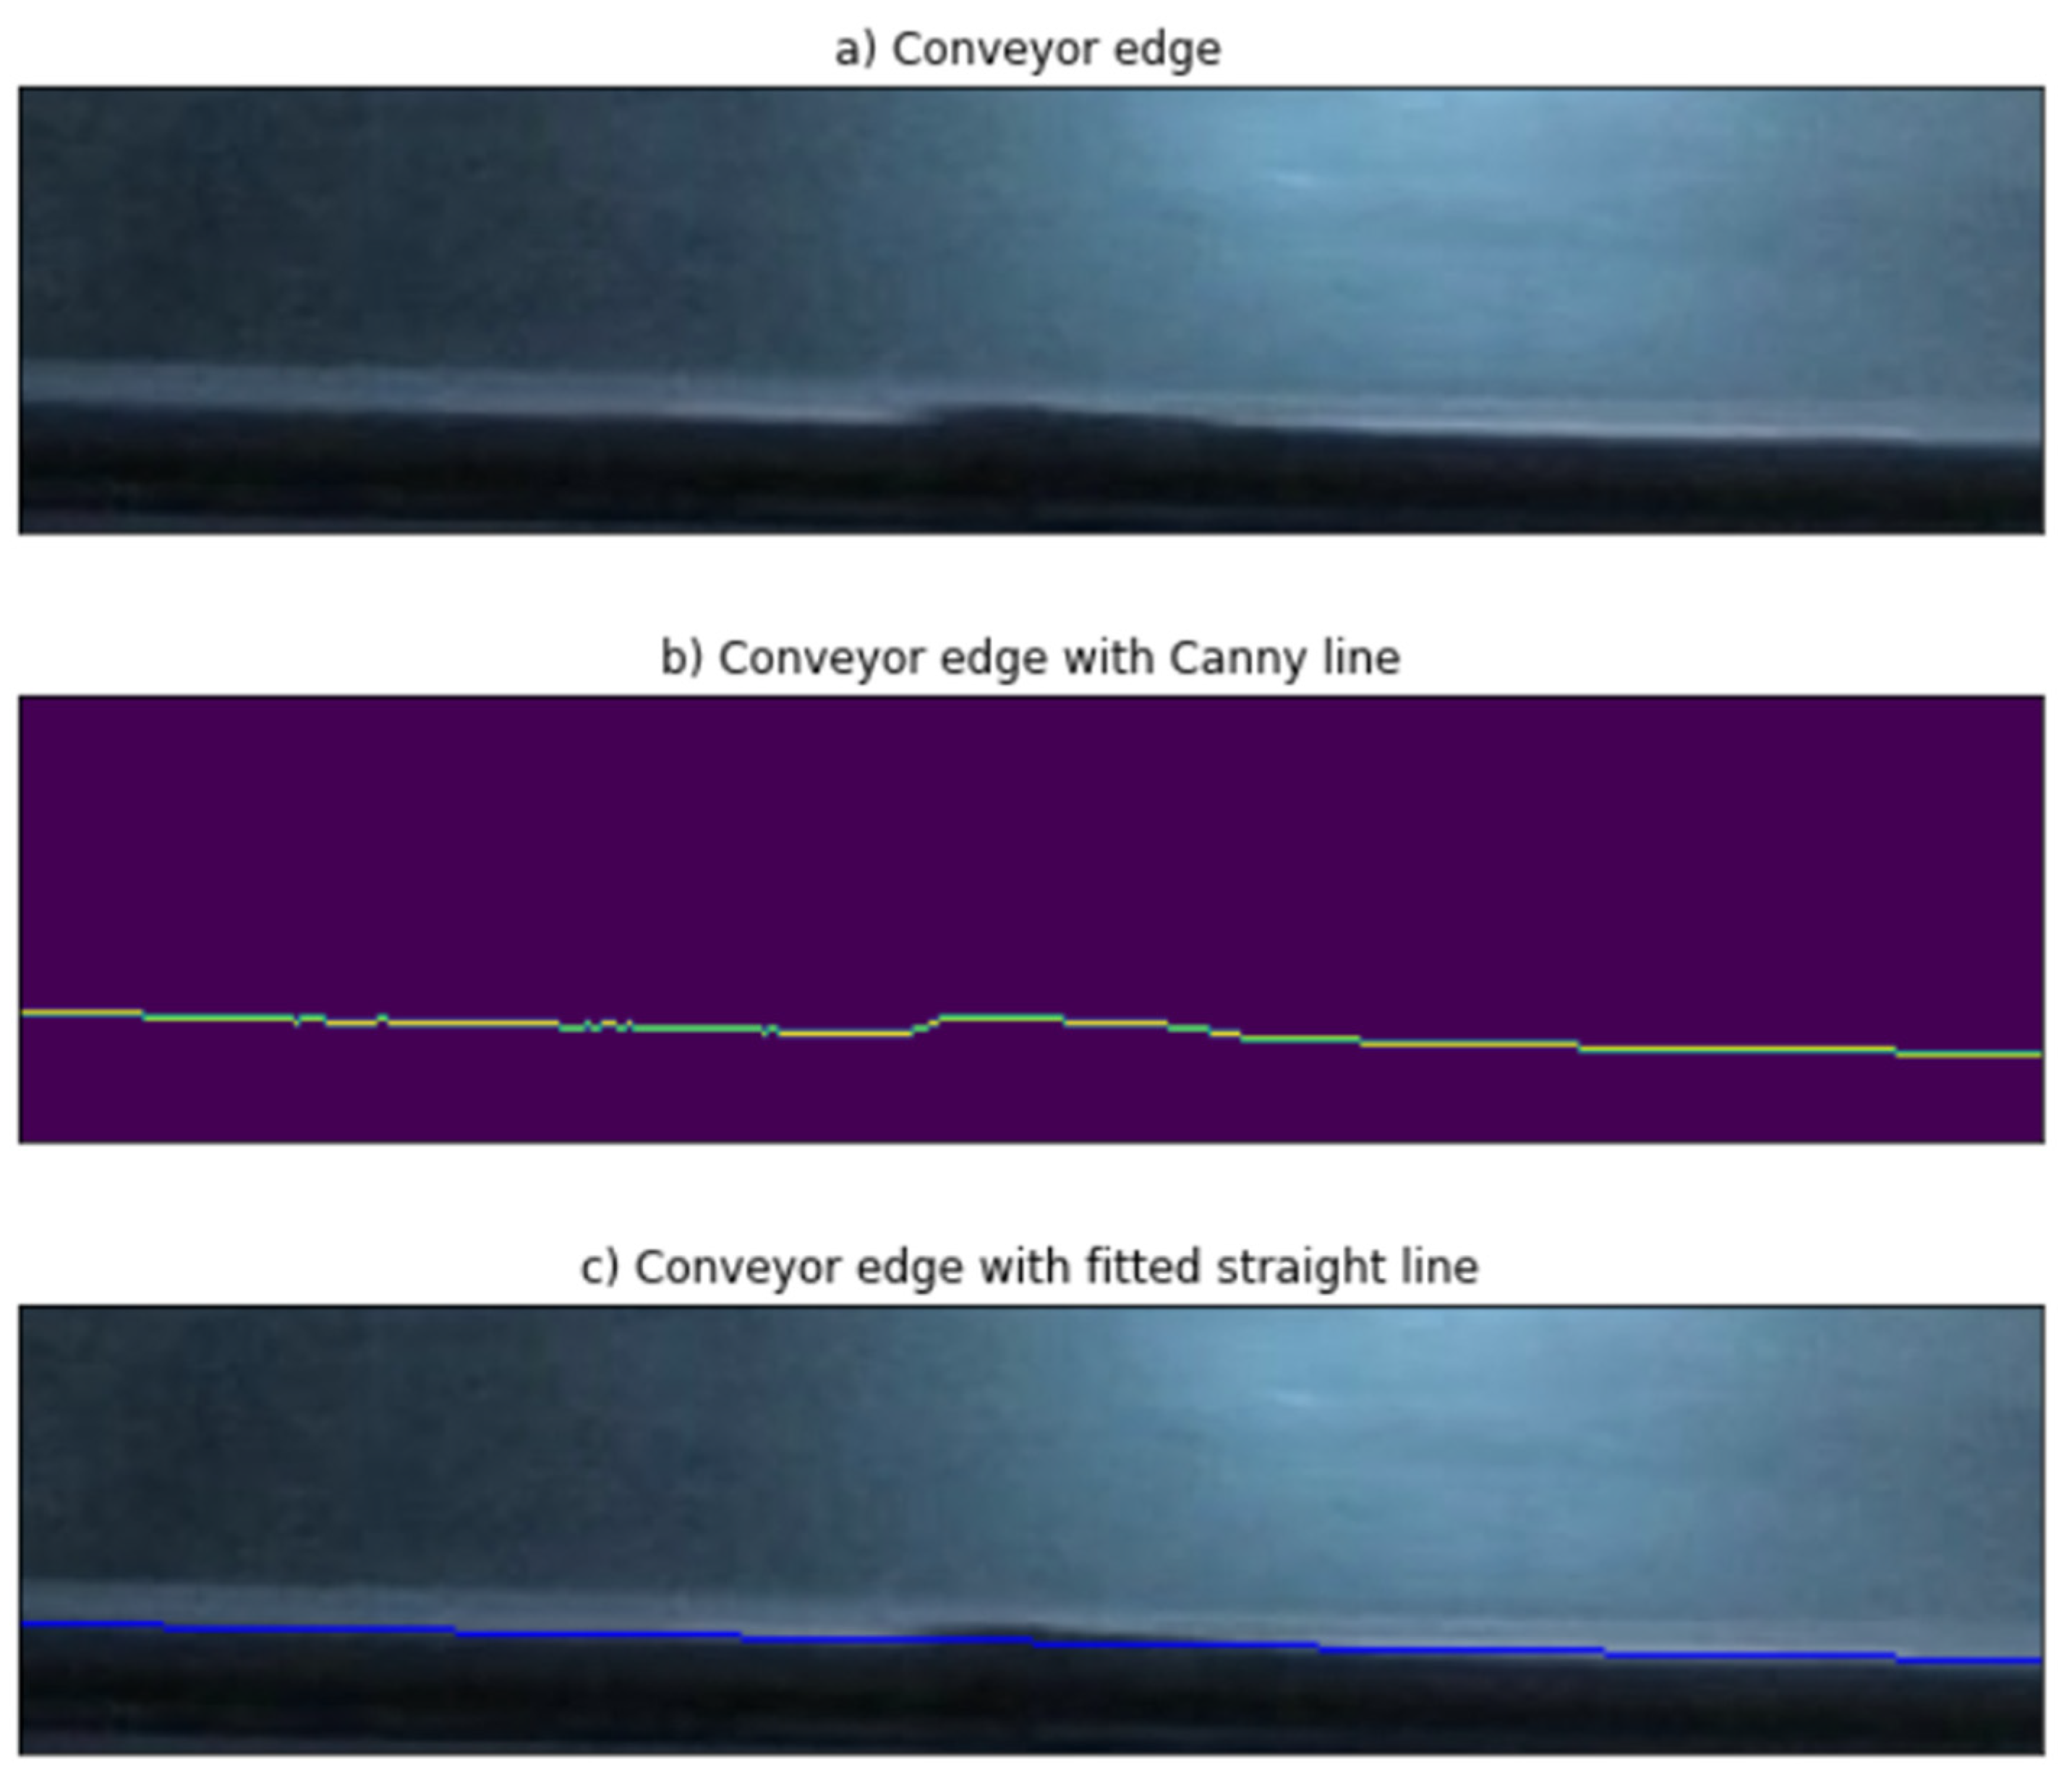
3. Algorithms and Results

In this section, the algorithms that are the result of the research are presented. The proposed methods were mainly based on the edge detection of objects present on the frame (which was the conveyor belt). In our study, we used the well-known Canny Edge Detection algorithm and tailored it to meet the underground mine challenges [39]. The speed of the conveyor belt, the length of the conveyor, and their quantity made it difficult to monitor them in real time with the naked eye. The Canny Edge Detection algorithm was applied to a grayscale blurred frame. Due to this, it was possible to detect the edges. Basically, the principle of the method is reduced to a few basic steps:
  • Noise Reduction.
    A filter based on the first derivative of the Gaussian function is used as it is sensitive to the presence of noise in the raw unprocessed image. The effect of this action is a slightly blurred image that is not affected by noise in any significant way.
  • Determination of image intensity gradients.
    The edges in the image can have different orientations. The Canny algorithm uses four filters to detect horizontal, vertical, and diagonal edges in a smoothed image. Edge detection operators return the values of the first derivative for the horizontal ( G y ) and vertical ( G x ) direction. The slope (G—gradient, rate of rise) of the edge and its direction ( θ ) can be determined from the following Equation (1). The edge detection angle is rounded to four cases representing vertical, horizontal, and two diagonals.
    G = G x 2 + G y 2    θ = arctan ( G y G x )
  • Non-maximum pixel removal.
    The third step involves “thinning” the edges in a way that ensures their continuity. This is performed by applying non-maximum attenuation to remove false detected edges. The result is a solid line of individual pixels.
  • Hysteresis Progression—apply a double threshold to identify potential edges and connect them.
    The last step is to remove irrelevant edges that have a slope (steepness) below the set threshold. Hysteresis progression causes the next pixels to be appended to the already detected edges despite the slope decrease, until the lower detection threshold is reached. This procedure prevents the edges from being split in places of lower contrast.
The Canny algorithm is widely used in various fields such as image registration, image segmentation, region separation, object description, and recognition. In this article, the algorithm is used to determine the boundaries of the belt conveyor, and then, with the help of points determined by the algorithm, the statistics of the conveyor’s edge, such as its shift angle, are calculated. They are used to find any abnormal behavior that may indicate a belt deterioration. A general application diagram is shown in the figure below (Figure 3).

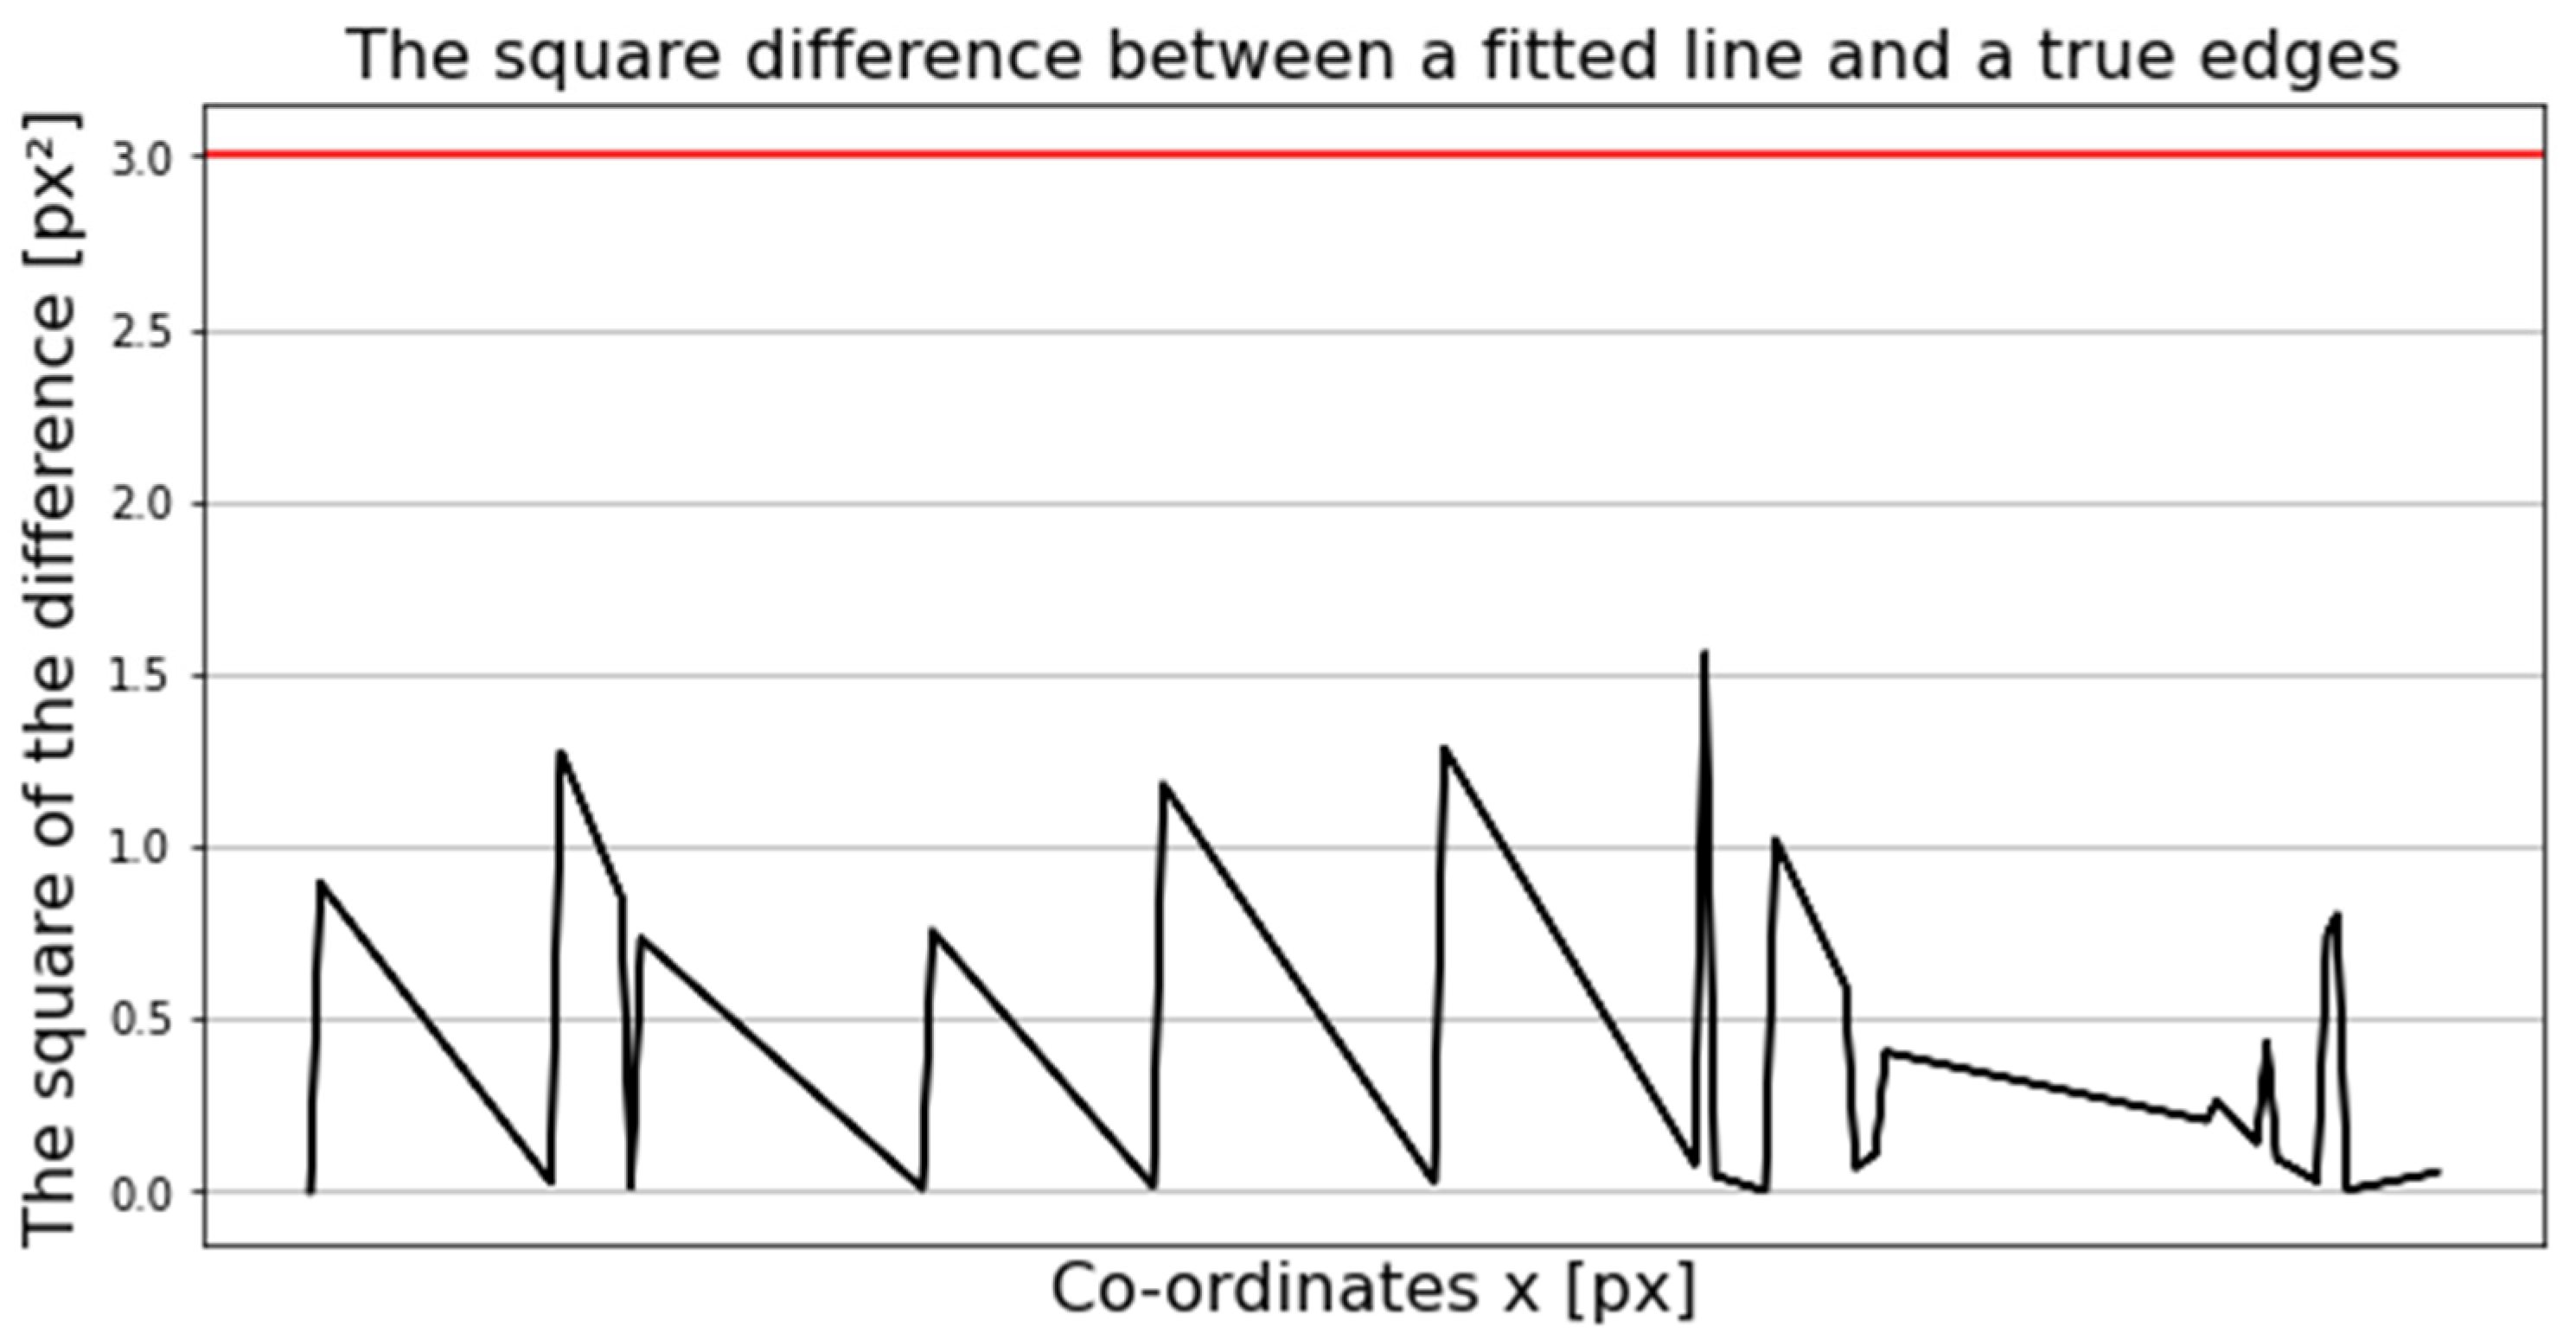
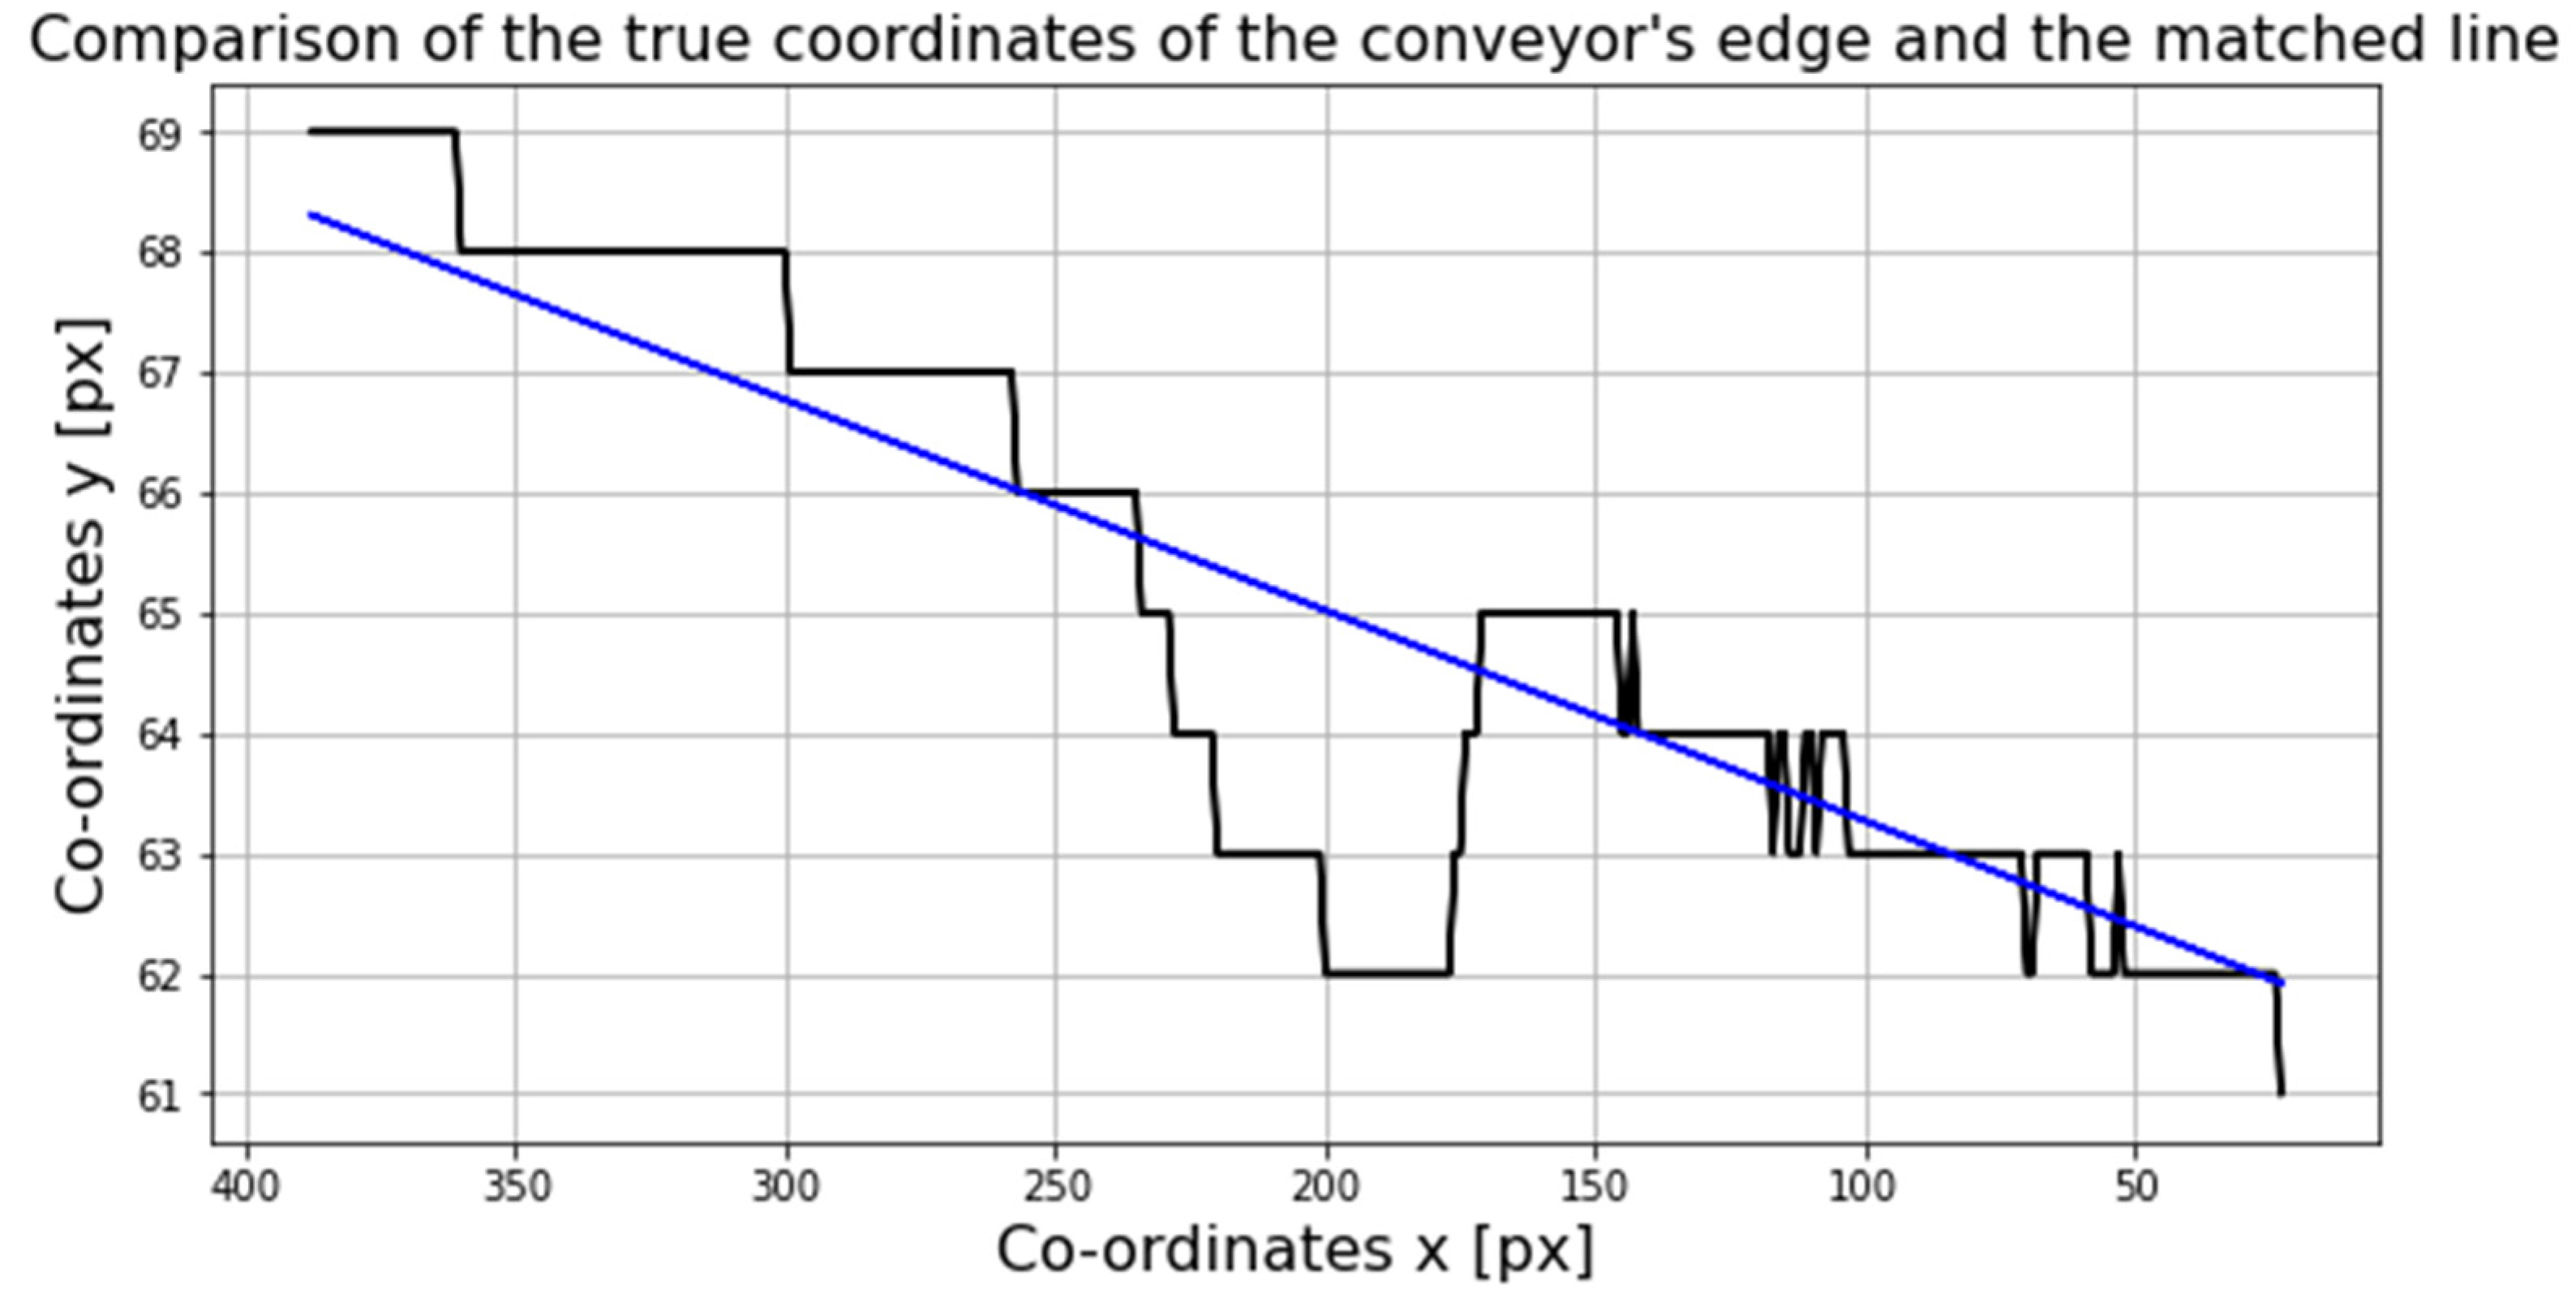
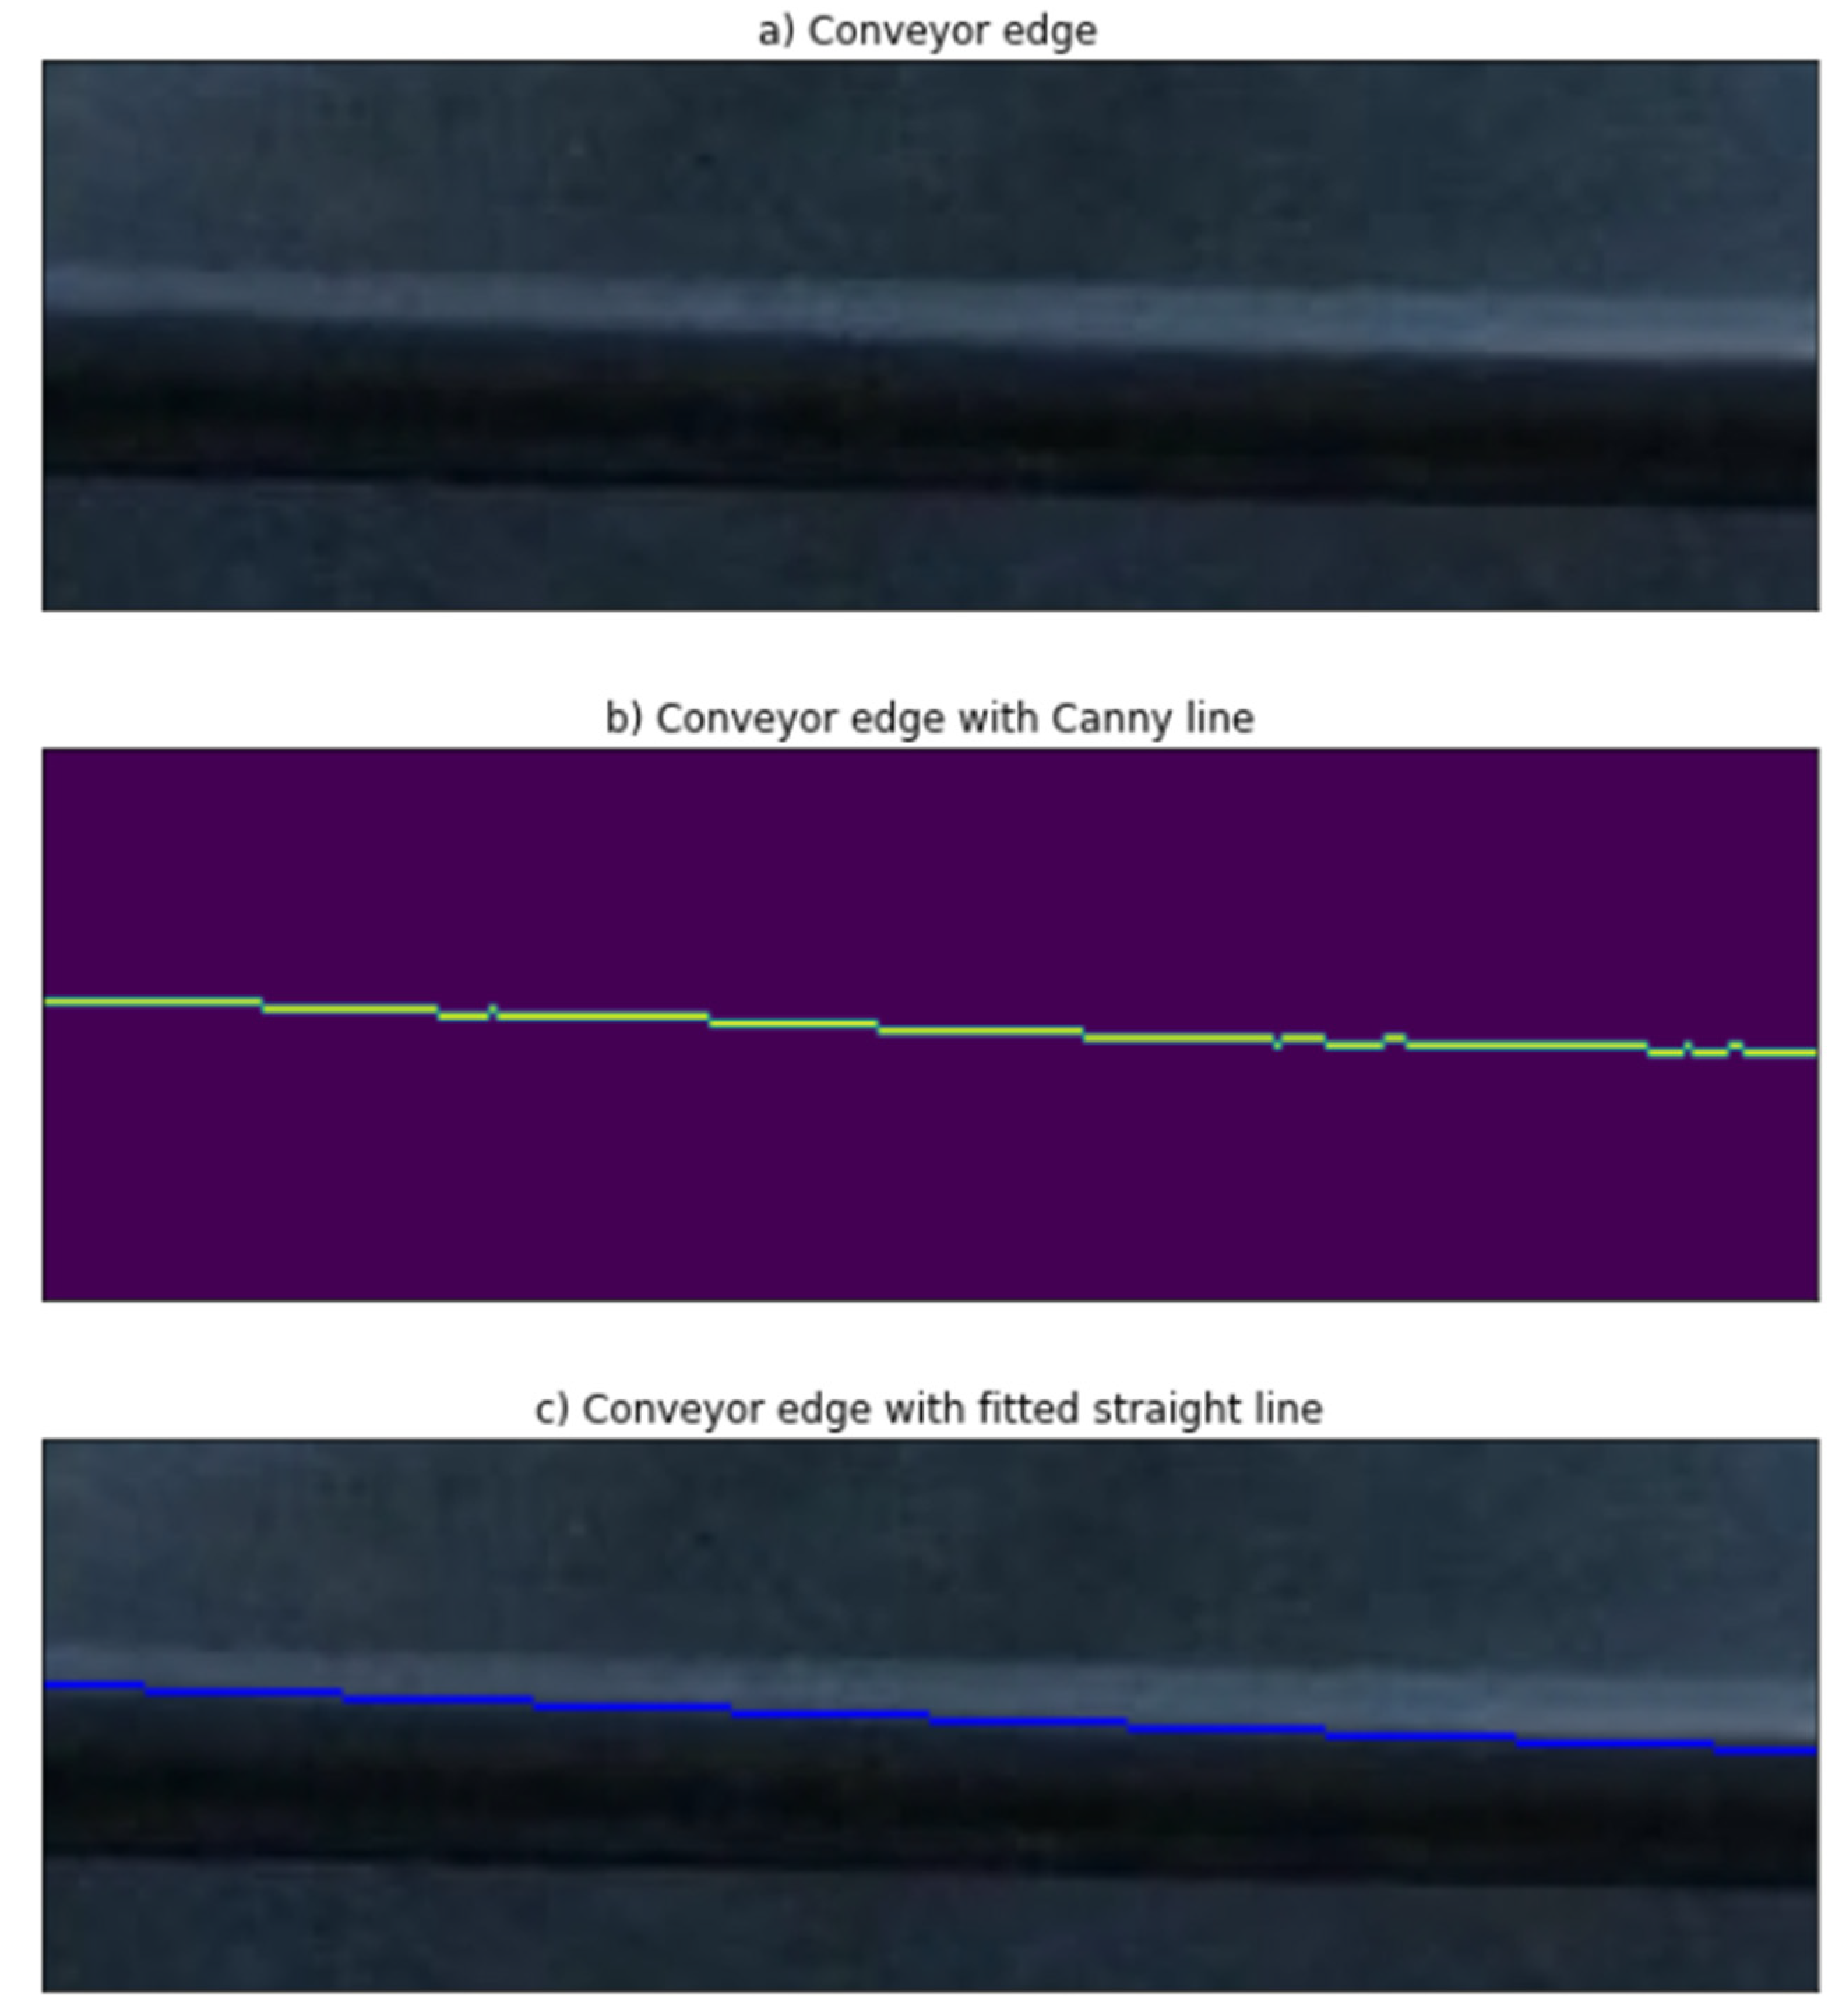
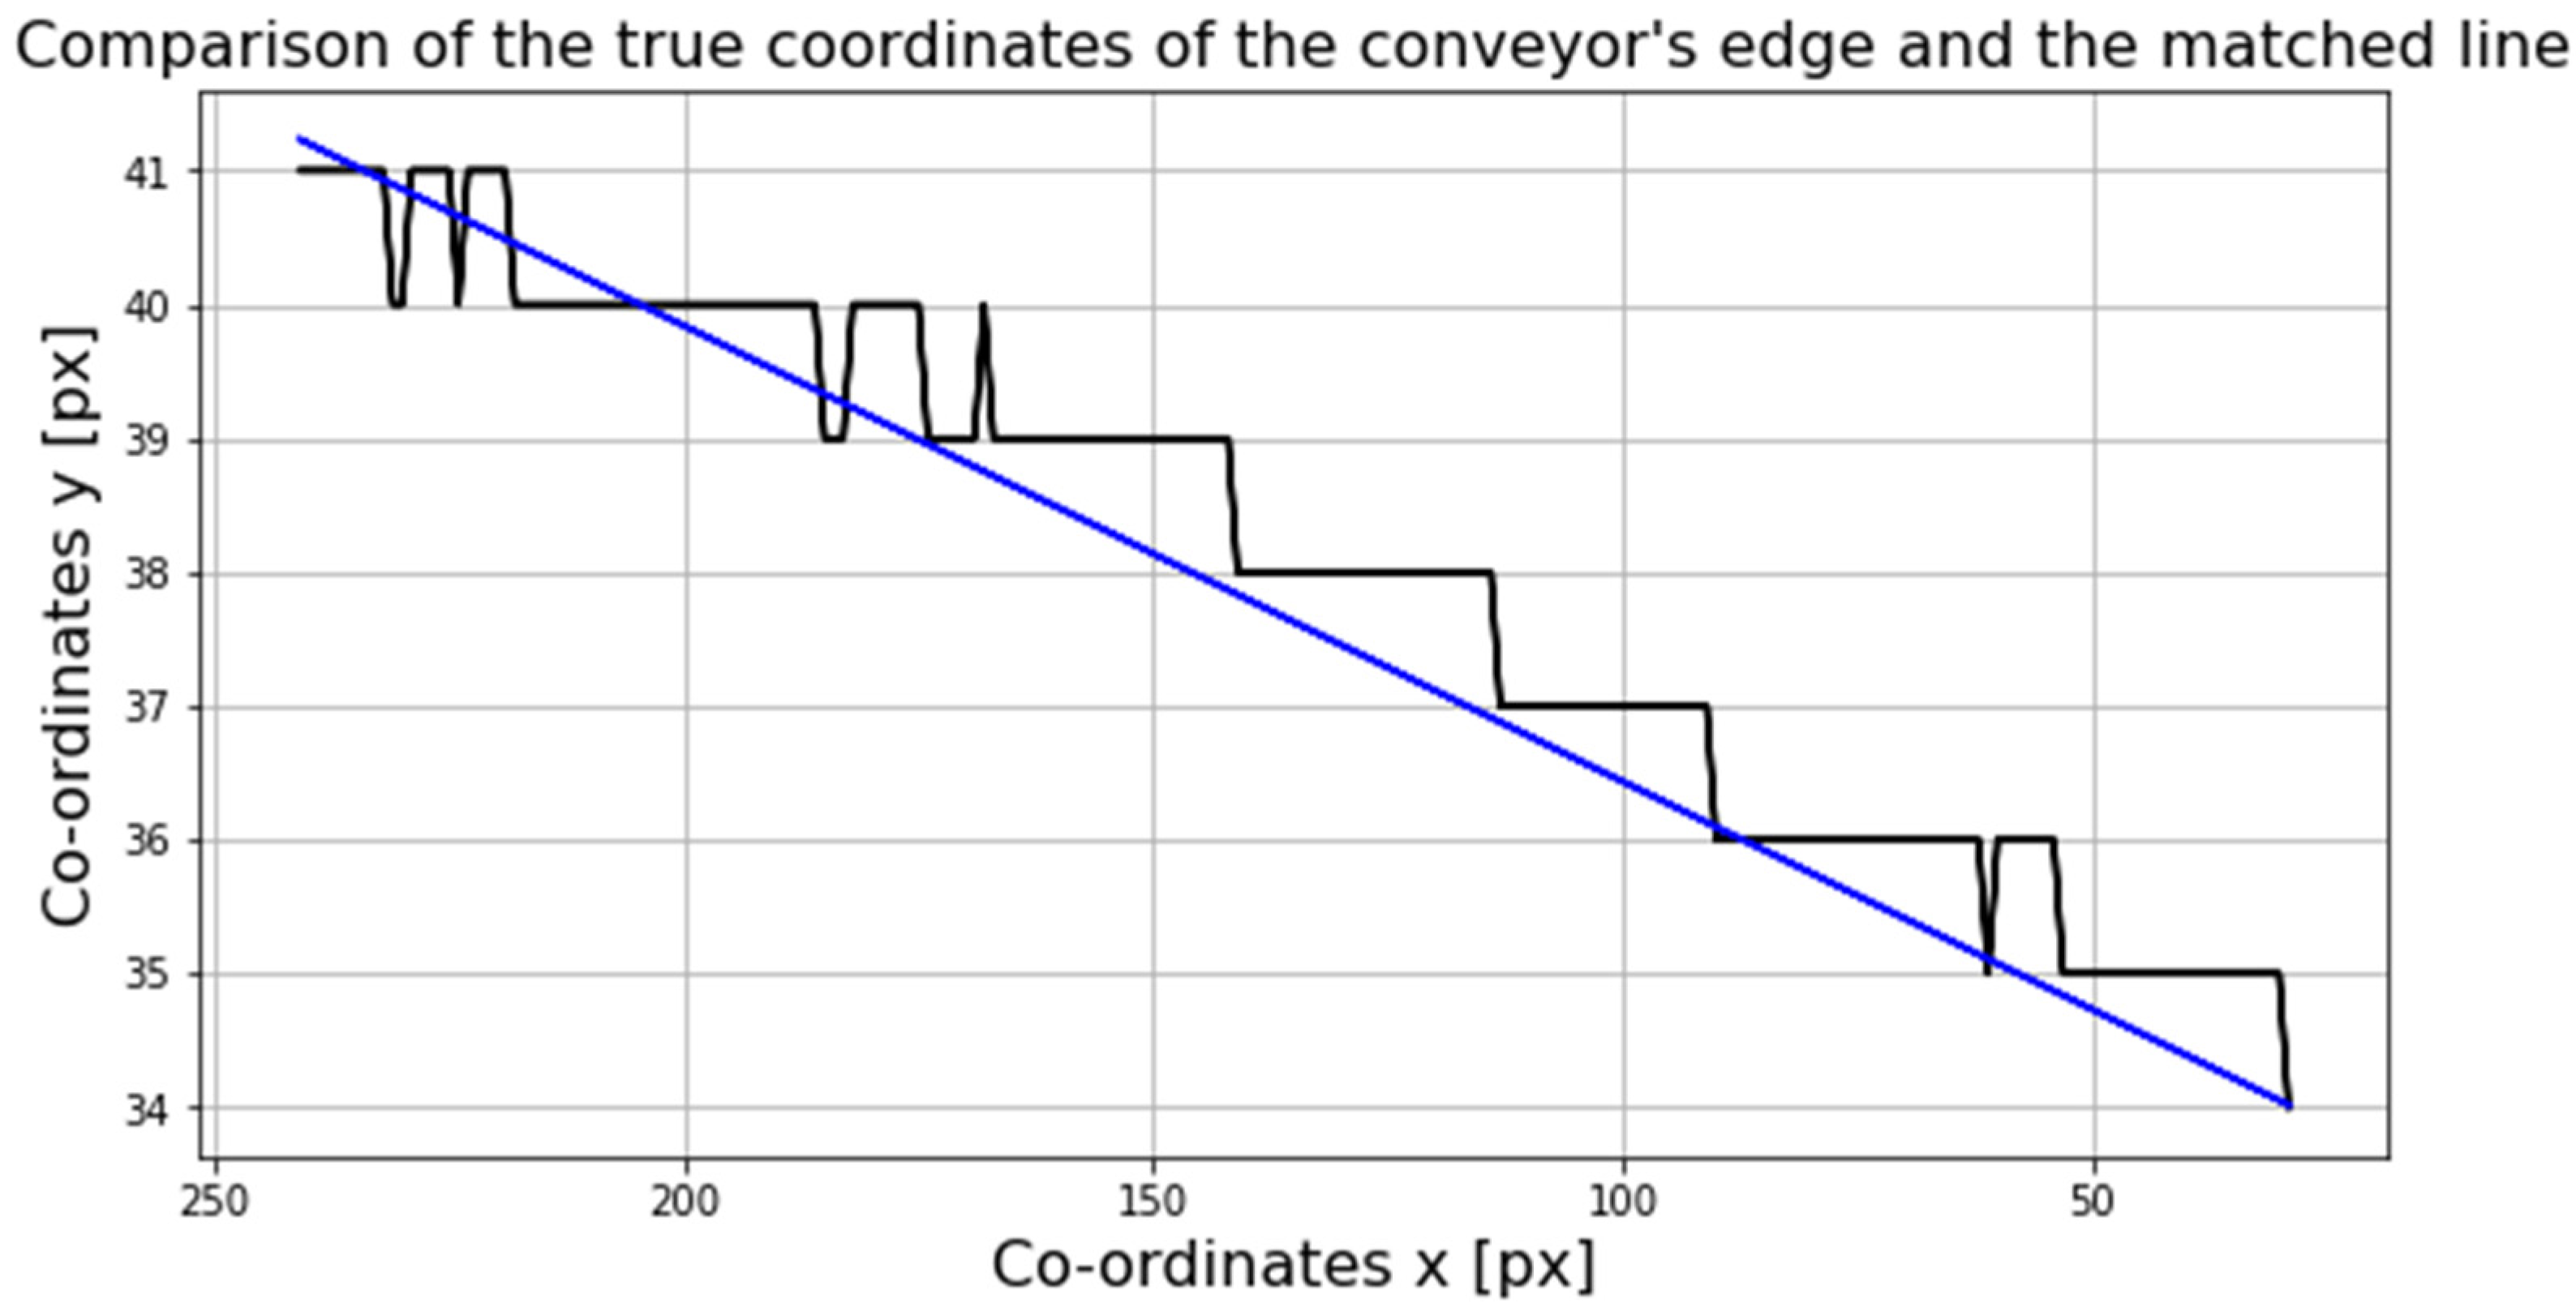
3.1. Damaged Edge Detection Algorithm for a Conveyor Belt: Top View and Side View

The algorithm for detecting the edges of the conveyor belt allows one to diagnose such damage as jagged rubber edges, belt shifts, and uneven material alignment, etc. To achieve this, firstly, the conveyor belt is cut from the selected frame. Then, by using the Canny Edge Detection algorithm, the contours are marked, which is shown in Figure 4.
Then, using the points from the Canny algorithm and linear regression, a straight line is fitted to the edge. The results can be seen in Figure 5.
In the above images, it can be seen where the lines differ. This place is also visible in the photo of the conveyor belt. A comparison between the Canny line and the straight line can be seen in Figure 6. Additionally, in Figure 7, the square of the difference between the two values was compared. The square was used to sharpen the differences. The figures show the moment when the values differed much more than the average. This corresponds to the location in the frame where the difference in edge behavior is visible. In the case of a possible anomaly, the difference between these values is visibly greater. The red line marks the potential threshold. The value was determined empirically while observing the behavior of the statistics for different frames of the film. Establishing it unambiguously requires more samples.
The algorithm was also tested on selected fragments where no anomalies were visible, which is shown below in Figure 8, Figure 9 and Figure 10. As can be seen, the difference function was fairly constant throughout the selected section of belt. Values usually did not exceed 1.5, with an average of around 1.0, while the anomaly had values around 5.0–9.0 with an average of around 7.0.
Similarly, it was possible to examine the quality of the edges of the belt by looking at it from the top view. The algorithm for this detection is very similar to the one used for side view, and most steps are the same: find the ends of the belt, fit the line, and check the difference. The only difference is that the position of the conveyor changes in the frame, which results in a vertical lines (instead of horizontal). One of the goals of a linear model is to see a variable change as a function of the variability of another variable; this is basically just a re-parameterized covariance. In the case of the algorithm for a top view, there is a variable with zero variation, so using a linear regression method would be unsuitable. In this configuration, to make a linear regression where Y values do not depend on X values, the method is to look for the solution of equation ay + b = x instead of the usual ax + b = y.

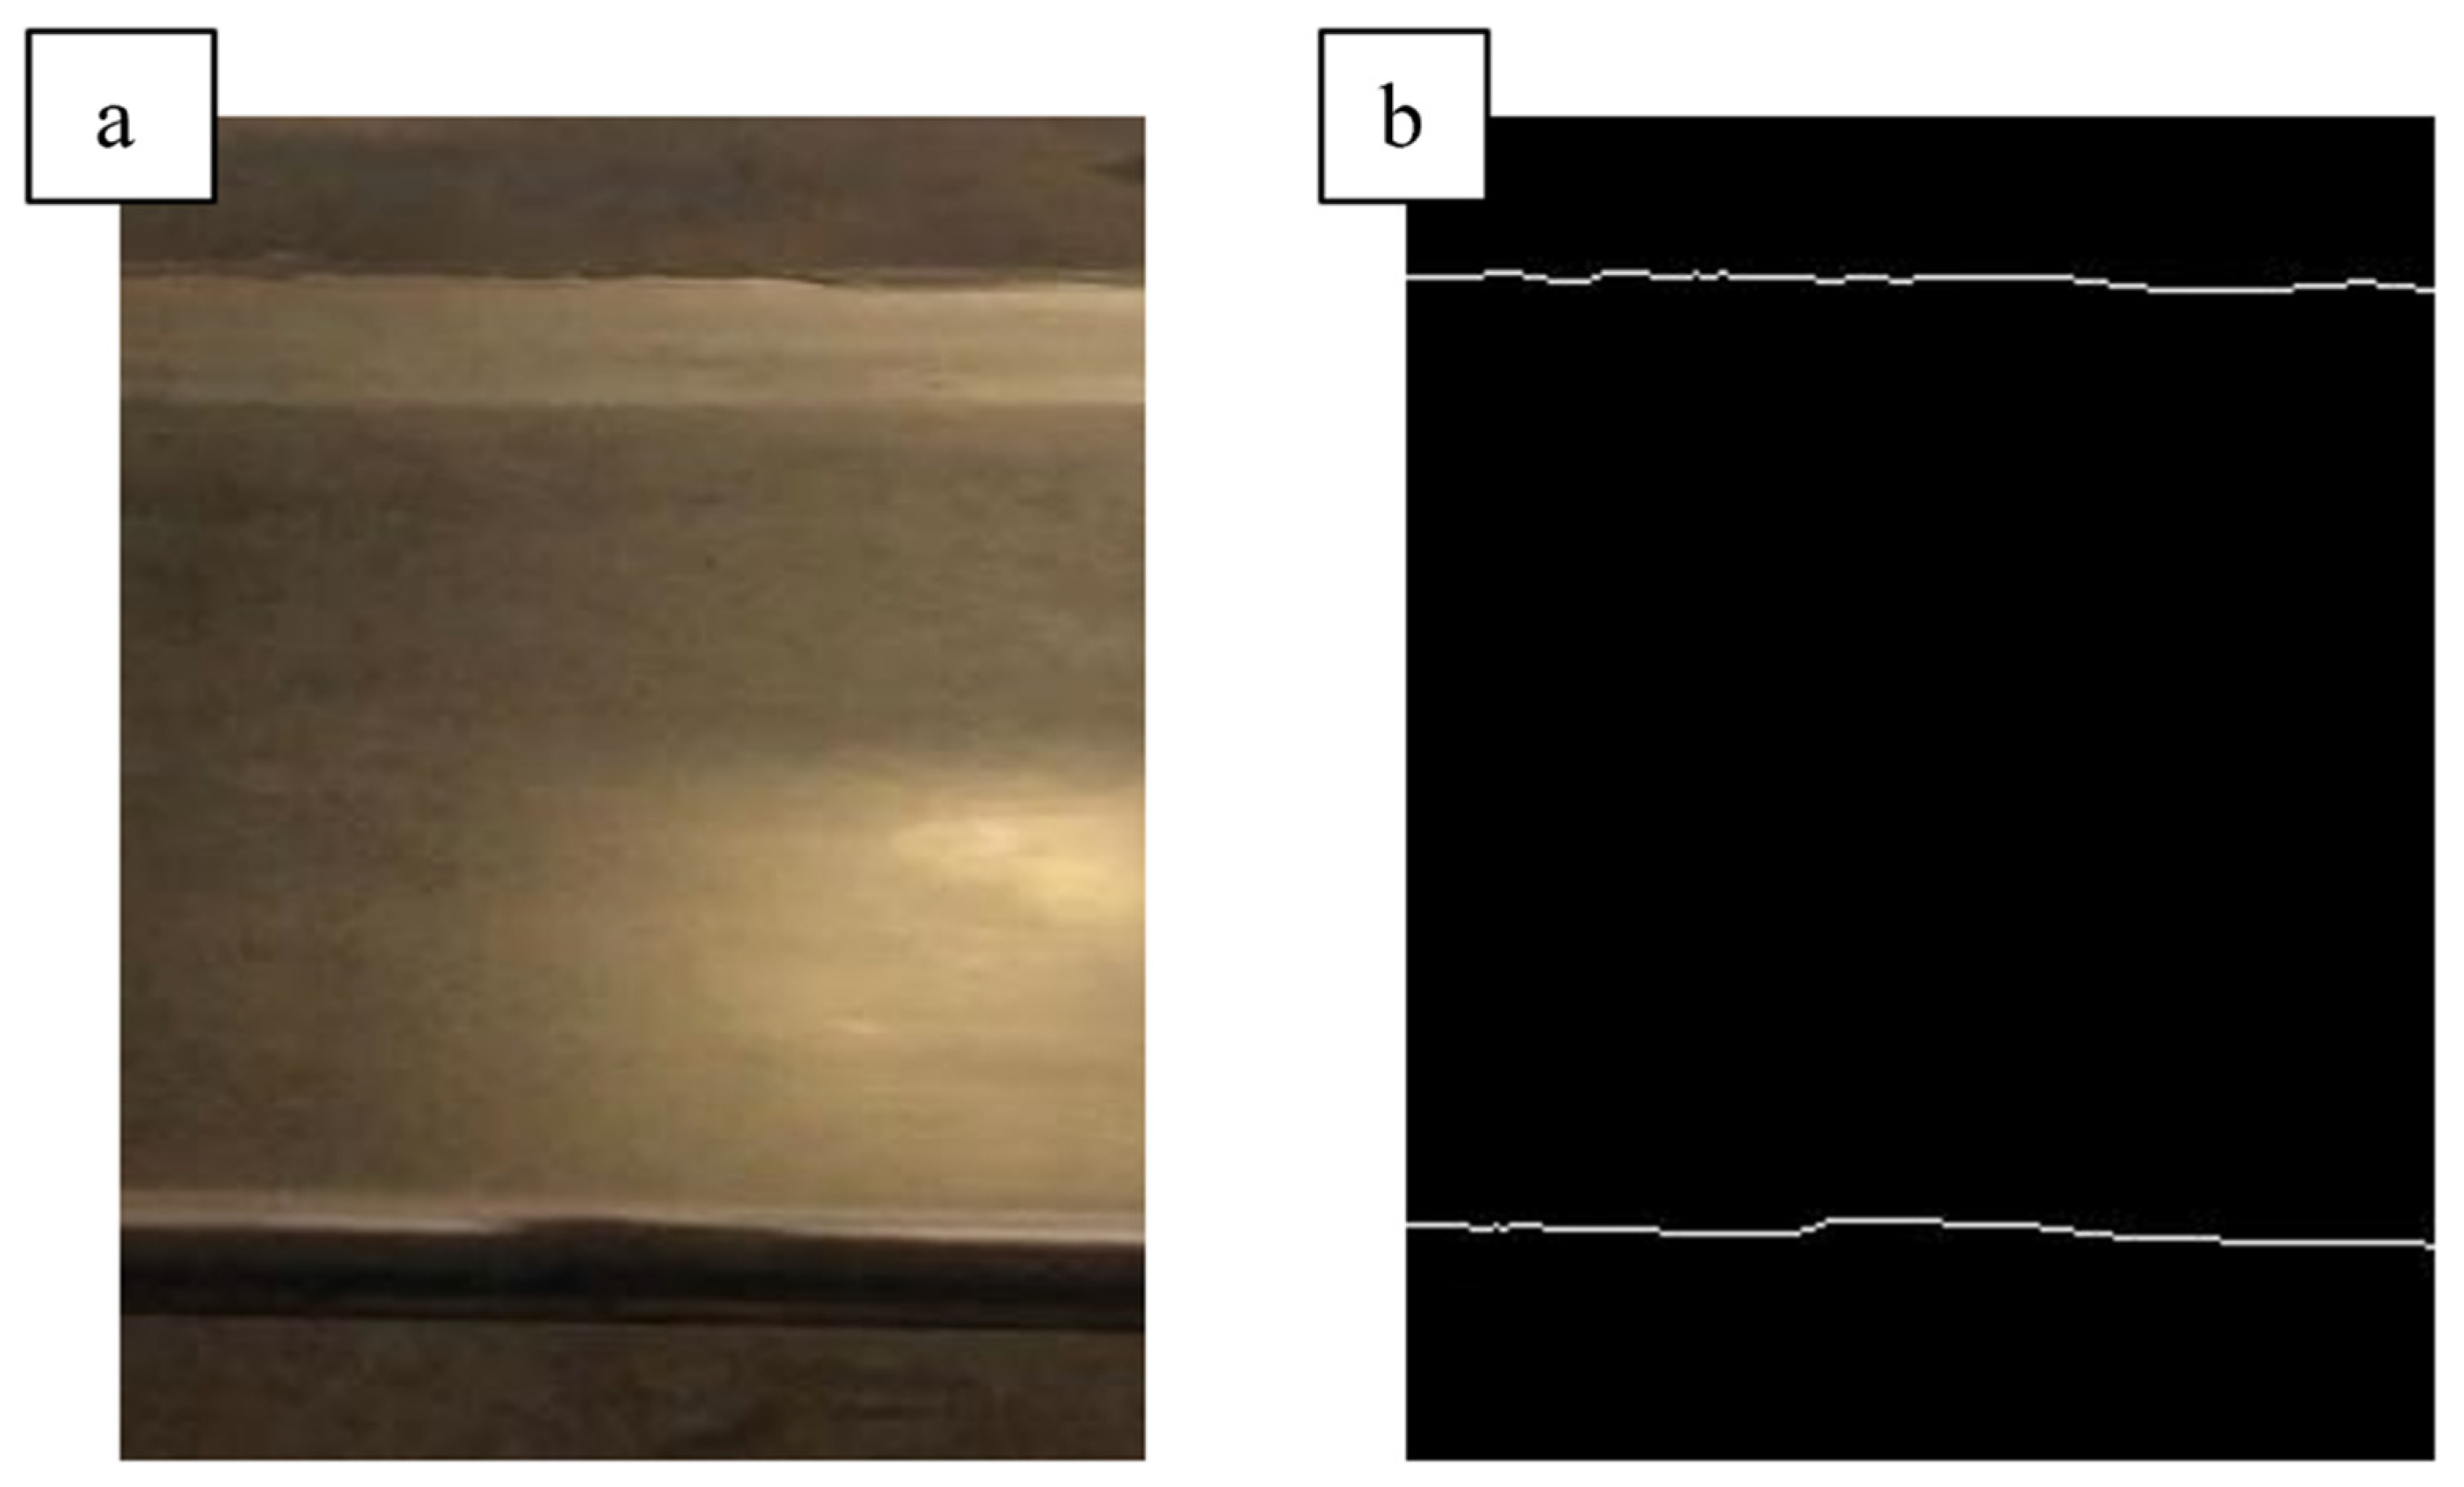
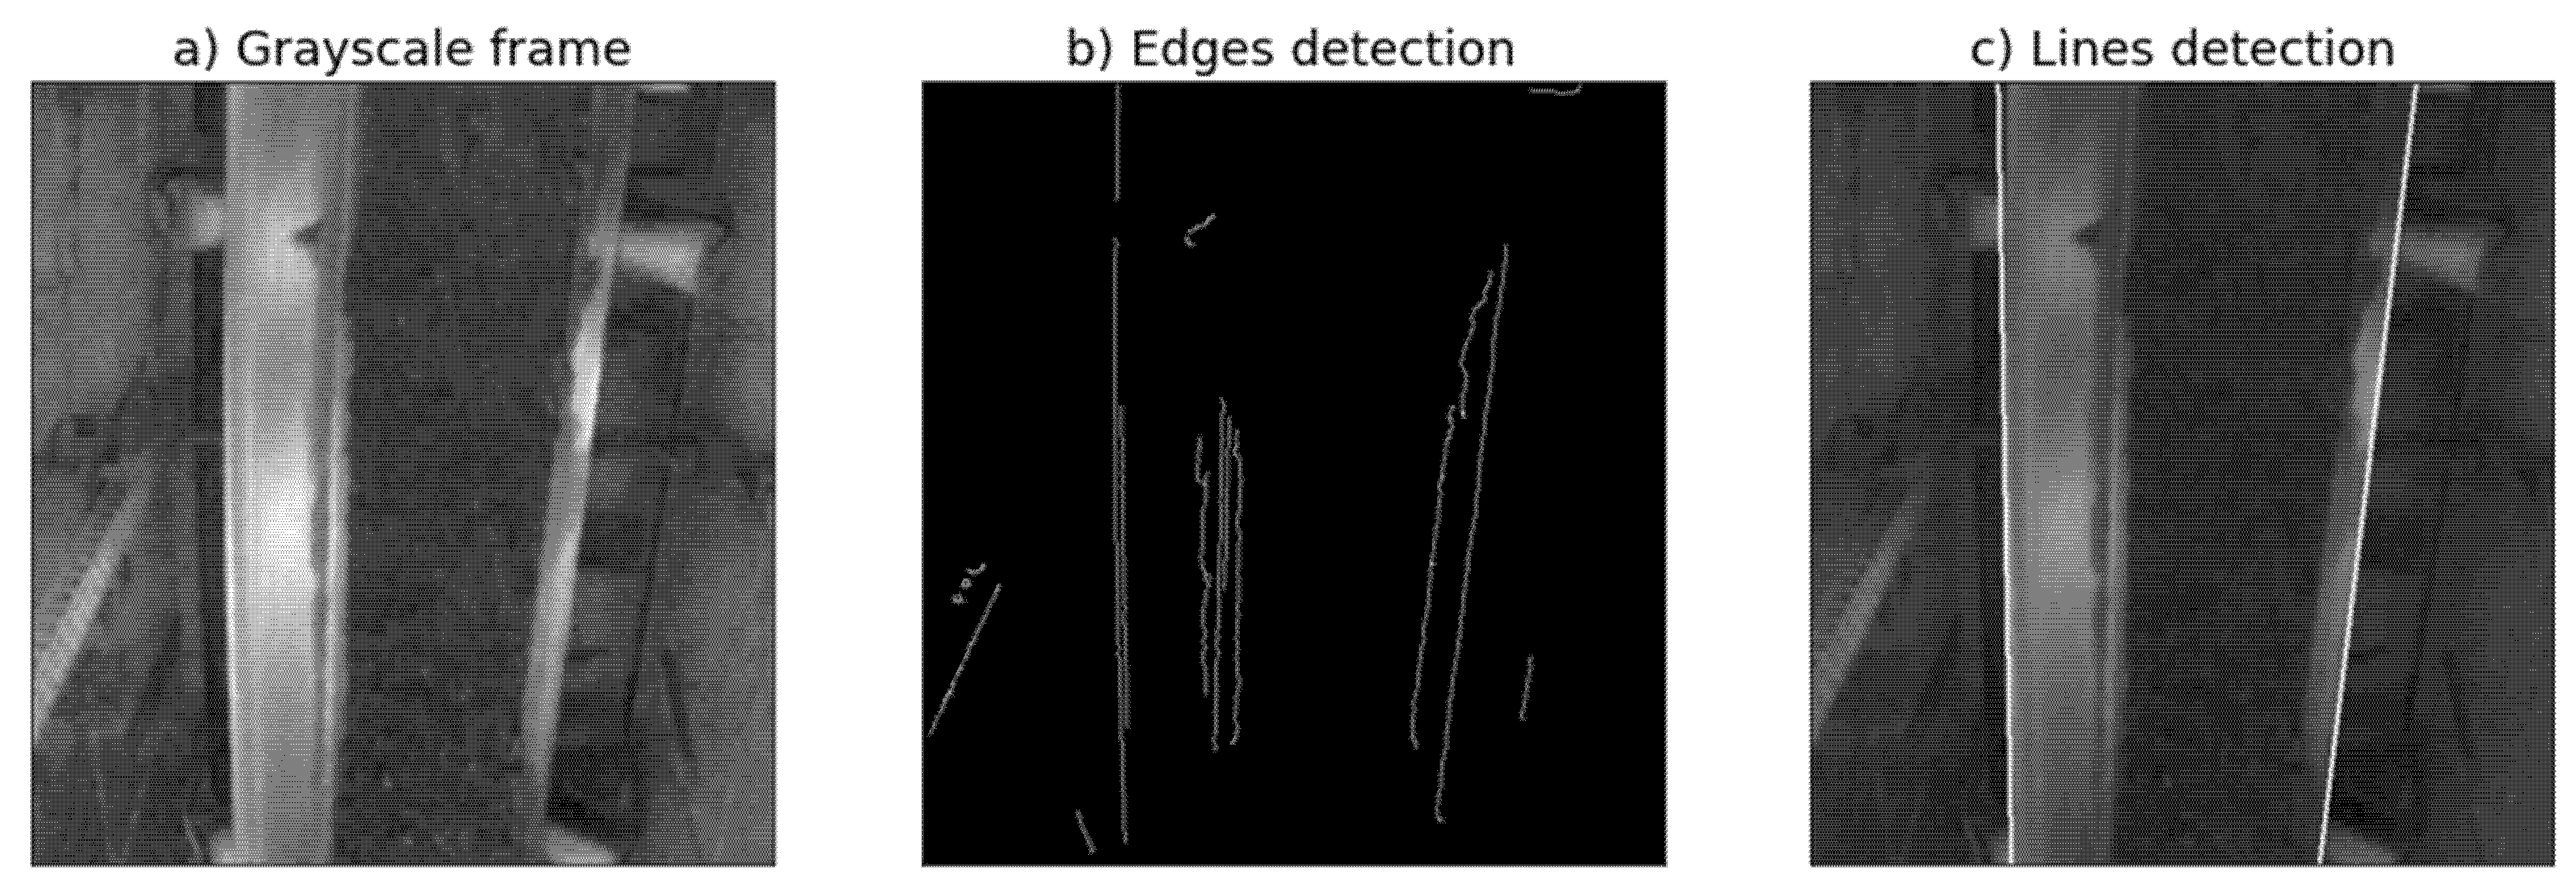
3.2. Detection of Conveyor Belt Edges: View from Above

The first step in analyzing a conveyor belt is detecting its position on the recorded frame. It is especially important if the camera does not stand still in one place but is on the moving robot. The problem can be reduced to detect the two linear boundaries of the belt. Therefore, the method assumes matching two straight lines that are the edges of the conveyor and assuming that there is a belt between them. To distinguish the edges of the belt from other edges in the photo, it is necessary to make a set of assumptions about the position and angle of the line. The method can be described in the following three steps (Figure 11):
  • Frame transformation to the grayscale image.
  • Detection of all edges using Canny Edge Detection.
  • Line fitting to consecutive edges and check if it is the belt edge.
In point 3, there are proper assumptions necessary to detect the conveyor edges on the left and the right side:
  • The edge is long: longer than 100 pixels.
  • The point on the fitted line: x 0   ∈ (0.1 w, 0.4 w) for the left side, and x 0   ∈ (0.6 w, 0.9 w) for the right side, where w is frame width.
  • The angle of inclination of the line: α ∈ (90°, 100°) for the left edge, and α ∈ (80°, 90°) for the right edge.
  • Fit only one line for the left and one for the right side (stop the procedure if the line is already fitted).
The above method allows for detection of belt edges for each frame. This is useful when the conveyor position changes because of the robot’s movement. However, if belt detection is impossible on some frames, the last fitted edges from the previous frames can be used.

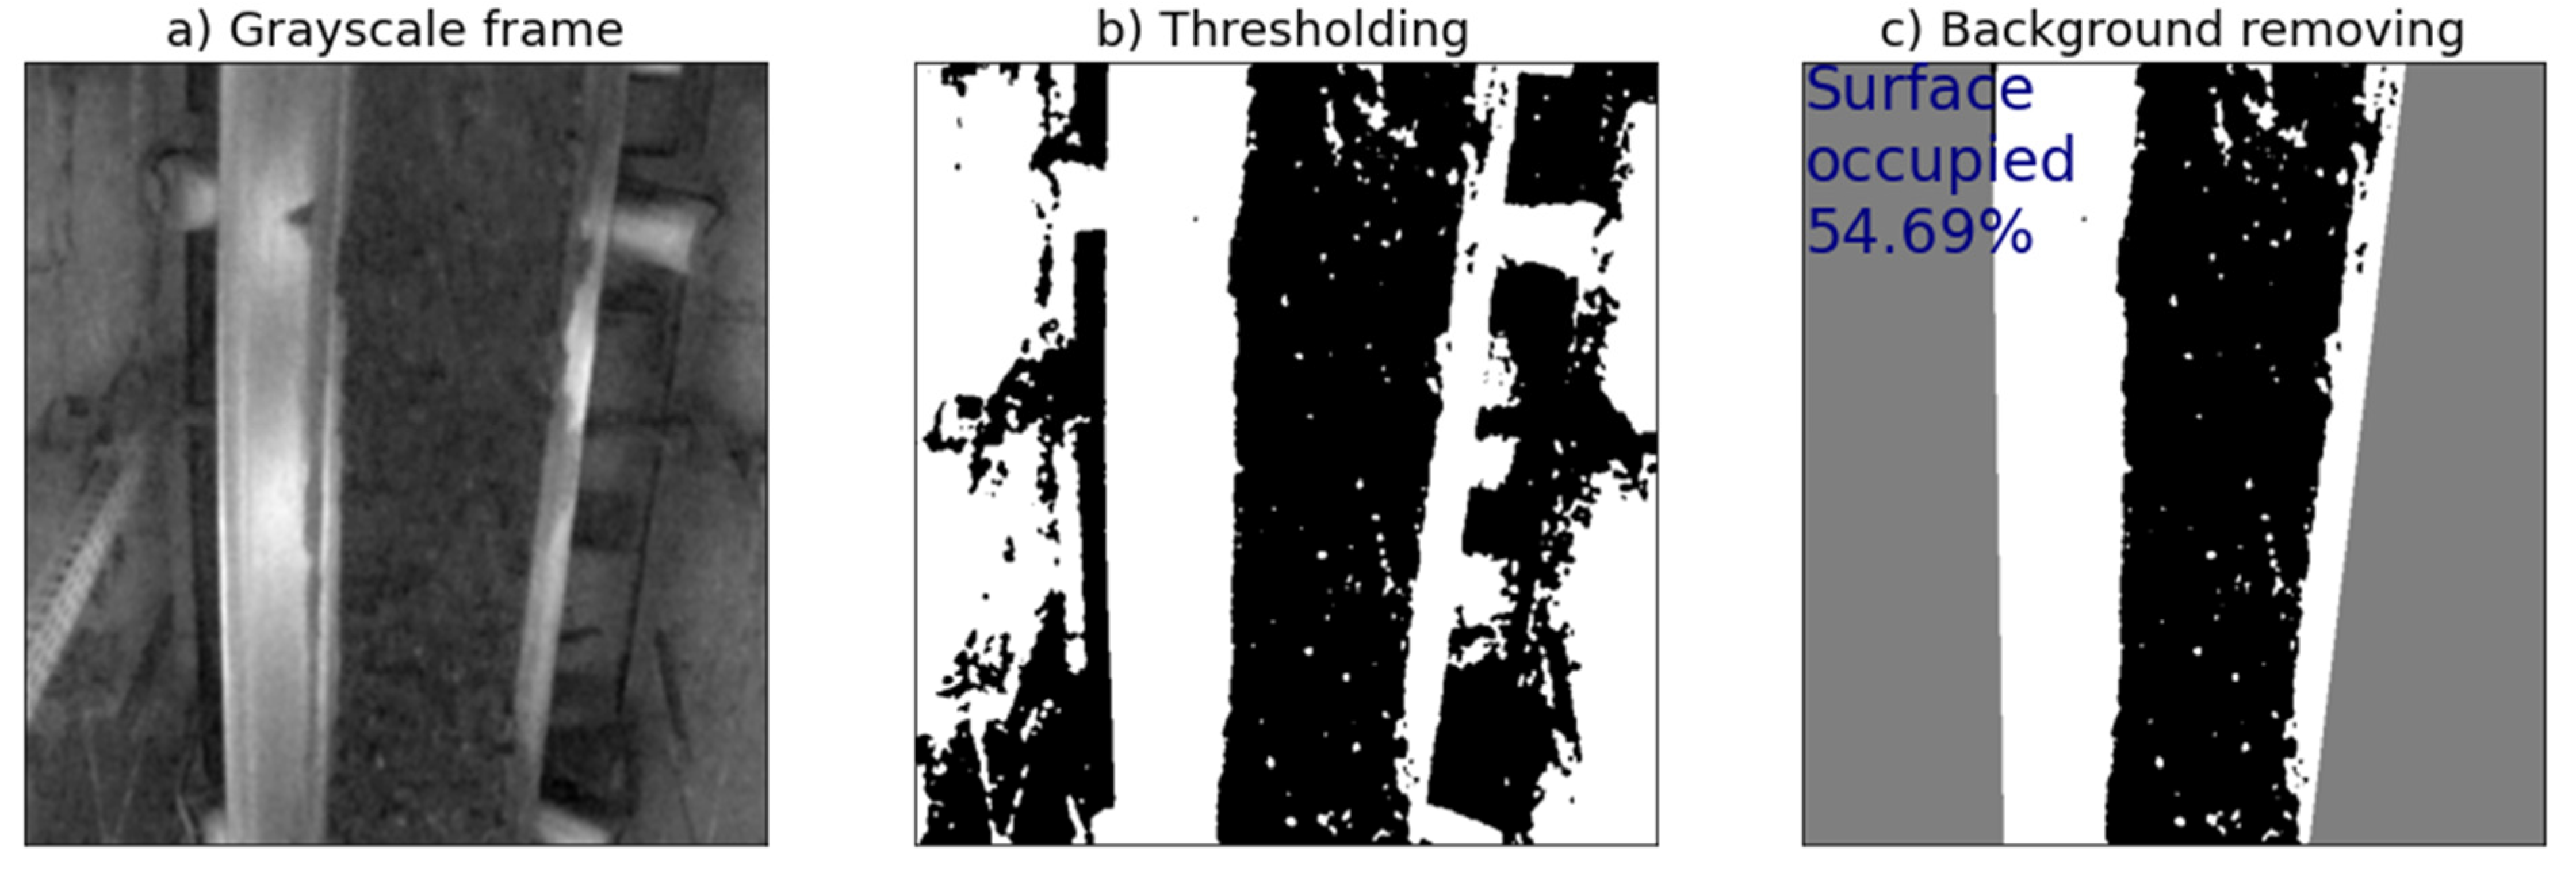
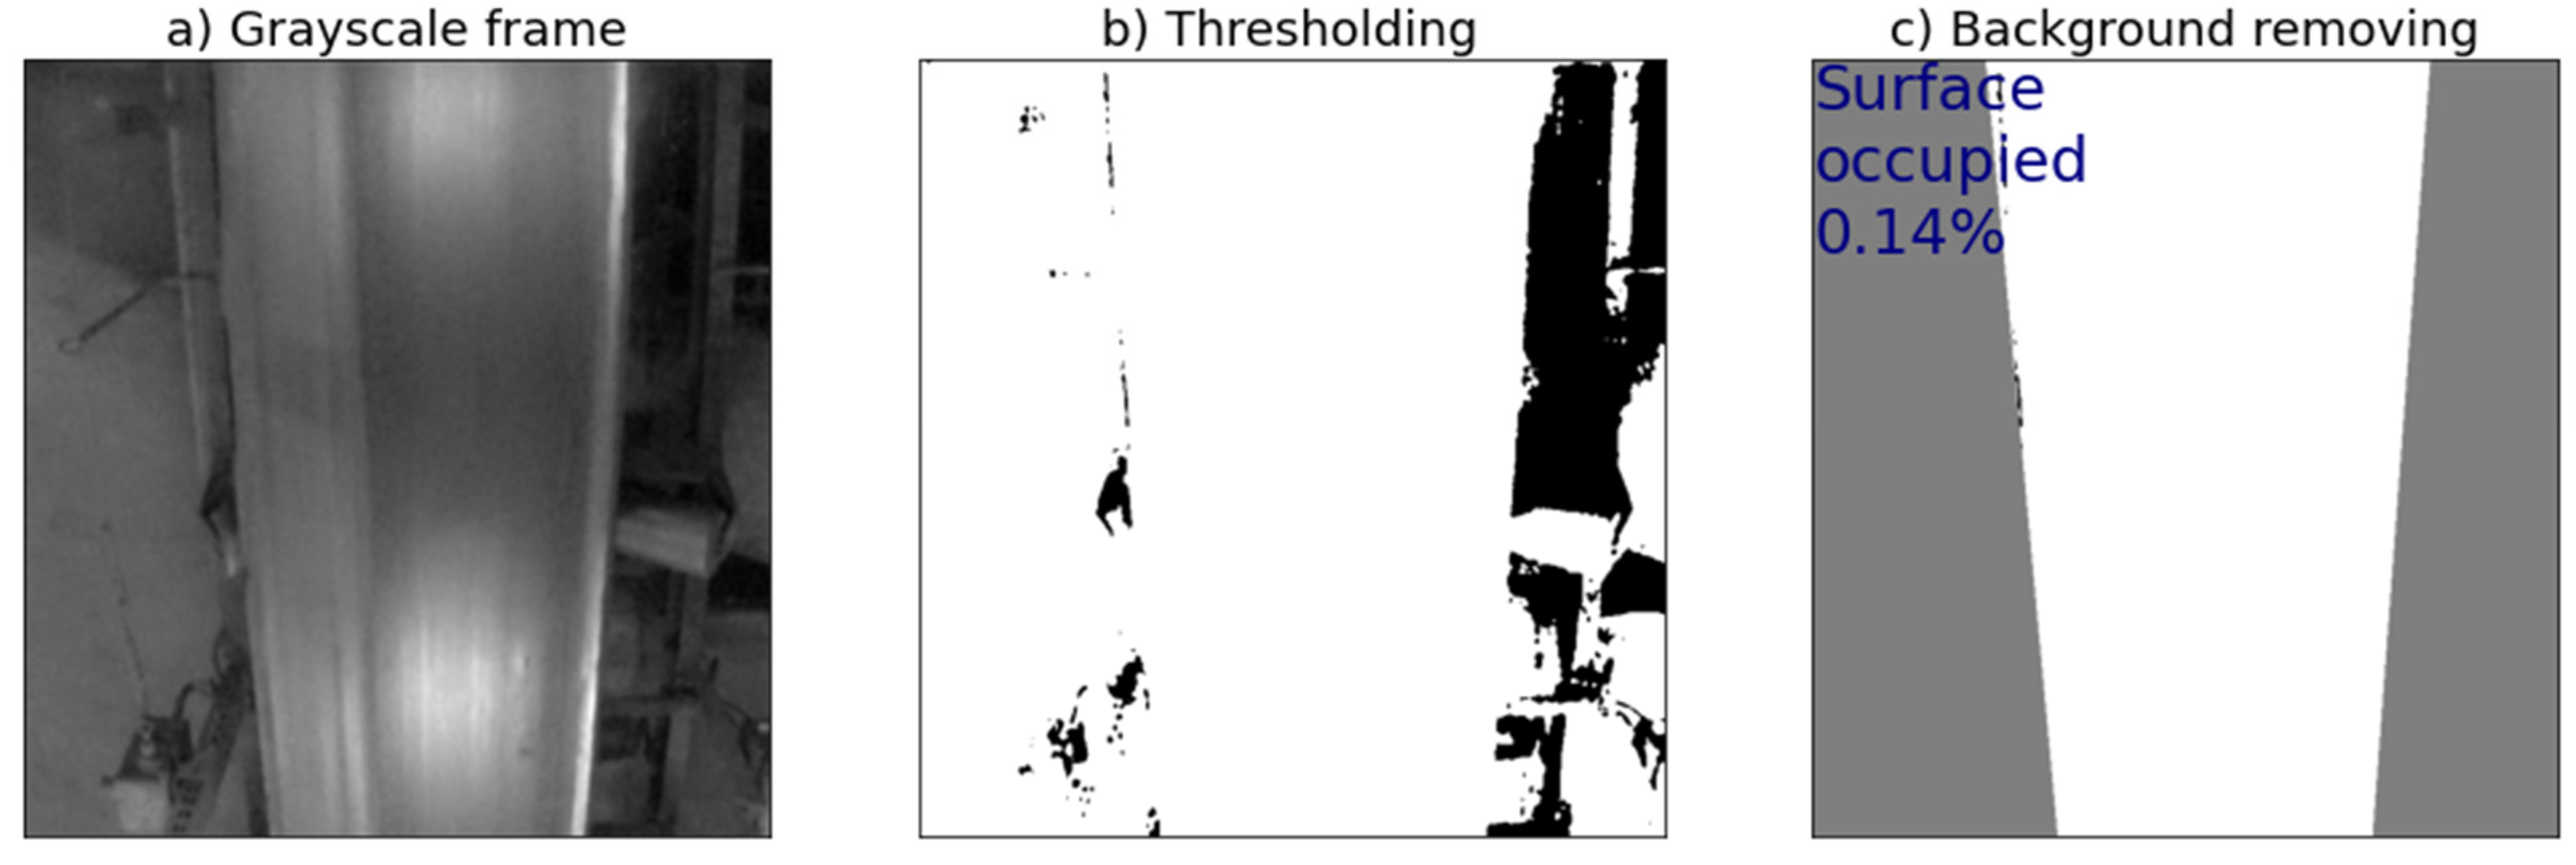
3.3. Detection of Loads on the Conveyor

After detecting the belt edges on the frame, it is possible to determine its load of the transported material (or if there is no load at all). As copper ore is much darker than the belt (which is clearly visible in Figure 11, Figure 12 and Figure 13), a simple thresholding method can be used. This makes it possible to determine when the conveyor is carrying a load and to estimate the percentage of belt load. The method can be described by the following steps:
  • Image transformation to grayscale.
  • Image thresholding with fixed threshold value (H, Equation (2)), where X is a matrix representing the image.
    X ( i , j ) = { 255 ,   i f     X ( i , j ) < H 0 ,   i f   X ( i , j ) H  
  • Background removal using detected edge lines of the conveyor belt (detected with the algorithm introduced in Section 3.2). Changing the values of the pixels classified as background to 127.
  • Calculate the percentage of the belt surface occupied with the following Equation (3), where X is a matrix representing the image, and # is a quantity:
    # ( X = 0 ) # ( X = 255   X = 0 ) × 100 %
Figure 12 presents an example of a loaded conveyor, for which the method detected 54.69% of occupied surface. In Figure 13, an empty conveyor is shown, and the method showed 0.14% of occupied surface, which is close to zero and can be classified as an unloaded belt.
In addition, the example shown in Figure 12 presents that the load on the conveyor is unevenly distributed (large part of the spoil is on the right side). The most likely cause of this behavior is uneven arrangement of the belt on the rollers. Thus, this observation can be used to detect deviation of the conveyor belt. Separate method for this is shown in the following Section 3.4.

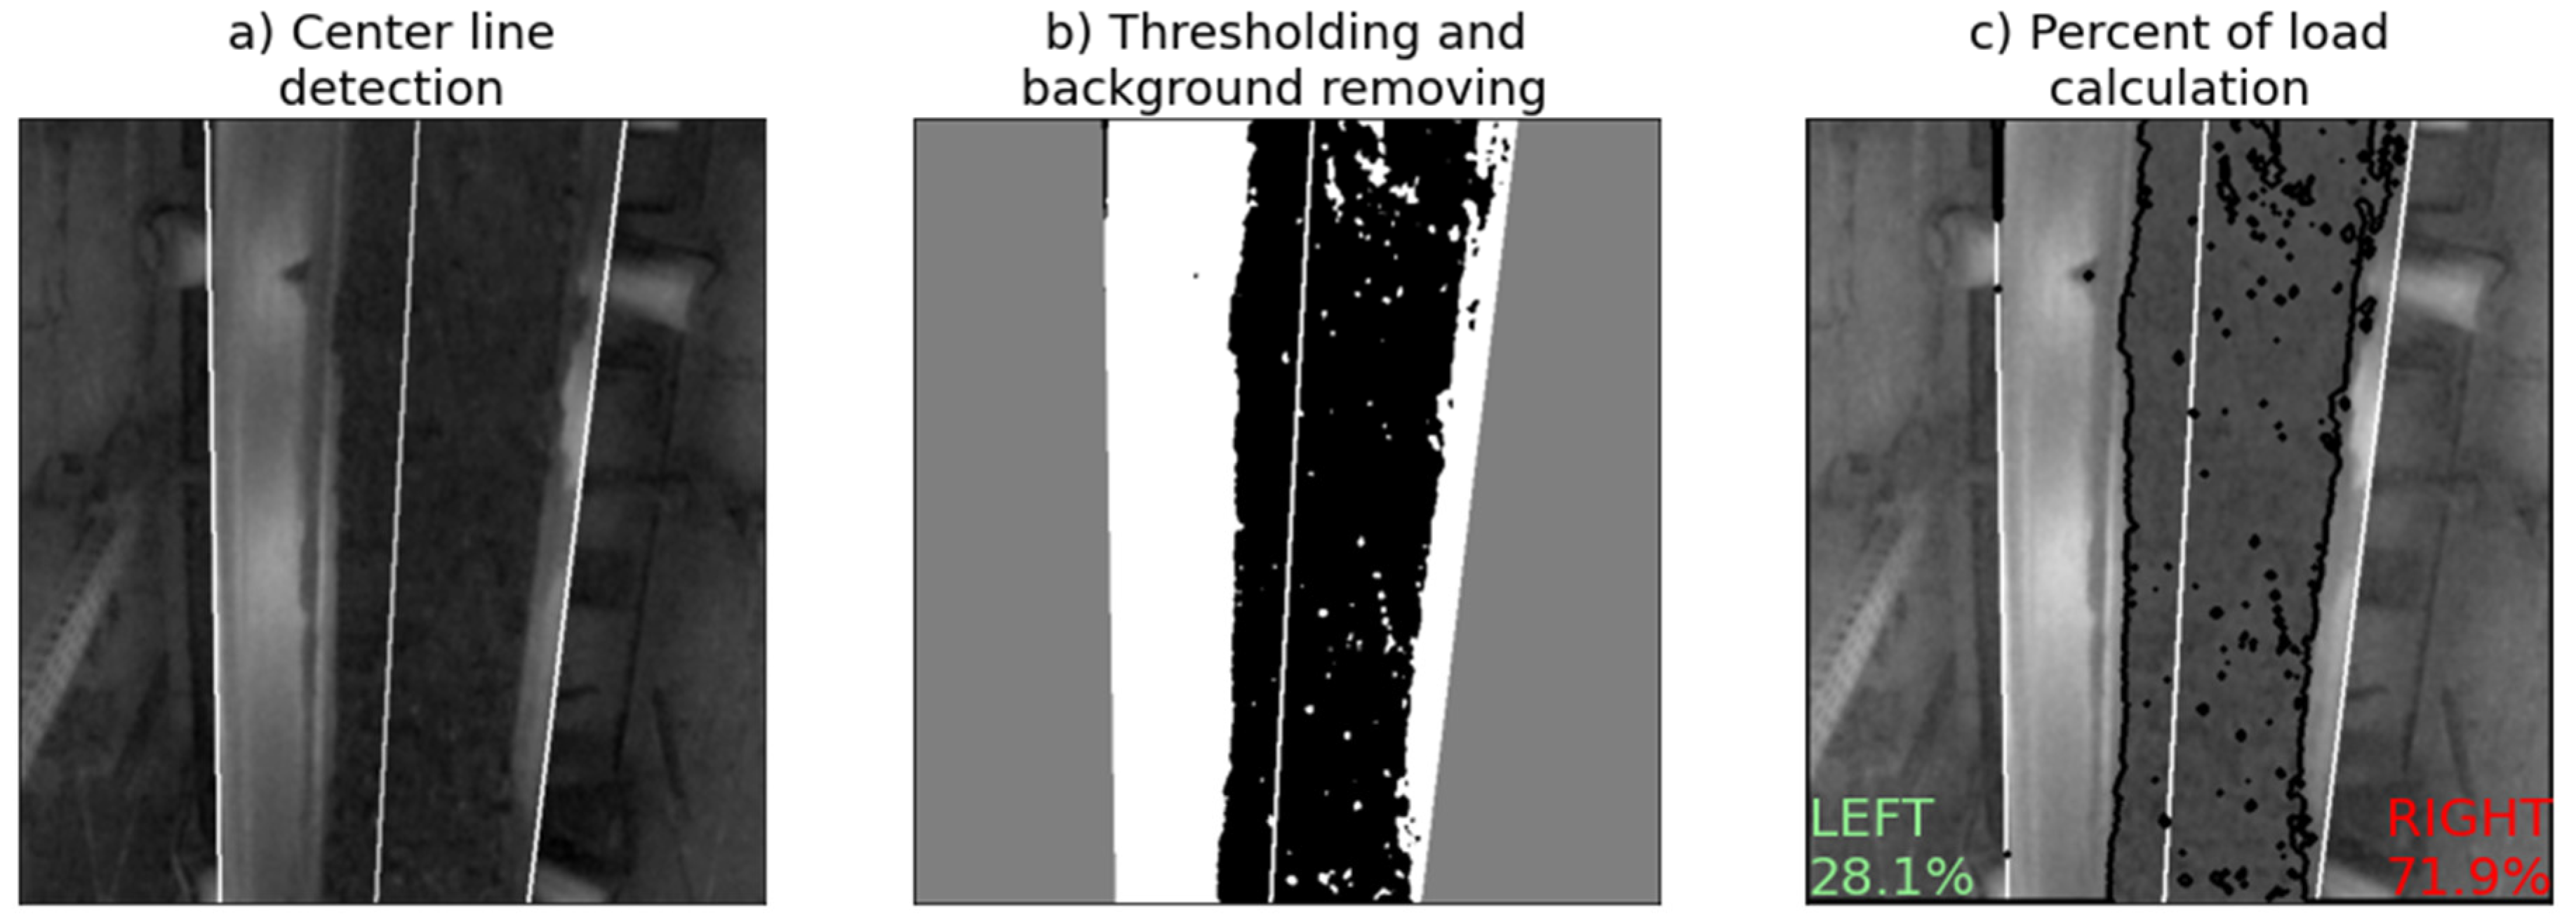
3.4. Conveyor Belt Deviation as Unevenly Load Distributed

If a currently analyzed conveyor is under some load, it is possible to check the regularity in the arrangement of the material on the belt, which can depend on the deviation of the belt. In this article, we focused only on a troughed belt conveyor with a three-roller top set and a trapezoidal cross-section. Such a system of rollers and their acute angle create a trough in the middle of the belt, regulating the shape of the transported material pile. The regularity of the ore distribution on the conveyor can be easily checked as the ratio of the load on the right and left sides of the belt. For this purpose, it is necessary to detect the center line of the belt, which can be calculated as the average of previously detected edge lines of the conveyor. The rest of the calculation is similar to the algorithm for load detection. The thresholding method is used to distinguish the load from empty fragments of the belt, and the background is removed. Then, the percentage of the load on the left and the right side is calculated. For both sides, this coefficient is calculated by dividing the number of black pixels on one of the sides by the amount of black pixels in entire conveyor surface. The consecutive steps of the method are presented in Figure 14. It can be seen that 71.9% of the load is on the right side, so it can be concluded that the belt is also not evenly distributed over the rollers, and the left side is raised more upwards.

4. Conclusions

Belt conveyors are responsible for a significant part of transportation in mines and other facilities. Their failure may result in interruptions in the entire production as they are often a bottleneck of the transport system. For this reason, their condition should be constantly monitored, which is a task currently performed by mining staff. Unfortunately, miners are forced to descend due to exploitation of deeper and deeper parts of the deposit, which complicates mining conditions (increased seismicity, presence of harmful gases, or sometimes the need to build narrow and low workings). Therefore, the global trend in deep mining is to search for new technologies that will exclude the presence of humans from dangerous places in the mining area or limit their exposure to nuisance factors that threaten life and health.
The article presents a simple inspection method that was performed using an autonomous robot. During the inspection, algorithms were used to detect damage to the conveyor (torn edges, belt deviation) and to assess the correctness of spoil distribution including spoil spilling outside the conveyor, which have also been described. The algorithms are based on video recordings that included left, right, and top views. The basis for the diagnostic procedures here was the Canny Edge Detection algorithm commonly used in computer vision tasks, which was used to detect individual parts of the conveyor belt. The main factor that determines the quality of the algorithm’s operation is the stability of the recording, which was achieved by stopping the robot for the duration of the measurement. The described algorithms are not novel; however, the article shows that they can be successfully used for autonomous inspection in industrial conditions.

Author Contributions

Conceptualization, M.S. and W.K.; methodology, M.S. and W.K.; software, M.S. and W.K.; validation, M.S., W.K., P.S., A.S. and S.A.; formal analysis, M.S. and A.S.; investigation, A.S. and S.A.; resources, P.S.; data curation, M.S. and W.K.; writing—original draft preparation, M.S., W.K. and A.S.; writing—review and editing, M.S., W.K., P.S., A.S. and S.A.; visualization, M.S.; supervision, P.S.; project administration, P.S.; funding acquisition, P.S. and S.A. All authors have read and agreed to the published version of the manuscript.

Funding

This work is a part of the project which has received funding from the European Union’s Horizon 2020 research and innovation programme under grant agreement No 780883.

Data Availability Statement

Not applicable.

Conflicts of Interest

The authors declare no conflict of interest.

References

  1. Zimroz, R.; Hardygóra, M.; Blazej, R. Maintenance of Belt Conveyor Systems in Poland—An Overview. In Proceedings of the 12th International Symposium Continuous Surface Mining—Aachen 2014; Springer Science and Business Media: Berlin/Heidelberg, Germany, 2015; pp. 21–30. [Google Scholar]
  2. Harrison, A. A magnetic transducer for testing steel-cord deterioration in high-tensile strength conveyor belts. NDT Int. 1985, 18, 133–138. [Google Scholar] [CrossRef]
  3. Xiao, G.; Yang, Z. The Electromagnetic Nondestructive Testing Device of the wirerope-core transmission belt. In Proceedings of the 2012 Power Engineering and Automation Conference, Wuhan, China, 18–20 September 2012; pp. 1–4. [Google Scholar]
  4. Kozłowski, T.; Wodecki, J.; Zimroz, R.; Błażej, R.; Hardygóra, M. A Diagnostics of Conveyor Belt Splices. Appl. Sci. 2020, 10, 6259. [Google Scholar] [CrossRef]
  5. Fedorko, G.; Molnar, V.; Marasova, D.; Grincova, A.; Dovica, M.; Zivcak, J.; Toth, T.; Husakova, N. Failure analysis of belt conveyor damage caused by the falling material. Part II: Application of computer metrotomography. Eng. Fail. Anal. 2013, 34, 431–442. [Google Scholar] [CrossRef]
  6. Fedorko, G.; Molnar, V.; Marasova, D.; Grincova, A.; Dovica, M.; Zivcak, J.; Toth, T.; Husakova, N. Failure analysis of belt conveyor damage caused by the falling material. Part I: Experimental measurements and regression models. Eng. Fail. Anal. 2014, 36, 30–38. [Google Scholar] [CrossRef]
  7. Chu, Q.Y.; Meng, G.Y.; Fan, X. Analysis of Speed and Belt Deviation of the Conveyor Belt. Adv. Mater. Res. 2011, 339, 444–447. [Google Scholar] [CrossRef]
  8. Zhao, L. Typical Failure Analysis and Processing of Belt Conveyor. Procedia Eng. 2011, 26, 942–946. [Google Scholar] [CrossRef]
  9. Zhang, M.; Gao, H.L.; Zhang, Y.; Wang, P.Z. Analysis and Dispose of Deviation of Mine Belt Conveyor. Appl. Mech. Mater. 2014, 608–609, 685–688. [Google Scholar] [CrossRef]
  10. Xianguo, L.; Lifang, S.; Zixu, M.; Can, Z.; Hangqi, J. Laser-based on-line machine vision detection for longitudinal rip of conveyor belt. Optik 2018, 168, 360–369. [Google Scholar] [CrossRef]
  11. Qiao, T.; Li, X.; Pang, Y.; Lü, Y.Y.; Wang, F.; Jin, B. Research on conditional characteristics vision real-time detec-tion system for conveyor belt longitudinal tear. IET Sci. Meas. Technol. 2017, 11, 955–960. [Google Scholar] [CrossRef] [Green Version]
  12. Li, W.; Wang, Z.; Zhu, Z.; Zhou, G.; Chen, G. Design of online monitoring and fault diagnosis system for belt con-veyors based on wavelet packet decomposition and support vector machine. Adv. Mech. Eng. 2013, 5, 797183. [Google Scholar] [CrossRef]
  13. Girdhar, P.; Scheffer, C. Practical Machinery Vibration Analysis and Predictive Maintenance; Elsevier: Amsterdam, The Netherlands, 2004. [Google Scholar]
  14. Stefaniak, P.K.; Wyłomańska, A.; Obuchowski, J.; Zimroz, R. Procedures for decision thresholds finding in maintenance management of belt conveyor system–statistical modeling of diagnostic data. In Proceedings of the 12th International Symposium Continuous Surface Mining—Aachen 2014; Springer: Cham, Switzerland, 2015; pp. 391–402. [Google Scholar]
  15. Szurgacz, D.; Zhironkin, S.; Vöth, S.; Pokorný, J.; Spearing, A.; Cehlár, M.; Stempniak, M.; Sobik, L. Thermal Imaging Study to Determine the Operational Condition of a Conveyor Belt Drive System Structure. Energies 2021, 14, 3258. [Google Scholar] [CrossRef]
  16. Tandon, N.; Choudhury, A. A review of vibration and acoustic measurement methods for the detection of defects in rolling element bearings. Tribol. Int. 1999, 32, 469–480. [Google Scholar] [CrossRef]
  17. Jiang, X.-P.; Cao, G.-Q. Belt conveyor roller fault audio detection based on the wavelet neural network. In Proceedings of the 2015 11th International Conference on Natural Computation (ICNC), Zhangjiajie, China, 15–17 August 2015; pp. 954–958. [Google Scholar]
  18. Nicolay, T.; Treib, A.; Blum, A. RF identification in the use of belt rip detection [mining product belt haulage]. In Proceedings of the SENSORS, 2004 IEEE, Vienna, Austria, 24–27 October 2004; pp. 333–336. [Google Scholar]
  19. Ponsa, D.; Benavente, R.; Lumbreras, F.; Martinez, J.; Roca, X. Quality control of safety belts by machine vision inspection for real-time production. Opt. Eng. 2003, 42, 1114–1120. [Google Scholar] [CrossRef]
  20. Wang, C.Q.; Zhang, J. The Research on the Monitoring System for Conveyor Belt Based on Pattern Recognition. Adv. Mater. Res. 2012, 466-467, 622–625. [Google Scholar] [CrossRef]
  21. Zhang, M.; Shi, H.; Yu, Y.; Zhou, M. A Computer Vision Based Conveyor Deviation Detection System. Appl. Sci. 2020, 10, 2402. [Google Scholar] [CrossRef] [Green Version]
  22. Zeng, C.; Zheng, J.; Li, J. Real-time conveyor belt deviation detection algorithm based on multi-scale feature fusion network. Algorithms 2019, 12, 205. [Google Scholar] [CrossRef] [Green Version]
  23. Wang, J.; Liu, Q.; Dai, M. Belt vision localization algorithm based on machine vision and belt conveyor deviation detection. In Proceedings of the 2019 34rd Youth Academic Annual Conference of Chinese Association of Automation (YAC), Jinzhou, China, 6–8 June 2019; pp. 269–273. [Google Scholar]
  24. Yang, Y.; Miao, C.; Li, X.; Mei, X. On-line conveyor belts inspection based on machine vision. Optik 2014, 125, 5803–5807. [Google Scholar] [CrossRef]
  25. Aichun, Z.; Gang, H.; Yongxing, W. The research on the detection method of belt deviation by video in coal mine. In Proceedings of the 2011 International Conference on Mechatronic Science, Electric Engineering and Computer (MEC), Jilin, China, 19–22 August 2011; pp. 430–433. [Google Scholar]
  26. Carvalho, R.; Nascimento, R.; D’Angelo, T.; Delabrida, S.; Bianchi, A.G.C.; Oliveira, R.; Azpúrua, H.; Garcia, L.G.U. A UAV-Based Framework for Semi-Automated Thermographic Inspection of Belt Conveyors in the Mining Industry. Sensors 2020, 20, 2243. [Google Scholar] [CrossRef] [PubMed] [Green Version]
  27. Nascimento, R.; Carvalho, R.; Delabrida, S.; Bianchi, A.G.; Oliveira, R.A.R.; Garcia, L.G.U. An integrated inspection system for belt conveyor rollers. In Proceedings of the 19th International Conference on Enterprise Information Systems (ICEIS 2017), Porto, Portugal, 26–19 April 2017; Volume 2, pp. 190–200. [Google Scholar]
  28. Szrek, J.; Wodecki, J.; Błażej, R.; Zimroz, R. An Inspection Robot for Belt Conveyor Maintenance in Underground Mine—Infrared Thermography for Overheated Idlers Detection. Appl. Sci. 2020, 10, 4984. [Google Scholar] [CrossRef]
  29. Stefaniak, P.; Anufriiev, S. Method of Defining Diagnostic Features to Monitor the Condition of the Belt Conveyor Gearbox with the Use of the Legged Inspection Robot. In Communications in Computer and Information Science; Springer: Cham, Switzerland, 2020; pp. 158–167. [Google Scholar]
  30. Khan, J.I.U.S.; Khan, U.S.; Iqbal, J.; Khan, M. Automatic Inspection System Using Machine Vision. In Proceedings of the 34th Applied Imagery and Pattern Recognition Workshop (AIPR’05), Washington, DC, USA, 19 October–21 December 2006. [Google Scholar]
  31. Zhao, M.-H. Design of Patrol Robot System for Mining Belt Conveyor. In Proceedings of the 2018 10th International Conference on Intelligent Human-Machine Systems and Cybernetics (IHMSC), Hangzhou, China, 25–26 August 2018; Volume 2, pp. 1–3. [Google Scholar]
  32. Cao, X.; Zhang, X.; Zhou, Z.; Fei, J.; Zhang, G.; Jiang, W. Research on the monitoring system of belt con-veyor based on suspension inspection robot. In Proceedings of the 2018 IEEE International Conference on Real-Time Computing and Robotics (RCAR), Kandima, Maldives, 1–5 August 2018; pp. 657–661. [Google Scholar]
  33. Yang, W.; Zhang, X.; Ma, H. An inspection robot using infrared thermography for belt conveyor. In Proceedings of the 2016 13th International Conference on Ubiquitous Robots and Ambient Intelligence (URAI), Xi’an, China, 19–22 August 2016; pp. 400–404. [Google Scholar]
  34. Zimroz, R.; Hutter, M.; Mistry, M.; Stefaniak, P.; Walas, K.; Wodecki, J. Why Should Inspection Robots be used in Deep Underground Mines? In Proceedings of the 27th International Symposium on Mine Planning and Equipment Selection-MPES 2018; Springer: Cham, Switzerland, 2019; pp. 497–507. [Google Scholar]
  35. Käslin, R.; Kolvenbach, H.; Paez, L.; Lika, K.; Hutter, M. Towards a Passive Adaptive Planar Foot with Ground Orientation and Contact Force Sensing for Legged Robots. In Proceedings of the 2018 IEEE/RSJ International Conference on Intelligent Robots and Systems (IROS), Madrid, Spain, 1–5 October 2018; pp. 2707–2714. [Google Scholar]
  36. Bednarek, J.; Bednarek, M.; Wellhausen, L.; Hutter, M.; Walas, K. What Am I Touching? Learning to Classify Terrain Via Haptic Sensing. In Proceedings of the 2019 IEEE International Conference on Robotics and Automation (ICRA), Montreal, QC, Canada, 20–24 May 2019. [Google Scholar]
  37. Skoczylas, A.; Stefaniak, P.; Anufriiev, S.; Jachnik, B. Belt Conveyors Rollers Diagnostics Based on Acoustic Signal Collected Using Autonomous Legged Inspection Robot. Appl. Sci. 2021, 11, 2299. [Google Scholar] [CrossRef]
  38. Stefaniak, P.; Skoczylas, A.; Nowicki, M.; Walas, K.; Stachowiak, M. Autonomous inspection of a belt conveyor in a deep mine with the use of a legged robot. In Proceedings of the APCOM 2021, Online, 30 August–1 September 2021. [Google Scholar]
  39. Canny, J. A Computational Approach to Edge Detection. Read. Comput. Vis. 1987, 6, 184–203. [Google Scholar] [CrossRef]
Figure 1. ANYmal legged robot by ANYbotics in various mining conditions.
Minerals 11 01040 g001
Figure 2. An example of a robot motion path with key checkpoints (●) during a conveyor inspection in an underground mine. The diagnosis of the belt ② was part of the entire inspection procedure.
Minerals 11 01040 g002
Figure 3. The square of the difference between the fitted trend and the belt edge coordinates.
Minerals 11 01040 g003
Figure 4. Procedure of recognizing belt edge for a side view: (a) a cut portion of the belt, (b) matching edges of the belt.
Minerals 11 01040 g004
Figure 5. (a) Lower part of the conveyor belt. (b) Edge line designated by Canny algorithm. (c) Fitted straight line designated by linear regression.
Minerals 11 01040 g005
Figure 6. Comparison of the Canny line and fitted straight line.
Minerals 11 01040 g006
Figure 7. The square of the difference between the Canny line and fitted straight line.
Minerals 11 01040 g007
Figure 8. (a) Lower part of the conveyor belt. (b) Edge line designated by Canny algorithm. (c) Fitted straight line designated by linear regression.
Minerals 11 01040 g008
Figure 9. Comparison of the Canny line and straight line for the portion of the belt where there was no anomaly.
Minerals 11 01040 g009
Figure 10. The square of the difference between the Canny line and fitted straight line for the portion of the belt where there was no anomaly.
Minerals 11 01040 g010
Figure 11. Steps in the process of detection of conveyor belt edges: (a) grayscaled raw frame, (b) detected edges, (c) detected belt edges.
Minerals 11 01040 g011
Figure 12. Steps for load detection, for example, of a loaded conveyor: (a) grayscaled raw frame, (b) image after thresholding, (c) image with removed background and spoil surface calculated.
Minerals 11 01040 g012
Figure 13. Steps for load detection, for example, of an unloaded conveyor: (a) grayscaled raw frame, (b) image after thresholding, (c) image with removed background and spoil surface calculated.
Minerals 11 01040 g013
Figure 14. Steps for the method of uneven load distributed detection: (a) grayscale frame with conveyor edges marked along with center line, (b) image after thresholding and background removal, (c) copper ore distribution between sides.
Minerals 11 01040 g014
Publisher’s Note: MDPI stays neutral with regard to jurisdictional claims in published maps and institutional affiliations.

