Article

The Competitive Adsorption of Chromate and Sulfate on Ni-Substituted Magnetite Surfaces: An ATR-FTIR Study

1
CAS Key Laboratory of Mineralogy and Metallogeny/Guangdong Provincial Key Laboratory of Mineral Physics and Material Research & Development, Guangzhou Institute of Geochemistry, Chinese Academy of Sciences, Guangzhou 510640, China
2
CAS Center for Excellence in Deep Earth Science, Guangzhou 510640, China
3
University of Chinese Academy of Sciences, Beijing 100049, China
4
Institutions of Earth Science, Chinese Academy of Sciences, Beijing 100029, China
5
National-Regional Joint Engineering Research Center for Soil Pollution Control and Remediation in South China, Guangdong Key Laboratory of Integrated Agro-Environmental Pollution Control and Management, Institute of Eco-Environmental and Soil Sciences, Guangdong Academy of Sciences, Guangzhou 510650, China
*
Author to whom correspondence should be addressed.
Minerals 2021, 11(1), 88; https://doi.org/10.3390/min11010088
Submission received: 16 December 2020 / Revised: 12 January 2021 / Accepted: 13 January 2021 / Published: 18 January 2021

Abstract

:
With similar chemical properties and geometrical configurations, sulfate and chromate display interesting competitive adsorption on mineral surfaces. Although such issues have been investigated on several Fe (hydr)oxide surfaces, e.g., ferrihydrite, goethite and hematite, the competitive adsorption on magnetite surfaces and the constraint mechanism have seldom been studied. This impedes the understanding of the transfer and fate of chromate and sulfate on magnetite surfaces, as magnetite is not only a useful adsorbent but also an efficient reductant to decrease the mobility and toxicity of chromium. In the present study, the geometries of the competitive adsorption of chromate and sulfate on Ni-substituted magnetite surfaces over a pH range of 4–9 were investigated using in situ attenuated total reflectance Fourier transform infrared spectroscopy and two-dimensional correlation analysis. In individual adsorption, nonprotonated monodentate mononuclear (NMM) complexes dominated chromate adsorption, accompanied by a few bidentate binuclear (BB) complexes. For sulfate, NMM complexes and outer-sphere (OS) species predominated under acidic and neutral–alkaline conditions, respectively. The above variation in adsorption configuration resulted in the different adsorption competitiveness between chromate and sulfate at different pH values. Specifically, the NMM complexes of chromate were substituted by NMM sulfate complexes under acidic conditions and vice versa. However, under neutral and alkaline conditions, the OS species of sulfate scarcely affected the adsorption of chromate. The adsorption affinity of chromate and sulfate on Ni-substituted magnetite increased in the following order: OS complex (sulfate) < NMM complexes (chromate) < NMM complexes (sulfate).

1. Introduction

Chromium, a naturally occurring element widely distributed in rocks, plants, water and soil, exists in two stable oxidation states, i.e., Cr(VI) and Cr(III), with different geochemical behaviors. Cr(III) is less toxic with high immobility because it forms Cr(OH)3 precipitates under neutral and alkaline conditions and is considered a nutrient [1]. In contrast, chromate (CrO42–), the predominant ionic form of chromium, is more toxic and even carcinogenic, in addition to its high solubility and mobility [2]. Chromium is released into the environment at elevated levels from a variety of natural (e.g., ultramafic rock weathering) [3] and anthropogenic (e.g., mining industry, chemical industry, electroplating and stainless-steel production) sources [4] and then undergoes a series of geochemical reactions, including adsorption, reduction and precipitation [1].
Iron (hydr)oxides, including ferrihydrite, goethite, hematite and magnetite, are ubiquitous in soils and aquatic sediments as discrete particles, colloids or coatings on other minerals [5] and display high affinity for chromate [6]. The adsorption of chromate at the iron oxide/water interface is a vital geochemical process controlling the transport of chromate in the subsurface environment [7]. Moreover, adsorption by iron oxides is also a promising routine for the removal of chromate from industrial wastewater, with the merits of low cost and easy handing. For magnetite, the properties of abundant surface groups, high surface area and strong magnetism are especially beneficial for easy separation [8].
In addition, the abiotic reduction of chromate to Cr(III) is another important geochemical process that decreases the toxicity and mobility of chromium [9], where iron oxides are regarded as strong reductants [10]. Magnetite, the most common Fe(II)-containing iron oxide in the Earth’s crust, plays a vital role in the abiotic reduction of chromate [11,12]. The surface Fe(II) in magnetite is an important electron donor, while structural Fe(II) and Fe(III) can be oxidized and reduced reversibly, promoting electron transfer from the solid phase to adsorbed chromate and keeping the structure of magnetite unchanged [13]. Then, the generated Cr(III) forms hydroxide on the mineral surface [14]. Based on the above reduction mechanism, the adsorption of chromate is crucial for the proceeding reduction reaction. Moreover, as verified in the heterogeneous oxidation of Mn(II) by goethite [15,16], the adsorption geometry of Mn(II) (e.g., outer-sphere, mononuclear or binuclear complexes) gives rise to differences in electronic structure, adsorption density, the number of coordination ligands bonded to goethite [16] and the electron transfer rate from Mn(II) to goethite [17]. This implies that the adsorption geometry of chromate is also significant for the reduction kinetics and efficiency of iron oxides. To date, compared to several iron oxides, including hematite, goethite and ferrihydrite, which have been intensively investigated [6,18,19], the adsorption mechanism and geometry of chromate on magnetite surfaces are poorly understood at the molecular level.
The adsorption behavior of chromate on iron oxides is greatly affected by coexistent oxyanions. For instance, sulfate (SO42–) is a major oxyanion in surface water and groundwater [20] from natural (e.g., acid rock drainage (ARD)) and anthropogenic (e.g., pulp and paper industry, food processing industry and fossil fuel combustion) sources [21] that competes with chromate for adsorption [14] due to its similar chemical properties and geometrical configuration [22]. Sulfate is utilized as a desorbing agent for chromate [23], which reduces chromate adsorption on hematite by up to 80% [24]. However, an exceptional phenomenon was observed on silica gelatine composites [22] and goethite [25], where the adsorption of chromate is unaffected by sulfate. This indicates controversy regarding the competitive adsorption between sulfate and chromate, probably ascribed to the variation in adsorption geometry depending on pH, ionic strength, adsorbate concentration and adsorbent type. For example, for chromate adsorbed on ferrihydrite and hematite, monodentate is the preferential geometry at low surface coverage and alkaline conditions, while it changes to bidentate complexes in corner-sharing configurations at high surface coverage and acidic pH [6,19]. Moreover, outer-sphere complexes have also been identified on boehmite [26] and maghemite surfaces [27]. However, sulfate is predominantly adsorbed as an outer-sphere species on goethite at alkaline pH, while both outer-sphere and inner-sphere complexes coexist under acidic conditions [28]. Hence, the adsorption species and reaction conditions should be considered in the comparison of adsorption competitiveness.
In this study, the effect of sulfate on the adsorption of chromate by Ni-substituted magnetite was investigated by in situ attenuated total reflectance Fourier transform infrared (ATR-FTIR) spectroscopy as a function of pH and adsorption sequence. ATR-FTIR is a non-destructive method capable of investigating the coordination environment and protonation state of oxyanions at the mineral/water interface without interference from the signals of the liquid phase [29,30], facilitating real-time observation of the adsorption geometries of chromate and sulfate on magnetite surfaces as well as their adsorption competitiveness. Although most ATR-FTIR analyses require curve fitting to obtain accurate assignment of peaks, where some uncertainty exists and small peaks are easily missed, two-dimensional correlation spectroscopy (2D-COS) was applied by resolving overlapping peaks and enhancing the spectral resolution [31,32]. To improve the IR signal of adsorbed oxyanions, Ni-substituted magnetite was chosen as the absorbent, which is one of the common natural magnetites with a higher specific surface area and stronger adsorption properties than pure magnetite [33]. The experiment was carried out under oxic conditions to inhibit the reduction of chromate by magnetite [11]. To the best of our knowledge, this is the first study to use the ATR-FTIR method to explore the competitive adsorption between chromate and sulfate on magnetite. The obtained results provide a molecular-level understanding of the competitive adsorption mechanism between chromate and sulfate and are of great significance for a thorough understanding of their behaviors in soils and aquatic environments.

2. Materials and Methods

2.1. Ni-Substituted Magnetite Preparation

All chemicals and reagents used in this study were of analytical grade and used as received. Deionized (DI) water with resistivity of 18.25 MΩ·cm–1 at 25 °C was used for the solution preparation, synthesis and reaction. Ni-substituted magnetite, synthesized by a precipitation–oxidation method (Text S1), was used as the magnetite sample. The substitution of Ni in magnetite did not noticeably change the crystal structure (Figure S1) or point of zero charge (PZC, 6.8) but did increase the specific surface area (53.7 m2·g–1) and active site density (4.35 sites nm–2), which could improve the adsorption of chromate and sulfate on magnetite and thus the signals and accuracy of ATR-FTIR analysis.

2.2. FTIR Measurements

The ATR-FTIR spectra were collected on a Bruker Vertex 70 FTIR spectrometer (Bruker, Billerica, MA, USA) equipped with a liquid N2-cooled MCT detector and horizontal ATR accessory. Two hundred scans were collected for each measurement in the spectral range of 600–1200 cm–1 with a resolution of 4 cm–1. Before ATR-FTIR analysis, a Ni-substituted magnetite particle layer was prepared on a diamond crystal surface. One milliliter of Ni-substituted magnetite suspension (5 g·L–1) was dropped on the crystal surface and allowed to dry overnight at room temperature. Prior to use, the film was rinsed with DI water to remove loosely deposited particles, which made the deposited Ni-substituted magnetite layer stable during the ATR-FTIR analysis [34]. Before adsorption, NaCl background electrolyte solution (0.01 mol·L–1), at the designed pH values, was run through the cell with the Ni-substituted magnetite deposition layer by a peristaltic pump at a rate of 1 mL min–1 until there was no further change in the spectra. A background spectrum composed of the absorbance of diamond crystal and deposited adsorbents was collected. Then, the solution containing specific oxyanions (i.e., chromate (100 μmol·L–1) or sulfate (100 μmol·L–1)) in the NaCl background electrolyte (0.01 mol·L–1) was injected into the diamond crystal to start the absorption experiment, while the IR spectra were recorded as a function of time until the adsorption reached equilibrium. In this process, the pH value was fixed by the HNO3 and NaOH solution with a concentration of 0.1 mol·L–1. Spectra acquisition, subtraction, normalization and baseline correction were performed using Bruker OPUS software (version 6.5, Bruker, Billerica, MA, USA). Curve fitting analysis of the overlapping peaks was conducted using a Gaussian line shape. To obtain an accurate assignment of the IR peaks for the surface complexes, the spectra were analyzed using the 2D-COS technique (Text S2).

3. Results

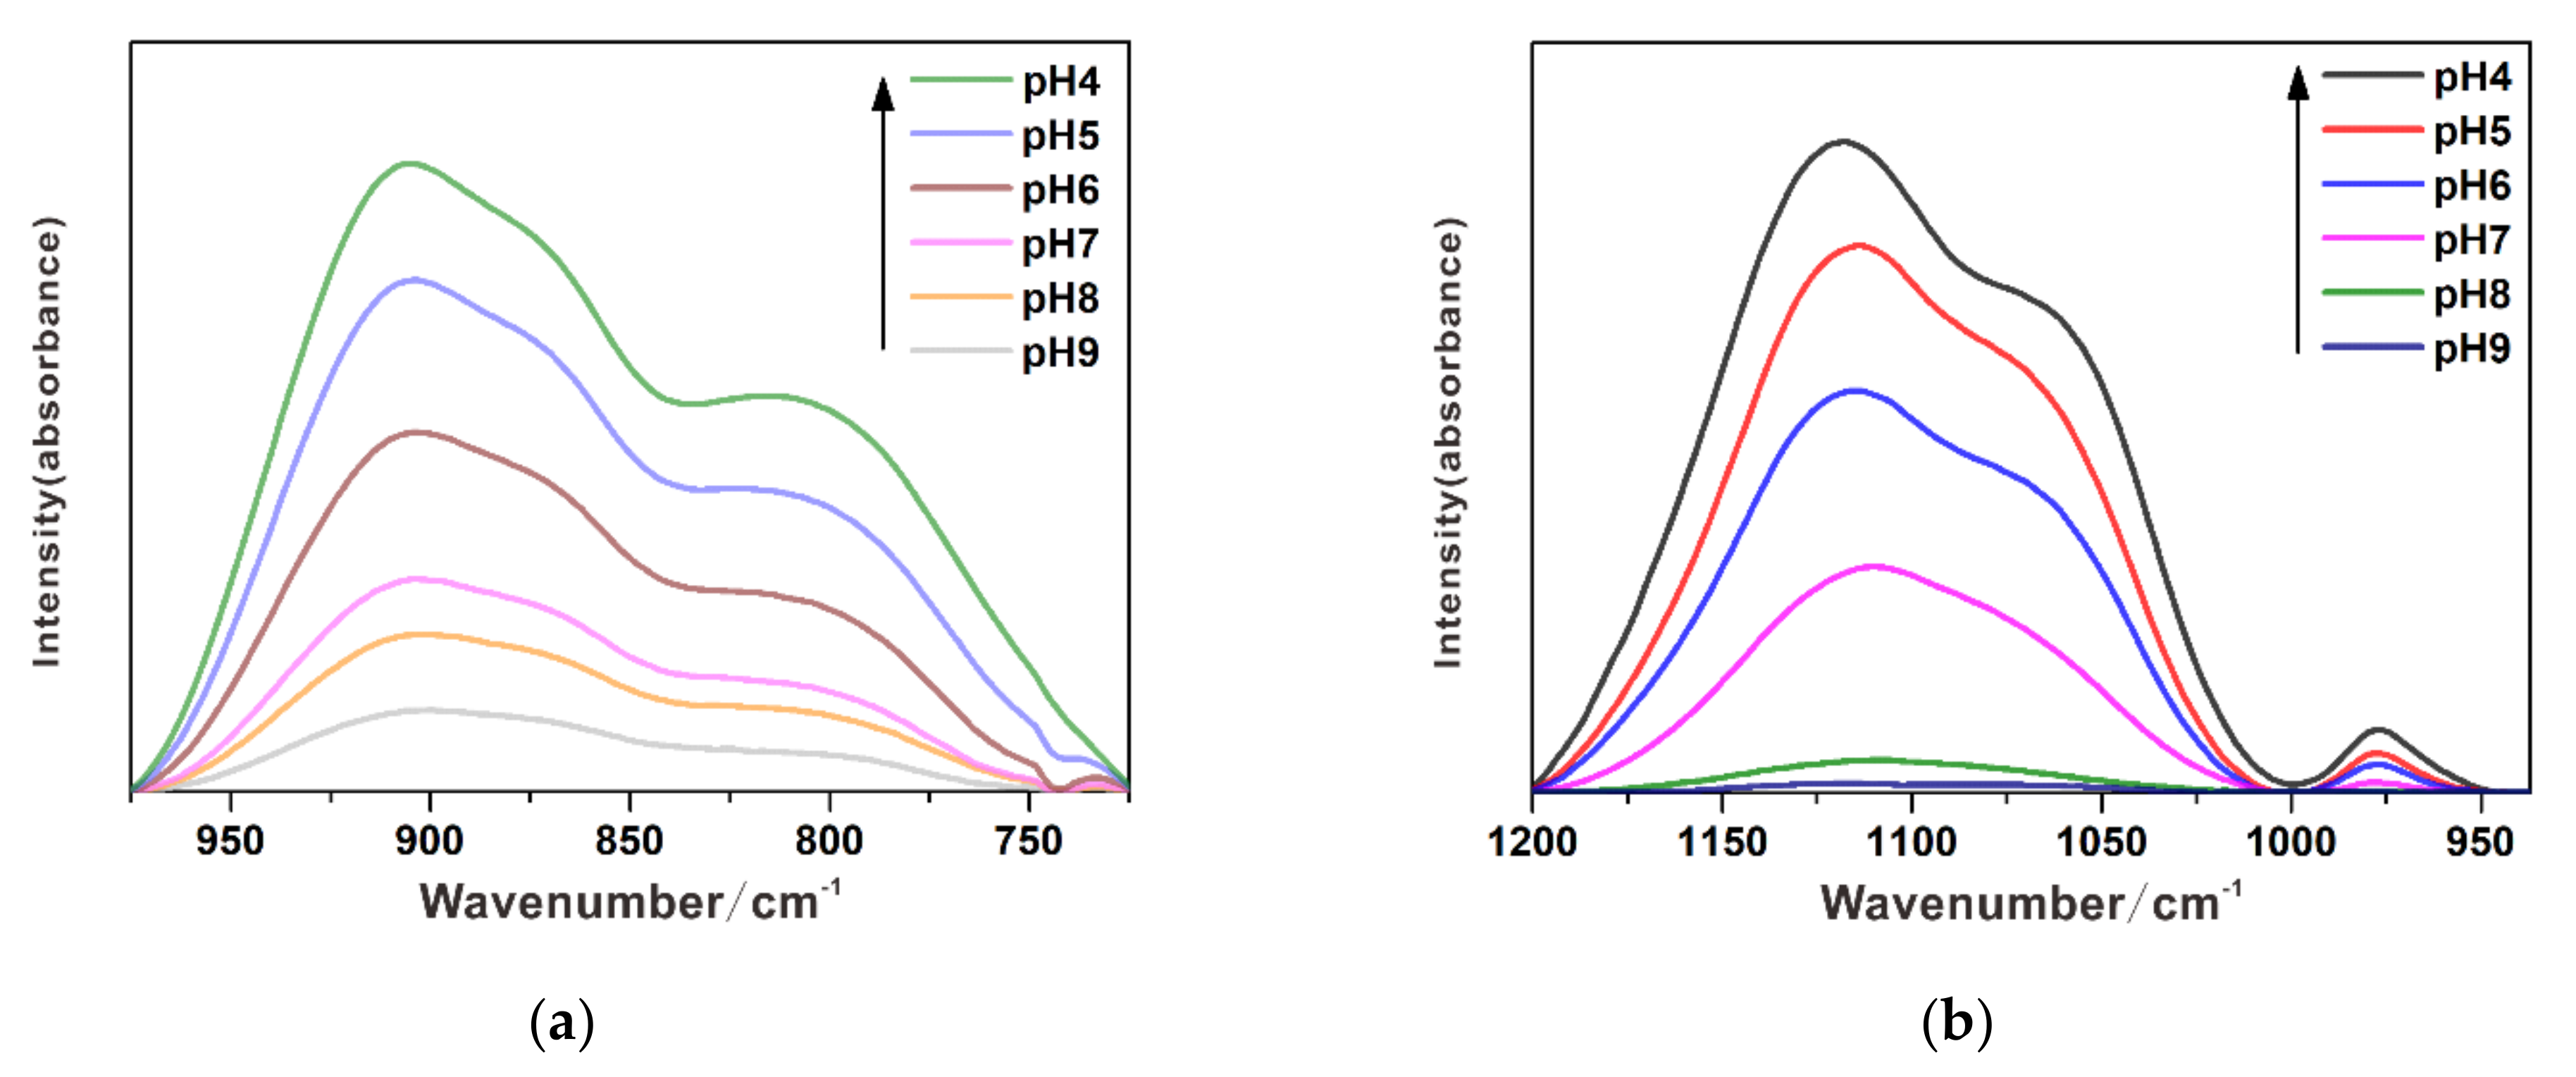
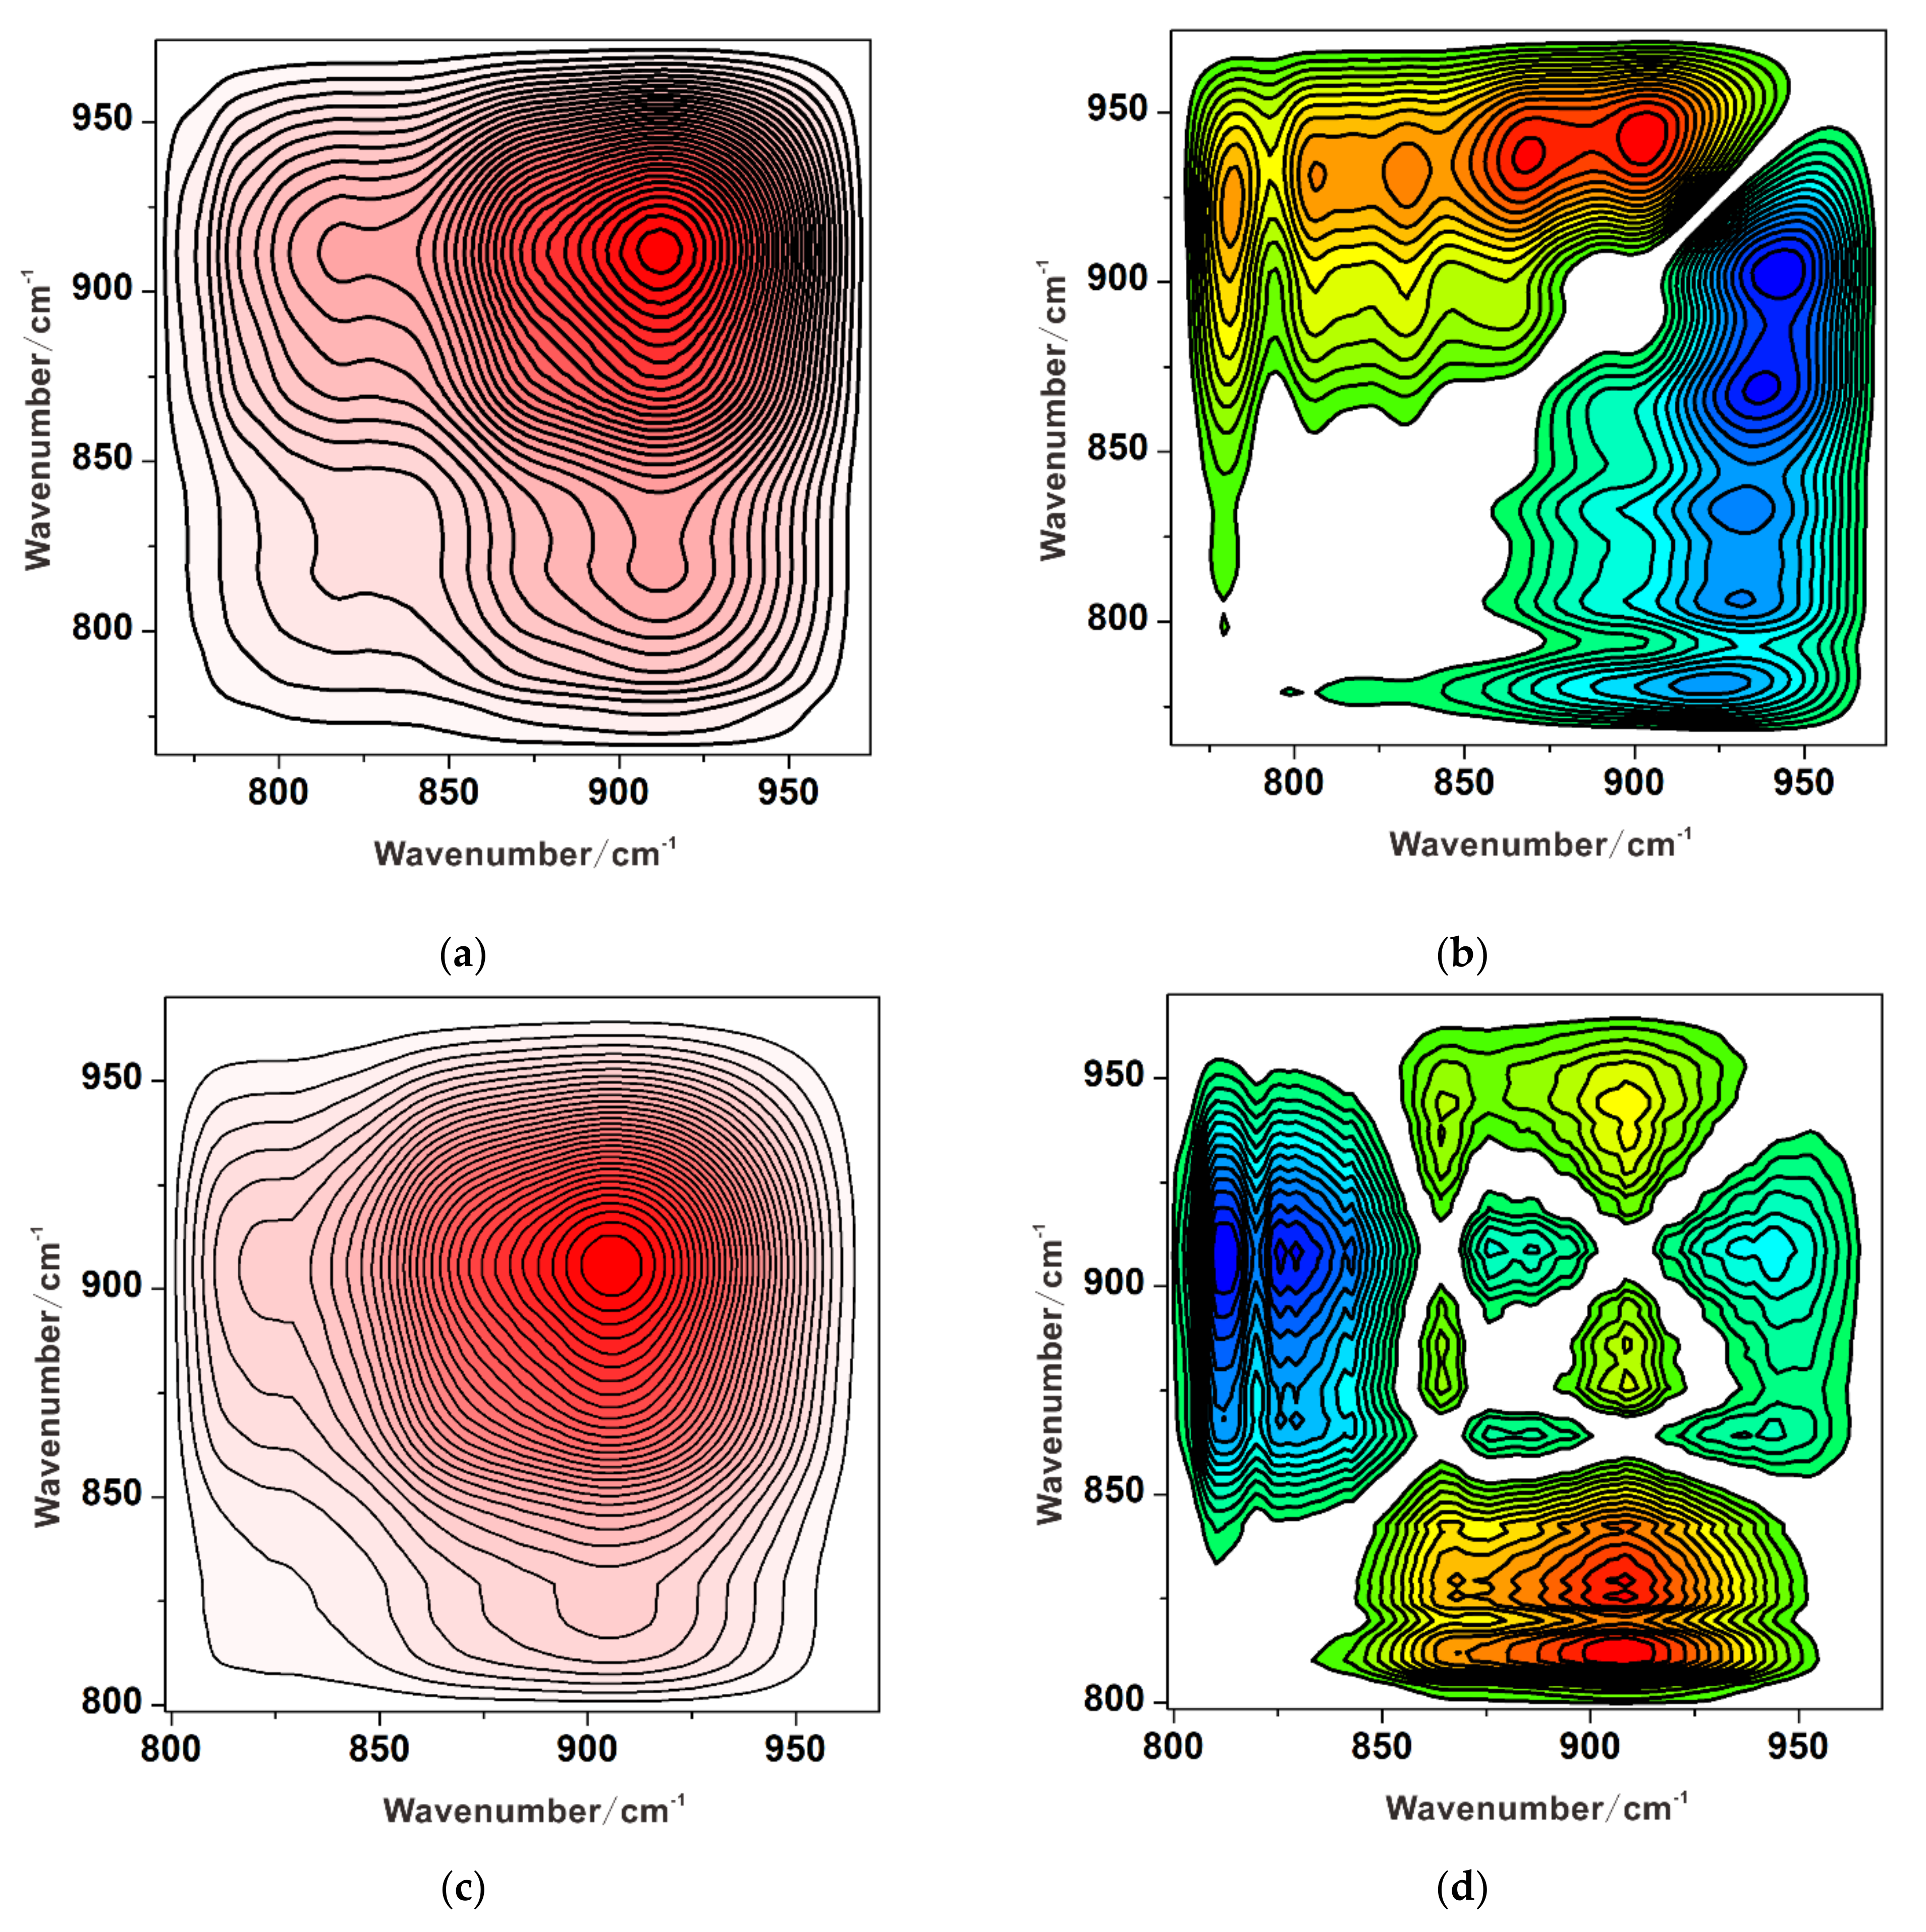
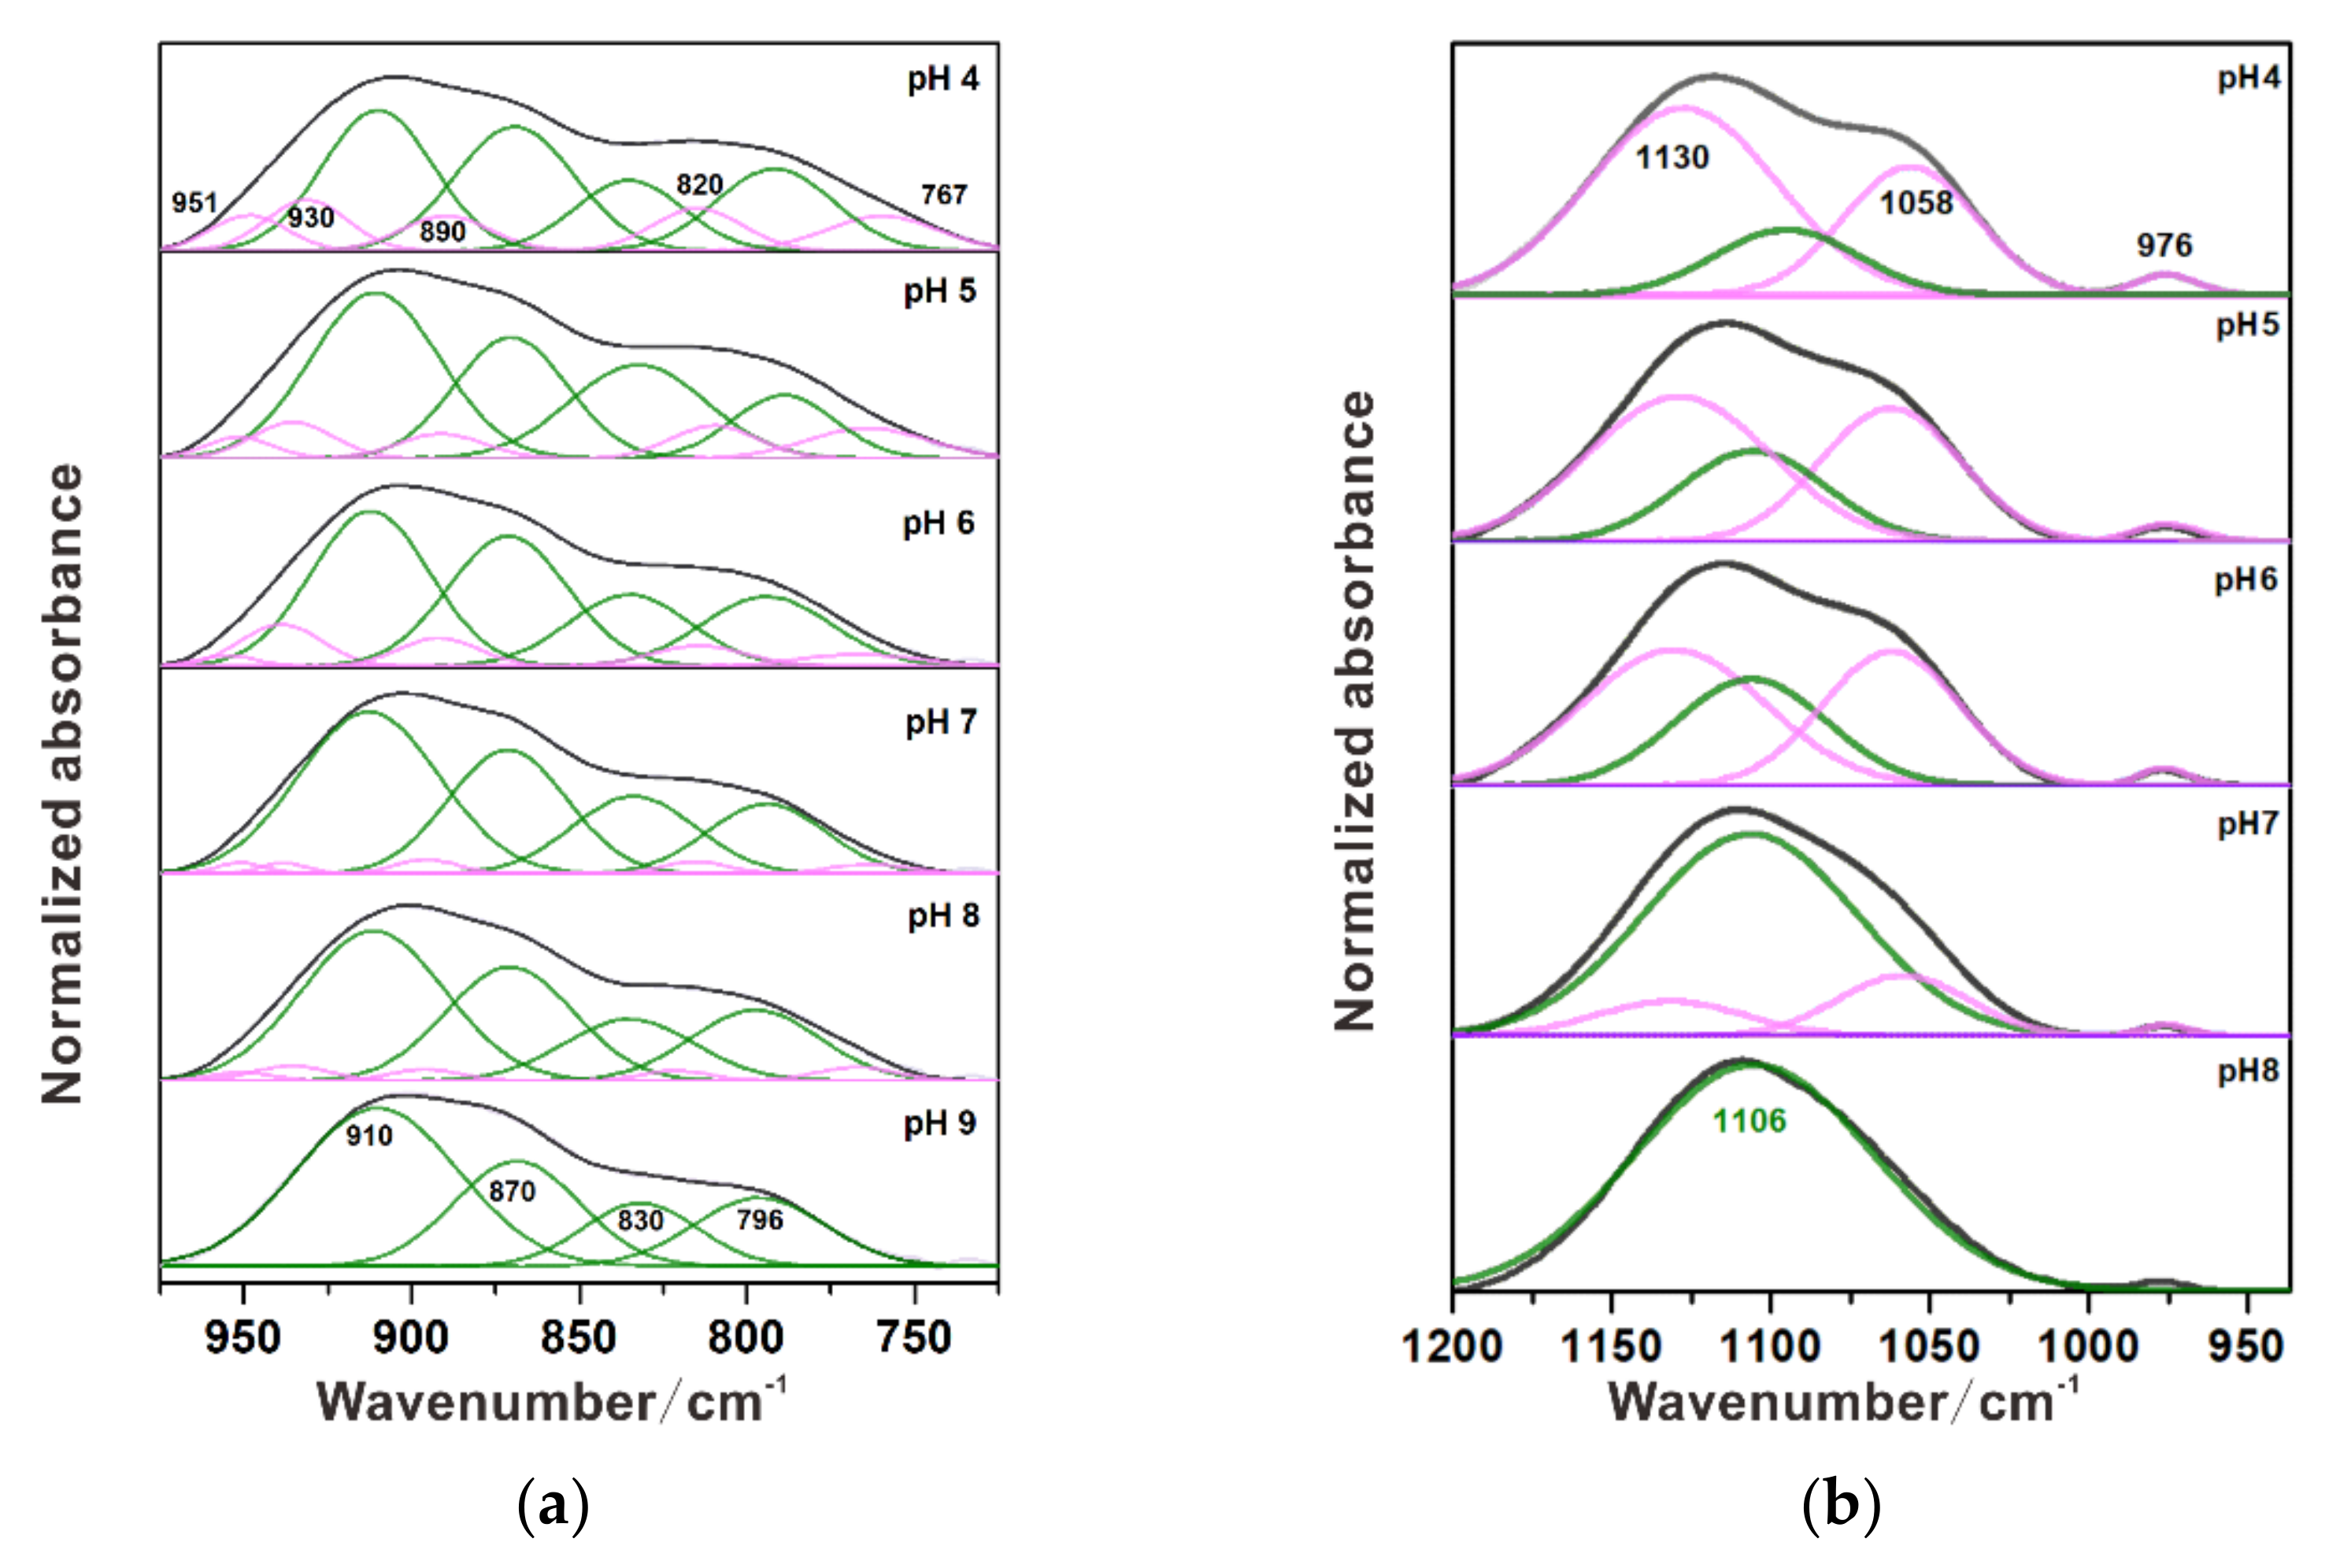
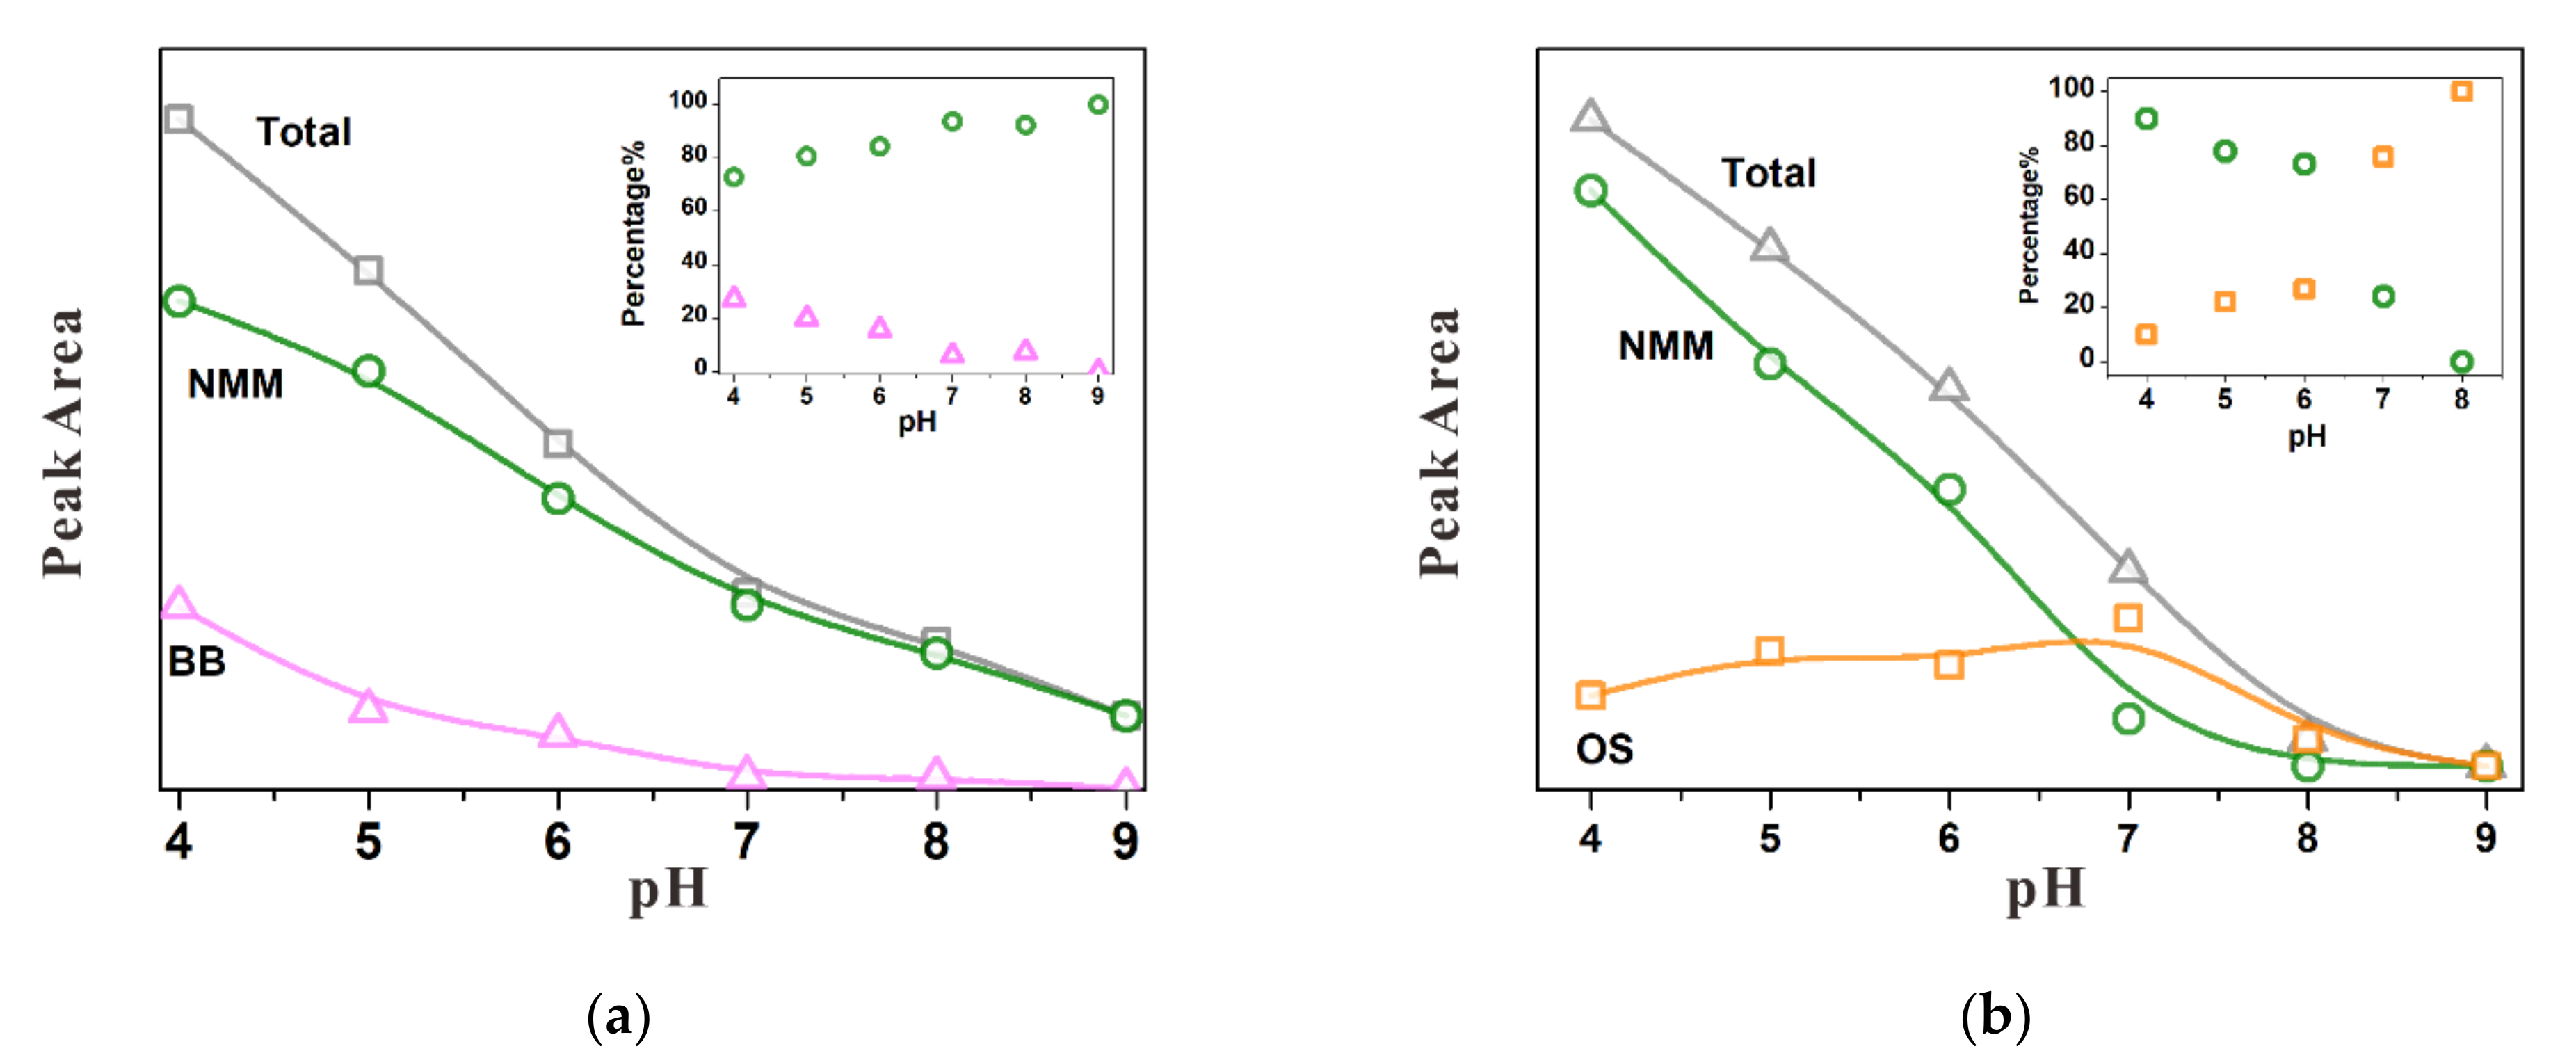
3.1. Individual Adsorption of Chromate

Since the maximum concentration of chromate in this study was only 100 μmol·L–1, the aqueous chromate was dominated by CrO42– and HCrO4, rather than Cr2O72–, according to the calculation results by Visual MINTEQ (Figure S2). As the chromate concentration was much lower than the detection limit of aqueous chromate by in situ ATR-FTIR (ca. 10 mmol·L–1), the characteristic IR bands absolutely contributed to the adsorbed chromate species. Thus, the intensity of the characteristic bands was proportional to the adsorption amount. Figure 1a shows the spectra of adsorbed chromate at different pH values. As the pH decreased, the IR intensity was noticeably enhanced, which is consistent with macroscopic studies [24,35]. Given that the point of zero charge (PZC) of the Ni-substituted magnetite was 6.8, the Ni-substituted magnetite surface gradually changed from a negative charge at alkaline pH to a positive charge under acidic conditions, resulting in an increase in chromate adsorption. Moreover, the spectra of adsorbed chromate significantly deviated from those of aqueous CrO42– and HCrO4, which displayed a single band at 880 cm–1 and four bands at 950 cm–1, 890 cm–1, 882 cm–1 and 772 cm–1, respectively (Figure S3) [36]. This confirms that chromate was directly bonded to the Ni-substituted magnetite surface by forming inner-sphere (IS) complexes. However, the profile of spectra showed slight variation with a pH decrease, i.e., an increase in the intensity of the shoulder band at 870 cm–1 as well as the blueshift of the band at 900 cm–1, suggesting a change in the adsorption geometry and the proportion of adsorption species.
To distinguish the adsorption species of chromate, the affiliation of characteristic bands was analyzed by applying the 2D-COS method to the spectra (Figure 2). The synchronous spectra revealed that as adsorption proceeded, the intensity of the auto-peak at 910 cm–1 observably increased. In addition to the auto-peak, strong cross peaks at Φ(910 cm–1, 830 cm–1) and weak cross peaks at Φ(910 cm–1, 870 cm–1) appeared (Figure 2a,c). This indicated that bands at 910 cm–1, 870 cm–1 and 830 cm–1 simultaneously increased in intensity with adsorption time [37]. Through asynchronous contour plots with higher resolution (Figure 2b,d), more IR bands were discerned, and their asynchronous correlations are shown in Table S1. The asynchronous spectrum displayed four groups of cross peaks, i.e., Ψ(950 cm–1, 910 cm–1), Ψ(930 cm–1, 910 cm–1), Ψ(890 cm–1, 910 cm–1) and Ψ(820 cm–1, 910 cm–1). Thus, the band at 910 cm–1 was asynchronous with those at 950 cm–1, 930 cm–1, 890 cm–1 and 820 cm–1. Likewise, the bands at 870 cm–1 and 830 cm–1 were also asynchronous with those at 950 cm–1, 930 cm–1, 890 cm–1 and 820 cm–1, in light of the cross peaks at Ψ(950 cm–1, 870 cm–1) and Ψ(930 cm–1, 830 cm–1). According to the study by Hoffmann et al. [36], Cr−O stretching vibrations of coordinated chromate occurred in the range of 950 cm–1 to 800 cm−1, while the bands below 800 cm−1 were mainly attributed to Cr−O−Fe bridge vibrations, OH torsional modes and Cr−OH stretching. Hence, the latter spectral range was not considered to infer the configuration of the chromate species. Therefore, based on 2D-COS analysis, the bands at 910 cm–1, 870 cm–1 and 830 cm–1 and those at 950 cm–1, 930 cm–1, 890 cm–1 and 820 cm–1 were attributed to two different inner-sphere complexes of chromate.
The former group of bands corresponds to two ν3 asymmetric (ν3, i.e., 910 cm–1 and 870 cm–1) and one symmetric stretching vibration mode of Cr–O (ν1, i.e., 830 cm–1). In light of group theory [34], the presence of three Cr–O stretching vibrations suggests that this chromate species possessed C symmetry. As reported in Kubicki’s study [38], the only possible configuration with C symmetry is nonprotonated monodentate mononuclear complexes (NMM, FeOCrO3). For the latter band group, the bands at 950 cm–1, 930 cm–1 and 820 cm–1 are assigned to ν3 vibrations, while those at 890 cm–1 are assigned to ν1 vibrations [39,40]. This suggests the C symmetry or lower (C1). The above characteristic bands were also observed in chromate adsorption on ferrihydrite and hematite surfaces (Table 1). Unlike the adsorbed chromate of C symmetry with the sole reliable configuration of (NMM), it is more difficult to assign the adsorbed species with C or C1 symmetry to a specific configuration. There are several possible adsorption geometries, including protonated monodentate complexes (FeOCrO2OH), protonated bidentate complexes (Fe2O2CrOOH) and nonprotonated bidentate complexes (Fe2O2CrO2). However, in Johnston’s study [19], the formation of protonated species (i.e., protonated monodentate or bidentate complexes) was excluded by a deuterium exchange experiment. The species with C symmetry should be nonprotonated bidentate complexes (BB, Fe2O2CrO2). Moreover, the frequencies of NMM and BB complexes matched well with the theoretical Cr–O stretching frequencies, i.e., 919 cm–1, 873 cm–1 and 828 cm–1 for monodentate complexes and 948 cm–1, 924 cm–1, 882 cm–1 and 841 cm–1 for bidentate complexes [40].
Based on the deconvolution of the characteristic bands of NMM and BB species (Figure 3a), their contributions to the total adsorption were calculated, which varied with pH (Figure 4a). Under alkaline conditions, IS complexes with NMM geometry were the dominant species (more than 93%, (Equation (1)), while almost no BB complexes were produced (Equation (2)). This is in accord with the density-functional theory (DFT) calculation results for chromate on iron oxides [6]. The monodentate complexes were the most stable configuration with an adsorption energy of –159.1 kJ·mol–1, which was much lower than that of BB complexes (–114.3 kJ·mol–1) [6]. As the pH decreased, the formation of both NMM and BB species significantly increased. The proportion of NMM complexes gradually decreased, although they were still the dominant species over BB complexes. As reported by Grossl et al., the formation of bidentate complexes was preceded by monodentate intermediate complexes [42]. This also explains the slower generation of BB complexes than NMM complexes. The transformation from monodentate complexes to bidentate complexes was also found on other iron oxides. However, it seemed faster on the ferrihydrite and hematite surfaces than on magnetite. At pH 4, BB species only accounted for 30% of the total adsorbed chromate on magnetite (this study) but achieved 50% on ferrihydrite [43] and 70% on hematite [6].
≡FeOH + HCrO4 → ≡FeOCrO3 + H2O
2≡FeOH + HCrO4 + H+ → (≡FeO)2CrO2 + 2H2O

3.2. Individual Adsorption of Sulfate

The adsorption of sulfate on Ni-substituted magnetite was also affected by pH. At pH 9, no attenuation of sulfate was seen (Figure 1b). pH 9 was significantly higher than the PZC value (6.8) of Ni-substituted magnetite, resulting in a large number of negative charges generated on the Ni-substituted magnetite surface. The strong repulsive force inhibited the sulfate oxyanions from approaching the Ni-substituted magnetite surface. When the pH decreased, the Ni-substituted magnetite surface gradually changed from negatively charged to positively charged, improving sulfate adsorption. Thus, the band intensity was greatly enhanced, and the spectrum profile was significantly altered. At pH 8, the spectrum displayed a broad and symmetrical band at 1100 cm–1, matching the IR bands of aqueous SO42– (Figure S4). This suggested that outer-sphere (OS) complexes predominated at alkaline pH [34]. As the pH decreased to 4, the band at 1100 cm–1 gradually split into two apparent bands at 1130 and 1050 cm–1, accompanied by an increase in the intensity of the band at 976 cm–1, suggesting the formation of inner-sphere complexes at acidic pH.
On the synchronous contour plot of adsorbed sulfate, the intensity of the auto-peak at 1106 cm–1 clearly increased with adsorption time (Figure 5a,c). The asynchronous spectra displayed three cross peaks, i.e., Ψ(1106 cm–1, 1135 cm–1), Ψ(1106 cm–1, 1058 cm–1) and Ψ(1106 cm–1, 976 cm–1) (Figure 5b,d). This indicated that the band at 1106 cm–1 has an asynchronous correlation with those at 1135 cm–1, 1058 cm–1 and 976 cm–1. It should be noted that there are no asynchronous correlations among the latter bands (Table S2), suggesting that they belong to the same adsorption species [44]. The band at 1106 cm–1 represented the OS complexes (Figure S3) [45]. For the band group, the band at 976 cm–1 was assigned to the S-O symmetric stretching vibration (ν1), while the bands at 1130 cm–1 and 1058 cm–1 were assigned to asymmetric stretching vibrations (ν3). The three S–O stretching bands illustrate that this adsorption species consists of inner-sphere complexes with C symmetry and corresponds to nonprotonated monodentate mononuclear complexes (NMM, FeOSO3). The configuration of adsorbed sulfate on Fe (hydr)oxides has been investigated by several studies (Table 2), where the ubiquity of outer-sphere and inner-sphere complexes was recognized. However, the geometry of inner-sphere species is distinct among iron oxides. For instance, bidentate binuclear (BB) complexes were the main species of sulfate on the goethite surface with four S–O stretching vibrations at 1170 cm–1, 1120 cm–1, 1050 cm–1 and 980 cm–1 [28,46]. However, on the ferrihydrite surface, sulfate formed two inner-sphere species, including MM and BB complexes [46,47,48]. The MM complexes displayed three characteristic bands at 1115 cm–1, 1044 cm–1 and 979 cm–1, which were quite close to those of the inner-sphere complexes found in this study. This confirms the MM geometry for sulfate adsorbed on Ni-substituted magnetite.
Through the deconvolution of the characteristic bands of OS and NMM species (Figure 3b), their amount and the contribution to total sulfate adsorption were calculated as a function of pH (Figure 4b). At alkaline and neutral pH, the OS complexes were the dominant species (Equation (3)). With decreasing pH, NMM complexes were formed through covalent bonds on the Ni-substituted magnetite surface (Equation (4)). Interestingly, when the pH was below the PZC (6.8) of the Ni-substituted magnetite, the amount of NMM complexes sharply increased, while the amount of OS complexes remained at a stable level. This suggests that OS species were the intermediates of the inner-sphere complexes. However, owing to the increase in NMM complexes with decreasing pH, the contribution of OS species to the total adsorption of sulfate decreased rapidly and became almost negligible at pH 4 (<10%, Figure 4b).
≡FeOH + SO42− → ≡FeOH···SO42−
≡FeOH + SO42− + H+ → ≡FeOSO3 + H2O

3.3. Competitive Adsorption between Sulfate and Chromate

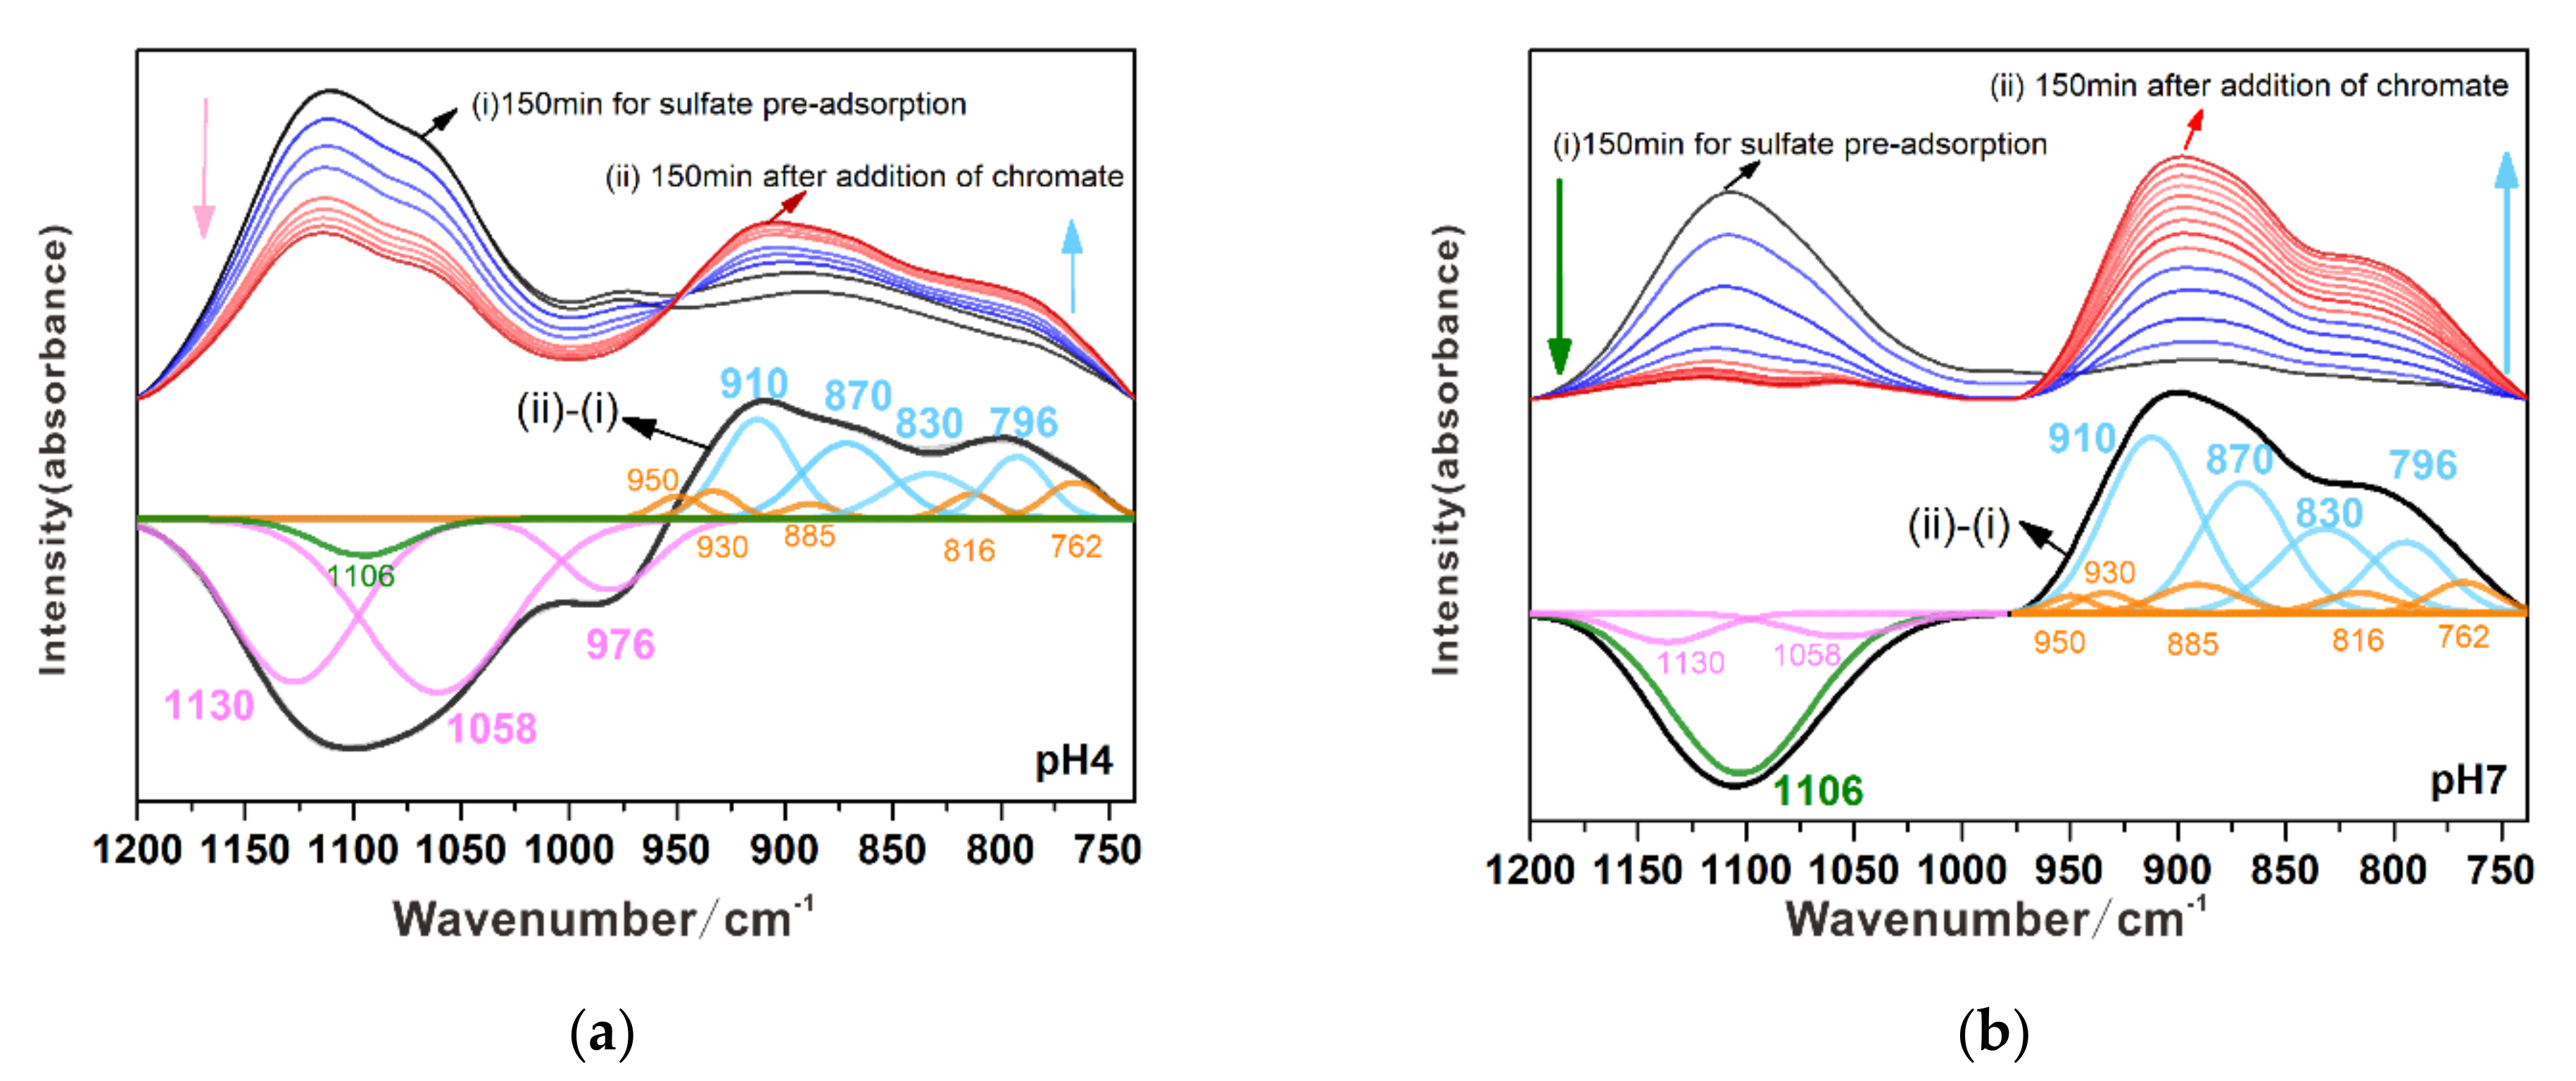
3.3.1. Substitution of Sulfate by Chromate

Initially, sulfate was pre-adsorbed on the Ni-substituted magnetite surface, which achieved equilibrium in 150 min (Figures S5a and S6). At pH 4, NMM complexes were the dominant species for the pre-adsorbed sulfate (Figure 4b). When the sulfate solution in the ATR cell was replaced by chromate solution of equal molar concentration, the bands in the 1200–960 cm–1 region immediately decreased in intensity (upper panel of Figure 6a). Simultaneously, bands in the 730–960 cm–1 region appeared and gradually became strong. This indicates the desorption of sulfate from the magnetite surface and subsequent adsorption of chromate. This process was clearer upon subtracting the equilibrium spectrum for the adsorbed chromate recorded at 300 min from the signals recorded at 150 min, i.e., immediately before the introduction of the chromate (lower panel of Figure 6a). The obtained spectrum displayed negative and positive signals, attributed to the desorbed sulfate and adsorbed chromate, respectively. Based on spectral integration, ca. 44% of absorbed sulfate was replaced by chromate. The negative spectrum was composed of three strong bands at 976 cm–1, 1058 cm–1 and 1130 cm–1 and a weak band at 1106 cm–1. Thus, the desorbed sulfate was dominated by NMM complexes (94%), with a small number of OS species (6%). The adsorbed chromate included NMM (80%) and BB (20%) complexes, evidenced by the appearance of two band groups, i.e., 910 cm–1, 870 cm–1 and 830 cm–1 with high intensity, and 950 cm–1, 930 cm–1, 885 cm–1 and 816 cm–1 with weak intensity.
The replacement of sulfate by chromate also occurred at pH 7. Before the addition of chromate, the spectra showed a symmetric broad band at 1106 cm–1 (Figure S5b), as the adsorbed sulfate was mainly outer-sphere species. After the introduction of the chromate solution, the bands of adsorbed sulfate rapidly decreased in intensity and achieved complete desorption in 40 min, while the chromate bands grew simultaneously. Interestingly, although the adsorbed sulfate was mainly outer-sphere complexes, its spectrum profile gradually became asymmetric during desorption (upper panel of Figure 6b). This can probably be ascribed to the fast desorption of the outer-sphere species (>90%), followed by the slow removal of the NMM species with characteristic bands at 1130 cm–1 and 1058 cm–1. Based on the subtractive spectrum (lower panel of Figure 6b), chromate substituting sulfate was primarily responsible for the NMM complexes (90%) and a few BB complexes (10%), which was consistent with the species composition of chromate in signal adsorption at pH 7 and substitution of sulfate at pH 4. According to the above observation, the pre-adsorbed sulfate did not notably affect the adsorption geometry of chromate. Moreover, the NMM complexes of chromate can compete with sulfate for the adsorption sites on the magnetite surface by partial substitution of the NMM complexes at acidic pH and almost all of the OS species at neutral pH.

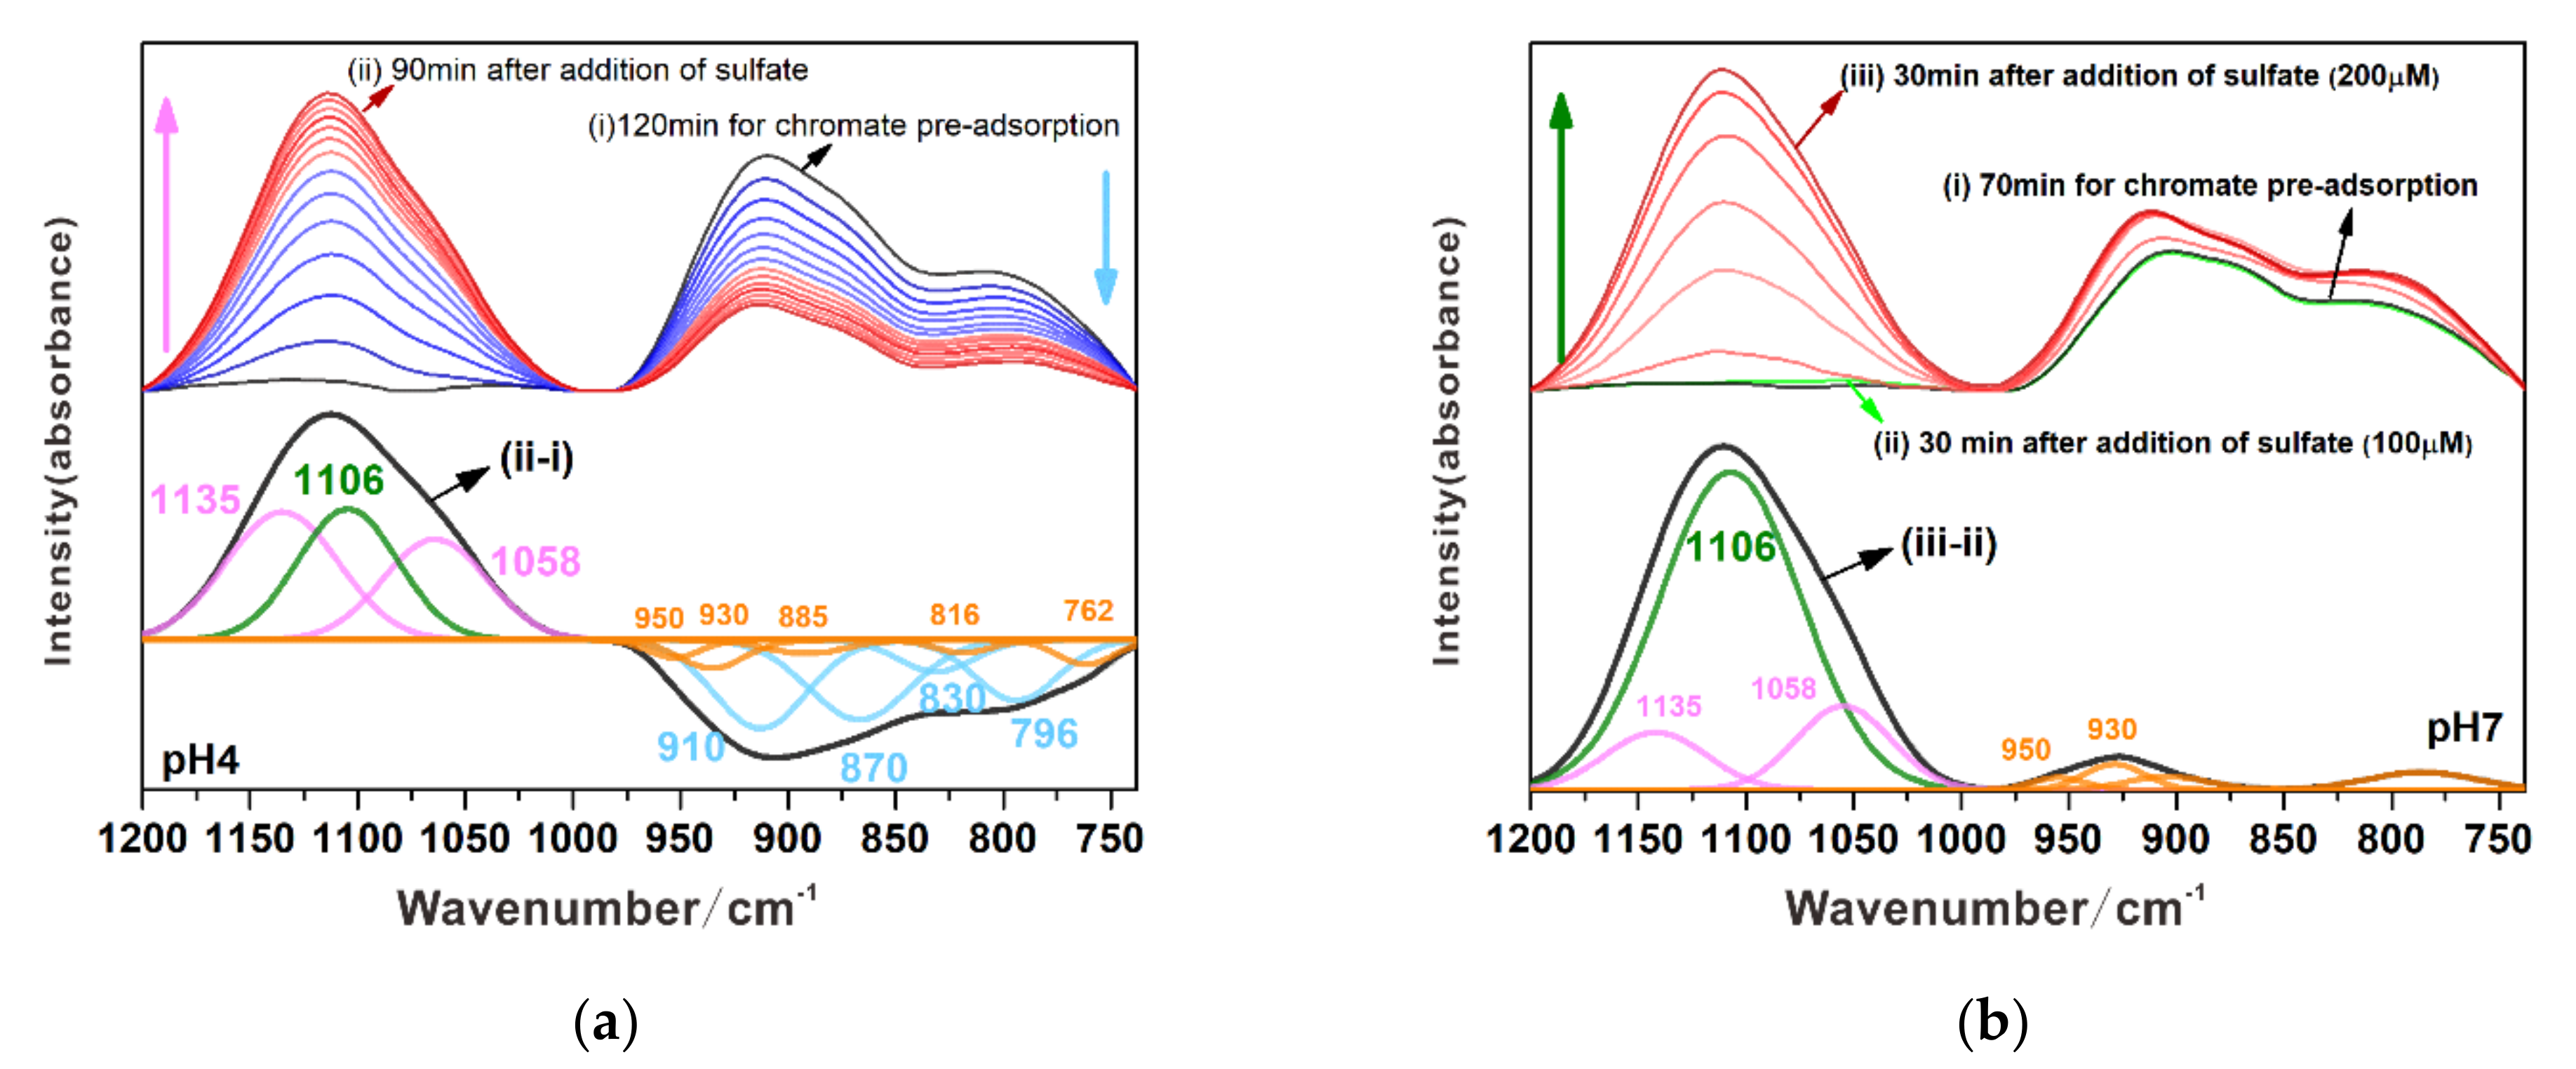
3.3.2. Substitution of Chromate by Sulfate

At pH 4, the pre-adsorbed chromate on the magnetite surface mainly existed as NMM complexes with a few BB complexes (Figure 4a and Figure S5c). The introduction of the sulfate solution of equal concentration significantly lessened the bands of adsorbed chromate and, in the region between 1200 cm–1 and 960 cm–1, the peaks of adsorbed sulfate gradually increased (upper panel of Figure 7a). Based on the spectral area integration, 66% of the adsorbed chromate was removed by sulfate in 90 min. As shown on the difference spectrum, most of the desorbed chromate consisted of NMM complexes (83%), while the desorbed amount of BB complexes was much lower (17%). The sulfate substituting chromate included two main configurations, i.e., NMM complexes and OS species, corresponding to the characteristic bands at 1135 cm–1 and 1058 cm–1, and 1106 cm–1, respectively. The NMM and OS complexes accounted for 65% and 35% of the adsorbed sulfate, respectively, which is different from the composition in the individual adsorption, i.e., 90% and 10%. This can probably be ascribed to the presence of BB chromate complexes, preventing more sulfate oxyanions from bonding to the magnetite surface.
When the pH was increased to 7, the adsorption geometry of chromate did not vary notably. Sulfate with an equal molar concentration could not replace the adsorbed chromate on the magnetite surface, as evidenced by the lack of change in the spectrum of adsorbed chromate and the disappearance of the signal of adsorbed sulfate in the 1200–970 cm–1 range (upper panel of Figure 7b). When the concentration of the sulfate solution was increased to 200 μmol·L–1, it was quickly adsorbed, as evidenced by the fast growth of the corresponding bands. However, the pre-adsorbed chromate species were hardly desorbed, as their characteristic bands still slightly increased in intensity and then stabilized (upper panel of Figure 7b). This illustrates the higher adsorption affinity of chromate over sulfate to the magnetite surface. By subtracting the equilibrium spectrum, recorded before the addition of sulfate (200 μmol·L–1) at 100 min, from that of the adsorbed sulfate at 130 min (lower panel of Figure 7a), the obtained spectrum displayed positive bands at 1106 cm–1 for the sulfate, featuring OS complexes. Other positive bands appeared at 950 cm–1 and 930 cm–1, corresponding to the BB complexes of chromate. Based on the above phenomenon, at neutral pH, sulfate could not substitute the pre-adsorbed chromate on magnetite. Indeed, the outer-sphere species of sulfate even promoted the formation of BB complexes of chromate.

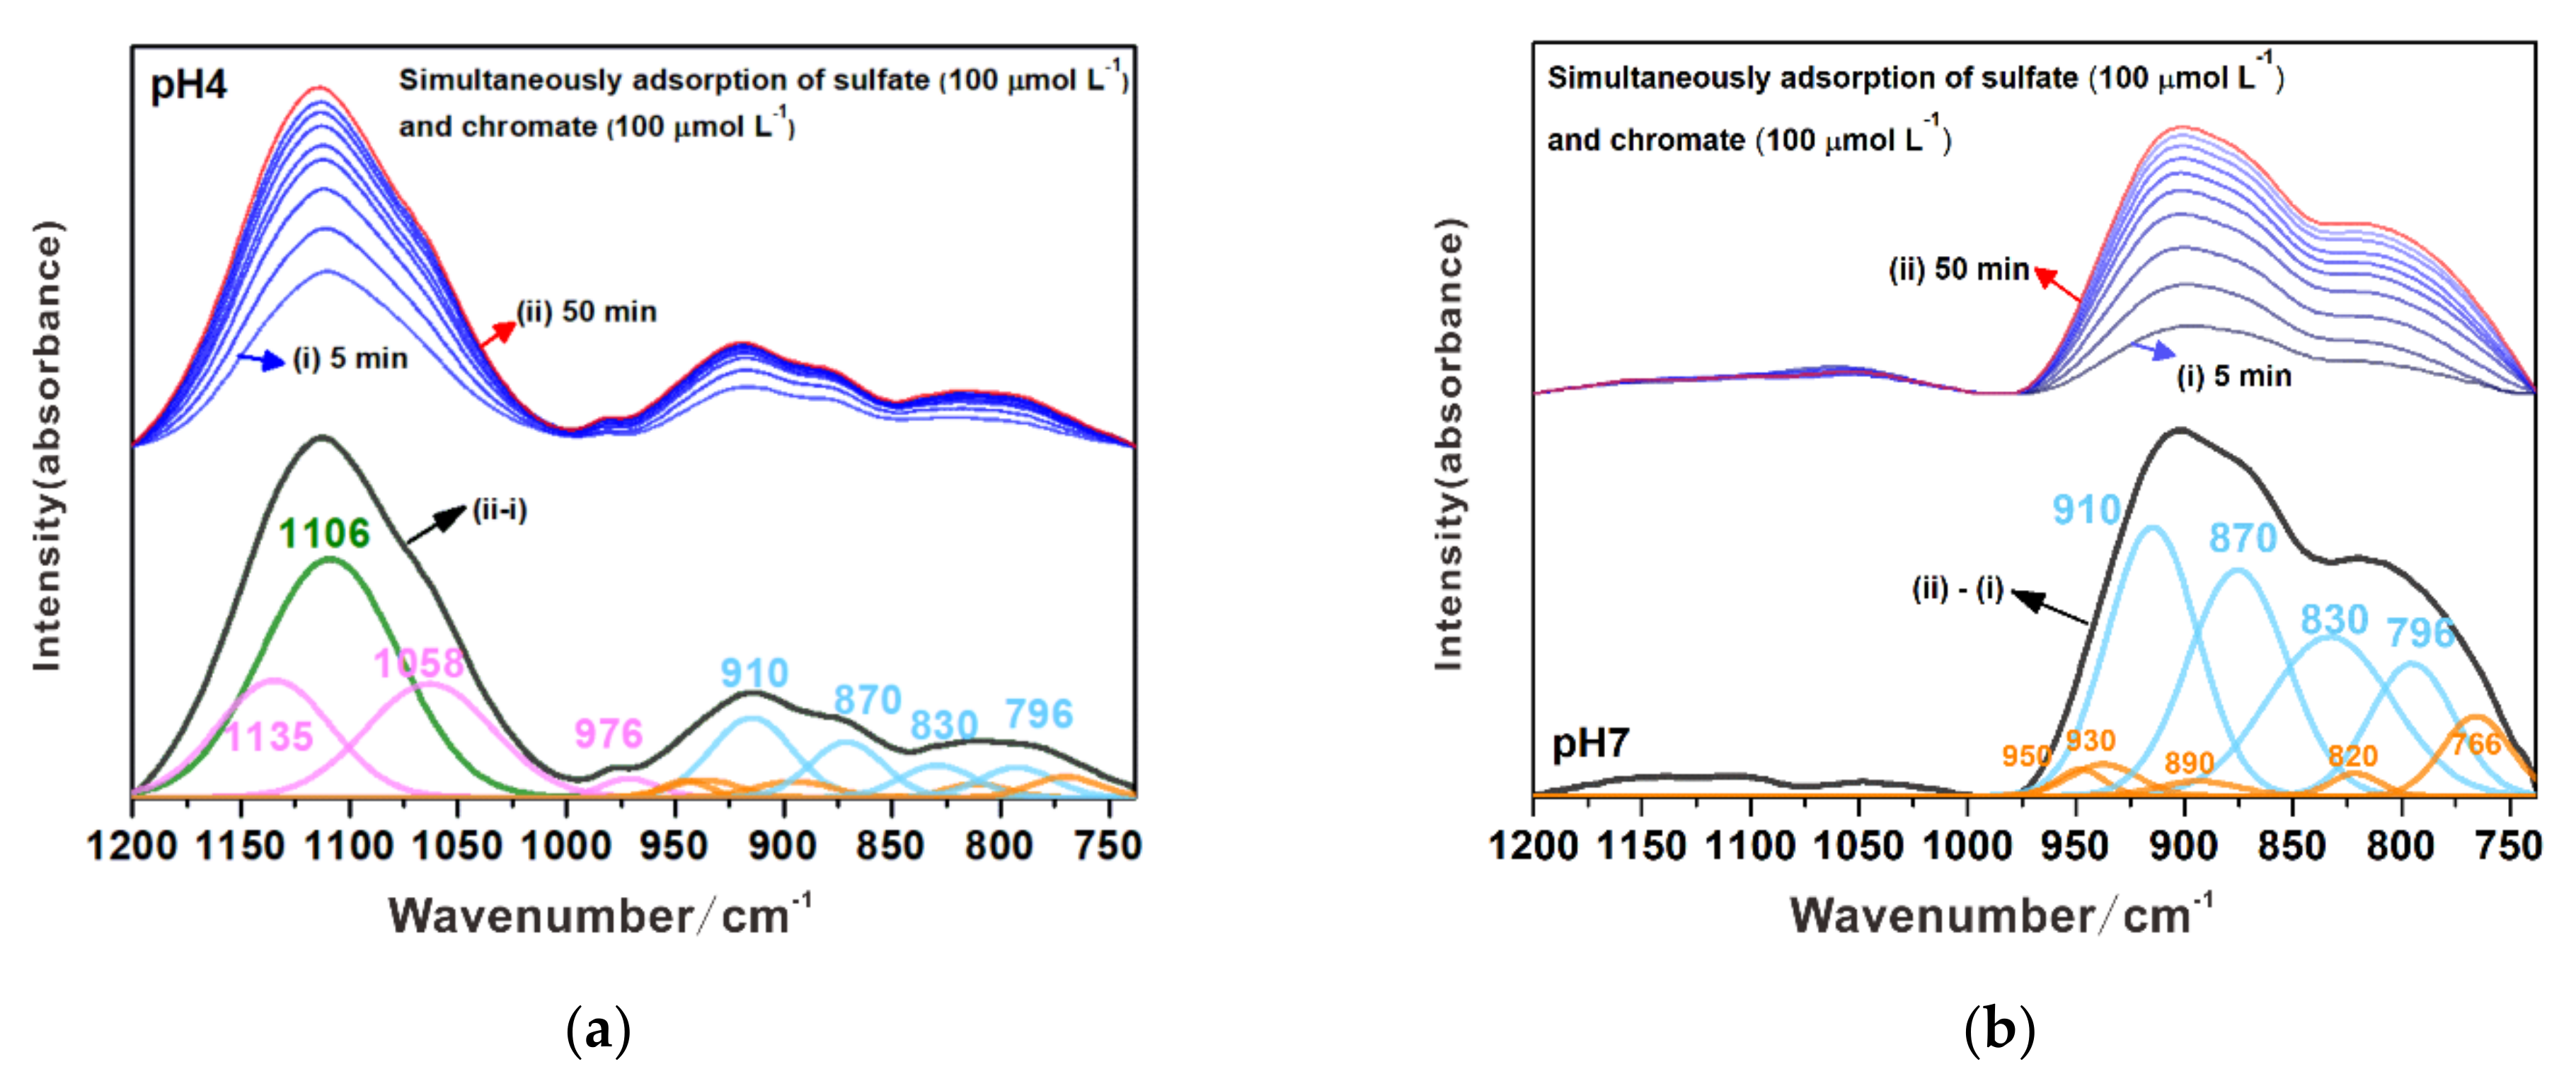
3.3.3. Simultaneous Adsorption of Chromate and Sulfate

To further compare the competitiveness between chromate and sulfate in the adsorption on magnetite, their simultaneous adsorption was also carried out. At pH 4, the bands corresponding to the adsorbed sulfate gradually increased in intensity with the reaction time and became steady after 50 min (upper panel of Figure 8a). The adsorption of chromate showed identical kinetics and achieved equilibrium in 50 min. This indicates that both oxyanions were simultaneously adsorbed on the magnetite surface. However, compared to the spectra of sulfate in individual adsorption, those of sulfate in simultaneous adsorption did not coincide, suggesting distinct adsorption geometries. For example, the spectra in single adsorption were obviously asymmetrical, with two isolated bands at 1130 cm–1 and 1050 cm–1. However, in the simultaneous adsorption, they became more symmetrical, with a maximum intensity at 1100 cm–1. To investigate this issue, curve fitting was conducted on the equilibrium spectrum (lower panel of Figure 8a). Although it was composed of two groups of bands, i.e., 1106 cm–1 for OS complexes and 1135 cm–1, 1058 cm–1 and 976 cm–1 for MM complexes, their contributions were mostly equal but notably different from the individual adsorption scenario with a negligible proportion of OS (< 10%, Figure 4b). This is in agreement with the result of the substitution of chromate by sulfate at acidic pH, where the adsorbed chromate favored the formation of OS complexes of sulfate. In contrast, the adsorption configuration of chromate did not vary, as identical spectra were obtained for individual and simultaneous adsorption (Figure 1b and Figure 8a). Different phenomena were seen for simultaneous adsorption at pH 7. Only the IR bands in the 960–738 cm–1 region for adsorbed chromate appeared and grew with the adsorption time, while the signal of adsorbed sulfate was too weak to be observed (upper panel of Figure 8b). This was consistent with the substitution of chromate by sulfate at the same pH, where the adsorption of sulfate was completely inhibited by the pre-adsorbed chromate (Figure 6b). This further confirmed the higher adsorption affinity of chromate over sulfate. The adsorption of chromate achieved equilibrium in 50 min by the formation of NMM (with bands at 910 cm–1, 870 cm–1 and 830 cm–1) and BB (with bands at 950 cm–1, 930 cm–1, 890 cm–1 and 820 cm–1) complexes for the majority and minority of chromate, respectively, which was consistent with the individual adsorption scenario (lower panel of Figure 8b).
Based on the results of the individual and competitive adsorption experiments for sulfate (Figure 4b and Figure 6, Figure 7 and Figure 8), the adsorption of sulfate on magnetite is very weak under alkaline conditions (pH > 7); thus, the competitive adsorption of sulfate and chromate under alkaline conditions was not discussed.

4. Discussion

4.1. Individual Adsorption

For chromate, although monodentate and bidentate complexes are common adsorption geometries formed on iron (hydr)oxides, e.g., ferrihydrite, hematite, goethite and magnetite, their proportions are variable. For example, under acidic conditions, the contribution of BB complexes to the total adsorption of chromate accounts for 90%, 70% and 50% on hematite, goethite and ferrihydrite, respectively [43,51]. However, as found in this study, compared to other (hydr)oxides, the proportion of BB complexes on the magnetite surface was much lower, i.e., only 30%. This made the MM complexes the dominant species on the magnetite surface. Based on the steric configuration, to build MM and BB complexes, chromate needs to be bonded to single and two adjacent surface sites, respectively. As indicated in other studies [18,28,52], the formation of BB complexes probably requires the protonation of two adjacent surface sites (Fe–OH or Fe–OH2+) for ligand exchange reactions, which includes two steps, i.e., (i) ligand exchange between chromate and a single hydroxyl site to form MM complexes and (ii) sequential reaction of MM complexes with the adjacent hydroxyl sites to form BB complexes [42]. Thus, the protonation degree of the hydroxyl group greatly affects the yield of BB complexes. Specifically, when surface sites are nonprotonated (Fe–O–), only outer-sphere species are present. However, with increasing protonation, the dominant species change from OS to MM and then to BB complexes. For surface sites with two protons (Fe–OH2+), participation in ligand exchange reactions is favored because water molecules (–OH2) are more easily replaced than hydroxyl groups (–OH). On account of the above adsorption mechanism, the variation in surface properties among iron (hydr)oxides can explain the difference in the adsorption complexes of chromate. The protonation degree is determined by the point of zero charge (PZC). At a given pH, magnetite has the lowest degree of protonation of hydroxyl groups, owing to its lower PZC (6.8) than ferrihydrite (8.4), goethite (9.3) and hematite (9.6). As a result, compared to other Fe (hydr)oxides, fewer BB complexes are generated on the magnetite surface. Moreover, the formation of BB complexes is also affected by the distance between adjacent protonated hydroxyl sites, as these complexes must be bonded to two adjacent protonated hydroxyl sites. If they are too far from each other, only MM complexes are produced. For hematite, goethite, ferrihydrite and magnetite, the densities of surface hydroxyl sites are 13.7, 6.14, 3.80 and 4.35 site·nm–2, respectively [47,53,54], resulting in a decrease in the proportion of BB complexes.
The variation in the adsorption geometries of sulfate displayed a similar trend among the Fe (hydr)oxides. Although MM and OS are the main species of adsorbed sulfate, the formation of MM complexes requires a higher protonation extent of hydroxyl groups than that for OS species. Thus, MM complexes are the only species formed on hematite with a higher PZC [34], while OS and MM species coexist on the surface of magnetite and ferrihydrite with a lower PZC [6].

4.2. Competitive Adsorption

Due to the identical chemical properties and geometrical configuration between sulfate and chromate (Figures S7 and S8) [14,22], they should display not only similar adsorption behavior but also strong competitive adsorption on mineral surfaces [24]. This is verified in the in situ ATR-FTIR analysis carried out on the magnetite surface in this study. For instance, under acidic pH, sulfate replaced the pre-adsorbed chromate, giving rise to the desorption of chromate by 66% (Figure 7a). Likewise, the adsorption of chromate led to dissolution of the pre-adsorbed sulfate by 44% (Figure 6a). In the simultaneous adsorption experiment, both oxyanions were adsorbed with comparable adsorption amounts. Therefore, chromate and sulfate displayed analogous affinity to the magnetite surface, resulting in intense competitive adsorption. Similar phenomena also occur in their co-adsorption on other minerals. As reported by Beinum et al., at pH 4, chromate significantly reduced the adsorption of sulfate on the goethite surface, while a significant decrease in the adsorption amount of chromate by the addition of sulfate was also observed [25]. In addition, a decrease of 40% in chromate adsorption by the introduction of sulfate is also seen on the corundum (γ–Al2O3) surface under acidic conditions [55].
Previous studies further distinguished the competitiveness between two oxyanions. The affinity of sulfate to goethite is weaker than that of chromate, while they reverse on the corundum surface. This is probably ascribed to the difference in the adsorption geometries. For chromate, under acidic conditions, BB complexes are the dominant configuration on goethite, while it primarily forms outer-sphere complexes on Al oxides [26]. Sulfate dominantly presents as BB complexes on both minerals [56]. Thus, the affinity of chromate and sulfate is opposite for Fe– and Al– oxides. In this study, both chromate and sulfate primarily existed as MM complexes on the magnetite surface under acidic conditions. As the desorption degree of chromate (66%) by sulfate is higher than that of sulfate (44%) by chromate, the competitiveness of sulfate MM complexes is mildly stronger than that of chromate MM species on the magnetite surface.
With the increase in pH to neutral conditions, the competitive adsorption between sulfate and chromate weakened dramatically. For example, sulfate could not replace the pre-adsorbed chromate, while the adsorption of chromate completely removed the pre-adsorbed sulfate. In addition, in the simultaneous adsorption study, no adsorption of sulfate was seen. Regardless of the addition order, sulfate did not affect the adsorption of chromate on magnetite. Similar phenomena were reported by Hilbrandf et al. [57] and Venditti et al. [22], where, for instance, at pH 7.5, sulfate had little effect on the adsorption of chromate on a ferrihydrite surface and on silica gelatin composites [22]. This can also be explained by the difference in adsorption configurations between sulfate and chromate. At neutral pH, sulfate was adsorbed by forming OS species, with much lower affinity than the main configuration of chromate, i.e., MM complexes (Figure 4).

5. Conclusions

In this study, the adsorption geometries of chromate and sulfate on magnetite surfaces and their adsorption competitiveness were investigated using ATR-FTIR and 2D-COS correlation methods. For chromate, nonprotonated monodentate mononuclear (NMM) complexes predominated in the pH range of 4–9, with a few bidentate binuclear (BB) complexes generated under acidic conditions. For sulfate, NMM and outer-sphere (OS) species dominated under acidic and neutral conditions, respectively. Chromate and sulfate displayed strong competitive adsorption on the magnetite surface under acidic conditions, as both existed mainly as NMM complexes. However, the affinity of sulfate was slightly stronger than that of chromate, although, with increasing pH, the competitive effect of sulfate on chromate adsorption decreased. Under neutral conditions, the adsorption of chromate completely suppressed sulfate adsorption, since the stability of NMM complexes of chromate was much stronger than that of the OS species of sulfate. Therefore, the adsorption competitiveness between chromate and sulfate on magnetite is dependent on the variations in adsorption geometries with pH. These molecular-level insights will be of great significance for understanding the transfer and fate of chromate and sulfate onto magnetite/water interfaces.

Supplementary Materials

The following are available online at https://www.mdpi.com/2075-163X/11/1/88/s1. Text S1: Preparation procedure of Ni-containing magnetite by a precipitation–oxidation method. Text S2: Analysis of ATR-FTIR spectra by using the 2D-COS technique. Figure S1: XRD pattern of as-prepared Ni-containing magnetite, Figure S2: Contribution of aqueous species of chromate at different pH values calculated by the Visual MINTEQ program. Figure S3: ATR-FTIR spectra of aqueous chromate (100 mmol·L–1) at pH 10 (top) and pH 3 (bottom). Figure S4: ATR-FTIR spectra of aqueous sulfate (10 mmol·L–1) at pH 8. Figure S5: Pre-adsorption of chromate (a, b) or sulfate (c, d) on Ni-substituted magnetite at pH 4 and pH7. Figure S6: IR spectra of Ni-substituted magnetite. Figure S7: The Cr(VI) adsorption isotherms of Ni-substituted magnetite. Figure S8: The S (VI) adsorption isotherms of Ni-substituted magnetite. Table S1: A synchronous relationship of peaks on the synchronous (Φ(ʋ1, ʋ2)) and asynchronous spectra (ψ(ʋ1, ʋ2)) of chromate adsorbed on the magnetite surface. Table S2: A synchronous relationship of peaks on the asynchronous spectra of sulfate adsorbed on the magnetite surface.

Author Contributions

Conceptualization, X.L. (Xiaoju Lin), X.L. (Xiaoliang Liang) and G.W.; methodology, X.L. (Xiaoju Lin). and J.L.; software, X.L. (Xiaoju Lin). and L.M.; experiments, X.L. (Xiaoju Lin), X.L. (Xiaoliang Liang), J.L. and J.Z.; writing—original draft preparation, X.L. (Xiaoju Lin), G.W. and X.L. (Xiaoliang Liang); writing—review and editing, X.L. (Xiaoju Lin), X.L. (Xiaoliang Liang), L.M. and J.Z. All authors have read and agreed to the published version of the manuscript.

Funding

This research was funded by the National Natural Science Foundation of China (Grant Nos. 41773113, 42022012 and 41825003), Natural Science Foundation for Distinguished Young Scientists of Guangdong Province (Grant No. 2020B1515020015), Science and Technology Planning of Guangdong Province, China (Grant No. 2020B1212060055) and the Youth Innovation Promotion Association CAS (Grant No. Y201863).

Institutional Review Board Statement

Not applicable.

Informed Consent Statement

Not applicable.

Data Availability Statement

The data presented in this study are available in this article and supplementary material.

Acknowledgments

This is contribution No.IS-2968 from GIGCAS. The authors wish to acknowledge the editors of MDPI and reviewers.

Conflicts of Interest

The authors declare no conflict of interest.

References

  1. Stefansson, A.; Gunnarsson, I.; Kaasalainen, H.; Arnorsson, S. Chromium geochemistry and speciation in natural waters, Iceland. Appl. Geochem. 2015, 62, 200–206. [Google Scholar] [CrossRef]
  2. Seidler, A.; Jahnichen, S.; Hegewald, J.; Fishta, A.; Krug, O.; Rüter, L.; Strik, C.; Hallier, E.; Straube, S. Systematic review and quantification of respiratory cancer risk for occupational exposure to hexavalent chromium. Int. Arch. Occup. Environ. Health 2013, 86, 943–955. [Google Scholar] [CrossRef]
  3. Saha, R.; Nandi, R.; Saha, B. Sources and toxicity of hexavalent chromium. J. Coord. Chem. 2011, 64, 1782–1806. [Google Scholar] [CrossRef]
  4. Zhitkovich, A. Chromium in Drinking Water: Sources, Metabolism, and Cancer Risks. Chem. Res. Toxicol. 2011, 24, 1617–1629. [Google Scholar] [CrossRef]
  5. Pedersen, H.D.; Postma, D.; Jakobsen, R.; Larsen, O. Fast transformation of iron oxyhydroxides by the catalytic action of aqueous Fe(II). Geochim. Cosmochim. Acta 2005, 69, 3967–3977. [Google Scholar] [CrossRef]
  6. Johnston, C.P.; Chrysochoou, M. Mechanisms of chromate adsorption on hematite. Geochim. Cosmochim. Acta 2014, 138, 146–157. [Google Scholar] [CrossRef]
  7. Fendorf, S.E. Surface-Reactions of Chromium in Soils and Waters. Geoderma 1995, 67, 55–71. [Google Scholar] [CrossRef]
  8. Rajput, S.; Pittman, C.U.; Mohan, D. Magnetic magnetite (Fe3O4) nanoparticle synthesis and applications for lead (Pb2+) and chromium (Cr6+) removal from water. J. Colloid Interface Sci. 2016, 468, 334–346. [Google Scholar] [CrossRef] [PubMed]
  9. Fendorf, S.; Wielinga, B.W.; Hansel, C.M. Chromium transformations in natural environments: The role of biological and abiological. processes in chromium(VI) reduction. Int. Geol. Rev. 2000, 42, 691–701. [Google Scholar] [CrossRef]
  10. Zhang, J.H.; Zhang, C.H.; Wei, G.L.; Li, Y.; Liang, X.L.; Chu, W.; He, H.; Huang, D.; Zhu, J.; Zhu, R. Reduction removal of hexavalent chromium by zinc-substituted magnetite coupled with aqueous Fe(II) at neutral pH value. J. Colloid Interface Sci. 2017, 500, 20–29. [Google Scholar] [CrossRef]
  11. White, A.F.; Peterson, M.L. Reduction of aqueous transition metal species on the surfaces of Fe(II)-containing oxides. Geochim. Cosmochim. Acta 1996, 60, 3799–3814. [Google Scholar] [CrossRef]
  12. Li, Y.; Wei, G.L.; Zhang, C.H.; Liang, X.L.; Chu, W.; He, H.; Stucki, J.W.; Ma, L.; Lin, X.; Zhu, J. Remarkable effect of Co substitution in magnetite on the reduction removal of Cr(VI) coupled with aqueous Fe(II): Improvement mechanism and Cr fate. Sci. Total Environ. 2019, 656, 400–408. [Google Scholar] [CrossRef] [PubMed]
  13. Costa, R.C.C.; Lelis, M.F.F.; Oliveira, L.C.A.; Fabris, J.D.; Ardisson, J.D.; Rios, R.R.V.A.; Silva, C.N.; Lago, R.M. Novel active heterogeneous Fenton system based on Fe3−xMxO4 (Fe, Co, Mn, Ni): The role of M2+ species on the reactivity towards H2O2 reactions. J. Hazard. Mater. 2006, 129, 171–178. [Google Scholar] [CrossRef] [PubMed]
  14. Meena, A.H.; Arai, Y. Effects of common groundwater ions on chromate removal by magnetite: Importance of chromate adsorption. Geochem. Trans. 2016, 17. [Google Scholar] [CrossRef] [PubMed] [Green Version]
  15. Namgung, S.; Guo, B.L.; Sasaki, K.; Lee, S.S.; Lee, G. Macroscopic and microscopic behaviors of Mn(II) (ad)sorption to goethite with the effects of dissolved carbonates under anoxic conditions. Geochim. Cosmochim. Acta 2020, 277, 300–319. [Google Scholar] [CrossRef]
  16. Rosso, K.M.; Morgan, J.J. Outer-sphere electron transfer kinetics of metal ion oxidation by molecular oxygen. Geochim. Cosmochim. Acta 2002, 66, 4223–4233. [Google Scholar] [CrossRef]
  17. Madden, A.S.; Hochella, M.F. A test of geochemical reactivity as a function of mineral size: Manganese oxidation promoted by hematite nanoparticles. Geochim. Cosmochim. Acta 2005, 69, 389–398. [Google Scholar] [CrossRef]
  18. Fendorf, S.; Eick, M.J.; Grossl, P.; Sparks, D.L. Arsenate and chromate retention mechanisms on goethite. 1. Surface structure. Environ. Sci. Technol. 1997, 31, 315–320. [Google Scholar] [CrossRef]
  19. Johnston, C.P.; Chrysochoou, M. Investigation of Chromate Coordination on Ferrihydrite by in Situ ATR-FTIR Spectroscopy and Theoretical Frequency Calculations. Environ. Sci. Technol. 2012, 46, 5851–5858. [Google Scholar] [CrossRef]
  20. Guo, H.; Chen, Y.; Hu, H.; Zhao, K.; Li, H.; Yan, S.; Xiu, W.; Coyte, R.M.; Vengosh, A. High Hexavalent Chromium Concentration in Groundwater from a Deep Aquifer in the Baiyangdian Basin of the North China Plain. Environ. Sci. Technol. 2020, 54, 10068–10077. [Google Scholar] [CrossRef]
  21. Lens, P.N.L.; Visser, A.; Janssen, A.J.H.; Pol, L.W.H.; Lettinga, G. Biotechnological treatment of sulfate-rich wastewaters. Crit. Rev. Environ. Sci. Technol. 1998, 28, 41–88. [Google Scholar] [CrossRef]
  22. Venditti, F.; Cuomo, F.; Ceglie, A.; Ambrosone, L.; Lopez, F. Effects of sulfate ions and slightly acidic pH conditions on Cr(VI) adsorption onto silica gelatin composite. J. Hazard. Mater. 2010, 173, 552–557. [Google Scholar] [CrossRef] [PubMed]
  23. Jung, Y.; Choi, J.; Lee, W. Spectroscopic investigation of magnetite surface for the reduction of hexavalent chromium. Chemosphere 2007, 68, 1968–1975. [Google Scholar] [CrossRef] [PubMed]
  24. Zachara, J.M.; Girvin, D.C.; Schmidt, R.L.; Resch, C.T. Chromate Adsorption on Amorphous Iron Oxyhydroxide in the Presence of Major Groundwater Ions. Environ. Sci. Technol. 1987, 21, 589–594. [Google Scholar] [CrossRef] [PubMed] [Green Version]
  25. Van Beinum, W.; Meeussen, J.C.L.; van Riemsdijk, W.H. Competitive sorption and diffusion of chromate and sulphate in a flow system with goethite in gel beads. J. Contam. Hydrol. 2006, 86, 262–278. [Google Scholar] [CrossRef] [PubMed]
  26. Johnston, C.P.; Chrysochoou, M. Mechanisms of chromate adsorption on boehmite. J. Hazard. Mater. 2015, 281, 56–63. [Google Scholar] [CrossRef] [PubMed]
  27. Pinakidou, F.; Katsikini, M.; Simeonidis, K.; Kaprara, E.; Paloura, E.C.; Mitrakas, M. On the passivation mechanism of Fe3O4 nanoparticles during Cr(VI) removal from water: A XAFS study. Appl. Surf. Sci. 2016, 360, 1080–1086. [Google Scholar] [CrossRef]
  28. Peak, D.; Ford, R.G.; Sparks, D.L. An in situ ATR-FTIR investigation of sulfate bonding mechanisms on goethite. J. Colloid Interface Sci. 1999, 218, 289–299. [Google Scholar] [CrossRef] [Green Version]
  29. Elzinga, E.J.; Sparks, D.L. Phosphate adsorption onto hematite: An in situ ATR-FTIR investigation of the effects of pH and loading level on the mode of phosphate surface complexation. J. Colloid Interface Sci. 2007, 308, 53–70. [Google Scholar] [CrossRef]
  30. Arai, Y.; Sparks, D.L. ATR–FTIR Spectroscopic Investigation on Phosphate Adsorption Mechanisms at the Ferrihydrite–Water Interface. J. Colloid Interface Sci. 2001, 241, 317–326. [Google Scholar] [CrossRef] [Green Version]
  31. Schmidt, M.P.; Martinez, C.E. Kinetic and Conformational Insights of Protein Adsorption onto Montmorillonite Revealed Using in Situ ATR-FTIR/2D-COS. Langmuir 2016, 32, 7719–7729. [Google Scholar] [CrossRef] [PubMed]
  32. Liu, J.; Zhu, R.; Liang, X.; Ma, L.; Lin, X.; Zhu, J.; He, H.; Parker, S.C.; Molinari, M. Synergistic adsorption of Cd(II) with sulfate/phosphate on ferrihydrite: An in situ ATR-FTIR/2D-COS study. Chem. Geol. 2018, 477, 12–21. [Google Scholar] [CrossRef] [Green Version]
  33. Liang, X.L.; Wei, G.L.; Xiong, J.; Tan, F.D.; He, H.P.; Qu, C.; Yin, H.; Zhu, J.; Qin, Z.; Zhang, J. Adsorption isotherm, mechanism, and geometry of Pb(II) on magnetites substituted with transition metals. Chem. Geol. 2017, 470, 132–140. [Google Scholar] [CrossRef]
  34. Hug, S.J. In SituFourier Transform Infrared Measurements of Sulfate Adsorption on Hematite in Aqueous Solutions. J. Colloid Interface Sci. 1997, 188, 415–422. [Google Scholar] [CrossRef]
  35. Ajouyed, O.; Hurel, C.; Ammari, M.; Allal, L.B.; Marmier, N. Sorption of Cr(VI) onto natural iron and aluminum (oxy)hydroxides: Effects of pH, ionic strength and initial concentration. J. Hazard. Mater. 2010, 174, 616–622. [Google Scholar] [CrossRef]
  36. Hoffmann, M.M.; Darab, J.G.; Fulton, J.L. An infrared and X-ray absorption study of the equilibria and structures of chromate, bichromate, and dichromate in ambient aqueous solutions. J. Phys. Chem. A 2001, 105, 1772–1782. [Google Scholar] [CrossRef]
  37. Noda, I. Two-dimensional infrared (2D IR) spectroscopy: Theory and applications. Appl. Spectrosc. 1990, 44, 550–561. [Google Scholar] [CrossRef]
  38. Kubicki, J.D.; Kabengi, N.; Chrysochoou, M.; Bompoti, N. Density functional theory modeling of chromate adsorption onto ferrihydrite nanoparticles. Geochem. Trans. 2018, 19. [Google Scholar] [CrossRef] [Green Version]
  39. Huang, X.P.; Hou, X.J.; Song, F.H.; Zhao, J.C.; Zhang, L.Z. Facet-Dependent Cr(VI) Adsorption of Hematite Nanocrystals. Environ. Sci. Technol. 2016, 50, 1964–1972. [Google Scholar] [CrossRef]
  40. Kabengi, N.J.; Chrysochoou, M.; Bompoti, N.; di Kubicki, J. An integrated flow microcalorimetry, infrared spectroscopy and density functional theory approach to the study of chromate complexation on hematite and ferrihdyrite. Chem. Geol. 2017, 464, 23–33. [Google Scholar] [CrossRef]
  41. Ramsey, J.D.; Xia, L.; Kendig, M.W.; McCreery, L. Raman spectroscopic analysis of the speciation of dilute chromate solutions. Corros. Sci. 2001, 43, 1557–1572. [Google Scholar] [CrossRef]
  42. Grossl, P.R.; Eick, M.; Sparks, D.L.; Goldberg, S.; Ainsworth, C.C. Arsenate and chromate retention mechanisms on goethite. 2. Kinetic evaluation using a pressure-jump relaxation technique. Environ. Sci. Technol. 1997, 31, 321–326. [Google Scholar] [CrossRef]
  43. Johnston, C.P.; Chrysochoou, M. Mechanisms of Chromate, Selenate, and Sulfate Adsorption on Al-Substituted Ferrihydrite: Implications for Ferrihydrite Surface Structure and Reactivity. Environ. Sci. Technol. 2016, 50, 3589–3596. [Google Scholar] [CrossRef] [PubMed]
  44. Noda, I. Frontiers of Two-Dimensional Correlation Spectroscopy. Part 1. New concepts and noteworthy developments. J. Mol. Struct. 2014, 1069, 3–22. [Google Scholar] [CrossRef]
  45. Muller, K.; Lefevre, G. Vibrational Characteristics of Outer-Sphere Surface Complexes: Example of Sulfate Ions Adsorbed onto Metal (Hydr)oxides. Langmuir 2011, 27, 6830–6835. [Google Scholar] [CrossRef]
  46. Zhu, M.Q.; Northrup, P.; Shi, C.Y.; Billinge, S.J.L.; Sparks, D.L.; Waychunas, G.A. Structure of Sulfate Adsorption Complexes on Ferrihydrite. Environ. Sci. Technol. Lett. 2014, 1, 97–101. [Google Scholar] [CrossRef]
  47. Fukushi, K.; Aoyama, K.; Yang, C.; Kitadai, N.; Nakashima, S. Surface complexation modeling for sulfate adsorption on ferrihydrite consistent with in situ infrared spectroscopic observations. Appl. Geochem. 2013, 36, 92–103. [Google Scholar] [CrossRef]
  48. Gu, C.H.; Wang, Z.M.; Kubicki, J.D.; Wang, X.M.; Zhu, M.Q. X-ray Absorption Spectroscopic Quantification and Speciation Modeling of Sulfate Adsorption on Ferrihydrite Surfaces. Environ. Sci. Technol. 2016, 50, 8067–8076. [Google Scholar] [CrossRef]
  49. Wang, X.M.; Wang, Z.M.; Peak, D.; Tang, Y.D.; Feng, X.H.; Zhu, M. Quantification of Coexisting Inner- and Outer-Sphere Complexation of Sulfate on Hematite Surfaces. ACS Earth Space Chem. 2018, 2, 387–398. [Google Scholar] [CrossRef]
  50. Zhang, G.Y.; Peak, D. Studies of Cd(II)–sulfate interactions at the goethite–water interface by ATR-FTIR spectroscopy. Geochim. Cosmochim. Acta 2007, 71, 2158–2169. [Google Scholar] [CrossRef]
  51. Xie, J.Y.; Gu, X.Y.; Tong, F.; Zhao, Y.P.; Tan, Y.Y. Surface complexation modeling of Cr(VI) adsorption at the goethite-water interface. J. Colloid Interface Sci. 2015, 455, 55–62. [Google Scholar] [CrossRef] [PubMed]
  52. Sverjensky, D.A.; Fukushi, K. A predictive model (ETLM) for As(III) adsorption and surface speciation on oxides consistent with spectroscopic data. Geochim. Cosmochim. Acta 2006, 70, 3778–3802. [Google Scholar] [CrossRef]
  53. Weerasooriya, R.; Tobschall, H.J. Mechanistic modeling of chromate adsorption onto goethite. Colloids Surf. A Physicochem. Eng. Asp. 2000, 162, 167–175. [Google Scholar] [CrossRef]
  54. Hiemstra, T.; van Riemsdijk, W.H. Effect of different crystal faces on experimental interaction force and aggregation of hematite. Langmuir 1999, 15, 8045–8051. [Google Scholar] [CrossRef]
  55. Wu, C.H.; Lo, S.L.; Lin, C.F. Competitive adsorption of molybdate, chromate, sulfate, selenate, and selenite on gamma-Al2O3. Colloids Surf. A Physicochem. Eng. Asp. 2000, 166, 251–259. [Google Scholar] [CrossRef]
  56. Paul, K.W.; Kubicki, J.D.; Sparks, D.L. Quantum chemical calculations of sulfate adsorption at the Al- and Fe-(Hydr)oxide-H2O interface-estimation of Gibbs free energies. Environ. Sci. Technol. 2006, 40, 7717–7724. [Google Scholar] [CrossRef]
  57. Hilbrandt, I.; Ruhl, A.S.; Zietzschmann, F.; Molkenthin, M.; Jekel, M. Competition in chromate adsorption onto micro-sized granular ferric hydroxide. Chemosphere 2019, 218, 749–757. [Google Scholar] [CrossRef]
Figure 1. Spectra of the adsorbed chromate (a) and sulfate (b) on the Ni-substituted magnetite surface from pH 4 to pH 9 (concentrations of chromate and sulfate: 100 μmol·L–1).
Minerals 11 00088 g001
Figure 2. Two-dimensional synchronous (a and c) and asynchronous (b and d) spectra of chromate adsorbed on Ni-substituted magnetite at pH 4 and pH 7.
Minerals 11 00088 g002
Figure 3. Infrared spectral fitting of the adsorbed chromate (a) and sulfate (b). Chromate with monodentate (green line) and bidentate (pink line) species from pH 4 to pH 9. Sulfate with outer-sphere (green line) and monodentate (pink line) species from pH 4 to pH 8.
Minerals 11 00088 g003
Figure 4. Integrated absorbance (IA) of the adsorbed chromate (a) and sulfate (b) species plotted vs. pH and the relative percentage of different adsorption species (inset figure).
Minerals 11 00088 g004
Figure 5. Two-dimensional synchronous (a,c) and asynchronous (b,d) spectra of sulfate adsorbed on Ni-substituted magnetite at pH 4 and pH 7.
Minerals 11 00088 g005
Figure 6. Infrared spectra of the substitution of pre-adsorbed sulfate (100 μmol·L–1) by chromate (100 μmol·L–1) at pH 4 (a) and pH 7 (b). After the pre-adsorption of sulfate for 150 min, chromate was added, and the spectra were recorded for another 150 min.
Minerals 11 00088 g006
Figure 7. Infrared spectra of the substitution of pre-adsorbed chromate by sulfate at pH 4 and pH 7 (a). At pH 4, after the pre-adsorption of chromate (100 μmol·L–1) for 120 min, sulfate (100 μmol·L–1) was added, with the spectra recorded for another 90 min. (b) At pH 7, after the pre-adsorption of chromate for 70 min, sulfate (100 μmol·L–1) was added, with the spectra recorded for another 30 min. Then, a high-concentration sulfate solution (200 μmol·L–1) was added, with the spectra monitored for another 30 min.
Minerals 11 00088 g007
Figure 8. Infrared spectra of the simultaneous adsorption of sulfate (100 μmol·L–1) and chromate (100 μmol·L–1) onto magnetite at pH 4 (a) and pH 7 (b).
Minerals 11 00088 g008
Table 1. IR vibrations of aqueous and coordinated chromate on the surface of various oxides.
MineralSpeciesCr–O Stretching Vibration (cm–1)pHReference
AqueousCrO42–880 [41]
HCrO4 898950
Cr2O4772 882950
HematiteMonodentate 830873910 >7[6,39]
803834952
Bidentate765825885930960<7
760823911932971
FerrihydriteMonodentate 820873910 <6.5[19]
Bidentate750830885930950>6.5
Ni-Substituted MagnetiteMonodentate760830870910 This study
Bidentate796820890930950
Table 2. IR vibrations of aqueous and coordinated sulfate on the surface of various oxides.
MineralSpeciesS–O Stretching Vibration/cm–1pHReference
AqueousSO42–1100 [45]
HematiteMonodentate97610601128 3–5[34,49]
Bidentate9711048112711833–7
GoethiteOuter-sphere1104>6[28]
Bidentate9921055113311703–5
FerrihydriteOuter-sphere11006[32,43,47,50]
Monodentate98010501110 3–5
Bidentate9801050112011703–5
Ni-Substituted MagnetiteOuter-sphere11057–8This study
Monodentate97610581130 4–6
Publisher’s Note: MDPI stays neutral with regard to jurisdictional claims in published maps and institutional affiliations.

