Article

Provenance and Sedimentary Context of Clay Mineralogy in an Evolving Forearc Basin, Upper Cretaceous-Paleogene and Eocene Mudstones, San Joaquin Valley, California

1
School of Geosciences, University of Aberdeen, King’s Collage, Aberdeen AB24 3UE, UK
2
Istituto di Metodologie per l’Analisi Ambientale IMAA-CNR, 85050 Tito Scalo, Italy
*
Author to whom correspondence should be addressed.
Minerals 2021, 11(1), 71; https://doi.org/10.3390/min11010071
Submission received: 4 November 2020 / Revised: 29 December 2020 / Accepted: 6 January 2021 / Published: 13 January 2021
(This article belongs to the Special Issue Clays, Clay Minerals and Geology)

Abstract

:
Mudstone samples from the Moreno (Upper Cretaceous-Paleocene) and Kreyenhagen (Eocene) formations are analysed using X-ray diffraction (XRD) and X-ray fluorescence (XRF) to determine their mineralogy. Smectite (Reichweite R0) is the predominant phyllosilicate present, 48% to 71.7% bulk rock mineralogy (excluding carbonate cemented and highly bio siliceous samples) and 70% to 98% of the <2 μm clay fraction. Opal CT and less so cristobalite concentrations cause the main deviations from smectite dominance. Opal A is common only in the Upper Kreyenhagen. In the <2 μm fraction, the Moreno Fm is significantly more smectite-rich than the Kreyenhagen Fm. Smectite in the Moreno Fm was derived from the alteration of volcaniclastic debris from contemporaneous rhyolitic-dacitic magmatic arc volcanism. No tuff is preserved. Smectite in the Kreyenhagen Fm was derived from intense sub-tropical weathering of granitoid-dioritic terrane during the hypothermal period in the early to mid-Eocene; the derivation from local volcanism is unlikely. All samples had chemical indices of alteration (CIA) indicative of intense weathering of source terrane. Ferriferous enrichment and the occurrence of locally common kaolinite are contributory evidence for the intensity of weathering. Low concentration (max. 7.5%) of clinoptilolite in the Lower Kreyenhagen is possibly indicative of more open marine conditions than in the Upper Kreyenhagen. There is no evidence of volumetrically significant silicate diagenesis. The main diagenetic mineralisation is restricted to low-temperature silica phase transitions.

1. Introduction

Recently, the Moreno and Kreyenhagen Fms became a focus of global geological interest because they host the two largest and best-exposed outcrops of giant sand injection complexes, the Panoche Giant Injection Complex (PGIC) and the Tumey Giant Injection Complex (TGIC), ~400 km2 and >200 km2, respectively [1,2,3,4] (Figure 1). As part of understanding the background geological setting of the mudstone-dominated host strata for the PGIC and TGIC, samples were collected and analysed from formal lithostratigraphic units in the Moreno Fm and informal units (Upper and Lower) in the Kreyenhagen Fm. Given the widespread occurrence and large outcrops of the Moreno and Kreyenhagen formations (henceforth Moreno Fm and Kreyenhagen Fm) in the San Joaquin Valley and their significance to petroleum systems, the paucity of mineralogical data in the public domain is surprising. According to Jay [5], the Kreyenhagen is “virtually unmentioned in the resource shale literature” despite producing significant volumes of hydrocarbons continuously since 1956.
The smectitic dominance of the phyllosilicate fraction in the Kreyenhagen Fm is known to the southeast of our study area, where 51 mudstone samples from boreholes were investigated [6], and a single outcrop sample was investigated in later studies [7,8], approximately 220 km and 55 km from our study area, respectively. Excellent outcrop [2,3] allows continuous sampling through the stratigraphy of both formations and enables the geological evolution of the San Joaquin Basin to be evaluated from the perspective of the fine-grained sedimentary record. Specific attention is given to the origin of smectite in the context of volcanic activity and quiescence in the evolving Sierra Nevadan magmatic arc. In the present study, a broader evaluation of the lithostratigraphy and mineralogy of the San Joaquin Basin was performed. The provenance, weathering, and composition of source terrane were studied by X-ray diffraction (XRD) and X-ray fluorescence (XRF). This approach is a useful tool for the investigation of fine-grained sedimentary rock [9,10].

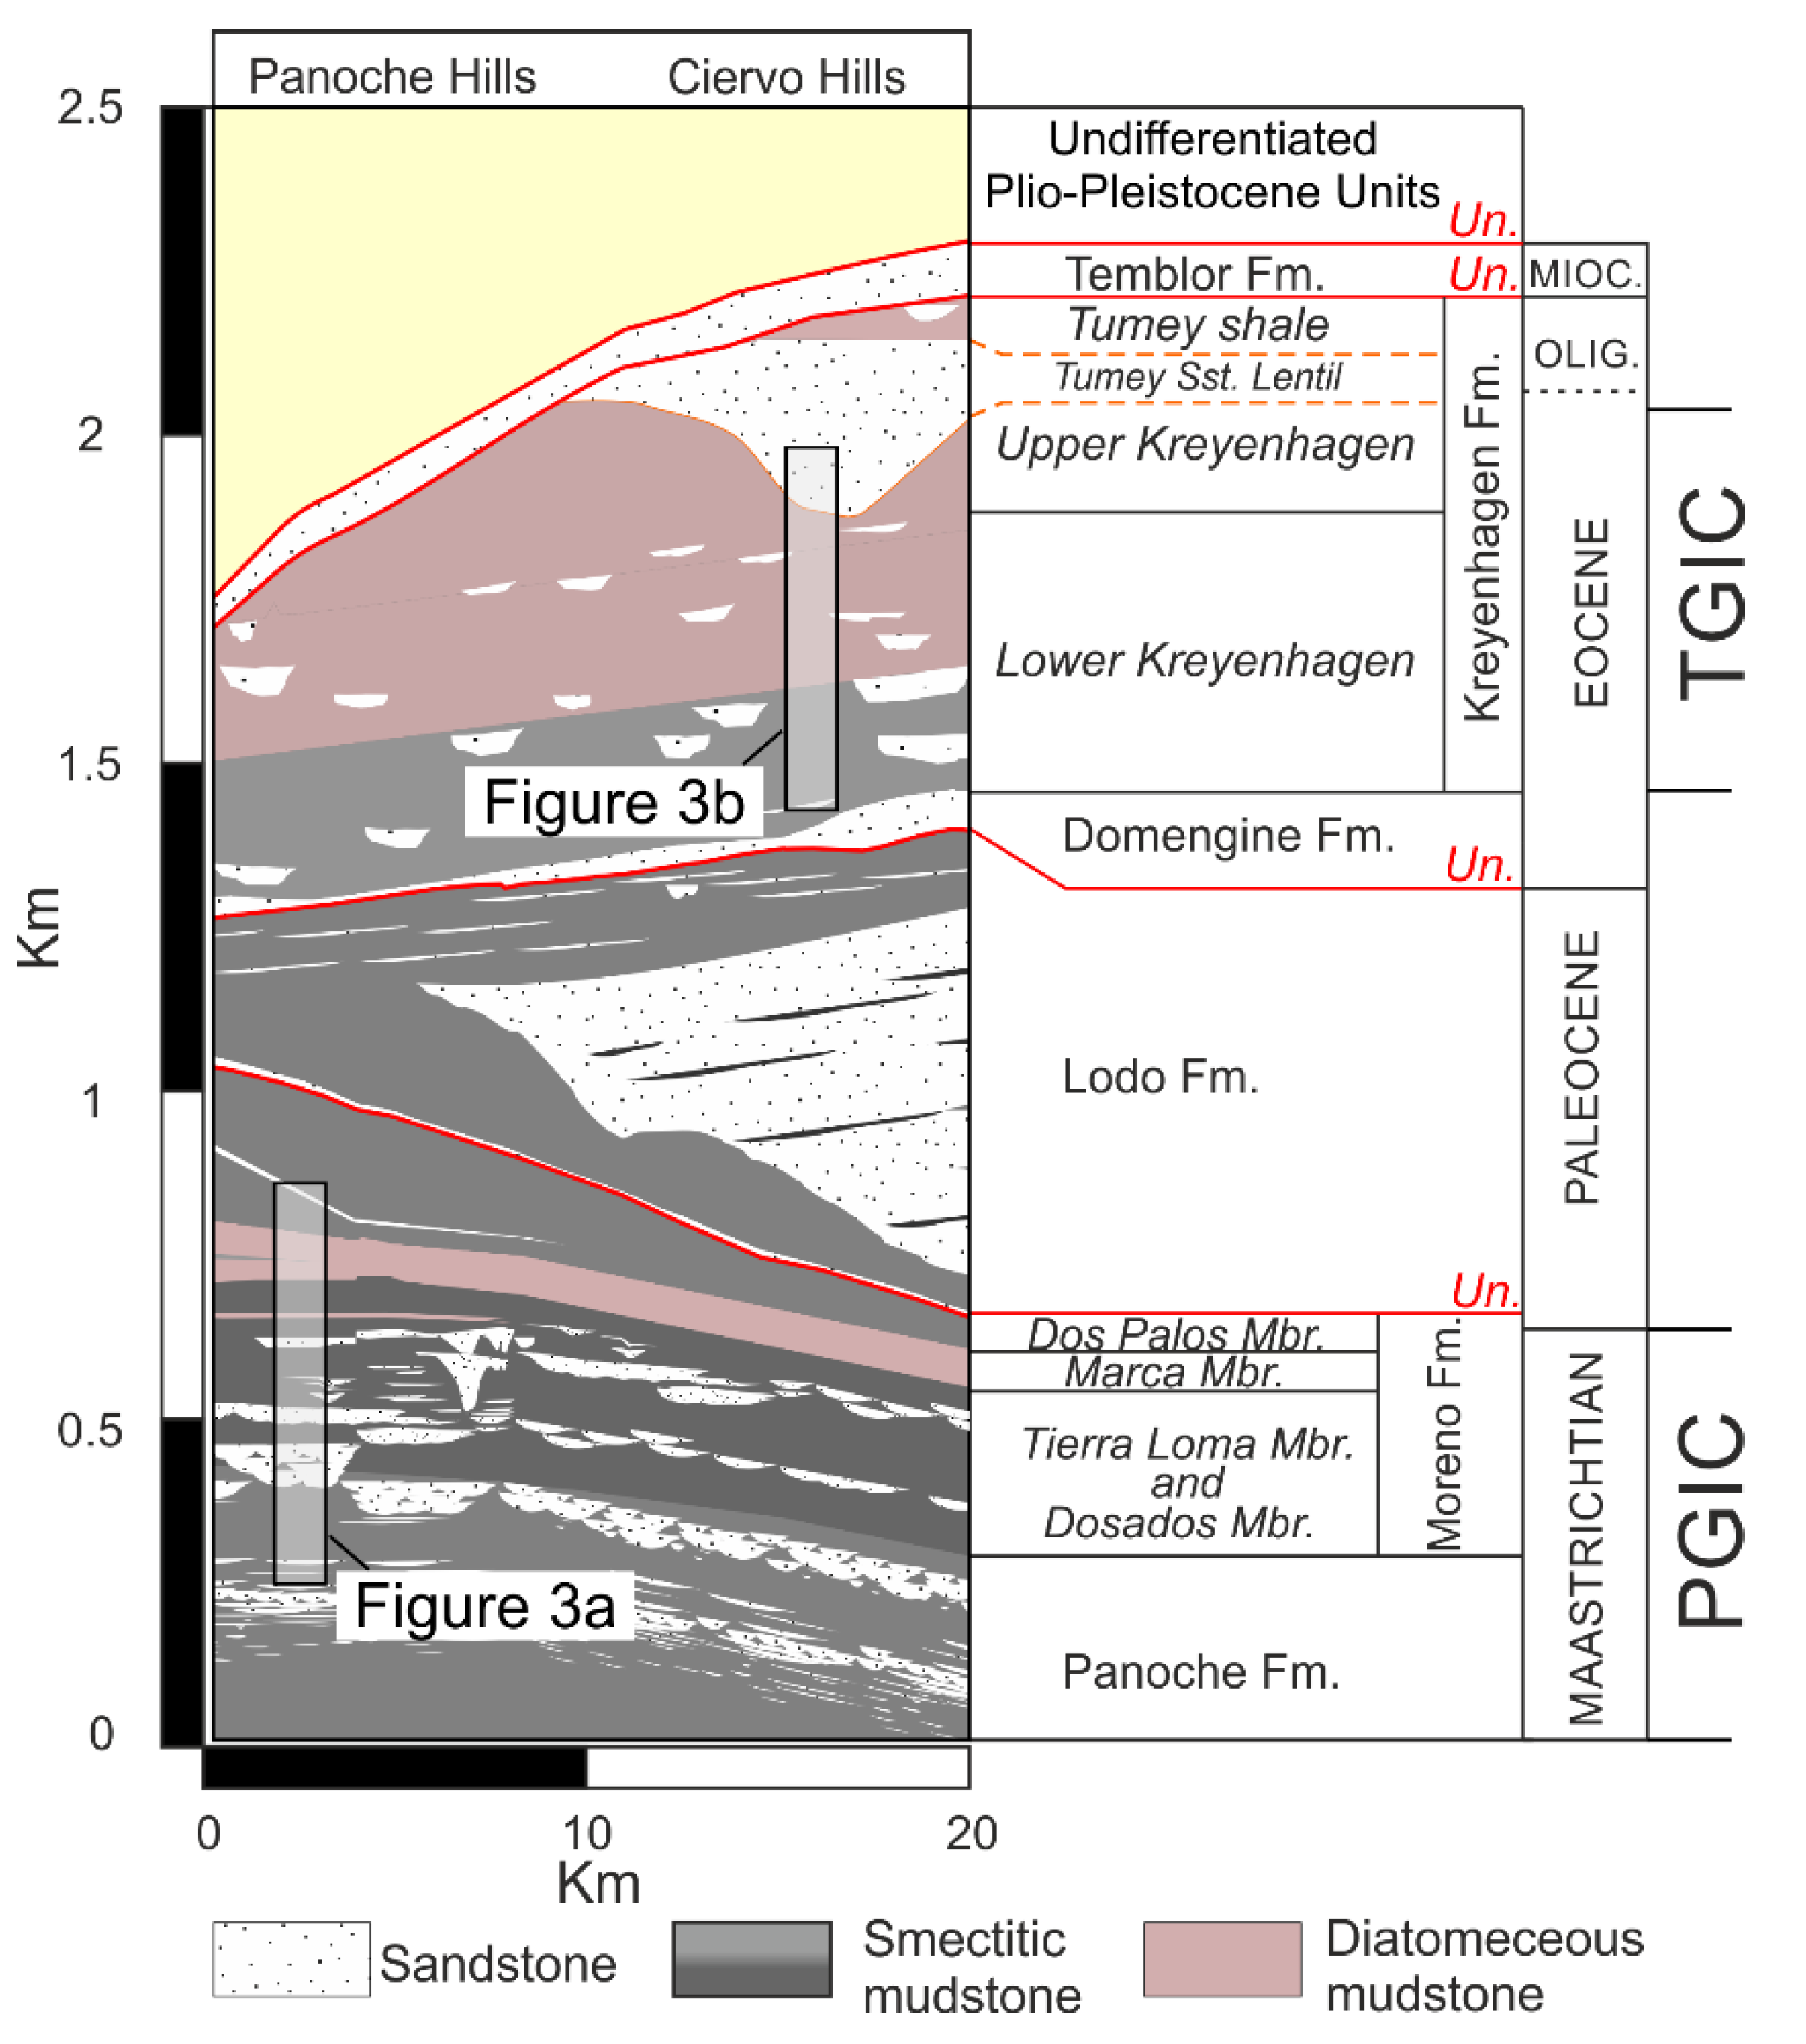
2. Geological Background

During the Upper Cretaceous, large sediment loads were deposited in the San Joaquin Basin, resulting from the rapid erosion of the Sierra Nevada arc. The basin gradually extended due to migration of magmatic activity to the east combined with the formation of the trench to the west [11]. Most of the Moreno Fm examined in this study comprises predominantly fine-grained Maastrichtian slope deposits (Figure 2), but the uppermost unit, the Dos Palos Mbr, deposited in shallower water on the upper slope. In the outcrop area, a regional unconformity truncates the top of the Moreno Fm (Figure 2). In the Eocene, rapid deformation of the basin occurred, and periods of uplift and subsidence ensued. The latter caused a regional marine transgression, associated with folding and thrusting at the basin margins. In the area of the TGIC outcrop, a regionally developed unconformity eroded deeply (in some cases >50 m) into the TGIC locally reworking shallow parts of the injection complex (Figure 2). The Eocene–Oligocene boundary is not preserved. Further tectonic movements occurred in the Oligocene, creating normal and thrust faulting and anticlinal folding at the basin peripheries [12]. In the San Joaquin Basin, the Kreyenhagen Fm records approximately 16 million years of slope and basin sedimentation from Middle Eocene to Early Oligocene, an extension of the Sierra Nevada forearc that was created during the subduction of the Pacific plate beneath the North American plate. The formation is predominantly mudstone (also known as the Kreyenhagen Shale), up to 3000 m thick, which is present at outcrop and in boreholes but includes turbiditic and transgressive shallow marine sandstone. Much of the mudstone is bio siliceous and, in some areas are important hydrocarbon source rocks [7,8]. It contains sequences where opal CT is common.

3. Materials and Methods
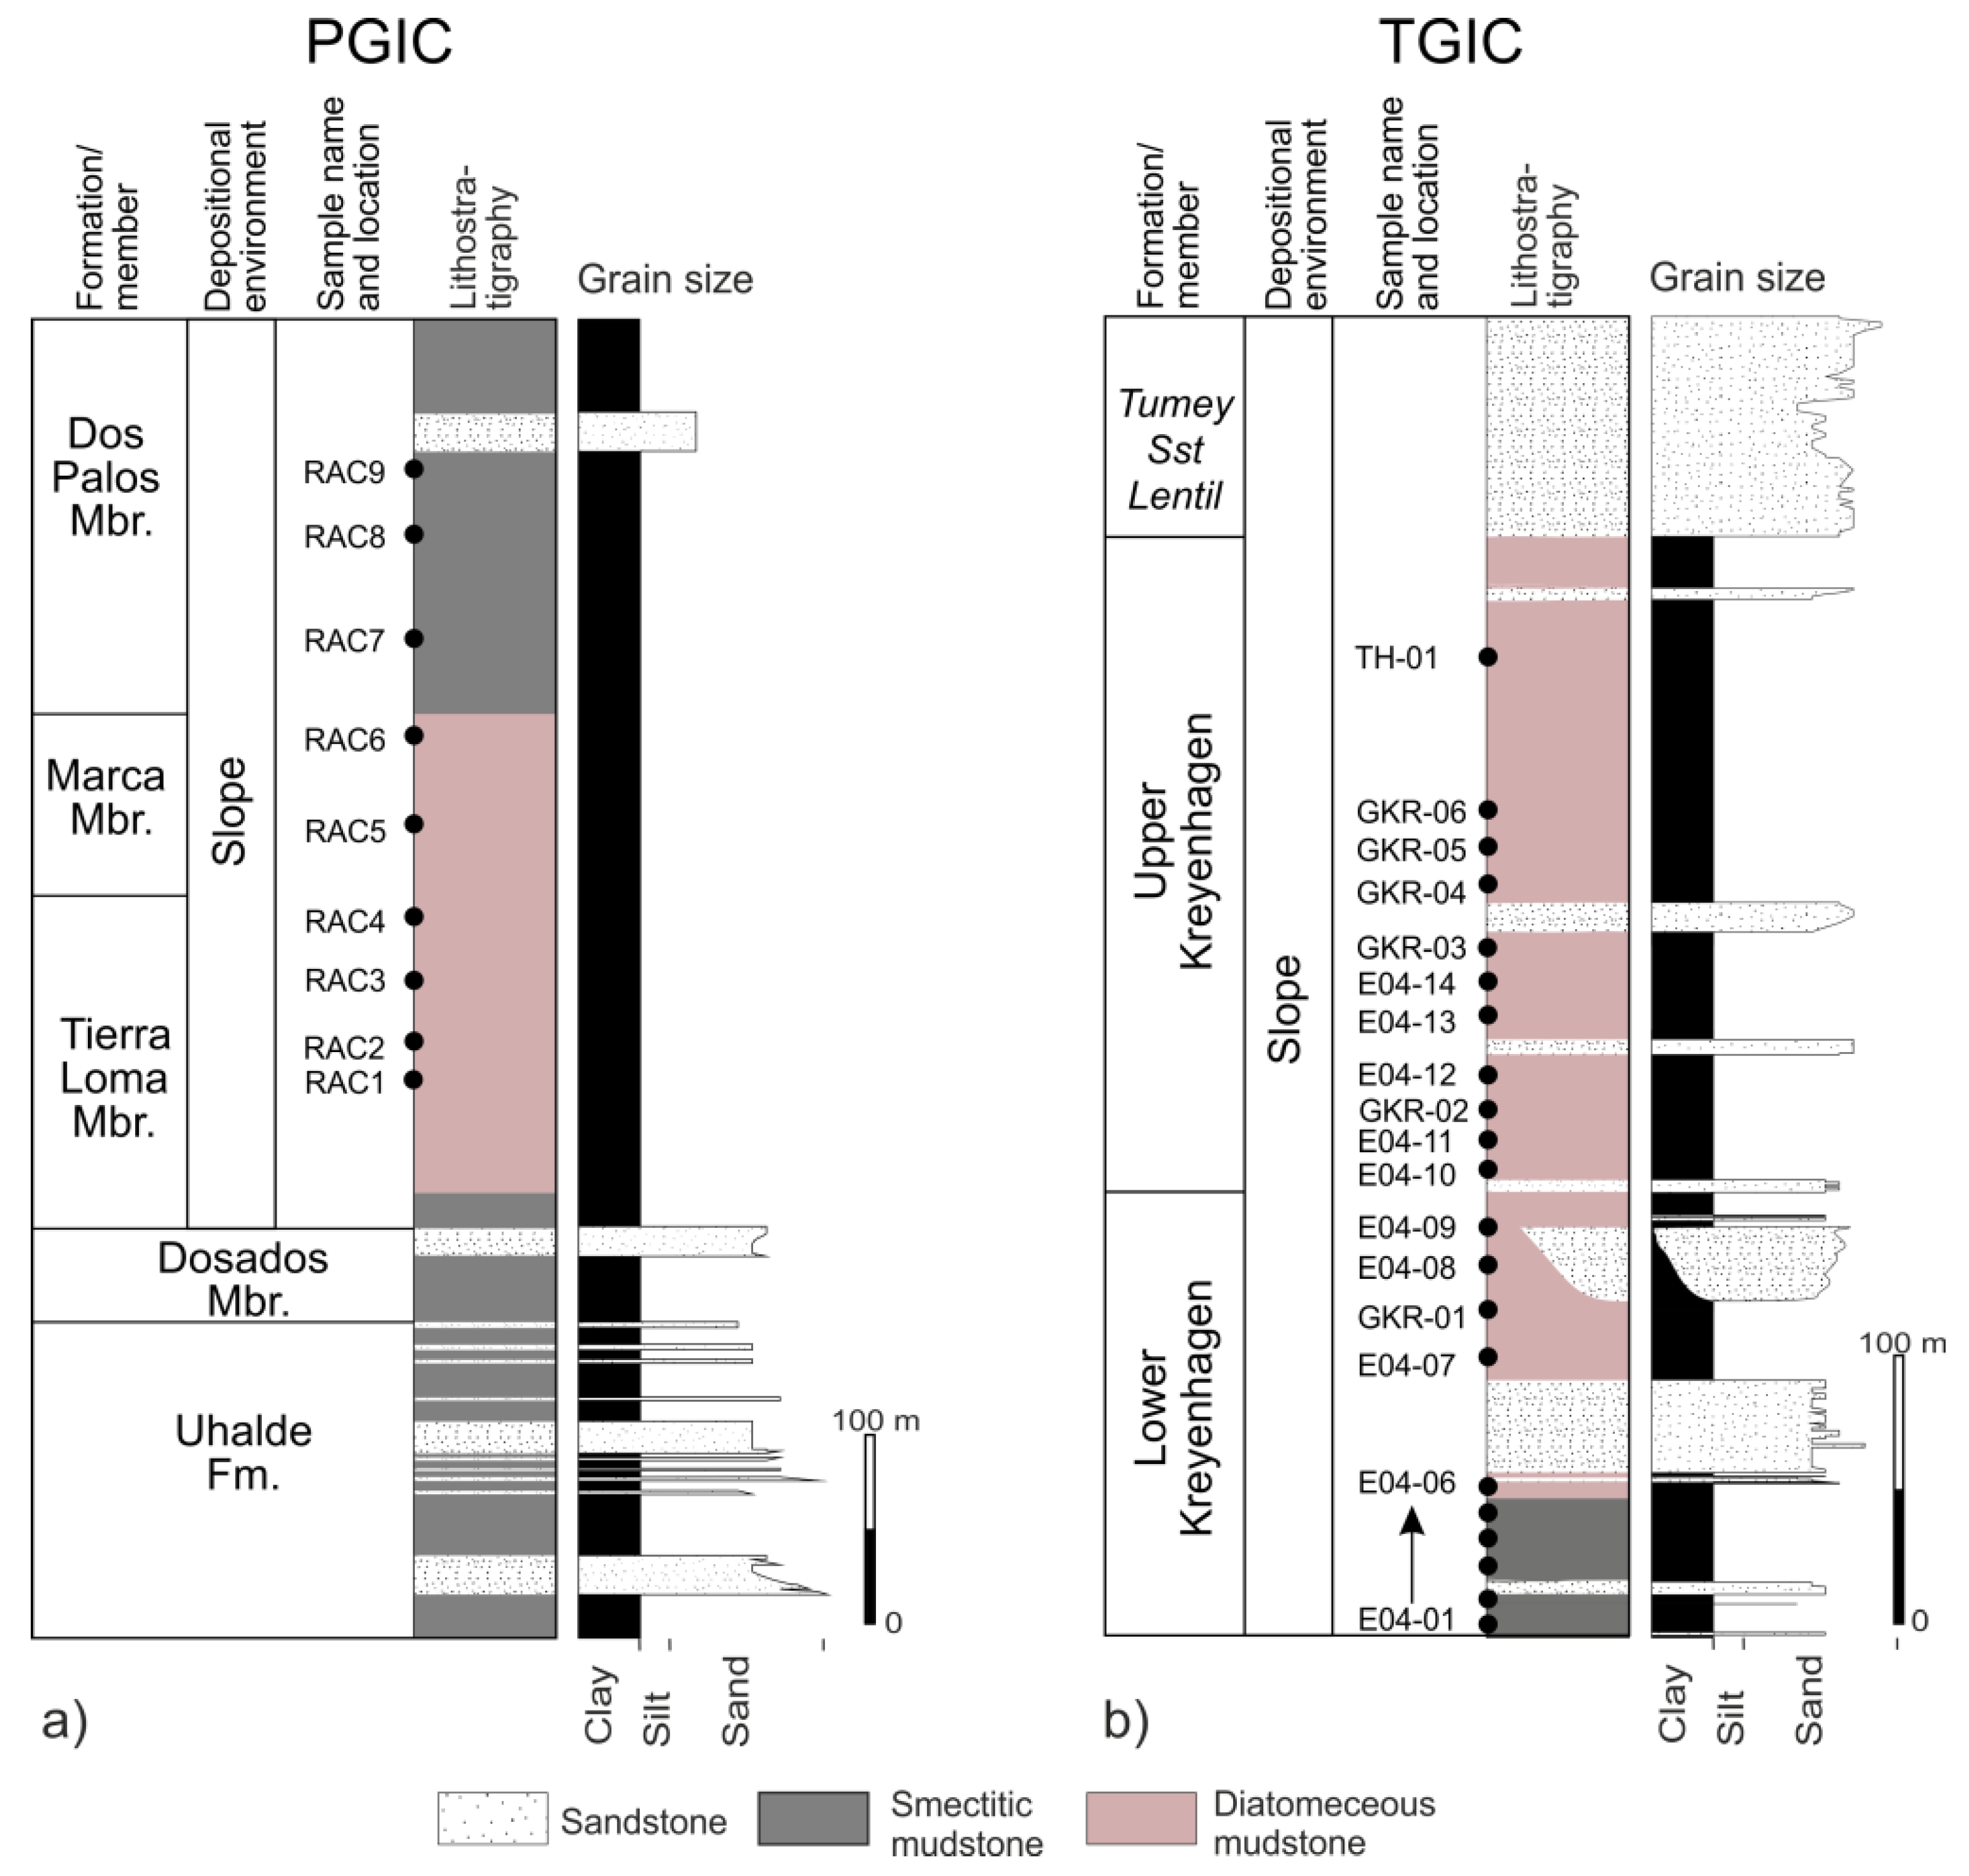
3.1. Materials

Mudstone samples were collected from transects through the outcrop of the Upper Cretaceous to Lower Paleocene Moreno Formation (1) and the Eocene of the Kreyenhagen Formation (3) (Figure 3). Moreno Fm samples were exclusively from the Right-Angle Canyon locality (RAC, Figure 3a), the geology of which was most recently described in Grippa et al. [13]. Regional thickness variations preserved in the Moreno Fm range from 430 m to >830 m with approximately 550 m present in RAC. Lamination in mudstone is locally preserved throughout the Moreno Fm., becoming less pervasive upward. Dense hydraulic fractures are present in parts of the Tierra Loma Mbr [2] often adjacent to large sandstone intrusions. Mudstone samples from the Kreyenhagen Fm are either dark brown (Lower Kreyenhagen) or pale pink/grey (Upper Kreyenhagen) (Figure 3b). Faint lamination is preserved in the Lower Kreyenhagen but is sparse in the Upper Kreyenhagen. Extensive areas of dense, intensive hydraulic fractures are present in the Upper Kreyenhagen. The Upper Kreyenhagen is lithified and generally of low density, from which a high content of opaline silica is inferred.

3.2. Methods

All samples were analysed using X-ray fluorescence (XRF) and X-ray diffraction (XRD) to determine chemical and mineralogical compositions of whole-rock samples (XRF and XRD) and clay fractions (XRD). Chemical analyses were carried out for major elements according to the procedure of Franzini et al. [14]. The sample preparation technique and the fusion procedure were those of Claisse [15]. A mixture containing 0.210 g of sample and 7.000 g of flux (50% Lithium tetraborate, Li2B4O7, and 50% Lithium metaborate, LiBO2), corresponding to a 1:30 sample/borate dilution, was carefully homogenized in a 95Pt/5Au crucible using Claisse Fluxer-Bis!® automatic apparatus (Malvern Panalytical, Malvern, UK). Ammonium iodide anhydrous powder was added as a non-wetting agent. The mixture was fused at 1000 °C for 20 min while continuously stirring the melt. When the sample was completely dissolved and any reaction ceased, the melt was poured into 95Pt/5Au/2Rh plate and cooled slowly. After cooling the melt formed a glass disc (ø = 32 mm), which was directly analysed by ARL 9400 XP+ sequential X-ray spectrometer (Thermo Fisher Scientific, Waltham, MA, USA) [16].
For the whole-rock XRD investigation, samples were gently crushed and then ground using a vibratory agate disc mill comminuting by friction. The particle size obtained was <5 µm. To separate the clay fraction (<2 µm), the whole sample was gently crushed (not ground) in an agate mortar, disaggregated in distilled water overnight, and then separated by settling in distilled water according to Stoke’s law. Clay suspensions for quantitative analysis were saturated with Mg2+ cations using 1 N MgCl2 solution. Oriented mounts were prepared by settling clay suspensions (concentration of 5 mg/cm2 [17]) on glass slides. Each specimen was analysed in an air-dried state, glycolated at 60 °C for 8 h and heated at 375 °C for 1 h [18].
XRD analyses were performed on whole-rock samples and clay fractions using a Rigaku Rint Miniflex powder diffractometer (Rigaku, Tokyo, Japan) with Cu-Kα radiation, sample spinner, and Cu anode at a voltage of 30 kV and a current of 15 mA. Mineralogical analyses of bulk samples were carried out on random mounts using side loading of bulk specimens, to guarantee a satisfactory reproducible density and random orientation [19]. Data were collected in a 2–70° range of 2θ with 0.02° step and a speed of 5 s/step. Data from the clay fraction were collected in the 2–33° range of 2θ with a step of 0.02° and a speed of 5 s/step. The content of clay minerals in <2 µm fractions was estimated by the peak areas on both glycolated and heated oriented mounts [20]. To distinguish between smectite and illite/smectite mixed-layer clay, the XRD patterns of glycolated clays were used as proposed by Moore and Reynolds [18]. The XRD patterns were processed using the WINFIT computer program [21].
The mineralogical composition was determined in two steps: (i) by XRD analysis using a Reference Intensity Ratio (RIR) method with quartz as an internal standard [20] and (ii) by combining XRD and XRF data using the vbAffina program (Microsoft Visual Basic 6.0) [22,23]. The VbAffina program requires as input data the major element composition of the bulk sample (SiO2, Al2O3, Fe2O3, MgO, CaO, Na2O, K2O, and LOI) and XRDP mineralogical data. All these data were processed using a least-squares procedure that minimizes the differences between chemical compositions calculated from the XRD-determined phase percentages that are introduced into vbAffina (i.e., XRDP results) and those determined using XRF. Stoichiometric compositions of quartz, calcite, dolomite, Na-plagioclase (albite), orthoclase, clinoptilolite, gypsum, opal, cristobalite, and kaolinite were used with the vbAffina program. Illite and smectite compositions were selected from a vbAffina database that contained the compositions of these minerals.

4. Results

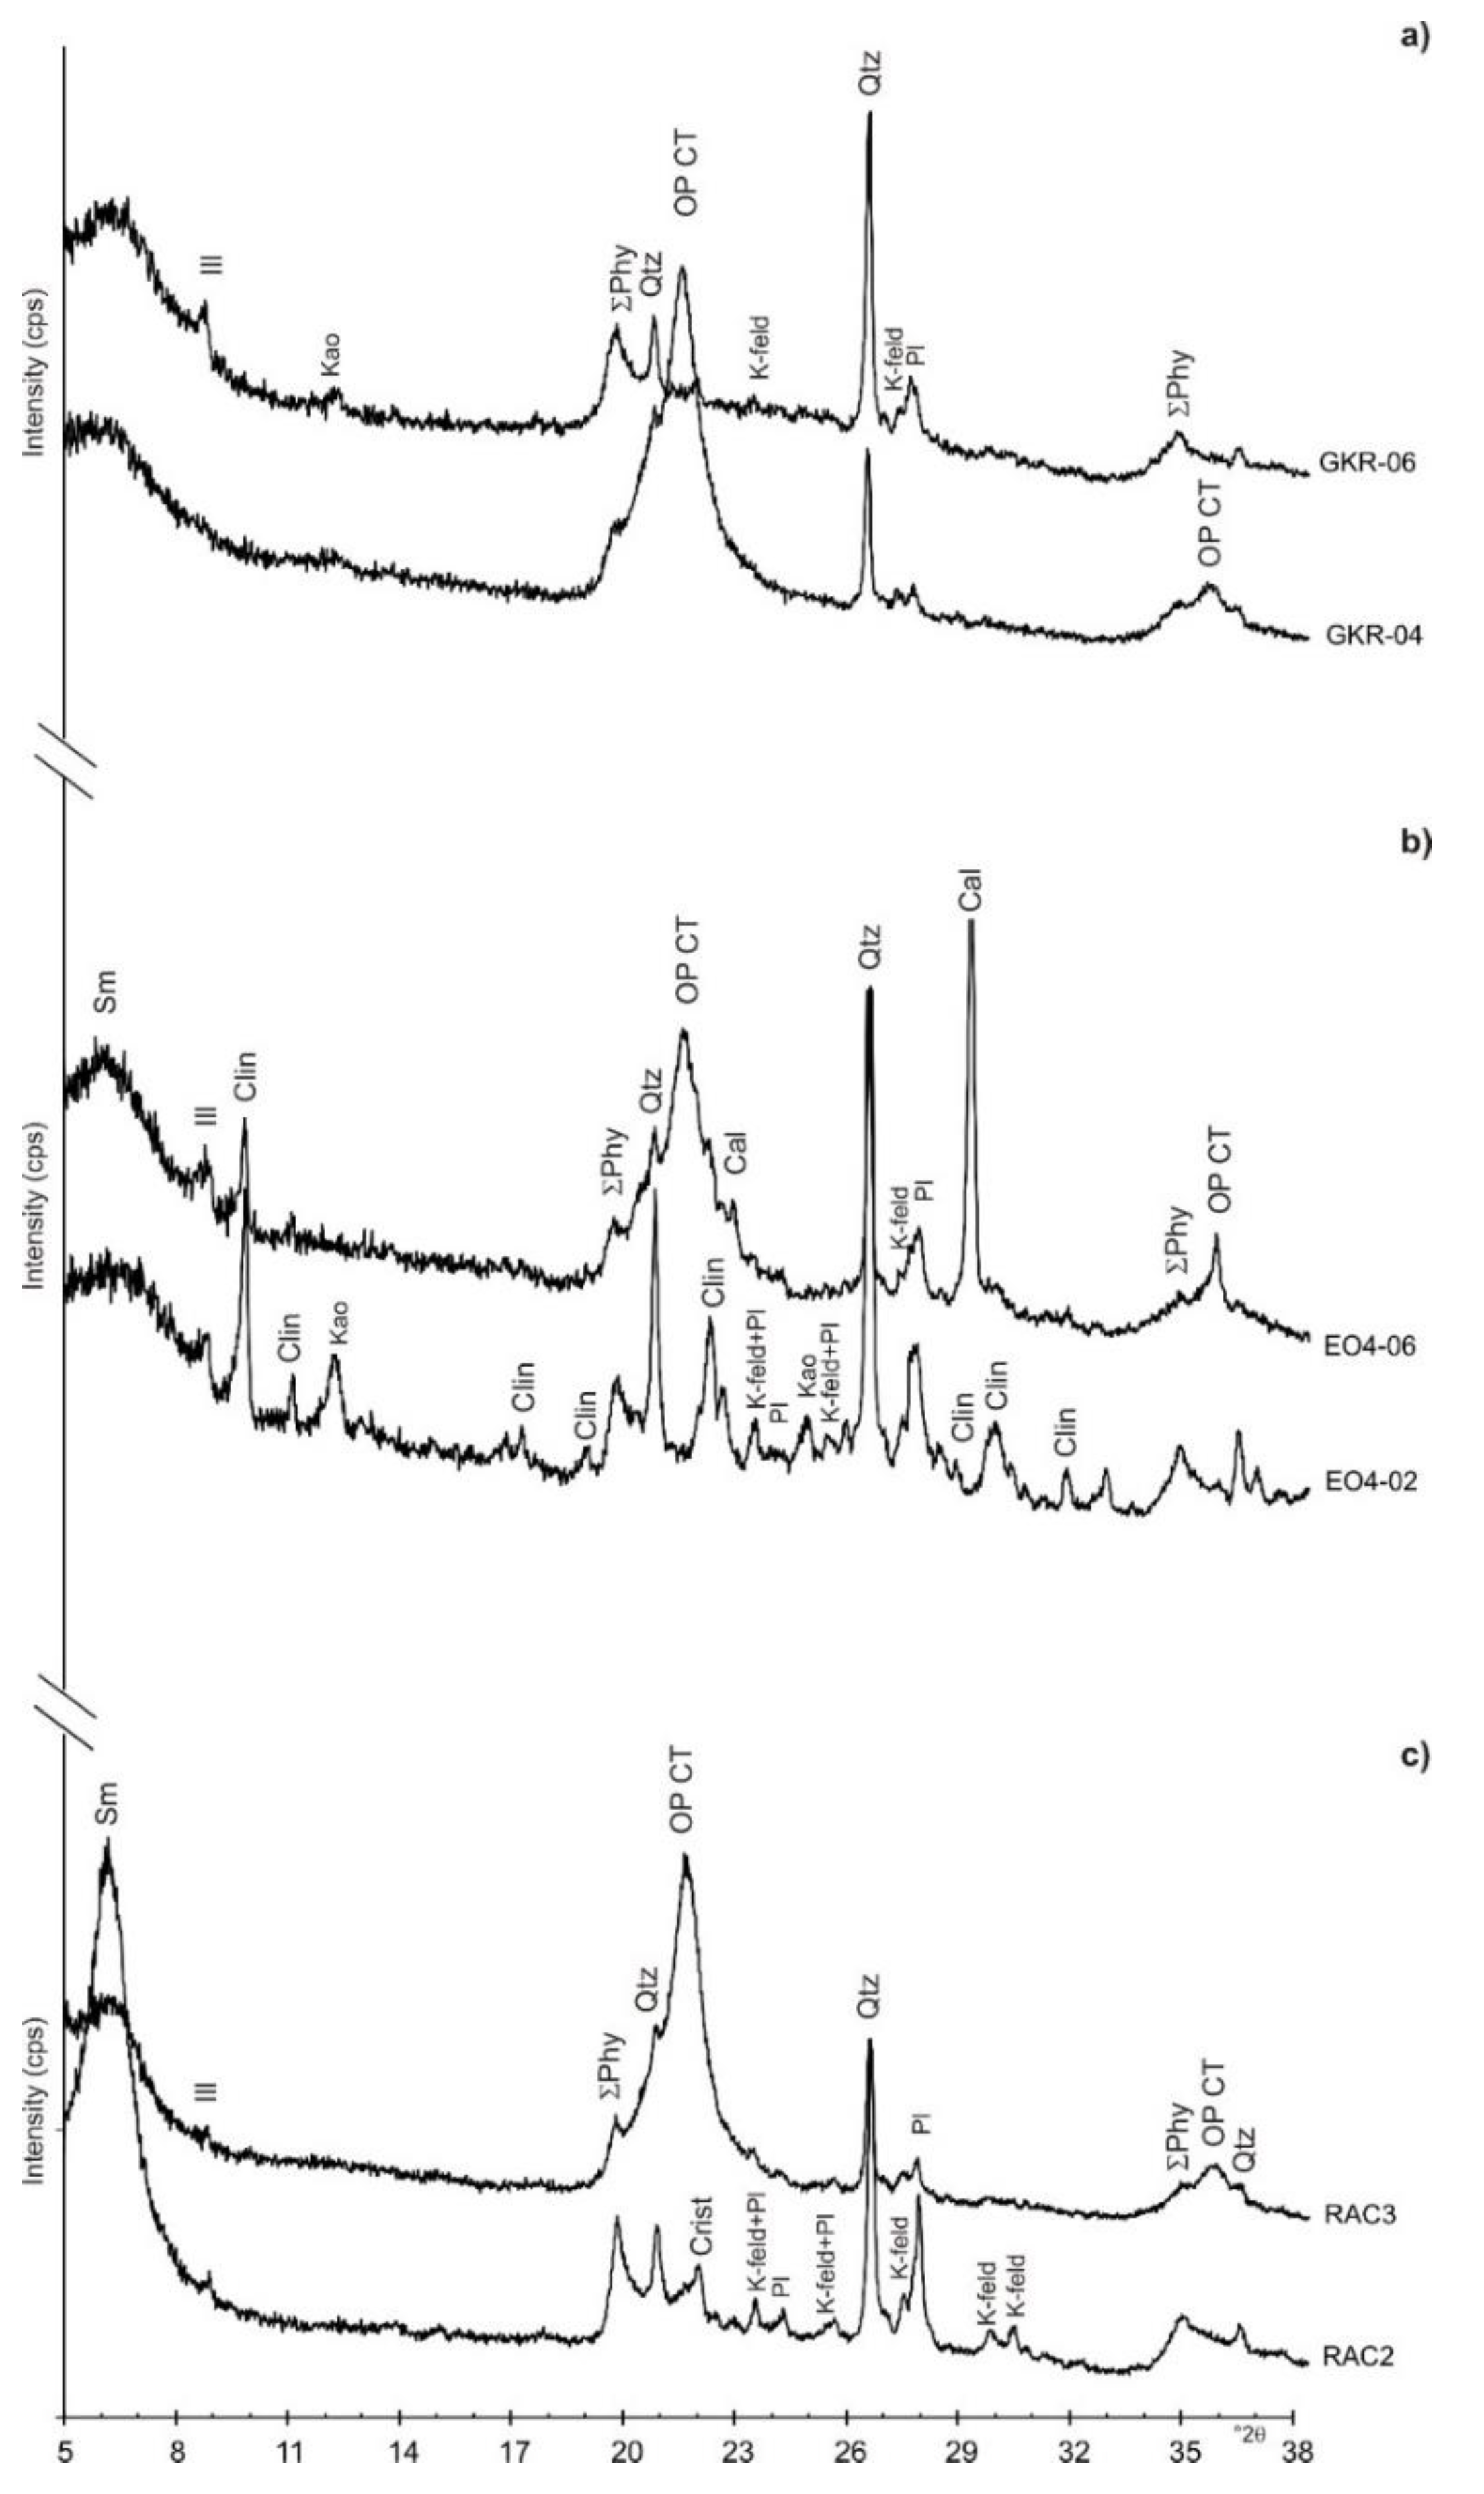
4.1. Bulk-Rock Mineralogy

Whole-rock analyses show that the samples are generally composed of quartz, feldspar (K-feldspar and plagioclase), cristobalite, and phyllosilicates (Table 1). Some samples show the presence of calcite, dolomite, clinoptilolite, gypsum, opal CT, and amorphous material, probably representing opal A (Figure 4). With one exception (RAC3) in which 58% of the bulk mineralogy is opal CT, samples from the Moreno Fm are dominated by phyllosilicates, and specifically, smectite. PGIC samples contain the highest amounts of quartz and cristobalite (Table 1), which accords with the chemical analyses that reveal a high proportion of SiO2 (Table 2). Samples from the Lower Kreyenhagen are characterised by the presence of clinoptilolite (Figure 4b), which although not present throughout, comprises 7.5% of the bulk rock volume in sample EO4-08 (Table 1). In the Upper Kreyenhagen, clinoptilolite is much less common (Figure 4a) and absent in 8 of the 13 samples. Clinoptilolite is undetected in the Moreno Fm samples (Figure 4c). Opal CT is identified in several samples, and its content varies widely from a few percent up to ~70% (Table 1). It is noteworthy that opal CT is present in varied abundance in both stratigraphic successions but absent in more than half of the samples. In the Kreyenhagen Fm, amorphous material attributed to opal A is present in the upper section of the Upper Kreyenhagen and comprises 28% and 24% in the youngest, probably least deeply buried samples (GKR-6 and TH-01, Table 1). It occurs only in one other Kreyenhagen sample (EO4-12) and is absent in the Moreno Fm.
Potassium feldspar is pervasive in the Moreno Fm and more common than in the Kreyenhagen Fm, where occasionally absent (Table 1). Plagioclase is ubiquitous and always more abundant than potassium feldspar in the Moreno Fm, and generally more abundant than in the Kreyenhagen Fm (Table 1). Calcite and dolomite are absent in most samples and, where present, form diagenetic cement. Where calcite and dolomite occur, chemical data show high concentrations of CaO and MgO, respectively (Table 2). Gypsum is present in one sample only (GKR-2) as 1%, consistent with the percentage of CaO (Table 2). Phyllosilicates in bulk samples from the Moreno Fm and Kreyenhagen Fm are predominantly represented by smectite (probably montmorillonite) or mixed layers illite/smectite R0 with low illite content (<10%). Illite and kaolinite are present in small amounts. Smectite content is in the range ~50% to 70% for most samples. Exceptions with much lower smectite content (12% to 28%, Table 1) are enriched in opal CT and, in one case (EO4-04), dolomite cement. Illite is pervasive in low proportions ranging from 5% to 8% (Table 1), while kaolinite is significantly less common and absent in nine samples (Table 1).

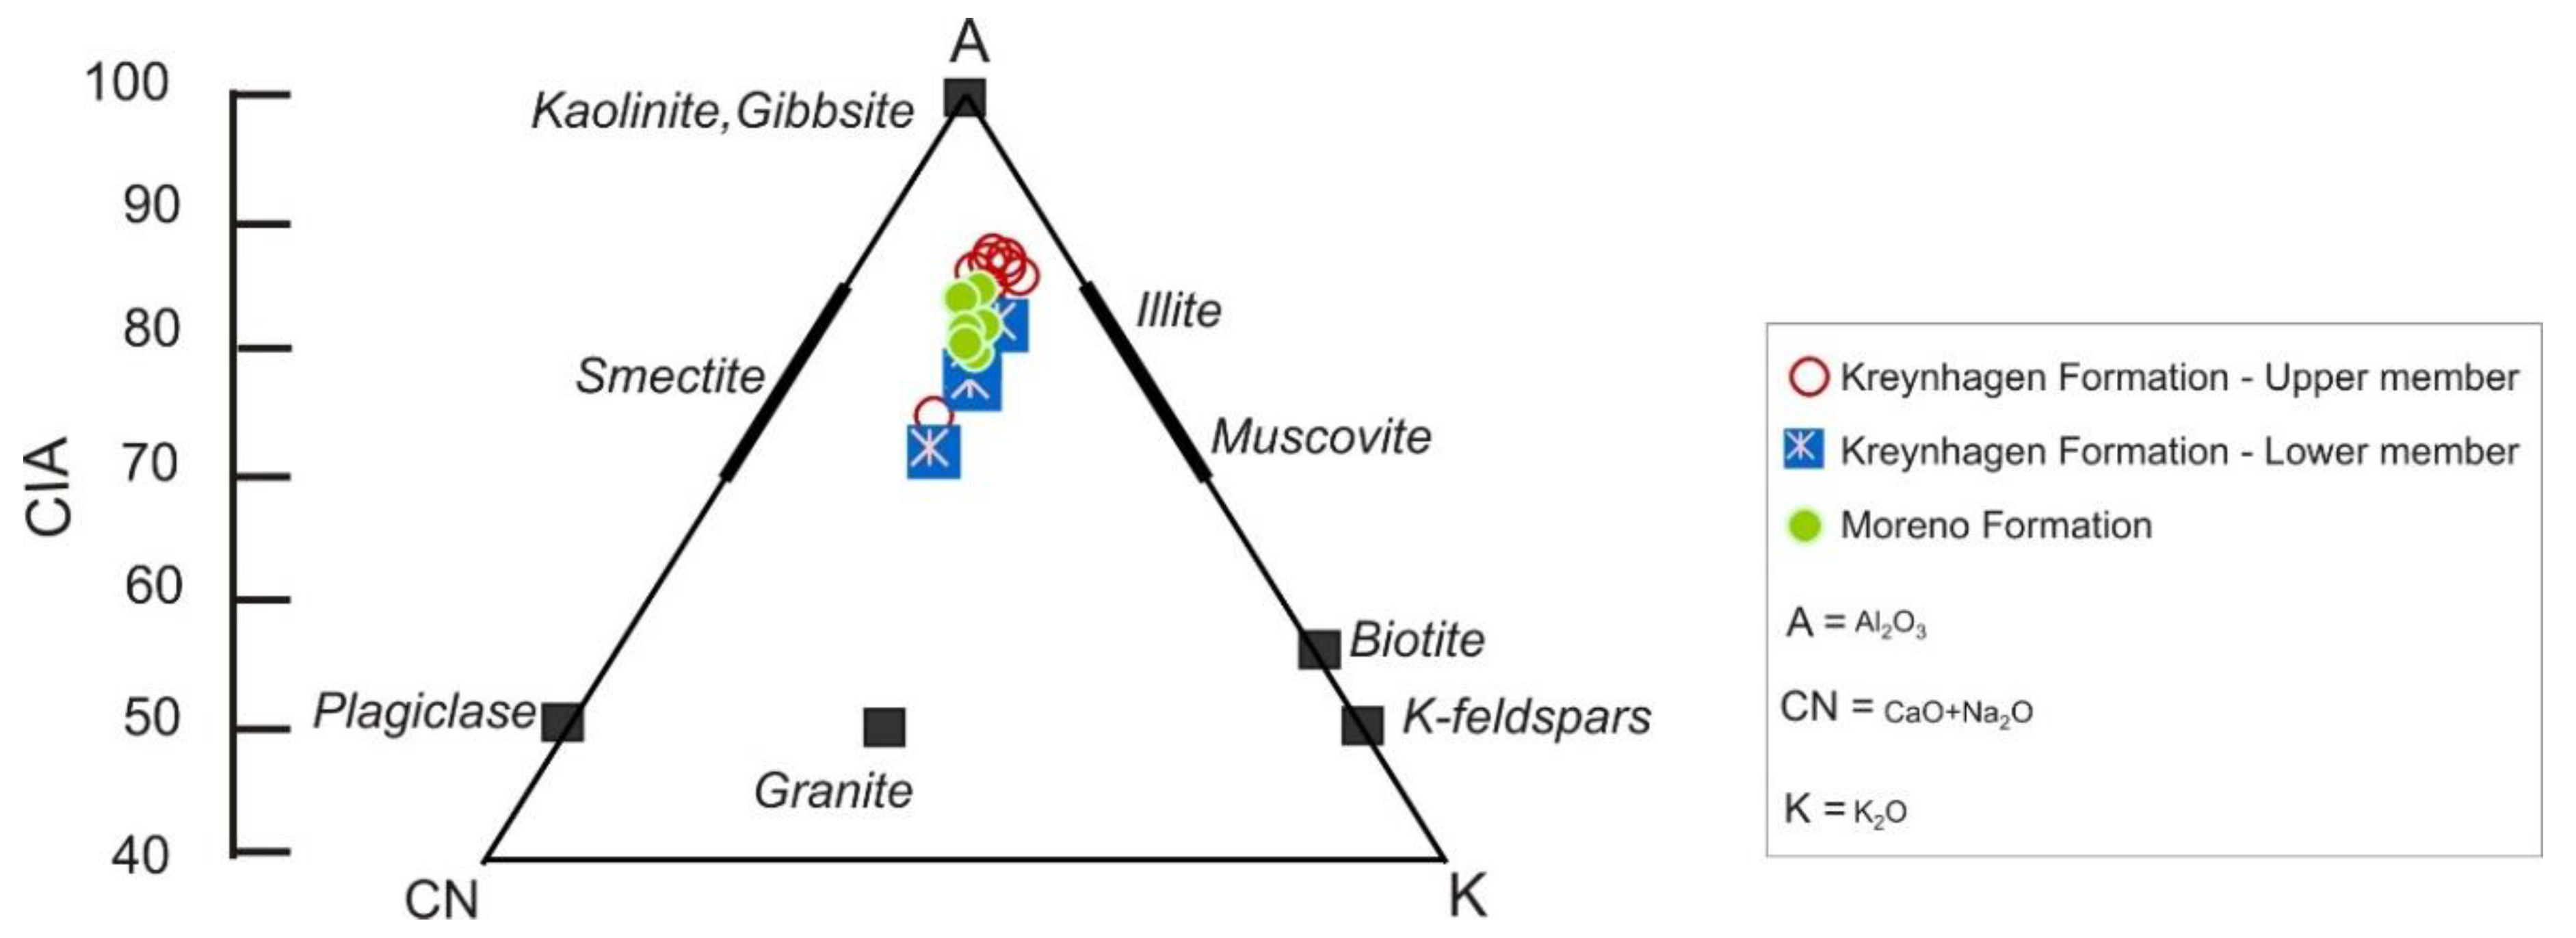
4.2. Bulk Rock Chemistry

The chemical data have limited major element data variability (Table 2). In the Lower Kreyenhagen, some exceptional CaO and MgO concentrations are caused by the presence of calcite and dolomite. SiO2 variability is associated with the concentration of bio siliceous opal. Na2O and K2O are present in low concentrations (1–2%); however, where clinoptilolite and plagioclase, and clinoptilolite and K-feldspar occur, the concentration of Na2O and K2O are higher, respectively. Excluding samples with carbonate minerals, Na2O, K2O, and CaO concentrations are lower than their average concentration in the Upper Continental Crust [24], which is indicative of significant leaching in the source terrane. Further evidence of a leached source terrane is recorded by TiO2 concentration that averages between 0.68% and 0.85%, slightly higher than average values from the Upper Continental Crust. Al2O3 content has little variability and an average content of 12% and 16% in the Lower Kreyenhagen and the Moreno formations, respectively. In accord with the mineralogical data (Table 1), the highest Al2O3 concentrations are where smectite and kaolinite predominate. In all samples, Al2O3 concentration is comparable with the average values of the Upper Continental Crust [24].
As expected from the high chemical indices of alteration (CIA) values (Table 2), sample compositions are close to the A vertex and the smectite compositional field (Figure 5). The combined presence of K-feldspar and illite shift the compositional field approximately 10% toward the A-K axis. The plots exclude all carbonate-rich samples.

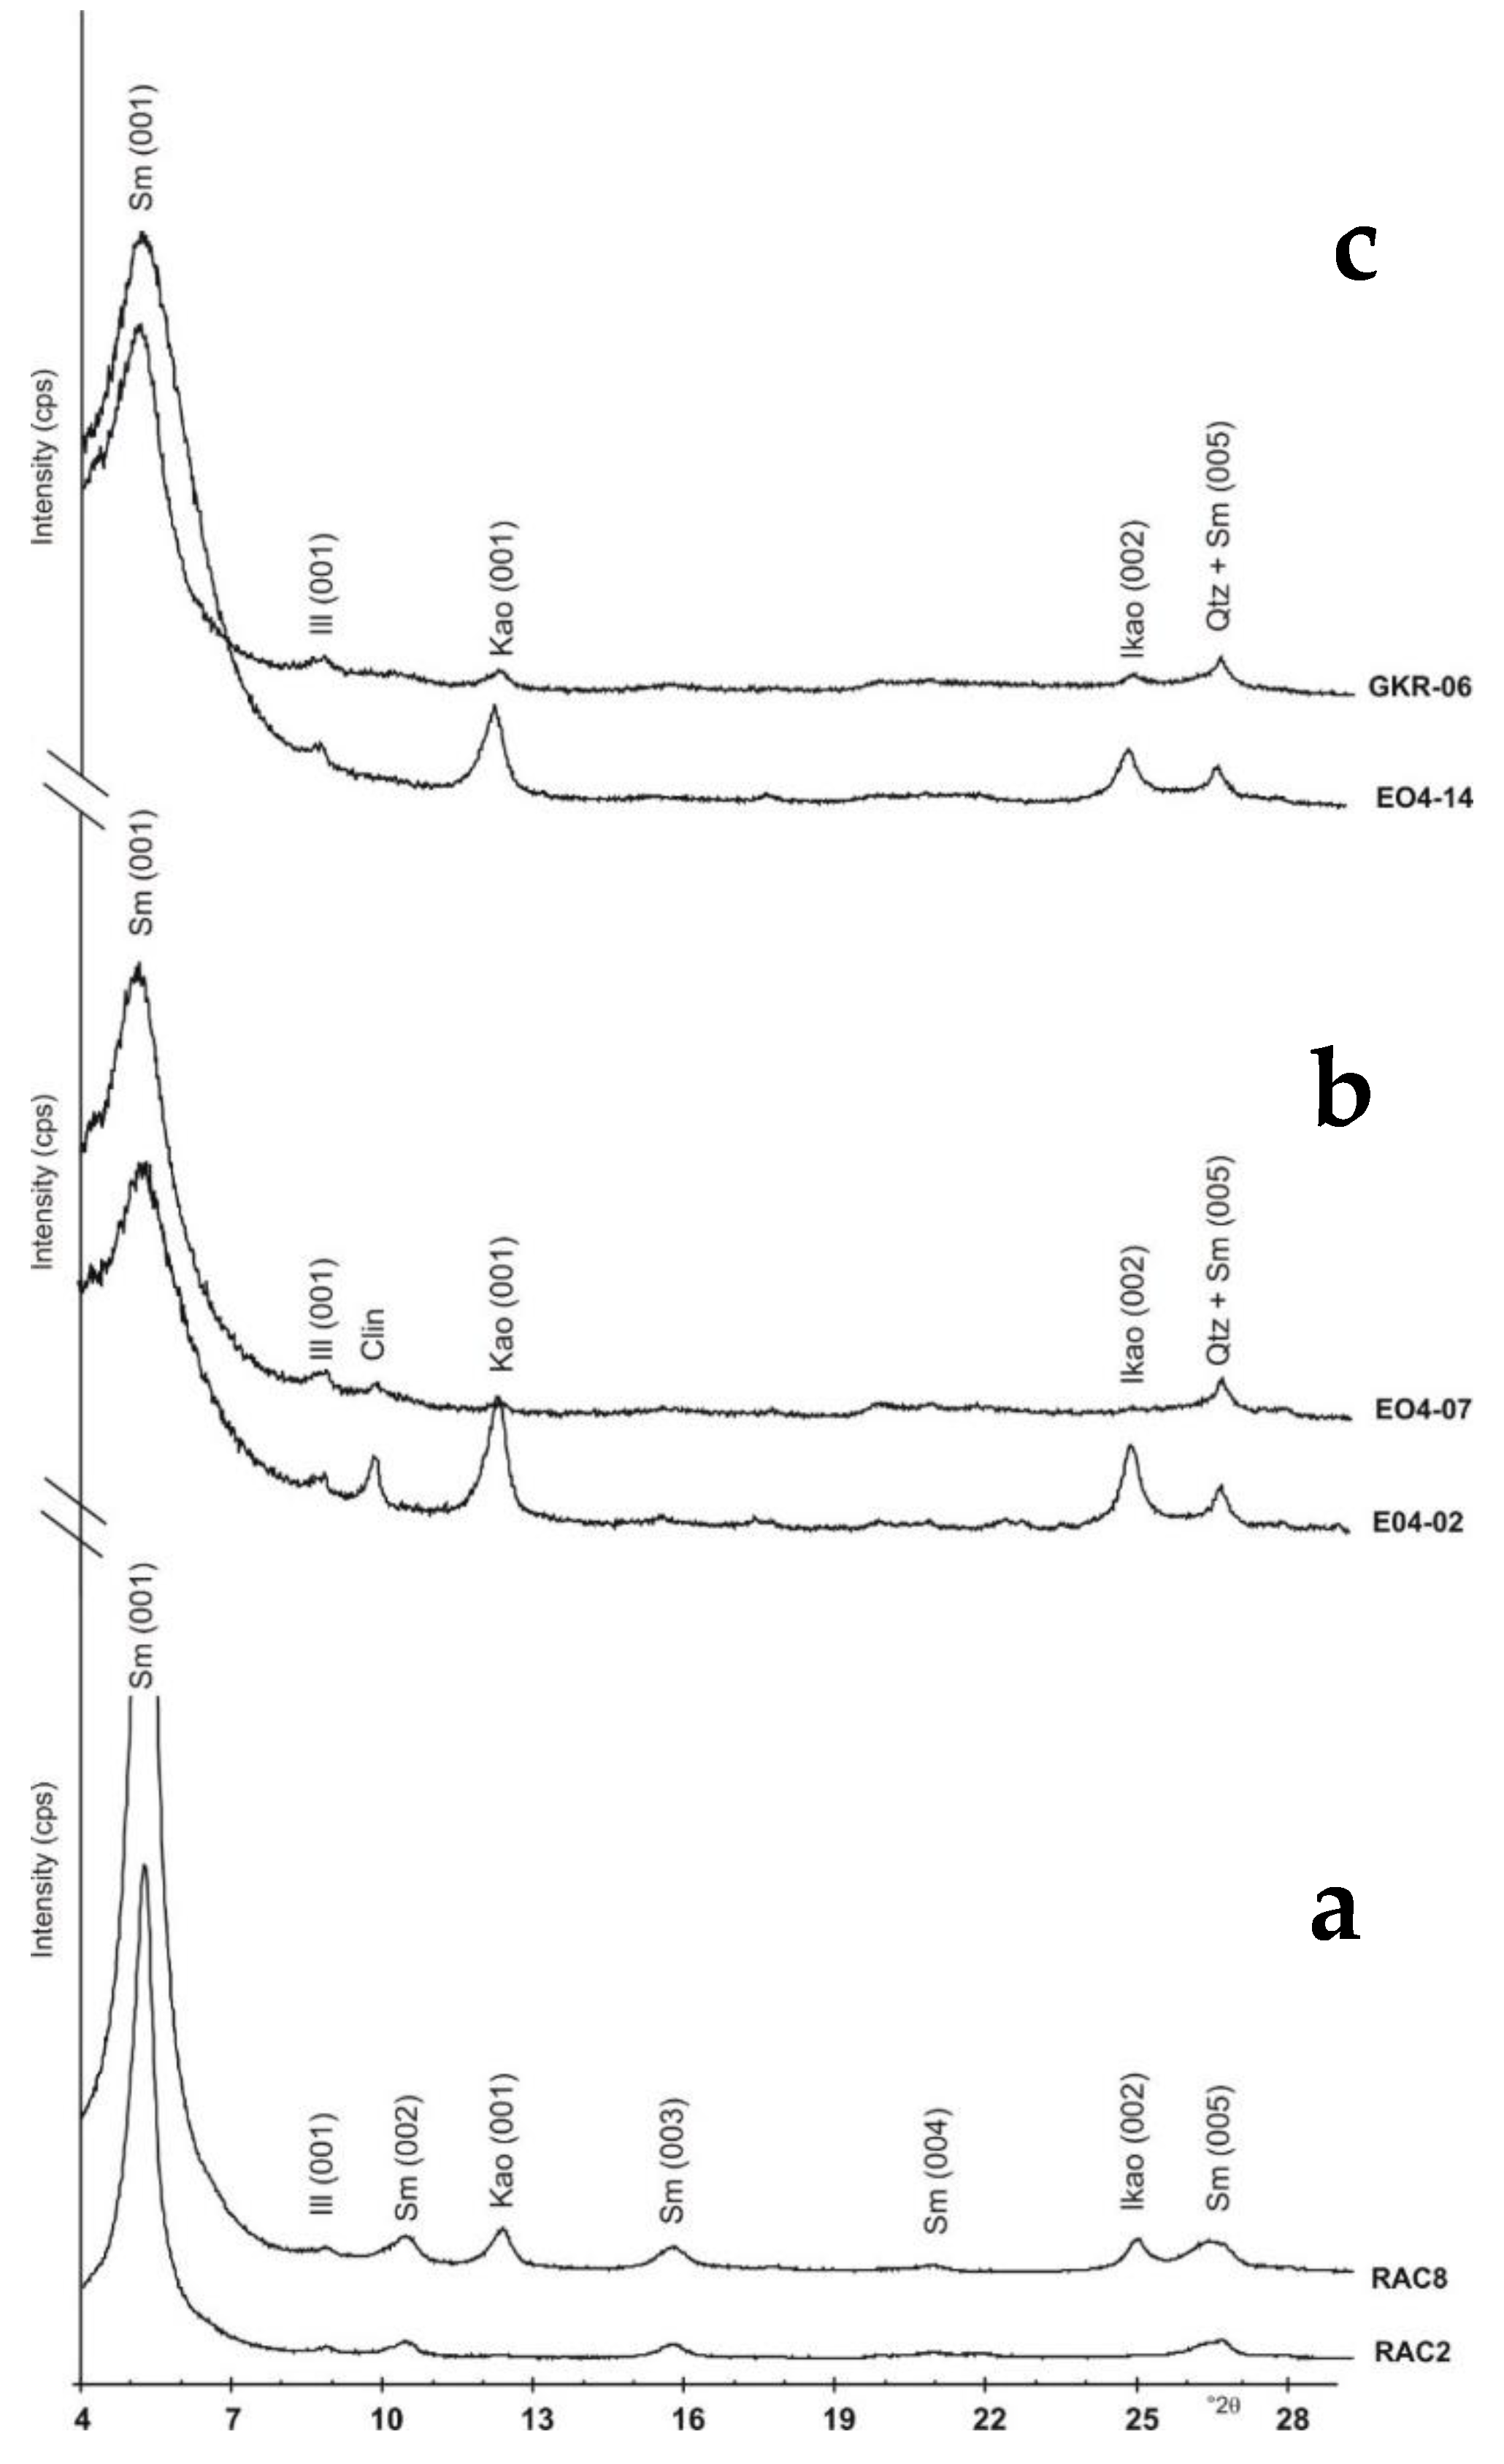
4.3. Mineralogy of the <2 µm Clay Fraction
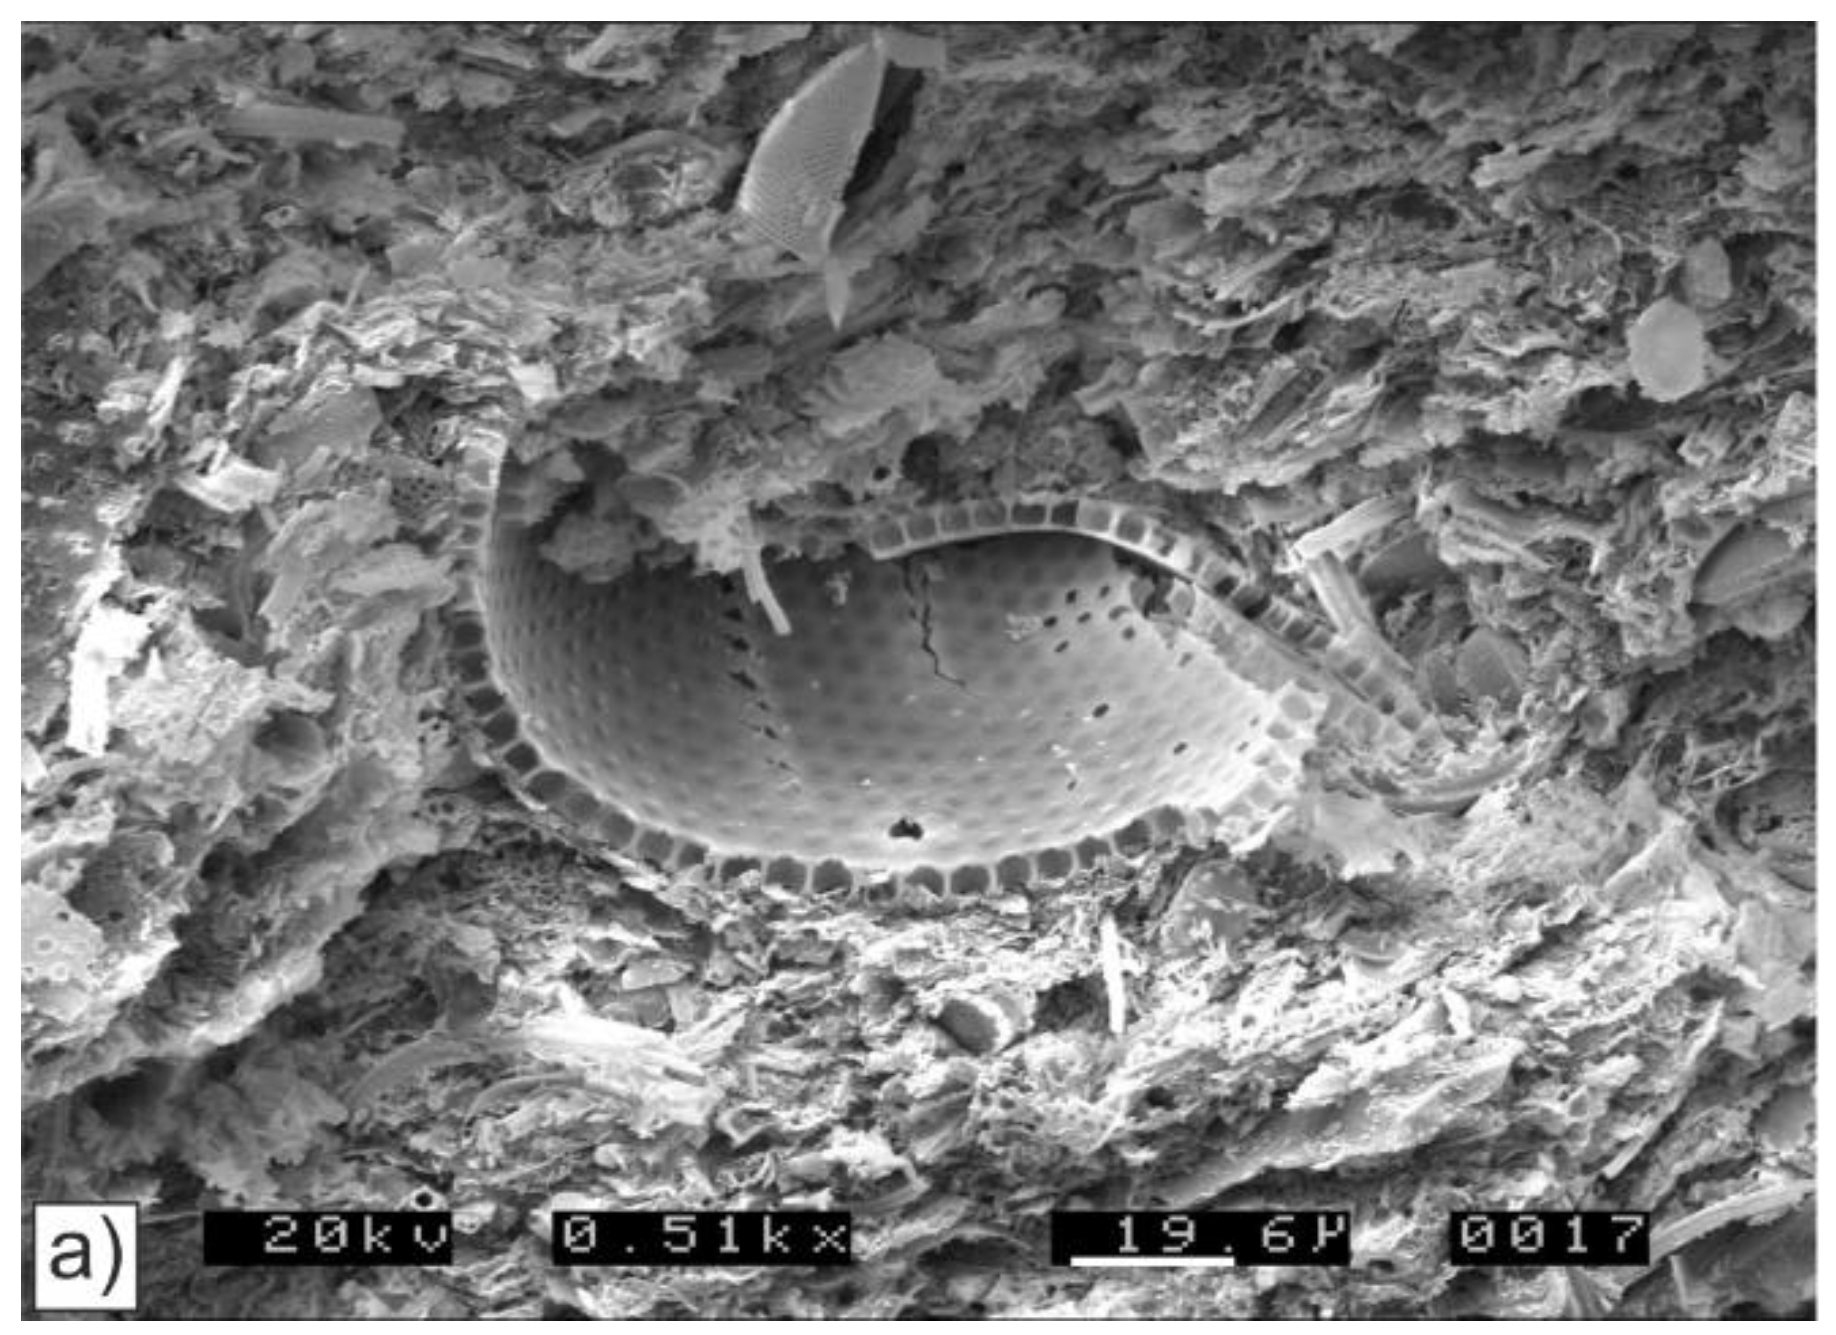
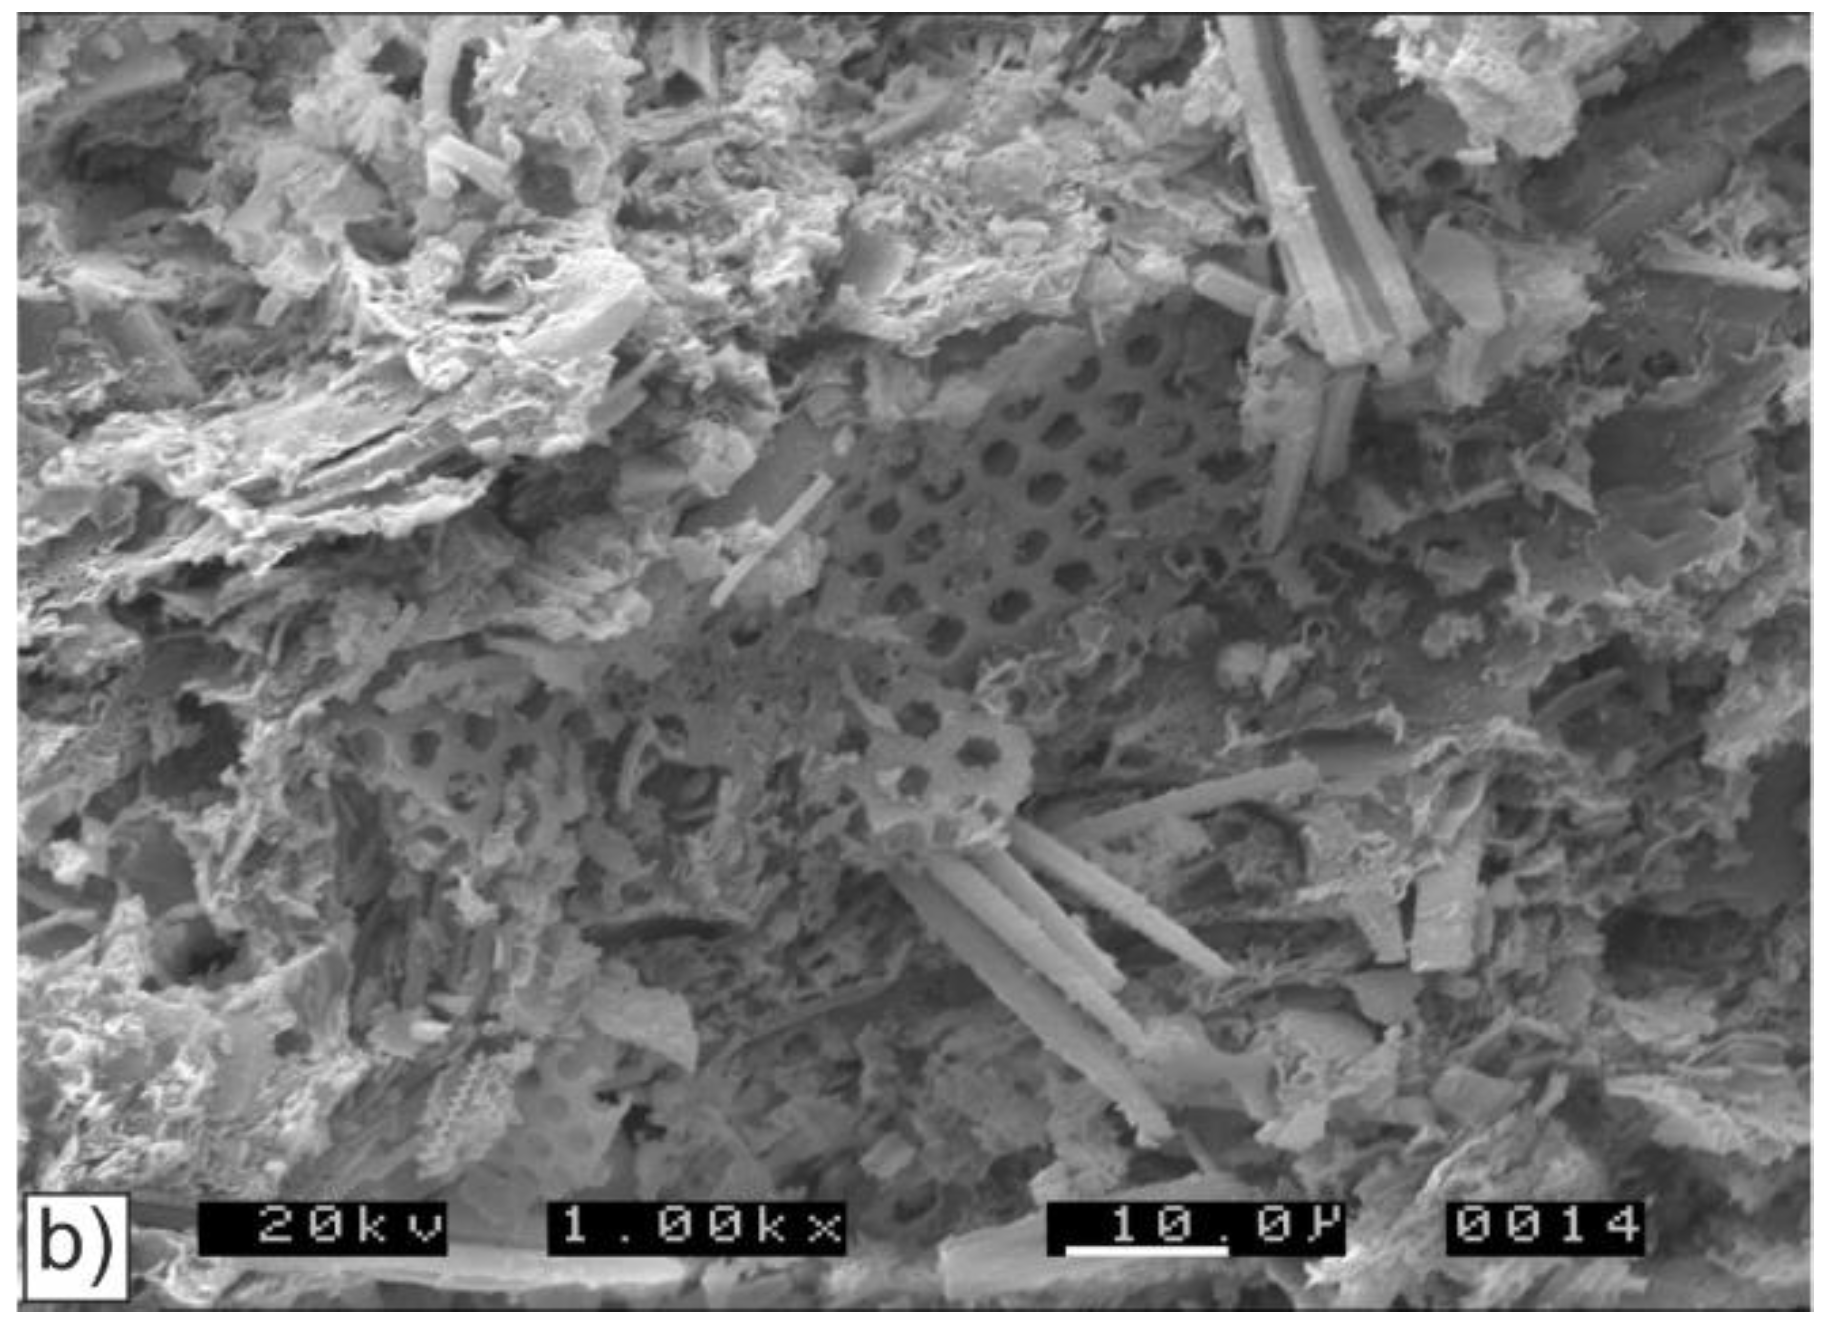
The clay fraction (<2 µm) comprises mainly smectitic clay, with small amounts of illite and kaolinite (Figure 6). Smectite content ranges from 92% to 98% (mean 95.3%) in the Moreno Fm and from 70% to 95% (mean 88.9%) in the Kreyenhagen Fm (Table 3). In the Kreyenhagen Fm, the Upper and Lower Kreyenhagen have averages of 88.9% and 86.1%, respectively; illite is present in all samples ranging from 1% to 11% (Figure 6a,b). In the Moreno Fm, illite is uncommon, ranging from 1% to 8% (mean 1.9%), and slightly more common in the Kreyenhagen Fm, ranging from 1% to 11% (mean 4.5%), with 3% and 5.8% mean illite in the Upper and Lower Kreyenhagen, respectively.
In the Moreno Fm, kaolinite is 4% or less of the <2 µm fraction in samples from the Tierra Loma and Marca Mbrs (Table 3), while in the overlying Dos Palos Mbr, it constitutes 5% or more of the <2 µm fraction (compare RAC2 and RAC8, Figure 6c). Kaolinite’s cumulative mean is 3% with a standard deviation of 2.65. In the Kreyenhagen Fm the kaolinite concentration varies significantly, with nine samples with 4% or less, and eight samples with 10% or more (Table 3). The mean concentration of kaolinite for the entire Kreyenhagen Fm and the Upper and Lower Kreyenhagen individually is 7.9%. The standard deviation for the Upper and Lower Kreyenhagen are significantly different, 6.63 and 9.68, respectively, and much greater than in the Moreno Fm. In the Kreyenhagen Fm (Table 3), the clusters of high kaolinite content occur in an ~40 m thick interval at the base of the sampled section (samples EO4-01 to -04), and in an ~25 m interval directly below (EO4-09) and above the transition from the Lower to the Upper Kreyenhagen (EO4-10 and -11). A less pronounced kaolinite enrichment occurs in an ~60 m interval. Samples with either low or no kaolinite content typically contain significant amounts of opal CT; for example, in EO4-06, EO-08, GKR1, GKR4, and RAC3 (Table 1).

4.4. Opaline Phases

The scanning electron microscopy (SEM) analysis reveals micro-textural variations that confirm the presence of opal A and differentiate it from opal CT. In the Upper Kreyenhagen, broken diatom tests exhibit pristine, box-work, shell micro-structure in a groundmass of comminuted bio siliceous debris (Figure 7). During sample preparation for XRD analysis, the opal A is assumed to disintegrate into finer-grained particles that are X-ray amorphous. By contrast, in the Moreno Fm, there is no preservation of shell tests or their micro-texture. Diatom morphology is sometimes preserved as crystalline fills of their internal geometry (Figure 8). XRD analyses of the clay fractions show an XRD pattern that is much closer to low tridymite rather than low cristobalite, with strong reflections at 4.33 Å and at 4.10 Å and weak, broad reflections at 2.49 Å and 2.31 Å.

5. Discussion

5.1. Origin of Smectite
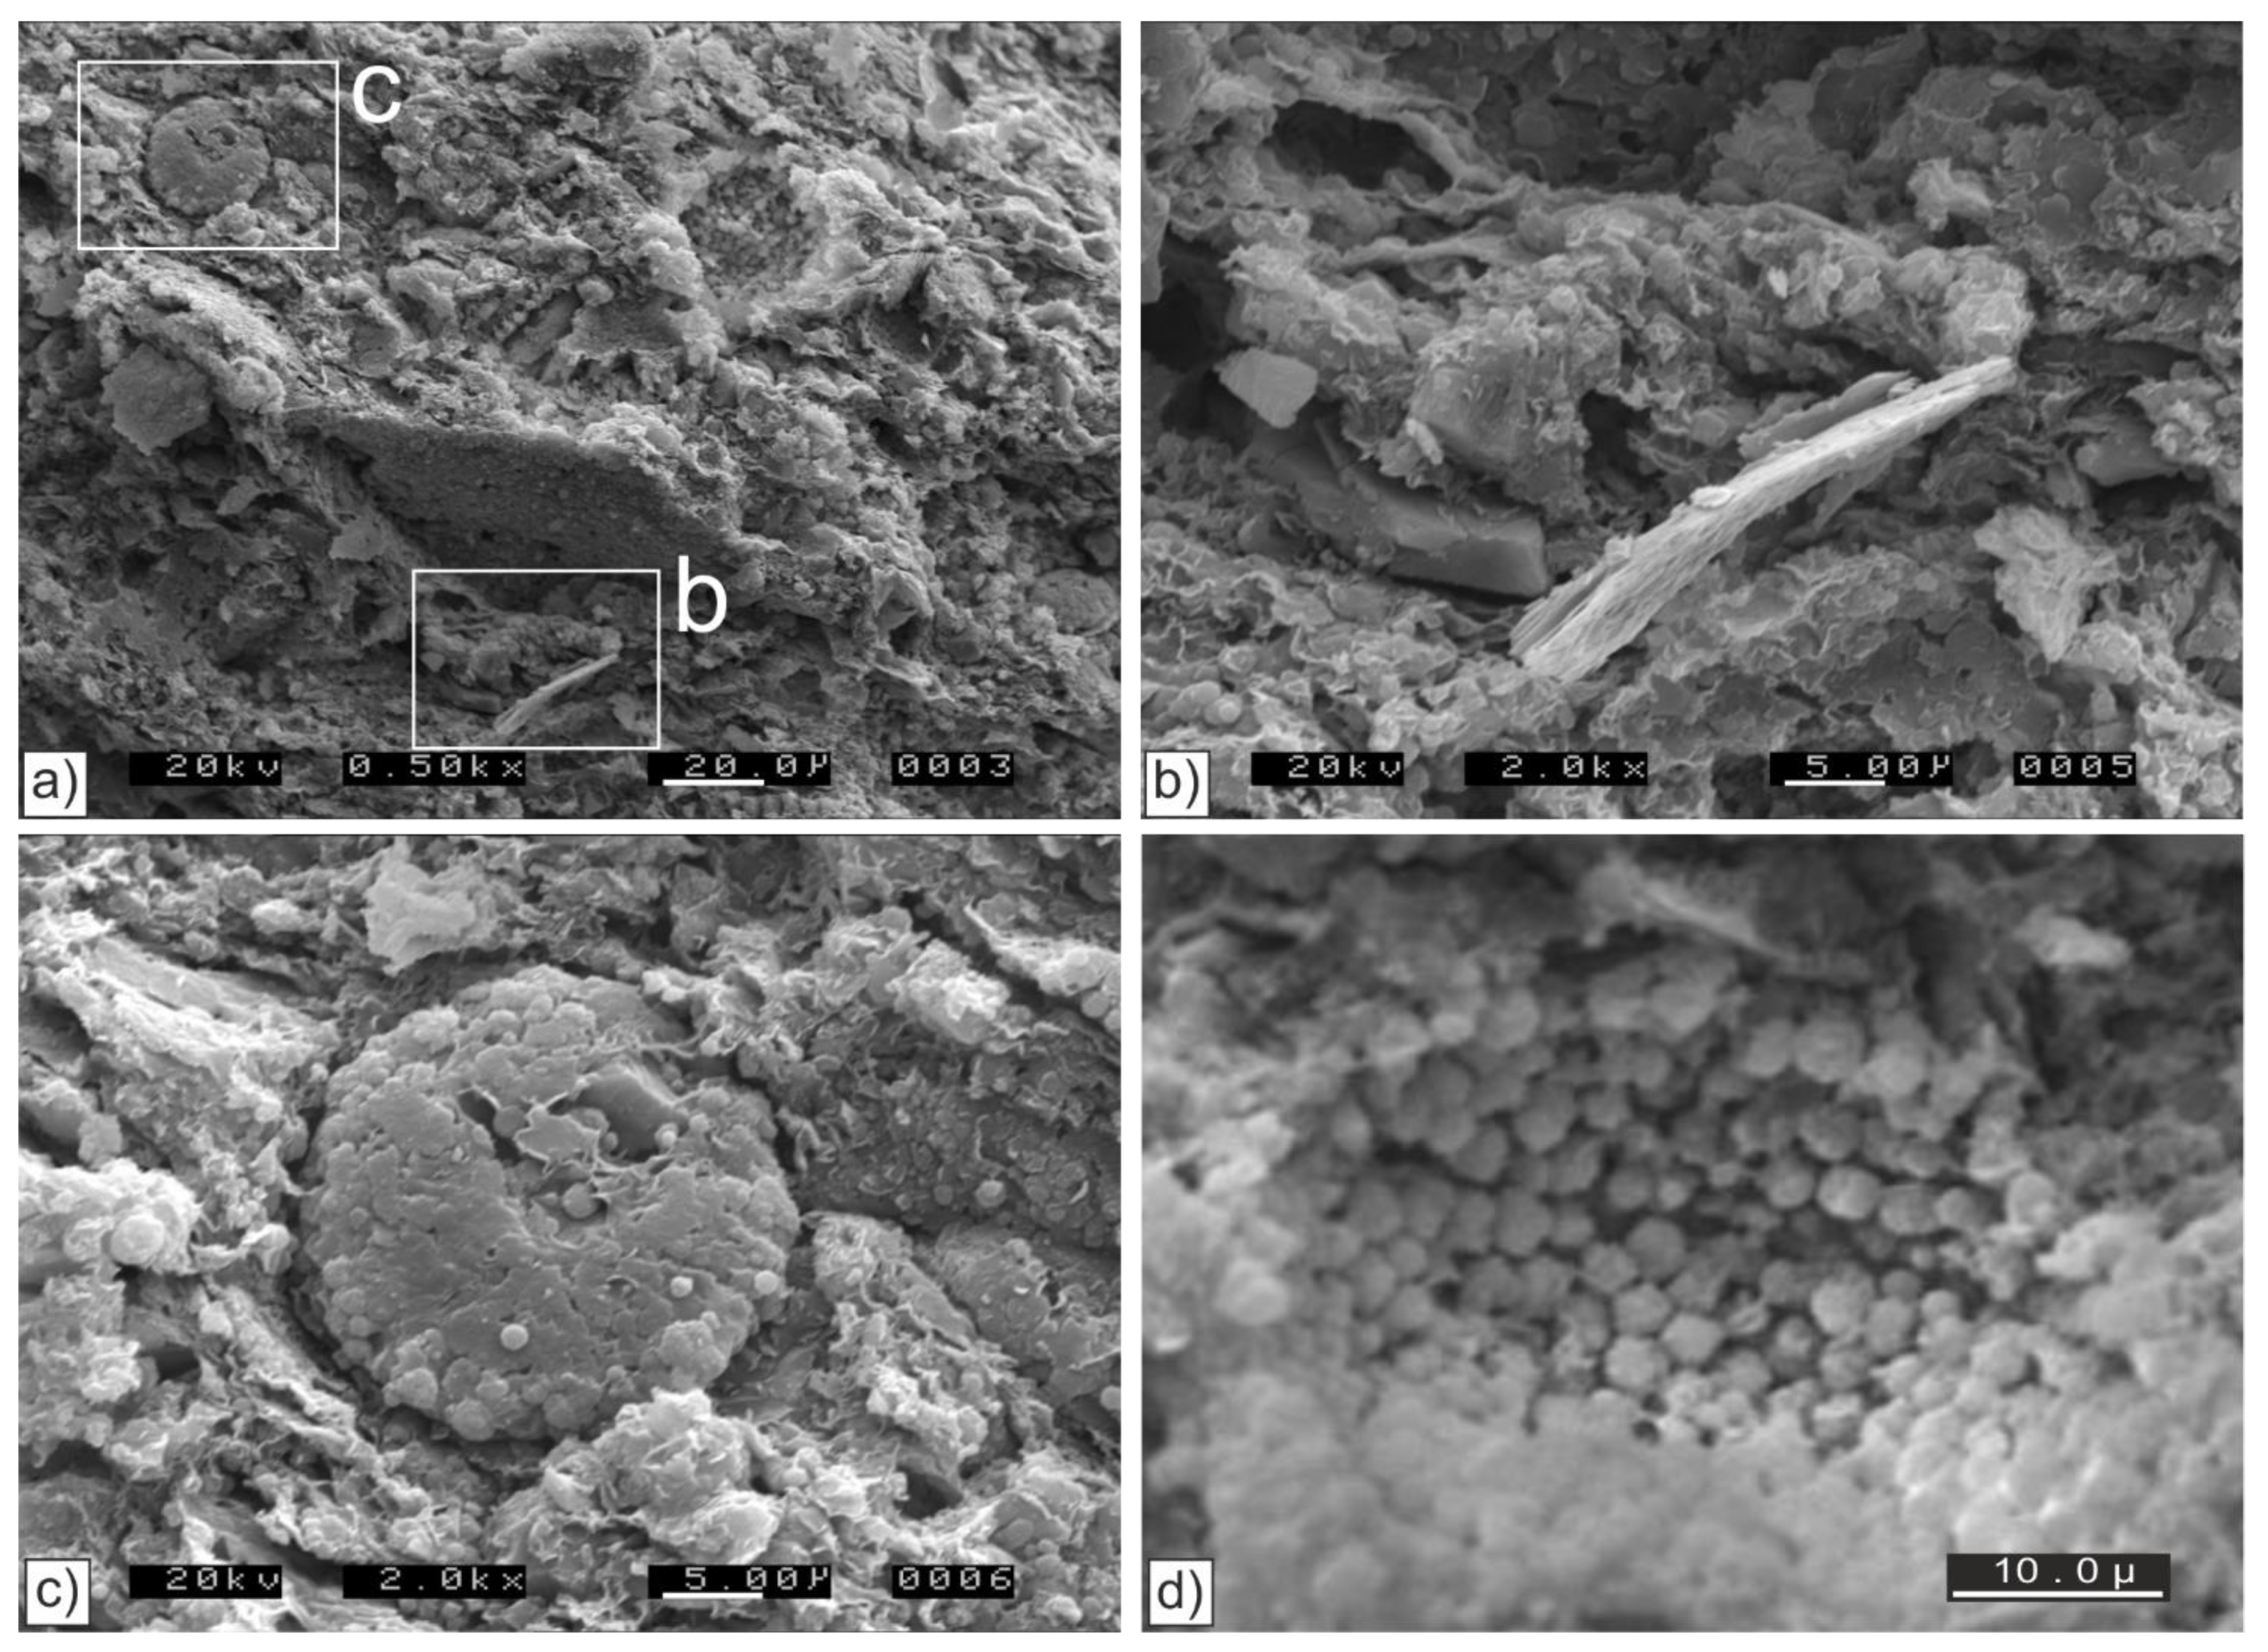
Mudstone of the Moreno and Kreyenhagen fms are dominated by smectite. Except where opal CT or dolomite occur, it is three to more than six times as abundant as any other mineral present (Table 1). Grim and Gȕven [26] concluded that the smectite in sedimentary rocks, particularly in bentonites, is most often associated with the input of volcanic material. A decade later, Moore and Reynolds [18] reaffirmed the significance of the volcanic origin for smectite, where the smectite is an alteration product of volcanic ash. It was considered that a volcanic origin could account for the occurrence of smectite in marine shales of the western interior of North America [27] and the shales and sandstones of the San Joaquin Basin in California [6]. Chamley [28] and Deconnick and Chamley [29] were particularly sceptical of the role of volcanic ash as a necessary precursor for the formation of smectite, specifically in coastal and deep-sea environments. It is now well established that smectite forms as a weathering product and constituent of soil in many tropical and sub-tropical environments and develops on a wide range of substrate [30,31,32].
During the Upper Cretaceous, deposition of the Moreno Fm coincided with active volcanism in the palaeo-Sierran magmatic arc [33] and erosion of substantial volumes of clastic detritus into a forearc basin [34], the site of the present-day San Joaquin Valley (Figure 1). Alteration of volcaniclastics from rhyolitic or dacitic composition to form smectite is inferred and supported by the high average SiO2 content (66.8%, Table 2). This accords with the occurrence of quartz, cristobalite, and opal CT (Table 1). No evidence exists for direct deposition from airborne volcaniclastics and tuff is unrecognized in our study area. Despite the prevalence of smectite (Table 1 and Table 3), high (mean 84.44) CIA values [25] persist and are indicative of significant leaching of the source terrane. The widespread contemporary volcanic activity makes alteration of volcaniclastics the likely primary source of smectite; however, prior to marine deposition, we suggest that smectite was likely to be retained and formed in pedogenic settings in which it was stable [28] but where further leaching continued to modify the bulk chemistry of the detritus. The low standard deviation of CIA in the Moreno Fm is a measure of the homogeneity of the bulk chemistry (Table 2).
Contemporary volcanism was absent in the palaeo-Sierra Nevada during the deposition of the Kreyenhagen Fm (Eocene), although it did occur further east on the “Nevadaplano” [35]. As with the Moreno Fm, the absence of tuff makes direct deposition from volcaniclastics unlikely, and weathering processes and soil formation along the western margin of the Sierra Nevada are more plausible origins for most of the smectite. High CIA values prevail, averaging 84.33 and 78.14 in the Upper and Lower Kreyenhagen, respectively. These are indicative of a moderately high level of leaching of the source terrane that coincides with the Paleocene–Eocene thermal maximum followed by almost 10 Ma years of the Eocene hyperthermal [36]. Red soils/paleosols with locally abundant smectite developed along the western margin of the North American continent recording a trend of tropical to sub-tropical climate from Baja California [37] to Oregon [38]. The Kreyenhagen Fm is typically deficient in alkali and alkaline earth cations and is notably ferriferous; Upper and Lower Kreyenhagen with 4.44% and 3.97% mean Fe2O3, respectively, relative to 2.56% Fe2O3 in the Moreno Fm (Table 2). Local concentrations of kaolinite (10–24%, Table 3) record erosion of more deeply weathered contemporary terrane. Iron oxide stain along cleavage planes in feldspar in Kreyenhagen sandstone is evidence of the erosion of deeply weathered source terrane [4]. Higher concentrations of Fe2O3 are consistent with the generation of smectite by weathering of the granitic or dioritic-granodioritic substrate and probable soil formation rather than by alteration of volcaniclastic debris.

5.2. Opal CT

Textural differences between opal CT from the Moreno Fm (Figure 7) and opal A from the Upper Kreyenhagen (Figure 8) show how opal A dissolution occurs by the disappearance of the intricate highly micro-porous diatom fragments and growth of coarser individual crystals of opal CT that sometimes preserve diatom test morphology but none of the original micro-porous structure. In a micro-textural context, the transition of opal A to opal CT is demonstrably not a solid-state transition. Growth of opal CT is manifest as an increase in bulk density in the sedimentary rock in which it occurs and is accompanied by a visible change from a substantial proportion of sub-μm micropores in diatomaceous fragments (Figure 7b) to less but larger (~0.5 μm to 2.5 μm) pores (Figure 8d). Although we have not attempted a quantitative evaluation of this change in micro-texture, it is apparent that the pore-size distribution in opal CT is skewed to larger pore sizes than in opal A, implicitly enhancing pore connectivity. It is worth noting that XRD analyses of the clay fractions show an XRD pattern that is much closer to low tridymite rather than low cristobalite, with strong reflections at 4.33 Å and 4.10 Å and weak, broad reflections at 2.49 Å and 2.31 Å. In contrast, low cristobalite has an XRD pattern with a very strong reflection at 4.05 Å and with medium-strong reflections at 3.14 Å, 2.84 Å, and 2.48 Å [39]. Despite these differences, most authors continue to identify opal CT as a precursor of cristobalite rather than tridymite, even though recent [40] and older work [41] presented spectroscopic evidence in support of opal CT as a precursor of tridymite rather than cristobalite.

5.3. Clinoptilolite

Global occurrence of clinoptilolite in sedimentary rocks is concentrated in strata of Upper Cretaceous to Eocene age [42]. When present in the Lower Kreyenhagen (seven of ten samples), clinoptilolite has a mean abundance of 3.63% whereas it is mainly absent from the Upper Kreyenhagen. Clinoptilolite was known in the Moreno Fm and associated with an early diagenetic alteration of smectite [43], but it is undetected in this study. The general relationship between the co-occurrence of clinoptilolite with opal CT and smectite [42,44] is not present in five of the seven clinoptilolite-bearing samples; smectite is abundant, but opal CT, opal A, and cristobalite are absent (Table 1). Clinoptilolite forms in normal salinity marine conditions in which opal A or CT are freely available and magnesium concentration is low, conditions typical of open oceans rather than where ocean circulation is restricted. In this context, it could be that the Lower Kreyenhagen deposited in more open marine conditions than the Upper Kreyenhagen. An alternative origin for clinoptilolite is from igneous rocks, often as alteration products of ignimbrites and tuffs, and as vesicular crystals [45,46,47]. This may be a potential contributory source for clinoptilolite in the Lower Kreyenhagen. In common with the origin of smectite, the lack of adjacent volcanic sources during the Eocene diminishes the likelihood of significant volcanic provenance.

5.4. Sedimentology and Diagenesis

Content of bio siliceous silica relative to phyllosilicates, and specifically smectite, is the main sedimentological variation present: in the Moreno Fm, the Marca Mbr is a thick, pale grey, regionally developed bio siliceous mudstone [2,13]; in the Kreyenhagen Fm, the Lower and Upper Kreyenhagen are differentiated by their clay mineral and bio siliceous content, respectively [3]. Deposition of the Dos Palos Mbr records a shallowing upward and from the medial part of the Marca Mbr into the Dos Palos Mbr kaolinite content has a significant increase, averaging 4.6% compared with 1% in the underlying mudstone (Figure 3a, Table 3). In the uppermost four samples (RAC-6, -7, -8, and -9), Fe2O3 is enriched along with alkali and alkali earth elements while SiO2 is less concentrated (Table 2). In the absence of any silicate diagenesis, the increase of kaolinite and Fe2O3 records increased terrestrial input with other chemical variations responding to a slight gradual coarsening and increased feldspar content. Independent evaluation of diagenetic grade in the Moreno Fm estimated the thermal maximum to be <50 °C [48], and we have no evidence to contradict that in this study.
Localized diagenetic calcite and dolomite cement and opaline silica transformations are identified and gypsum is present in the Kreyenhagen Fm [4]. High silica content and deficiency in alkali and alkaline earth cations is characteristic (Table 2) and attributed to derivation of clastic material from siliceous magma. The Lower Kreyenhagen is significantly enriched in alkali and alkali earth elements and depleted in Si4+ relative to the Upper Kreyenhagen and the Moreno Fm. When the four samples with diagenetic carbonate cement from the Lower Kreyenhagen are excluded from the statistical analysis, Mg2+ and Ca2+ remain significantly higher than in Upper Kreyenhagen and Moreno samples, thus reinforcing the significance of the chemical difference of the Lower Kreyenhagen.

5.5. Smectite and Hydrocarbon Generation

Unsurprisingly, given the known hydrocarbon reserves in the area [5,49], most of the very few published papers on the clay mineralogy of Paleogene strata in the San Joaquin Basin are associated with hydrocarbons. Previously, smectite in the Kreyenhagen Fm was believed to promote oil expulsion efficiency and was investigated using hydrous pyrolysis to compare natural and thermal maturation of samples [50]. Using the same samples, Lewan et al. [7] concluded that oil expulsion efficiency from smectitic mudstone was reduced by 88% compared to that of mudstone impregnated with kerogen. The reduction in expulsion efficiency was thought to be due to the kerogen in the interlayer region of the smectite structure being converted to bitumen that on heating converted to pyrobitumen through a crosslinking reaction. This actively inhibits oil generation and expulsion efficiency by changing the pore system from water-wet to bitumen-wet. Again, using the same samples, this result was confirmed by Clauer et al. [8], who monitored the changes in chemistry, mineralogy, and K–Ar isotope ratios. Mineralogical changes were monitored by XRD and consisted of recording inhibition of swelling of smectite layers and promotion of illite layers following the impregnation of the pore system and interlayer region of the smectite structure by pyrobitumen after heating to temperatures above 365 °C for 72 h.
Data from our <2 µm samples show that smectite in Kreyenhagen samples (Figure 6b,c) is dominated by randomly interstratified mixed-layer illite-smectite (I/S) where the S component exceeds ~85% in a Reichweite R0 arrangement. Samples show evidence of inhibition to swelling after treatment with ethylene glycol, a behaviour attributed to the <2 µm fraction being Mg-saturated [51]. When heated at 375 °C for 1 h it produces a very broad 10 Å reflection, which is asymmetric toward the high angle side. This XRD characteristic is caused by the difficulty of removing interlayer water associated with the interlayer Mg2+ cation [51]. Thus, inhibition of swelling in smectite need not be associated with the adsorption of pyrobitumen in the interlayer space although our data neither confirm nor deny the concept that formation of a pyrobitumen-smectite complex in the interlayer space [7,8] may inhibit oil generation. Further investigation is required in order to resolve this issue.

6. Conclusions

Evolution of the palaeo-Sierra Nevada provided remarkably uniform smectite-dominated fine-grained sediment input to the forearc basin during the deposition of the Upper Cretaceous and Paleogene Moreno Fm and the mid-to-late Eocene Kreyenhagen Fm. Deposition of the Moreno Fm was concurrent with volcanic activity in the magmatic arc, and the alteration of rhyolitic or dacitic volcaniclastics is the likely primary source of smectite. The absence of tuff means that there is no direct evidence of volcaniclastic deposition in the marine forearc basin. Volcaniclastics are likely to have been incorporated into terrestrial sedimentary systems, possibly pedogenic, and later reworked into marine environments.
Smectite is prevalent in the Kreyenhagen Fm but in the absence of concurrent Sierran magmatism. Weathering of granitic or dioritic-granodioritic source terrane is inferred during the extended period of sub-tropical climate in the late Paleocene and early Eocene. Local periods of kaolinite enrichment are present that record erosion of more deeply weathered terrane. Chemical data (high CIA) confirm significant leaching of source terrane.
Diatomaceous opaline silica is the main variable constituent in the fine-grained sediment budget. Opal CT is locally common in the Moreno Fm and the prevailing constituent of the Marca Member. In the Upper Kreyenhagen, opal CT is common and opal A is preserved in the youngest parts of the section.
Clinoptilolite is consistently present in small quantities in the Lower Kreyenhagen. but the common general relationship between co-occurrence of clinoptilolite, opal CT, and smectite is not unsustained; opal CT is typically absent where clinoptilolite occurs. Otherwise, the occurrence of clinoptilolite is entirely consistent with the strata of this age globally and indicative of open oceanic conditions.

Author Contributions

Conceptualization, A.G., G.P., and A.H.; methodology, M.J.W., F.C., and C.B.; validation, A.H., M.J.W., and L.W.; formal analysis, C.B., F.C., M.J.W., and L.W.; field investigation, A.G., G.P., and AH.; resources, A.H.; data curation, A.G.; writing—original draft preparation, A.H., M.J.W., and L.W.; writing—review and editing, A.H.; visualization, A.G. and A.H.; supervision, A.H.; project administration, A.H.; funding acquisition, A.H. All authors have read and agreed to the published version of the manuscript.

Funding

This research received part funding from the Sand Injection Research Group (SIRG) at the University of Aberdeen.

Institutional Review Board Statement

Not applicable.

Informed Consent Statement

Not applicable.

Data Availability Statement

The data presented in this study are available on request from the corresponding author. Some data availability is restricted by confidentially agreements with research sponsors.

Conflicts of Interest

There are no conflicts of interest.

References

  1. Vigorito, M.; Hurst, A.; Cartwright, J.A.; Scott, A. Architecture of a sand injectite complex: Implications for origin and timing. J. Geol. Soc. Lond. 2008, 165, 609–612. [Google Scholar] [CrossRef]
  2. Vigorito, M.; Hurst, A. Regional sand injectite architecture as a record of pore pressure evolution and sand redistribution in the shallow crust: Insights from the Panoche Giant Injection Complex, California. J. Geol. Soc. Lond. 2010, 167, 889–904. [Google Scholar] [CrossRef]
  3. Zvirtes, G.; Hurst, A.; Philipp, R.P.; Palladino, G.; Grippa, A. The Tumey Giant Injection Complex, Tumey Hill, California (USA). Geol. Soc. Lond. Spec. Publ. 2019, 493. [Google Scholar] [CrossRef]
  4. Zvirtes, G.; Philipp, R.P.; Hurst, A.; Palladino, G.; De Ros, D.F.; Grippa, A. Petrofacies of Eocene sand injectites of the Tumey Giant Injection Complex, California (USA). Sediment. Geol. 2020, 400. [Google Scholar] [CrossRef]
  5. Jay, J. Reservoir shale as oil source in California. AAPG Search and Discovery Article #90122©2011. In Proceedings of the AAPG Hedberg Conference, Austin, TX, USA, 5–10 December 2010. [Google Scholar]
  6. Ramseyer, K.; Boles, J.R. Mixed-layer illite/smectite in Tertiary sandstones and shales, San Joaquin Basin, California. Clay Clay Min. 1986, 34, 115–124. [Google Scholar] [CrossRef]
  7. Lewan, M.; Dolan, M.; Curtis, J.B. Effects of smectite on the oil-expulsion efficiency of the Kreyenhagen Shale, San Joaquin Basin, California, based on hydrous-pyrolysis experiments. AAPG Bull. 2014, 98, 1091–1109. [Google Scholar] [CrossRef]
  8. Clauer, N.; Lewan, M.D.; Dolan, M.P.; Chaudhuri, S.; Curtis, J.B. Mineralogical, chemical and K-Ar changes in Kreyenhagen Shale whole rocks and <2 µm clay fractions during natural burial and hydrous-pyrolysis experimental maturation. Geochim. Cosmochim. Acta 2014, 130, 93–112. [Google Scholar]
  9. Cavalcante, F.; Fiore, S.; Piccarreta, G.; Tateo, F. Geochemical and mineralogical approaches to assessing provenance and deposition of shales: A case study. Clay Miner. 2003, 38, 383–397. [Google Scholar] [CrossRef]
  10. Perri, F.; Critelli, S.; Cavalcante, F.; Mongelli, G.; Dominici, R.; Sonnino, M.; De Rosa, R. Provenance signatures for the Miocene volcaniclastic succession of the Tufiti di Tusa Formation, southern Apennines, Italy. Geol. Mag. 2012, 149, 423–442. [Google Scholar] [CrossRef]
  11. Graham, S.A.; Williams, L.A. Tectonic, depositional, and diagenetic history of Monterey Formation (Miocene), central San Joaquin Basin, California. AAPG Bull. Am. Assoc. Petr. Geol. 1985, 69, 385–411. [Google Scholar]
  12. Namson, J.S.; Davis, T.L. Seismically active fold and thrust belt in the San Joaquin Valley, central California. Geol. Soc. Am. Bull. 1988, 100, 257–273. [Google Scholar] [CrossRef]
  13. Grippa, A.; Hurst, A.; Palladino, G.; Iacopini, D.; Lecomte, I.; Huuse, M. Seismic imaging of complex geometry: Forward modelling of sandstone intrusions. Earth Planet. Sci. Lett. 2019, 513, 51–63. [Google Scholar] [CrossRef]
  14. Franzini, M.; Leoni, L.; Saitta, M. Revision di una metodologia analitica per fluorescenza-X, basala sulla correzione complet degli efftti di matrice. Rendiconti della. Soc. It. Min. Petr. 1975, 31, 365–378. [Google Scholar]
  15. Claisse, F. Accurate X-ray fluorescence analysis without internal standards. Norelco Rep. 1957, 4, 3–17. [Google Scholar]
  16. Lezzerini, M.; Tamponi, M.; Bertoli, M. Calibration of XRF data on silicate rocks using chemicals ans in-house standards. Atti Soc. Tosc. Sci. Nat. Mem. 2014, 121, 65–70. [Google Scholar]
  17. Lezzerini, M.; Sartori, F.; Tamponi, M. Effect of amount of material used on sedimentation slides in the control of illite “crystallinity” measurements. Eur. J. Mineral. 1995, 7, 819–823. [Google Scholar] [CrossRef]
  18. Moore, D.M.; Reynolds, R.C., Jr. X-ray Diffraction and Identification and Analysis of Clay Minerals, 2nd ed.; Oxford University Press: Oxford, UK; New York, NY, USA, 1997; 378p. [Google Scholar]
  19. Środoń, J.; Drits, V.A.; McCarty, D.K.; Hsieh, J.C.C.; Eberl, D.D. Quantitative X-ray diffraction analysis of clay-bearing rocks from random preparation. Clay Clay Min. 2001, 49, 514–528. [Google Scholar]
  20. Cavalcante, F.; Fiore, S.; Lettino, A.; Piccaretta, G.; Tateo, F. Illite-smectite mixed layers in sicilide shales and piggy-back deposits of the Gorgoglione Formation (Southern Appenines): Geological inferences. Boll. Soc Geol. It. 2007, 126, 241–254. [Google Scholar]
  21. Krumm, S. The Erlangen geological and mineralogical software collection. Comput. Geosci. 1999, 25, 489–499. [Google Scholar] [CrossRef]
  22. Leoni, L.; Saitta, M.; Sartori, F. Analisi mineralogica quantitative di rocce e sedimenti pelitici mediante combinazione di dati diffrattometrici e dati chimici. Rend. Soc. It. Min. Petr. 1989, 43, 743–756. [Google Scholar]
  23. Cesarano, M.; Bish, D.L.; Cappelletti, P.; Cavalcante, F.; Belviso, C.; Fiore, S. Quantitative mineralogy of clay-rich siliciclastic landslide terrain of the Sorrento Penisula, Italy, using a combined XRPD and XRF approach. Clay Clay Min. 2018, 66, 353–369. [Google Scholar] [CrossRef]
  24. McLennan, S.M.; Taylor, S.R.; Hemming, S.R. Composition, differentiation, and evolution of continental crust: Constraints from sedimentary rocks and heat flow. In Evolution and Differentiation of the Continental Crust; Brown, M., Rushmer, T., Eds.; Cambridge University Press: Cambridge, UK, 2006; pp. 92–134. [Google Scholar]
  25. Nesbitt, H.W.; Young, G.M. Early Proterozoic climates and plate motions inferred from major element chemistry of lutites. Nature 1982, 299, 715–717. [Google Scholar] [CrossRef]
  26. Grim, R.E.; Gȕven, N. Bentonites: Geology, Mineralogy, Properties and Uses. Developments in Sedimentology 24; Elsevier Scientific: Amsterdam, The Netherlands, 1978; 256p. [Google Scholar]
  27. Nadeau, P.H.; Reynolds, R.C., Jr. Volcanic components in pelitic sediments. Nature 1981, 294, 72–74. [Google Scholar] [CrossRef]
  28. Chamley, H. Clay Sedimentology; Springer: Berlin, Germany, 1989; 623p. [Google Scholar]
  29. Deconnick, J.F.; Chamley, H. Diversity of smectite origins in late Cretaceous sediments: Example of chalks from northern France. Clay Min. 1995, 30, 365–379. [Google Scholar] [CrossRef]
  30. Deepthy, R.; Balakrishnan, S. Climatic control on clay mineral formation: Evidence from weathering profiles developed on either side of the Western Ghats. J. Earth Syst. Sci. 2005, 114, 545–556. [Google Scholar] [CrossRef]
  31. Fisher, G.B.; Ryan, P.C. The smectite-to-disordered kaolinite transition in a tropical soil chronosequence, Pacific Coast, Costa Rica. Clay Clay Min. 2006, 54, 571–586. [Google Scholar] [CrossRef]
  32. Guimarães, E.M. Greywacke weathering under tropical climate: Chemical and mineralogical changes (example from central Brazil). In Proceedings of the 19th World Congress of Soil Science, Soil Solutions for a Changing World, Brisbane, Australia, 1–6 August 2010; pp. 24–27. [Google Scholar]
  33. Barth, A.P.; Walker, J.D.; Wooden, J.L.; Riggs, N.R.; Schweikert, R.A. Birth of the Sierra Nevada magmatic arc: Early Mesozoic plutonism and volcanism in the east-central Sierra Nevada of California. Geosphere 2011, 7, 877–897. [Google Scholar] [CrossRef]
  34. Ingersoll, R.V. Initiation and evolution of the Great Valley forearc basin of northern and central California, USA. Geol. Soc. Lond. Spec. Publ. 1982, 10, 459–467. [Google Scholar] [CrossRef]
  35. Cassel, E.J.; Grove, M.; Graham, S.A. Eocene drainage evolution and erosion of the Sierra Nevada batholith across northern California and Nevada. Am. J. Sci. 2012, 312, 117–144. [Google Scholar] [CrossRef]
  36. McInherney, F.A.; Wing, S. A perturbation of carbon cycle, climate, and biosphere with implications for the future. Annu. Rev. Earth Planet. Sci. 2011, 39, 489–516. [Google Scholar] [CrossRef] [Green Version]
  37. Peterson, G.L.; Abbott, P.L. Mid-Miocene climatic change, southwestern California and northwestern Baja California. Paleogeogr. Paleoclimatol. Paleoecol. 1979, 26, 73–87. [Google Scholar] [CrossRef]
  38. Bestland, E.A.; Retallack, G.J.; Swisher, C.C., III. Stepwise climate change recorded in Eocene-Oligocene paleosol sequences from central Oregon. J. Geol. 1997, 105, 153–172. [Google Scholar] [CrossRef]
  39. Brown, G. Associated Minerals. In X-ray Structures of Clay Minerals and Their X-ray Identification; Brindley, G.W., Brown, G., Eds.; Mineralogical Society of Great Britain and Ireland: London, UK, 1984; pp. 361–410. [Google Scholar]
  40. Wilson, M.J. The structure of opal-CT revisited. J. Non-Cryst. Solids 2014, 405, 68–75. [Google Scholar] [CrossRef]
  41. Wilson, M.J.; Russell, J.D.; Tait, J.M. A new interpretation of disordered alpha cristobalite. Contrib. Mineral. Petrol. 1974, 47, 1–6. [Google Scholar] [CrossRef]
  42. Nathan, Y.; Flexer, A. Clinoptilolite, paragenesis and stratigraphy. Sedimnetology 1977, 24, 845–855. [Google Scholar] [CrossRef]
  43. Curtis, C.D.; Cornell, W.C. Unusual occurrence of clinoptilolite: Fresno County, California. Geol. Soc. Am. Bull. 1972, 83, 833–838. [Google Scholar] [CrossRef]
  44. Stonecipher, S.A. Origin, distribution and diagenesis of phillipsite and clinoptilolite in deepsea sediments. Chem. Geol. 1976, 17, 307–318. [Google Scholar] [CrossRef]
  45. Levy, S.S.; O’Neil, J.R. Moderate-temperature zeolitic alteration in a cooling pyroclastic deposit. Chem. Geol. 1989, 76, 321–326. [Google Scholar] [CrossRef]
  46. Lander, R.H.; Hay, R.L. Hydrogeologic control on zeolitic diagenesis of the White River sequence. Geol. Soc. Am. Bull. 1993, 105, 361–376. [Google Scholar] [CrossRef]
  47. Merino, E.; Wang, Y.; Deloule, E. Genesis of agates in flood basalts: Twisting of chalcedony fibres and trace element geochemistry. Am. J. Sci. 1995, 295, 1156–1176. [Google Scholar] [CrossRef]
  48. Hurst, A.; Morton, A.C.; Scott, A.; Vigorito, M.; Frei, D. Heavy mineral assemblages in sandstone intrusions: Panoche Giant Injection Complex, California. J. Sediment. Res. 2017, 87, 1–18. [Google Scholar] [CrossRef] [Green Version]
  49. Scheirer, H.A.; Magoon, L.B. Petroleum Systems and Geologic Assessment of Oil and Gas in the San Joaquin Basin Province, California. In USGS Professional Papers; US Geological Survey: Reston, VA, USA, 2007; p. 1713. [Google Scholar]
  50. Dolan, M.P. The Role of Smectite in Petroleum Formation: Comparing Natural and Experimental Thermal Maturation. Master’s Thesis, Colorado School of Mines, Golden, CO, USA, 1998; 217p. [Google Scholar]
  51. Farmer, V.C. Water on particle surfaces. In The Chemistry of Soil Constitutents; Greenland, D.J., Hayes, M.H.B., Eds.; John Wiley and Sons: Chichester, UK, 1978; pp. 405–448. [Google Scholar]
Figure 1. The location of the giant sand injection complexes in central California and a geological map. The Panoche Giant Injection Complex (PGIC) [1] occurs within Upper Cretaceous and Danian strata Panoche and Moreno formations. The white bar in the Panoche Hills is the approximate line of the section sampled and represented in Figure 3a. The Tumey Giant Injection Complex (TGIC) occurs within the Eocene Kreyenhagen Formation. The white bar along Monocline Ridge is the approximate line of the section sampled and represented in Figure 3b.
Minerals 11 00071 g001
Figure 2. The geological cross-section of the upper part of the Great Valley Sequence in the area from the Panoche to Ciervo hills with locations of Figure 3a,b. The term Un (red) refers to regionally developed unconformities. For simplification, sandstone intrusions are omitted from this figure. Abundant turbiditic sandstone is depicted in the Maastrichtian to Paleogene.
Minerals 11 00071 g002
Figure 3. Simplified vertical sections through (a) the PGIC and (b) the TGIC; see Figure 1 and Figure 2 for locations. Sample locations are marked.
Minerals 11 00071 g003
Figure 4. X-ray diffractograms for whole-rock samples: (a) Upper Kreyenhagen, (b) Lower Kreyenhagen, and (c) Moreno Formation. Mineral abbreviations are as in Table 1. Sample locations are shown in Figure 3.
Minerals 11 00071 g004
Figure 5. The A–CN–K plot of samples from Table 2 excluding those enriched in carbonate.
Minerals 11 00071 g005
Figure 6. X-ray diffractograms of the clay mineralogy (<2 μm fraction) analysed as glycolated oriented mounts and using Cu–Kα radiation, °2θ on the horizontal axis, and counts per second (cps) on the vertical axis. (a) the Moreno Fm, (b) the Lower Kreyenhagen, and (c) the Upper Kreyenhagen. Mineral abbreviations are as in Table 1. Sample locations are shown in Figure 3.
Minerals 11 00071 g006
Figure 7. Scanning electron microscopy (SEM) images of the bio siliceous mudstone sample (TH-01) from the Upper Kreyenhagen, Monocline Ridge (TGIC, Figure 3b). The sample is consolidated. (a) Crushed parts of a large diatom test in which the pristine opal A micro-texture is preserved. The surrounding bio silicious groundmass is largely comminuted fragments from crushed diatom shells; scale bar = 19.6 μm. (b) Micro-porous test fragments (opal A) in a groundmass of crushed tests; scale bar = 10 μm.
Minerals 11 00071 g007aMinerals 11 00071 g007b
Figure 8. SEM images of the bio siliceous mudstone sample (RAC5) from the Marca Member in Right Angle Canyon (PGIC, Figure 3a). The sample is poorly consolidated and contains recrystallized test fills and more finely comminuted opaline particles, none of which preserve micro-textures associated with opal A. (a) Tightly packed bio silicious particles, often <5 μm across but with occasional elongate (>20 μm) gypsum (b) and recrystalized tests (c); scale bar = 20 μm. (b) Relic bio silicious tests (now opal CT) with gypsum as shown in (a); scale bar = 5 μm. (c) An ovoid crystalline fill of a diatom test shown in (a) with no evidence of micro-texture associated with opal A; scale bar = 5 μm. (d) Micro-textures formed by crystallization within a diatom test. Prevailing rounded, blocky equilateral and less common approximately spherical μm-scale crystals with micropores generally in the 0.1 μm to 0.2 μm range; scale bar = 10 μm.
Minerals 11 00071 g008
Table 1. Whole-rock mineralogy (wt %) for Kreyenhagen and Moreno formations estimated from X-ray diffraction (XRD) analysis. Qtz = quartz; Op CT = opal CT; Opal A? = amorphous material and probably opal A; Crist = cristobalite; K-feld = K-feldspar; Pl = plagioclase; Cal = calcite; Dol = dolomite; Clin = clinoptilolite; Gy = gypsum; Sm = smectite; Ill = illite; Kao = kaolinite; Σ Phy = total phyllosilicates.
FormationMemberAgeSampleNon PhyllosilicatesPhyllosilicates
Qtz Op CTOpale A?Cristk-FeldPlCalDolClinGySmIll Kao∑Phy
Kreyenhagen Foramtion Upper memberEarly Oligocene
Minerals 11 00071 i001
Middle Eocene
TH-018.10.024.04.02.03.90.00.00.00.048.05.05.058.0
GKR-068.80.028.03.51.74.00.00.00.00.048.03.03.054.0
GKR-0514.20.04.04.55.07.00.00.00.00.058.02.54.865.3
GKR-046.053.45.00.01.53.50.00.00.00.025.62.52.530.6
GKR-0311.58.96.00.01.43.80.00.00.60.058.92.86.067.7
EO4-1411.85.20.02.51.02.50.00.00.00.069.02.06.077.0
EO4-1315.70.00.02.00.51.50.00.00.00.071.74.34.380.3
EO4-1210.07.38.02.02.12.80.00.00.00.060.02.65.267.8
GKR-0210.03.90.02.72.59.00.00.00.01.062.98.00.070.9
EO4-1113.52.00.02.51.95.50.00.00.70.061.43.59.073.9
EO4-1013.50.00.00.03.33.00.00.02.00.069.93.54.978.3
Min Value6.00.00.00.00.51.50.00.00.00.025.62.00.030.6
Max Value 15.753.428.04.55.09.00.00.02.01.071.78.09.080.3
Average11.27.36.82.22.14.20.00.00.30.157.63.64.665.8
St. dev2.915.69.91.61.22.20.00.00.60.313.21.72.314.3
Lower memberEO4-0911.50.00.01.44.44.80.00.02.30.064.33.38.075.6
EO4-086.243.80.00.03.512.50.00.07.50.023.62.90.026.5
GKR-015.070.30.00.00.82.56.40.00.00.012.03.00.015.0
EO4-079.00.00.04.45.913.10.00.01.20.063.33.10.066.4
EO4-067.538.60.00.03.07.014.00.03.20.021.75.00.026.7
EO4-0511.00.00.01.90.08.30.00.00.00.068.85.05.078.8
EO4-042.00.00.00.00.01.50.072.00.00.024.50.00.024.5
EO4-033.30.00.00.00.02.830.50.03.20.057.13.20.060.3
EO4-0218.90.00.00.03.05.70.00.04.00.054.06.08.468.4
EO4-018.50.00.00.02.17.512.00.04.00.055.18.12.866.0
Min Value2.00.00.00.00.01.50.00.00.00.012.00.00.015.0
Max Value 18.970.30.04.45.913.130.572.07.50.068.88.18.478.8
Average8.315.30.00.82.36.66.37.22.50.044.44.02.450.8
St. dev4.825.90.01.52.14.010.122.82.40.021.42.23.524.5
Moreno ForamtionDos PalosLower Paleocene
Minerals 11 00071 i002
Upper Cretaceous
RAC918.00.00.02.49.510.50.00.00.00.050.62.56.559.6
RAC811.50.00.04.52.910.00.00.00.00.062.22.36.671.1
RAC712.50.00.03.02.07.00.00.00.00.069.01.55.075.5
MarcaRAC612.515.00.05.01.05.50.00.00.00.059.02.00.061.0
RAC513.512.50.04.02.55.00.00.00.00.056.03.03.562.5
Tierra LamaRAC413.27.20.03.74.07.00.00.00.00.061.81.41.764.9
RAC37.058.00.00.01.53.50.00.00.00.028.02.00.030.0
RAC212.03.50.03.63.08.00.00.00.00.067.92.00.069.9
RAC120.00.00.01.55.07.00.00.00.00.064.02.50.066.5
Min Value7.00.00.00.01.03.50.00.00.00.028.01.40.030.0
Max Value 20.058.00.05.09.510.50.00.00.00.069.03.06.675.5
Average13.410.70.03.13.57.10.00.00.00.057.62.12.662.3
St. dev3.818.60.01.62.62.30.00.00.00.012.50.52.913.2
Table 2. Major element chemistry for samples shown in Table 1. LOI = loss on ignition. CIA = chemical index of alteration [25].
FormationMemberAgeSample Na2OMgOAl2O3SiO2P2O3K2OCaOTiO2MnOFe2O3LOICIA
Kreyenhagen Foramtion Upper memberEarly Oligocene
Minerals 11 00071 i001
Middle Eocene
TH-010.931.8612.7165.070.481.140.000.830.037.689.2786.0
GKR-060.972.6312.0868.990.301.570.000.730.033.758.9582.6
GKR-051.432.7015.2063.050.371.930.010.760.065.069.4381.9
GKR-040.320.977.2977.340.480.900.000.550.034.048.0885.7
GKR-030.841.8714.7063.470.591.360.000.950.033.1013.0987.0
EO4-140.852.2316.7162.290.301.530.001.000.033.6411.2287.5
EO4-130.611.7417.7162.470.321.890.240.860.033.8110.3286.6
EO4-120.671.4315.4264.840.361.580.000.970.032.6412.0687.3
GKR-022.013.4113.8555.450.471.980.640.820.056.9114.4174.9
EO4-111.171.8516.5156.250.531.740.000.810.033.7117.4085.0
EO4-100.921.3117.2656.280.242.110.481.040.034.3316.0083.1
Min Value0.320.977.2955.450.240.900.000.550.032.648.0874.95
Max Value 2.013.4117.7177.340.592.110.641.040.067.6817.4087.53
Average0.982.0014.5063.220.401.580.130.850.044.4311.8484.33
St. dev0.450.702.996.300.110.370.230.140.011.563.073.67
Lower memberEO4-091.021.4918.5458.870.262.500.520.910.034.4711.3982.1
EO4-081.861.648.4170.940.451.350.000.600.032.5212.2072.4
GKR-010.941.073.8081.440.280.593.380.380.041.546.54n.c.
EO4-072.052.5715.0456.300.712.080.020.880.034.5115.8178.4
EO4-061.131.787.6064.550.211.487.800.490.043.4611.46n.c.
EO4-051.843.2916.4255.950.242.420.450.930.057.8410.5777.7
EO4-040.6116.566.7618.320.140.8722.090.310.081.3732.89n.c.
EO4-031.812.2211.4939.040.581.7517.200.500.054.4420.92n.c.
EO4-021.881.2917.0659.750.182.210.140.960.043.8912.6080.1
EO4-012.062.0814.9347.980.312.266.850.800.045.6317.06n.c.
Min Value0.611.073.8018.320.140.590.000.310.031.376.5472.38
Max Value 2.0616.5618.5481.440.712.5022.090.960.087.8432.8982.11
Average1.523.3912.0055.310.341.755.850.680.043.9715.1478.14
St. dev0.534.675.0917.430.190.667.900.250.011.937.383.65
Moreno ForamtionDos PalosLower Paleocene
Minerals 11 00071 i002
Upper Cretaceous
RAC92.051.7719.5962.710.032.620.250.800.032.527.6379.9
RAC81.942.0721.1859.460.032.100.140.790.053.868.3883.5
RAC71.511.9519.3863.280.121.920.170.870.042.548.2284.3
Marca RAC61.042.8913.1566.550.321.350.000.760.033.4110.5084.6
RAC51.171.3115.9469.330.451.470.350.820.032.176.9684.2
Tierra LamaRAC41.421.4715.8768.590.272.020.170.950.032.197.0281.5
RAC30.591.127.2481.120.780.920.100.430.041.995.6781.8
RAC21.261.7917.1466.420.202.000.640.930.031.947.6581.5
RAC11.531.9717.9764.070.142.200.580.800.032.438.2880.7
Min Value0.591.127.2459.460.030.920.000.430.031.945.6779.93
Max Value 2.052.8921.1881.120.782.620.640.950.053.8610.5084.62
Average1.391.8216.3866.840.261.840.270.790.032.567.8182.44
St. dev0.450.524.186.180.240.510.220.150.010.651.321.75
Table 3. Clay minerals (wt %) for Kreyenhagen and Moreno formations estimated from XRD analyses of the <2 μm fractions. Abbreviations as in Table 1. Sample locations are in Figure 3.
FormationMemberAgeSample Clay Minerals
SmIllKao
Kreyenhagen Foramtion Upper memberEarly Oligocene
Minerals 11 00071 i001
Middle Eocene
TH-019128
GKR-069343
GKR-059244
GKR-049522
GKR-039316
EO4-1487111
EO4-1387211
EO4-129226
GKR-029270
EO4-1185312
EO4-1071524
Min Value71.41.30.4
Max Value 95.37.323.6
Average89.03.18.0
St. dev6.61.96.5
Lower memberEO4-0970822
EO4-089370
GKR-019550
EO4-079351
EO4-069370
EO4-059154
EO4-04781110
EO4-039334
EO4-0271227
EO4-0184511
Min Value70.02.00.0
Max Value 94.511.227.2
Average86.15.88.0
St. dev9.72.69.8
Moreno ForamtionDos PalosLower Paleocene
Minerals 11 00071 i002
Upper Cretaceous
RAC99218
RAC89515
RAC79415
Marca RAC69811
RAC59514
Tierra LamaRAC49612
RAC39280
RAC29821
RAC19811
Min Value91.80.60.0
Max Value 98.47.77.6
Average95.41.82.9
St. dev2.42.22.6
Publisher’s Note: MDPI stays neutral with regard to jurisdictional claims in published maps and institutional affiliations.

