Article

Garnet Characteristics Associated with Jiama Porphyry-Skarn Cu Deposit 1# Skarn Orebody, Tibet, Using Thermal Infrared Spectroscopy

1
College of Earth Science, Chengdu University of Technology, Chengdu 610059, China
2
Qinghai-Tibet Plateau Institute of Resources and Environment, Chengdu University of Technology, Chengdu 610059, China
3
MNR Key Laboratory of Metallogeny and Mineral Assessment, Institute of Mineral Resources, CAGS, Beijing 100037, China
4
Natural Geological Data Center of China Geological Survey, Langfang 065000, China
*
Author to whom correspondence should be addressed.
Minerals 2021, 11(1), 5; https://doi.org/10.3390/min11010005
Submission received: 23 October 2020 / Revised: 18 December 2020 / Accepted: 21 December 2020 / Published: 23 December 2020

Abstract

:
Field measurements of the thermal infrared (TIR) reflectance from drill hole samples proved to be an effective method to map variations in garnet species associated with hydrothermal alteration zonation of the Jiama porphyry-skarn Cu deposit 1# skarn orebody, Tibetan Plateau, China. The TIR mineral spectral information was combined with electron probe micro-analysis (EPMA) measurements to provide geological insights on effectively determining (a) garnet end components and providing a format for further research on the type and genesis of the deposit; (b) the significance of the characteristic spectrum of garnet to the variation of mineralization environment; (c) the relationship between the characteristic spectrum of garnet and Fe/Al content; (d) the garnet characteristic spectrum to the economic mineralization. The results suggest that garnet characteristics of the thermal infrared spectrum can be used as an indicator for skarn deposit prospecting.

1. Introduction

Garnet occurs in a large variety of magmatic and metamorphic rocks [1] and can form major or minor accessory phases in many hydrothermal deposits [2]. Numerous studies have reported that hydrothermal garnets record the process of fluid-rock interactions and can, therefore, reveal the physicochemical conditions of hydrothermal mineralisation, which include the fluid temperature, oxygen fugacity, fluid flow rate, pH and chemical compositions [3,4,5,6,7]. In the last decade, many studies have been conducted using garnet geochemical composition, U-Pb geochronology [8,9,10] and a fluid inclusion temperature measurement [11] to gain an understanding of the mechanism of trace element substitution in garnet mineral compositions. These methods can also be used to determine ore-forming age [12,13] and hydrothermal fluid evolution processes [14,15] during garnet growth.
Reflectance spectroscopy is used increasingly in the resources sector as a tool for both greenfield and brownfield exploration, as well as for resource characterisation [16]. In recent years, a large number of successful applications of short-wave infrared technology for mapping minerals associated with different stages of hydrothermal alteration have been developed [17,18,19,20,21,22,23]. Due to the physiochemistry and the respective vibrational modes of the minerals, short-wave infrared technology can only identify relatively low-temperature minerals containing OH- (sheet silicates or OH-bearing sulphates) or carbonate complexes (salts or calcite) [24,25,26]. It shows great limitations for skarn minerals such as felspars, pyroxenes and garnets under a higher temperature [27]. Thermal infrared reflectance (TIR) (TIR: 6500 nm to 14500 nm) provides opportunities for mapping exchange vectors in nominally anhydrous silicates (garnets, feldspars and pyroxenes) [28], as well as carbonates [29]. Thermal infrared reflectance spectroscopy has only been used for the analysis of mineral systems in a few cases, such as porphyry-skarn [30], orogenic gold [31] and VMS-style mineralisation [32].
Jiama is a giant porphyry-skarn Cu deposit of great economic value and scientific research significance in the eastern Gangdise metallogenic belt. This geological area completely preserves the information relating to the formation and evolution of the skarn. A significant amount of garnet has been found in field exploration and subsequent sample testing. This paper uses TIR and electron probe micro analysis (EPMA) to study the garnet characteristics as the indicator for skarn deposits. It includes: (1) determining the garnet spectral characteristics by TIR, (2) completing the garnet mapping and (3) interpreting the relationship between garnet spectral characteristics and the respective ore-forming processes.

2. Geological Setting

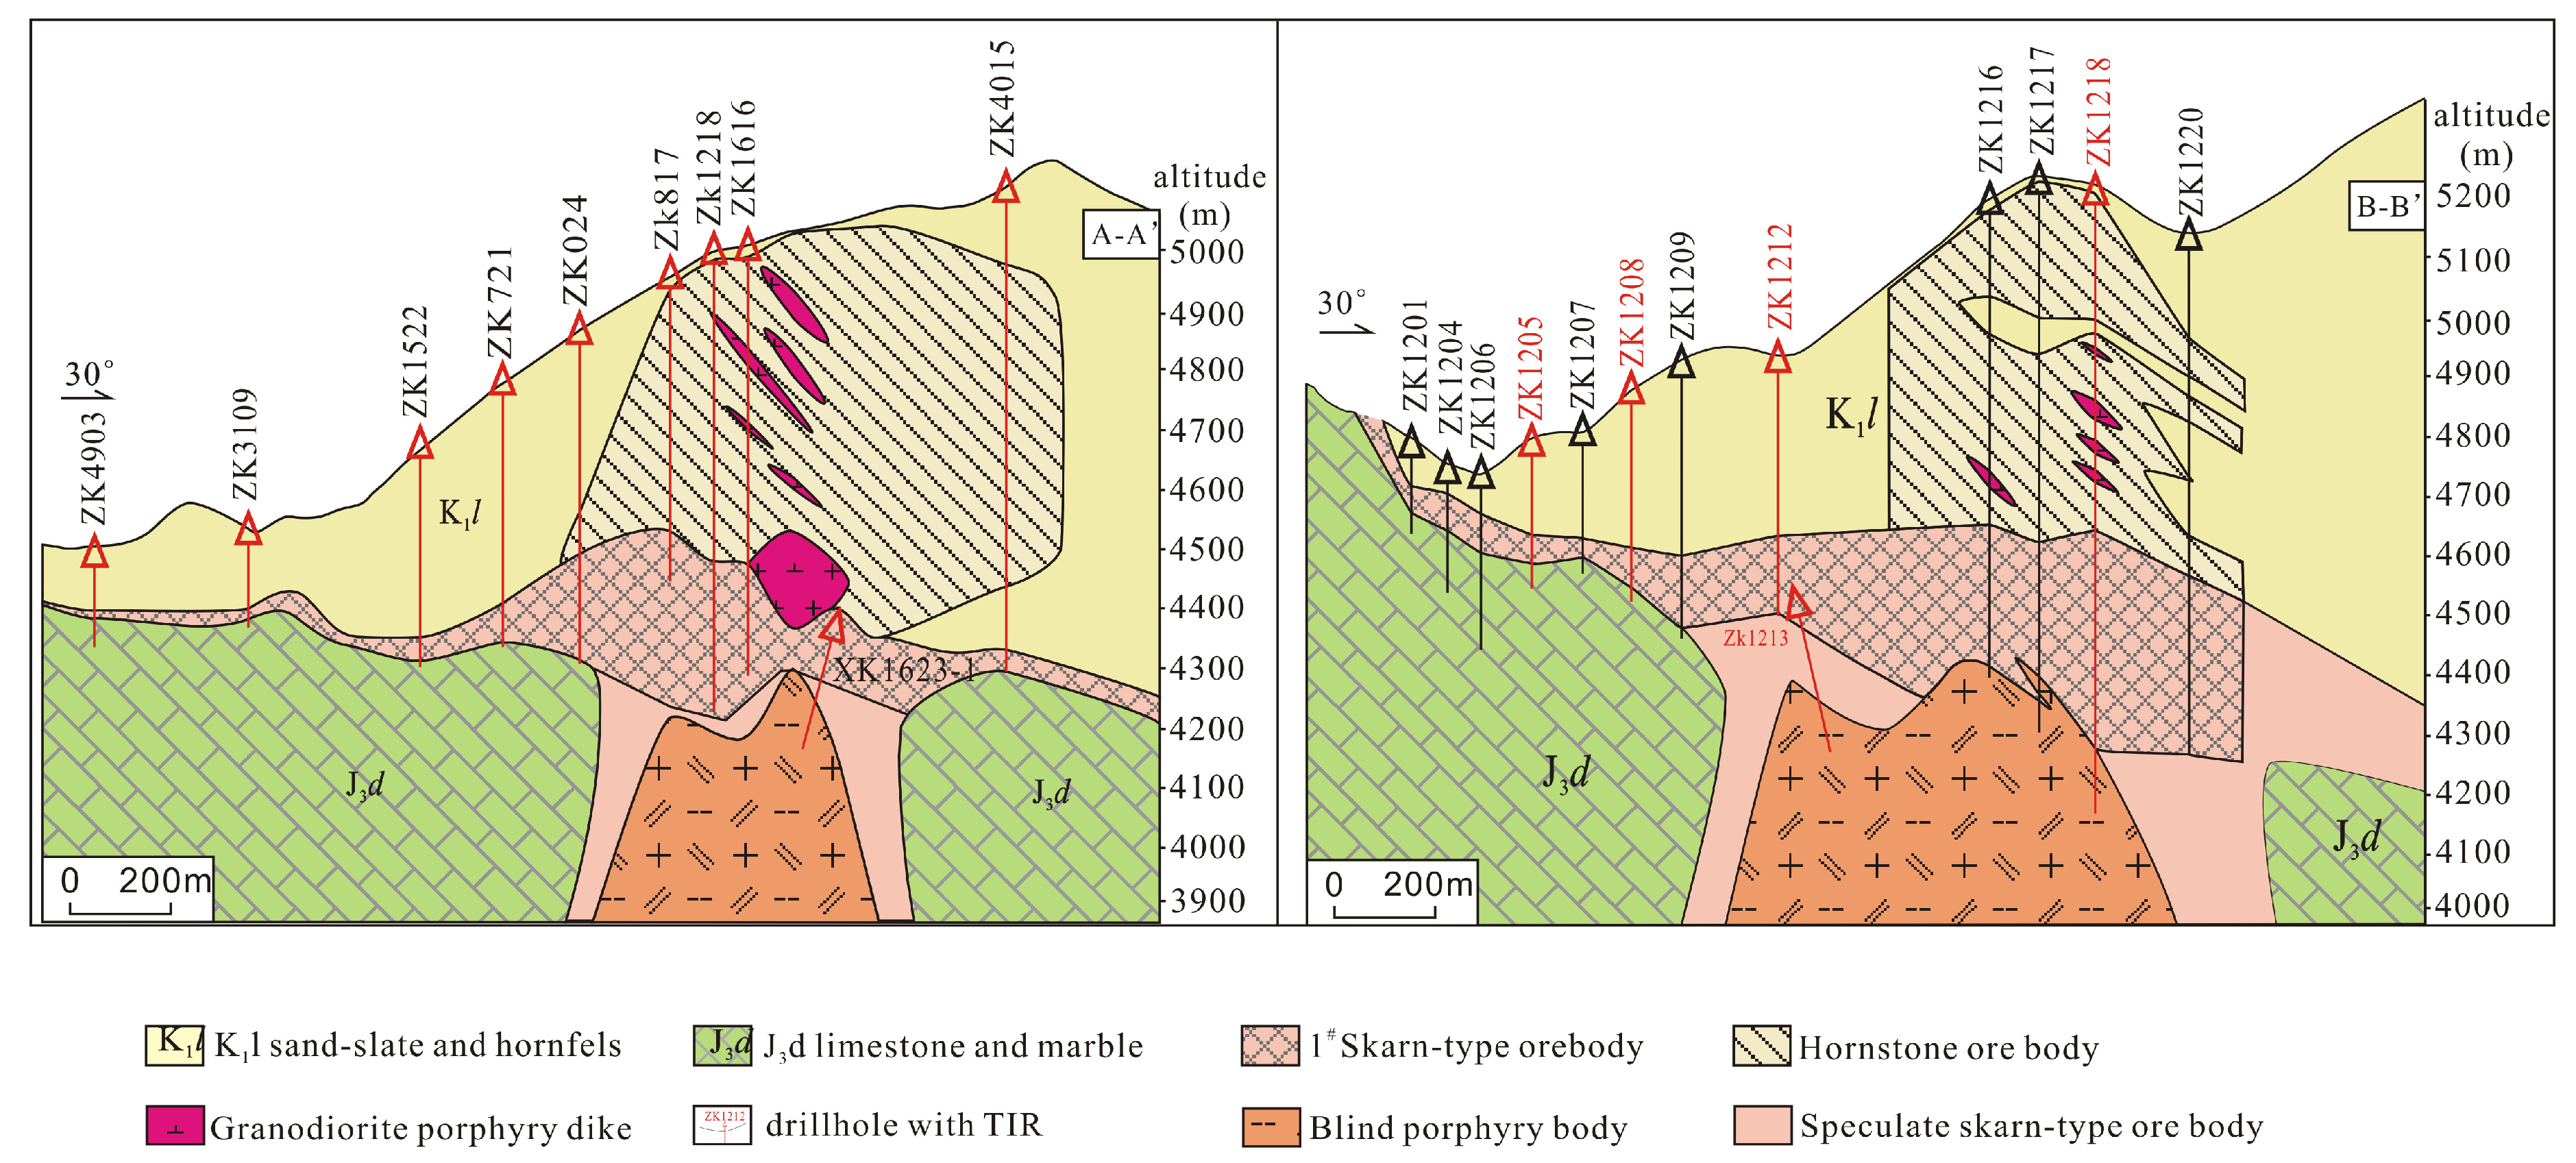
2.1. Deposit Geology

The Jiama mining area is located in the eastern section of the Gangdise metallogenic belt in the Tethys structural domain in Tibet [33] (Figure 1a). The strata exposed in the mining area mainly comprise the Lower Cretaceous Linbuzong Formation (K1l) and the Upper Jurassic Duodigou Formation (J3d), as well as a small amount of Quaternary (Q) (Figure 1b). The Jiama mining area can be observed between the Duodigou and Linbuzong formations [34,35,36,37].
Magmatic rocks are well-developed and widely distributed. This rock type exposes a huge area of plutons in addition to a thick layer of sedimentary rocks of volcanic origin. It is distributed to the north of the Yajiang fault, which is also an important part of the Gangdese volcanic arc [33,38]. Magmatic rocks in the mining area are observed as veins in shallow formations, whereas there are ore-bearing porphyries in the deep formations. The main types of rock and their emplacement order are quartz diorite porphyry → granite porphyry → monzonitic granite porphyry → granodiorite porphyry. The main diagenetic age of magmatic rocks is concentrated in the range 16.5–15.0 Ma [39,40].
Contact metamorphism develops around plutons, generating both hornfels and skarn alteration [41]. Magmatism, resulting in hydrothermal alteration, occurs along structurally controlled pathways, yielding a variety of metasomatic alteration minerals, including skarn (e.g., garnet, pyroxene and wollastonite), silicic, phyllic (e.g., white mica), propylitic (e.g., epidote, chlorite and carbonate) and argillic (e.g., kaolinite and montmorillonite) minerals. The wide range of mineralogy reflects the mobility of elements such as Si, K, Ca, Al, Fe and Mg, as well as compounds such as H2O and CO2 [20].
The ore-controlling structures in the Jiama deposit mainly consist of a thrust nappe structure and a gliding nappe structure. The nappe structure was the primary control on porphyry intrusions and on the formation of the 1# skarn, hornfels and porphyry orebodies. The gliding nappe structure controlled the formation of the 2# skarn orebody [42,43].
The Jiama copper polymetallic deposit is mainly composed of copper metallogenic elements, such as symbiotic molybdenum, lead, zinc, gold and silver. These observations can be derived according to the different ore-forming surrounding rocks produced by the main and symbiotic minerals. Jiama copper polymetallic deposits are mainly composed of three types of ore bodies [41]: Cu–polymetallic skarns, Cu–Mo hornfels and Mo ± Cu porphyry mineralisation (Figure 2). The different structural settings described above further define two subtypes of skarn mineralisation, referred to as 1# skarn and 2# skarn [41,44].

2.2. 1# Skarn Orebody

The 1# skarn orebody is formed in the contacting zone between porphyry mineral formations and marble, as well as in the interlayer detachment zone between the Linbuzong Formation hornfels and the Duodigou Formation marbles [45] (Figure 3). The orebody occurs as a lamellar, or thick plate, and generally lies at an elevation of 4000 m to 5000 m. It strikes west-northwest and dips to the northeast. The upper part of the orebody dips at a steep angle (on average 60–80°), whereas the lower part is much flatter, with an average dip of 10–30° (Figure 3). The thickness of the skarn orebody controlled by the interlayer detachment zone is generally 10 m to 50 m; however, this reaches 50 m to 100 m in the anticlinal core. The thickness of the skarn orebody controlled by the intrusive body and marble contact belt is typically greater than 100 m, with a maximum of 328 m [41].
The average grade of 1# skarn orebody is approximately Cu @ 0.8%, Mo @ 0.06%, Pb + Zn @ 2.0%, Au @ 0.26g/t and Ag @ 15 g/t [45]. Cu mineralisation in the skarn occurs as massive, disseminated vein chalcopyrite with bornite (Figure 4a,b). Mo mineralisation occurs as disseminated molybdenite (Figure 4c). Pb–Zn mineralisation is dominated by banded and disseminated galena and sphalerite (Figure 4d). This mineralisation is found above an elevation of 4800 m and is distributed throughout the outer zone of the entire 1# skarn orebody. Au and Ag are hosted mainly within chalcopyrite, bornite and other Cu minerals and are by-products of Cu extraction. The gangue minerals in the 1# skarn orebody are mainly skarn minerals (e.g., garnet, wollastonite and epidote) and quartz (Figure 4e,f).
Previous studies have shown that a set of typical calcareous skarn mineral combinations are developed in Jiama skarn, including garnet, diopside and wollastonite [42,46]. It has been observed that garnet is the most widely distributed and most abundant skarn mineral in the Jiama deposit. Its colour changes significantly and it can be seen in various shades of dark brown, reddish brown, brown, khaki, dark green, emerald green and light yellowish green. Garnet mainly occurs as massive strip and vein structures (Figure 4f–j). It shows multi-stage development due to the observation of ring-shaped hyperplasia of garnet (Figure 4f), where the early ore-free garnet skarn was randomly cut through the later vein-like ore-bearing garnet (Figure 4e). The garnet ring structure (Figure 4i) is developed and can be seen in a hand specimen and under the microscope. Under plane polarized light of the microscope, garnet is mainly light brown or yellowish brown. The crystal forms of garnet under the microscope is mostly hexagonal (Figure 4k). Garnet is closely related to chalcopyrite and molybdenite, and metal minerals are mostly filled with garnet particles in other shapes (Figure 4l). The metals can also have gangue minerals or be produced in the skarn with strong silicification (Figure 4e).

3. Methods and Samples

3.1. TIR Technique

More than 1000 samples collected from the 2400 m drill core (ZK1205-ZK1218, ZK4903-ZK4105) in the Jiama deposit were scanned using 2 m intervals across two transects (Figure 3) to generate a cruciform section covering the 1# skarn body. TIR (TIR: 6500 nm to 14500 nm) spectra were measured using a HyLogger3TM at the Natural Geological Data Center of China, Langfang, China. The HyLogger3TM enables the simultaneous collection of hyperspectral reflectance spectra in the visible near infrared (VNIR) (350 nm to 1000 nm), SWIR (1000 nm to 2500 nm) and TIR (6000 nm to 14,500 nm) wavelength ranges [25,47,48]. The TIR wavelength ranges collected using the HyLogger3TM allow rapid mapping of nominally anhydrous minerals (e.g., quartz, feldspar, garnet) by identifying particular absorption features specific to a certain atomic vibration [25,49]. The instrument was operated with a spot size of 10 mm × 14 mm [48]. All the mineral identification databases and comparative analyses were obtained using the The Spectral Assistant (TSA) analysis system. The data enhancement processing was based on the second derivative method, and the extraction of the mineral information was accomplished by script programming.
Figure 5 shows different end member components of garnet spectrums measured by Commonwealth Scientific and Industrial Research Organisation (CSIRO) Canberra, Australia and garnet spectrums in samples, a diagnostic double-peak absorption characteristic from 10,000 nm to 13,000 nm (CSIRO minerals spectral database, CSIRO.2016.). A shift of the garnet-related SiO4 tetrahedra stretching modes between 10,000 nm and 12,000 nm towards shorter wavelengths could be observed [16]. This phenomenon was exacerbated by an increasing grossular component of the andradite series (i.e., increasing Al/Fe) [30].

3.2. EPMA Measurements

Twenty-two typical samples of garnet measured with TIR and selected from each drill hole on the A-A’ section for the scanning electron microscopy (SEM) and electron probe microprobe analysis (EMPA) were directly conducted on the polished thin section that was cut from the hand specimens. Each garnet sample has been observed carefully under a microscope and SEM to investigate their internal textures. For zoned garnets, one measuring point is arranged for each zoning. We then use the average value from the thin section measured by EPMA plotted against the average value of garnets from the core portion from which the thin section has been extracted. Backscatter electron (BSE) images of garnet were obtained at the Guangzhou Tuoyan Analytical Technology Co., Ltd., Guangzhou, China, using an Analytical Scanning Electron Microscope (TESCAN MIRA 3). The chemical composition of garnet was determined by using a 1720 EPMA (SHIMADZU, Japan) at Chengdu Institute of Comprehensive Utilization of Mineral Resources, China Geological Survey, Chengdu, China. Analysis conditions included a 20 nA beam current with 15 kV voltage. The counting time was 10 s for Na, Si and K, 15 s for Ca, and 20 s for Mg, Ti, Al, Mn and Fe. The analyses were calibrated using hematite (Fe), bustamite (Mn), rutile (Ti), microcline (K), clinopyroxene (Si, Ca), plagioclase (Al), olivine (Mg) and anorthoclase (Na) standards. The detection limits for most elements are 0.01 wt%. The precisions are <1% for element concentrations above 10 wt%, <5% for element concentrations between 1 and 10 wt%, and >5% for element concentrations below 1 wt%.

3.3. Cu and Mo Concentrations

This study collects the Cu and Mo data of ZK1205, ZK1208, ZK1212, ZK1213 and ZK1218 on the B-B’ section, and ZK024 on the A-A’ section of the Jiama deposit. The sampling interval is 1 m, and the samples are processed by rod milling to −200 mesh (−0.074 mm) and sent to the Southwest Metallurgical Testing Center, Chengdu, China, for grade analysis. Cu and Mo are dissolved by aqua regia + hydrofluoric acid + perchloric acid and measured by full-spectrum direct reading plasma emission spectrometry.

4. Results

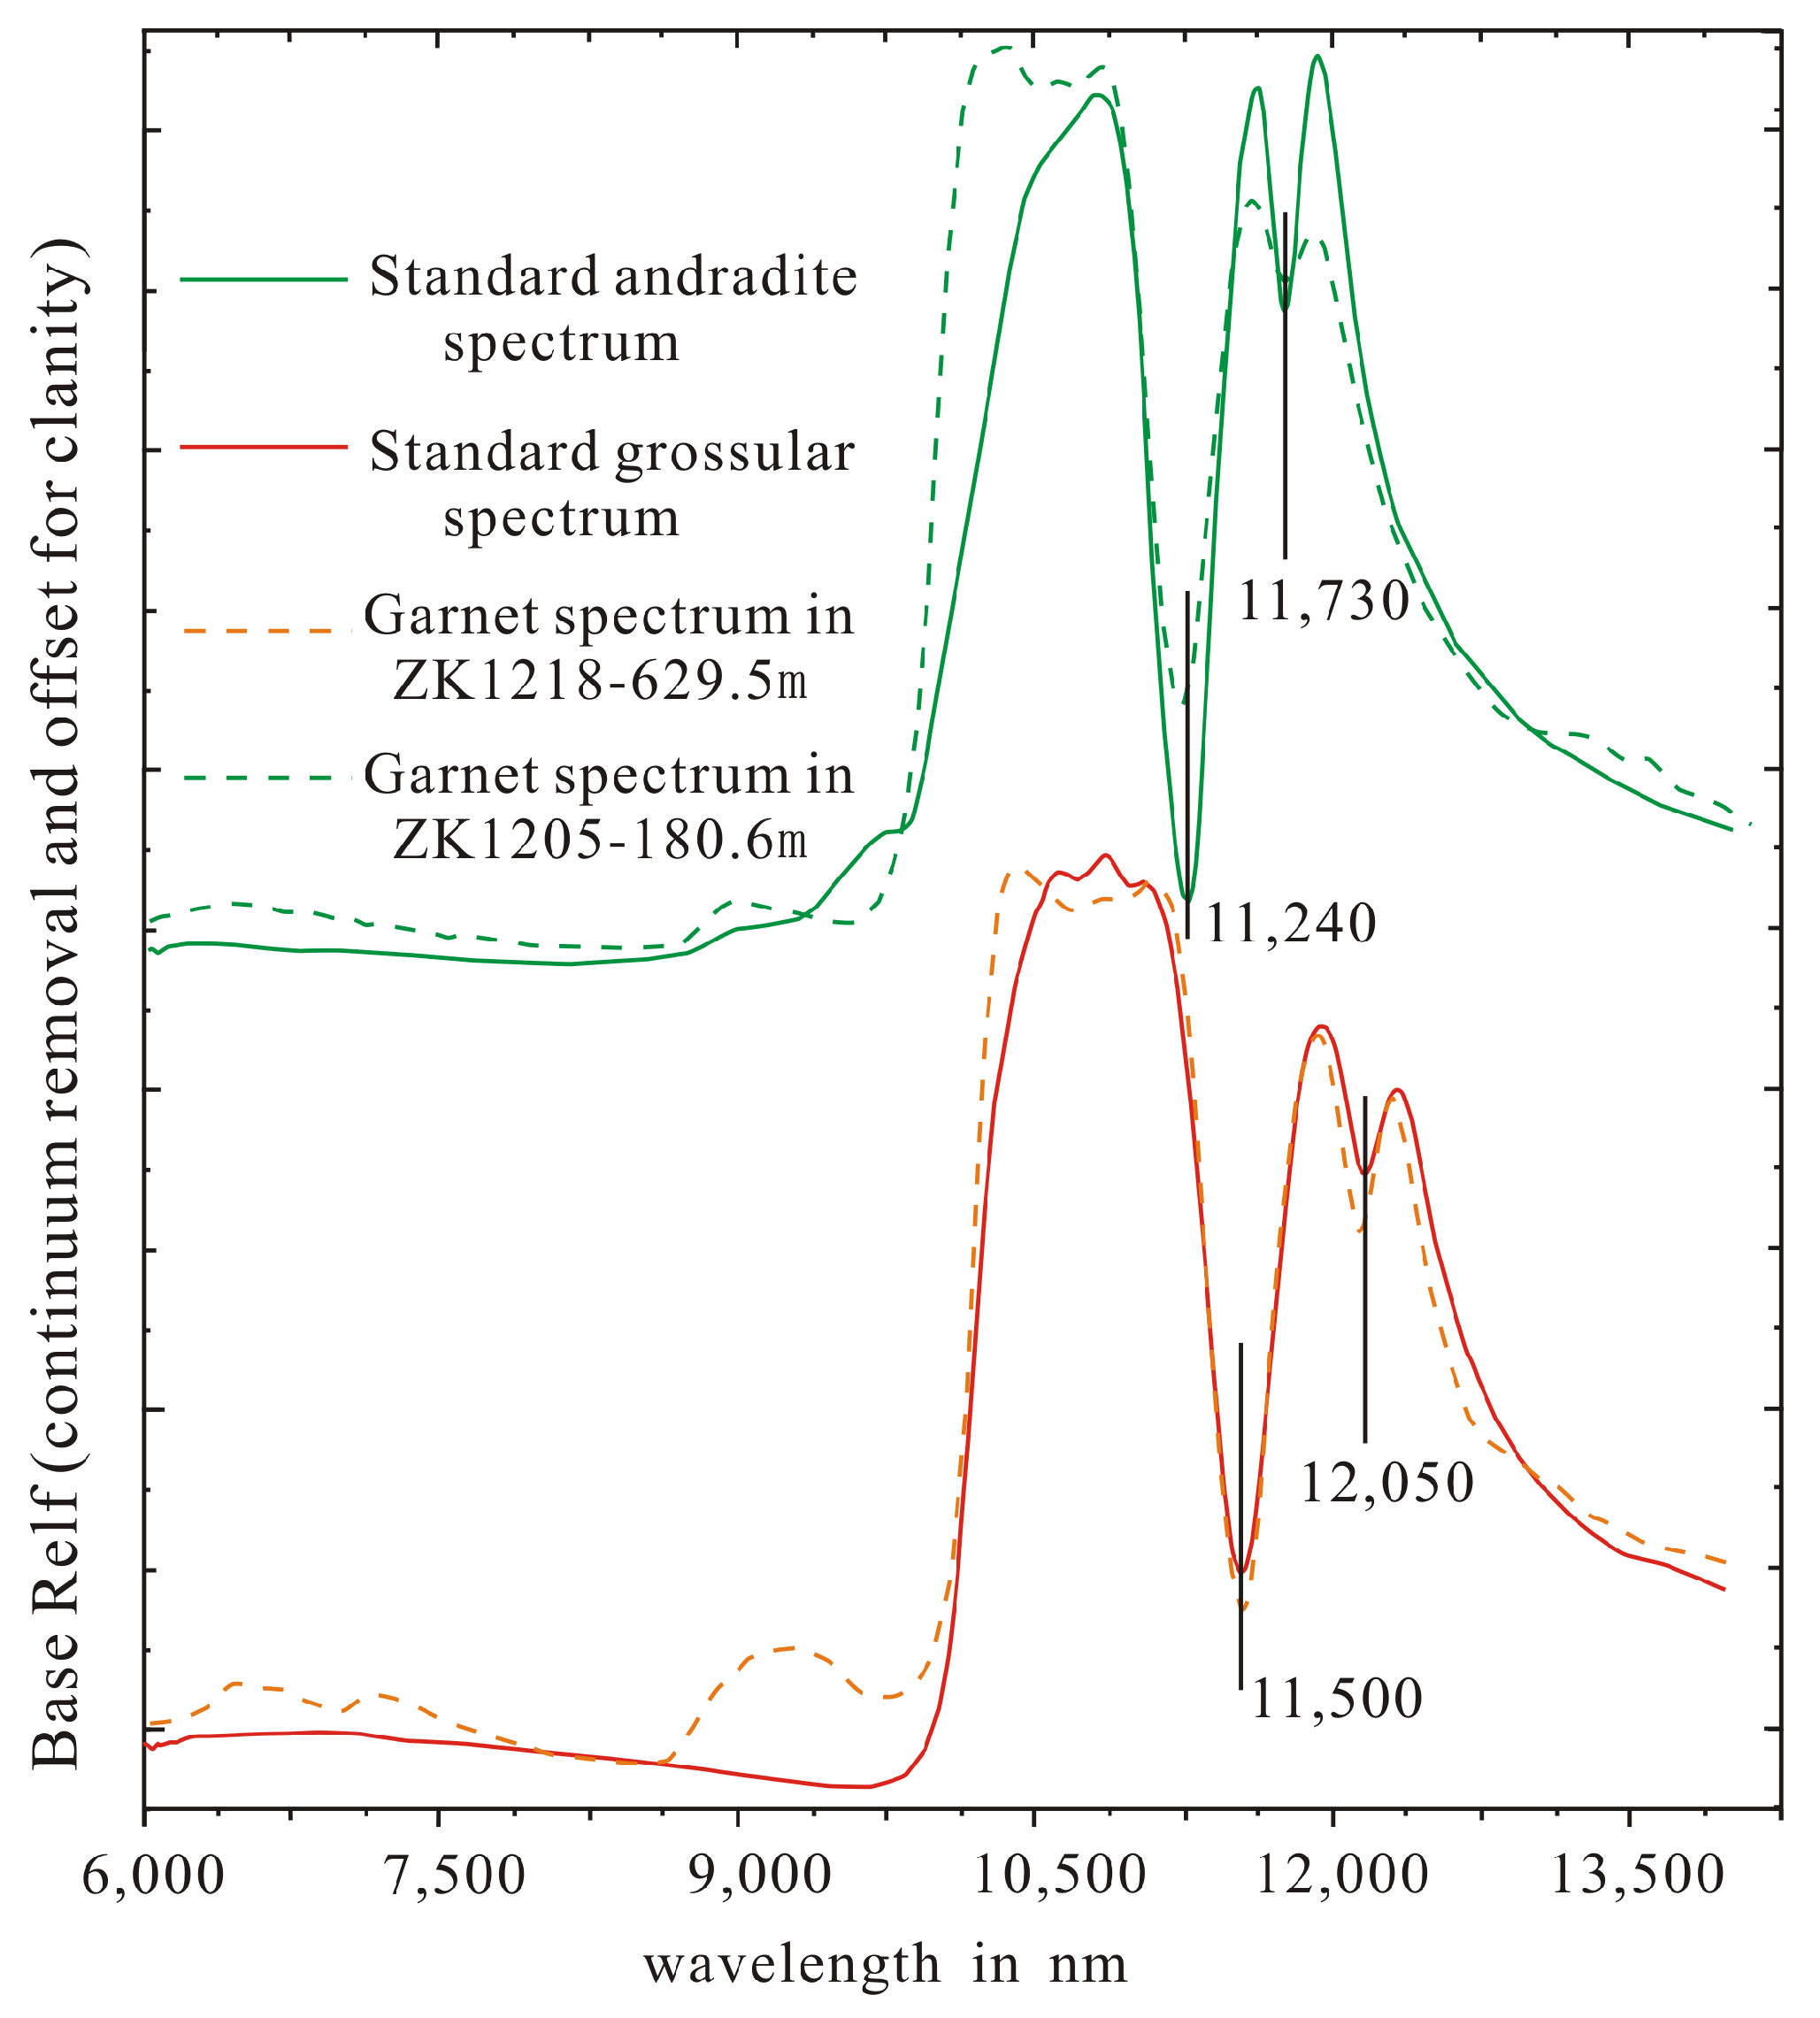
4.1. Spectral Characteristics of Garnet

4.1.1. Colour Variations

Numerous studies have reported that colour behaviour in skarn garnet is strongly related to intrusions and mineralisation zones [50,51,52]. The colour of garnet in the Jiama deposit varies significantly [42,46], and it can be seen in dark brown, reddish-brown, brown, khaki, dark green, emerald green and light yellowish green (Figure S1). The main absorption peaks with different colours vary from 11,220 to 11,585 nm. The absorption peak of dark brown garnet is between 11,560 and 11,585 nm (Table 1). More dark brown garnets are observed in the 11,570 to 11,585 nm range, for example the sample from ZK1218 (Figure S1a), for which the absorption peak is 11,575 nm. The absorption peak of brown garnet is between 11,530 and 11,560 nm (Table 1). Specifically, the focus is on the 11,540 to 11,550 nm range. For example, the sample from ZK024 (Figure S1c) has an absorption peak of 11,545 nm. The absorption peak of light brown garnet is between 11,220 and 11,450 nm (Table 1). There are more observations between 11,220 and 11,250 nm. For example, the sample from ZK4903 (Figure S1e) shows an absorption peak of 11,227 nm. In summary, it can be concluded that the samples with dark colour have longer wavelengths and the light colour samples have shorter wavelengths (Table 1).

4.1.2. Lithology Bariations

Previous studies have shown that the type of metal mineralisation in the Jiama deposit is related to skarn lithology [42,53]. The skarn in Jiama was divided into skarnised hornfels, garnet-diopsite skarns, garnet skarns, garnet-wollastonite skarns, wollastonite skarns and skarnised marbles according to the lithological variations by logging (Figure S2). The absorption peak of garnet in skarnised hornfels is between 11,220 and 11,350 nm, with more focus on 11,270 to 11,320 nm. For example, the absorption peak of sample from drill hole ZK1208 is 11,281 nm. The absorption peak of garnet in skarnised marble is between 11,520 nm 11,580 nm, with more focus on 11,550 to 11,560 nm. For example, the sample from ZK1213 shows an absorption peak of 11,558 nm (Figure S2). In summary, it can be concluded that the garnet in skarnised hornfels with shorter wavelengths lies on the top and the garnet in skarnised marbles with longer wavelengths lies on the bottom. Therefore, the wavelength of garnet’s absorption peak increases, accompanied by the enhancement of thermal metamorphism.

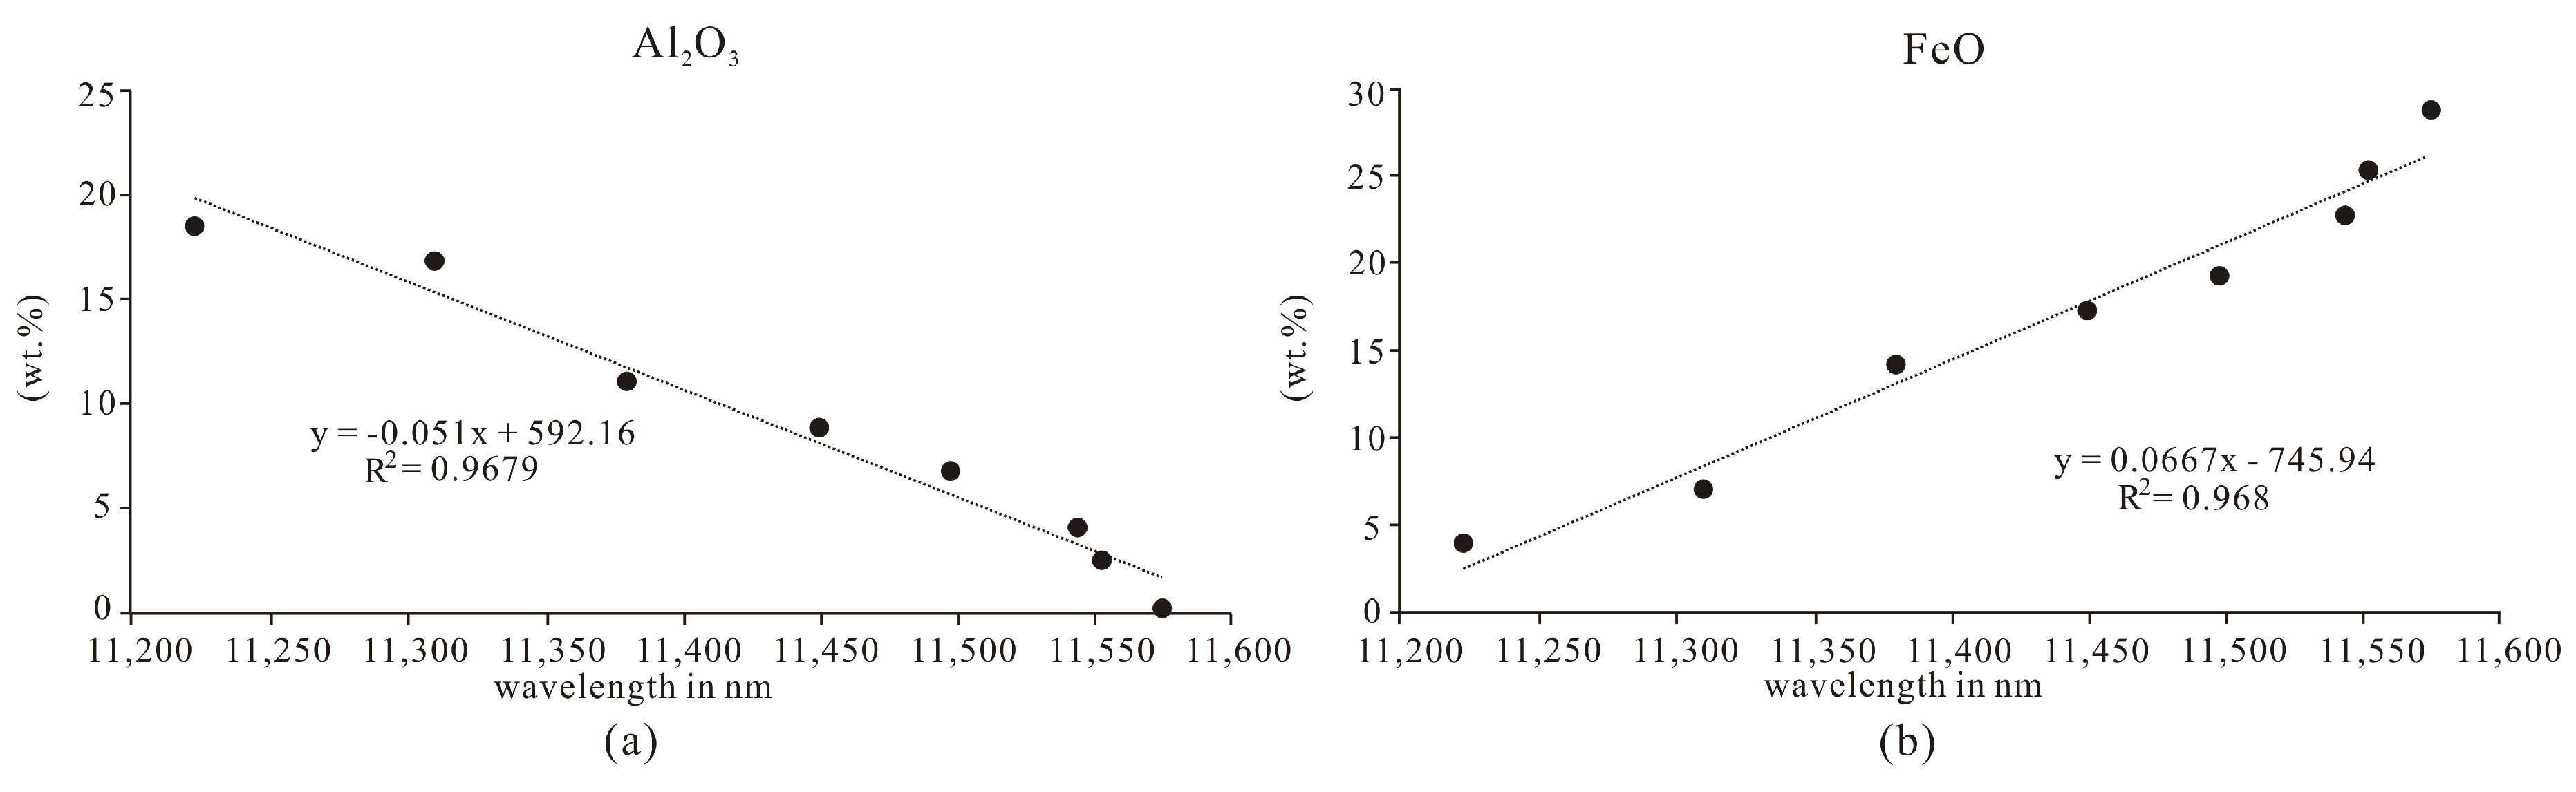
4.2. Elements Measured by EMPA

Figure 6 shows that the spectral characteristic absorption of garnet is significantly negatively correlated with Al content (R2 = 0.9679) and significantly positively correlated with Fe content (R2 = 0.968) (Table 2). Thus, the wavelength variation of garnet has a positive correlation with the ratio of Fe/Al content.
Oscillatory zoning is common in Jiama garnets [42,44,53,54]. Major element compositions of zoned garnet are shown in Table 3. Garnet has compositional zoning and falls within a compositional range of And72.15–98.45Gro0.69–21.2Alm + Sps + Pyr0.69–1.84, And70.61–98.4Gro0.75–27.78Alm + Sps + Pyr0.83–1.6 (Figure 7). The results show that these garnets belong to grossular-andradite solid solution. From the core to the edge, the Fe and Al content of the garnet oscillatory zones vary widely (Figure 7; Table 3), and the Fe content increases while the Al decreases. Generally, the core is relatively rich in Al, and the edges are relatively rich in Fe. Therefore, the variation of Fe/Al content in oscillatory zoning may affect the shift of the spectral absorption peak parameters of garnet.

5. Discussion

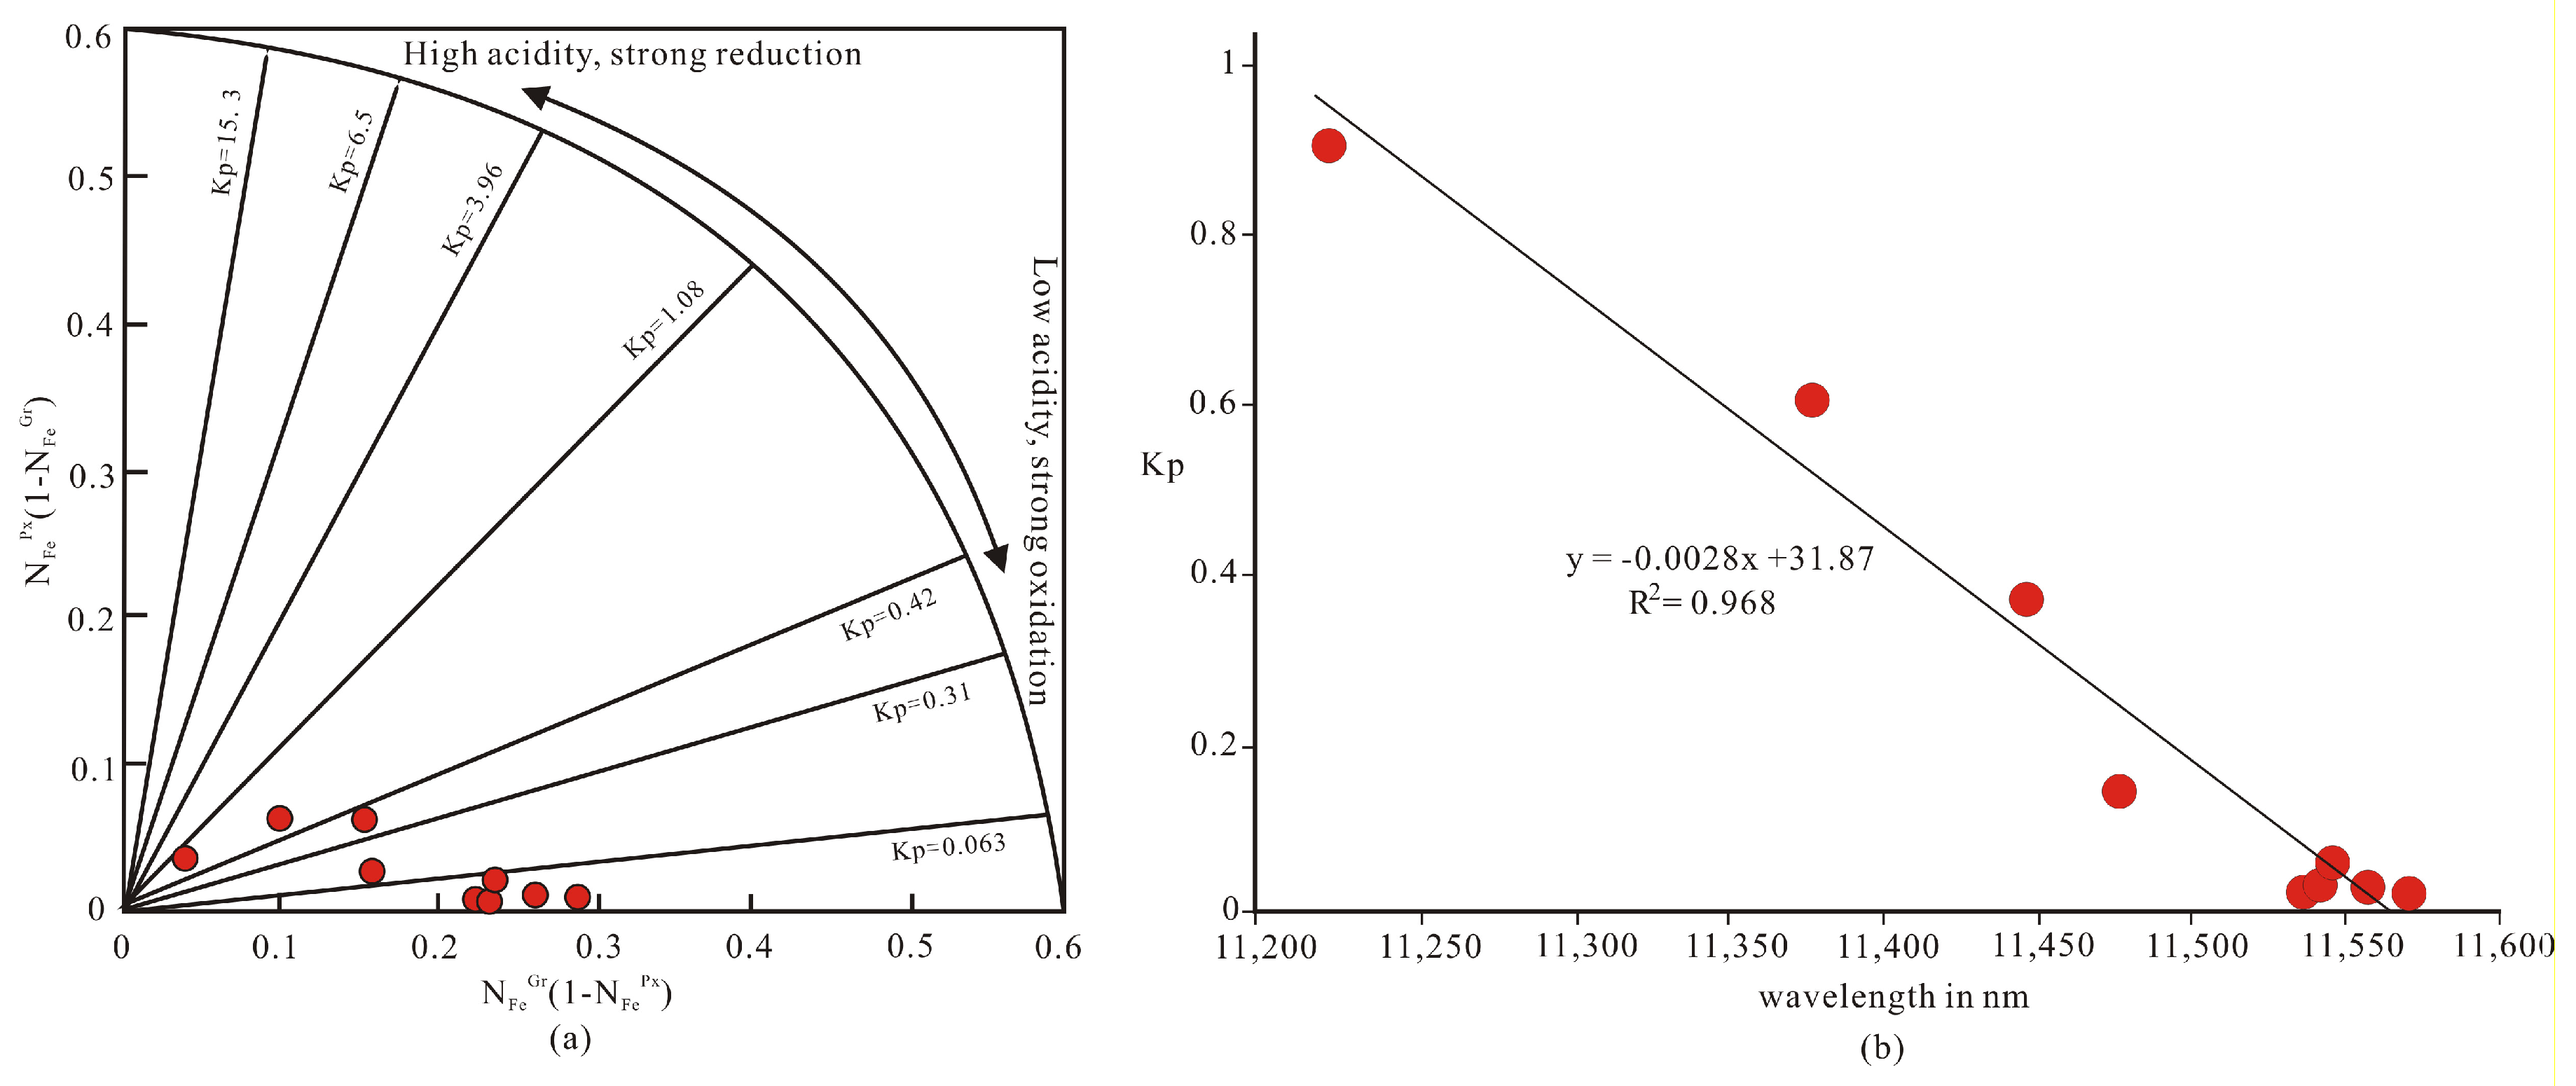
5.1. Relationship between the Wavelength Variation and Geochemistry

It is suggested that the composition of garnet is related to mineralisation [2,51,55,56]. Garnet with different content of chemical elements shows shifts of wavelengths (Figure S3; Table 2). Samples measured by EPMA were verified as andradite (And > 50%) and grossular (Gro > 50%). Andradite (And > 50%) wavelengths vary from 11,450 to 11,585 nm, and grossular (Gro > 50%) wavelengths vary from 11,220 to 11,450 nm (Figure S3). The sample from ZK1218 (And98.42Gro0.39Pyr + Spe + Alm1.19) shows an absorption peak of 11,575 nm. The sample from ZK817 (And57.04Gro41.79Pyr + Spe + Alm1.18) has an absorption peak of 11,450 nm. The sample from ZK3905 (And12.18Gro85.58Pyr + Spe + Alm2.07) has an absorption peak of 11,223 nm (Figure S3). Therefore, it can be interpreted that when the andradite component in the garnet end-member component decreases (And98.42→And12.18), the wavelength shifts to the short-wave direction.
Meinert’s [2,51] statistical analysis of the composition of garnets in the world’s large-scale skarn deposits shows that the garnets in the copper skarn belong to grossular-andradite solid solution series, and the content of andradite is slightly higher than that of grossular. Figure 8 shows the comparison of garnet’s composition with spectral absorption characteristics between the Jiama deposit and different kinds of skarn deposits in the world. The range of composition variation of Jiama garnet is the same as that of garnet in copper skarn in the world and overlaps with garnet in Mo, Fe and Zn skarn. Therefore, the Jiama grossular-andradite solid solution series is closely related to the mineralisation of Cu, Mo, Fe, and Zn, which is consistent with the current geological exploration results. In summary, the garnet end components can be determined effectively by TIR.

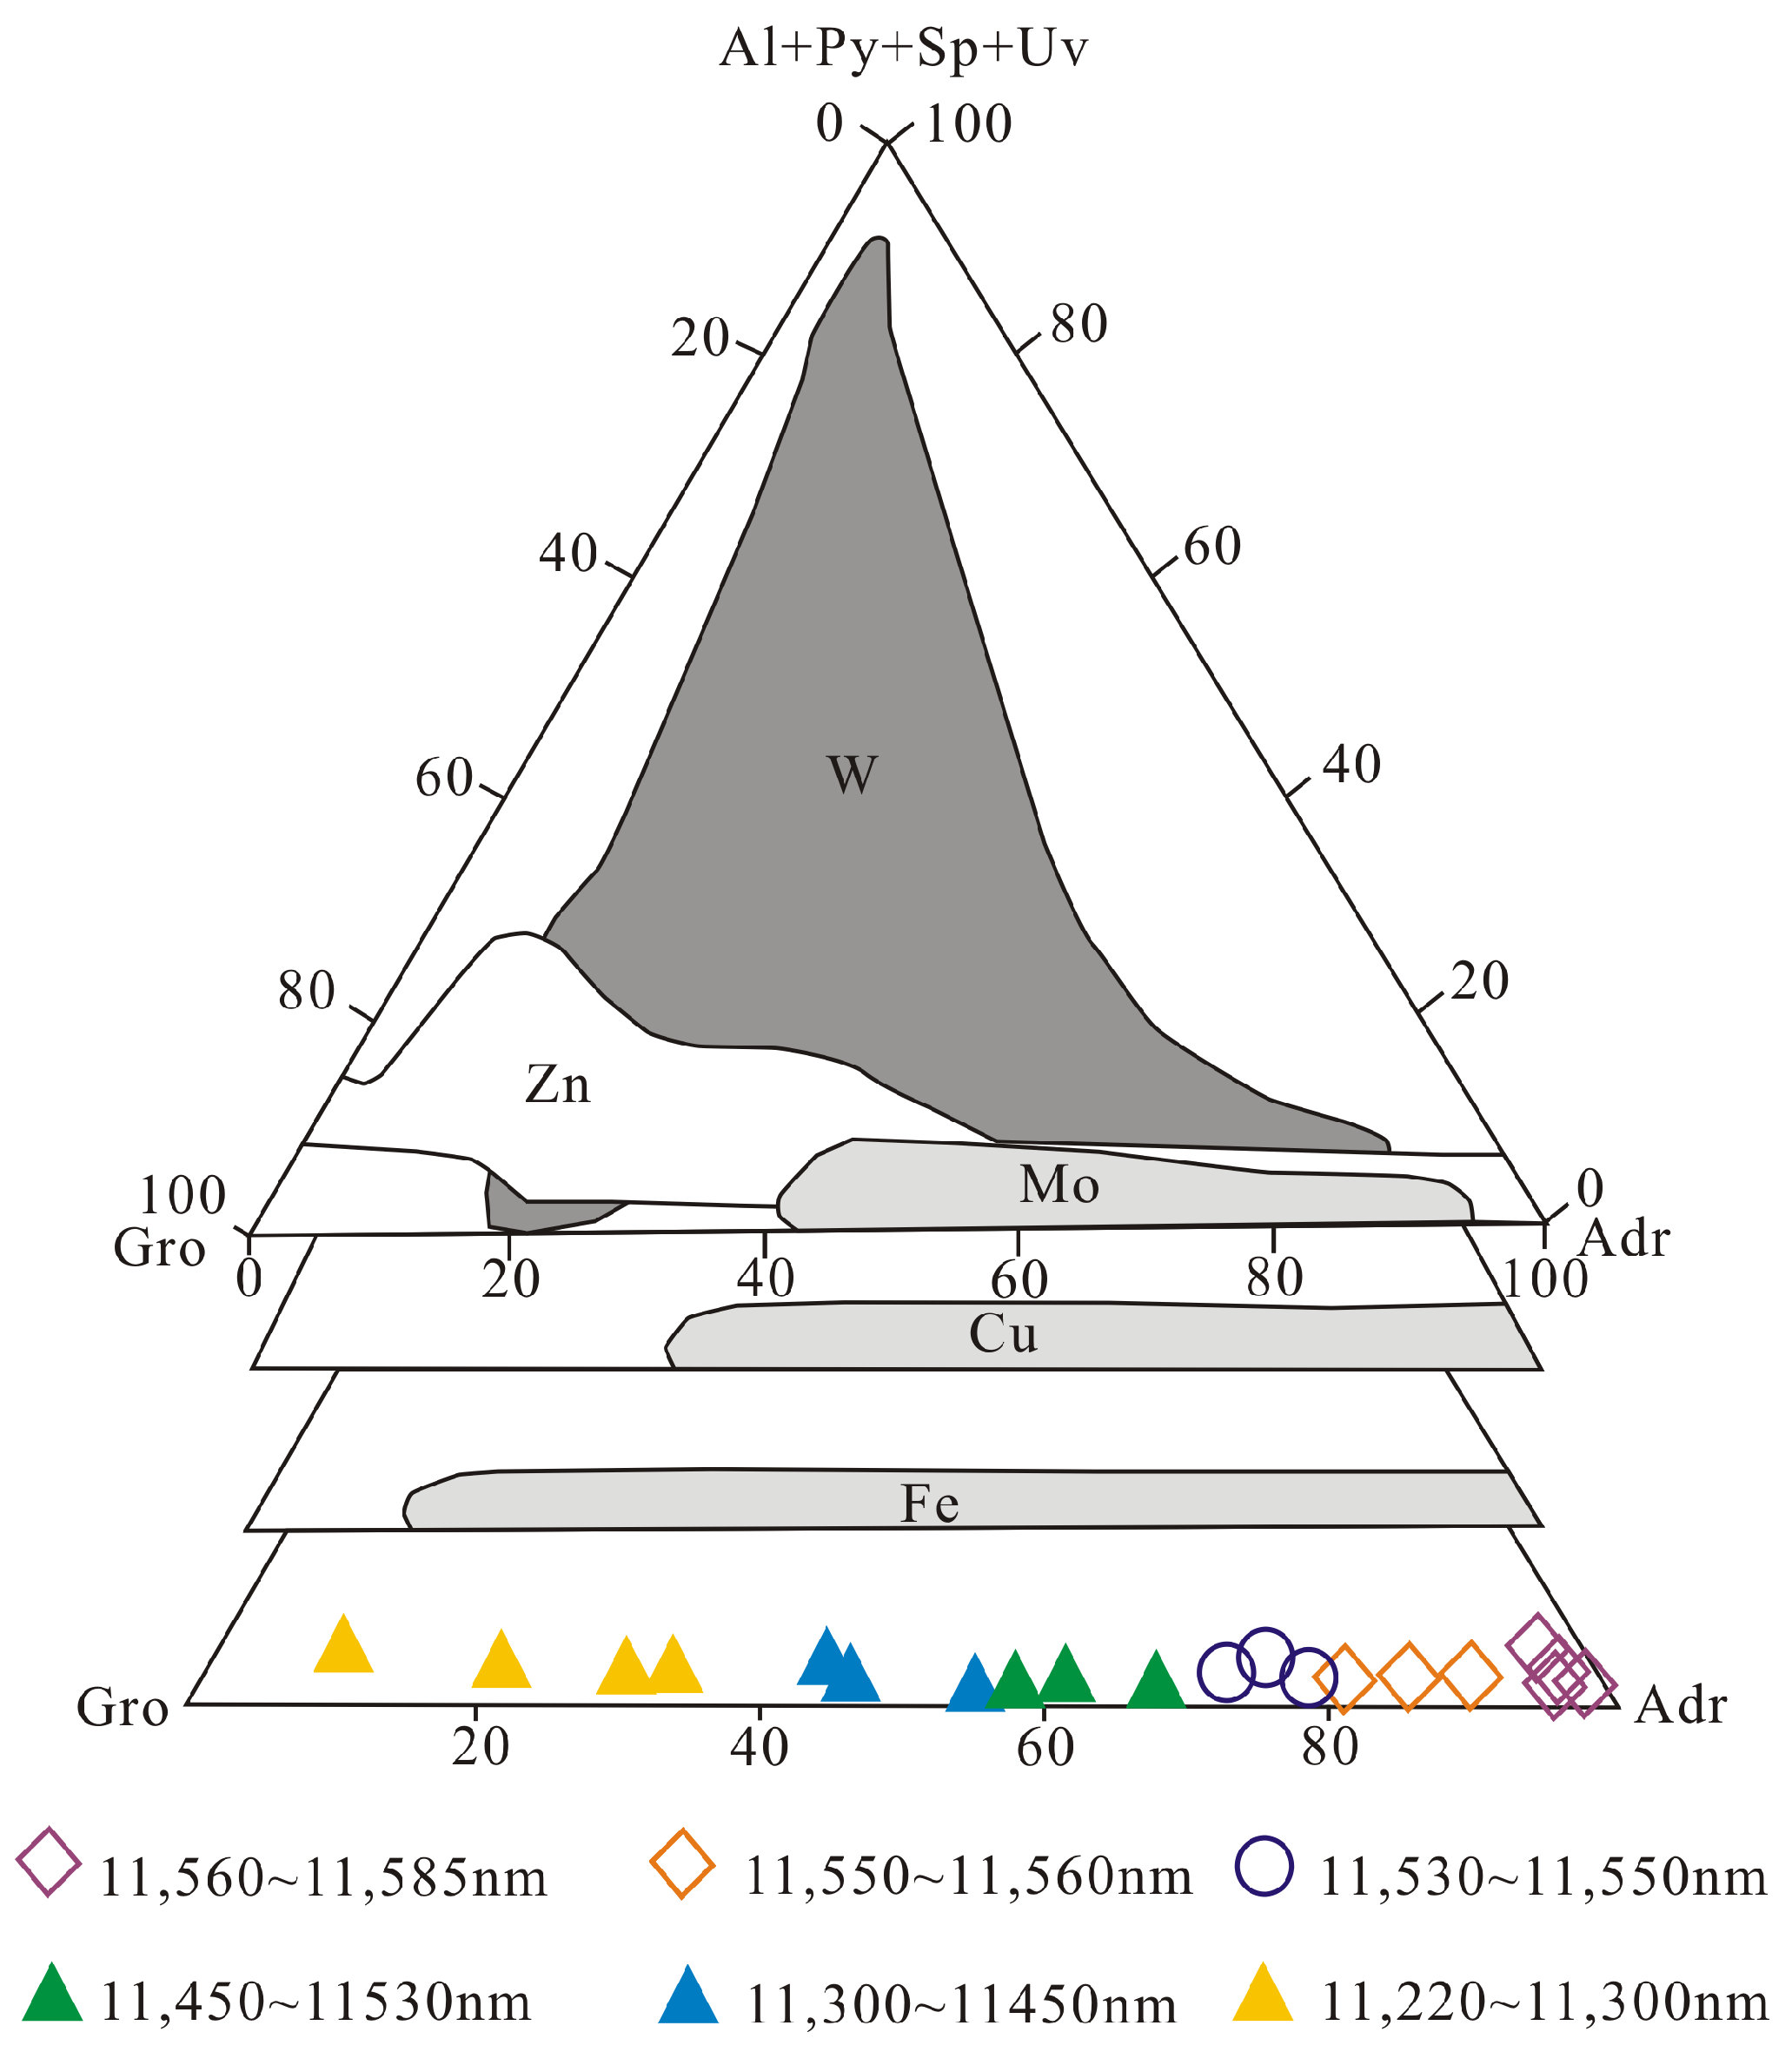
5.2. Metallogenic Environment Variation

The changes in the content and chemical composition of garnet and pyroxene in calcareous skarn are important indications of the metallogenic environment variation [57,58,59,60,61,62]. Following the examination of a number of skarn deposits in China, Zhao et al. [62] suggested using the iron content ratio (Kp) of the symbiotic pyroxene-garnet mineral pair in the deposits to measure the index of properties in skarn fluid (Figure 9a) The formula is: Kp = NFePx(1 − NFeGr) / NFeGr(1 − NFePx), where NFePx represents the iron content in pyroxene and NFeGr represents the iron content in garnet. Various minerals’ iron content can be calculated from garnet and pyroxene electron probe data (Table 4 and Table 5). Figure 9a shows that the range of Kp change is not large, indicating that during the early metamorphic skarn formation of the Jiama deposit, the pH and redox state of the fluid did not change significantly. Early skarn minerals are formed in a relatively stable environment and are generally in a weakly acidic and strongly oxidised state.
Figure 9b shows that the wavelength of garnet has a negative linear correlation with the Kp value (R2 = 0.968). It can, therefore, be concluded that long-wave garnets suggest a mineralisation environment with relatively high oxygen fugacity and low acidity.
Using Kriging interpolation, the garnet spectrum mapping was completed. The higher value distribution is close to the porphyry intrusion centre while the lower value distribution is at the edge (Figure 10). Previous studies have shown that the oxygen fugacity of the fluid at the centre of the Jiama mining area is −35.8 Mpa, while the oxygen fugacity at the edge drops to −46.8 Mpa [63]. This is consistent with the results of spectrum mapping of garnet (Figure 10). Such a distribution law is restricted by the activity of oxygen fugacity, and the crystallisation of the andradite aggravates the reduction of fluid oxygen fugacity, which indirectly leads to the precipitation of sulphides [54].

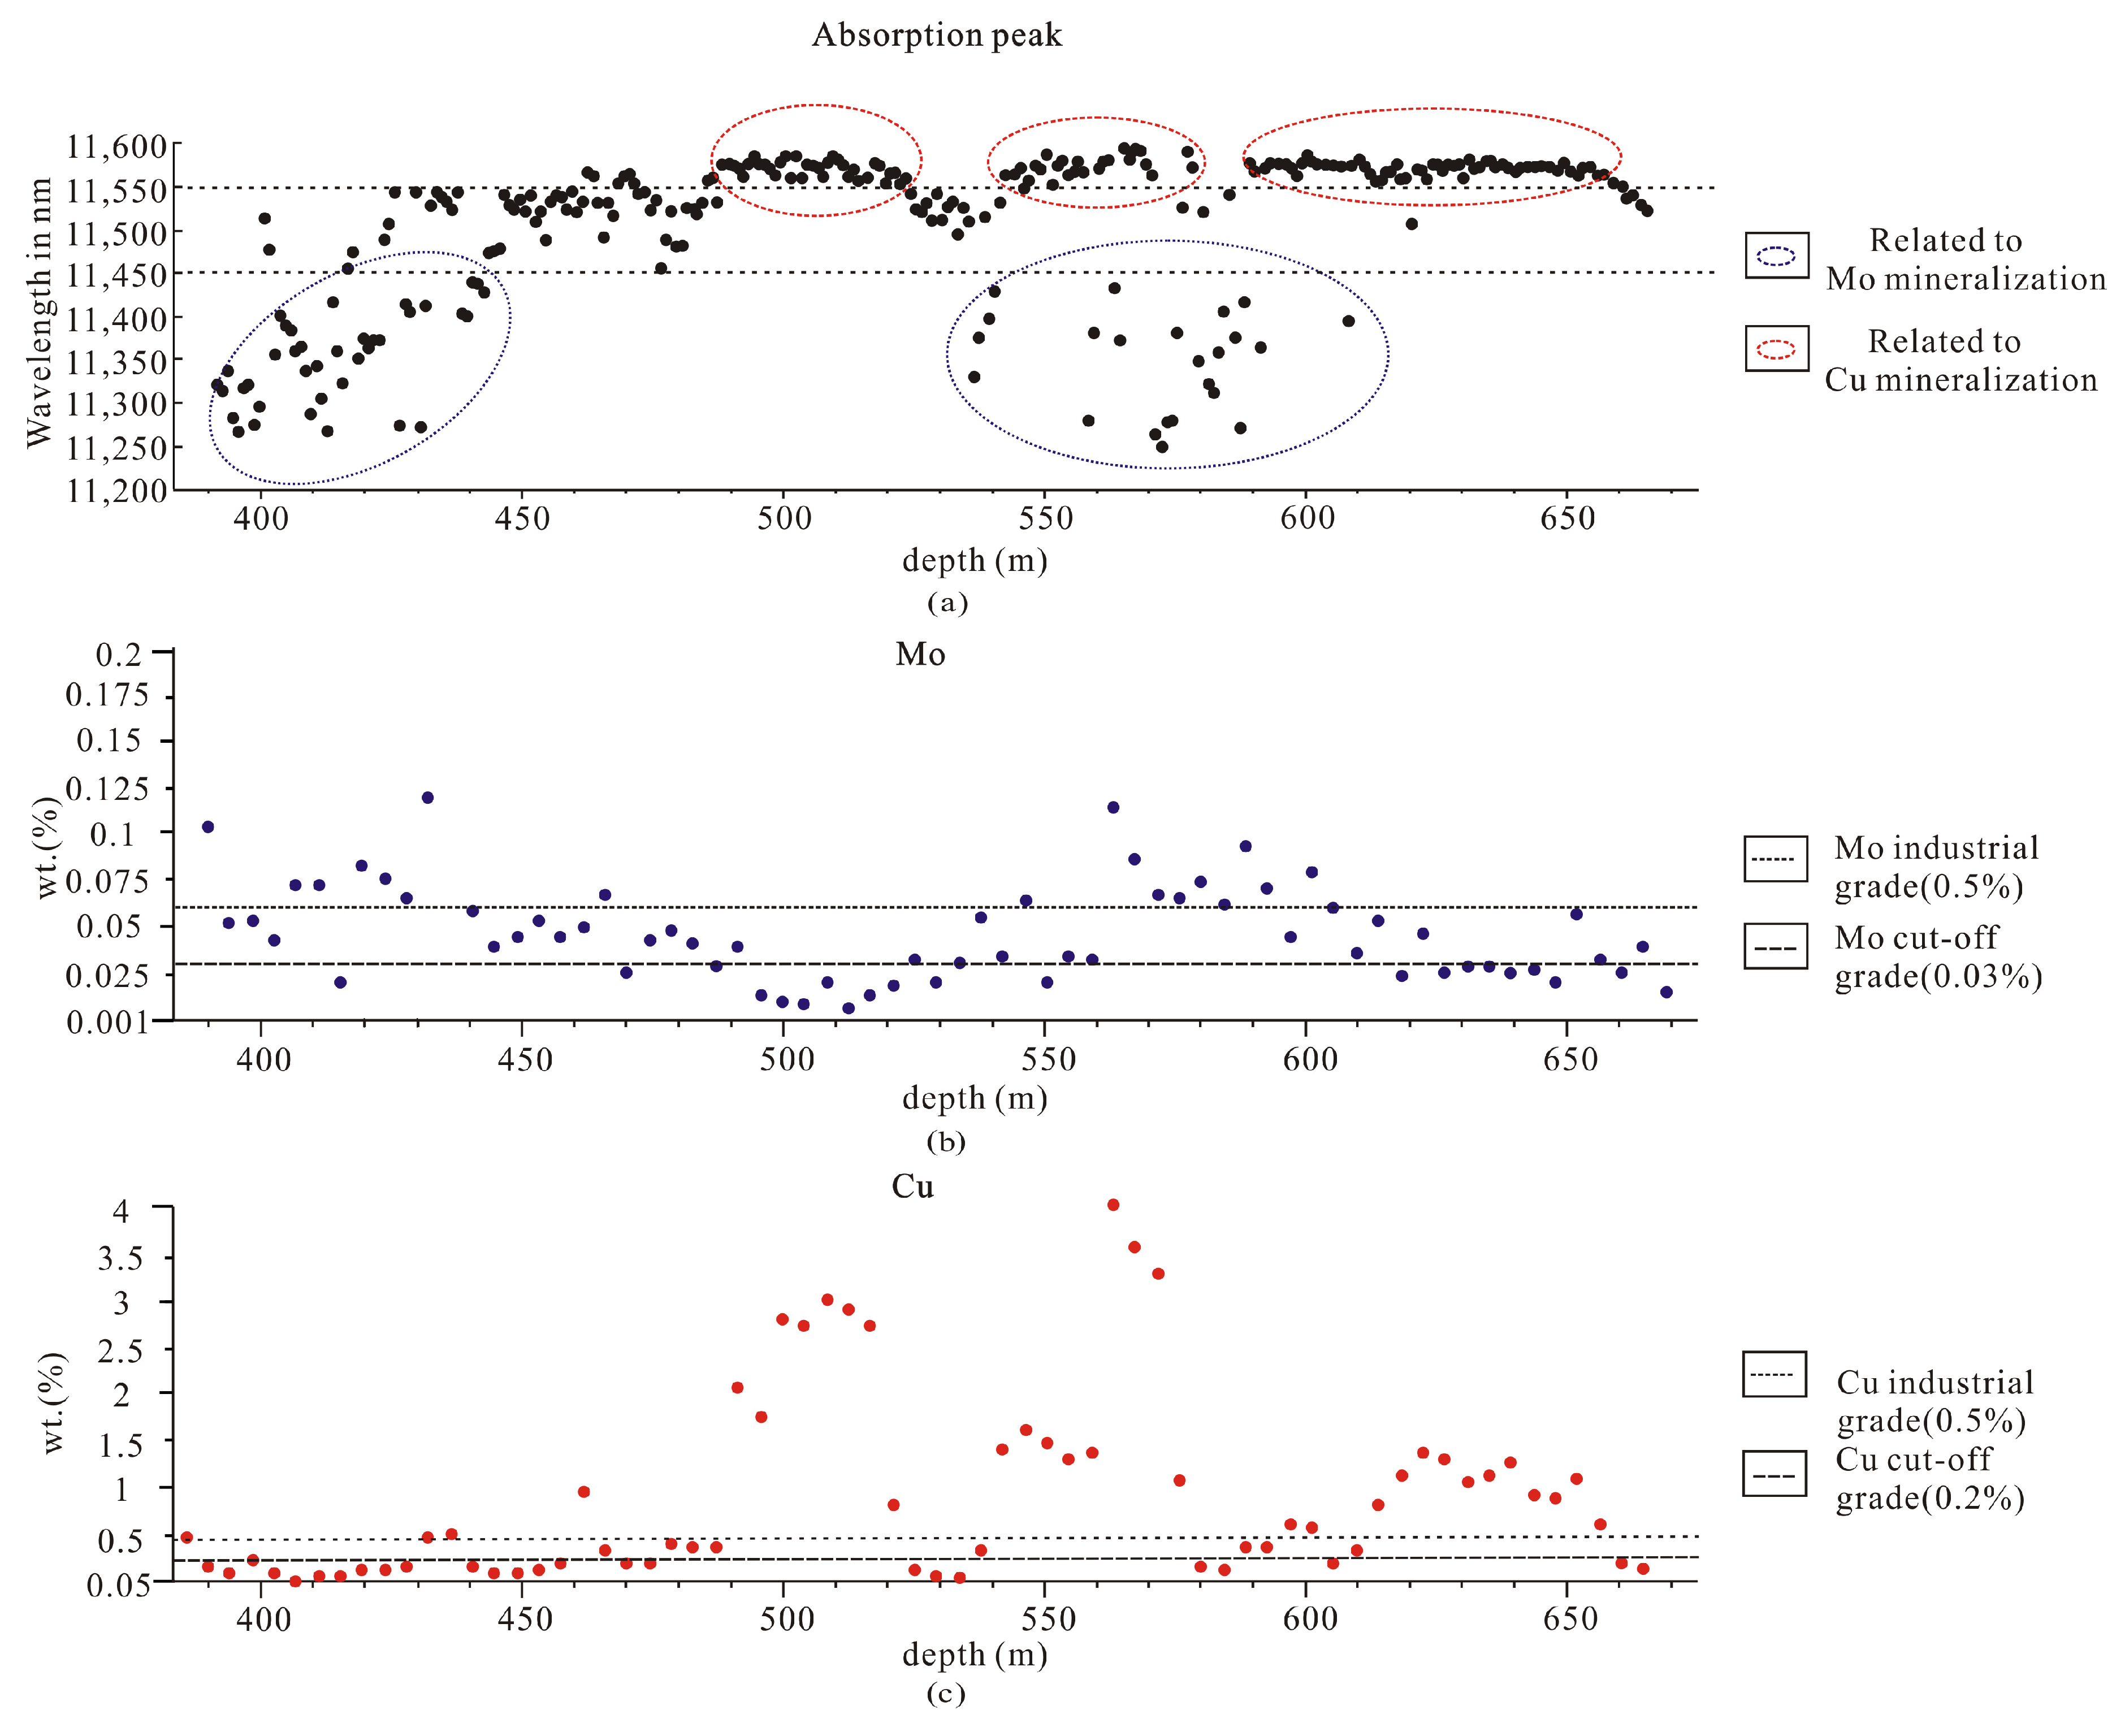
5.3. Relationship between the Spectra and Mineralisation

In hydrothermal deposits, the Al-OH absorption feature of sericite group minerals may point to the hydrothermal and mineralization centre of the mine area [20,21,63,64,65], but reports on successful SWIR applications on skarn deposit prospecting are fairly limited [20]. As for skarn deposits, garnet can be used as a guide in prospecting Cu skarn deposits [66]. However, garnet could only be observed in TIR, due to the fact that some atomic group vibrations in garnet can be detected in TIR. Therefore, this study attempts to explore the relationship between the characteristic absorption peak of garnet and ore mineralization.
Taking drilling ZK024 as an example, comparing Figure 11a–c shows that the majority of Mo mineralisation is found in samples with short-wave garnets (<11,450 nm) while long-wave garnets (>11,540 nm) are related to Cu enrichment.
Figure 12 demonstrates that when the garnet wavelength is greater than 11,540 nm, the Cu grade is increasing rapidly and it is positively correlated with the grade of Cu, whereas when the wavelength of garnet is less than 11,450 nm, Mo grade began to increase and it has a negative correlation with the grade of Mo. There may be many reasons for this phenomenon. Previous studies have shown that Cu and Mo in the Jiama deposit have zoning characteristics, which is caused by different periods of magmatic intrusion [43]. Cu caused volatile components to move and Mo in the fluid with MoO2Cl+ to migrate [63]. The precipitation of Mo is not only related to temperature, pressure and Eh, but also to the value of pH in the fluid [41].
Guo et al. [20] use SWIR and found that Cu and Mo show the highest grades in the skarn of the Jiama deposit, accompanied by abundant white mica. This is because SO2 dissolved in the magmatic hydrothermal fluid phase progressively disassociates to H2S and H2SO4 as the fluid cools below ~400 °C [67,68]. Then, it will generate hydrogen sulphide, which initiates abundant precipitation of sulphide minerals (i.e., chalcopyrite, molybdenite). Garnetization can be considered as an early ground preparation process for later ore mineralisation [69]. Garnet formation increased brittle behaviour which facilitated further development of fractures and cracks and precipitation of ore minerals during later hydrothermal activity [42]. The TIR characteristics of garnet seeds in the prograde skarn and the SWIR spectral characteristics of sericite in the retrograde skarn can better predict the mineralisation potential of the deposit.

6. Conclusions

Garnet is typically an alteration mineral in skarn deposits. On the whole, the dark colour garnets are associated with the longest wavelengths while the light colour garnets have the shortest wavelengths. In addition, accompanied by the enhancement of thermal metamorphism, the garnet in skarnised hornfels with shorter wavelengths lies on the top and the garnet in skarnised marbles with longer wavelengths lies on the bottom.
Through TIR spectrometry, the garnet end components can be determined effectively and thus provide a format for further research on the type and genesis of the deposit.
Long-wave garnets suggest an environment of mineralisation with relatively low amounts of acidity and high oxygen fugacity. Thus, the characteristic absorption peak of garnet can indicate the variations in metallogenic environment variation.
The spectral characteristics of garnet are closely related to mineralisation. The orebody coexists in the garnet zone, where the wavelength location at 11,200–11,600 nm plays an important role in mineralisation in skarn deposits. Furthermore, short-wave garnet (<11,450 nm) is closely related to Mo, while long-wave (>11,540 nm) garnet is closely related to Cu enrichment.
It is important to relate garnet wavelength changes in skarn to a specific deposit. Furthermore, it can be used as the indicator of Fe/Al, mineralisation grade and in alteration mapping.

Supplementary Materials

The following are available online at https://www.mdpi.com/2075-163X/11/1/5/s1, Figure S1: Spectral curves of garnets with different colours; Figure S2: Spectral curves of garnets with different lithology; Figure S3: Spectral curves of garnets with different end component.

Author Contributions

Conceptualization, N.G. and Y.-R.H.; methodology, Y.-R.H. and N.G.; software, Y.-R.H.; validation, Y.-R.H., N.G., J.-X.T. and W.-X.S.; formal analysis, Y.-R.H., W.-X.S. and F.-Q.R.; writing—original draft preparation, Y.-R.H.; writing—review and editing, Y.-R.H., N.G.; funding acquisition, J.-X.T. and N.G. All authors have read and agreed to the published version of the manuscript.

Funding

This research was funded by the Deep Resources Exploration and Mining, National Key R&D Program of China (grant numbers: 2018YFC0604101, 2018YFC0604105).

Institutional Review Board Statement

Not applicable.

Informed Consent Statement

Not applicable.

Acknowledgments

We are greatly indebted to the following sponsors, teachers and friends for their support: Natural Geological Data Center of China Geological Survey, China, my classmate Qiufeng Leng, Miao Sun and Zebin Zhang. In addition, we thank the anonymous reviewers whose comments improved the manuscript.

Conflicts of Interest

The authors declare no conflict of interest.

References

  1. Baxter, E.F.; Caddick, M.J.; Ague, J.J. Garnet: Common mineral, uncommonly useful. Elements 2013, 9, 415–419. [Google Scholar] [CrossRef]
  2. Meinert, L.D.; Dipple, G.M.; Nicolescu, S.; Hedenquist, J.W.; Thompson, J.F.H.; Goldfarb, R.J.; Richards, J.P. World skarn deposits. In One Hundredth Anniversary Volume; Society of Economic Geologists: Lyttelton, CO, USA, 2005; pp. 299–336. [Google Scholar] [CrossRef]
  3. Jamtveit, B.; Wogelius, R.A.; Fraser, D.G. Zonation patterns of skarn garnets: Records of hydrothermal system evolution. Geology 1993, 21, 113–116. [Google Scholar] [CrossRef]
  4. Jamtveit, B.; Hervig, R.L. Constraints on transport and kinetics in hydrothermal systems from zoned garnet crystals. Science 1994, 263, 505–508. [Google Scholar] [CrossRef]
  5. Park, C.; Song, Y.; Kang, I.-M.; Shim, J.; Chung, D.; Park, C.-S. Metasomatic changes during periodic fluid flux recorded in grandite garnet from the Weondong W-skarn deposit, South Korea. Chem. Geol. 2017, 451, 135–153. [Google Scholar] [CrossRef]
  6. Park, C.; Park, C.; Song, Y.; Choi, S.-G. Sequential trace element analysis of zoned skarn garnet: Implications for multi-stage fluxing and flow of magmatic fluid into a skarn system. Lithos 2019, 105213. [Google Scholar] [CrossRef]
  7. Xiao, X.; Zhou, T.-F.; White, N.C.; Zhang, L.-J.; Fan, Y.; Wang, F.-Y.; Chen, X.-F. The formation and trace elements of garnet in the skarn zone from the Xinqiao Cu-S-Fe-Au deposit, Tongling ore district, Anhui Province, Eastern China. Lithos 2018, 302–303, 467–479. [Google Scholar] [CrossRef]
  8. Lima, S.M.; Corfu, F.; Neiva, A.; Ramos, J.M. U-Pb ID-TIMS dating applied to U-rich inclusions in garnet. Am. Miner. 2012, 97, 800–806. [Google Scholar] [CrossRef]
  9. Mezger, K.; Rawnsley, C.M.; Bohlen, S.R.; Hanson, G.N. U-Pb garnet, sphene, monazite, and rutile ages: Implications for the duration of high-grade metamorphism and cooling histories, Adirondack Mts., New York. J. Geol. 1991, 99, 415–428. [Google Scholar] [CrossRef]
  10. Seman, S.; Stockli, D.; McLean, N. U-Pb geochronology of grossular-andradite garnet. Chem. Geol. 2017, 460, 106–116. [Google Scholar] [CrossRef]
  11. Ma, X.L.; Wang, K.Y.; Li, S.D.; Shi, K.T.; Wang, W.Y.; Yang, H. Geology, fluid inclusion, and H-O-S-Pb isotopic study of the Shenshan skarn Fe-Cu deposit, Southern Great Xing’an Range, Northeast China. J. Geochem. Explor. 2019, 200, 167–180. [Google Scholar] [CrossRef]
  12. Gevedon, M.; Seman, S.; Barnes, J.D.; Lackey, J.S.; Stockli, D.F. Unraveling histories of hydrothermal systems via U-Pb laser ablation dating of skarn garnet. Earth Planet. Sci. Lett. 2018, 498, 237–246. [Google Scholar] [CrossRef]
  13. Wafforn, S.; Seman, S.; Kyle, J.R.; Stockli, D.; Leys, C.; Sonbait, D.; Cloos, M. Andradite garnet U-Pb geochronology of the big gossan skarn, Ertsberg-Grasberg mining district, Indonesia. Econ. Geol. 2018, 113, 769–778. [Google Scholar] [CrossRef]
  14. Ismail, R.; Ciobanu, C.L.; Ciobanu, C.L.; Teale, G.S.; Giles, D.; Mumm, A.S.; Wade, B. Rare earths and other trace elements in minerals from skarn assemblages, Hillside iron oxide-copper-gold deposit, Yorke Peninsula, South Australia. Lithos 2014, 184-187, 456–477. [Google Scholar] [CrossRef]
  15. Zhai, D.-G.; Liu, J.; Zhang, H.-Y.; Wang, J.-P.; Su, L.; Yang, X.-A.; Wu, S.-H. Origin of oscillatory zoned garnets from the Xieertala Fe-Zn skarn deposit, northern China: In situ LA-ICP-MS evidence. Lithos 2014, 190-191, 279–291. [Google Scholar] [CrossRef]
  16. Laukamp, C.; Lau, I.; Wang, R. Tracing exchange vectors of minerals in hydrothermal systems using SWIR and TIR active functional groups. In Proceedings of the 11th Australasian Conference on Vibrational Spectroscopy (ACOVS11)/5th Asian Spectroscopy Conference (ASC5), Sydney, Australia, 29 September–2 October 2015. [Google Scholar]
  17. Clark, R.N.; King, T.V.V.; Klejwa, M.; Swayze, G.A.; Vergo, N. High spectral resolution reflectance spectroscopy of minerals. J. Geophys. Res. Space Phys. 1990, 95, 12653–12680. [Google Scholar] [CrossRef] [Green Version]
  18. De Mesquita, N.M.; Carrino, T.A.; Neto, J.A.D.S. The use of reflectance spectroscopy and the prehnite spectral index to target gold mineralization at the Bonfim polymetallic skarn deposit, Seridó Mobile Belt, Borborema Province, Brazil. Ore Geol. Rev. 2019, 115, 103192. [Google Scholar] [CrossRef]
  19. Doublier, M.P.; Roache, T.; Potel, S.; Laukamp, C. Short-wavelength infrared spectroscopy of chlorite can be used to determine very low metamorphic grades. Eur. J. Miner. 2012, 24, 891–902. [Google Scholar] [CrossRef]
  20. Guo, N.; Thomas, C.; Tang, J.; Tong, Q. Mapping white mica alteration associated with the Jiama porphyry-skarn Cu deposit, central Tibet using field SWIR spectrometry. Ore Geol. Rev. 2019, 108, 147–157. [Google Scholar] [CrossRef]
  21. Na, G.; Wenbo, G.; Dong, L.; Yiru, H.; Long, Z.; Yanan, G. Alteration zoning model associated with Tibetan Sinongduo epithermal deposit, the continental volcanic areas of Gangdise metallogenic belt. Acta Pet. Sin. 2019, 35, 833–848. [Google Scholar] [CrossRef]
  22. Huang, Y.R.; Guo, N.; Zheng, L.; Yang, Z.Y.; Fu, Y. 3D geological alteration mapping based on remote sensing and shortwave infrared technology: A case study of the Sinongduo low-sulfidation epithermal deposit. Acta Geosci. Sin. 2017, 38, 779–789. [Google Scholar] [CrossRef]
  23. Tian, J.; Zhang, Y.; Cheng, J.-M.; Sun, S.-Q.; Zhao, Y.-J. Short wavelength infra-red (SWIR) characteristics of hydrothermal alteration minerals in skarn deposits: Example from the Jiguanzui Cu-Au deposit, Eastern China. Ore Geol. Rev. 2019, 106, 134–149. [Google Scholar] [CrossRef]
  24. Chukanov, N.V. Infrared Spectra of Mineral. Species: Extended Library; Springer-Verlag GmbH: Dordrecht, The Netherlands; Heidelberg, Germany; New York, NY, USA; London, UK, 2014; p. 1716. ISBN 9400771274. [Google Scholar]
  25. Hancock, E.; Huntington, J.F. The GSWA NVCL HyLogger: Rapid Mineralogical Analysis for Characterizing Mineral and Petroleum Core; GSWA-Geological Survey Western Australia: Perth, Australia, 2010; p. 21. [Google Scholar]
  26. Thompson, A.J.B.; Hauff, P.; Robitaille, A.J. Alteration mapping in exploration: Application of short-wave infrared (SWIR) spectroscopy. Soc. Econ. Geol. Newslett. 1999, 39, 16–27. [Google Scholar]
  27. Dai, J.J.; Zhao, L.X.; Jiang, Q.; Wang, H.Y.; Liu, T.Y. Review of the thermal infrared spectroscopy applied in geological ore exploration. Acta Geol. Sin. 2020, 94, 2520–2533. [Google Scholar] [CrossRef]
  28. Christensen, P.R.; Bandfield, J.L.; Hamilton, V.E.; Howard, D.A.; Lane, M.D.; Piatek, J.L.; Ruff, S.W.; Stefanov, W.L. A thermal emission spectral library of rock-forming minerals. J. Geophys. Res. Space Phys. 2000, 105, 9735–9739. [Google Scholar] [CrossRef] [Green Version]
  29. Green, D.; Schodlok, M. Characterisation of carbonate minerals from hyperspectral TIR scanning using features at 14,000 and 11,300 nm. Aust. J. Earth Sci. 2016, 63, 1–7. [Google Scholar] [CrossRef]
  30. Cudahy, T.; Wilson, J.; Hewson, R.; Linton, P.; Harris, P.; Sears, M.; Okada, K.; Hackwell, J. Mapping porphyry-skarn alteration at Yerington, Nevada, using airborne hyperspectral VNIR-SWIR-TIR imaging data. In Proceedings of the IGARSS 2001, Scanning the Present and Resolving the Future. IEEE 2001 International Geoscience and Remote Sensing Symposium (Cat. No.01CH37217), Sydney, Australia, 9–13 July 2001; Volume 2, pp. 631–633. [Google Scholar]
  31. Cudahy, T.; Hewson, R.; Caccetta, M.; Roache, A.; Whitbourn, L.; Connor, P.; Coward, D.; Mason, P.; Yang, K.; Huntington, J.; et al. Drill core logging of plagioclase feldspar composition and other minerals associated with archean gold mineralization at Kambalda, Western Australia, using a bidirectional thermal infrared reflectance system. Remote Sens. Spectr. Geol. 2009, 16, 223–235. [Google Scholar] [CrossRef]
  32. Duuring, P.; Hassan, L.; Zelic, M.; Gessner, K. Geochemical and spectral footprint of metamorphosed and deformed VMS-style mineralization in the Quinns District, Yilgarn Craton, Western Australia. Econ. Geol. 2016, 111, 1411–1438. [Google Scholar] [CrossRef]
  33. Tang, J.X.; Wang, D.H.; Wang, X.W.; Zhong, K.H.; Ying, L.J.; Zheng, W.B.; Li, F.J.; Guo, N.; Qin, Z.P.; Yao, X.F.; et al. Geological features and metallogenic model of the Jiama copper-polymetallic deposit in Tibet. Acta Geosci. Sin. 2010, 31, 495–506. [Google Scholar] [CrossRef]
  34. Ying, L.; Wang, C.; Tang, J.; Wang, D.; Qu, W.; Li, C. Re-Os systematics of sulfides (chalcopyrite, bornite, pyrite and pyrrhotite) from the Jiama Cu-Mo deposit of Tibet, China. J. Asian Earth Sci. 2014, 79, 497–506. [Google Scholar] [CrossRef]
  35. Tang, J.; Wang, F.; Xiao, X.; Zhang, L. 2.5-D DC resistivity modeling considering flexibility and accuracy. J. Earth Sci. 2011, 22, 124–130. [Google Scholar] [CrossRef]
  36. Wang, J.; Jin, P.; Bishop, P.L.; Li, F. Upgrade of three municipal wastewater treatment lagoons using a high surface area media. Front. Environ. Sci. Eng. 2012, 6, 288–293. [Google Scholar] [CrossRef]
  37. Zhong, K.H.; Yao, D.; Dorji; Zheng, F.S.; Yan, G.Q. Structural features of Yeba tectonite group in Jiama (Gyama)-Qulong area of Tibet. Acta Geosci. Sin. 2013, 34, 75–86. [Google Scholar] [CrossRef]
  38. Tang, J.X.; Deng, S.L.; Zheng, W.B.; Ying, L.J.; Wang, X.W.; Zhong, K.H.; Qin, Z.P.; Ding, F.; Li, F.J.; Tang, X.Q.; et al. An exploration model for Jiama copper polymetallic deposit in Maizhokunggar County, Tibet. Miner. Depos. 2011, 30, 179–194. [Google Scholar] [CrossRef]
  39. Qin, Z.P.; Wang, X.W.; Duo, J.; Tang, X.Q.; Zhou, Y.; Peng, H.J. Characteristics, intrusion mechanism and genetic significance of two types granites in Jiama copper polymetallic deposit. Miner. Depos. 2010, 29, 261–262. [Google Scholar]
  40. Li, H.; Liu, X.; Li, X.; Sheng, J.; Cai, X.; Wang, T. Rayleigh wave group velocity distribution in Ningxia. J. Earth Sci. 2011, 22, 117–123. [Google Scholar] [CrossRef]
  41. Zheng, W.; Tang, J.; Zhong, K.; Ying, L.; Leng, Q.; Ding, S.; Lin, B. Geology of the Jiama porphyry copper-polymetallic system, Lhasa Region, China. Ore Geol. Rev. 2016, 74, 151–169. [Google Scholar] [CrossRef]
  42. Leng, Q.F. Skarn Diagenesis and Mineralization of Jiama Copper Polymetallic Deposit in Tibet. Ph.D. Thesis, Chengdu University of Technology, Chengdu, China, 2015. [Google Scholar]
  43. Lin, B.; Tang, J.X.; Zhang, Z.; Zheng, W.B.; Leng, Q.F.; Zhong, W.T.; Ying, L.J. Preliminary study of fissure system in Jiama porphyry deposit of Tibet and its significance. Miner. Depos. 2012, 31, 579–589. [Google Scholar] [CrossRef]
  44. Bing, Z.; Bin, L.; Zheng, W.; Yang, S.; Pan, T.; Zebing, Z.; Xin, G. The characteristics of alteration and mineralization and geochronology of ore-bearing porphyry in south pit of Jiama copper-polymetallic deposit, Tibet. Acta Pet. Sin. 2019, 35, 953–967. [Google Scholar] [CrossRef]
  45. Wang, Y.Y.; Zheng, W.B.; Chen, Y.C.; Tang, J.X.; Leng, Q.F.; Tang, P.; Ding, S.; Zhou, Y. Descussion on the mechanism of seperation of copper and molybdenum in Jima porphyry deposit system. Tibet. Acta Petrol. Sin. 2017, 33, 495–514. [Google Scholar]
  46. Tang, X.Q. Characteristics, Genesis and Mineralization of Jiama Copper Polymetallic Skarn in Tibet. Ph.D. Thesis, Chengdu University of Technology, Chengdu, China, 2013. [Google Scholar]
  47. Hancock, E.; Green, A.A.; Huntington, J.F.; Schodlok, M.; Whitbourn, L. HyLogger-3: Implications of Adding Thermal-Infrared Sensing; Geological Survey of Western Australia: Perth, Australia, 2013; p. 24.
  48. Schodlok, M.C.; Whitbourn, L.; Huntington, J.; Mason, P.; Green, A.; Berman, M.; Coward, D.; Connor, P.; Wright, W.; Jolivet, M.; et al. HyLogger-3, a visible to shortwave and thermal infrared reflectance spectrometer system for drill core logging: Functional description. Aust. J. Earth Sci. 2016, 63, 929–940. [Google Scholar] [CrossRef]
  49. Burley, L.L.; Barnes, S.J.; Laukamp, C.; Mole, D.R.; Barnes, S.J.; Fiorentini, M.L. Rapid mineralogical and geochemical characterisation of the Fisher East nickel sulphide prospects, Western Australia, using hyperspectral and pXRF data. Ore Geol. Rev. 2017, 90, 371–387. [Google Scholar] [CrossRef]
  50. Li, J.; Qin, K.; Li, G.; Lin, J.; Xiao, B.; Jiang, H.; Han, F.; Huang, S.; Chen, L.; Zhao, J. Chronology of Qiangdui copper-molybdenum deposit in the east section of Gangdise, composition of skarn garnet and its significance. Geol. Prospect. 2011, 47, 11–19. [Google Scholar]
  51. Meinert, L.D.; Hefton, K.K.; Mayes, D.; Tasiran, I. Geology, zonation, and fluid evolution of the Big Gossan Cu-Au skarn deposit, Ertsberg District, Irian Jaya. Econ. Geol. 1997, 92, 509–534. [Google Scholar] [CrossRef]
  52. Tian, M.; Li, Y.; Wan, H.; Zhang, Y.; Gao, T. Characteristics of skarn minerals in Yongping copper deposit, Jiangxi Province, and geological significances. Acta Petrol. Sin. 2014, 30, 3741–3758. [Google Scholar]
  53. Ying, L.J.; Tang, J.X.; Wang, D.H.; Wang, W.P. Characteristics and genetic significance of garnet from the Jiama super-large copper deposit in Tibet. Acta Geol. Sin. 2012, 86, 1735–1747. [Google Scholar]
  54. Tang, X.Q.; Wang, G.Z.; Qin, Z.P.; Yao, X.F.; Zhou, Y.X. Mineralogical characteristics and genetic significance of garnet from Jiama copper polymetallic deposit in Tibet. Acta Geosci. Sin. 2012, 33, 633–640. [Google Scholar] [CrossRef]
  55. Ai, Y.F.; Jin, L.N. A preliminary study on the relationship between garnet composition and mineralization. J. Peking Univ. (Nat. Sci. Ed.) 1981, 84–91. [Google Scholar] [CrossRef]
  56. Zhao, Y.M.; Tan, H.J.; Sun, J.H. Skarn zoning characteristics of the Makeng and Yangshan iron deposits in Fujian and their relationship with mineralization zoning. J. Rock Miner. 1982, 1, 11–22. [Google Scholar]
  57. Brown, P.E.; Bowman, J.R.; Kelly, W.C. Petrologic and stable isotope constraints on the source and evolution of skarn-forming fluids at Pine Creek, California. Econ. Geol. 1985, 80, 72–95. [Google Scholar] [CrossRef]
  58. Anonymous. Skarn deposits. Skarn Depos. 1995, 75, 317–391. [Google Scholar] [CrossRef]
  59. Kwak, T.A.P. Hydrothermal alteration in carbonate-replacement deposits. Geol. Assoc. Can. Short Course Notes 1994, 11, 381–402. [Google Scholar]
  60. Meinert, L.D. Skarns and skarn deposits. Geosci. Can. 1992, 19, 145–162. [Google Scholar] [CrossRef]
  61. Misra, K.C. Understand Mineral Deposit; Kluwer Academic Publishers: Dordrecht, The Netherlands, 1999; pp. 1–499. [Google Scholar]
  62. Zhao, Y.M.; Lin, W.W. Skarn Deposits in China; Geological Publishing House: Beijing, China, 1990; p. 347. [Google Scholar]
  63. Zhou, Y.; Wang, X.W.; Tang, J.X.; Qin, Z.P.; Peng, H.J.; Li, A.G.; Yang, K.; Wang, H.; Li, J.; Zhang, J.C. Origin and evolution of ore-forming fluids from Jiama copper polymetallic deposit in Tibet. Mineral. Depos. 2011, 30, 231–246. [Google Scholar] [CrossRef]
  64. Herrmann, W. Short Wavelength Infrared (SWIR) spectral analysis of hydrothermal alteration zones associated with base metal sulfide deposits at Rosebery and western Tharsis, Tasmania, and highway-reward, Queensland. Econ. Geol. 2001, 96, 939–955. [Google Scholar] [CrossRef]
  65. Yang, K.; Browne, P.; Huntington, J.; Walshe, J. Characterising the hydrothermal alteration of the Broadlands-Ohaaki geothermal system, New Zealand, using short-wave infrared spectroscopy. J. Volcanol. Geotherm. Res. 2001, 106, 53–65. [Google Scholar] [CrossRef]
  66. Somarin, A.K. Garnetization as a ground preparation process for copper mineralization: Evidence from the Mazraeh skarn deposit, Iran. Acta Diabetol. 2008, 99, 343–356. [Google Scholar] [CrossRef]
  67. Kusakabe, M.; Komoda, Y.; Takano, B.; Abiko, T. Sulfur isotopic effects in the disproportionation reaction of sulfur dioxide in hydrothermal fluids: Implications for the δ 34 S variations of dissolved bisulfate and elemental sulfur from active crater lakes. J. Volcanol. Geotherm. Res. 2000, 97, 287–307. [Google Scholar] [CrossRef]
  68. Reeves, E.P.; Seewald, J.S.; Saccocia, P.; Bach, W.; Craddock, P.R.; Shanks, W.C.; Sylva, S.P.; Walsh, E.; Pichler, T.; Rosner, M. Geochemistry of hydrothermal fluids from the PACMANUS, Northeast Pual and Vienna Woods hydrothermal fields, Manus Basin, Papua New Guinea. Geochim. Cosmochim. Acta 2011, 75, 1088–1123. [Google Scholar] [CrossRef] [Green Version]
  69. Somarin, A.K. Garnet composition as an indicator of Cu mineralization: Evidence from skarn deposits of NW Iran. J. Geochem. Explor. 2004, 81, 47–57. [Google Scholar] [CrossRef]
Figure 1. Geology of the Jiama Cu polymetallic ore deposit showing sedimentary and intrusive rocks, faults and the location of drill holes, including the two transects of drill holes measured by thermal infrared reflectance (TIR) spectra (red lines, “A-A’” and “B-B’”). (adapted from Tang et al. [38]). (a) Tectonic framework of the Tibetan Plateau. (adapted from Guo et al. [20]). (b) Geology of the Jiama Cu polymetallic ore deposit. (adapted from Tang et al. [38]).
Minerals 11 00005 g001
Figure 2. 3-D view of orebodies in Jiama Cu–polymetallic system, including the 1# skarn orebody, the 2# skarn orebody, the porphyry orebody, and the hornfels orebody (adapted from Zheng et al. [41]).
Minerals 11 00005 g002
Figure 3. Drillholes with TIR which lie on transect A and transect B.
Minerals 11 00005 g003
Figure 4. Hand-specimen photos and thin-section microphotographs from the 1# skarn orebody in Jiama Cu–polymetallic system. (a): vein Bn in the garnet-wollastonite skarns; (b): massive Bn + Cp in the garnet skarns; (c): disseminated Mol in the garnet skarns; (d) massive Gn + Cp in the skarnized marble; (e) the early garnet veins are cut by the later garnet veins and then by the late Q + Mol + Grt veins in the garnet skarns; (f) vein Grt + Wo + Bn in the skarnized marble, and ring-shaped garnets can be seen, in which the outer garnet is reddish brown and the inner band is green; (g) the red brown garnet veins are produced in the skarn hornstone, which is the result of selective metasomatism; (h) the light khaki garnet in the skarnized marble is produced in a massive form; (i) hexagonal garnet ring structure;(j) layered garnet; (k) self-shaped granular garnet; (l) Cp + Bn is filled between pomegranate seeds. Q = quartz, Cpy = chalcopyrite, Mol = molybdenite, Gn = galena, Bn = Bornite, Cp = Chalcopyrite Grt = garnet, Wo = Wollastonite.
Minerals 11 00005 g004
Figure 5. Characteristic spectra of garnet minerals (standard spectra from CSIRO TIR spectral database).
Minerals 11 00005 g005
Figure 6. Correlation between garnet wavelength and content of Al2O3, FeO (a,b).
Minerals 11 00005 g006
Figure 7. BSE images (left) and compositional variation profiles of the zoned garnet at Jiama deposit. Yellow dots and white numbers represent the electron probe micro analysis (EPMA) locations and spot numbers, respectively. (a,c) were sample ZK1213-70; (b,d) were sample ZK024-515. Abbreviations: And-andradite, Gro-grossular.
Minerals 11 00005 g007
Figure 8. Triangular classification of garnet in the Jiama deposit (the base map according to [2]. Abbreviations: Adr = andradite; Gro = grossular; Al =almandine; Py = pyrope; Sp = spessartine; Uv = uvarovite).
Minerals 11 00005 g008
Figure 9. The relationship between garnet wavelength and redox properties. (a) Kp calculation diagram (adapted from Zhao et al. [62]), (b) Correlation between garnet wavelength and and Kp.
Minerals 11 00005 g009
Figure 10. Spectrum mapping of garnet. A-A’ (top) et B-B’ (bottom).
Minerals 11 00005 g010
Figure 11. Comparison of garnet wavelength versus Cu, Mo content. (a) Variation of garnet spectral absorption peak down the drill hole, (b) Mo grade changes down the drill hole, (c) Cu grade changes down the drill hole.
Minerals 11 00005 g011
Figure 12. Correlation between garnet wavelength and content of Cu, Mo (a,b). The samples are from drillhole ZK024 and all drillholes with TIR on B-B’ section.
Minerals 11 00005 g012
Table 1. Relationship between garnet colour and spectral characteristic value.
ColourAbsorption Peak Position
Dark brown, black green11,560–11,585 nm
Brown, brown yellow, reddish brown 11,530–11,560 nm
Emerald green, brown black11,510–11,530 nm
Light yellow-green, khaki11,450–11,510 nm
Light khaki, light brown11,220–11,450 nm
Table 2. EPMA analysis results (wt%) and absorption peak of garnet.
Sample
(Dill Hole-Depth)
ZK1218–619 m aZK1616–768 m aZK1616–737.6 m aZK1616–700.96 m aZK817–494 m aZK1522–331.5 m aZK1616–603.1 m aZK3905–152.4 m a
Absorption peak11,575 nm11,553 nm11,544 nm11,498 nm11,450 nm11,380 nm11,310 nm11,223 nm
SiO235.7336.2736.2537.2936.5437.7238.7638.33
TiO20.03000.250.050.370.180.63
Al2O30.12.584.16.838.8811.0816.8418.45
Cr2O300.040000.030.040.06
FeO28.6725.1822.6719.2617.2314.187.073.89
MnO0.390.240.270.270.520.440.610.8
MgO0.070.120.040.330.010.120.260.1
CaO33.734.2634.3734.9334.9535.4835.9336.63
Total98.6998.6997.799.1698.1899.4299.6998.89
Si2.972.982.9932.962.982.982.96
Ti0000.0100.020.010.04
Al0.010.250.40.650.851.031.531.68
Cr00000000
Fe3+21.731.571.291.170.940.450.25
Fe2+00000000
Mn0.030.020.020.020.040.030.040.05
Mg0.010.0100.0400.010.030.01
Ca3.013.023.043.013.0332.963.03
Andradite98.4285.1876.6563.3457.0446.1322.512.18
Grossular0.3913.6622.5834.7841.7952.3675.0885.58
Almandine + Pyrope + Spessartine1.191.040.771.871.181.432.322.07
Note: The calculations are based on 12 oxygens; Spectral data comes from this study; a data from Leng. [42].
Table 3. EPMA analysis results (wt%) of the zoned garnet.
SamplesZK1213–70–1ZK1213–70–2ZK1213–70–3ZK1213–70–4ZK1213–70–5ZK1213–70–6ZK1213–70–7ZK1213–70–8
SiO236.3636.3237.1236.9436.8537.0436.4836.8
TiO20.01000000.010
Al2O33.932.121.650.660.51.410.924.68
Cr2O3000000.0300
FeO21.3924.2522.7824.7625.1523.424.8719.31
MnO0.440.210.250.260.250.470.560.42
MgO0.120.150.030.030.010.040.020.16
CaO34.8934.1234.9334.9634.8834.4834.8434.78
Total97.1497.0596.897.6197.6496.8597.6896.16
Si3.043.073.133.113.13.133.073.09
Ti00000000
Al0.410.220.170.070.050.150.10.49
Cr00000000
Fe3+1.31.421.411.51.521.431.511.2
Fe2+0.20.30.190.230.230.220.240.16
Mn0.030.020.010.010.020.030.040.03
Mg0.020.010000.0100.02
Ca3.133.093.153.163.153.123.153.13
Andradite76.9587.0489.5495.8696.8691.0694.3272.15
Grossular1.212.269.513.242.237.33.9625.83
Almandine + Pyrope + Spessartine1.840.690.930.90.91.641.722
SampleZK1213–70–9ZK1213–70–10ZK1213–70–11ZK1213–70–12ZK024–515–1ZK024–515–2ZK024–515–3ZK024–515–4
SiO236.3136.4936.3636.4435.6835.635.7336.9
TiO200000.050.040.040.62
Al2O32.271.650.870.254.625.213.852.57
Cr2O300000000
FeO23.4823.0124.6524.9822.3321.4223.1922.9
MnO0.480.370.250.230.190.190.180.17
MgO0.020.030.030.030.220.230.210.15
CaO34.4334.9635.2335.5434.6334.3534.2333.9
Total9796.5197.3898.3697.7397.0497.4496.67
Si3.073.13.083.062.982.9933.11
Ti00000000
Al0.240.180.090.030.460.530.40.27
Cr00000000
Fe3+1.41.441.521.581.291.241.341.35
Fe2+0.250.190.220.240.270.260.290.27
Mn0.030.020.020.020.010.010.010.01
Mg00000.030.030.030.02
Ca3.123.183.193.23.13.093.083.06
Andradite86.1689.6994.6398.4573.970.6177.7884.03
Grossular12.349.064.440.6924.5327.7820.714.68
Almandine + Pyrope + Spessartine1.491.240.930.851.561.61.51.28
SampleZK024–515–5ZK024–515–6ZK024–515–7ZK024–515–8
SiO236.0835.8735.3636.04
TiO200.020.060
Al2O30.461.432.120.26
Cr2O30000
FeO26.2625.8224.7626.7
MnO0.120.140.230.11
MgO0.10.090.060.1
CaO34.334.3734.5134.49
Total97.3297.7497.197.7
Si3.073.0333.06
Ti0000
Al0.050.150.230.03
Cr0000
Fe3+1.561.511.471.59
Fe2+0.310.320.290.31
Mn0.010.010.020.01
Mg0.010.010.010.01
Ca3.133.113.143.14
Andradite97.1591.3687.498.4
Grossular1.957.7611.650.75
Almandine + Pyrope + Spessartine0.880.870.910.83
Note: The calculations are based on 12 oxygens.
Table 4. EPMA analysis results (wt. %) and NFeGr of garnet.
Samples
(Drill Hole-Depth)
Absorption PeakElements (%) NFeGr
SiO2TiO2Al2O3Cr2O3FeOMnOMgOCaOTotal
ZK4903–153.3 m a11,480 nm37.920.0710.19015.820.520.0535.1499.710.16
ZK3905–152.4 m a11,223 nm38.330.6318.450.063.890.80.136.6398.890.04
ZK1522–356.84 m a11,540 nm36.690.134.34022.20.160.1233.6297.260.23
ZK721–423 m a11,548 nm36.470.074.1023.220.280.0434.1898.360.24
ZK817–494.3 m a11,380 nm38.630.0814.7509.940.810.136.04100.350.1
ZK817–515.1 m a11,450 nm36.870.8810.38015.140.420.0634.8198.560.15
ZK817–595.7 m a11,558 nm36.30.12.120.0225.840.150.0933.9998.610.26
ZK1616–737.6 m a11,544 nm36.2504.1022.670.270.0434.3797.70.23
ZK4015–925 m a11,572 nm35.750.040.260.0628.670.270.0933.9499.080.3
Note: Spectral data comes from this study; a data from Leng [42].
Table 5. EPMA analysis results (wt. %) and NFePx of pyroxene.
Samples
(Drill Hole-Depth)
Elements (%) NFePx
SiO2TiO2Al2O3Cr2O3FeOMnOMgOCaONa2OK2OTotal
ZK4903–153.3 m a54.7700.110.032.750.9116.8525.90.010.01101.340.03
ZK3905–152.4 m a54.0800.380.093.631.2716.1525.720.140101.460.04
ZK1522–356.84 m a55.3100.1800.740.3218.6325.90.050.01101.140.01
ZK721–423 m a54.610.020.1301.740.7217.826.030.090.02101.160.02
ZK817–494.3 m a53.7400.2506.271.2214.2525.270.090101.090.06
ZK817–515.1 m a53.710.050.160.016.441.2114.2125.40.130101.320.06
ZK817–595.7 m a55.0200.6901.050.5118.526.3200102.090.01
ZK1616–737.6 m a54.840.010.17010.5318.1726.100100.820.01
ZK4015–925 m a53.4300.082.5810.5418.0325.3800.03101.070.01
Note: a data from Leng. [42].
Publisher’s Note: MDPI stays neutral with regard to jurisdictional claims in published maps and institutional affiliations.

