Article

Microstructure and Pb2+ Adsorption Properties of Blast Furnace Slag and Fly Ash based Geopolymers

1
Facultad de Ingeniería Mochis, Universidad Autónoma de Sinaloa, Los Mochis, Sinaloa 81223, Mexico
2
Departamento de Química, División de Ciencias Naturales y Exactas, Universidad de Guanajuato, Guanajuato 36050, Mexico
3
Escuela de Ingeniería Mazatlán, Universidad Autónoma de Sinaloa, Mazatlán, Sinaloa 82146, Mexico
*
Author to whom correspondence should be addressed.
Minerals 2020, 10(9), 808; https://doi.org/10.3390/min10090808
Submission received: 11 August 2020 / Revised: 11 September 2020 / Accepted: 11 September 2020 / Published: 13 September 2020
(This article belongs to the Special Issue Alkali Activated Materials: Advances, Innovations, Future Trends)

Abstract

:
In this study, a blast furnace slag (BFS) and fly ash (FA) based adsorbent geopolymer to be used for removing Pb2+ from aqueous solutions were synthesized using the hydrothermal method at 60 °C for 24 h, and then cured at 25 °C for another six days. The alkali activator applied in this work was a combination of sodium hydroxide and sodium silicate solutions at a mass ratio of 2. The geopolymer slurry was adjusted to a Si/Al molar ratio of 3. A BFS-based geopolymer (GS) having a specific area of 23.56 m2/g and pore size and volume of 7.8 nm and 73 cm3/kg, respectively, surpassed the raw material surface by approximately 13-fold. An FA-based geopolymer (GA) having a specific area of 35.97 m2/g and a size and porous volume of 9 nm and 124 nm, respectively, surpassed the raw material surface by approximately 23-fold. In addition, GS and GA showed a cation exchange capacity (CEC) of 241.30 and 286.96 Meq/100 g, respectively. X-ray diffraction (XRD) determined sample crystallinity and it was proven by scanning electron microscopy (SEM), showing that both geopolymers were constituted of unreacted particles surrounded by amorphous and semi-amorphous products. Through Fourier transform infrared spectroscopy (FTIR), a band that was assigned to the asymmetric stretching vibration of Si-O-M (M = Na+ and/or Ca2+) non-bridging oxygen type was observed, which suggested that Na and Ca could serve as exchangeable ions in the ionic exchange process. Adsorption test data indicated that good adsorption was obtained when a neutral pH was used at room temperature, and the adsorption isotherm showed that GA had more adsorption sites than GS, which meant greater maximum adsorption capacity.

1. Introduction

Urbanization and industrialization have led to serious problems for the environment due to the heavy metal pollution in wastewater. It is estimated that industrial activity in México will generate a wastewater volume that is close to 2.1 millions of square meters by 2030 [1]. Heavy metals are highly hazardous pollutants, because of their high toxicity, non-degradability, and tendency to accumulate in living organisms [1,2,3,4]. Several studies have identified industrial wastewater sources containing lead, which include metal smelting processes, the manufacture of lead-based paints, metallurgy, mining, and alloys [5,6]. Waste emissions from these industries are the main cause of lead contamination in food, as they accumulate in animal tissues and organs and, subsequently, go into the production of meat, milk, and eggs. Fertilizer utilization in agriculture also causes metal pollution through the accumulation in vegetables and leaves [7,8,9]. Lead can be found to be dissolved in sulphate and hydroxide forms; at an acid pH, it remains a divalent cation. The main entry route of this metal into organisms are intake and inhalation. Human body in adult age can absorb an average of 10–15% of the ingested quantity [10]. Its residence time is from 20 to 40 days in the blood and from 10 to 30 years in tissues and bones, thus it mainly accumulates in bones, kidneys, and liver. An excess of lead in the human body can cause encephalopathy, psychomotor abnormalities, kidney, liver, and hematological system damage (hypertension and cardiovascular), as well as lung, stomach, brain, and kidney cancer [11,12,13,14]. Environmental levels of lead have increased more than 1000-fold in the last three centuries [15]. Because of anthropogenic activities, it is the most common heavy metal in wastewater [11,16].
Various heavy metal removal methods for wastewater have been used, including chemical precipitation, membrane filtration, adsorption, etc. [17,18,19]. Each method has advantages; nevertheless, industries tend to choose the cheapest option. Adsorption by ion exchange is a viable option, because of its high efficiency and simplicity. It is a process in which ions in aqueous solution are transferred (since they are attracted by electrostatic charges) to a solid matrix, which releases a different kind of ions with equal charge [20,21,22,23]. Zeolites and activated carbons are some of materials used for metal removal by adsorption due to their high surface area and porosity; however, these materials are quite expensive due to the depletion of raw material sources and the high energetic requirements of the synthesis process. For this reason, further investigation is needed to develop new and better options that solve the lead-contaminated wastewater problem [24,25]. Geopolymers have been explored as an economic, effective, and ecofriendly heavy metal adsorbent [25,26]. These materials are the amorphous equivalent of zeolites, because they are three-dimensional inorganic polymers of alkaline aluminosilicates, constituted of chains of AlO4 and SiO4 tetrahedra and linked together by shared oxygen atoms. Zeolites are highly crystalline, and geopolymers are mainly amorphous and semi-amorphous. The network that constitutes these materials is negatively charged, due to the Al3+ generated from being linked to four oxygens [27,28,29,30,31]. This charge is compensated by cations that are trapped in intracrystalline spaces; these ions are easily interchangeable, and this peculiarity gives the geopolymer the ability to attract ions. Unlike zeolites, geopolymer synthesis requires low temperature and, in general, several wastes, such as industry by-products, can be used as aluminosilicate sources in geopolymer synthesis [32,33,34,35,36]. Blast furnace slag (BFS) is a non-metallic residual material of steel fabrication. Blast furnaces are fed with controlled mixes of iron ore (Fe2O3 + SiO2), coke (C), and limestone (CaCO3), and they operate at temperatures around 2000 °C. The resulting material is steel and remnant slag [37]. In total, the Mexico steel sector generates more than four million tons per year of BFS, of which 70% is reused in productive processes as substitutes and 30% is accumulated in landfills [38]. However, fly ash (FA) is produced from burning pulverized coal in electric power generating plants. It is a fine-grained, powdery particulate material that is collected from the exhaust gases by electrostatic precipitators. In México, the combustion of one ton of coal generates an average of 80 to 250 kg of FA, and its utilization is only 1/4th of the total production worldwide [37]. The use of these two materials is essential to mitigating landfill and environmental issues that are associated with waste disposal, which increases the recycling of by-products. The main purpose of this research is to contribute to solving these environmental pollution problems by synthetizing alkali-activated BFS- and FA-based geopolymers for use as an adsorbent of Pb2+, determining the effect of pH and initial concentration, as well as assessing cationic exchange capacity and studying its behavior as an adsorbent in an aqueous medium.

2. Materials and Methods

2.1. Materials

Altos Hornos de México, S.A.B. de C.V., which is located in Monclova, Cohahuila, México, provided the BFS used in this study. The FA was obtained from the thermal power plant José López Portillo, located in Nava city, México. The chemical composition (Table 1) was determined by X-ray fluorescence (XRF) while using a Bruker S4 Pioneer (Centro de Investigaciones en Óptica A.C. (CIO), León, Gto., México).
The raw BFS was supplied with agglomerated particles with average size of 3.7 cm, and they were subjected to a size reduction process by grinding; this process was carried out in a rotating balls mill with nineteen steel ball of 540 g each for a period of 2 h; with this grinding time, finer and non-agglomerated particles are obtained that facilitate the synthesis of geopolymers [39]. The BFS resulted in milling, and the FA were sectioned with sieving (45 μm ASTM E11-95 [40]) to obtain a surface area of 1.79 m2/g and 1.37 m2/g for the BFS and FA, respectively.
For the alkali activator solution (AAS), a mix of sodium hydroxide (NaOH) pellets with ±97% purity, containing sodium carbonate (Na2CO3) in 1% at 10 M and sodium silicate solution (Na2O3Si) with a modulus (SiO2/Na2O ratio) of 2.8 was used. The mix was obtained according to a mass ratio (Na2OSiO3/NaOH) of 2.
Aluminum hydroxide (Al(OH)3) containing aluminum oxide (Al2O3) between 50% and 57.5% was used as the source of aluminum (AS).
Distilled water with a pH between 6 and 7.5 and total dissolved solids between 2 and 5 mg/L was used as the solvent for NaOH.
The aqueous Pb2+ solution was prepared by dissolving Pb(NO3)2 in deionized water (standard solution). The concentration was diluted before the adsorption experiment. The pH value of the Pb2+ solution was adjusted while using 0.1 M HNO3 and 0.1 M NaOH.

2.2. Geopolymer Synthesis

BFS and FA were individually combined with AS, and then mechanically mixed with the AAS to create a geopolymer slurry that was adjusted to a mass molar ratio Si/Al of 3. BFS-based geopolymer slurry have molar ratios SiO2/Al2O3 = 5.26, Na2O/SiO2 = 0.48 and H2O/Na2O = 6.98 and FA-based geopolymer slurry, molar ratios SiO2/Al2O3 = 5.42, Na2O/SiO2 = 0.15 and H2O/Na2O = 11.16.
After it was mixed until homogeneous (about 1 min.), the geopolymer slurry was cast into a plastic mould (2 × 2 × 2 cm), and then subjected to hydrothermal curing at 60 °C for 24 h until it achieved geopolymerization, and was then subjected to water-submerged curing at 25 °C for another six days. The geopolymer samples were then dried in oven at 100 °C for 24 h, cooled, ground, sieved (150 μm ASTM E11-95 [40]), and labelled as GS (BFS-based geopolymer) and GA (FA-based geopolymer).

2.3. Microstructure Analysis

Materials crystallinity was determined by X-Ray diffraction (XRD) while using a Bruker D8 Advanced diffractometer (Centro de Investigación en Materiales Avanzados S.C.(CIMAV), Chihuahua, Chih., México). XRD analysis was performed in the 2θ range of 15° to 70° in order to verify the change from the crystalline phases of the raw materials to geopolymers. Fourier transform infrared spectroscopy (FTIR) was carried out using tablets mixed with KBr in a Bruker spectrophotometer model ATR Tensor 27 and the analysis was carried out in the frequency range of 4000–400 cm−1 to identify the functional groups of BFS, GS, FA, and GA. Peak deconvolution using Gaussean peak fitting was performed.
For SEM observation, hardened samples fragments were coated with gold to obtain the necessary conductivity to acquire the secondary electron images, and to observe porosity, microcracks, and crystals that are present in geopolymer matrix. The geopolymer morphology was obtained by SEM while using a Hitachi SU3500 scanning electron microscope (Advanced Materials Research Center (CIMAV), Chihuahua, Chih. México), at 3000×, 7000×, 13,000×, and 30,000×.
The texture properties were measured by N2 adsorption via a Brunauer–Emmett–Teller (BET) method using a Quantachrome Autosorb automated gas sorption system.

2.4. Cation Exchange Capacity (CEC)

The materials cation exchange capacity was determined by the Na+ ion saturation with 1.0 N sodium acetate (CH3COONa), and subsequently a Na+ ion exchange by NH4+ with 1.0 N ammonia acetate (CH3COONH4). The CEC was estimated by an equation following [41]:
CIC   ( m e q 100 g ) = [ N a + ] V ( 100 ) m   M W
where:
  • [Na+] = Na+ concentration in exchangeable solution (mg/L)
  • V = Exchangeable solution volume (L)
  • m = Mass
  • MW = Molecular weight

2.5. Batch Adsorption Operation

Lead adsorption was investigated in batch tests at a constant temperature of 25 °C. The tests were carried out, as follows: 0.5 g of geopolymer sample was added to 40 mL of Pb2+ solution with a different initial concentration (5, 10, 20, 50, 100, 200, and 500 mg/L) at pH values that ranged from 2 to 8 for a period of time of six days.
For each test, the lead concentration was determined by atomic absorption spectroscopy (AAS), while using the atomic absorption spectrophotometer GBC Avantar 4324 (Universidad de Guanajuato, Gto., México), and calculating the uptake percentage using the following equation [4]:
% R = C 0 C e C 0   ×   100
where:
  • C0 = Initial concentration of heavy metal solution (mg/L)
  • Ce = Remaining equilibrium or final concentration (mg/L)
The adsorption amount was calculated using the following equation [42]:
q = ( C 0 C e ) V m
where:
  • V = Solution volume (L)
  • m = Mass of adsorbent (g)
Thus, once the value of q was obtained for each Ce value, those values were correlated to the Langmuir–Freundlich [43] model and their adsorption isotherms were obtained.

3. Results and Discussion

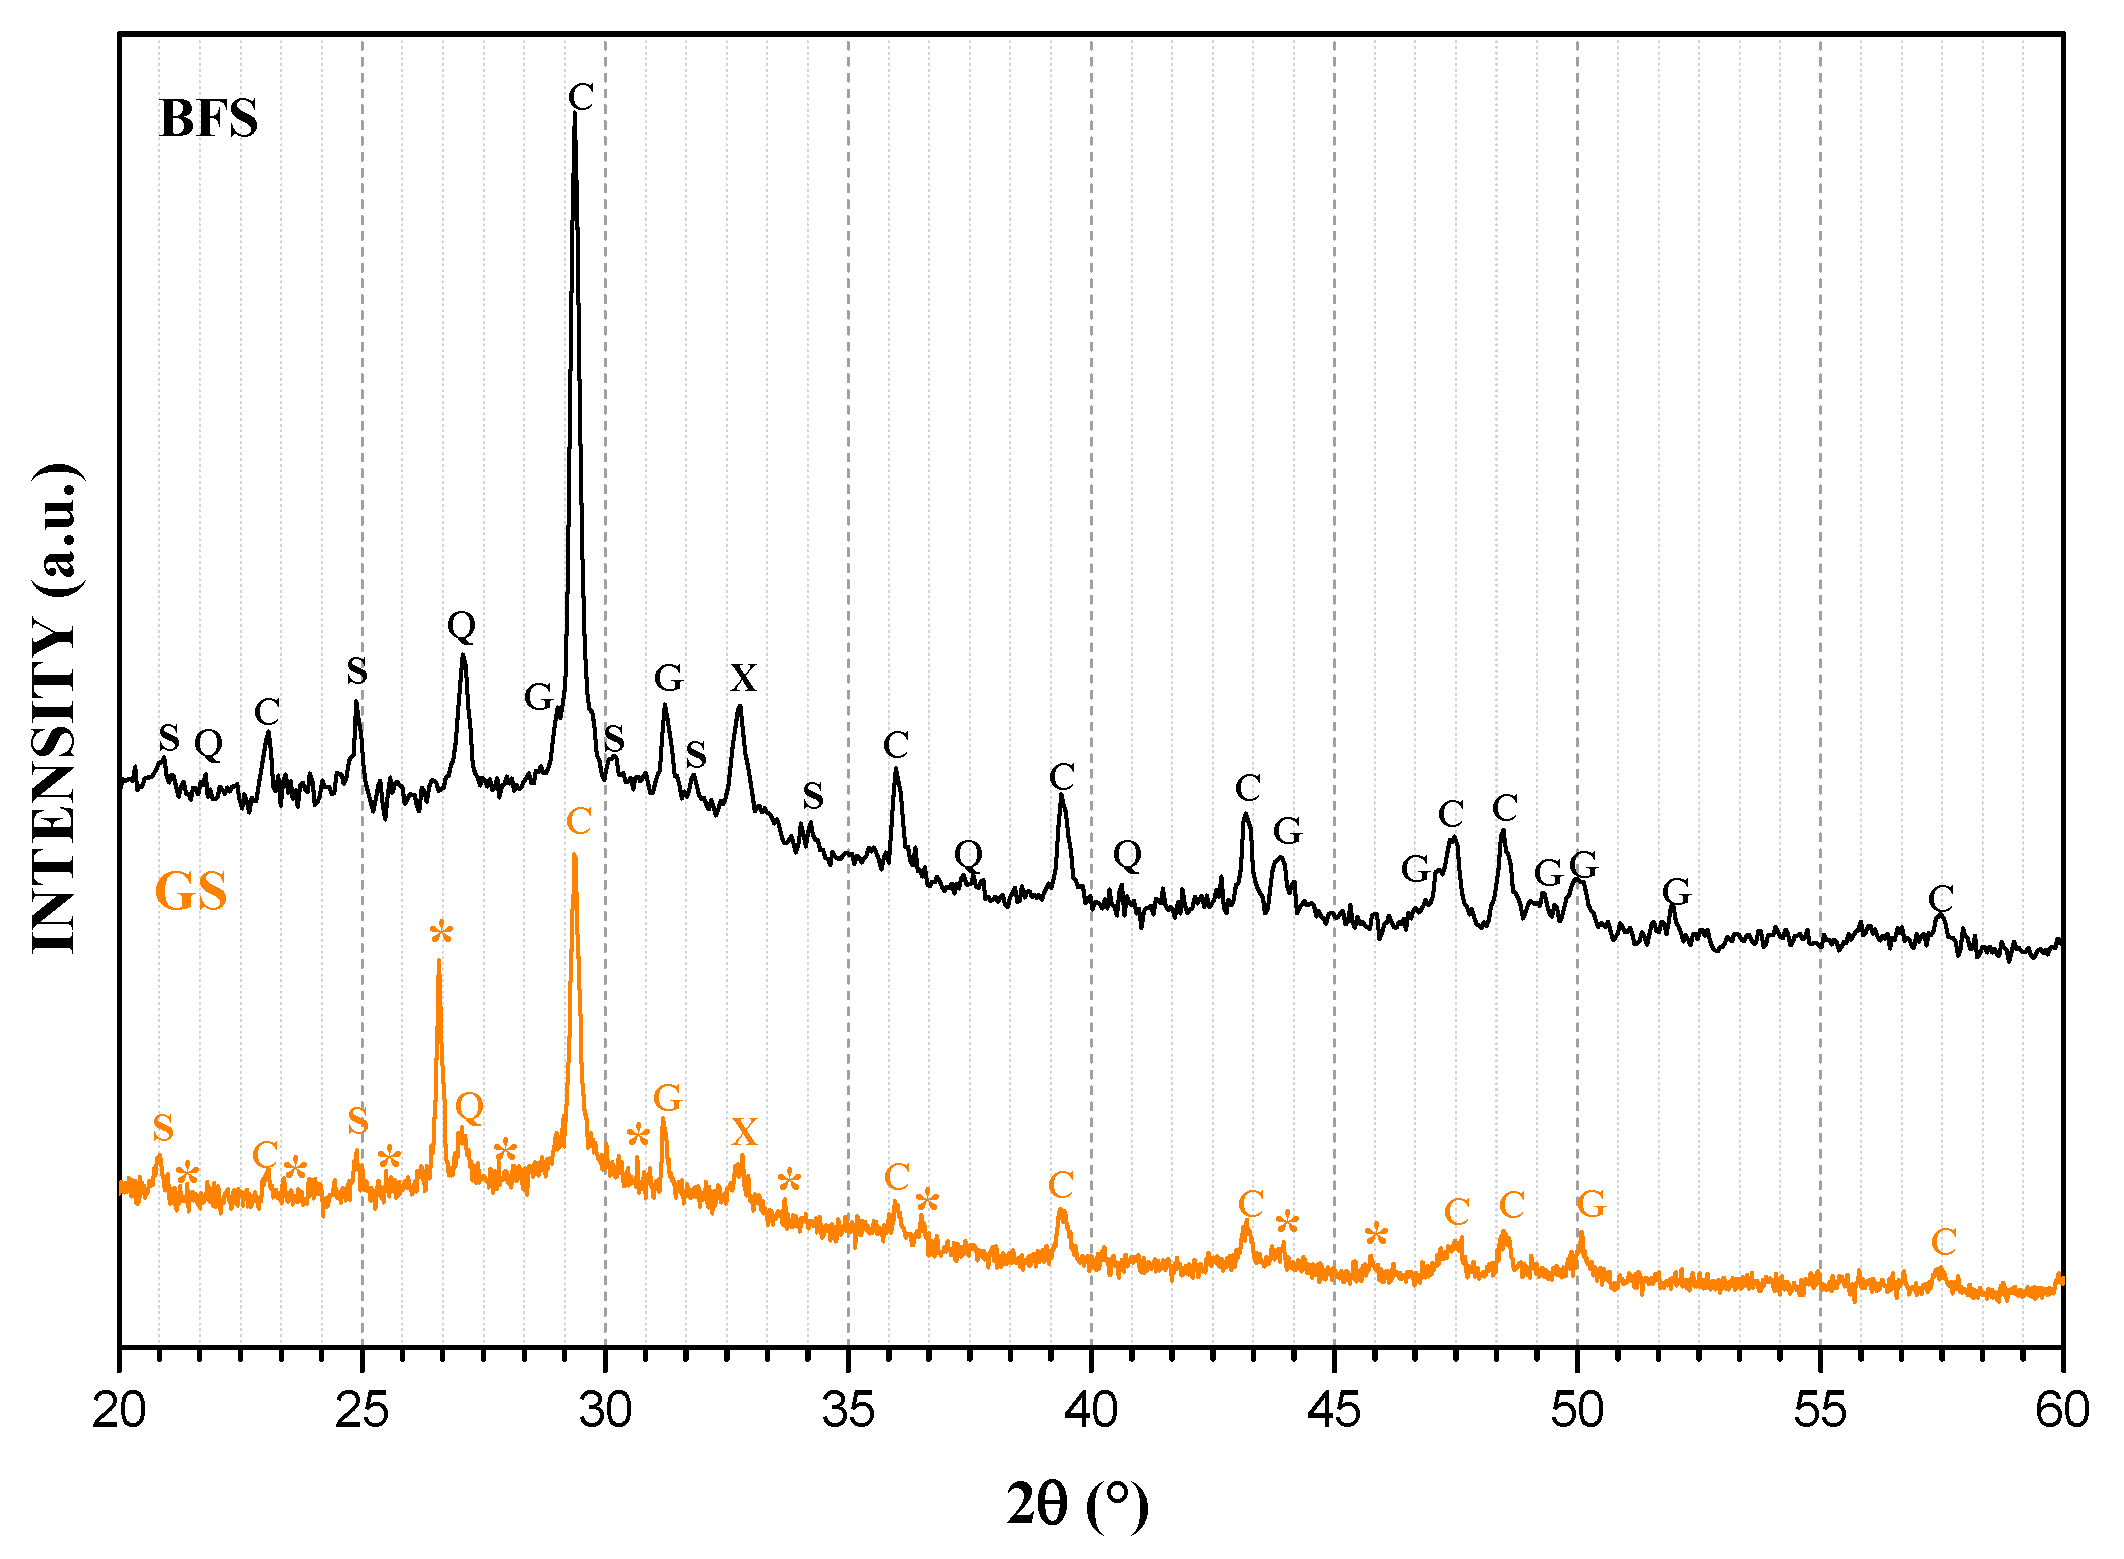
3.1. Mineralogical Analyses

Figure 1 presents the XRD pattern of BFS and GS. In the patterns, the main peak is located around 30° 2θ, which corresponds to Calcite (CaCO3) and it is associated with a large amount of CaO in raw BFS and its interaction with CO2 in the environment. This phase constitutes most of the BFS and GS. The other carbonate found is magnesite (MgCO3) around 33° 2θ due to a small but significant amount of MgO in the raw material. Calcium is linked to Si and Al, forming calcium aluminosilicate, also called gehelenite (Ca2Al(SiAl)O7). Finally, a small peak around 27° 2θ is attributed to Quartz (SiO2). Because all of these phases appear in both BFS and GS, it is possible to note that the crystalline structure of the raw material did not completely dissolve during the geopolymerization process. However, it is possible to observe wide dispersion peaks and a hump between 25-40° 2θ identifying the amorphous structure of several typical metallurgical slags [44] and synthetized geopolymers, like GS [39,45]. In GS, it can observe new phases calcium aluminosilicate hydrated gel (CASH), such as chabasite-Ca (Al3.6Ca1.76H19.74O33.87Si8.4) and chantalite (Al2CaH4O8Si), with triclinic and tetragonal structures, respectively, as well as sodium aluminosilicate hydrated (NASH) gel in a phase, called Analcime (Al2H4Na1.862O13.667Si4), with an isometric crystal structure [46].
On the other hand, Figure 2 presents the patterns of FA and GA. It is possible to observe that the FA is composed of quartz (SiO2) corresponding to a peak around 27° 2θ and mullite (Al6Si2O13). After geopolymerization, the ions of these phases were redirected in an activated process and formed NASH-type gels, such as analcime (Al2H4Na1.862O13.667Si4) and ussingite (AlHNa2O9Si3), with orthorhombic and triclinic structure, respectively.
GS and GA both present phases that contain Al in their structure. This could indicate a greater number of exchange sites in the geopolymer, as the Al in the structure represents the sites where metal ions are exchanged for compensating ions in the solid matrix (Na and Ca in this case). Table 2 summarizes the crystalline phases identified using XRD [47,48,49,50,51].

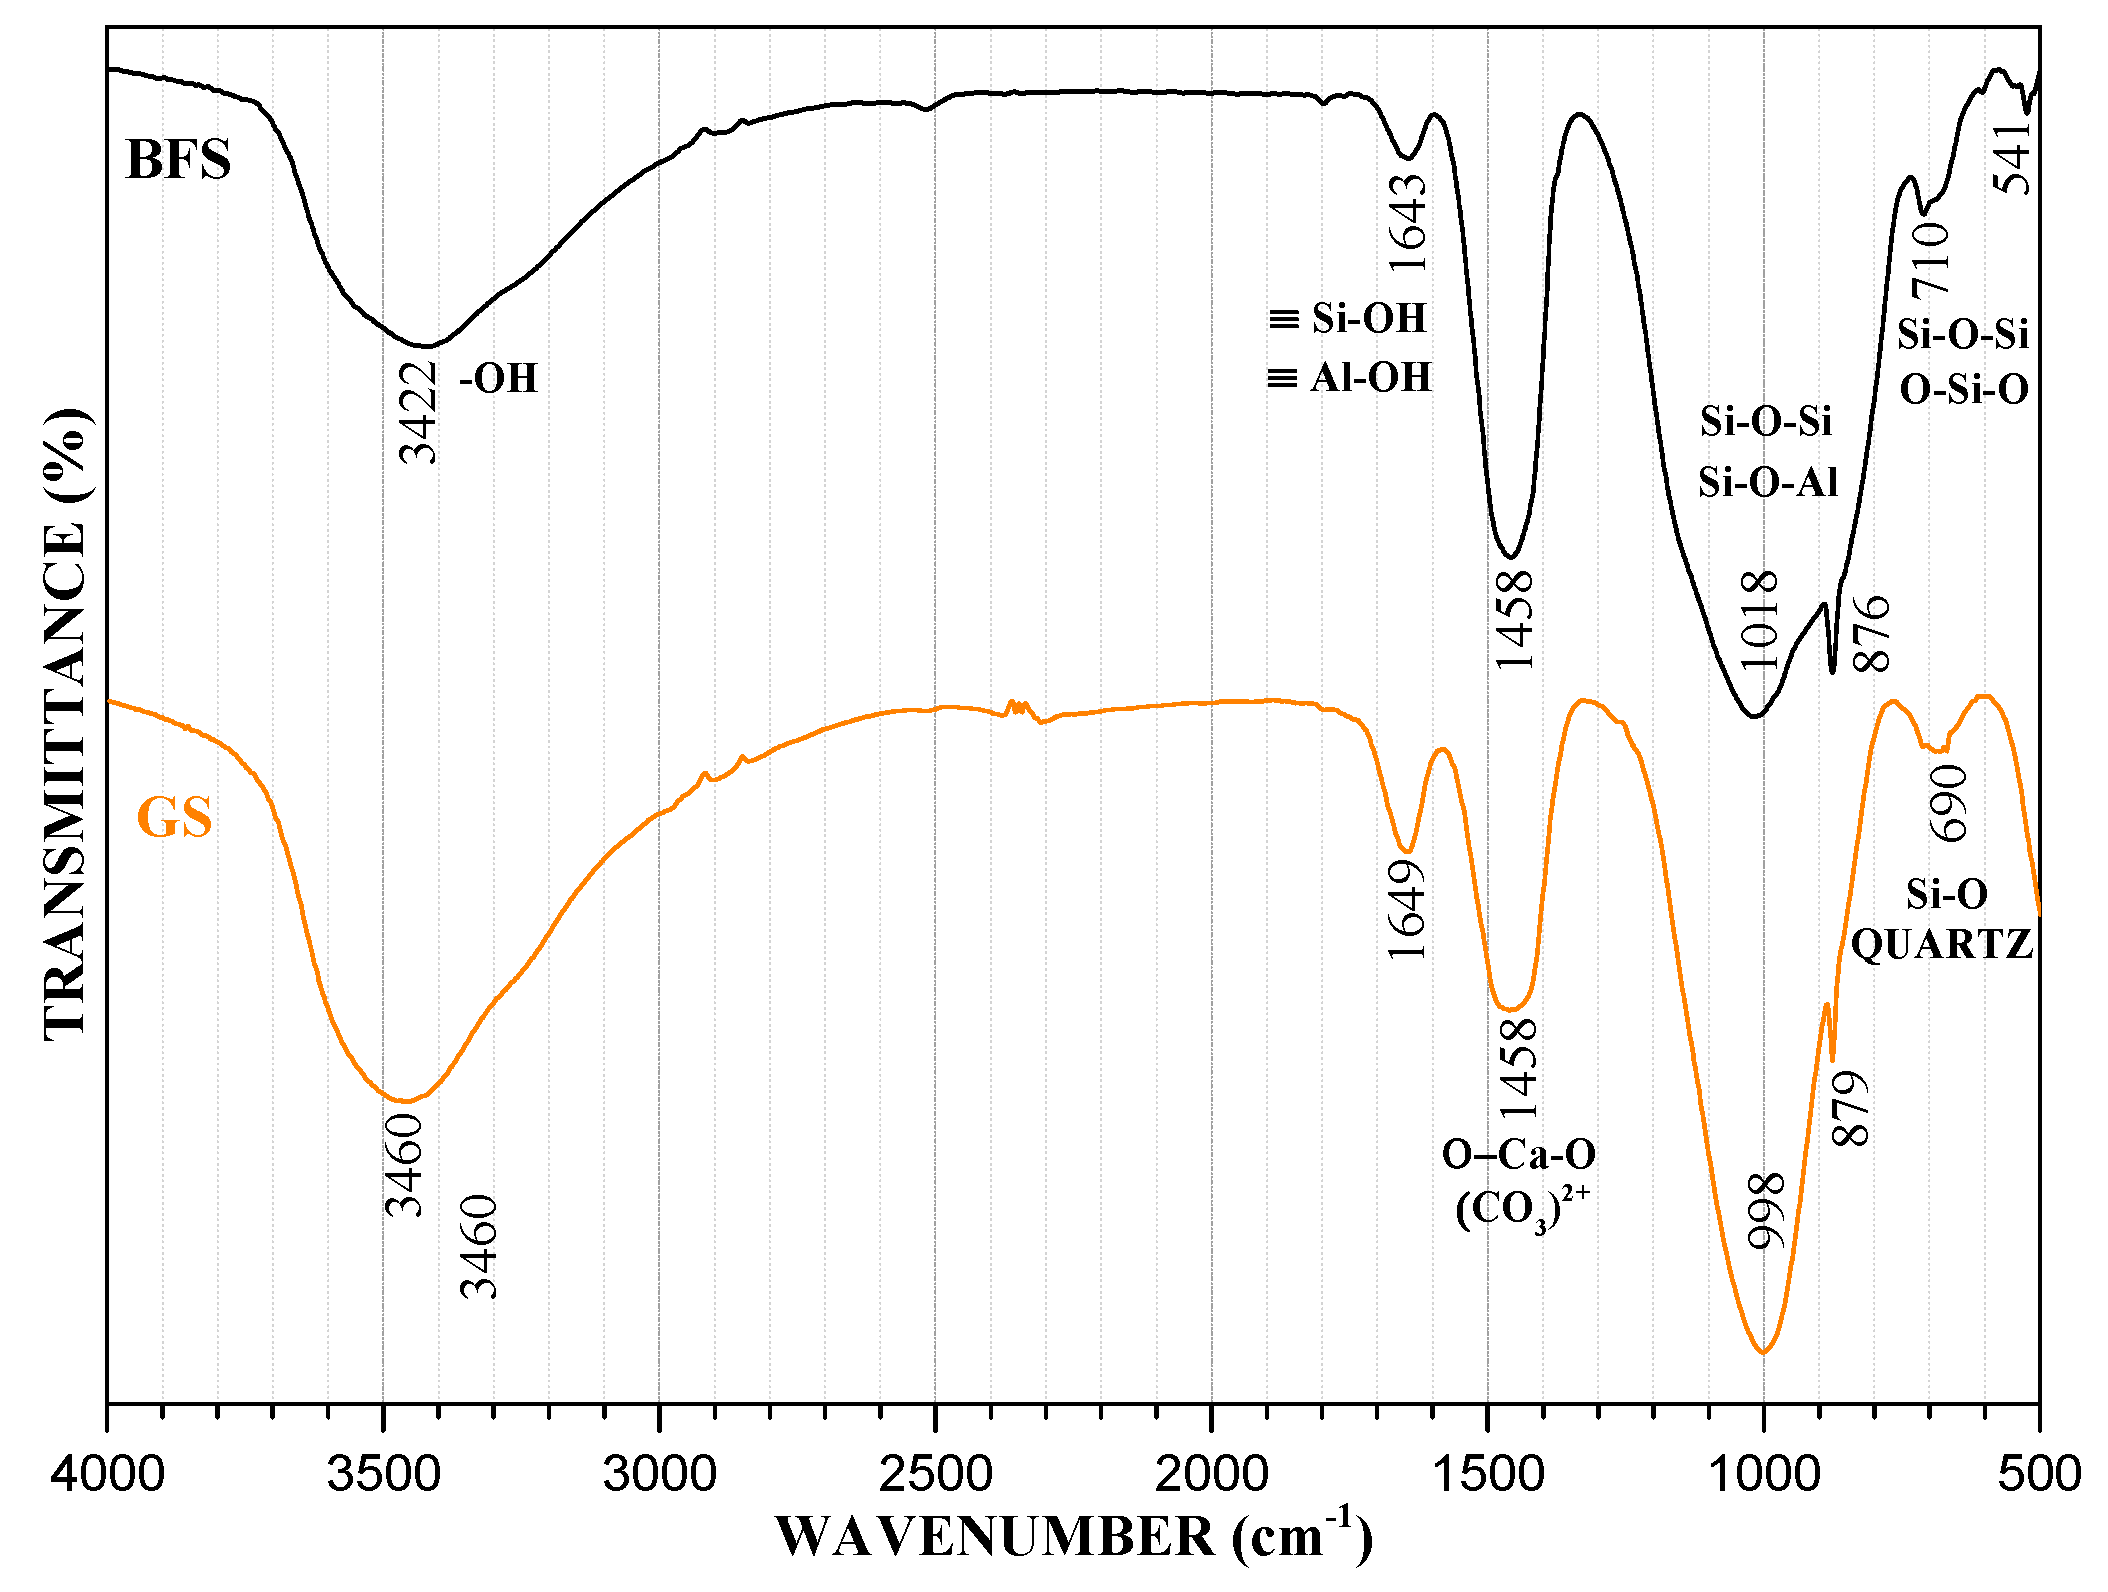
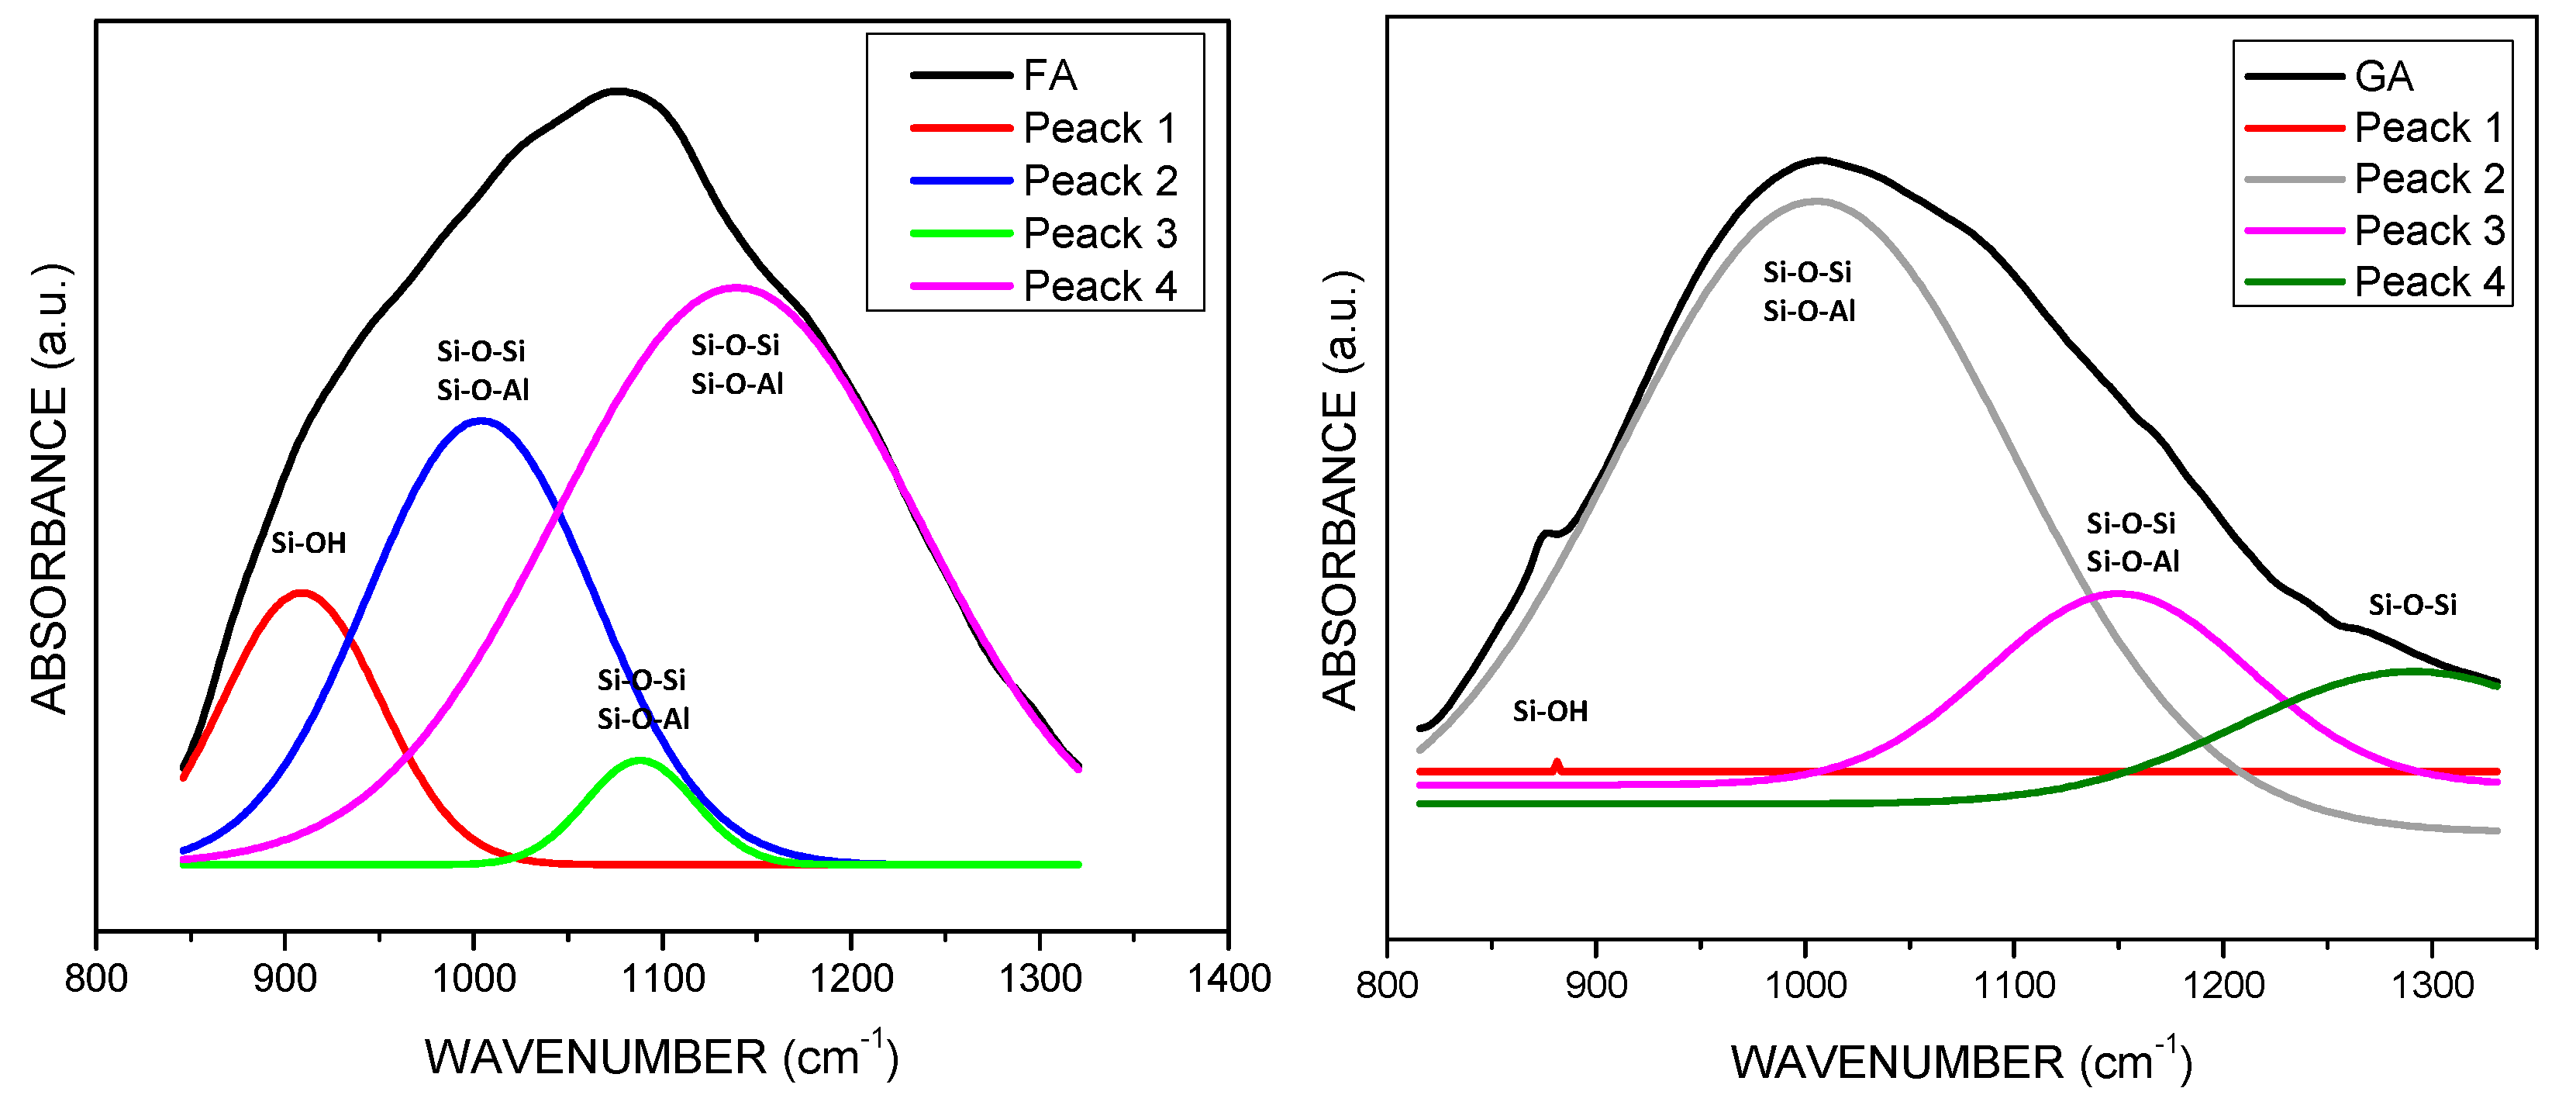
3.2. Fourier Transform Infrared Spectroscopy (FT-IR)

Figure 3 shows the spectra that were obtained for BFS and GS. In both spectrums, it can be observed the bands between 500 and 700 cm−1 associated with the vibrations of Si-O-Si or O-Si-O bonds, and both are attributed to Quartz. In raw material, there is a band at 541 cm−1, which was assigned to the symmetric stretches of the Si-O bonds, and the 710 cm−1 band is generated by in-plane bending vibrations of the same kind of bond, as well as the 690 cm−1 band in GS. Both types of vibration correspond to quartz [52].
The aluminosilicate characteristic band is located around 1000 cm−1. This band indicates asymmetric stretches on the Si-O-Si or Si-O-Al bonds of unreacted raw material. In BFS, it is situated at 1018 cm−1 and, in GS, it is displaced to 998 cm−1. This behavior is because a three-dimensional network of Si-O bonds has not been well formed, as the glassy structure of the BFS is enriched with Ca and a large amount of this element is present at early ages in the solution. It consumes the Si and Al units, as they react preferentially with Ca to form a CASH gel instead of accumulating continuously. Figure 4 represents the deconvolution analysis of BFS and GS and shows the changes of molecular vibration that were present in the aluminosilicate characteristic band. The amorphous structure and the BFS intermolecular bonds produce more bands that together form a broad band. GS forms a tight band instead. In addition, because the position of this band depends on the Si/Al ratio of the product formed, the band moves at lower frequencies due to the rise in the tetrahedral aluminum content [51,53,54,55,56,57,58,59]. The replacement of Si4+ by Al3+ results in the T-O-T (T = Si or Al) angle becoming more acute, and the band changing to lower frequencies because the Al-O bond is longer than the Si-O bond. The degree of substitution of the Si atoms by Al atoms has an important effect in the direction of the displacement of this band. On the other hand, bands located at wavenumbers 876 cm−1 in the raw material and at 879 cm−1 in GS may be attributed to the vibration in non-bridging oxygen bonds with Si-O-M (M = Na+, Ca2+). Na+ ions are produced by the alkali activator (NaOH + Na2O3Si), and the Ca2+ ions are produced by the main component in BFS (CaCO3). These two ions are the interchangeable ions in the geopolymer. They may be released from the structure and leave a space for the metal ion (Pb2+), whereby its presence is essential to the efficiency of the ion exchange mechanism [60,61,62].
On the other hand, there is a band at 1458 cm−1 in BFS and GS. This band corresponds to asymmetric stretches on the O-C-O bonds belonging to the CO32− groups [51,63]. Finally, bands corresponding to O-H groups of chemically and physically bound water appear both in the GS and in the BFS. Water is necessary in the geopolymerization process, because it implies the dissolution of solid particles and Al3+ and Si4+ hydrolysis. The bands that are located at 1643 cm−1 in BFS and at 1649 cm−1 in GS are owing to vibrations in the weak bonds of silanol (≡Si-OH) and aluminol (≡Al-OH) of the physically bound water linked to the surface, and cavities in the structure of the geopolymer. Following this, a broad band around 3460 cm−1 in GS and 3422 cm−1 in BFS are attributed to stretching vibrations in the O-H bonds of the hydroxyl groups of the chemically bound water in the material [37].
Figure 5 presents FA and GA spectra. It can be observed that the first bands are located around 650 and 688 cm−1. These bands correspond to vibrations of Si-O-Si and O-Si-O bonds and they are attributed to Mullite phase. Subsequently, FA presents a band around 788 cm−1 corresponding to Quartz Si-O bonds. Mullite bonds bands do not appear in GA, which suggests that the Mullite phase ions were redirected to form reaction gels. Conversely, the bands between 700 and 800 cm−1 in GA are attributed to the Quartz of the raw material. Aluminosilicate characteristic bands appear in FA around 1076 cm−1 and around 1007 cm−1 in GA. In addition to the BFS-based geopolymers, we can observe a small but important displacement to a lower signal in the deconvolution study in Figure 6. FA presents different bands that, just like BFS, could indicate the Si-O-Si or Si-O-Al bonds in aluminosilicate phases; once the geopolymerization is carried out, the number of bans decreases and GS and GA show a broad band instead, which may indicate that the Si-O-Si or Si-O-Al bonds correspond to amorphous NASH and CASH gel phases. The case of GA indicates that the Si and Al units were consumed by a high amount of Na, contributed by alkali activator, in order to form NASH type gel.
However, the atmospheric carbonation band is located in GA 1428 cm−1. This band is caused by vibrations in the O-C-O bonds and it indicates the presence of sodium bicarbonate in the samples. Finally, the bands caused by vibration in H-O-H and -OH bonds were also present in the geopolymers in the raw material. This bands corresponds to physically and chemically bonded water the same as occurs in GA. After geopolymerization, this band becomes broader, which is possibly due to an increase in water molecules by the hydrolysis process effect.
In general, it is possible to observe in all materials that the most intense band corresponds to the asymmetric stresses of Si-O-Si or Al-O-Al bonds. This is because BFS and FA mainly conform to aluminosilicates. In the BFS case, the main component is CaO in CaCO3 form. For this reason, the carbonates band (around 1400 cm−1) is more intense in BFS than in FA.

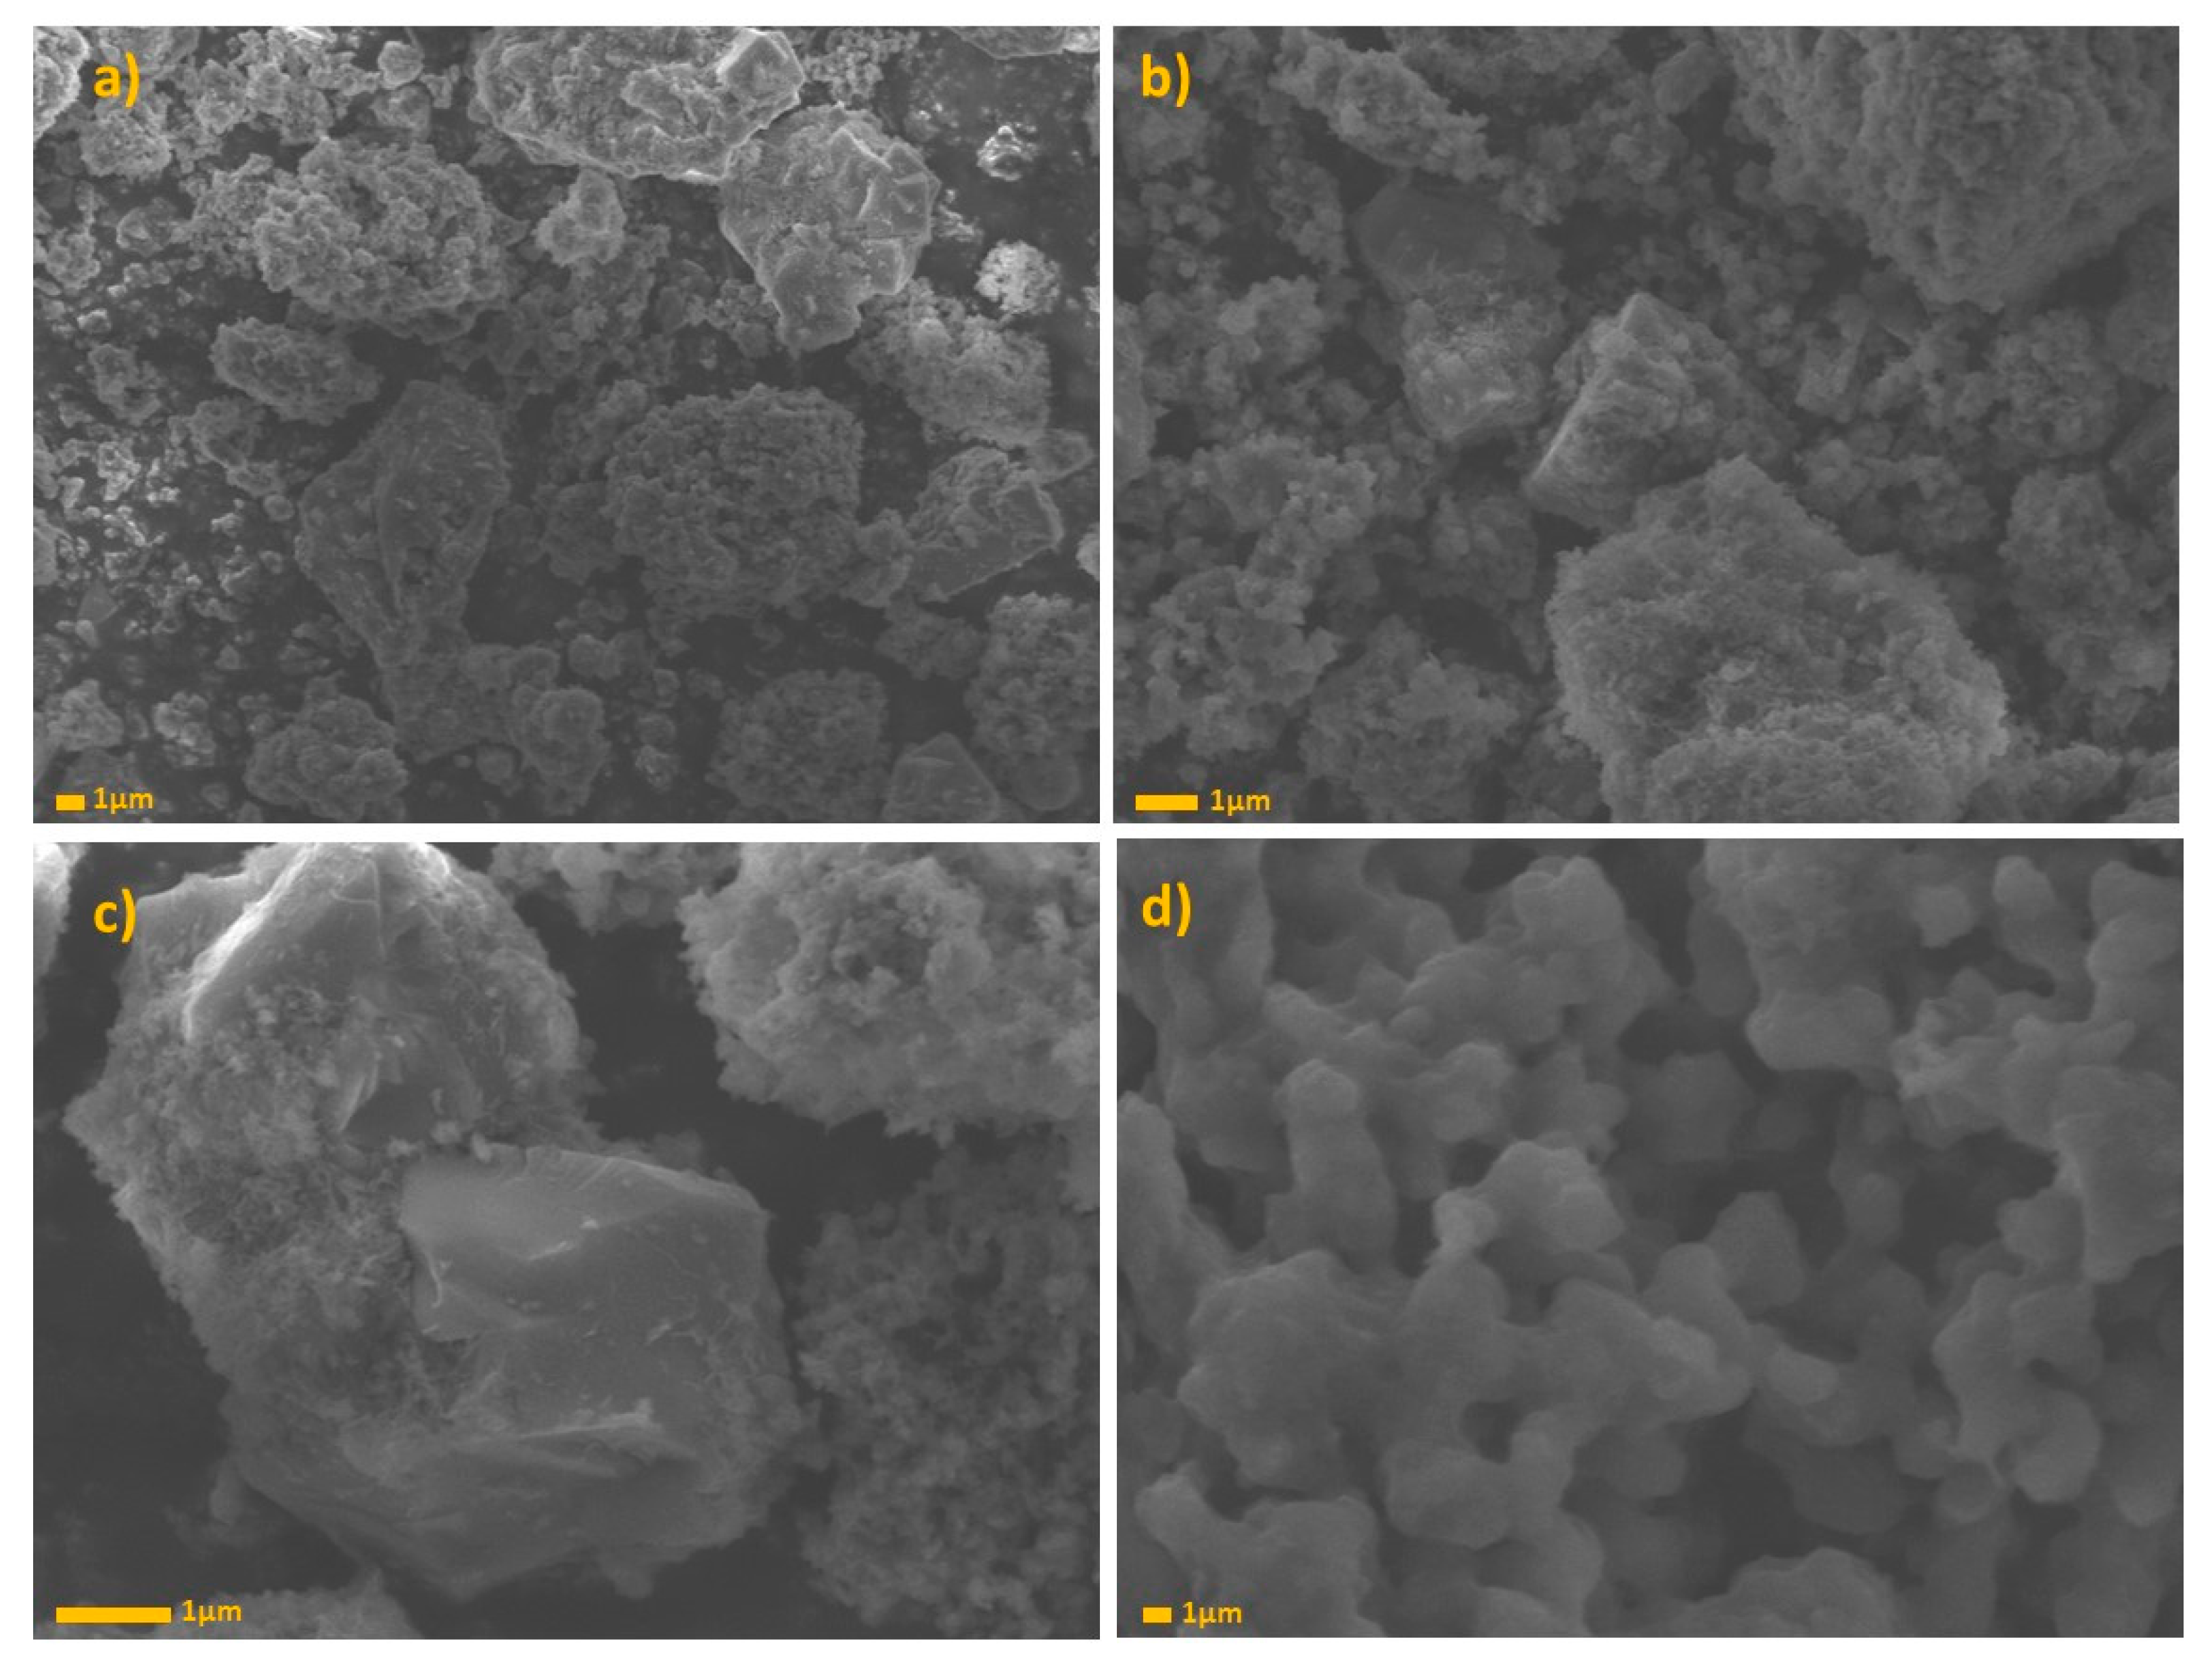
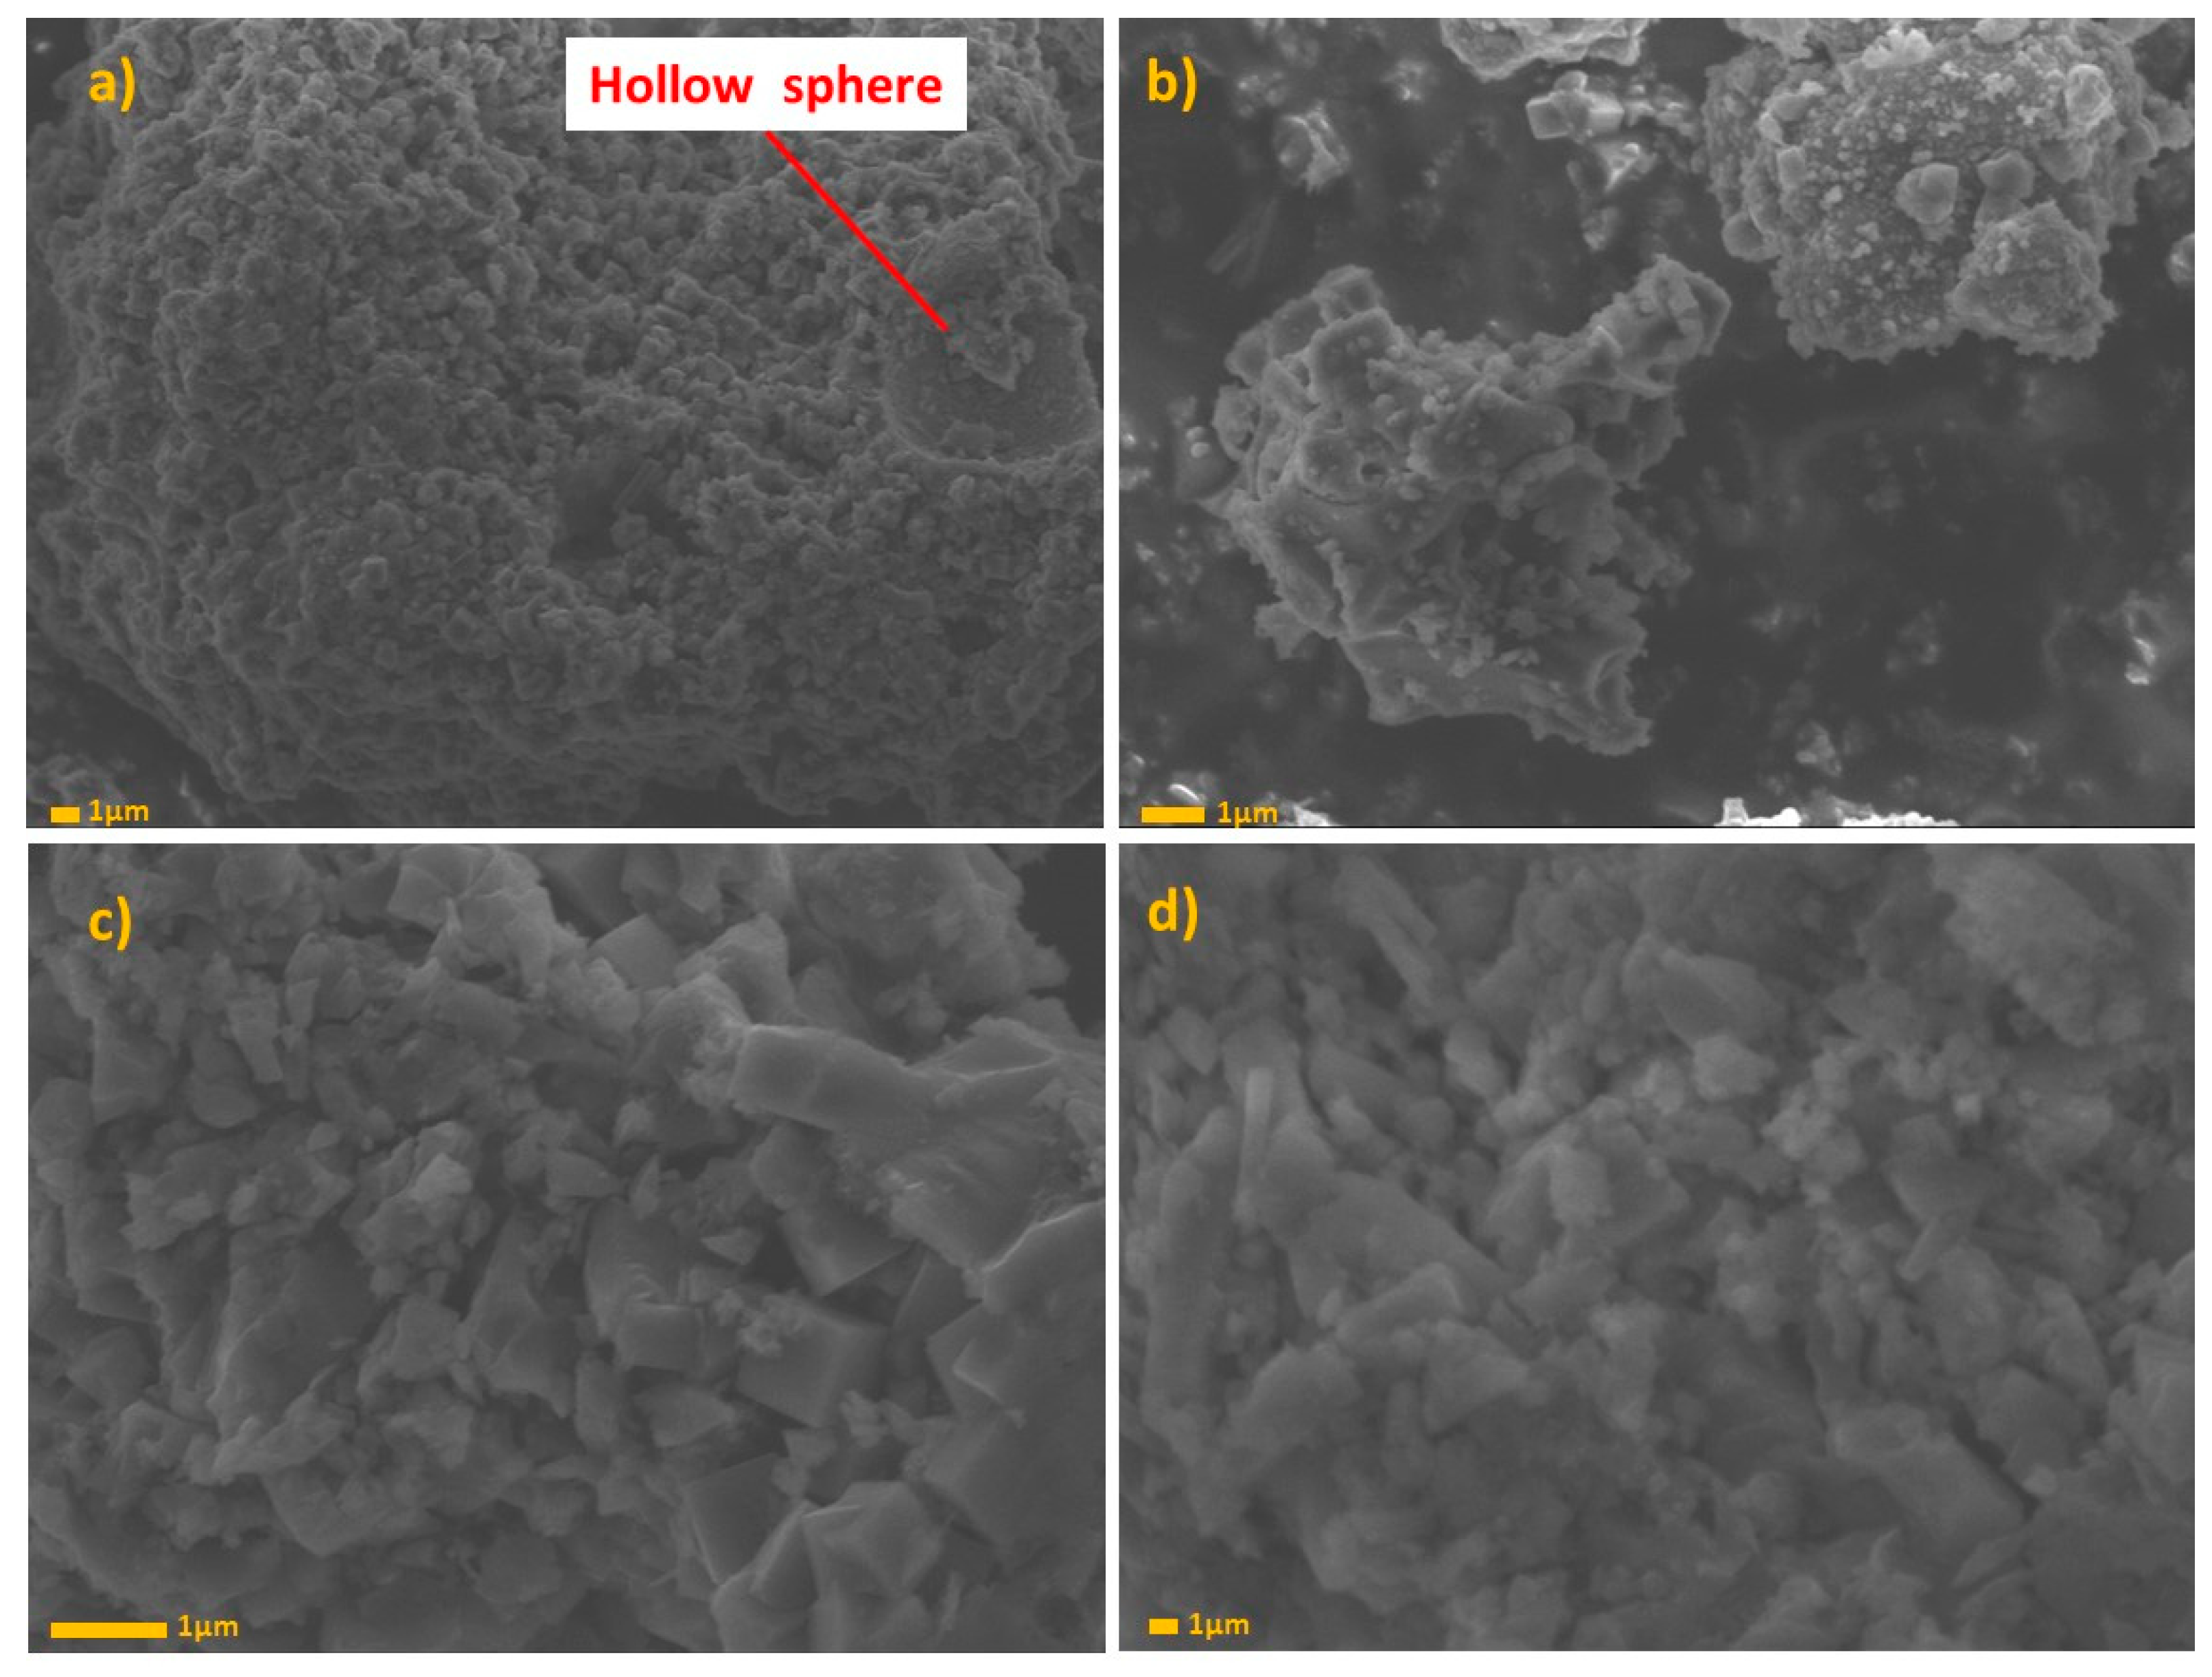
3.3. Scanning Electron Microscopy (SEM)

Figure 7 shows SEM images for GS. In images “a” and “b,” we can observe a predominantly spherical shape with a smooth surface. This is the typical morphology of BFS after grinding with a rotating ball mill. The slag is composed of crystalline phases and, during the grinding, the bonds between the molecules and atoms are broken, thus leaving the shape of the surface broken [64]. The BFS grains are covered with amorphous and irregular structures. In image “c”, it is possible to distinguish unreacted calcite grains, covered by amorphous CASH type gels. At last, in image d, irregular phases can be found, but with defined orthorhombic type forms, which can be attributed to the Analcime phase that is found in XRD studies. Analcime has relatively structured unit cells that are based on non-intersecting channels with four, six, and eight members of oxygen rings, and 16 sites occupied by sodium in the smallest 24 cavities, and by water molecules located in the 16 largest channels [46].
Thus, we can prove that the geopolymer is formed by crystalline, semi-crystalline, and amorphous phases; generally, the percentages of unreacted BFS covered by geopolymerization products, which will be in charge of giving the material the ion exchange property [65].
Figure 8 shows the SEM images for GA, by imaging that it is possible to observe irregular and amorphous structures, which are attributed to the reaction products obtained after geopolymerization (NASH type gels). In this image, it is possible to appreciate a hollow sphere shape, which is characteristic of FA structure. However, not many of these shapes are observed that can indicate a high reactivity of raw material. In image “b”, the semi-spherical particles completely surrounded by the reaction product and NASH type gels. In image “c” and “d”, we can observe irregular particles with triclinic structure. This structure is attributed to the ussignite phase [66].

3.4. Physical Adsorption of Gases by the BET Method

The specific surface of GS is 23.56 m2/g and the pore volume and size were 73 cm3/kg and 7.8 nm, respectively, surpassing by about 26-fold the surface of the raw FA. By about 13-fold the surface of the raw BFS. In the case of GA, the specific surface was 35.97 m2/g and the pore volume and size were 124 cm3/Kg and 9 nm, respectively, surpassing by about 26-fold the surface of the raw FA.
The increase in specific surface with respect to raw material corresponds to an addition of aluminum for adjusting the Si/Al ratio of 3, and also corresponds to the grinding process after geopolymerization. It favors the adsorption mechanism, as there is an increase in exchange sites in the geopolymer.

3.5. CEC

CEC depends on the number of available exchange sites in the geopolymer. According to the experimental results, GS and GA have an exchange capacity of 241.30 and 286.96 Meq/100 g, respectively. In the DRX and MEB results, it was observed that the generation of phases, such as Analcime, Chantalite, Chabasite-Ca, and Ussignite, which had a high aluminium content, promoted the generation of a large number of exchange sites, and, hence, favored the adsorption capacity of the geopolymer.

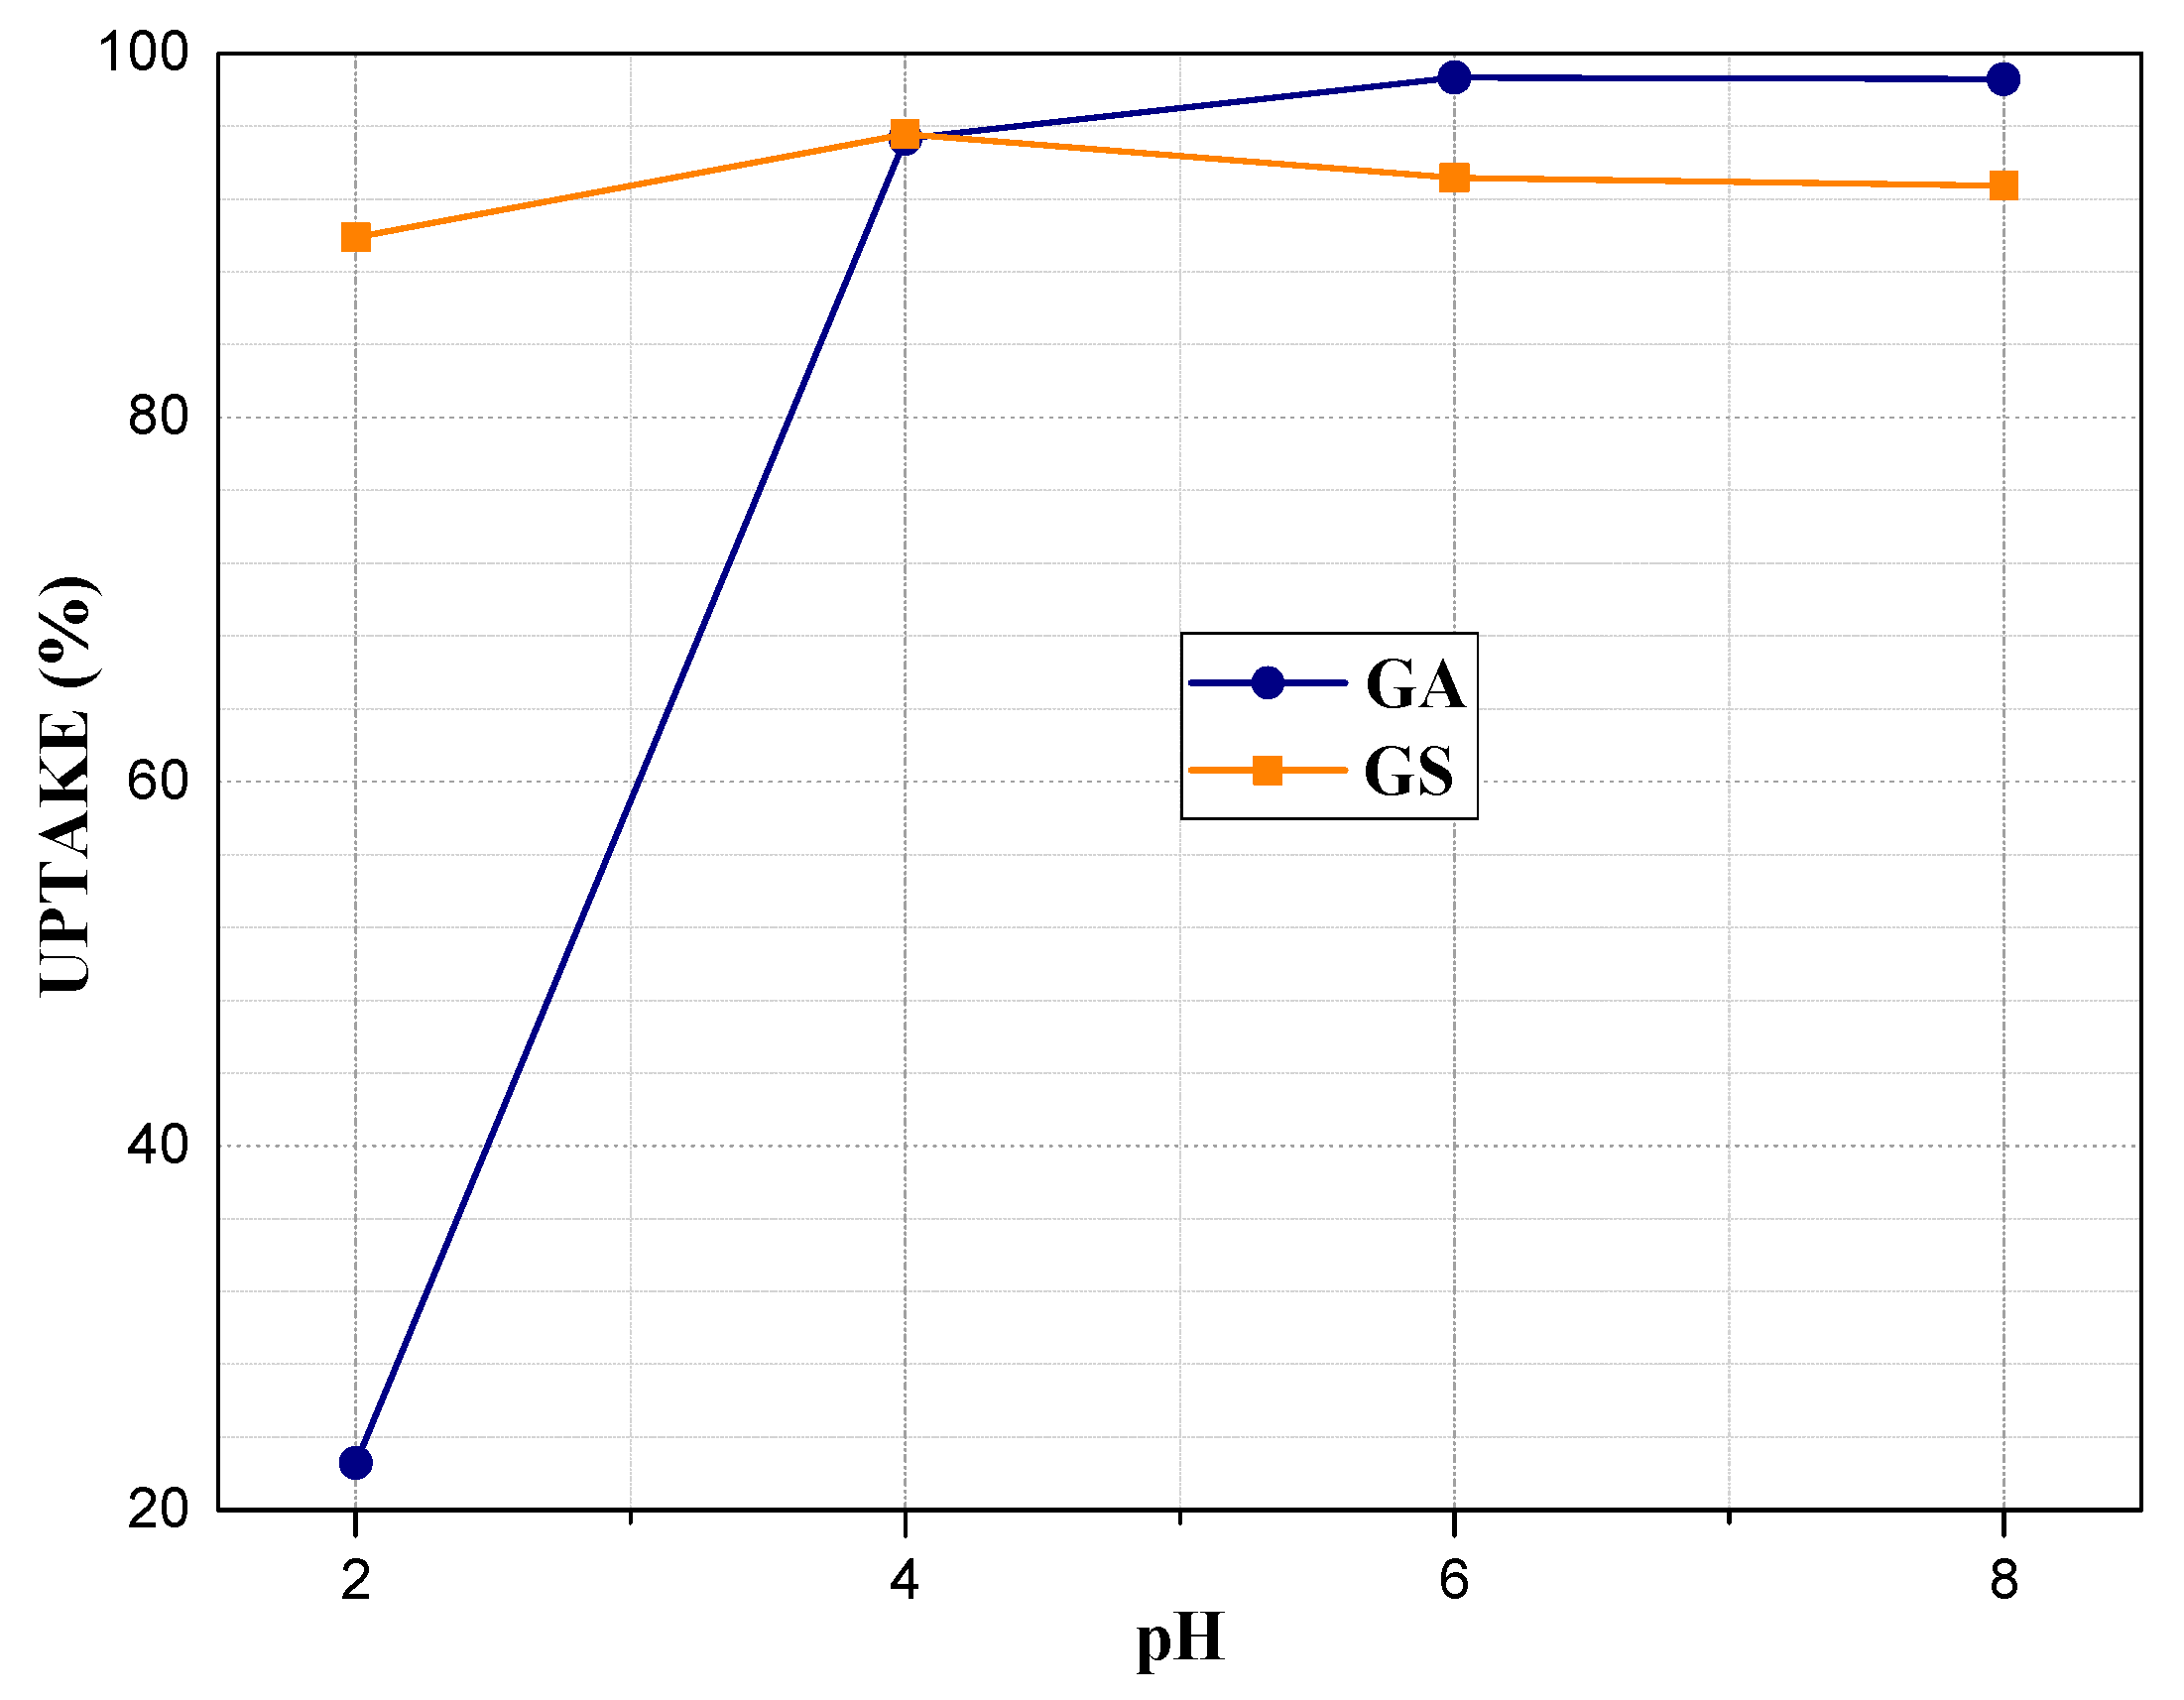
3.6. Adsorption Potential for Pb2+ Ions

FA and BFS, according to Nguyen et al., can adsorb for itself positive metal ions by Coulombic forces on negatively charged particles at pH above 3 in FA and above pH 6 in BFS; it is important to mention that the pHPZC of each of these materials is 3 and 6, respectively; however, adsorption by other forces can occur at all pHs independent of the PZC [67], it is possible that this mechanism occurs in geopolymers due to the presence of unreacted phases, like quartz, in the particles. The attractive forces of positively charged metal ions into GA and GS are due to relatively weak Van Der Waals forces and at active sites due to ion exchange of Ca+ and Na+ ions that are present in the geopolymer structure. The high specific surface area due to the porosity of GA and GS and volume pore are factors influencing the adsorption capacity [68].
Figure 9 shows the adsorption test data at 2, 4, 6, and 8 pH. The maximum removal of lead (approximately 95% in GS and 99% in GA) was reached at a pH of 6, and it decreased at a pH of 8. According to the lead speciation graph, from about 6 pH, hydroxide species are formed, which cause precipitation on the geopolymer surface and block access to geopolymer pores for lead ions.
At a pH of 2 and 4, lead is in the ionized form in solution, and this allows access through the pores and, therefore, access to exchange sites by Van Der Waals forces, which indicates that geopolymers enhance their adsorption capacity in acidic media [69]. Figure 10 shows the effect of the initial Pb2+ concentration (C0) on geopolymer adsorption capacity. In GS, adsorption capacities that are greater than 90% are obtained up to 100 mg/L concentration, due to the high CEC and porosity caused by aluminium-rich phases (analcime, chantalite, and chabasite-Ca). At 5 mg/L concentration, a removal of 95% is reached, which increases to 99.9% at 20 mg/L. Subsequently, as the concentration increases, the removal percentage decreases by 20%. In GA, the uptake increases to 10 mg/L, reaching approximately 98%. At 20 and 50 mg/L, there is a decrease, and at 100, 200, and 500, an increase. The uptake obtained at 20 and 50 are inconsistent, probably due to an error in the pH adjustment [42].

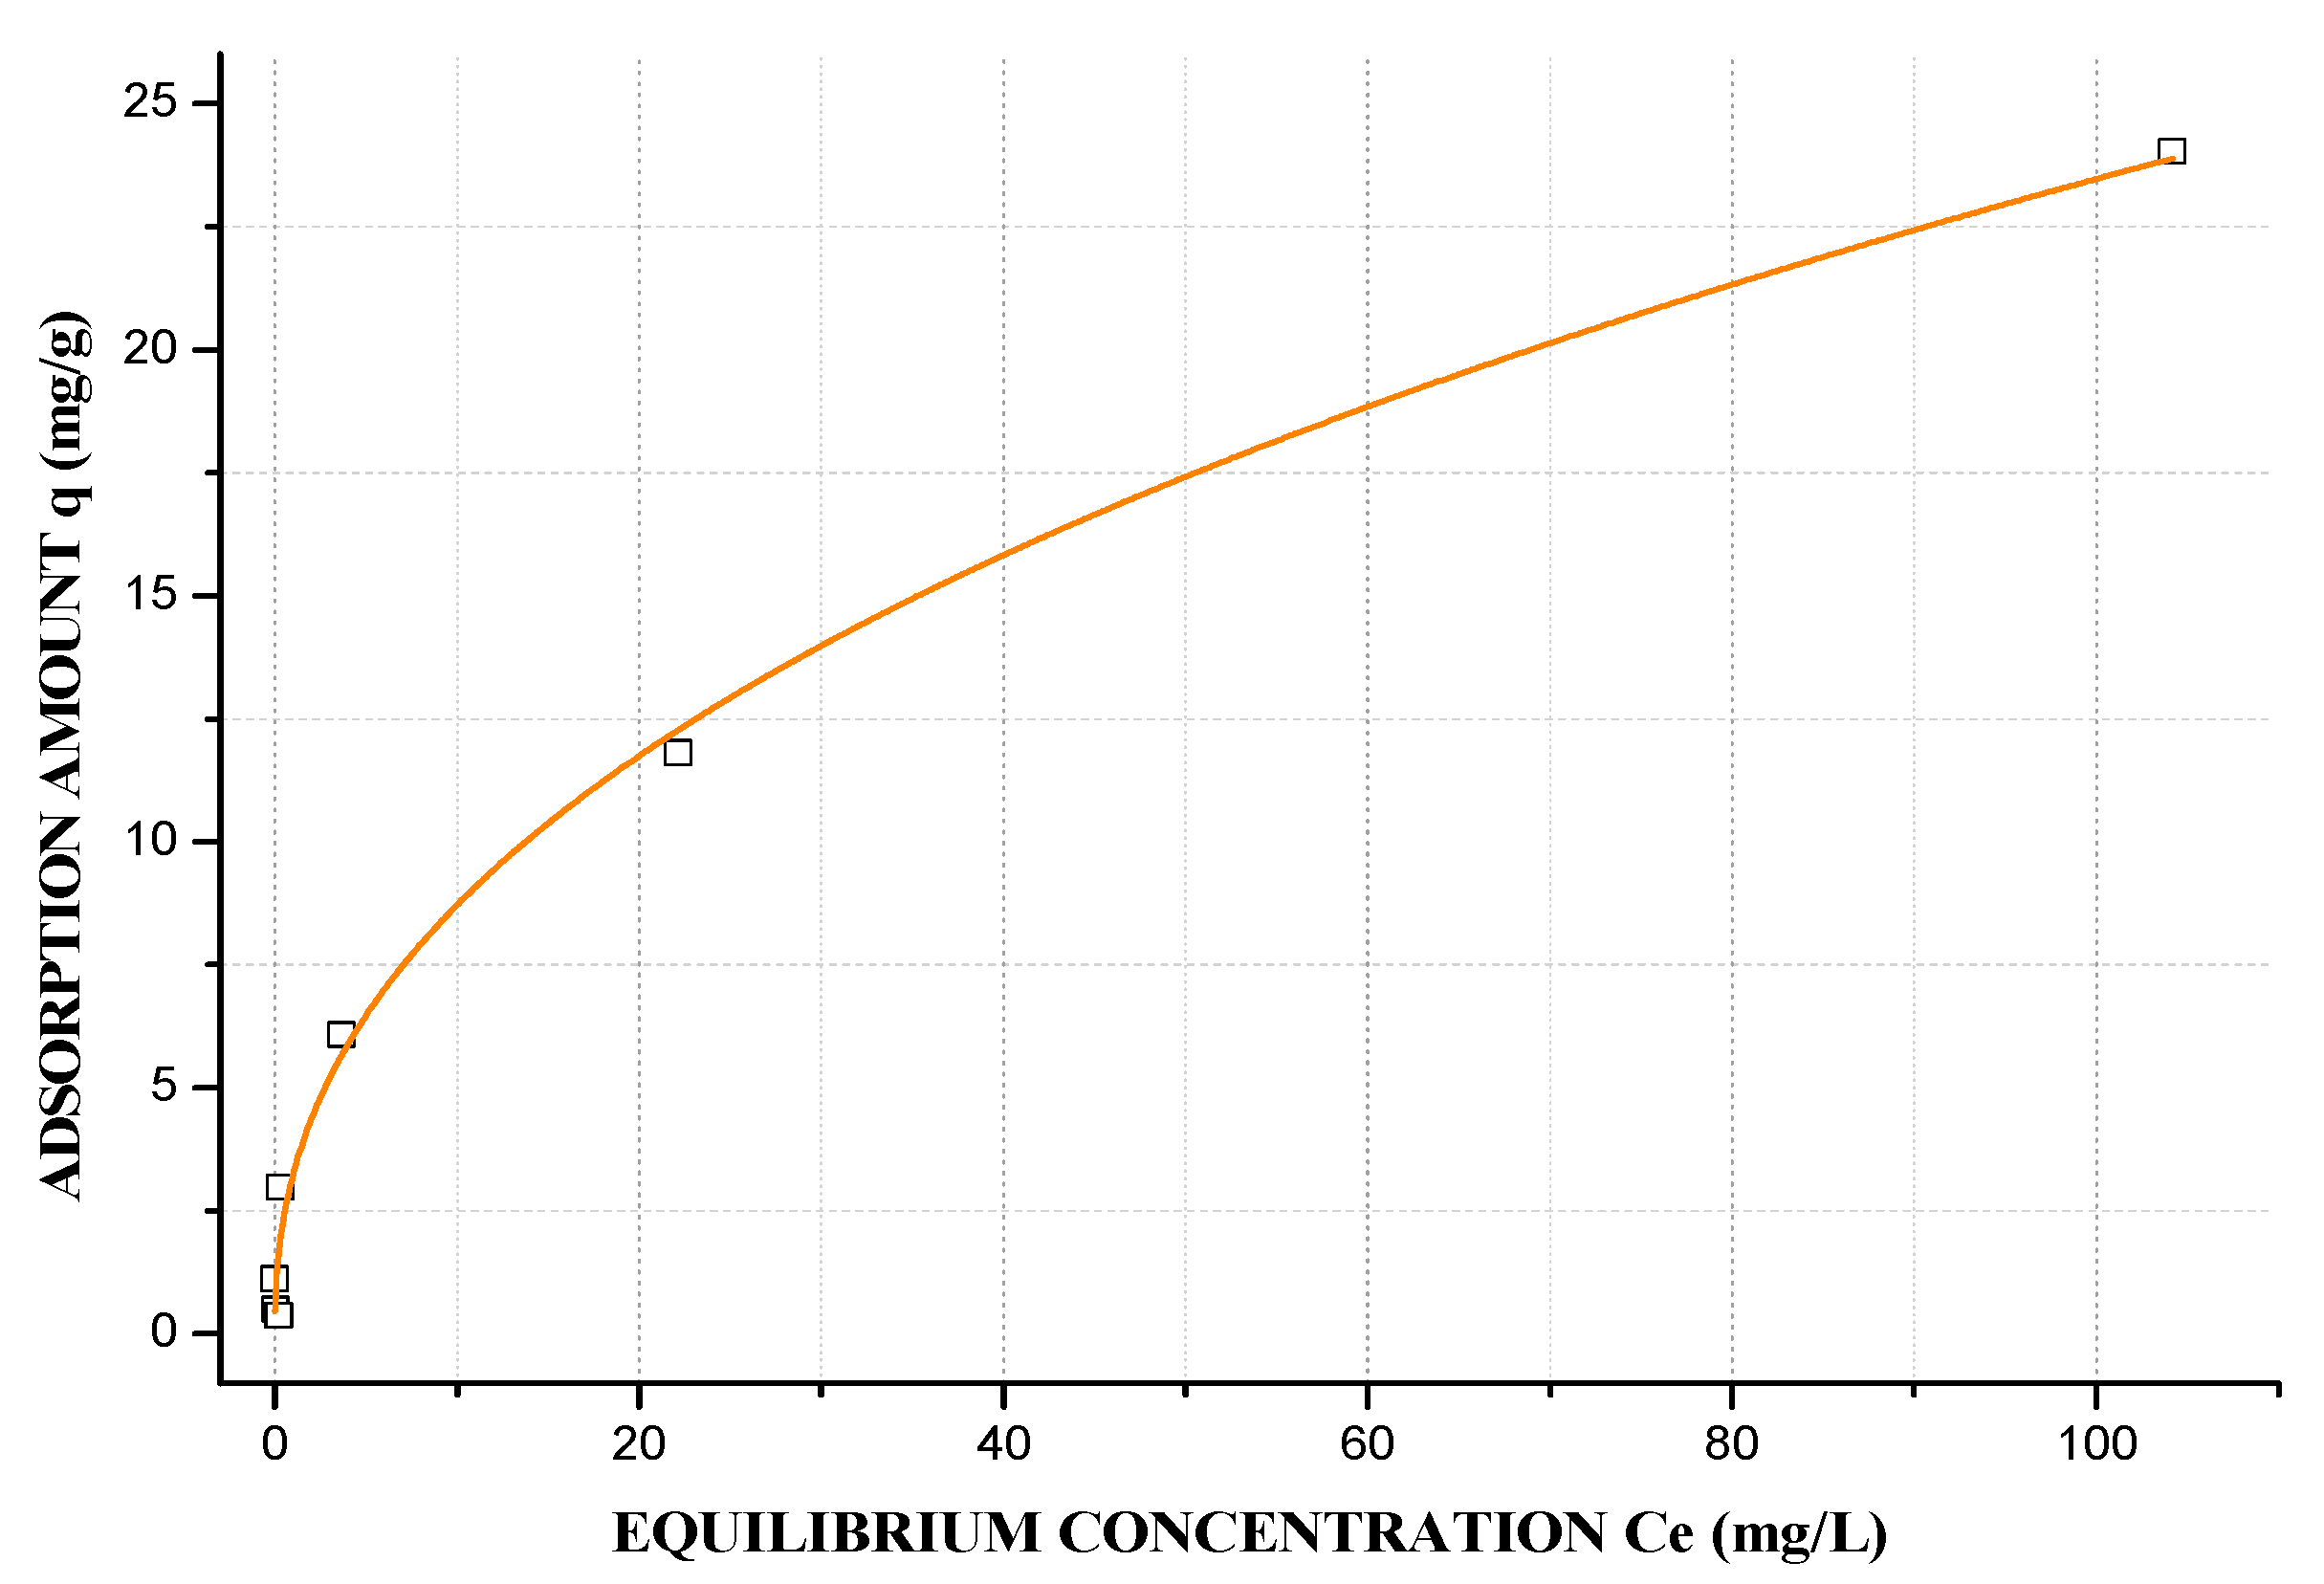
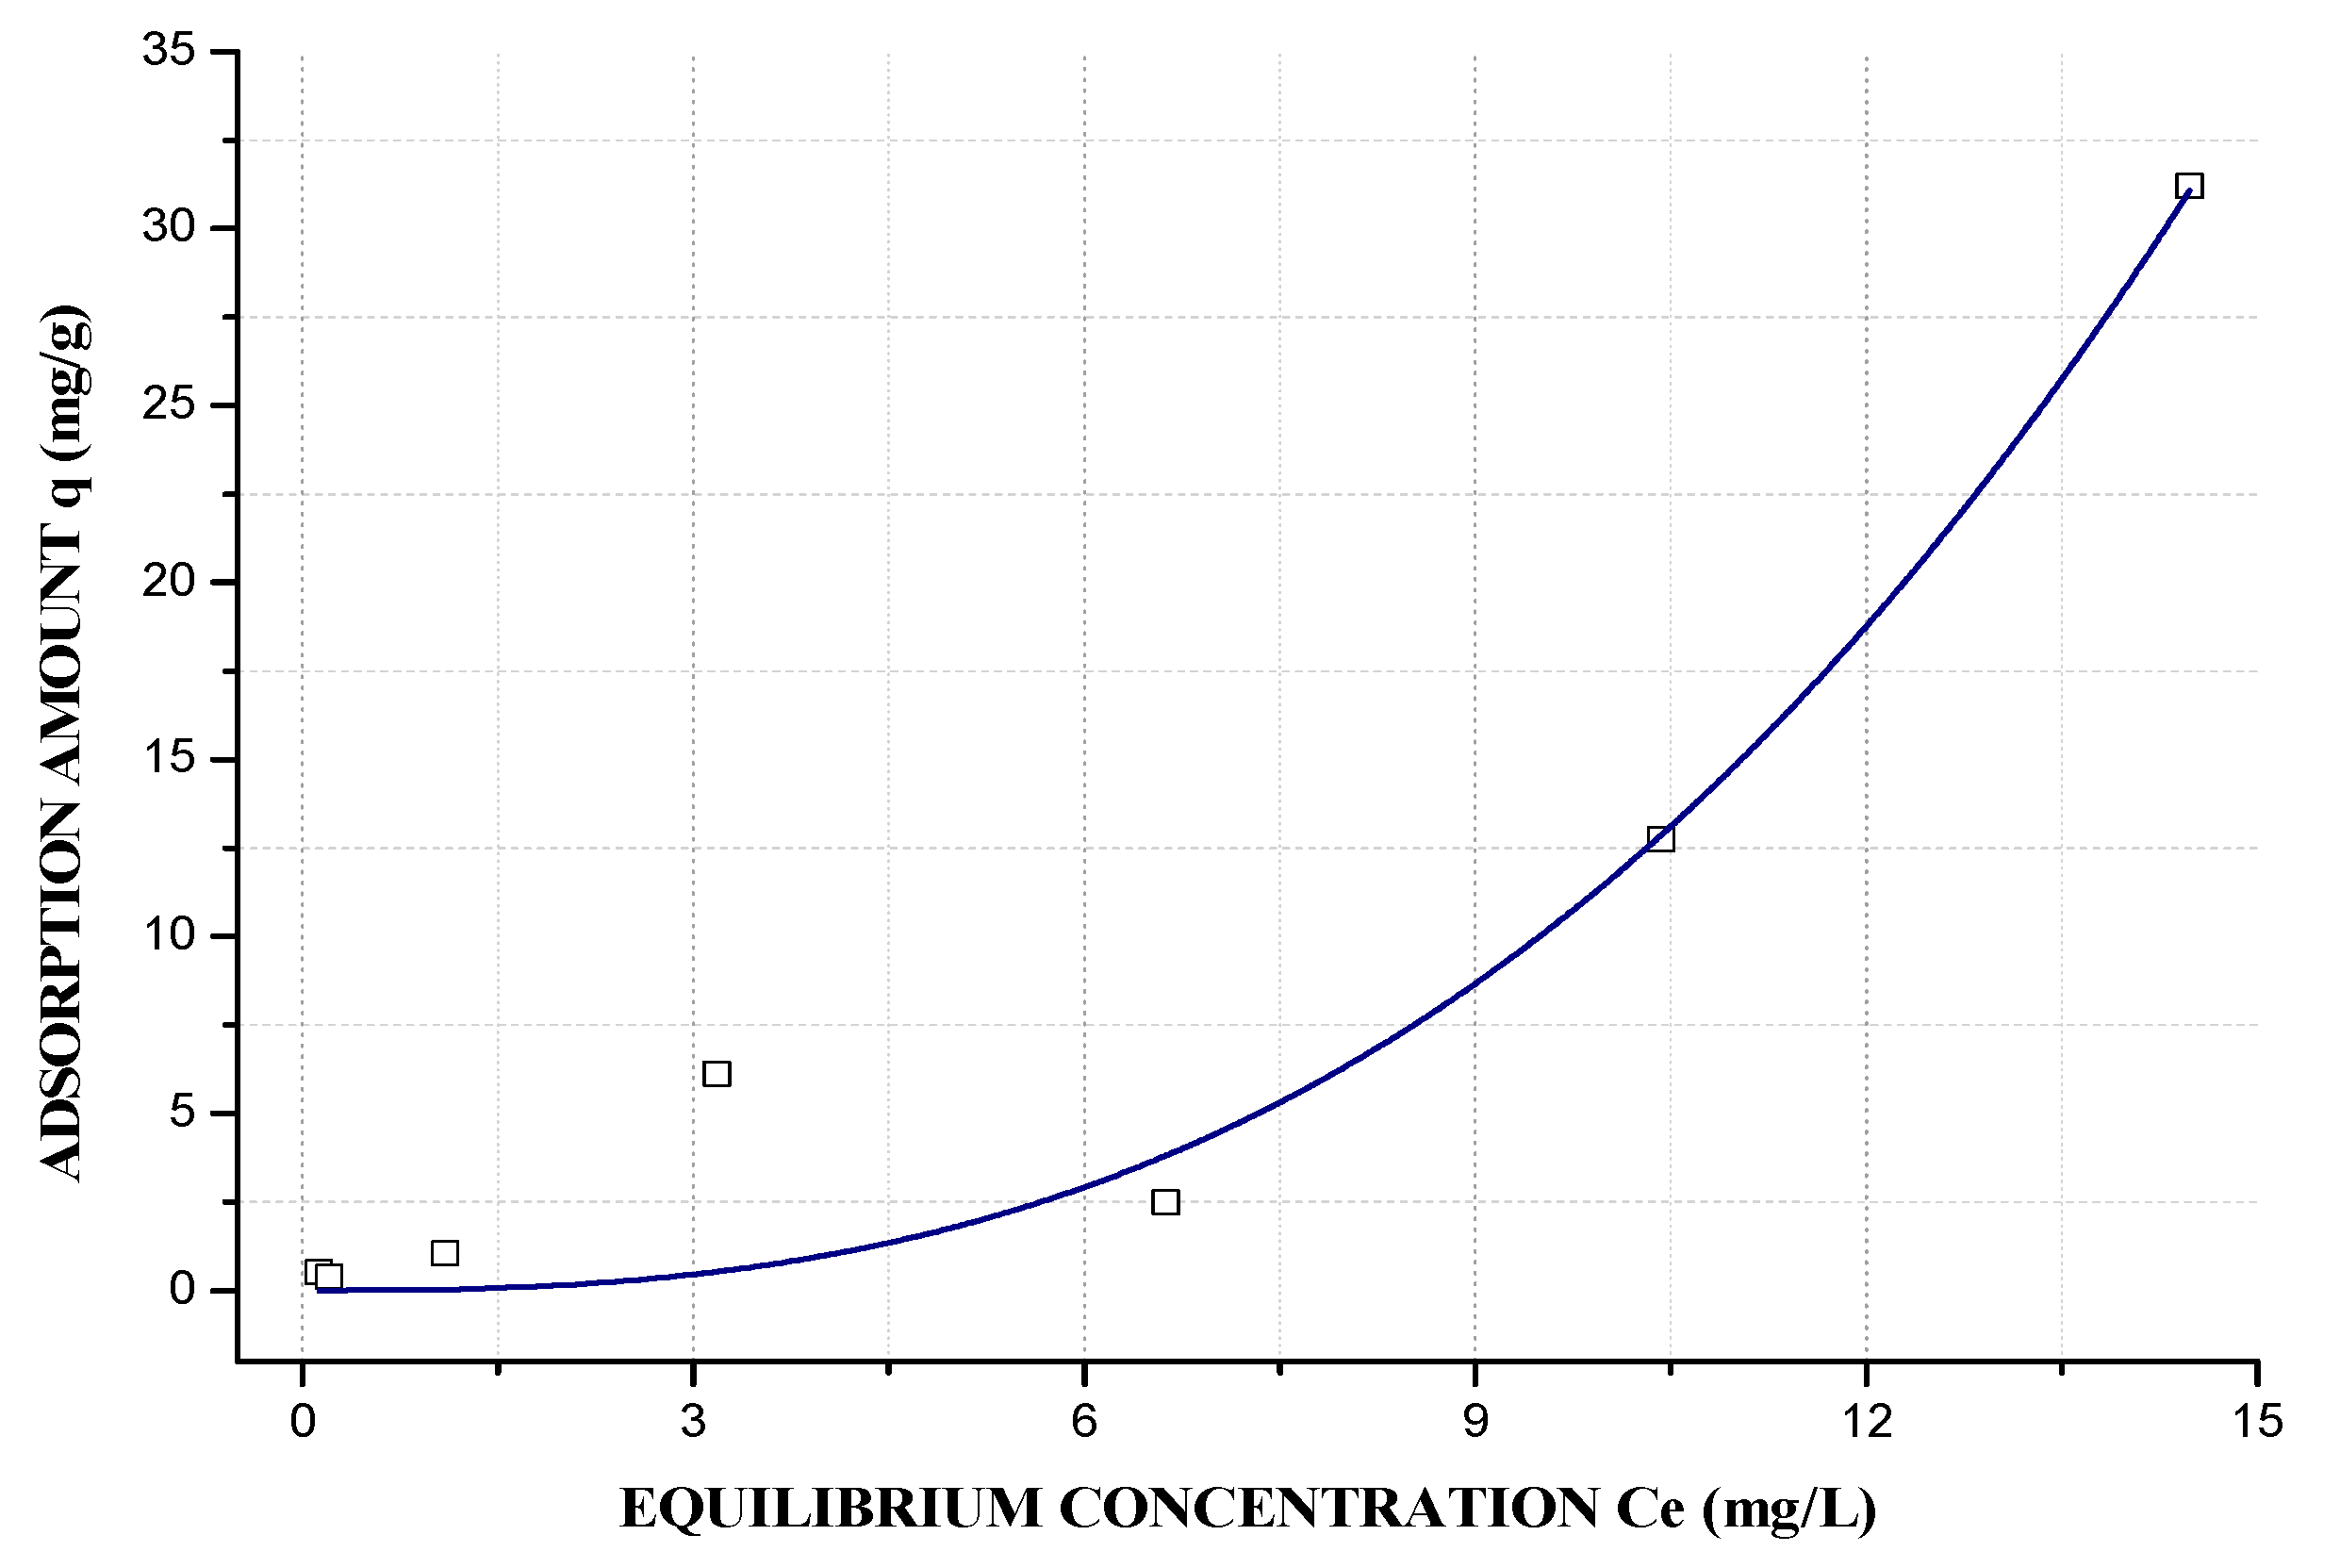
3.7. Langmuir–Freundlich Adsorption Isotherm

The equilibrium isotherm shows the quantity of adsorbate (Pb2+) that can be adsorbed by the adsorbent (GS and GA) in proportion to the equilibrium concentration in liquid phase. Furthermore, the equilibrium curve helps to explain certain phenomena that are associated with the adsorbate-adsorbent interaction [42,70]. The initial equilibrium curve shape of GS (Figure 11) and GA (Figure 12) have been identified as the L2 and S1 types, respectively, according to the Giles classification [71], and the best mathematical model that represents GS is the Langmuir model, and the Freundlich model for GA. In this study, the equilibrium isotherm used was the Langmuir-Freundlich (R2 = 0.992, GS and R2 = 9544, GA). The L-type shape indicates that the higher the concentration, the greater the adsorption amount until the available exchangeable sites reach their limit. Thereby, there is a competition between the metal ions for the available sites, and this kind of isotherm indicates that adsorption occurs because relatively weak forces as Van Der Waals. In the subclass 2 curves, there is no intermolecular interaction between the solute, which forms a long plateau that is represented by the maximum adsorption capacity (qm), indicating a saturation of the adsorbent monolayer before the additional adsorption at new sites, and the process becomes highly favorable, this Pb2+ adsorption in geopolymers based FA was reported by Al-Zboon et.al [72]. A high energy barrier is necessary, and this indicates that qm depicts the maximum number of exchangeable sites, in this case, 38.20 mg/g. The S-type shape shows the opposite behavior to the L-type, because the orientation tends to be vertical for solute molecules at higher concentrations, and more sites are available for adsorption, which agreed with the CEC results. Subclass 1 of an S-type isotherm indicates completely vertical behavior of adsorption capacity, which is possibly caused by the precipitation of the solute on the adsorbent surface causing the curve slope to increase [46]. GA has a qm of 83.20 mg/g, according to the Langmuir–Freundlich model.

4. Conclusions

GS and GA are comprised of crystalline, semi-crystalline, and amorphous phases.
The geopolymerization process generates CASH- and NASH-type gels, which are driven by high Ca and Na content, thus generating active sites for the ion exchange process.
GA generates NASH type gels only, and it has higher amorphicity and, hence, a more specific surface, porosity, and CEC.
Adsorption isotherms accorded well with the Langmuir-Freundlich adsorption isotherm model, and the maximum adsorption capacities for GS and GA were 38.20 and 83.20 mg/g, respectively.
Additionally, adsorption occurs because of the relatively weak Van Der Waals forces in the reaction, allegedly by the ion exchange of Ca+ and Na+ present in the geopolymer structure.
The Pb2+ adsorption is strongly affected by pH; better adsorption is obtained when a solution with neutral pH is used at room temperature.

Author Contributions

Data curation, C.A.R.; Investigation, T.J.M., S.P.A. and A.J.; Software, C.A.R.; Supervision, S.P.A., R.C., A.J. and R.A.Z.; Visualization, F.G.C. and J.M.B.; Writing—original draft, T.J.M.; Writing—review & editing, S.P.A. and R.C. All authors have read and agreed to the published version of the manuscript.

Funding

This research was funded by Fondo Sectorial de Investigación para la Educación SEP-CONACYT, grant number A1-S-15401 and the APC was funded by grant number A1-S-15401.

Acknowledgments

The authors thank to “Fondo Sectorial de Investigación para la Educación SEP-CONACYT, grant number A1-S-15401”; to Consejo Nacional de Ciencia y Tecnología (CONACYT) for its doctoral scholarship program, to Universidad Autónoma de Sinaloa (UAS), Universidad de Guanajuato, Centro de Investigación en Materiales Avanzados S.C. (CIMAV) and Centro de Investigaciones en Óptica A.C. (CIO), for the support and availability of resources and equipment.

Conflicts of Interest

The authors declare no conflict of interest.

References

  1. De la Peña, M.E.; Ducci, J.; Zamora, V. Tratamiento de Aguas Residuales en México; IDB-TN-512; Banco Interamericano de Desarrollo: Washington, DC, USA, 2013; p. 42. [Google Scholar]
  2. Cardona-Gutiérrez, A.F.; Cabañas-Vargas, D.D.; Zepeda-Pedreguera, A. Evaluación del poder biosorbente de cáscara de naranja para la eliminación de metales pesados, Pb (II) y Zn (II). Ingeniería 2013, 17, 1–9. [Google Scholar]
  3. Bumanis, G.; Novais, R.M.; Carvalheiras, J.; Bajare, D.; Labrincha, J.A. Metals removal from aqueous solutions by tailored porous waste-based granulated alkali-activated materials. Appl. Clay Sci. 2019, 179, 105147. [Google Scholar] [CrossRef]
  4. Onutai, S.; Kobayashi, T.; Thavorniti, P.; Jiemsirilers, S. Removal of Pb2+, Cu2+, Ni2+, Cd2+ from wastewater using fly ash based geopolymer as an adsorbent. Key Eng. Mater. 2018, 773, 373–378. [Google Scholar] [CrossRef]
  5. Obeng-Gyasi, E. Sources of lead exposure in various countries. Rev. Environ. Health 2019, 34, 25–34. [Google Scholar] [CrossRef] [PubMed]
  6. Dignam, T.; Kaufmann, R.B.; LeStourgeon, L.; Brown, M.J. Control of lead sources in the United States, 1970–2017: Public health progress and current challenges to eliminating lead exposure. Physiol. Behav. 2017, 176, 139–148. [Google Scholar] [CrossRef]
  7. Fry, D.M.; Maurer, J.R. Assessment of Lead Contamination Sources Exposing California Condors; Species Conservation and Recovery Program report 2003-02; California Department of Fish and Game Habitat Conservation Planning Branch: Sacramento, CA, USA, 2003. [Google Scholar]
  8. Huang, Z.Y.; Chen, T.; Yu, J.; Qin, D.P.; Chen, L. Lead contamination and its potential sources in vegetables and soils of Fujian, China. Environ. Geochem. Health 2012, 34, 55–65. [Google Scholar] [CrossRef]
  9. Reyes, Y.C.; Vergara, I.; Torres, O.E.; Díaz, M.; González, E.E. Contaminación por metales pesados: Implicaciones en salud, ambiente y seguridad alimentaria. Rev. Ing. Investig. Y Desarro. 2016, 16, 77. [Google Scholar] [CrossRef]
  10. Papanikolaou, N.C.; Hatzidaki, E.G.; Belivanis, S.; Tzanakakis, G.N.; Tsatsakis, A.M. Lead toxicity update. A brief review. Med. Sci. Monit. 2005, 11, 329–336. [Google Scholar]
  11. Moreno-Rivas, S.C.; Ramos-Clamont Montfort, G. Descontaminación de arsénico, cadmio y plomo en agua por biosorción con Saccharomyces cerevisiae. TIP Rev. Espec. En Cienc. Quím. Biol. 2018, 21, 51. [Google Scholar] [CrossRef]
  12. Mohod, C.V.; Dhote, J. Review of heavy metals in drinking water and their effect on human health. Int. J. Innov. Res. Sci. Eng. Technol. 2013, 2, 2992–2996. [Google Scholar]
  13. Martin, S.; Griswold, W. Human health effects of heavy metals: Briefs for citizens. Environ. Sci. Technol. 2009, 15, 1–6. [Google Scholar]
  14. Jan, A.T.; Azam, M.; Siddiqui, K.; Ali, A.; Choi, I.; Haq, Q.M.R. Heavy metals and human health: Mechanistic insight into toxicity and counter defense system of antioxidants. Int. J. Mol. Sci. 2015, 16, 29592–29630. [Google Scholar] [CrossRef] [PubMed] [Green Version]
  15. Pérez Vázquez, R.G. Efecto de los Metales Pesados en la Salud Humana. Bachelor’s Thesis, Universidad de Pinar del Río “Hermanos Saíz Montes de Oca”, Pinar del Río, Cuba, 2011. [Google Scholar]
  16. Caviedes Rubio, D.I.; Muñoz Calderón, R.A.; Perdomo Gualtero, A.; Rodríguez Acosta, D.; Sandoval Rojas, I.J. Tratamientos para la remoción de metales pesados comúnmente presentes en aguas residuales industriales. Una revisión. Rev. Ing. Y Reg. 2015, 13, 73–90. [Google Scholar] [CrossRef]
  17. Bapat, S.A.; Jaspal, D.K. Parthenium hysterophorus: Novel adsorbent for the removal of heavy metals and dyes. Glob. J. Environ. Sci. Manag. 2016, 2, 135–144. [Google Scholar] [CrossRef]
  18. Matlock, M.M.; Howerton, B.S.; Atwood, D.A. Chemical precipitation of heavy metals from acid mine drainage. Water Res. 2002, 36, 4757–4764. [Google Scholar] [CrossRef]
  19. Efome, J.E.; Rana, D.; Matsuura, T.; Lan, C.Q. Effects of operating parameters and coexisting ions on the efficiency of heavy metal ions removal by nano-fibrous metal-organic framework membrane filtration process. Sci. Total Environ. 2019, 674, 355–362. [Google Scholar] [CrossRef]
  20. Fu, F.; Wang, Q. Removal of heavy metal ions from wastewaters: A review. J. Environ. Manag. 2011, 92, 407–418. [Google Scholar] [CrossRef]
  21. Torres Gaviria, L.F.; Ocampo Vélez, J.C.; Socarrás Cárdenas, A. Reducción del nivel de potasio en vinaza de destilería utilizando resinas de intercambio iónico. Rev. Investig. Agrar. Y Ambient. 2018, 10, 107–118. [Google Scholar] [CrossRef]
  22. Helfferich, F. Ion. Exchange; Hill, M., Ed.; Dover Publications, INC.: New York, NY, USA, 1995; ISBN 0-486-68784-8. [Google Scholar]
  23. Nascimento, I.S.; Silva, D.L.; Pereira, T.B.; Gonzálves, G.R.F.; Veríssimo, L.A.A.; Veloso, C.M.; Bonomo, R.C.F.; Fontan, R.C.I. Capture of lectins from jackfruit (Artocarpus integrifolia) seeds in a single step using a supermacroporous ion exchange cryogel. Rev. Mex. Ing. Quim. 2019, 18, 313–324. [Google Scholar] [CrossRef]
  24. López Guzmán, F.J. Study of Geopolymer Adsorbents Prepared from Metakaolin and Rice Husk Silica for Targeting to Heavy Metal Capture. Ph.D. Thesis, Nagaoka University of Technology, Nagaoka, Japan, 2014. [Google Scholar]
  25. Yan, C.; Guo, L.; Ren, D.; Duan, P. Novel composites based on geopolymer for removal of Pb (II). Mater. Lett. 2018, 239, 192–195. [Google Scholar] [CrossRef]
  26. Villaquirán-Caicedo, M.A.; Mejía de Gutiérrez, R. Synthesis of ceramic materials from ecofriendly geopolymer precursors. Mater. Lett. 2018, 230, 300–304. [Google Scholar] [CrossRef]
  27. Davidovits, J. Geopolymers. J. Therm. Anal. 1991, 37, 1633–1656. [Google Scholar] [CrossRef]
  28. Provis, J.L.; Van Deventer, J.S.J. Introduction of Geopolymers. Geopolymers. Structure, Processing, Properties and Industrial Applications, 1st ed.; Provis, J.L., van Deventer, J.S., Eds.; Elsevier: Amsterdam, The Netherlands, 2009; ISBN 9781845694494. [Google Scholar]
  29. Liew, Y.M.; Heah, C.Y.; Mohd Mustafa, A.B.; Kamarudin, H. Structure and properties of clay-based geopolymer cements: A review. Prog. Mater. Sci. 2016, 83, 595–629. [Google Scholar] [CrossRef]
  30. Davidovits, J. Geopolymer. Chemistry & Applications, 2nd ed.; Institut Geopolymere: Saint-Quentin, France, 2008; ISBN 2-9514820-1-9. [Google Scholar]
  31. Kumar, S.; Kumar, R.; Mehrotra, S.P. Influence of granulated blast furnace slag on the reaction, structure and properties of fly ash based geopolymer. J. Mater. Sci. 2010, 45, 607–615. [Google Scholar] [CrossRef]
  32. Özcan, A.; Karakoç, M.B. The resistance of blast furnace slag- and ferrochrome slag-based geopolymer concrete against acid attack. Int. J. Civ. Eng. 2019, 17. [Google Scholar] [CrossRef]
  33. Luukkonen, T.; Heponiemi, A.; Runtti, H.; Pesonen, J.; Yliniemi, J.; Lassi, U. Application of alkali-activated materials for water and wastewater treatment: A review. Rev. Environ. Sci. Biotechnol. 2019, 18, 271–297. [Google Scholar] [CrossRef] [Green Version]
  34. Jena, S.; Panigrahi, R.; Sahu, P. Effect of silica fume on the properties of fly ash geopolymer concrete. Lect. Notes Civ. Eng. 2019, 25, 145–153. [Google Scholar] [CrossRef]
  35. Poltue, T.; Suddeepong, A.; Horpibulsuk, S.; Samingthong, W.; Arulrajah, A.; Rashid, A.S.A. Strength development of recycled concrete aggregate stabilized with fly ash-rice husk ash based geopolymer as pavement base material. Road Mater. Pavement Des. 2019, 1–12. [Google Scholar] [CrossRef]
  36. Zhu, H.; Liang, G.; Xu, J.; Wu, Q.; Zhai, M. Influence of rice husk ash on the waterproof properties of ultrafine fly ash based geopolymer. Constr. Build. Mater. 2019, 208, 394–401. [Google Scholar] [CrossRef]
  37. Siddique, R.; Khan, M.I. Supplementary Cementing Materials; Engineering Materials; Springer: Berlin/Heidelberg, Germany, 2011; Volume 37, ISBN 978-3-642-17865-8. [Google Scholar]
  38. Riveros Olivares, B. Tratamiento de Aguas Residuales Municipales en la Ciudad de México. Bachelor´s Thesis, Universidad Nacional Autónoma De México, Mexico City, Mexico, 2013. [Google Scholar]
  39. Petrakis, E.; Karmali, V.; Bartzas, G.; Komnitsas, K. Grinding kinetics of slag and e ff ect of final particle size on the compressive strength of Alkali. Minerals 2019, 9, 714. [Google Scholar] [CrossRef] [Green Version]
  40. ASTM International. Standard Specifications for Wire Cloth and Sieves for Testing Purposes; ASTM E11—95; ASTM International: West Conshohocken, PA, USA, 2001. [Google Scholar]
  41. Leyva Ramos, R.; Medellín Castillo, N.A.; Guerrero Coronado, R.M.; Berber Mendoza, M.S.; Aragón Piña, A.; Jacobo Azuara, A. Intercambio iónico de Plata (I) en solución acuosa sobre clinoptilolita. Rev. Int. Contam. Ambient. 2005, 21, 193–200. [Google Scholar]
  42. Bonilla-Petriciolet, A.; Mendoza-Castillo, D.I.; Reynel-Ávila, H.E. Adsorption Processes for Water Treatment and Puri Cation; Springer International Publishing: Cham, Switzerland, 2017; ISBN 9783319581354. [Google Scholar]
  43. Jeppu, G.P.; Clement, T.P. A modified Langmuir-Freundlich isotherm model for simulating pH-dependent adsorption effects. J. Contam. Hydrol. 2012, 129–130, 46–53. [Google Scholar] [CrossRef] [PubMed]
  44. Komnitsas, K.; Bartzas, G.; Karmali, V.; Petrakis, E.; Witold, K.; Grzegorz, P.; Jaroslaw, K. Assessment of alkali activation potential of a Polish Ferronickel slag. Sustainability 2019, 11, 1863. [Google Scholar] [CrossRef] [Green Version]
  45. Zaharaki, D.; Komnitsas, K.; Perdikatsis, V. Use of analytical techniques for identification of inorganic polymer gel composition. J. Mater. Sci. 2010, 45, 2715–2724. [Google Scholar] [CrossRef]
  46. Vigil de la Villa Mencía, R.; Goiti, E.; Ocejo, M.; García Giménez, R. Synthesis of zeolite type analcime from industrial wastes. Microporous Mesoporous Mater. 2019, 1–9. [Google Scholar] [CrossRef]
  47. Siyal, A.A.; Shamsuddin, M.R.; Khan, M.I.; Rabat, N.E.; Zulfiqar, M.; Man, Z.; Siame, J.; Azizli, K.A. A review on geopolymers as emerging materials for the adsorption of heavy metals and dyes. J. Environ. Manag. 2018, 224, 327–339. [Google Scholar] [CrossRef]
  48. Criado, M.; Fernández-Jiménez, A.; Palomo, A. Alkali activation of fly ash: Effect of the SiO2/Na2O ratio. Part I: FTIR study. Microporous Mesoporous Mater. 2007, 106, 180–191. [Google Scholar] [CrossRef]
  49. Gadsden, J.A. Infrared Spectra of Minerals and Related Inorganic Compounds; Butterworths: London, UK, 1975; ISBN 0-408-70665-1. [Google Scholar]
  50. Yousuf, M.; Mollah, A.; Hess, T.R.; Tsai, Y.N.; Cocke, D.L. An FTIR and XPS investigations of the effects of carbonation on the solidification/stabilization of cement based systems-Portland type V with zinc. Cem. Concr. Res. 1993, 23, 773–784. [Google Scholar] [CrossRef]
  51. Amin, M. Impact of alkali cations on properties of metakaolin and metakaolin/slag geopolymers: Microstructures in relation to sorption of 134 Cs radionuclide. J. Hazard. Mater. 2018, 344, 913–924. [Google Scholar] [CrossRef]
  52. Kovtun, M.; Kearsley, E.P.; Shekhovtsova, J. Cement and Concrete Research Chemical acceleration of a neutral granulated blast-furnace slag activated by sodium carbonate. Cem. Concr. Res. 2015, 72, 1–9. [Google Scholar] [CrossRef] [Green Version]
  53. Fernández-Jiménez, A.; Palomo, A. Mid-Infrared spectroscopic studies of alkali-activated fly ash structure. Microporous Mesoporous Mater. 2005, 86, 207–214. [Google Scholar] [CrossRef]
  54. Torres-Carrasco, M.; Puertas, F. Waste glass in the geopolymer preparation. Mechanical and microstructural characterisation. J. Clean. Prod. 2015, 90, 397–408. [Google Scholar] [CrossRef]
  55. Gao, X.; Yu, Q.L.; Brouwers, H.J.H. Reaction kinetics, gel character and strength of ambient temperature cured alkali activated slag-fly ash blends. Constr. Build. Mater. 2015, 80, 105–115. [Google Scholar] [CrossRef] [Green Version]
  56. Wang, J.; Wu, X.L.; Wang, J.X.; Liu, C.Z.; Lai, Y.M.; Hong, Z.K.; Zheng, J.P. Hydrothermal synthesis and characterization of alkali-activated slag-fly ash-metakaolin cementitious materials. Microporous Mesoporous Mater. 2012, 155, 186–191. [Google Scholar] [CrossRef]
  57. Zhang, Z.; Wang, H.; Provis, J.L.; Bullen, F.; Reid, A.; Zhu, Y. Quantitative kinetic and structural analysis of geopolymers. Part 1. the activation of metakaolin with sodium hydroxide. Thermochim. Acta 2012, 539, 23–33. [Google Scholar] [CrossRef]
  58. Hajimohammadi, A.; Provis, J.L.; Van Deventer, J.S.J. Time-Resolved and spatially-resolved infrared spectroscopic observation of seeded nucleation controlling geopolymer gel formation. J. Colloid Interface Sci. 2011, 357, 384–392. [Google Scholar] [CrossRef] [PubMed]
  59. Barbosa, T.R.; Foletto, E.L.; Dotto, G.L.; Jahn, S.L. Preparation of mesoporous geopolymer using metakaolin and rice husk ash as synthesis precursors and its use as potential adsorbent to remove organic dye from aqueous solutions. Ceram. Int. 2018, 44, 416–423. [Google Scholar] [CrossRef]
  60. Pavia, D.L.; Lampman, G.M.; Kriz, G.S.; Vyvyan, J.R. Introduction to Spectroscopy, 4th ed.; Harcourt College Publishers: San Diego, CA, USA, 2009; ISBN 978-0-495-11478-9. [Google Scholar]
  61. Albella, J.M.; Cintas, A.M.; Miranda, T.; Serratosa, J.M. Introducción a la Ciencia de Materiales. Técnicas de Preparación y Caracterización; Consejo Superior de Investigaciones Científicas: Madrid, Spain, 1993; ISBN 84-00-07343-6. [Google Scholar]
  62. Bernal, S.A.; Provis, J.L.; Rose, V.; Mejía De Gutierrez, R. Evolution of binder structure in sodium silicate-activated slag-metakaolin blends. Cem. Concr. Compos. 2011, 33, 46–54. [Google Scholar] [CrossRef]
  63. Yu, P.; Kirkpatrick, R.J.; Poe, B.; McMillan, P.F.; Cong, X. Structure of Calcium Silicate Hydrate (C-S-H): Near-, mid-, and far-infrared spectroscopy. J. Am. Ceram. Soc. 2004, 82, 742–748. [Google Scholar] [CrossRef]
  64. Vereshchagina, T.A.; Kutikhina, E.A.; Solovyov, L.A.; Vereshchagin, S.N.; Mazurova, E.V.; Chernykh, Y.Y.; Anshits, A.G. Synthesis and structure of analcime and analcime-zirconia composite derived from coal fly ash cenospheres. Microporous Mesoporous Mater. 2018, 258, 228–235. [Google Scholar] [CrossRef] [Green Version]
  65. Chen, Y.; Zhou, X.; Wan, S.; Zheng, R.; Tong, J.; Hou, H.; Wang, T. Synthesis and characterization of geopolymer composites based on gasification coal fly ash and steel slag. Constr. Build. Mater. 2019, 211, 646–658. [Google Scholar] [CrossRef]
  66. Powell, K.J.; Brown, P.L.; Byrne, R.H.; Gajda, T.; Hefter, G.; Leuz, A.; Sjöberg, S.; Wanner, H. Chemical speciation of environmentally significant metals with inorganic ligands. Part 3: The Pb2+ + OH, Cl, CO32−, SO42−, and PO43− Systems (IUPAC technical report). Pure Appl. Chem. 2009, 81, 2425–2476. [Google Scholar] [CrossRef] [Green Version]
  67. Nguyen, T.C.; Loganathan, P.; Nguyen, T.V.; Kandasamy, J.; Naidu, R.; Vigneswaran, S. Adsorptive removal of five heavy metals from water using blast furnace slag and fly ash. Environ. Sci. Pollut. Res. 2018, 25, 20430–20438. [Google Scholar] [CrossRef] [PubMed] [Green Version]
  68. Komnitsas, K.; Zaharaki, D.; Bartzas, G.; Alevios, G. Adsorption of Scandium and Neodymium on Biochar derived after low-temperature pyrolysis of sawdust. Minerals 2017, 7, 200. [Google Scholar] [CrossRef] [Green Version]
  69. Alshaaer, M.; Zaharaki, D.; Komnitsas, K. Microstructural characteristics and adsorption potential of a zeolitic tuff–metakaolin geopolymer. Desalin. Water Treat. 2015, 56, 338–345. [Google Scholar] [CrossRef]
  70. García Aseno, N. Una Nueva Generación de Carbones Activados de Altas Prestaciones Para Aplicaciones Medioambientales. Ph.D. Thesis, Universidad de Oviedo, Oviedo, Spain, 2014. [Google Scholar]
  71. Giles, C.H.; MacEwan, T.H.; Nakhwa, S.N.; Smith, D. Studies in adsorption. Part XI. A system of classification of solution adsorption isotherms and its use in diagnosis of adsorption mechanisms and in measurement of specific surface areas of solids. Chem. Soc. 1960, 3973–3993. [Google Scholar] [CrossRef]
  72. Al-Zboon, K.; Al-Harahsheh, M.S.; Hani, F.B. Fly ash-based geopolymer for Pb removal from aqueous solution. J. Hazard. Mater. 2011, 188, 414–421. [Google Scholar] [CrossRef]
Figure 1. X-ray diffraction (XRD) patterns of blast furnace slag (BFS) and GS. S = Calcium silicate, Q = Quartz, C = Calcite, G = Gehlenite, X = Magnesite, * = calcium aluminosilicate hydrated (CASH) and sodium aluminosilicate hydrated (NASH) type gels.
Minerals 10 00808 g001
Figure 2. XRD patterns of FA and GA. Q = Quartz, M = Mullite, * = NASH type gels.
Minerals 10 00808 g002
Figure 3. Fourier Transform Infrared Spectroscopy (FT-IR) spectrum of BFS and GE.
Minerals 10 00808 g003
Figure 4. FT-IR Spectrum deconvolution of Si-O-T bands of BFS and GS.
Minerals 10 00808 g004
Figure 5. FT-IR spectrum of FA and GA.
Minerals 10 00808 g005
Figure 6. FT-IR Spectrum deconvolution of Si-O-T bands of FA and GA.
Minerals 10 00808 g006
Figure 7. GS SEM images at (a) 3000×, (b) 7000×, (c) 13,000×, and (d) 30,000×.
Minerals 10 00808 g007
Figure 8. GA SEM images at (a) 3000× (b) 7000×, (c) 13,000×, and (d) 30,000×.
Minerals 10 00808 g008
Figure 9. Influence of pH on geopolymers adsorption capacity of Pb2+: m = 0.15 g, V = 40 mL, C0 = 5 mg/L.
Minerals 10 00808 g009
Figure 10. Influence of initial concentration on geopolymers adsorption capacity of Pb2+: m = 0.15 g, V = 40 mL, pH = 4.
Minerals 10 00808 g010
Figure 11. Langmuir–Freundlich Adsorption isotherm of GS: m = 0.15 g, V = 40 mL, pH = 4.
Minerals 10 00808 g011
Figure 12. Langmuir–Freundlich Adsorption isotherm of GA: m = 0.15 g, V = 40 mL, pH = 4.
Minerals 10 00808 g012
Table 1. Chemical composition of raw materials in percentage (%).
Sample SiO2Al2O3Na2OTiO2Fe2O3MnOMgOCaOK2OP2O5
BFS32.610.99.120.991.160.478.7334.90.740.05
FA61.919.30.791.494.290.082.08.281.00.11
Table 2. Crystalline phases identified by XRD.
Phase IDPhase NameChemical FormulaICDD-PDF 1
CCalciteCa(CO3)00-001-0837
SCalcium silicateCa2SiO400-072-2297
GCalcium aluminosilicate (Gehlenite)Ca2(Al(Al Si)O700-073-2041
XMagnesite MgCO300-085-2348
QQuartzSiO200-046-1045
MMulliteAl6Si2O1300-001-0613
*CASH and NASH gels
Chabasite-CaAl3.6Ca1.76H19.74O33.87Si8.496-901-4473
Chantalite Al2CaH4O8Si96-900-8283
AnalcimeAl2H4Na1.862O13.667Si496-900-9956
UssigniteAlHNa2O9Si396-901-6499
1 ICDD-PDf International Centre for Diffraction data-Powder Diffraction File, * CASH and NASH identified phases.

