Article

Strength, Stiffness, and Microstructure of Wood-Ash Stabilized Marine Clay

1
Civil Engineering Program, Middle East Technical University, Northern Cyprus Campus, Kalkanli, Guzelyurt, North Cyprus, Mersin TR-10, Turkey
2
Civil Engineering, European University of Lefke, Northern Cyprus TR-10, Turkey
*
Author to whom correspondence should be addressed.
Minerals 2020, 10(9), 796; https://doi.org/10.3390/min10090796
Submission received: 17 July 2020 / Revised: 6 September 2020 / Accepted: 7 September 2020 / Published: 9 September 2020

Abstract

:
The world’s population is growing at a rapid pace, thus increasing the need for shelter, which, because of increased carbon emissions, is making our planet less habitable. Thus, supplementary cementitious materials (SCMs) are used to reduce the embodied carbon emissions in the building sector. Wood-ash, as a replacement for cement in ground improvement, seems to be a promising material. In this study, we considered the strength, stiffness, and microstructural behavior of marine deposited clays of Cyprus treated with cement and wood-ash as a cement replacement. Since clay is abundant in nature, it could help stabilize waste to improve the mechanical behavior of produced composites. Portland cement (7%, 10%, and 13%) was replaced with various amount of wood-ash (5% and 10%) with two different dry densities (1400 and 1600 kg/m3) and three distinct curing periods (7, 28, and 60 days). Unconfined compressive strength (UCS), direct shear, porosity and pulse velocity tests were performed. Additionally, X-ray diffraction (XRD), scanning electron microscopy (SEM) and energy-dispersive X-ray spectroscopy analysis (EDX) were performed for microstructural evaluation of clay–wood-ash–cement mixtures. The results revealed that the replacement of cement with 5% of wood-ash yielded superior performance. The microstructure investigation of wood-ash–cement–clay blends further showed the formation of a densified matrix with stable bonds. Furthermore, the porosity and strength properties (unconfined compressive strength, splitting tensile strength, cohesion (C) and friction angle (ϕ)) of blends have unique relationships with porosity and binder contents, which were further confirmed by other supplementary materials and soils.

1. Introduction

Not long ago, our ancestors were hunters and gatherers. They settled on fertile lands filled with animals to hunt. As soon as the soil became infertile and food sources grew extinct, these hunters and gatherers sought new homes. This process continued until they reached the fertile lands of Mesopotamia between the Tigris and Euphrates rivers, which extend from Eastern Anatolia to the Persian Gulf. These lands were so fertile that people did not need to seek new homes; thus, they settled there and built homes. Upon examining early settlements, settling next to fertile lands required the construction of homes on the strong ground using soft alluvium soils rich with minerals needed for farming. Since that time, the increase in population has created demands for speedy construction. According to the Cyprus Chamber of Civil Engineers [1] (Site Investigation Database), most of this increase in construction activities has taken place in areas close to the sea where marine clays are present. It is known that marine clays are problematic for construction because they lack strength and compressibility, which leads to excessive settlements that have low bearing capacities [2,3,4,5,6,7,8].
Soil stabilization techniques have been developed to improve the properties of the poor-quality soil so that inadequate soil would be able to serve the current needs. One of the most widely used stabilization techniques is mixing soil with several binding agents to enhance the mechanical properties of inadequate soils. Soil-cement and soil-lime stabilization have been extensively studied. However, in addition to the soil stabilization approach, it became necessary to consider sustainability to decrease the carbon footprint and environmental pollution. In that sense, the utilization of waste products, such as wood-ash within soil stabilization as a partial replacement for cement, could be an effective approach. It is known that cement production is one of the main sources of CO2 emission worldwide [9].
Consequently, using wood-ash as partial replacement to cement will decrease the cement used in soil stabilization and decrease the carbon emission caused by cement production. Additionally, it will be beneficial in terms of waste management since a waste product can be used in soil stabilization [9]. In today’s world, climate change and global warming are forcing world leaders to find more effective sustainable solutions [9,10]. Concrete is used in the construction of various structures necessary to accommodate the rapidly increasing world population. The statistics show that approximately 1 cubic meter of concrete is used per person [11]. Approximately 1 ton of carbon dioxide gas is released into the atmosphere during the production of 1 ton of Ordinary Portland cement, which affects the strength of the concrete components without supplementary cementitious materials (SCMs) [12]. Additionally, the global average of carbon release is established as 0.86, according to Miller et al. study [13].
In line with these developments, experts are seeking alternative ways to reduce carbon gas to address the issue of sustainability worldwide [14,15,16,17,18,19]. Cement companies around the world have been widely using supplementary cementitious materials (SCMs), especially in the last 25 years. Scrivener et al. [20] offers more detailed projection of the construction sector for better sustainability and reviews ongoing studies on SCMs. Additionally, given the unavailability of the traditional industrial by-product of SCMs in certain regions, the limited global supply and its effects on sustainability strategies are highlighted in Scrivener et al.’s study [20]. To reduce the amount of clinker used in cement production, many universities and research organizations are using SCMs, e.g., fly ash, bottom ash, rice husk ash, marble powder, and wood-ash (WA), and evaluating different alternative wastes [11,21,22,23,24,25,26]. Fly ash, bottom ash, rice husk ash, marble powder, and wood-ash (WA) are commonly used SCMs. The positive effect of these wastes on both fresh and hardened concrete properties benefits the industry. In addition to improving the concrete properties, SCMs should make a positive contribution to the soil properties. Therefore, simply improving concrete properties is insufficient; rather, the soil properties must be improved [14,22]. SCMs promote gel formation, provide denser structure, and reduce the amount of ettringite formation in the paste. A homogeneous interstitial transition zone can be achieved with the use of SCMs [27,28,29]. Wood-ash incorporation, as a partial replacement, generally reduces the porosity of the concrete by having a filler effect. However, a high amount of carbon makes it unsuitable for structural grade concrete applications [23,30]. The sum of alumina, silica, and iron oxides falls below the limit values specified in ASTMC618 [18,31,32]. In addition, the loss on ignition value is far above the limit value set in the standards. However, previous research has demonstrated that these values do not have a negative effect on concrete properties [9,18,30]. WA is a light and porous material. Its quality largely depends on the species of trees, burning temperature, and moisture content available during cutting operations [18]. The factor governing the composite’s behavior is related to the calcium-to-silica (Ca/Si) ratio. As this ratio increases, the expansion also increases. The growth of cracks is minimized as the Ca/Si ratio is reduced [28,33]. Based on previous findings, a high amount of silica reduces the pH of the system by reducing the Ca/Si ratio while providing a higher density when the ratio is high. Furthermore, the addition of WA to the concrete increases the water demand to ensure internal curing and helps the formation of better bonds in later stages [9,33]. The filler effect and poor pozzolanic activity of WA improve the strength beyond 90 days. The silica/alumina (Si/Al) ratio also plays an important role in the development of a strong bond by increasing the stability of the structure [10,28,33].
Microscopic investigations showed that WA contains irregular and angular particles. Some research has demonstrated that WA incorporated composites comprising flaky and elongated shape particles with porous carbon spheres. Carbon spheres contain micro and macropores and are distributed evenly [10,18,33]. Many studies have shown that portlandite and ettringite needles are also present. Crystalline phases are mostly dominated by calcium particles and show pozzolanic activity, which helps the densification and stabilizes a less crack-free microstructure. Tobermorite gel in WA can be considered a semicrystalline, while calcium silicate hydrate gel can be considered amorphous. Mullite crystals affect the durability properties of the composites [23,27,28,34]. The incorporation of WA increases water demand and creates internal pressure inside the matrix. If this pressure continues to increase, it deteriorates the composites’ structure. Naik and Kraus [19] investigated the physical and chemical properties together with the microstructure of WA, incorporating cement-based materials. In their study, various WA samples were collected from the United States and Canada. The authors found that the source of WA significantly affected the behavior of the composites. They suggested using WA to control low strength and structural grade applications. Siddique et al. [9] evaluated the WA as a replacement for fine aggregate using X-ray diffraction. They reported that the WA contained crystalline and amorphous phases. Furthermore, they found that 5% of WA is optimal for better matrix properties. Due to WA’s higher absorption capacity, the final composites are adversely affected above this substitution level. Shearer and Kurtis [17] evaluated the possibility of using coal ash and biomass ash as a source of SCMs. They reported that the increase in aluminum and silica concentration in pore solution most probably occurred after 7 days of curing, thereby gaining further strength in later ages. They also concluded that ashes have a positive effect on durability. Stolz et al. [23] characterized WA in foam-based composites. They reported that up to a 20% strength loss was recorded when WA was incorporated into a system as a 10% cement substitution. The elastic modulus reduction was approximately 35% at the 20% substitution level. However, they mentioned advantages of using WA in projects where acoustical and sound permeability is important. Elinwa [29] examined the effects of calcined clay on mortar and concrete properties. Samples composed of clay varied from 0–40% by mass of cement. As the clay content increased, the strength continuously decreased. The results of the study indicated that 10% calcined clay was found to be optimal in terms of better strength and durability.
Consoli et al. [35] obtained correlations between water-cement and porosity-cement ratios to evaluate the unconfined compressive strength of soils. The authors reported a significant increase in the strength of soil by the addition of cement only. The effect of cement content increased linearly with strength, whereas it showed an exponential relationship with the reduction in porosity. In other words, as the soil-cement products fill the voids of the soil, the strength increases consequently. Consoli et al. [35] proposed a correlation to evaluate the unconfined compressive strength of cement stabilized soils. According to the authors, the ratio between voids and cement, in other words, [η/Civ]0.28 where η is porosity and Civ is volumetric cement content, best represents the UCS by some empirical factors. Another piece of research by Consoli et al. [36] claimed that the unconfined compressive strength increases when the lime content and density are constant and the amount of fly ash increases. In line with the previous study, the reduction in porosity revealed an exponential relationship with strength, whereas the amount of fly ash showed a linear trend. Ekinci et al. [22] concluded that mixing marine clay with Portland cement and copper slag had negative effects on strength properties; however, the inclusion of lime activated the pozzolanic effects, and an improvement in strength properties was observed. Some researchers studied the shear strength parameters of wood-ash that included fine-grained soil by examining Mohr–Coulomb shear envelope and concluded that improvement occurs both in cohesion and friction angle until an optimum value of 10% addition of wood-ash. However, above that value, i.e., at 12.5% addition, a decrease in shear parameters was observed [37]. Consoli et al. [38] established a reliable relationship between the unconfined compressive strength, splitting tensile strength and cohesion (C), and friction angle (ϕ) in case of lime addition to soils. More recently, Soltani et al. [39] established a universal predictive model for the UCS of artificially cemented fine-grained soils.
WA alone does not possess pozzolanic activity, but due to the presence of some silica and alumina, it shows better engineering properties. Generally, clay particles contain enough silica and some alumina. The interaction of clayey soils with WA seems promising for future trends. To date, no research has investigated the effects of WA–clay–cement blends in terms of strength, stiffness, and microstructure. This study investigated the effect of the partial replacement of cement with wood-ash in marine clay stabilization by considering unconfined compressive strength, initial shear modulus, and shear strength parameters. Scanning electron microscopy imaging was used to analyze the microstructure and highlight the observed behavior of the blends. In addition, a parametric model was created to determine the amount of cement needed to establish the value of the studied parameters (UCS, shear strength, and initial shear modulus) for the optimal amount of wood-ash. Finally, an equation was proposed to evaluate the necessary amount of cement to reach a target value for the studied parameters (i.e., unconfined compressive strength, shear strength, and initial shear modulus) to attain the optimal amount of wood-ash.

2. Experimental Section

2.1. Materials

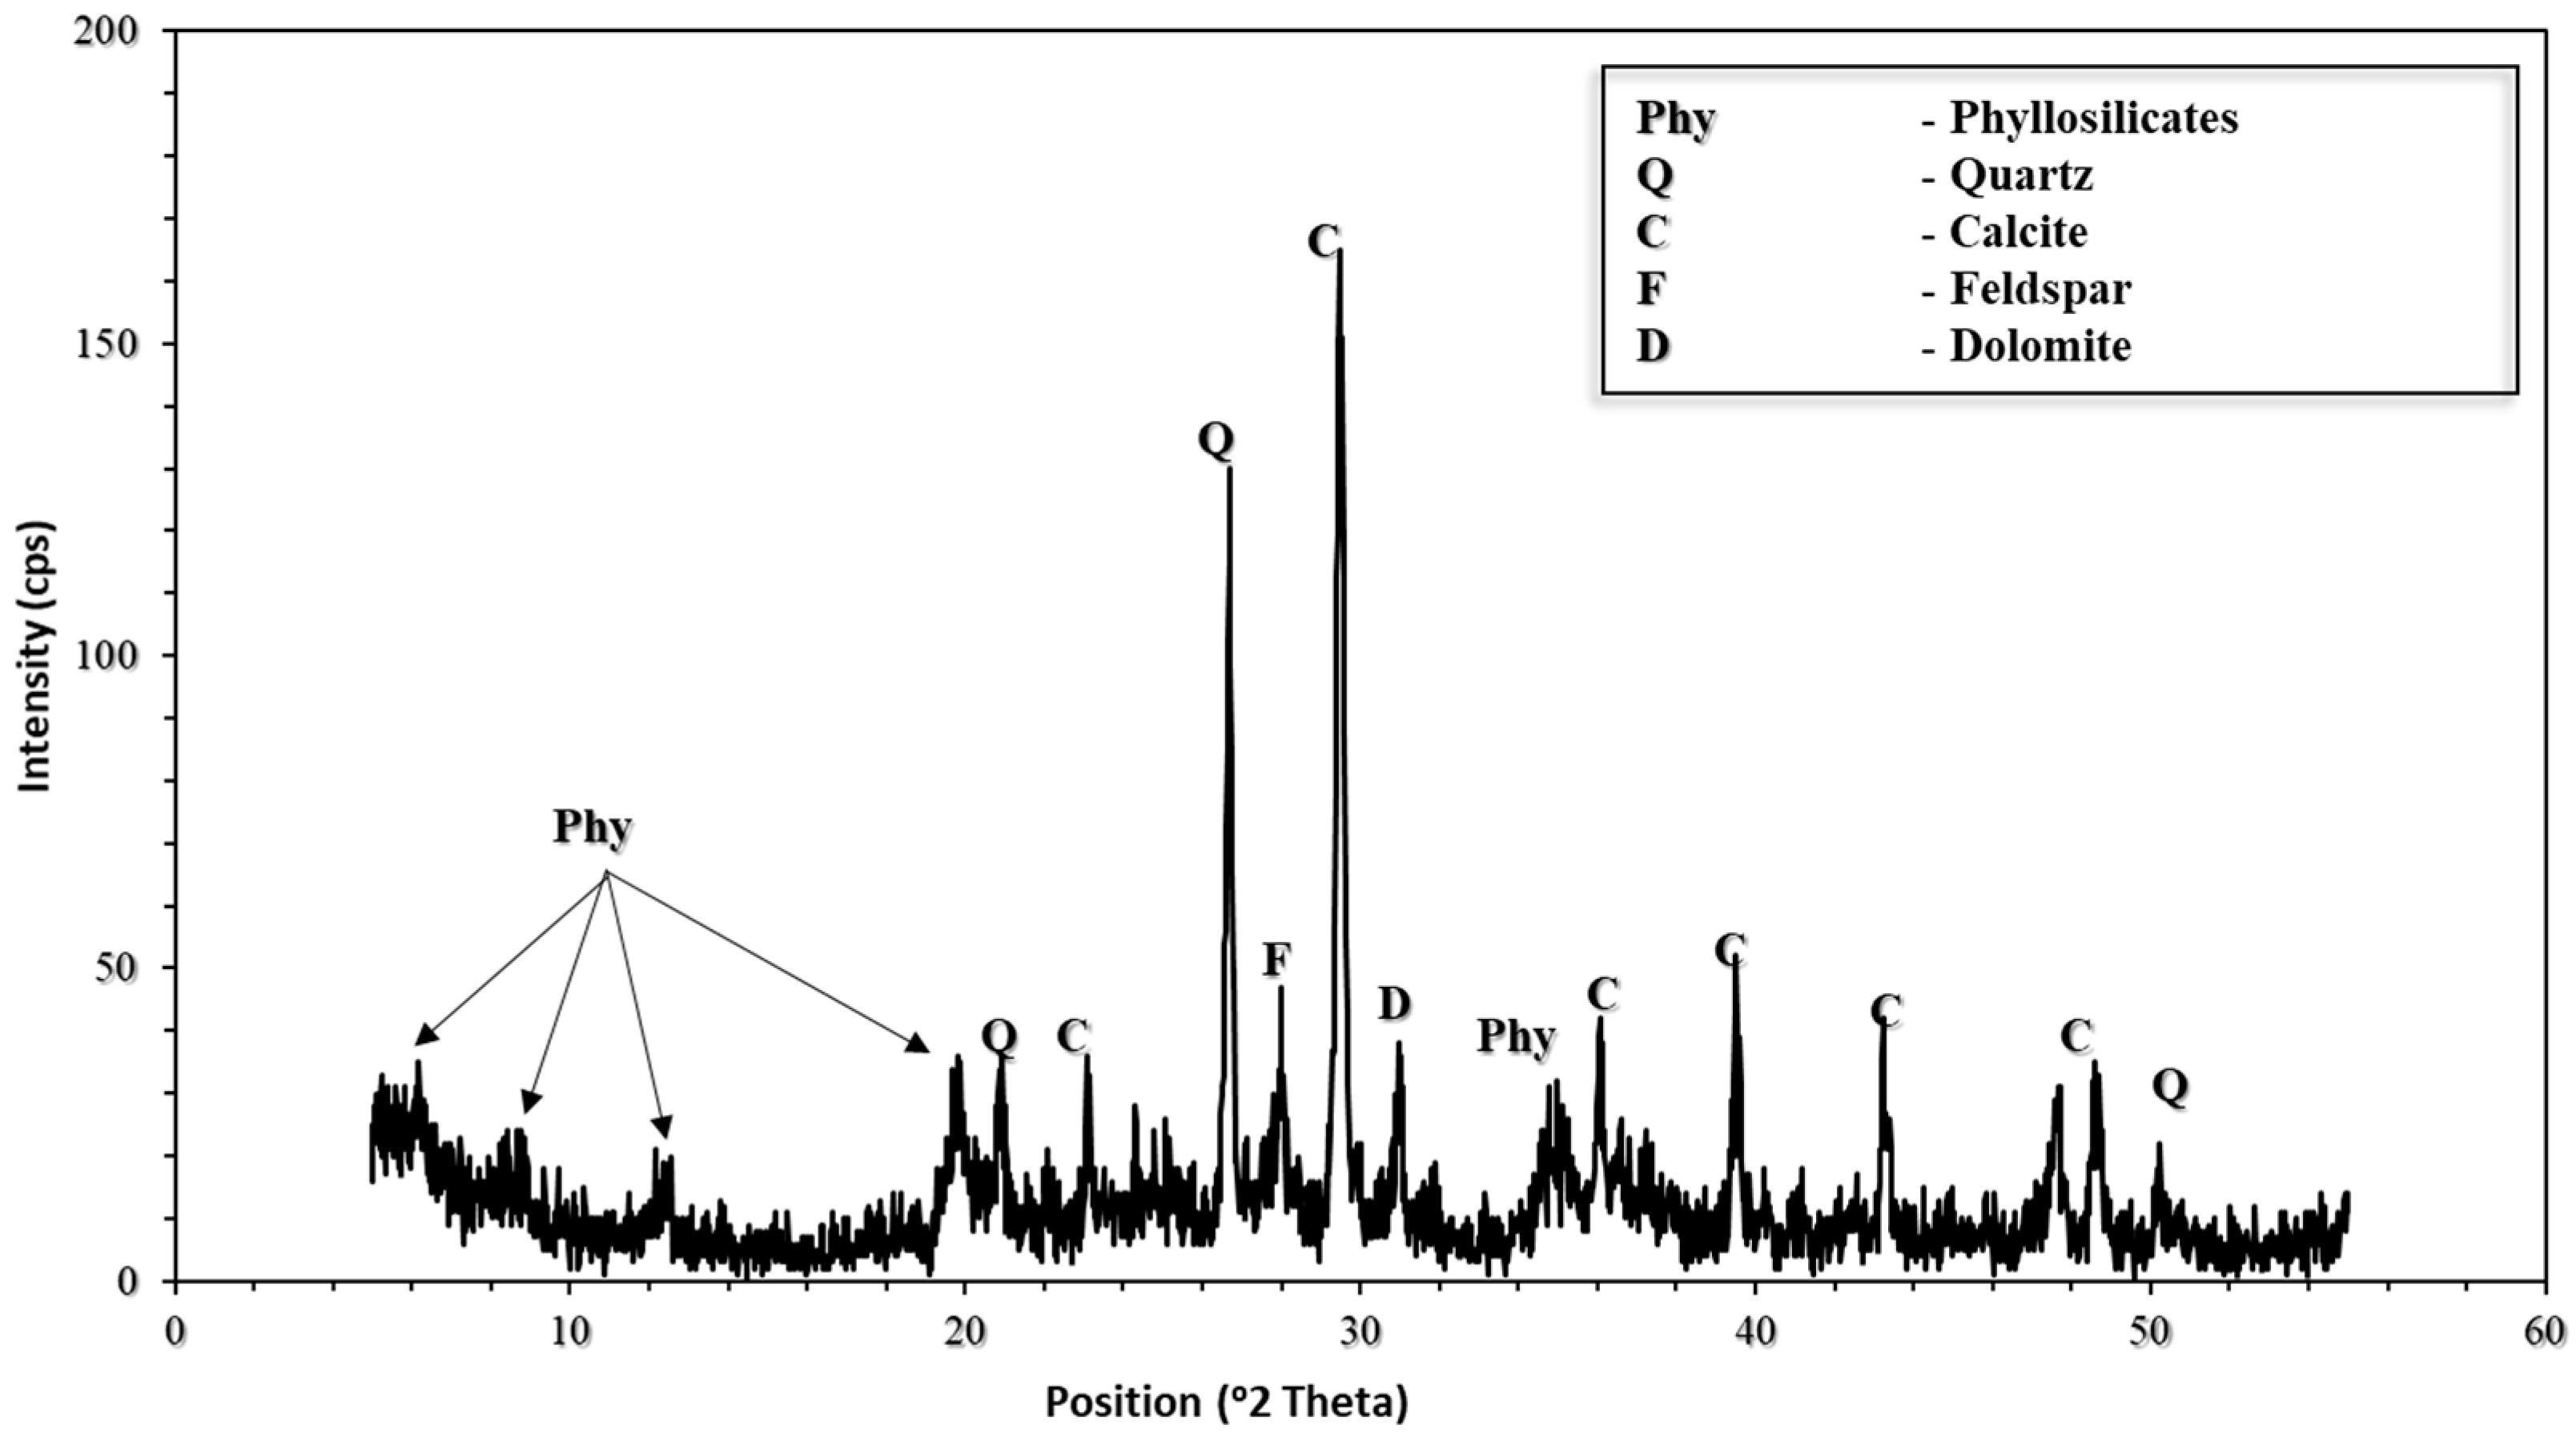
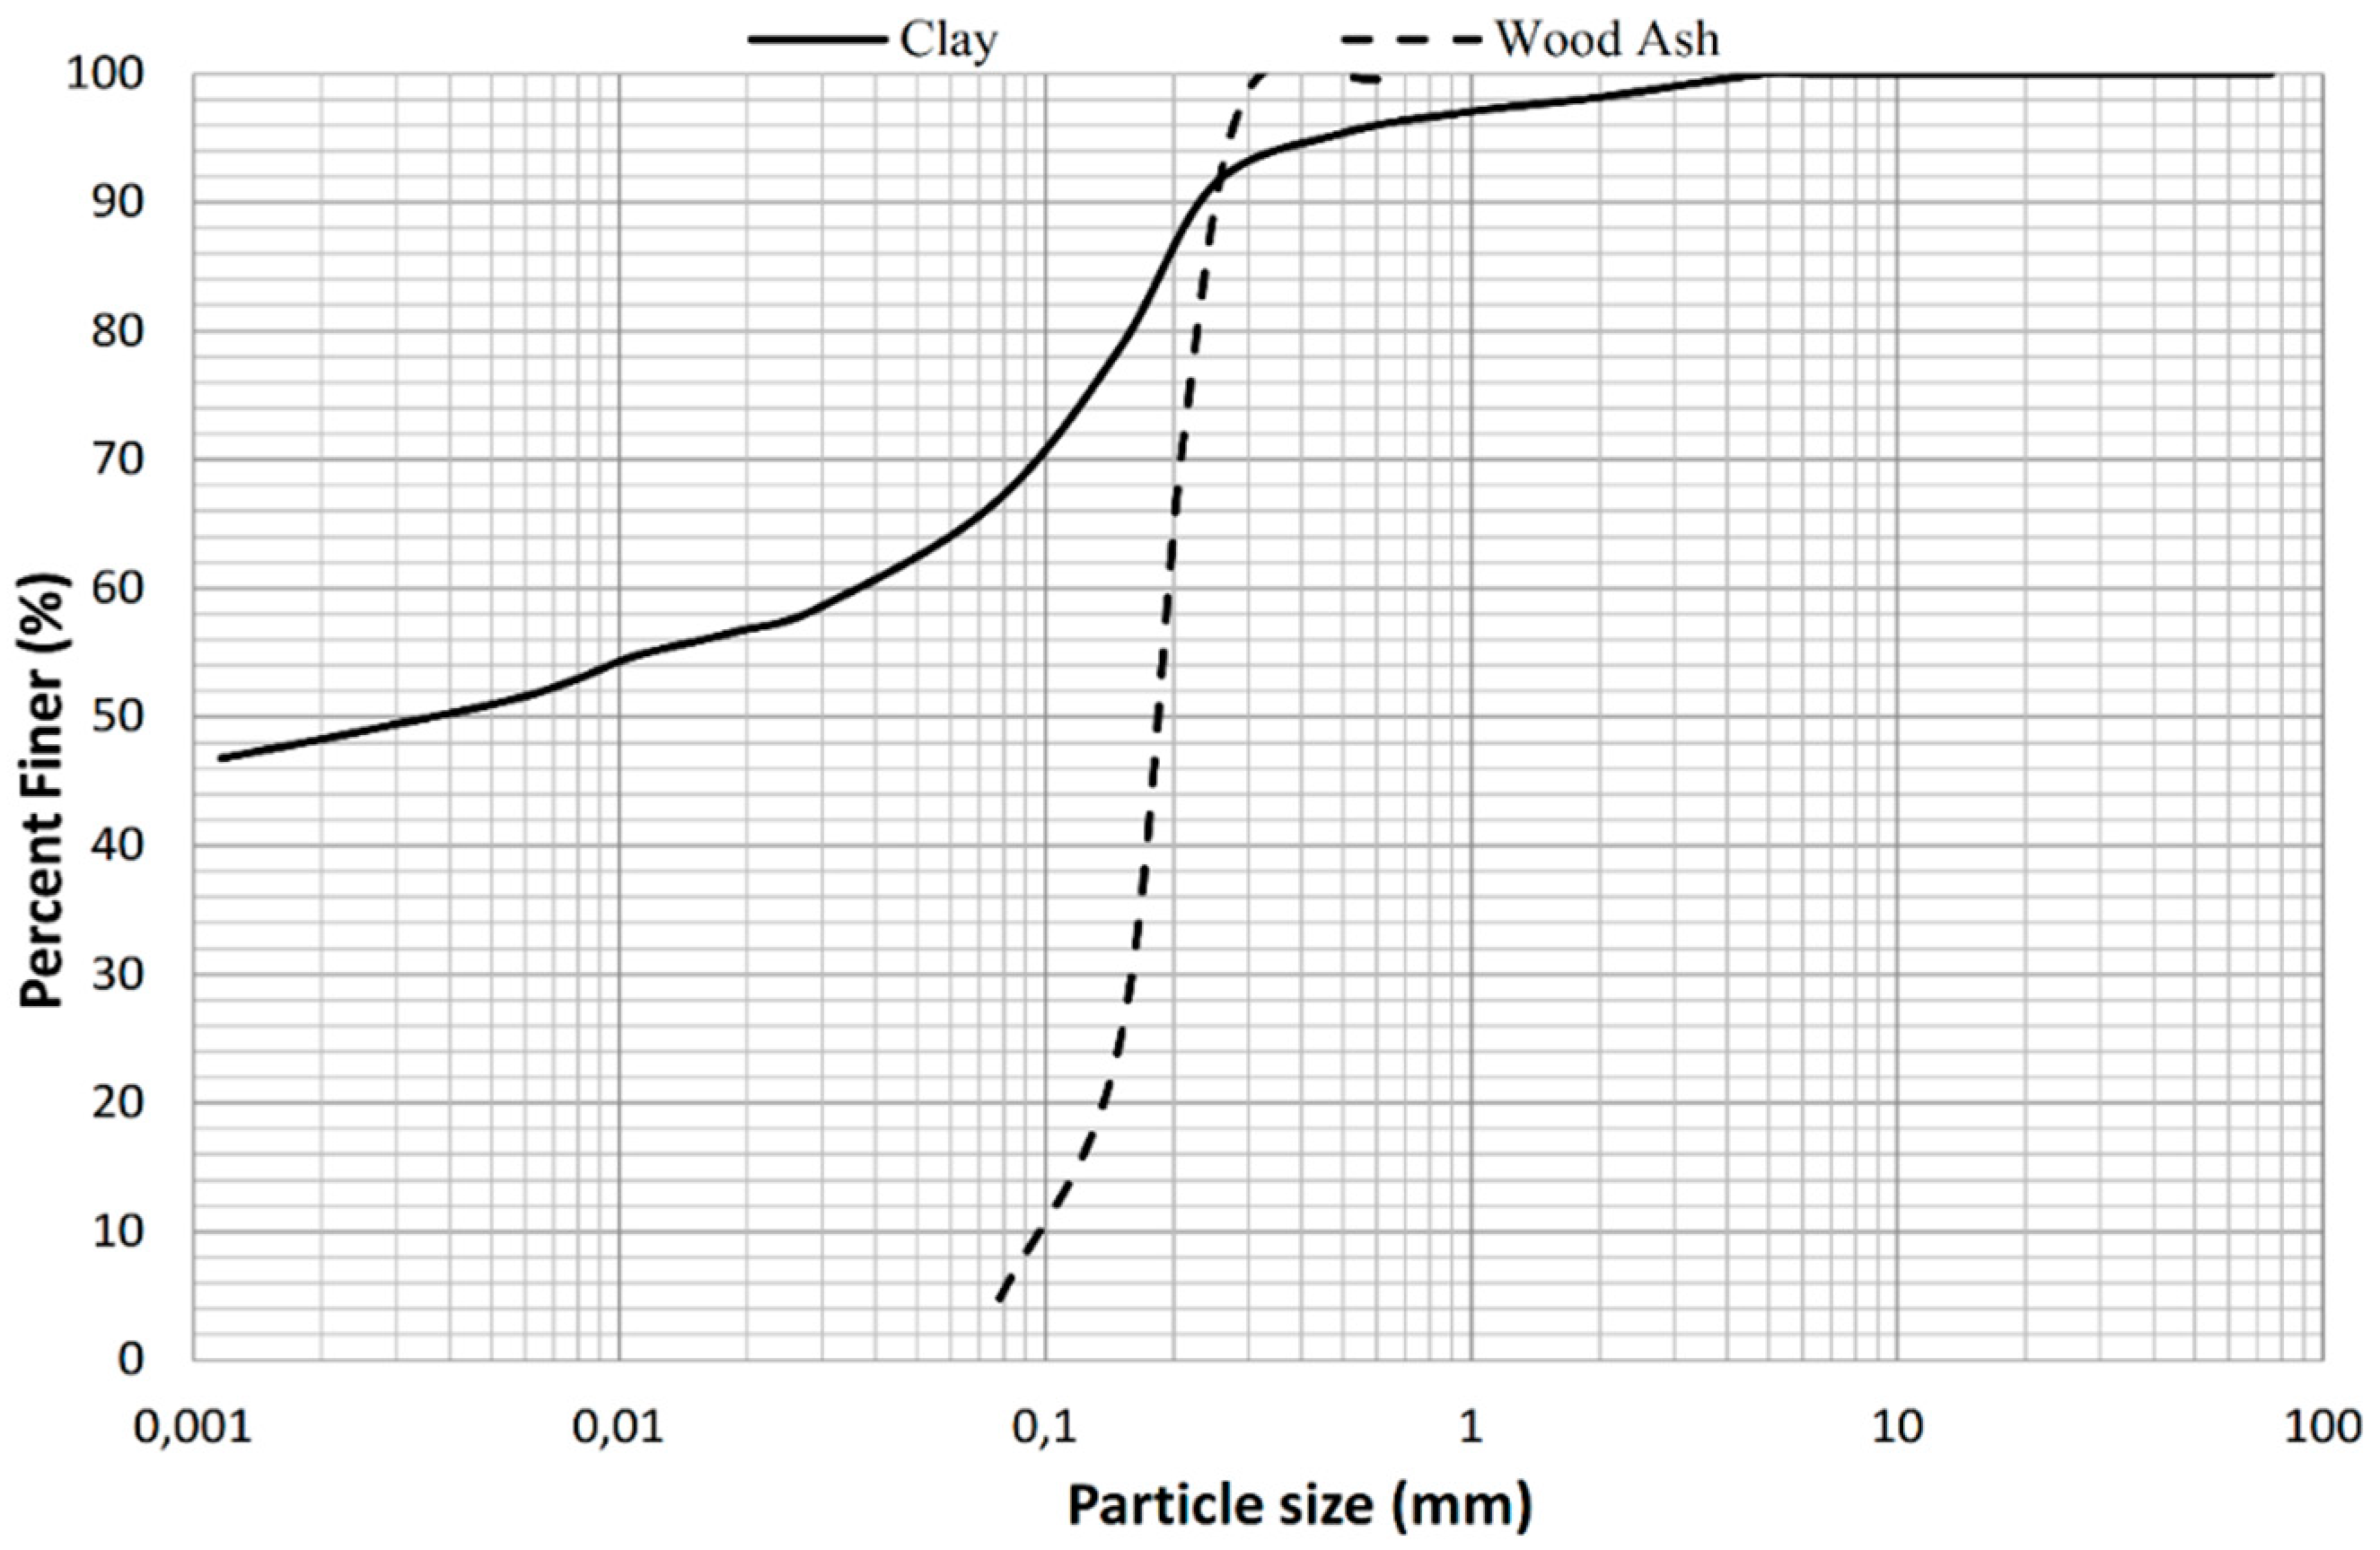
2.1.1. Marine Deposited Clay

Block samples were collected from the site, located in the Kyrenia District, northern coast of Cyprus, located at Grid Reference 33°23′31.18″ E, 35°19′59.71″ N. The blocks were obtained during the excavation phase at a depth of approximately 12 m.
Marine deposited clays used in this study are Kyrenia Range, Çamlıbel Marl, which were identified as “Mirtou Marl” by Bellamy and Jukes-Brown [40]. Later in their study, Hakyemez et. al. [41] identified this formation as Çamlıbel Marl. Palamakumbura [42] noted that the initial emergence of the Kyrenia Range began during the Pliocene Epoch and resulted in a non-marine mountain range, surrounded by a shallow-marine environment. Additionally, the author added that the base of the sequence comprises a thick bedded carbonate deposit containing beds rich in either benthic and planktonic foraminifera or calcareous red algae. Furthermore, author stated that the calcium carbonate content of the formation originated from the limestones and dolomites of the Kyrenia zone and the chalks of the South Cyprus zone, and has a considerable part that is biogenic in origin. Characterization tests, such as Atterberg limits, sieve analysis, and specific gravity, were conducted according to ASTM D4318-17 [43], ASTM D6913-17 [44], and ASTM D854-14 [45], respectively. The grain size distribution of clay is shown in Figure 1 (note that it is well-graded with a D50 particle diameter of 0.0035 mm). Table 1 shows the physical characteristics of the clay. In addition, this clay is categorized according to USCS (ASTM, 2017b [46]) as an inorganic clay with low to medium plasticity (CL). The specific gravity was determined in accordance with ASTM D854-14 [45]. X-ray diffraction analysis of bulk sample was completed with X’Pert Pro MPD diffractometer using monochromatic Cu–Ka radiation. The X-ray diffraction (XRD analysis of studied clay sample is shown in Figure 2. The EDX of marine deposited clay is shown in supplementary file (see Figure S2).

2.1.2. Wood-Ash (WA)

The WA used in this study was obtained from the remnants of pruned and burned olive trees. The particle size distribution is shown in Figure 1, along with that of the clay. The chemical analysis (standard) results are shown in Table 2. This wood-ash consists mainly of calcite and silica. Similar findings were confirmed on the EDX analysis shown in supplementary file (see Figure S3). The specific gravity of wood-ash was determined in accordance with ASTM C188-17 [48]. The specific gravity can vary depending on the source and the heat of combustion, as explained by Naik et al. [49]. Therefore, specific gravity tests were performed on every lot of provided wood-ash, and an average value of 1.7 was taken into consideration (variation of Gs < 0.02).

2.1.3. Cement

The cement used in the study was Portland cement (C) Type I, as specified in ASTM C150 M-18 [50]. The Blaine fineness of cement was 289 m2/kg. The chemical analysis of this cement is shown in Table 2.

2.1.4. Water

Distilled water was used to mix and cure the composites.

2.2. Methods

2.2.1. Moulding and Curing of Specimens

For the unconfined compression-strength tests, cylindrical specimens were prepared with a 100 mm height and 50 mm diameter according to ASTM C39 [51]. First, the targeted dry density was specified. In this research, the targeted densities were 1400 and 1600 kg/m3 based on the maximum dry density of the clay at the optimum moisture content (1600 kg/m3). As stated by Basma et al. [52], to obtain representative soil properties, the soil should be air-dried rather than oven-dried. Therefore, clay samples obtained from the site were air-dried at room temperature and pulverized with mortar and pestle. Next, the amounts of clay, cement, and wood-ash were calculated based on the aforementioned density. These proportions of dry materials were then mixed under dry conditions until uniform distribution was achieved (at least 5 min). After that, the precalculated amount of water was slowly added and mixed with the binder until a homogenous mixture was reached. The amount of water to be used was determined from the compaction curve of the clay (see supplementary file, Figure S1). Two densities were chosen, where the first one corresponded to the maximum density (1600 kg/m3), and the second one corresponded to a lesser density (1400 kg/m3). This mixture was then separated into three equal layers and compacted statically in a split mold to the desired density using the compaction method proposed by Selig and Ladd [53]. After the sample was formed, it was removed from the mold and the dimensions measured. The specimens were cured according to ASTM C 511 [54].
The mix of the specimens was based on the relative contents of Portland cement (C) and wood-ash (WA). C was defined as the mass of Portland cement divided by the mass of the dry soil, whereas WA was defined as the mass of the wood-ash divided by the mass of Portland cement, as it was a partial replacement for cement.
Porosity was calculated using a modified version of Equation (1) proposed by Consoli et al. [47], which considers dry density (ρd) and the mass of the marine clay (MS), Portland cement (MC), and wood-ash (MWA). The corresponding specific gravities are marine clay ( Gs S ) , Portland cement ( Gs c ) , and wood-ash ( Gs WA ) , respectively.
η = 100 100 [ ρ d total   mass   of   solid ] [ M S Gs S + M c Gs c + M WA Gs WA ]
Depending on the porosity cement index ( η /Civ), a unique relationship was developed to predict the behavior of cement-treated soils [55], which only accounted for cement. More recently, Ekinci et al. [22] proposed a more general index Xiv, which accounts for all binder contents. In this study, Ekinci et al.’s [22] parameter was modified in an attempt to predict the strength of each mixture, where Xiv was calculated from the modified Equation (2), where V = M/ρs is true for all materials used:
X iv =   V S + V C + V WA V ,
Table 3 provides all the necessary molding data, including material contents, curing periods, dry density, and the type of tests conducted.
For direct shear tests, another set of samples with an average height of 30 mm and a diameter of 60 mm were prepared. The preparation procedure was similar to that of the previous specimens. Formed specimens were then cured for seven days in the direct shear device under the selected normal pressure.

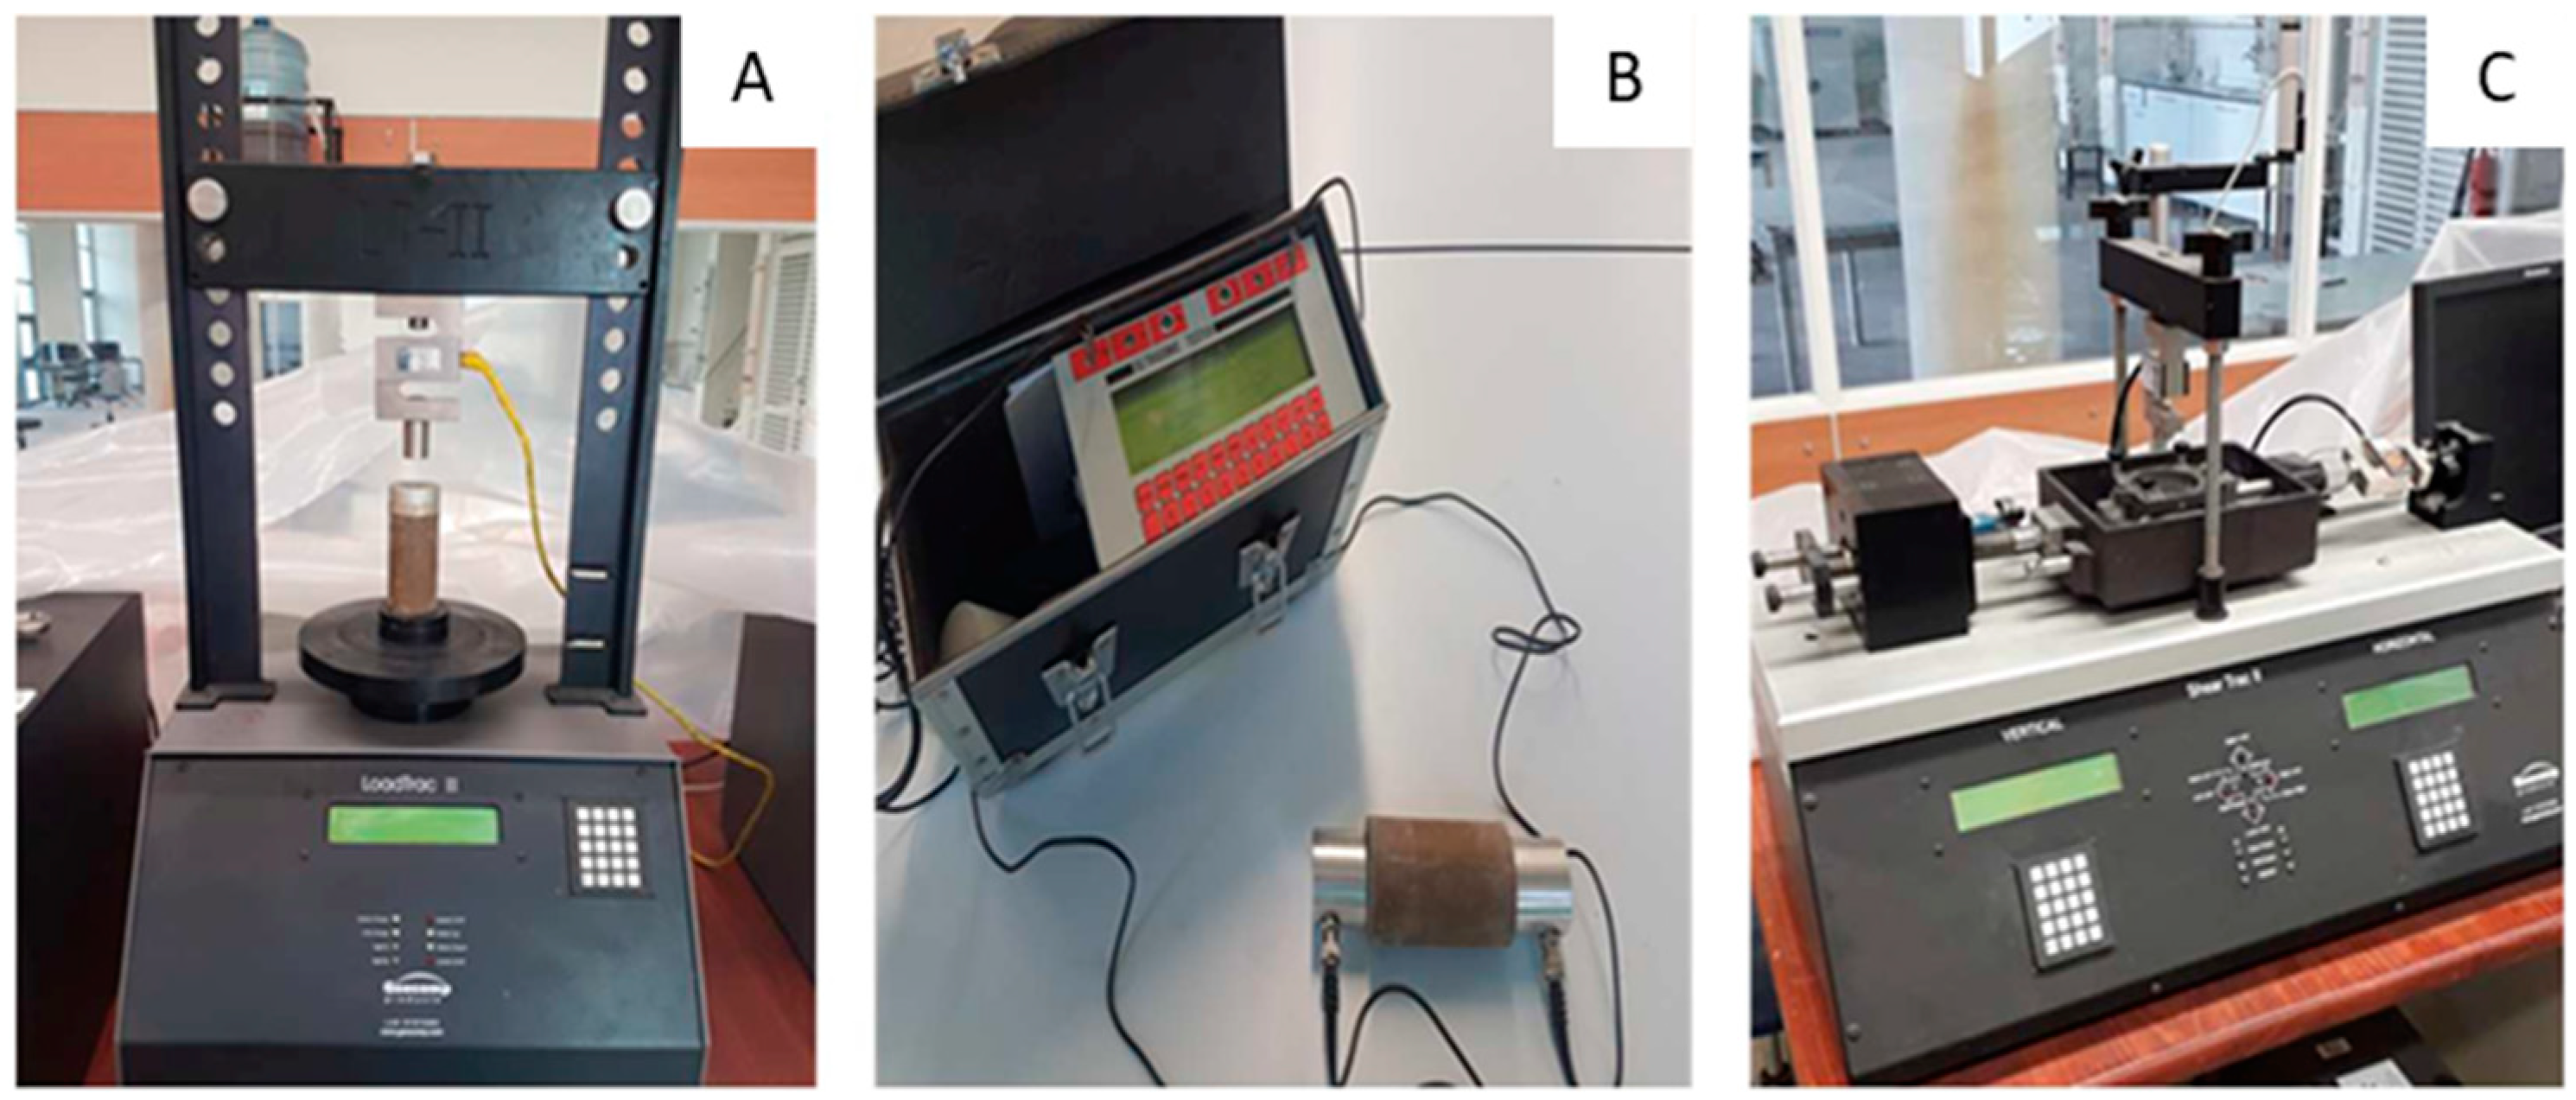
2.2.2. Unconfined Compression Strength

A UCS test was conducted according to ASTM C39 [51]. The fully automatic testing system (max. capacity: 20 kN, accuracy of 0.005 kN) was used (Figure 3A). A constant strain rate was applied and controlled throughout the testing program.

2.2.3. Ultrasonic Pulse Velocity Test

In this study, the ASTM C 597-02 [56] was used to determine the ultrasonic pulse velocity. Samples tested during this stage were prepared, cured, inundated, and dried, as stated in the UCS test. The device used was MATEST Ultrasonic Tester Model C368 (Figure 3B). Two transducers were connected to the samples on both sides using grease. The distance between the transducers (the length of the specimen) was accurately determined. After that, the device sent a velocity wave, and subsequently, the time for the wave to travel through the sample was measured. The distorted form of the wave was viewed on the device’s screen.
The shear modulus was obtained from the product of the density of the specimen and the square of the shear wave velocity measured by the pundit. This is illustrated in the following formula:
G 0 = ρ . ν 2
where G0 is the shear modulus, ρ is the density of the sample, and ν is the wave velocity measured from the device.

2.2.4. Direct Shear Tests

A direct shear test was performed on the aforementioned cylindrical samples of the 30 mm × 60 mm dimensions in accordance with ASTM D3080-11 [57] under consolidated drained conditions. Following the preparation of specimens, a computer-controlled apparatus (Figure 3C) was used for this test purpose. This apparatus was equipped with two load cells of 2-ton capacities for horizontal and vertical strength and two displacement transducers. The shearing stage started (strain rate: 0.1 mm/min) under the normal pressures (σ1) of 100, 200, and 300 kPa up to a maximum displacement of 8 mm.

2.2.5. Scanning Electron Microscopy (SEM)

Once the UCS was finished, scanning electron microscopy (SEM) was applied to the samples to study the microstructure of the blends. For this purpose, a Jeol JSM-6480LV scanning electron was used. First, a small dried piece of the specimens was attached to the aluminum stubs. Silver paint was applied to ensure electrical contact between each sample and stub. After that, the gold coating was applied to the sample and then it was tested. The magnifications of the images ranged from 5000× to 7500×.

3. Results and Discussion

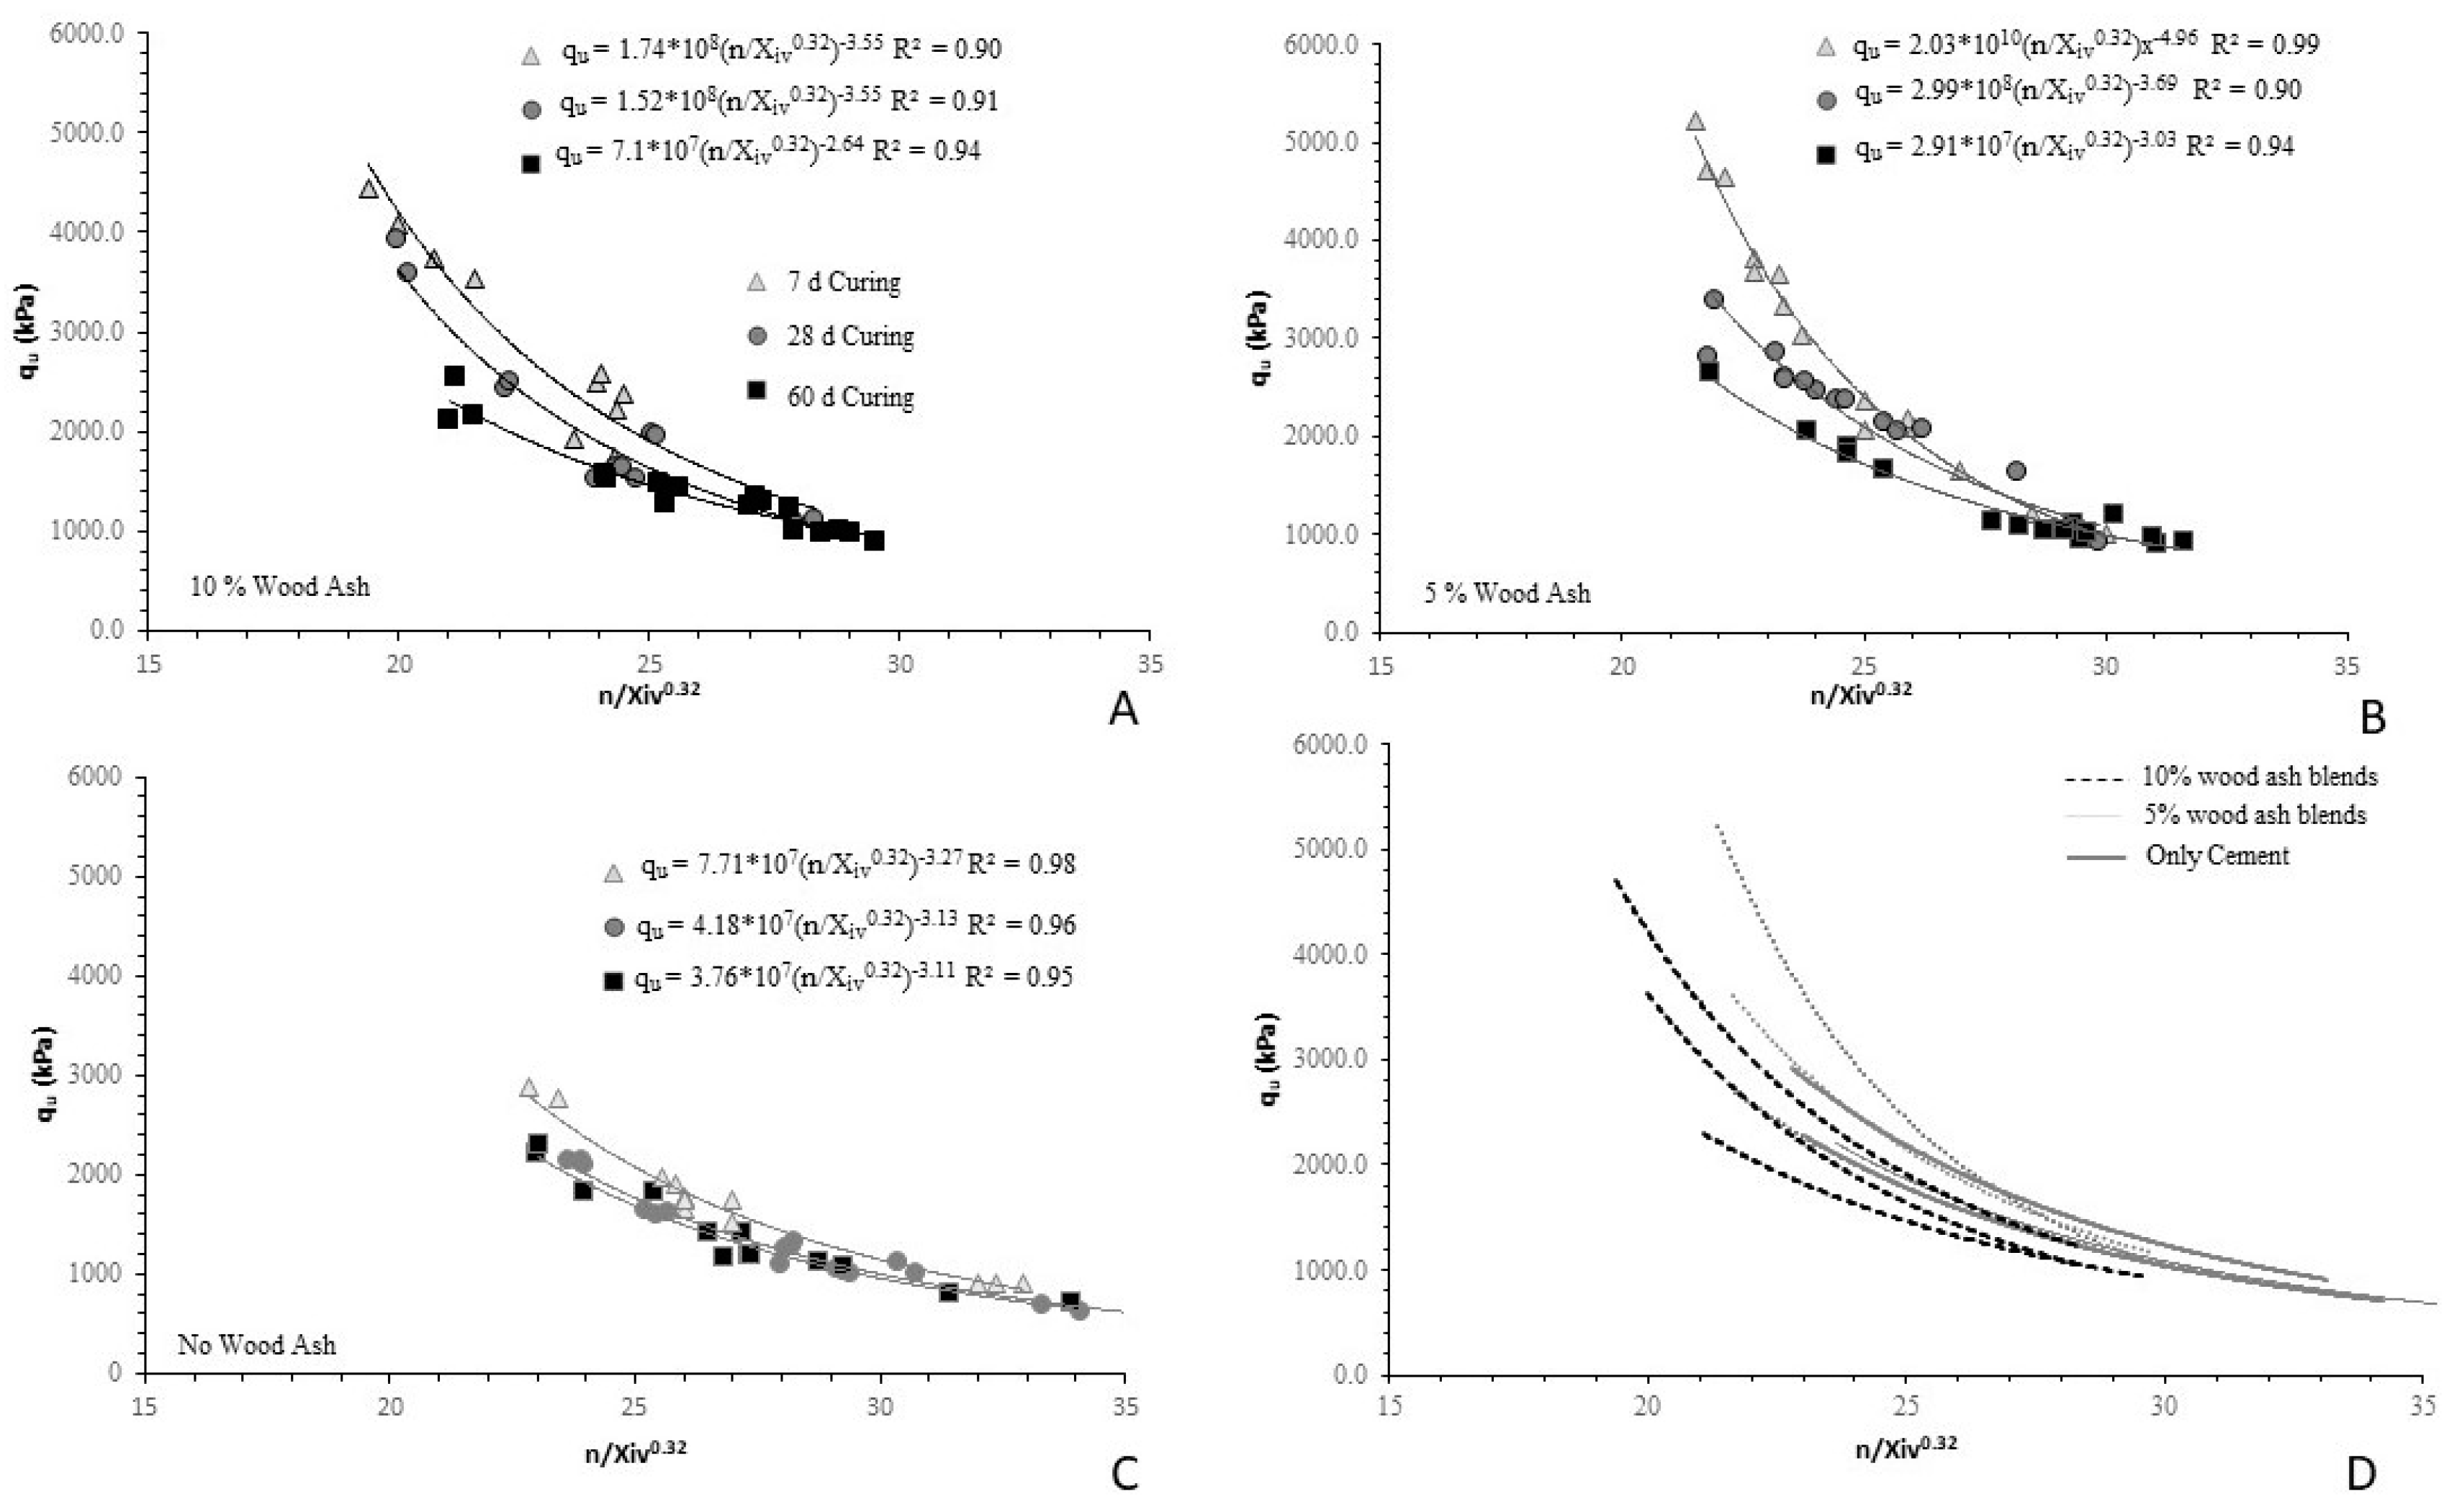
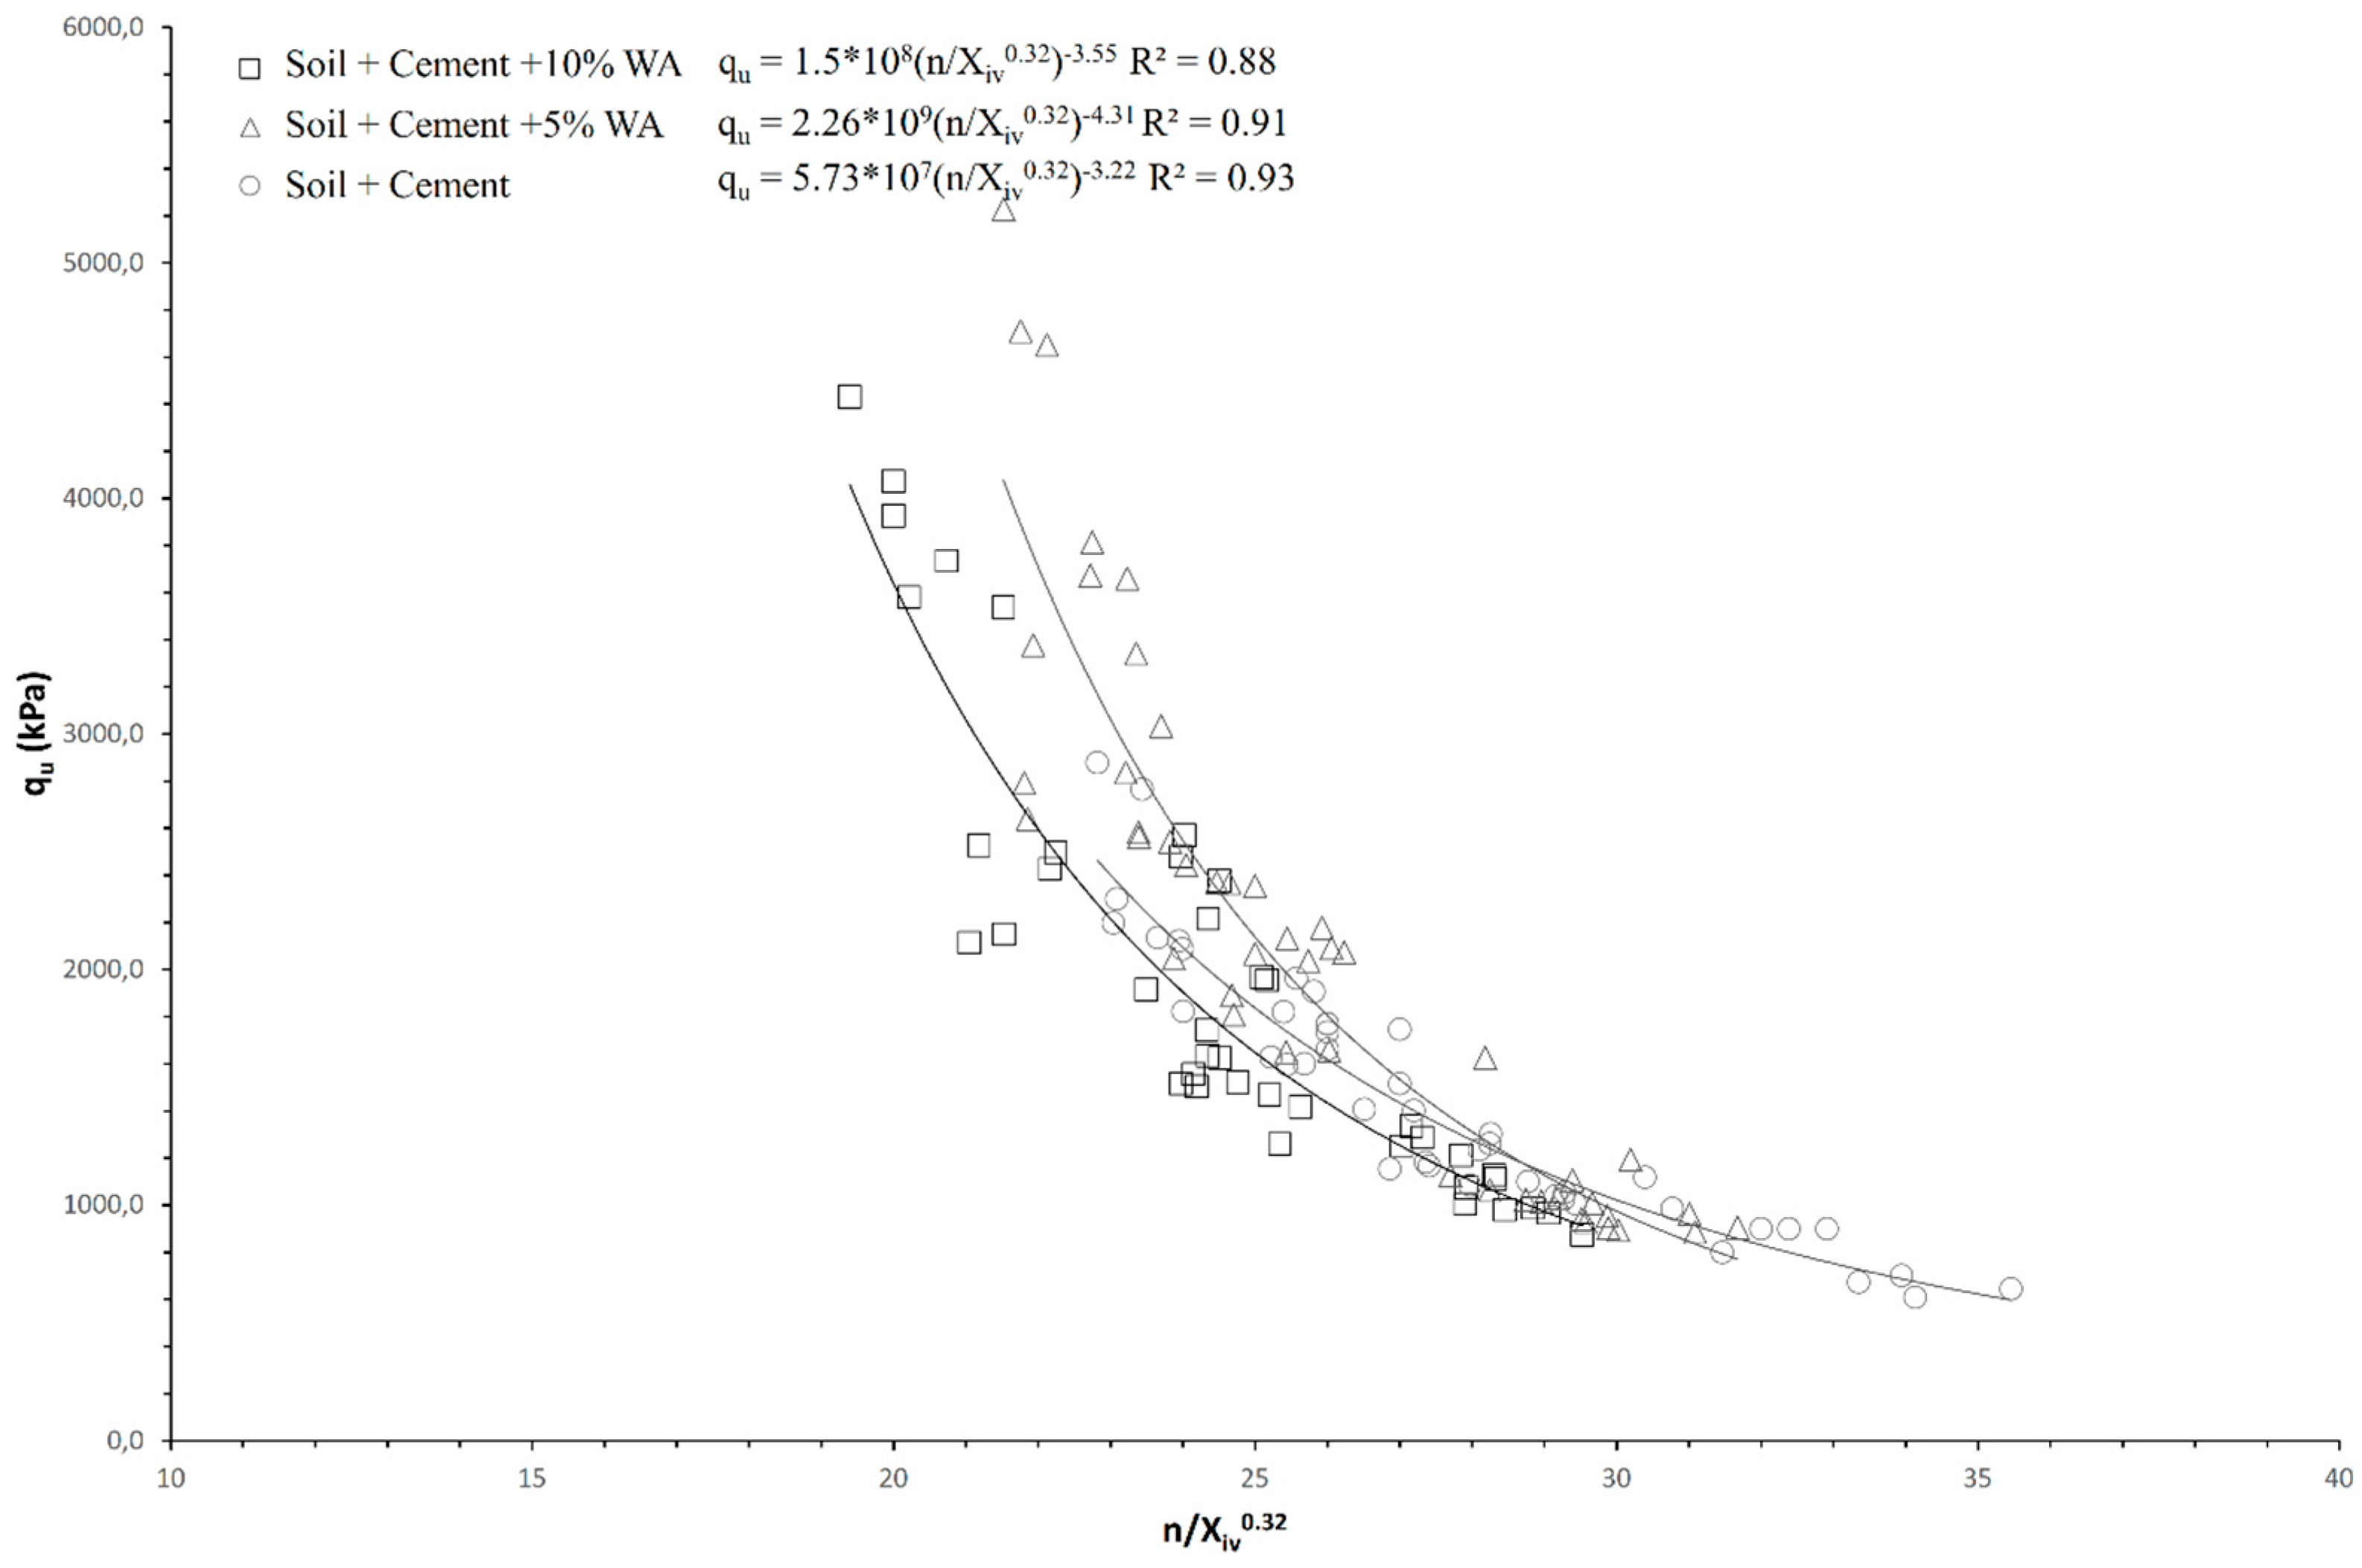
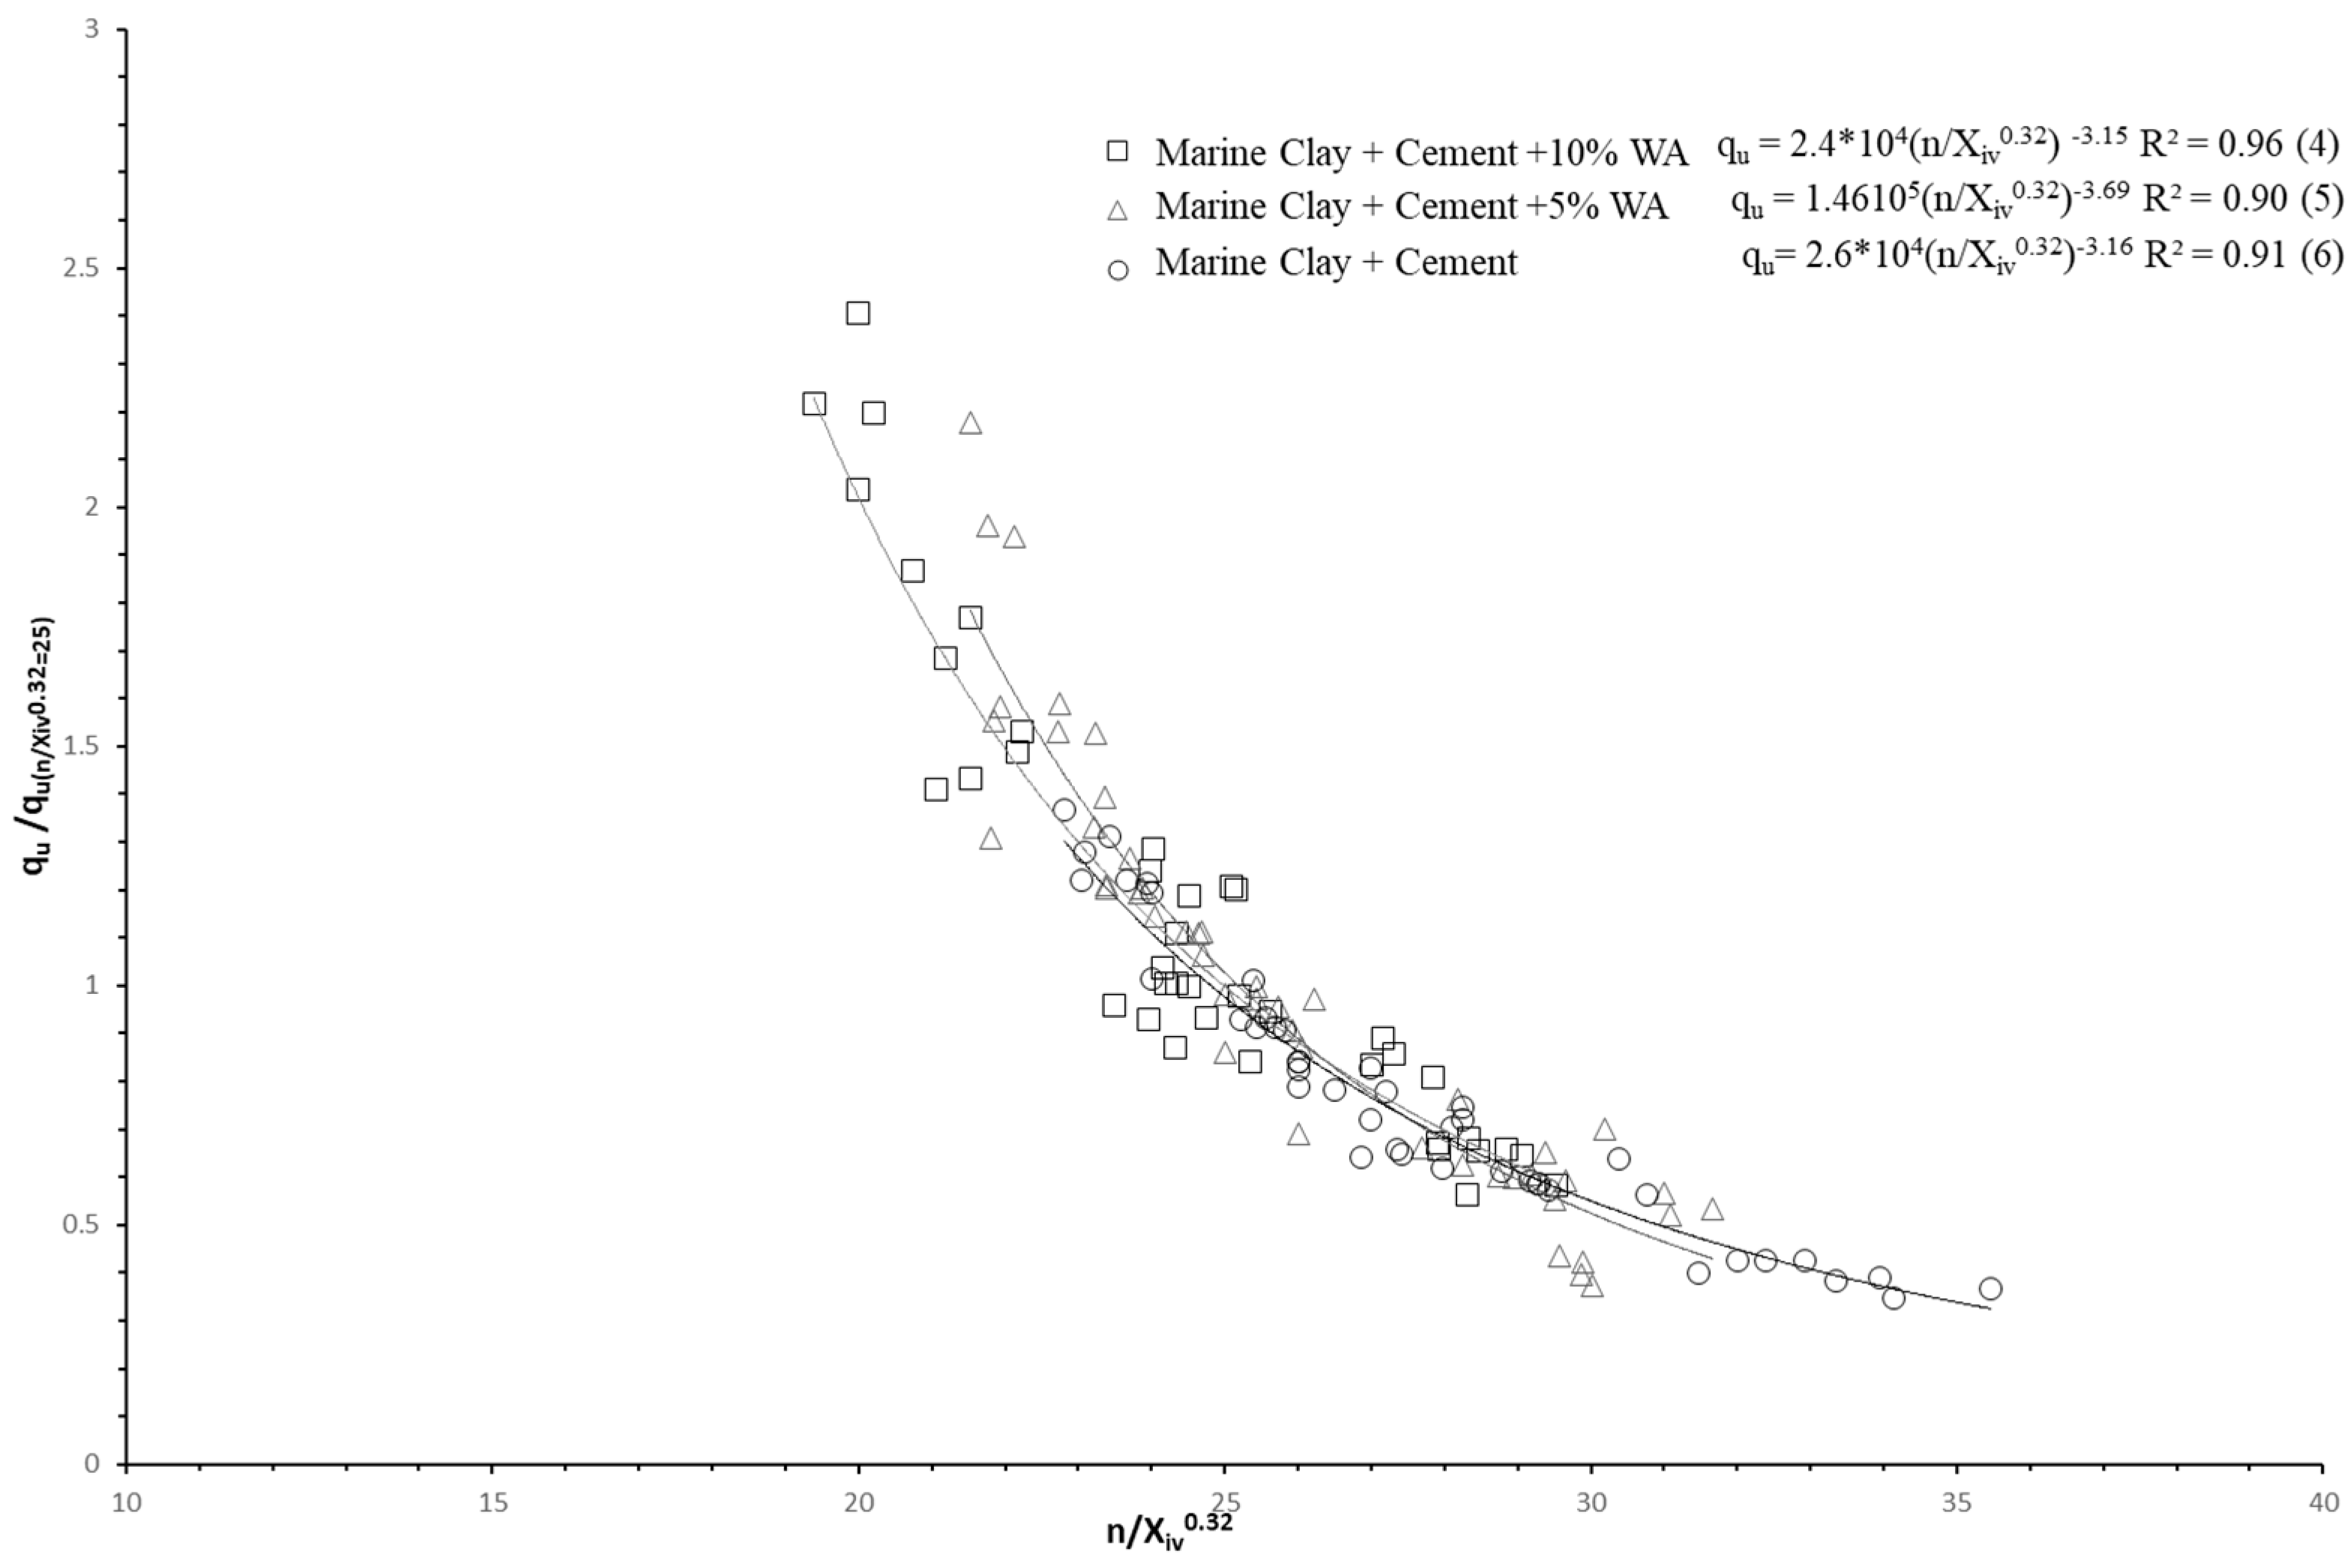
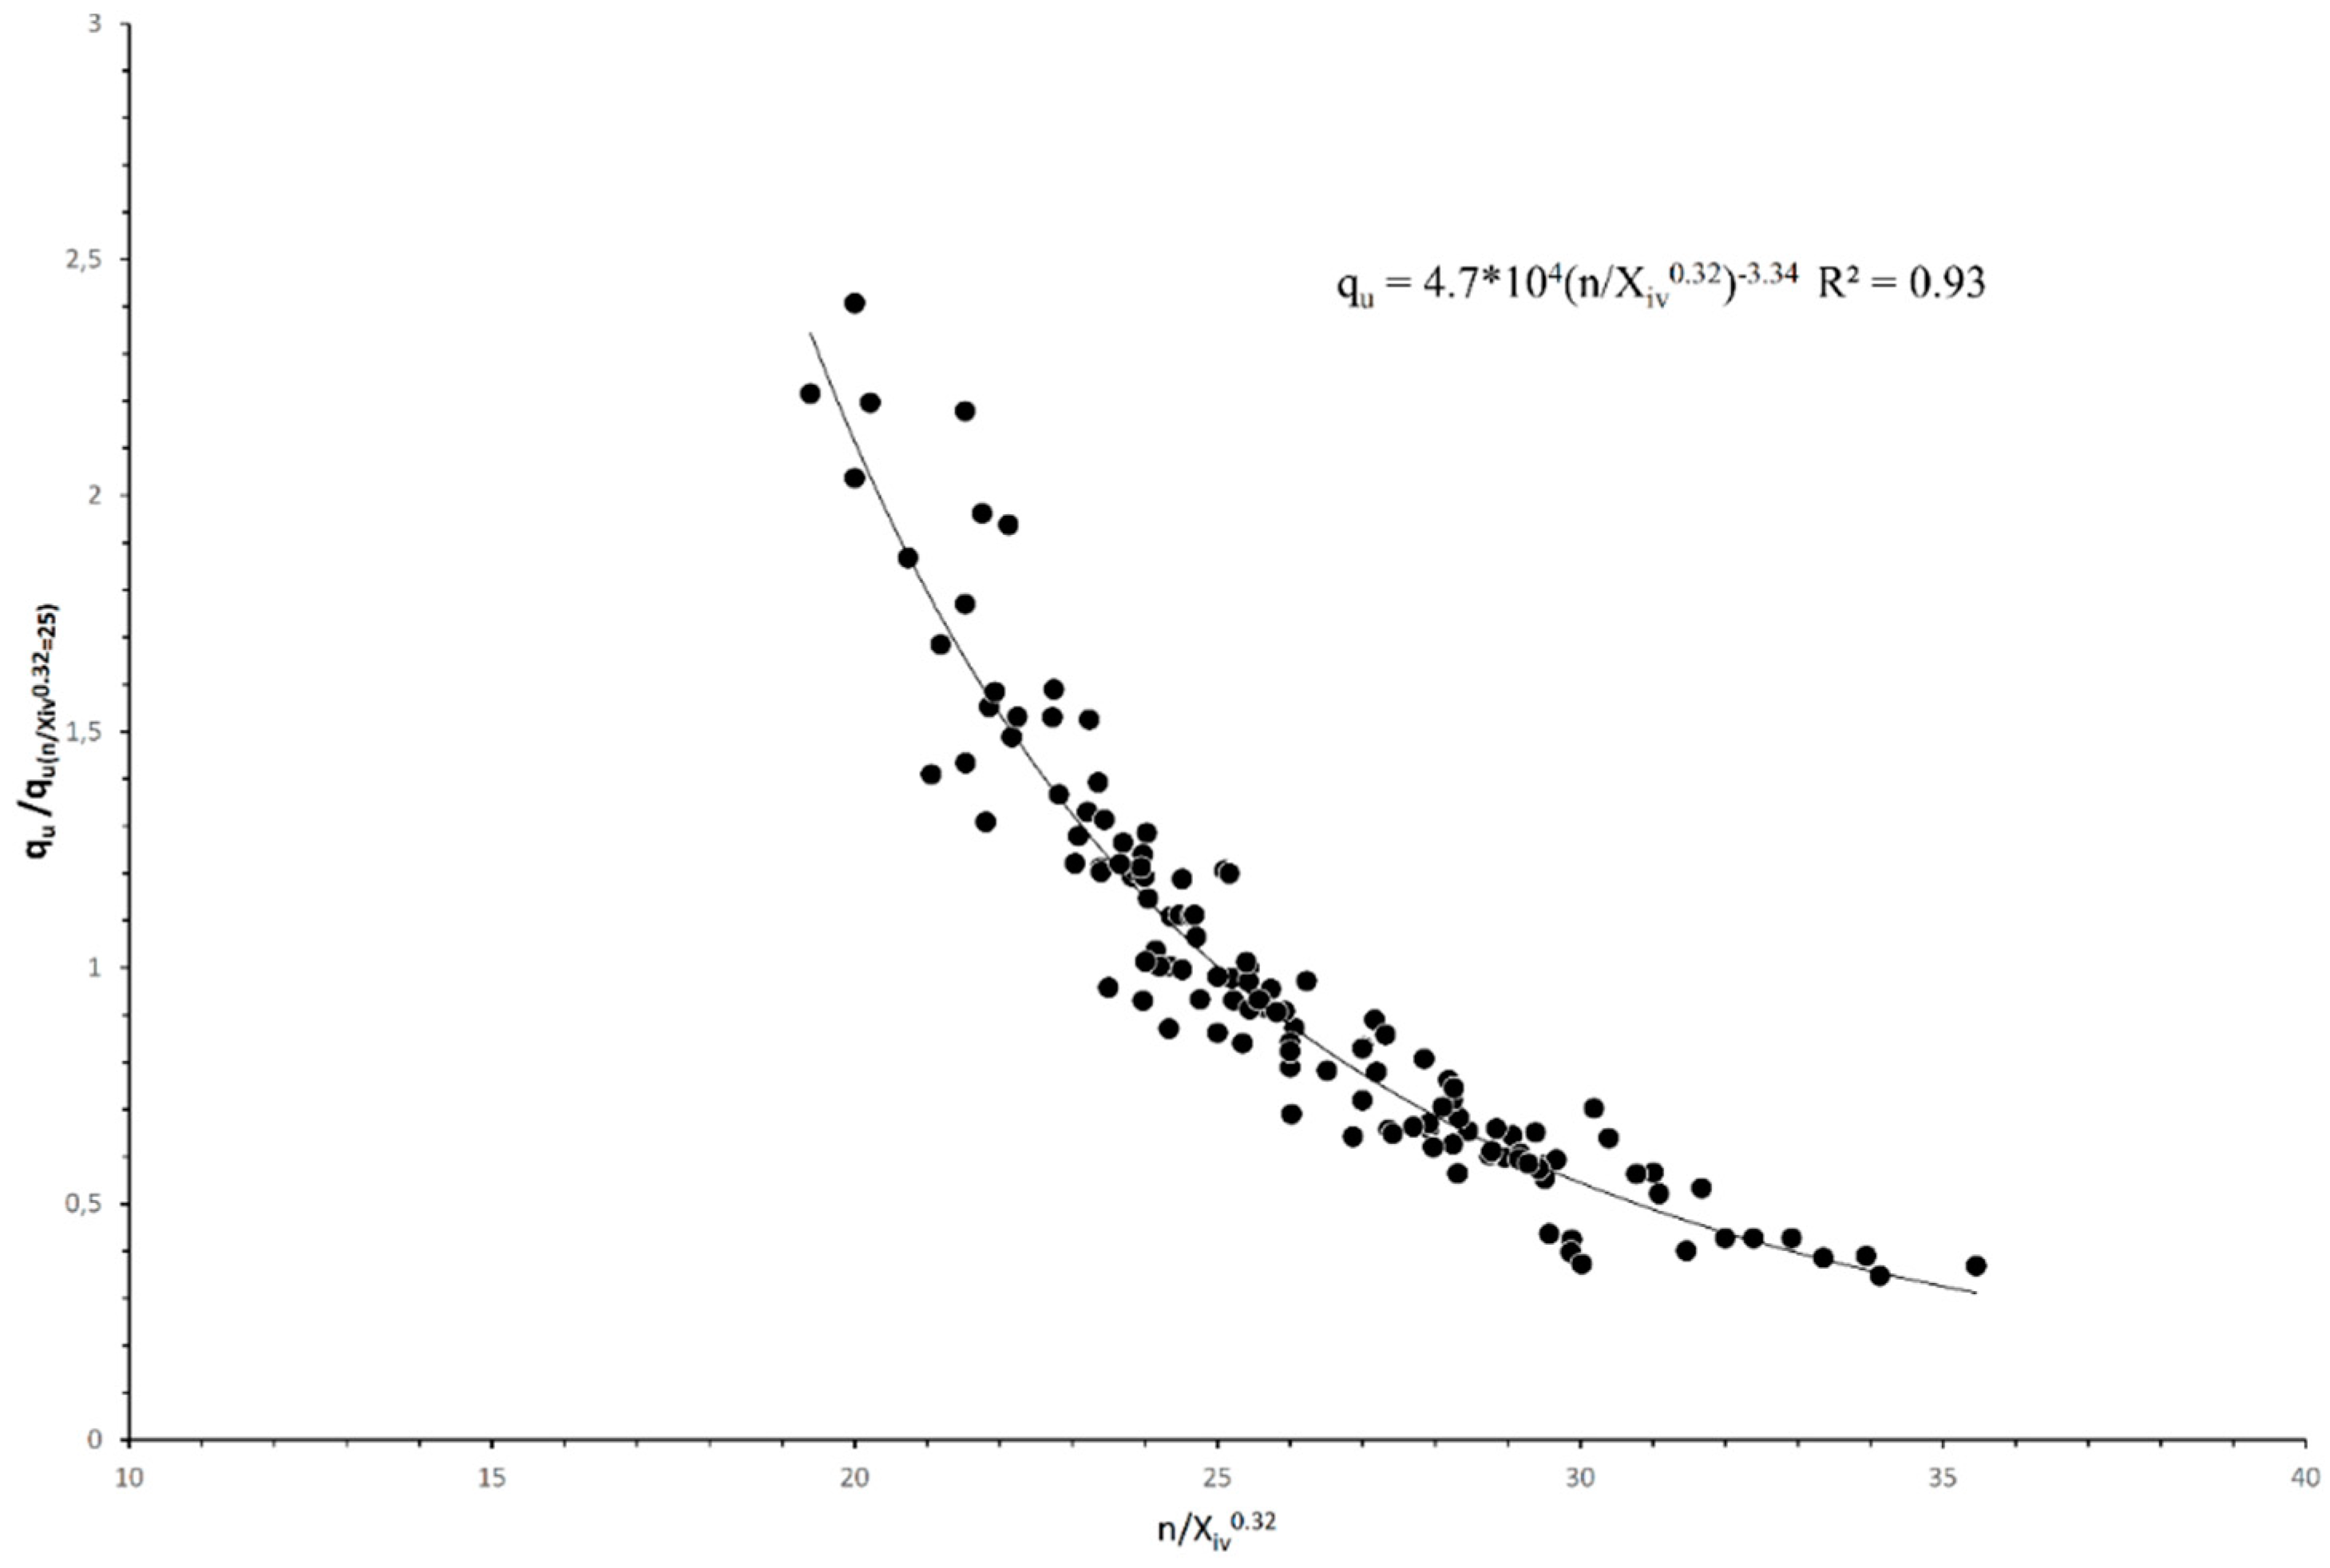
3.1. Influence of Porosity/Binder Index on Unconfined Compressive Strength

Figure 4A–C show the relationship between UCS and the adjusted porosity/binder index (η/Xiv0.32) of specimens prepared with 1400 and 1600 kg/m3 dry densities; 7%, 10%, and 13% cement content; and 7, 28, and 60 days of curing. Furthermore, Figure 4A,B, and c present 5% wood-ash, 10% wood-ash, and no wood-ash replacement, respectively.
A power relationship between qu and η/Xiv0.32 revealed good agreement for all blends. Previous empirical studies on various types of soils have shown that the exponent might vary slightly between 0.21 and 0.35. Therefore, in this study, 0.32 was chosen to be the best-fit exponent. Figure 4 shows that a unique correlation was developed for each blend.
Figure 4 and the available literature indicate that a reduction in compressive strength is due to an increase in porosity and reduction of blend content. Furthermore, in Figure 4A,B, where 10% and 5% of wood-ash were used, respectively, the 7 and 28 days of curing did not affect the qu at high porosity. On the other hand, curing for 60 days yielded an improvement. The contribution in all curing periods was more pronounced at low porosity.
The findings for the double binder of cement and both 5% and 10% wood-ash in Figure 4A,B show a reduction in porosity due to wood-ash replacement. In response to such replacement, compressive strengths at all curing periods increased. However, such behavior was not observed in Figure 4C, where no wood-ash enhancement was used.
Furthermore, aligning all the regression curves obtained from Figure 4A–C into Figure 4D revealed that the strength of the cement blend with 10% wood-ash at all curing periods was nearly the same as that with cement alone; however, it reduced the porosity, and 5% wood-ash incorporation accelerated the process of strength gain, yielding much more strength gain compared to cement alone at 60 days. The reason for this result is that the cement stabilized the coarse particles of portion with the hydration products from cement and wood-ash to stabilize the clay fraction present in the mix.
These features are also evident in Figure 5, where qu is plotted against η/Xiv0.32 for all the tested blends. It is clear that incorporating 10% of wood-ash as a replacement for cement reduces qu and increases η/Xiv0.32 compared to the reference samples. Therefore, to further encourage the rate of strength gain by activating the pozzolanic reactions, 5% of wood-ash replacement was found to be the most appropriate dosage, and the increase in qu was observed at all curing times. Wood-ash, as 10% of cement replacement, reduced the compressive strength of the specimens relative to 5% wood-ash+cement treated specimen for all curing times. Based on the SEM images that was further investigated, wood-ash replacement enhanced the microstructure, reducing the available pores that were filled with hydration products. Overall, 5% of wood-ash seems to optimize engineering properties. When compared with the porosity-strength value, an additional increase in the replacement value decreased performance compared to a 5% replacement level. Increasing the replacement level reproduces the amount of fine grains in the mixture, leading to an increase in the water demand. Thus, the weakening of the bonds increases the porosity and decreases the strength of the composites. Additionally, recent studies proved the usefulness of microstructural analysis of cement-based materials [9,58,59].
Consoli et al. [60], influenced by ba et al. [61], established a general model via normalizing their results by dividing the established power equations to a particular value of strength. Using such an approach helped the authors predict the mechanical performances of cement-treated granular soils. In the current study, 252 specimens with specific qu were chosen at η/Xiv0.32 = ∇ = 25 for all the tested blends, as all of them had ∇ = 25 (Table 3). As shown in Figure 6, Equations (4) (10% wood-ash), 5 (Cement only), and 6 (5% wood-ash) yielded high coefficients of determination (R2).
q u = q u   ( η / X iv 0.32 = 25 ) .2.6   ×   10 4 ( η / X iv 0.32 ) 3.16   R 2 = 0.91 ,
q u = q u   ( η / X iv 0.32 = 25 ) .2.4   ×   10 4 ( η / X iv 0.32 ) 3.15   R 2 = 0.96
q u = q u   ( η / X iv 0.32 = 25 ) .1.5   ×   10 5 ( η / X iv 0.32 ) 3.69   R 2 = 0.91 ,
Furthermore, Figure 7 combines the wood-ash-replaced and cement-only unconfined compressive results normalized with the adjusted porosity/binder index. It is revealed that, by using Equation (7), a higher coefficient of determination (R2 = 0.93) was obtained.
q u ,   = q u ( η / X iv 0.32 = 25 ) .4.7   ×   10 4 ( η / X iv 0.32 ) 3.34   R 2 = 0.93
Equation (7) provides an important contribution, as it enables the qu for specific blends of clays with 5% and 10% wood-ash and cement cured for specific periods to be obtained using only one test. If possible, this test should be performed using three identical specimens to obtain a representative value of the strength at the chosen value of η/Xiv0.32 = ∇. Based on the available literature and data, it is suggested to use ∇ values near 25. If possible, a named test should be performed using three identical specimens to obtain a representative value of the strength at the chosen value of η/Xiv0.32 = ∇. Based on the available literature and data, it is suggested to use ∇ values near 25.
To validate the applicability of Equation (7), the results of other authors on different soil types and blends were used in accordance with Equation (7) to predict the qu. Figure 8 shows the unconfined compression test results obtained by Consoli et al. [47] for cement-stabilized Portugal silty sand (Table 1) together with the line predicted using Equation (7). As suggested above and in the literature, η/Xiv0.32 = ∇ = 25 was chosen, and the corresponding qu was found to be 6300 KPa from the curve of Consoli et al. [47]. Substituting the value of qu with Xiv0.32 = 25 in Equation (7) and varying Xiv0.32, a curve was plotted together with the laboratory test data. Figure 8 demonstrates that the predicted curve represents the experimental data.
From the same paper by Consoli et al. [47], compression test results were obtained for London clay stabilized with cement. The data were taken from the specimens with Xiv0.32 = ∇ = 25 and qu (for ∇ = 25) = 1100 KPa. By substituting these values into Equation (7) and varying Xiv0.32, a curve was plotted together with the laboratory test data. Figure 8 shows the curve obtained using Equation (7) that represents the experimental data, and the fit of the plotted curve shows a high degree of similarity with the curve plotted by experimental results.
To summarize, creating a sample at 25% porosity Xiv content will enable any strength to be predicted. One can argue that to obtain the predicted curve, it is necessary to have the initial idea of the variation of Xiv0.32. However, 25 is the value found in the previous literature. The relationship developed in this study to predict the qu was confirmed to yield successful predictions under all investigated conditions for fine- and coarse-grained soils treated with up to three different binders and cured up to 60 days.

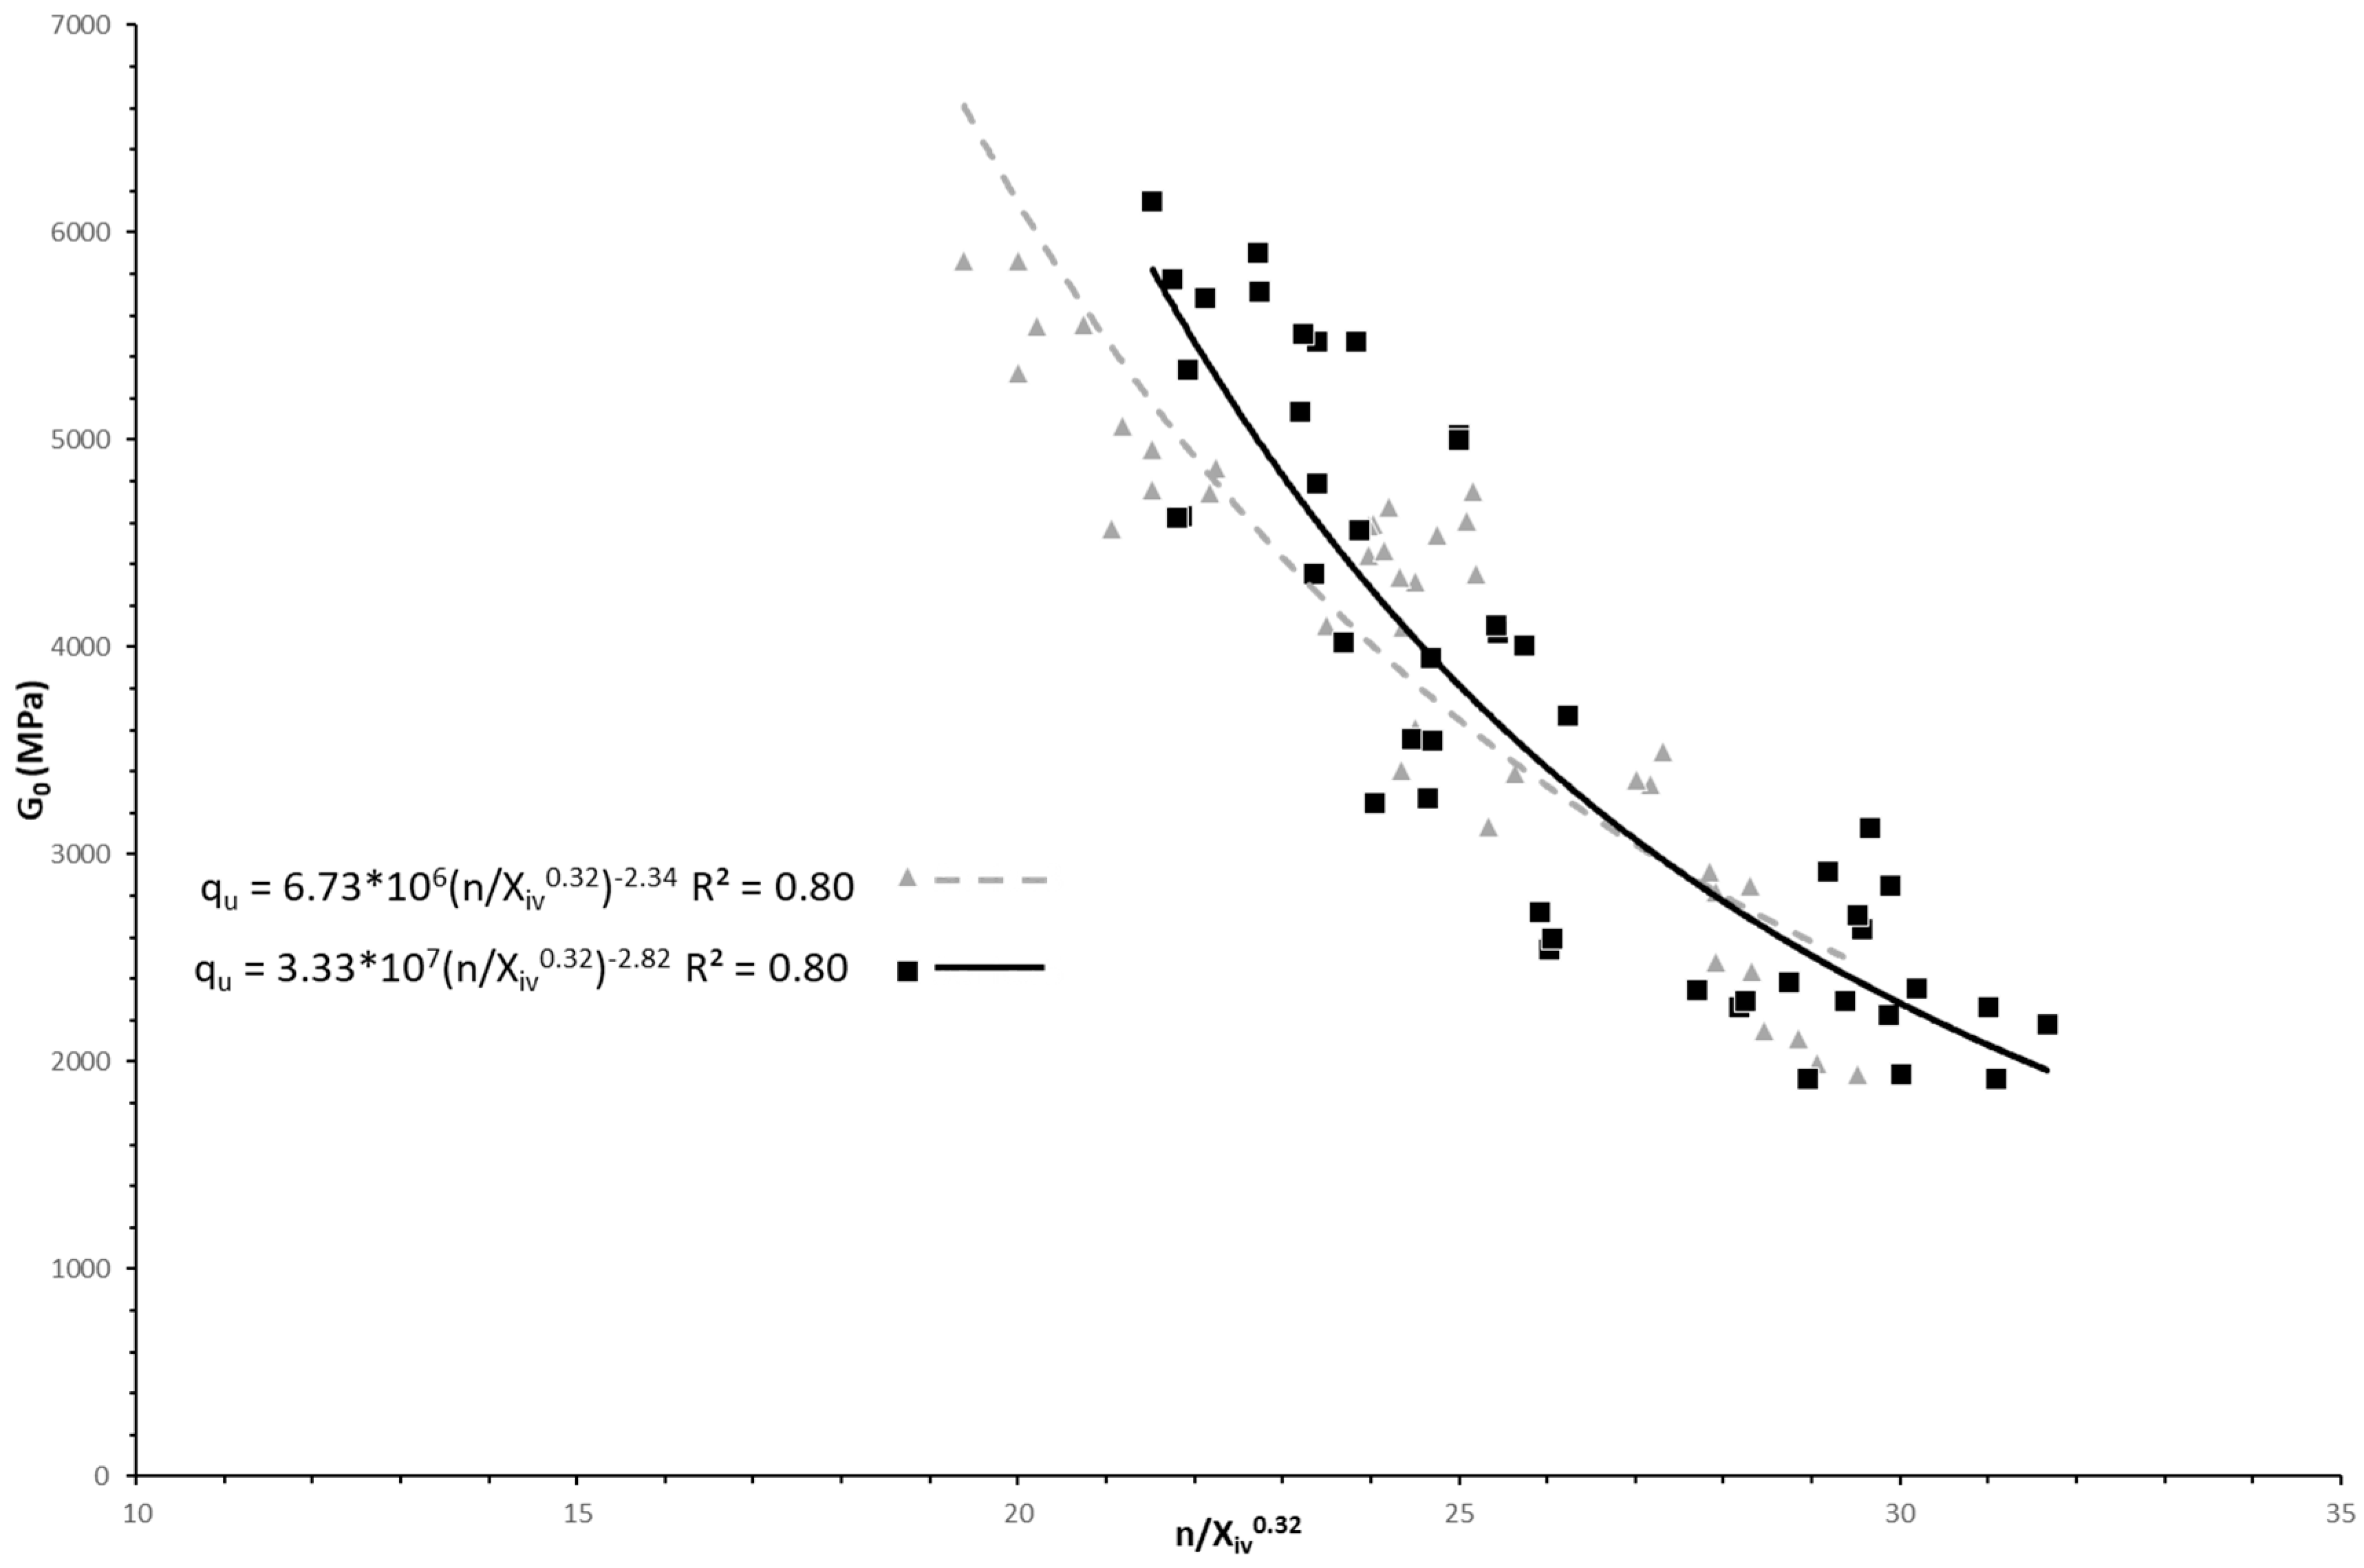
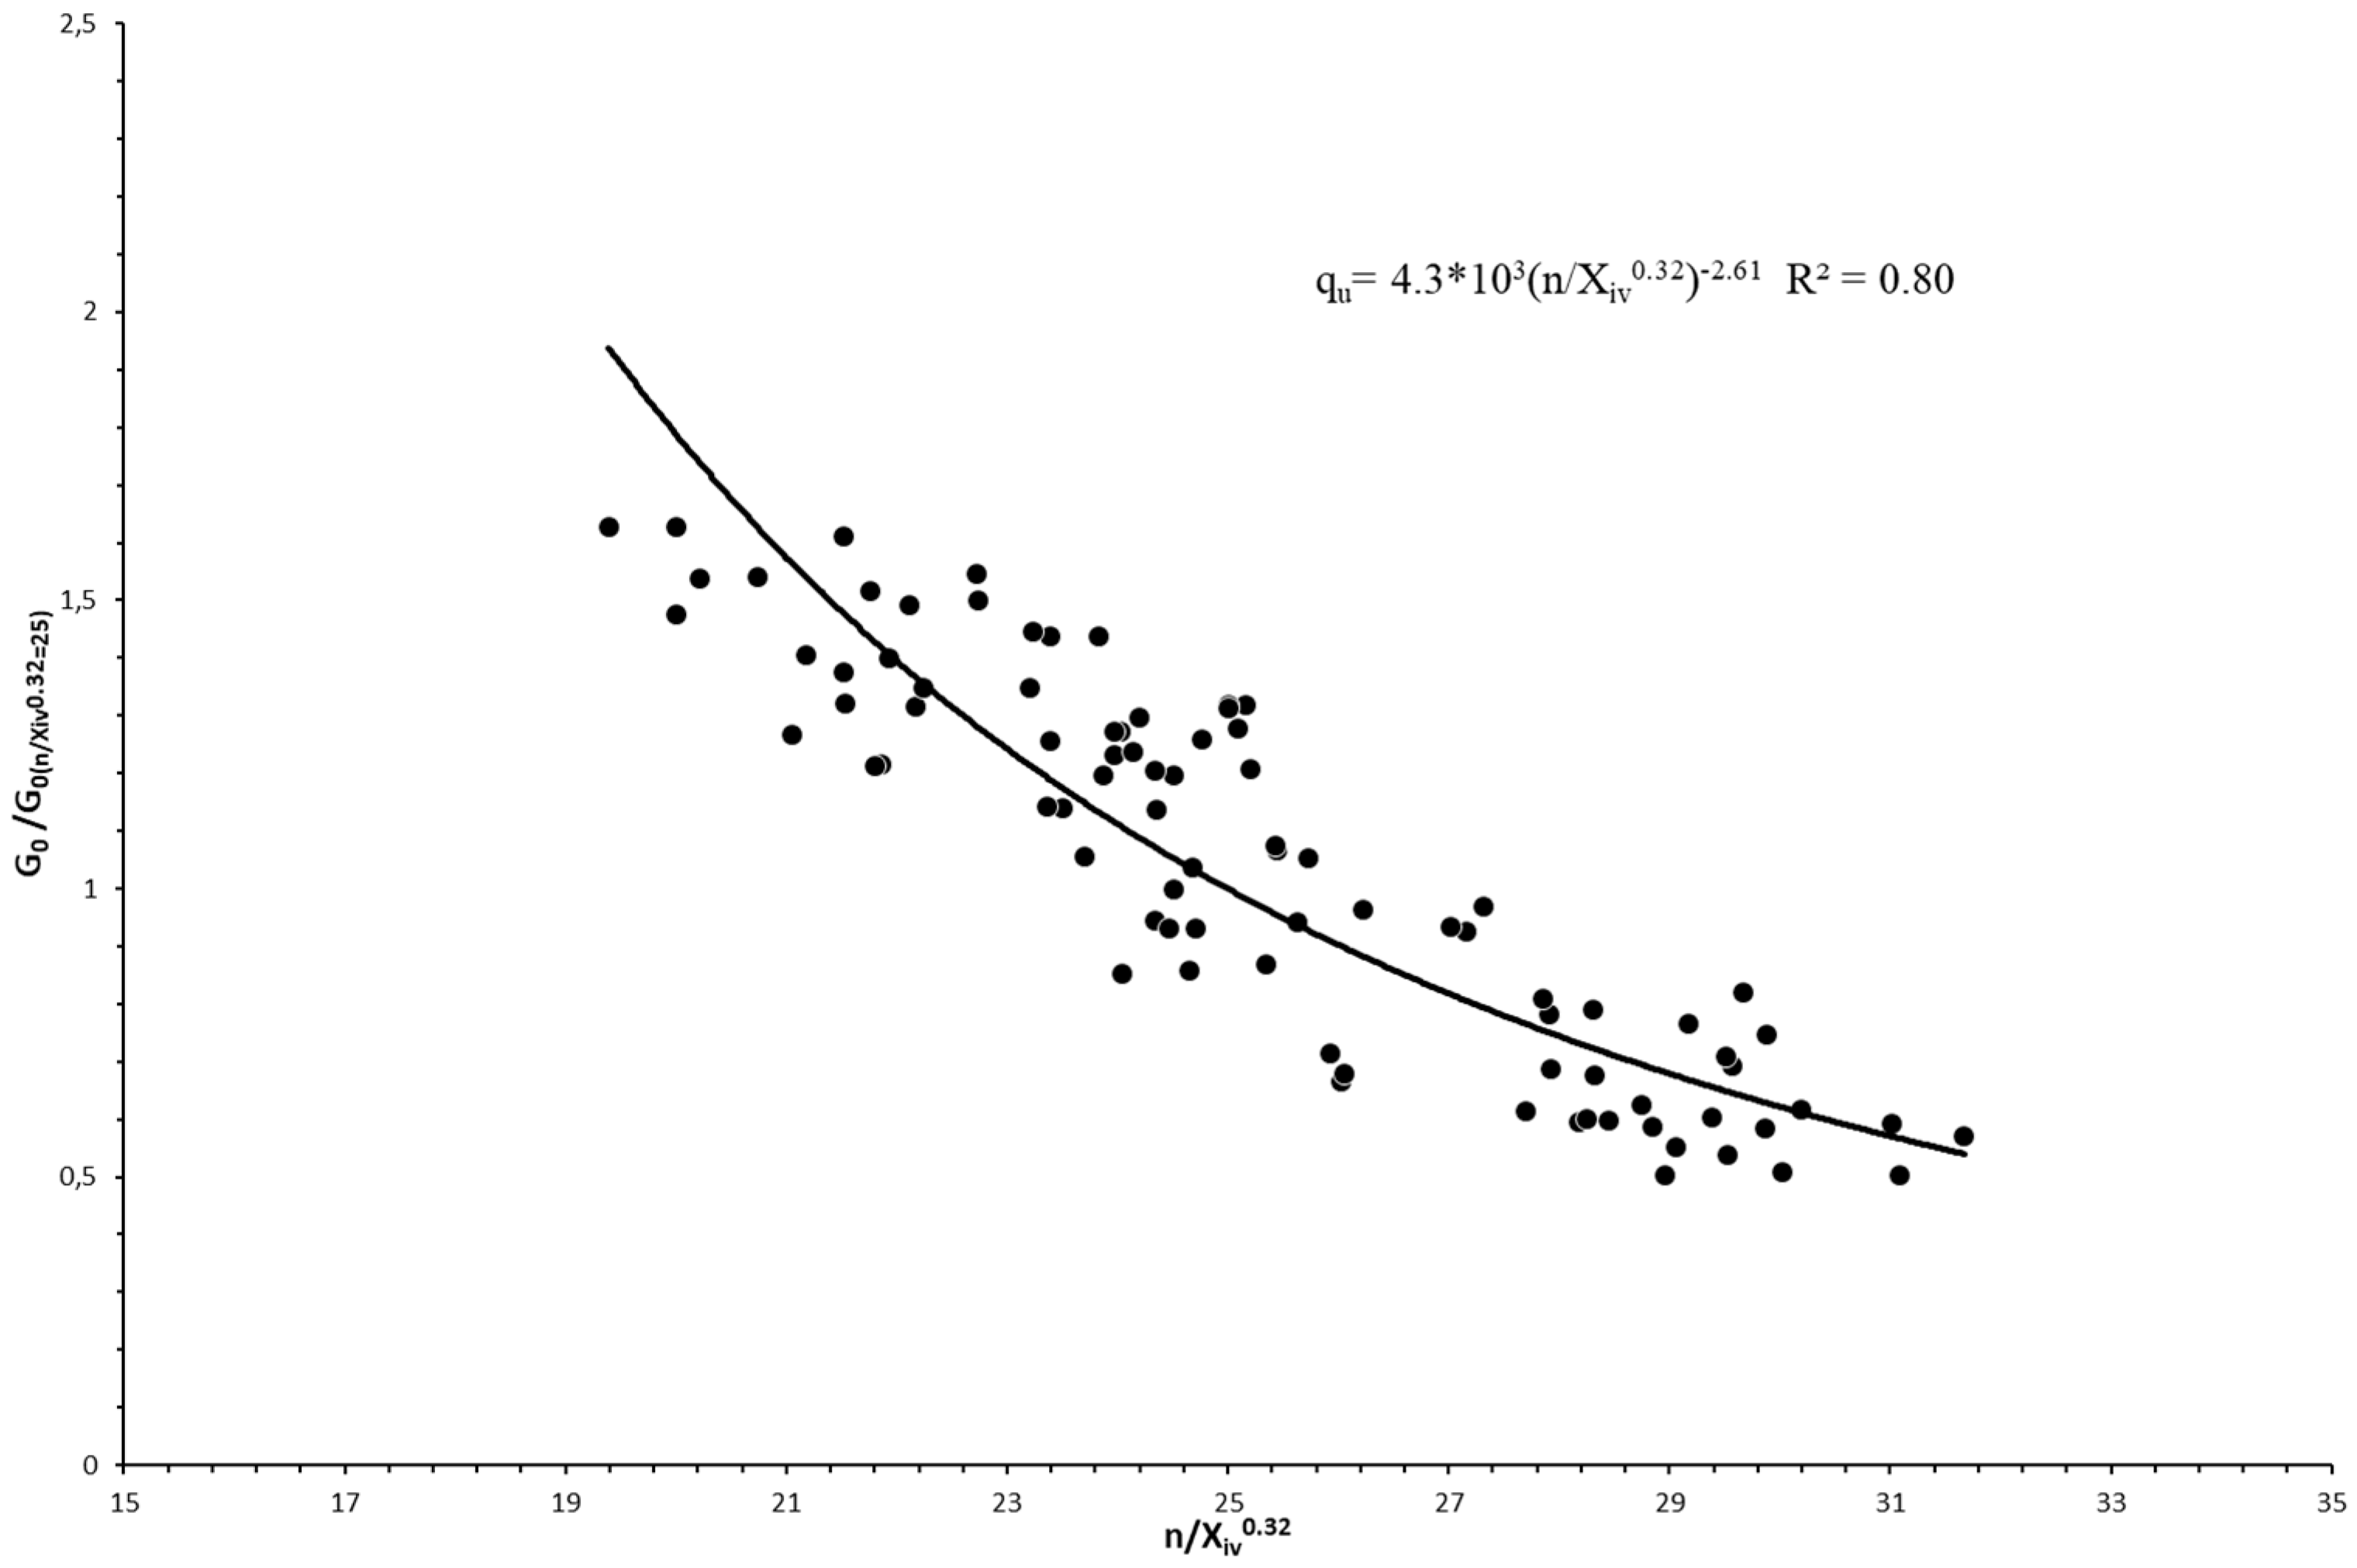
3.2. Effect of Porosity/Binder Index on Initial Shear Modulus

The curves plotted in Figure 9, G0 vs. Xiv0.32, and Figure 5, qu vs. Xiv0.32 of the wood-ash blends, are quite similar. Figure 9 shows a similar analysis for G0. The results show a good correlation between G0 and Xiv0.32 for 5% and 10% wood-ash mixes, where R2 is found to be 0.8 for both mixes tested at 7, 28, and 60 days of curing. In this study, wood-ash replacement improved the strength and stiffness of the clay matrix. Moreover, at high porosity, the effect of wood-ash was not monitored; however, as the porosity decreased due to an extended curing period, the 5% wood-ash replacement showed improved strength. Data were more scattered than the compressive strength, although the correlation was good. The filler effect of the wood-ash at 10% did not allow us to highlight the 5% wood-ash contribution due to the pozzolanic reaction. This was also due to a denser matrix with the 10% wood-ash replacement rather than the 5%.
A relationship of initial shear modulus as a function of porosity binder index for compacted wood-ash can be established. Like compressive strength analysis, the results can be normalized by dividing the established power equations by a specific value of stiffness. In this study, 106 specimens with specific initial shear modulus were chosen at Xiv0.32 = ∇ = 25 for all of the tested blends, as all of them had ∇ = 25 [G0(for ∇ = 25) = 3600 MPa (10% wood-ash), 3800 MPa (5% wood-ash)]. As shown in Figure 10, the form in Equation (8) yields good coefficients of determination (R2) of about 0.80.
G 0 ,   = G 0 ( η / X iv 0.32 = 25 ) .4.4   ×   10 3 ( η / X iv 0.32 ) 2.61   R 2 = 0.81 ,
Equation (8) provides an important contribution as it enables the initial shear modulus for blends of clays with 5% and 10% wood-ash and cement-only cured for specific periods to be obtained using only one test for the first time.

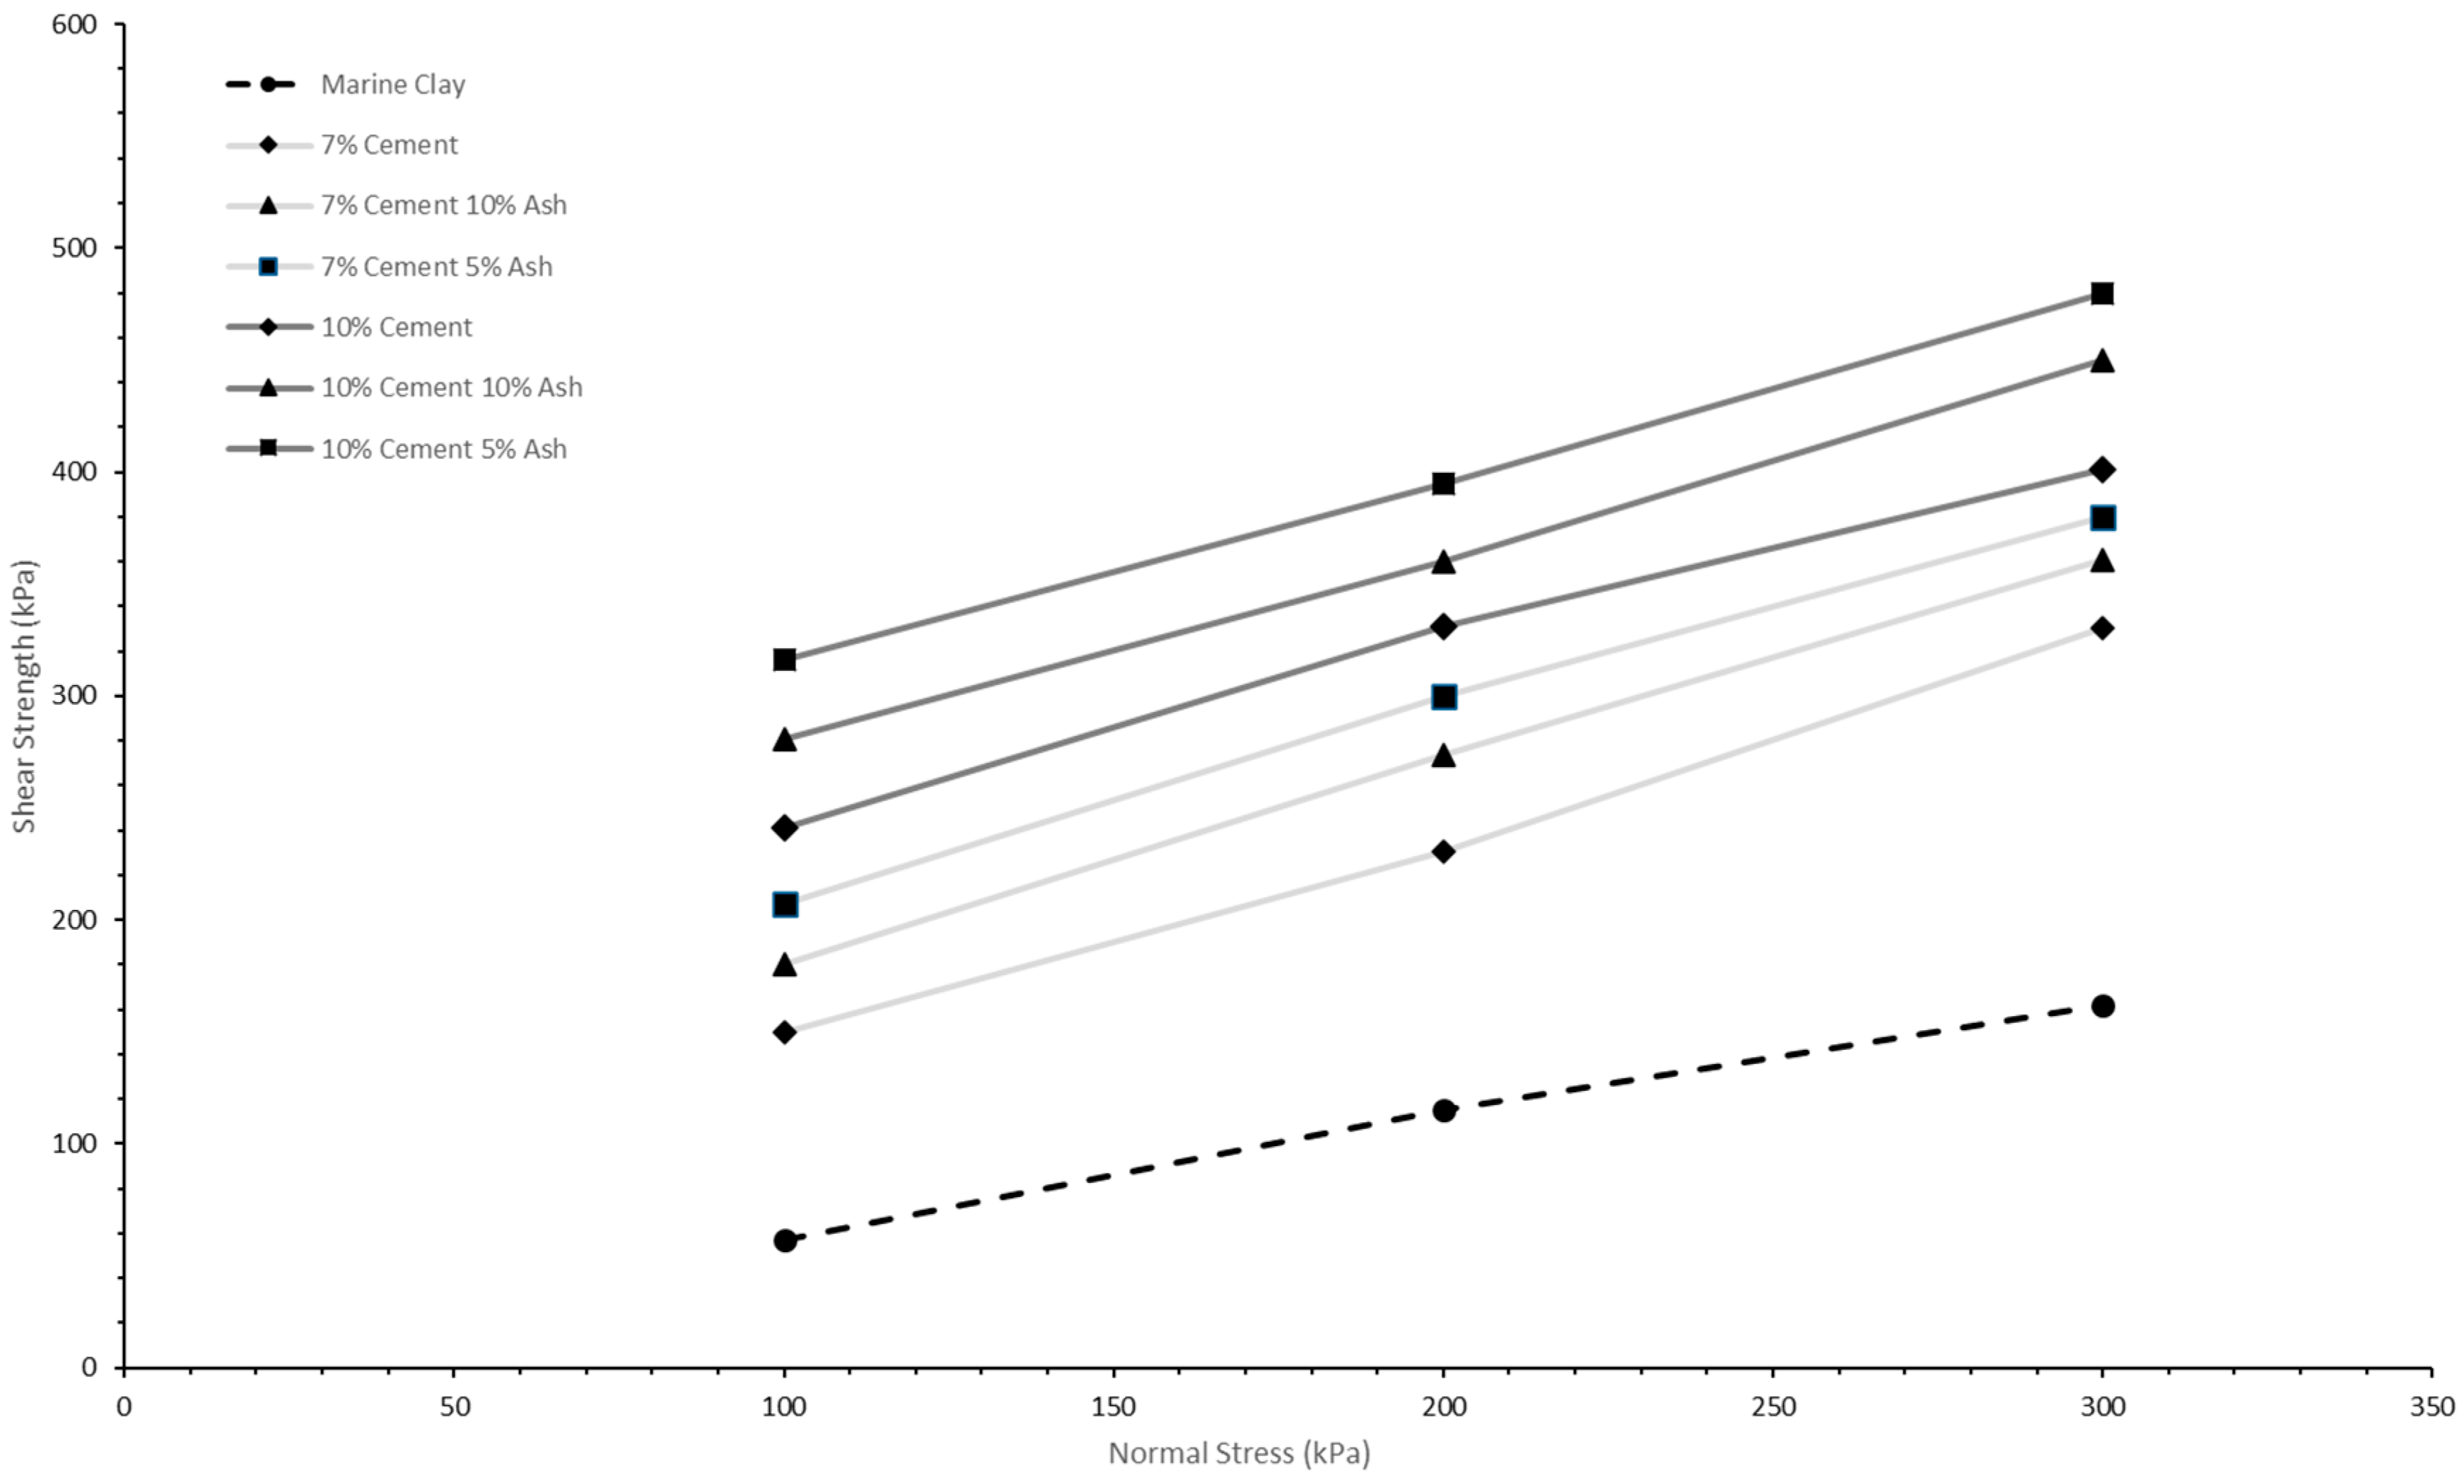
3.3. Shear Strength Parameters
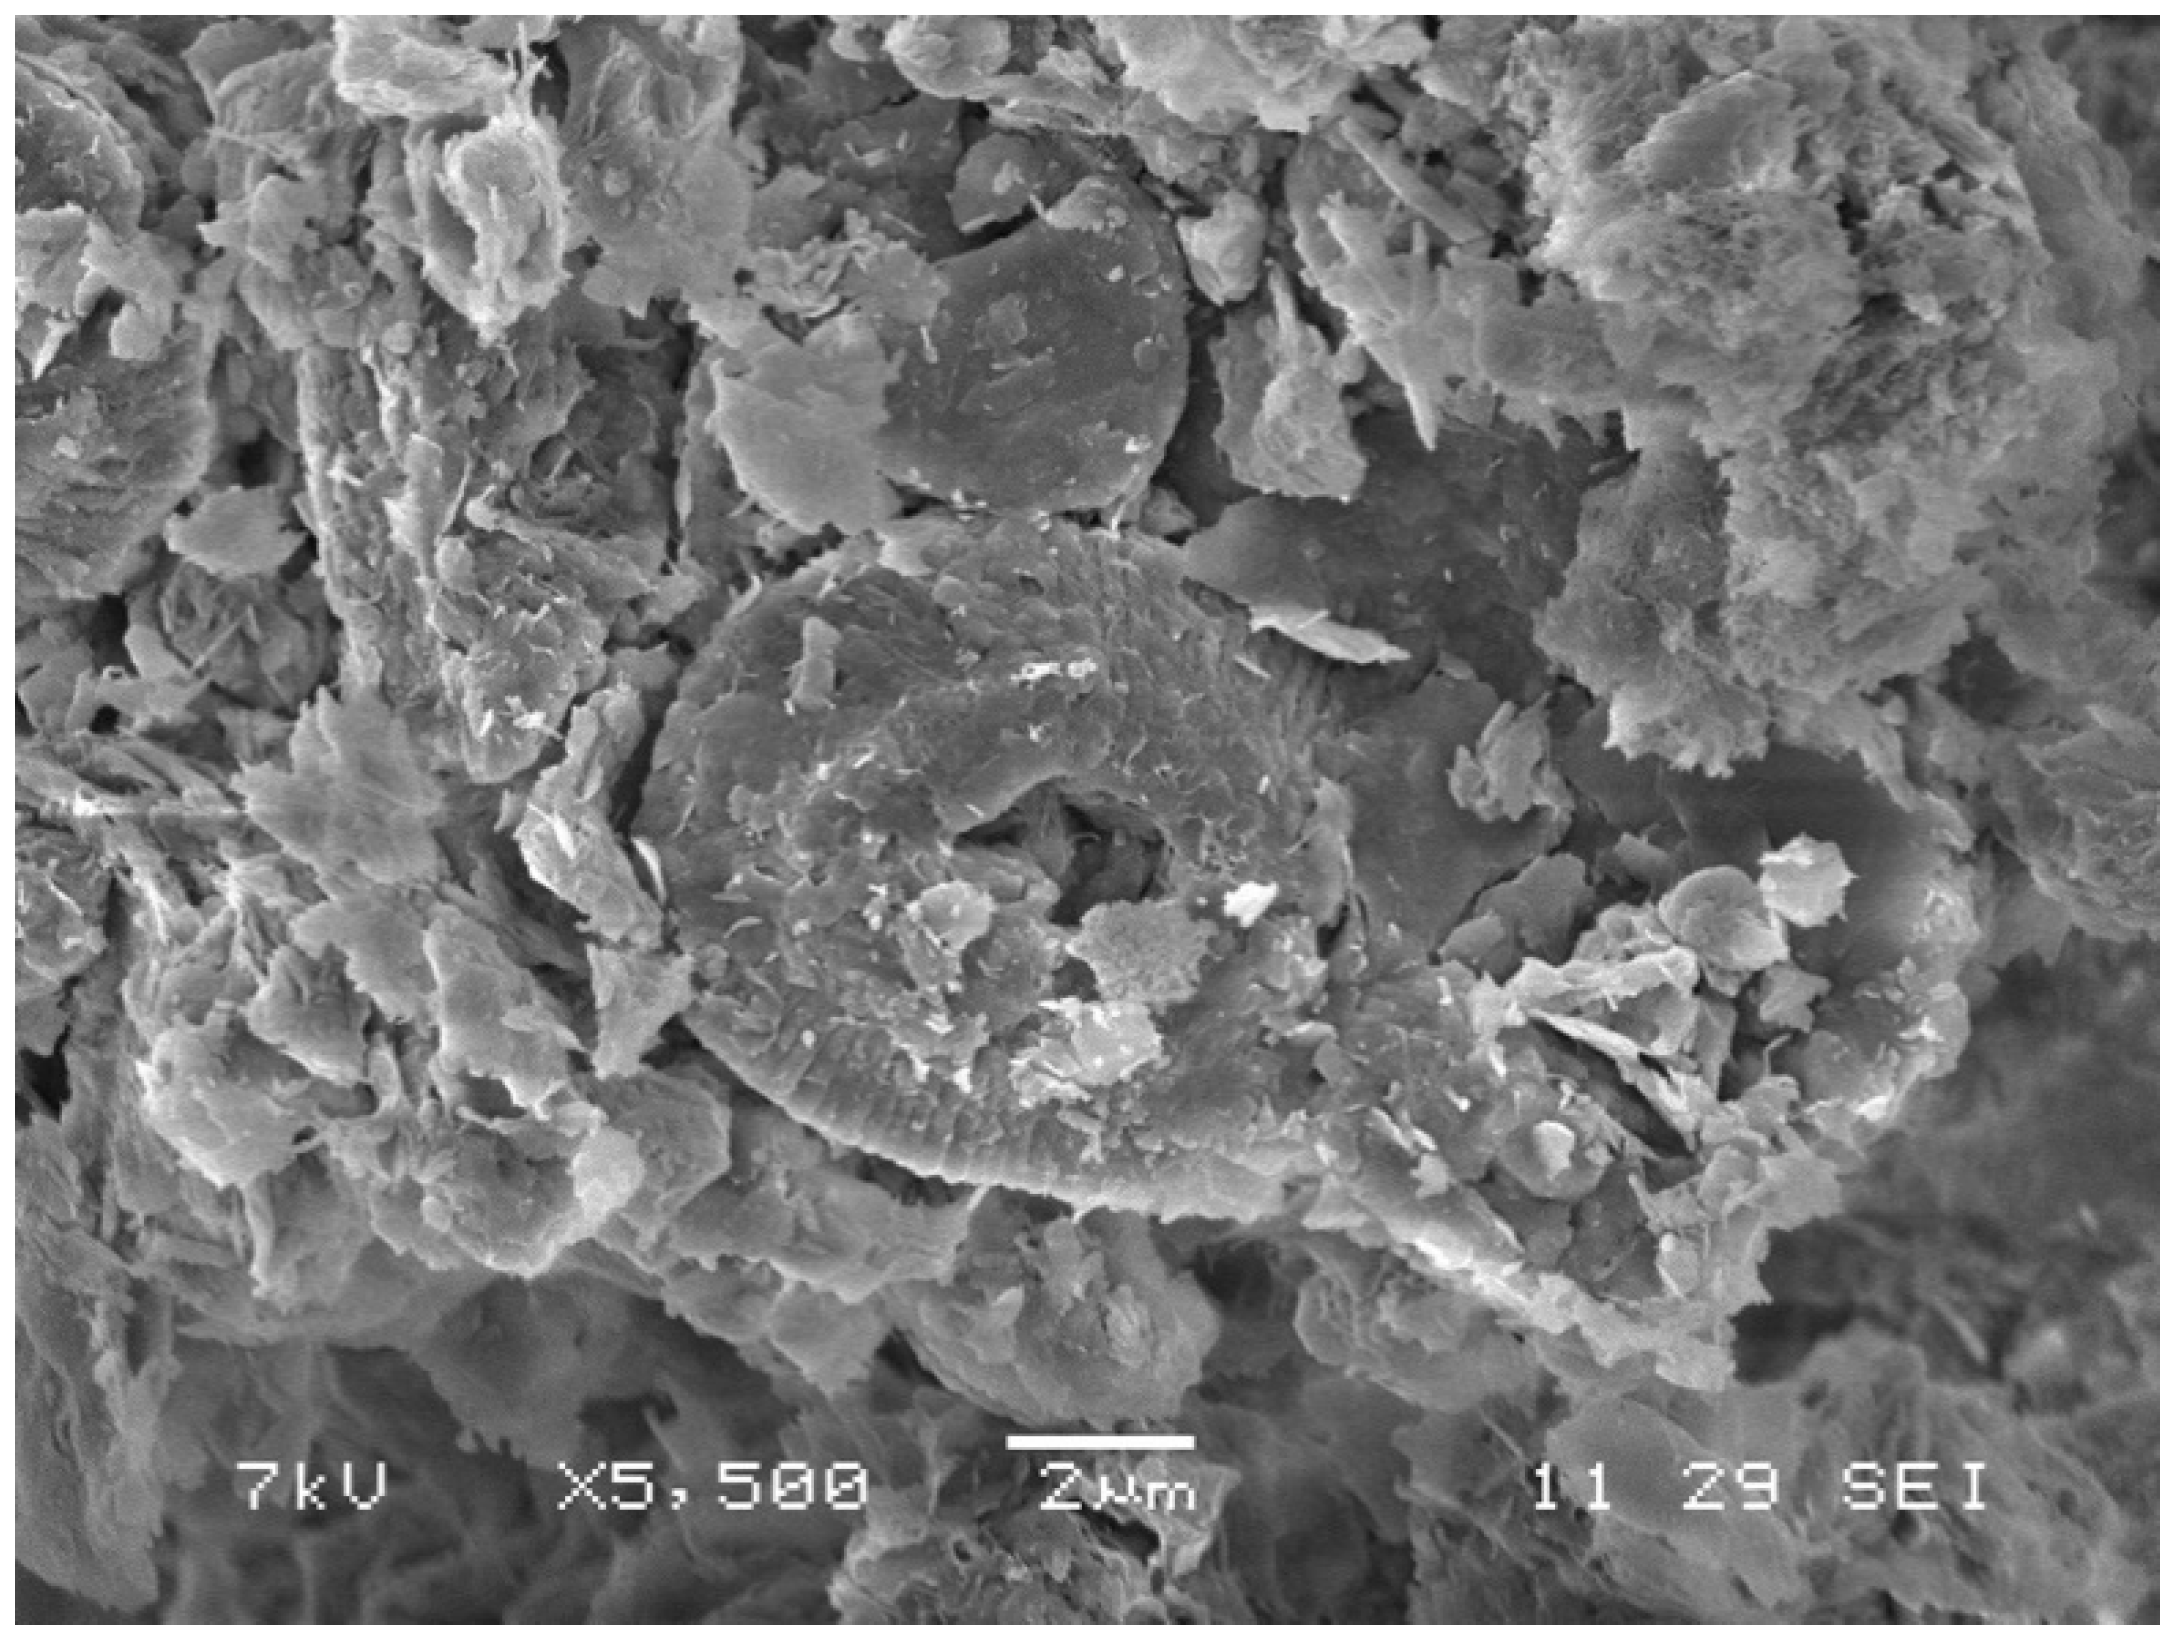
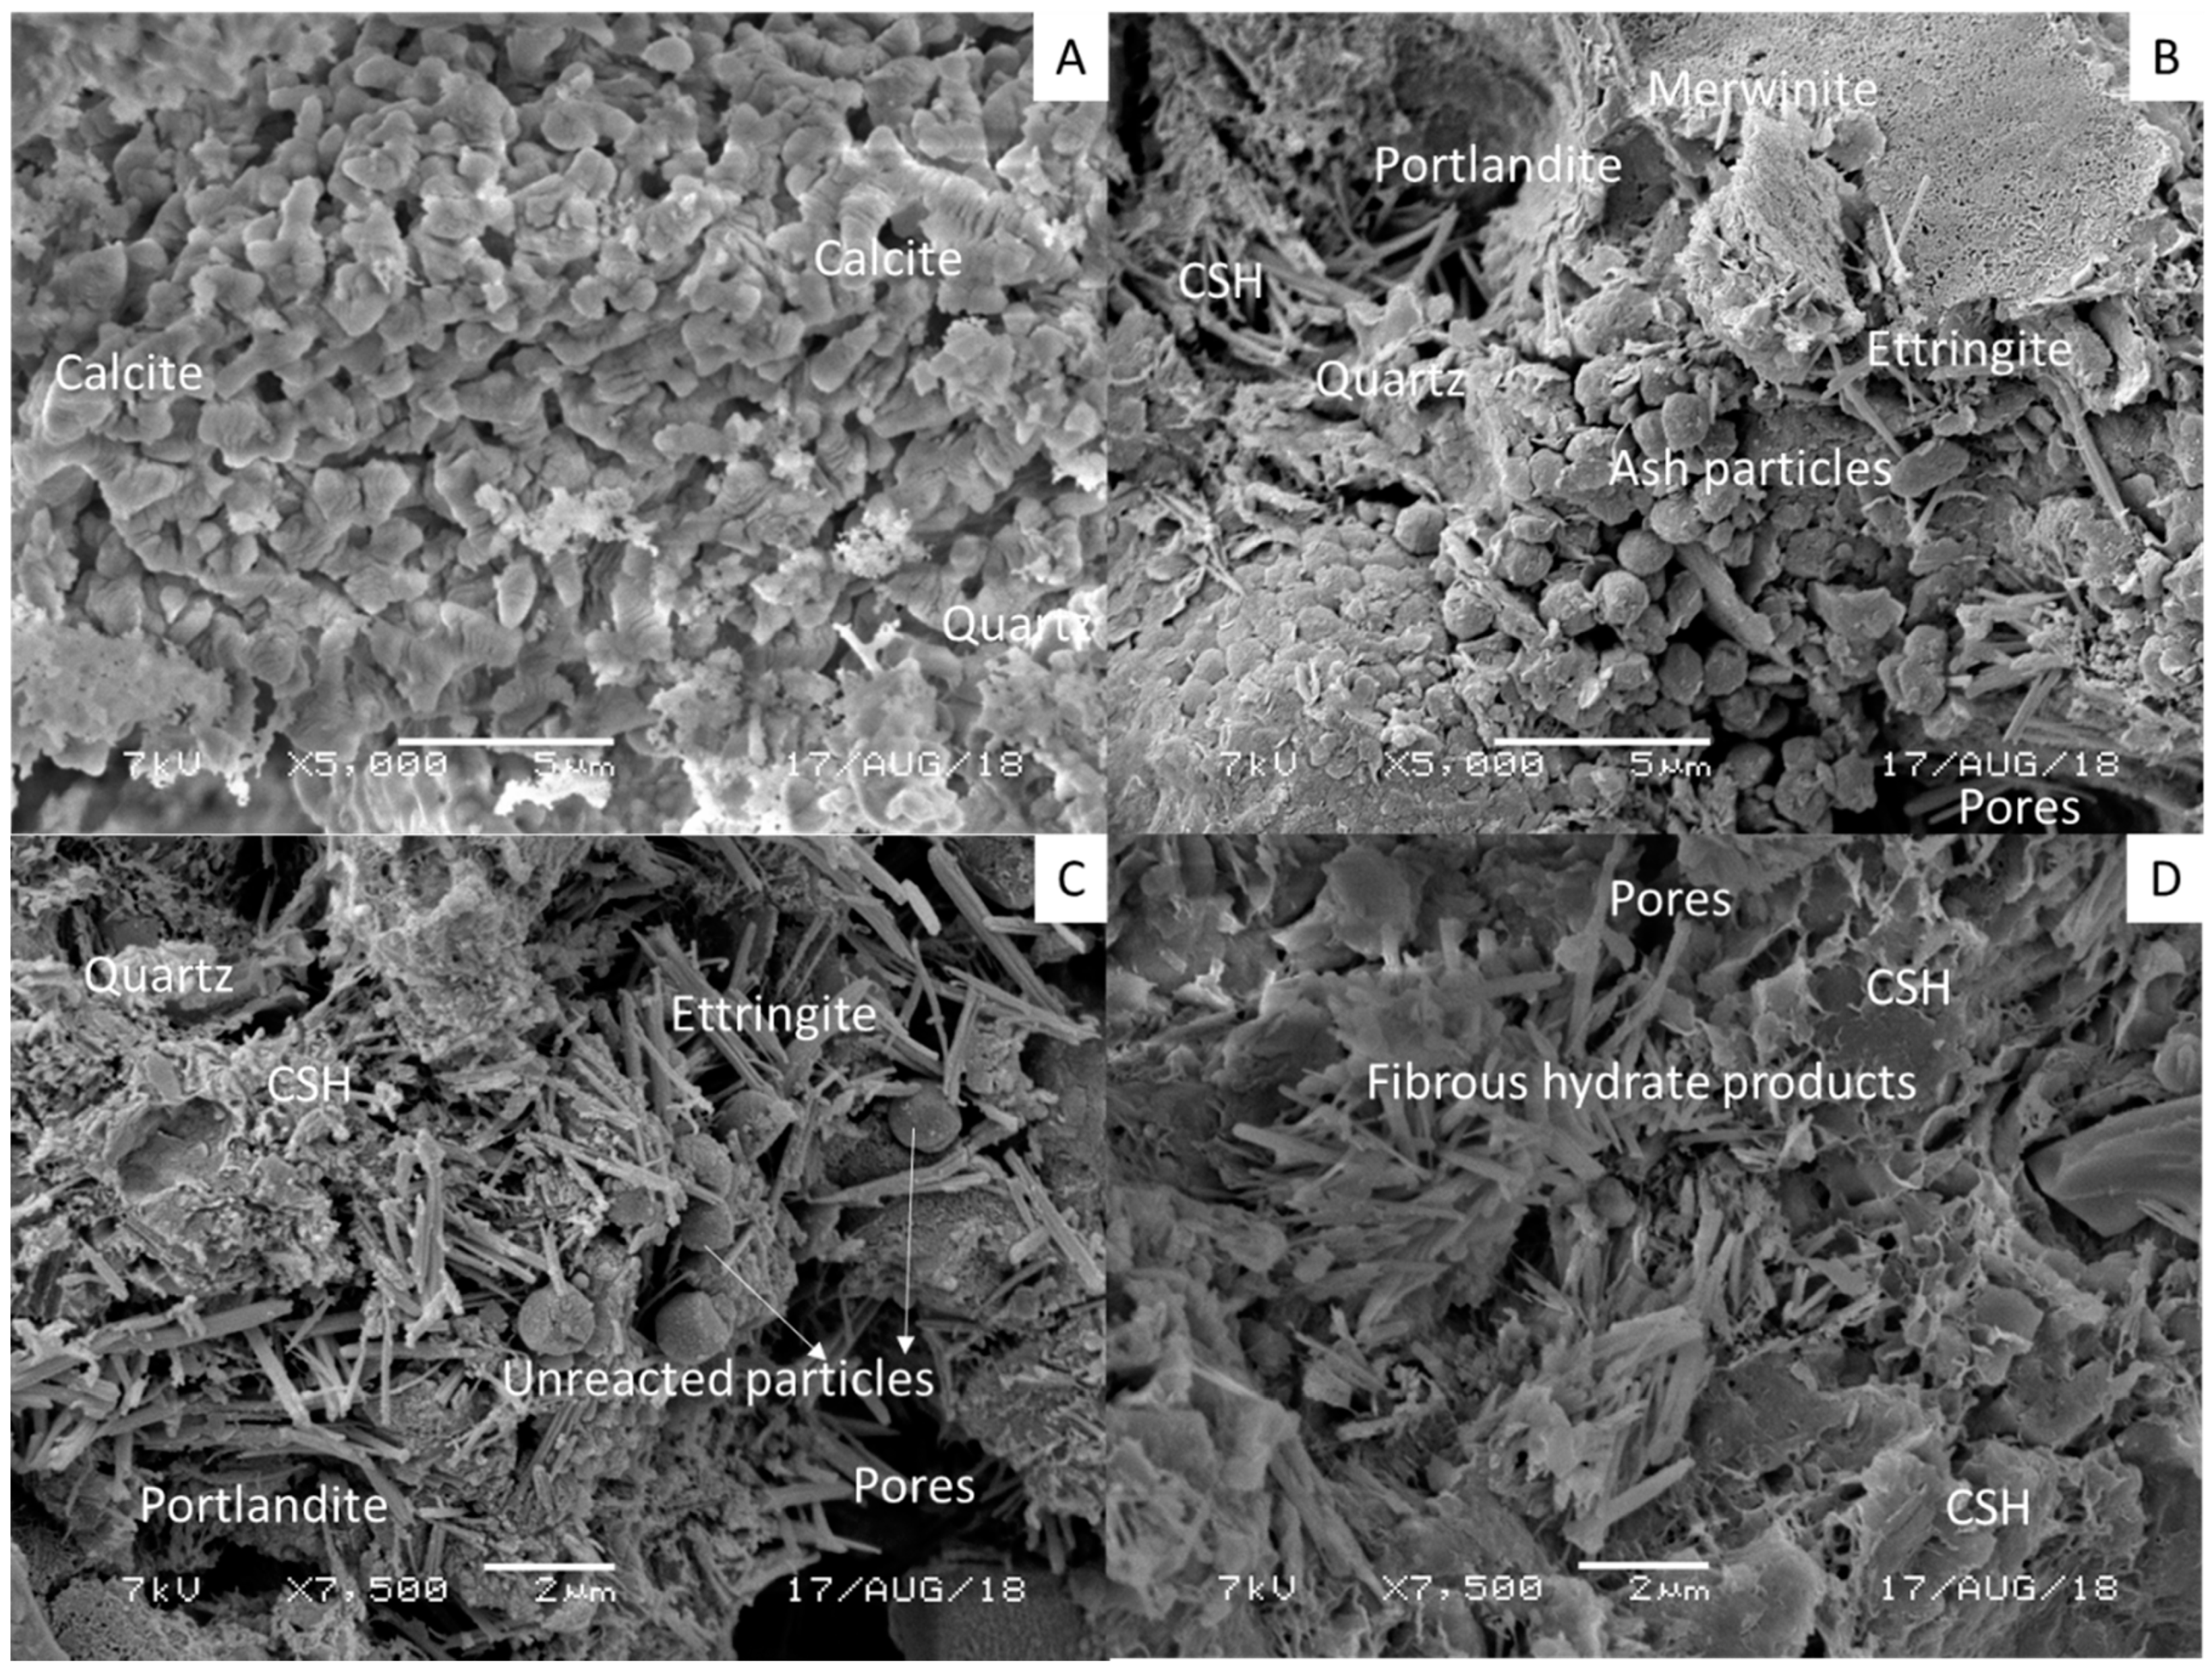
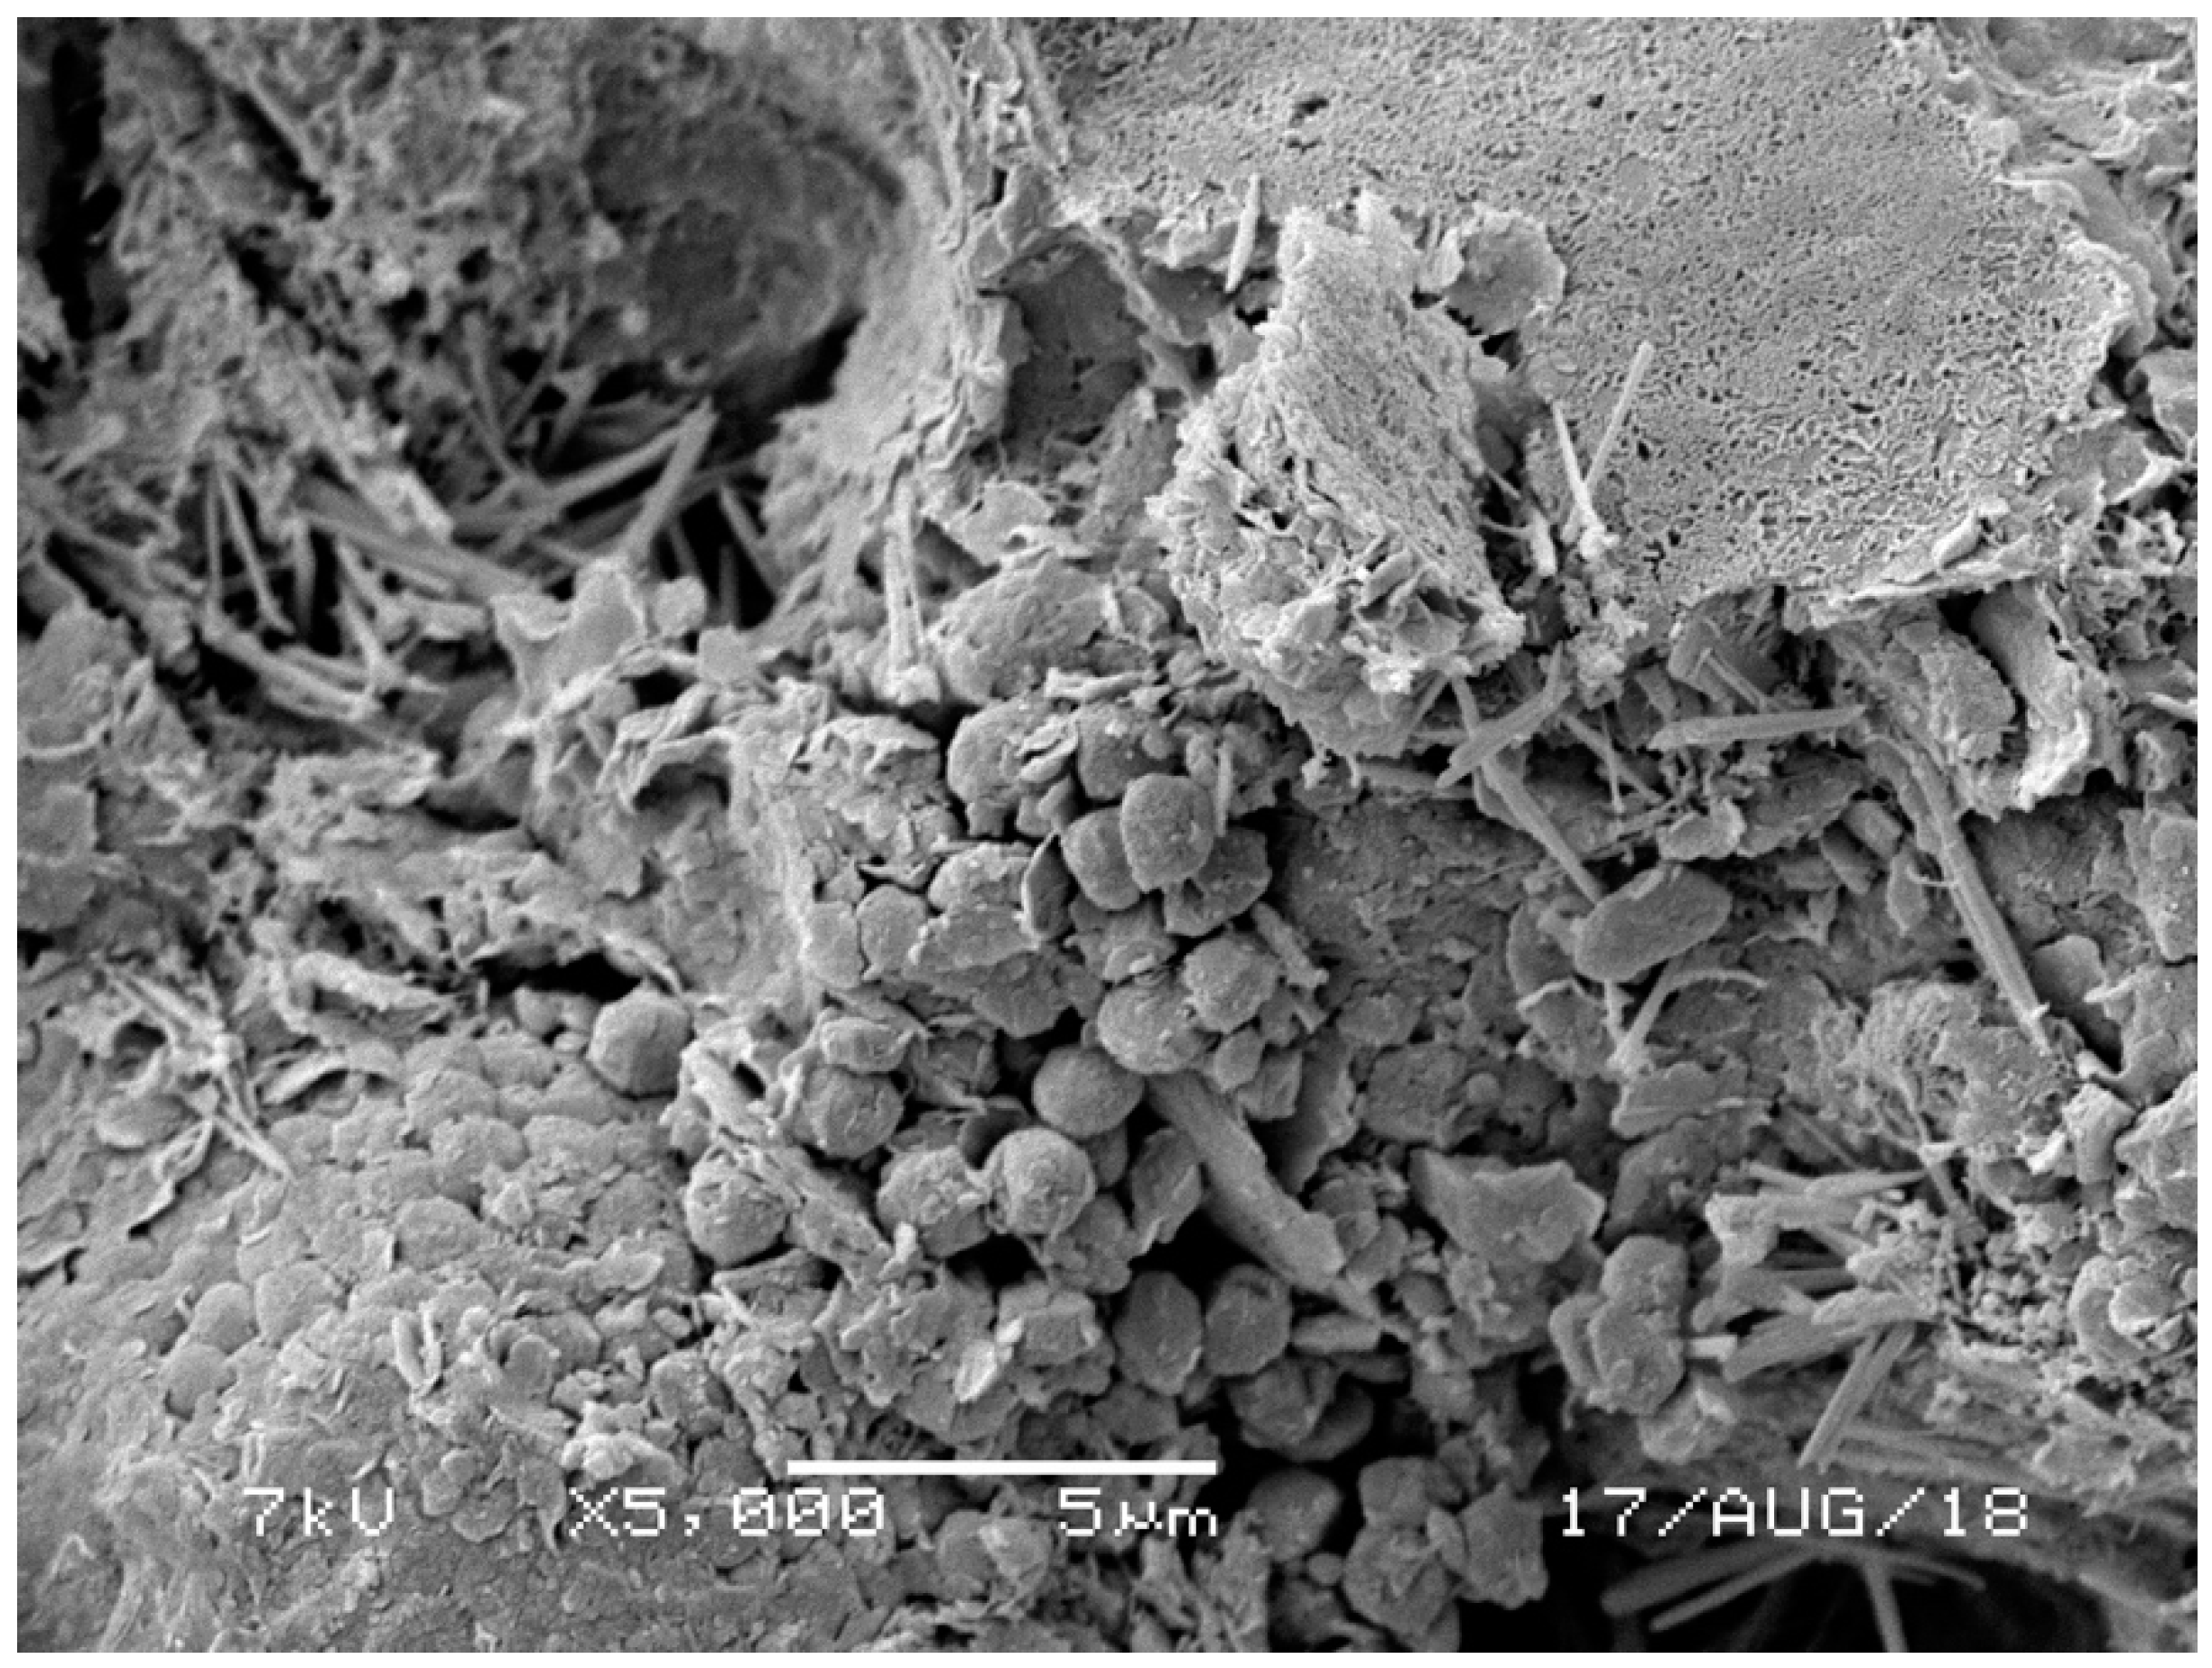
Typical shear strength and normal stress data with failure envelopes of marine clay, 5% wood-ash, and 10% wood-ash cement-replaced specimens with η/Xiv0.32 = 25 under effective normal stress of 100, 200, and 300 kPa with seven days as the curing period are shown in Figure 11. Table 4 shows that cohesion increased with the increase in cement content. Furthermore, the replacement of cement with 5% wood-ash resulted in a further increase in cohesion, where a further increase in wood-ash replacement to 10% resulted in reduced cohesion. An increase in cohesion at 5% wood-ash replacement indicates the introduction of bonding strength along with clay particles. Stabilizing the marine clay with cement alone resulted in an increased friction angle from 27 to 42, where a further increase of cement content to 10% resulted in a slight decrease in friction angle to 39–40. Wood-ash replacement did not seem to influence the friction angle of the specimens. Additionally, the brittleness index recommended by Bishop [62] was utilized to explore the softening response of blends with wood-ash inclusion at varying cement contents. The brittleness index is defined as:
I B ( % ) = τ peak τ post rupture τ peak × 100 ,
where τ post rupture is the shear stress obtained at the maximum horizontal displacement. The average brittleness index of 100, 200, and 300 KPa consolidated specimens for each tested blend is shown in Table 4, which also shows that an increase in cement content increased the average brittleness index. Further, wood-ash replacement was monitored to reduce the brittleness, with optimal reduction achieved at 5% wood-ash replacement. The results are similar to unconfined compressive strength and initial shear modulus.
Table 4 shows that clays alone have a negligible brittleness index. Cement-clay blends have a higher brittleness index value compared to clay-wood-ash groups. Increasing the amount of wood-ash causes an increase in the brittleness index. Additionally, cohesion value causes more stable matrix properties; hence, as it increases, the brittleness index decreases. Considering the number of clay–cement blends, as cement content increases, the brittleness index increases. However, 5% of wood-ash replacement has better matrix properties and more cohesion at lower brittleness index value. It seems that cement and clay alone do not provide enough bonds, and less calcium silicate hydrate gel is formed during their interaction (i.e., less dense structure). In this study, this reaction was offset by wood-ash.

3.4. Microstructure

Based on the XRF data in Table 2, XRD data in Figure 2, and EDX data (see supplementary file Figure S2), clay particles used in this study contained mainly calcite (CaCO3) and quartz (SiO2). Additionally, some minor constituents of dolomite and feldspar. The reflections shown suggest the presence of smectite, illite and chlorite-kaolinite within the phyllosilicates.
Figure 12 shows the SEM of pure wood-ash sample, and Figure 13 shows the SEM of marine deposited clay sample
More reactive particles were observed on the SEM image (Figure 14). The portlandite phase is believed to be effective in producing secondary CSH gel when mixed with clay. This depends strongly on the mineralogy and treatment of the clay. Clays generally only have sufficient pozzolanic reactivity for the use as SCMs once calcined, and 2:1 clay minerals (such as montmorillonite) are typically less reactive compared to kaolinite. As stated in Li et al. [63] study, it would have been beneficial to conduct a bound water or heat release test to measure the reactivity of the clay to understand the exact behavior of the composites. More gel formation due to secondary CSH reactions can help reduce the brittleness index and improve the strength of the composites. This is evident in Figure 13. Compared to clay particles, wood-ash particles are irregular in shape as seen in Figure 12 and Figure 13.
However, flaky and elongated particles need more water to become saturated and contain more voids. These voids can be considered as a water reservoir for later hydration process. The water in pores is being used by the chemical reactions to produce more gel, as seen in Figure 14B–D, to improve the strength and reduce the brittleness index. From the data presented in Figure 1, the d50 of the wood-ash is higher than that of the clay (and also the cement), so its addition would reduce the overall available surface area. Additionally, agglomerates of wood-ash particles with no interparticle bonding effectively act as large pores in the microstructure. These large pores might be acting as water reservoirs for later curing ages. Thus, lesser availability of cement decreases the strength and hence increases the brittleness of the matrix.
The bright structures (light gray, Figure 14A) indicate a glassy surface. These products have little pozzolanic due to their inert character. However, the elongated irregular shaped particles formed mainly from calcium, quartz, portlandite, and a small amount of merwinite indicated crystalline phase (See Figure 14). The angular, flaky, and elongated particles with sharp edges can be seen in Figure 12 and Figure 14A. This heterogeneity in the mixture increases porosity, followed by a decrease in strength. Naik et al. [23] and Siddique et al. [9] reported the same key findings for wood-ash. The availability of a large amount of calcium led to the formation of more CSH gel [63]. Li et al. [63] showed that each blend by the newly proposed method called “R3 technique” can be easily quantified. This method can help for better understanding the reactivity mechanisms.
Additional reaction with clay resulted in the denser matrix, as shown in Figure 14B–D. Needle-like structure, laminar phases, and angular flakes containing the porous region were also observed, as shown in Figure 14B–D. Figure 14C displays the unreacted carbon particles. These particles were loosely bonded and contained more water.
Additionally, hexagonally shaped calcium hydroxide plates were observed, as seen in Figure 14B. Some fibrous phases were also observed, as shown in Figure 14C. Adding clay into the system increased the rate of reactions. The particles connected better with each other, and pores filled up with hydrated products or transformed into a stable CSH gel. However, some pores and unreacted particles still appeared in SEM image 14b and 14c. The unreacted particles decreased at later ages, as seen in Figure 14D. This can be attributed to the amount of water remaining in pores during mixing operation, leading to the additional water reservoir for reactions. This water can then be used to continue chemical reactions.
The wood-ash used in this study was obtained from the local houses. Generally, there are unburned residues in wood ash since the heat produced at fireplace at home are not sufficiently high. This is consistent with the high number of unreacted particles observed in SEM and high (loss on ignition) LOI in chemical analysis of wood-ash. LOI value was very high compared to the recommended levels in cement (higher than 6%). This makes the wood-ash not suitable for load-bearing applications. However, for controlled low strength or moderate strength applications, it can be used. Most of the research conducted on wood-ash was collected from the biomass operation where heat reached more than 500 °C.
Based on the EDX data shown in supplementary file (See Figure S3), the wood-ash sample contained mainly CaO and SiO2; therefore, both crystalline and amorphous structures were available. This is consistent with the SEM analysis of the pure wood-ash sample in Figure 12. The availability of the amorphous phase indicated pozzolanic. However, the crystalline phase indicated the availability of inert particles. Accordingly, the hydration was slower, and it needed more curing for pores to be filled with hydration products. In Figure 15, the SEM image of clay-cement-ash sample is shown. Especially, the SEM images (Figure 14 and Figure 15) clearly shows this situation. Additionally, a high amount of CaO in wood-ash helped form strong bonds when interacting with clay and cement, as shown in Figure 15.
The number of pores decreased, and the unreacted particles transferred to a stable denser gel structure. CSH gel and some calcium aluminate hydrate flakes formed as seen in Figure 14B–D and Figure 15. However, incorporating wood-ash increased the alkalinity of the system, destabilizing the expansive aluminate gel. An increase in the consumption of the portlandite and refinement of pores by lowering the aluminate phase improved the composite’s microstructure, as observed in Figure 14C and d and the cement-clay–wood-ash interaction in Figure 15. Similar findings were reported by Mehta and Monteiro [64] and Siddique et al. [9].
It is believed that beyond the 60 days of curing, the performance of the composites will further improve. Many researchers [10,28,33] have reported similar findings.

4. Conclusions

From the results presented in this study, the following conclusions can be drawn:
  • The mechanical response of the wood-ash blend is most beneficial at 5% wood-ash replacement. The 5% of wood-ash replacement seems to be the optimum replacement percentage to improve matrix properties.
  • By testing one sample, the UCS and initial stiffness can be predicted for all other wood-ash content and cement content at any curing time and density.
  • The proposed adjusted porosity/binder index formula can predict the strength and initial stiffness of other binder products, which was also confirmed in other studies.
  • The replacement of cement with 5% wood-ash improves cohesion, and above this replacement level to 10% results in a reduction of cohesion.
  • The long-term effective cohesion and friction angle parameters are aligned with the results of the unconfined compressive strength and initial stiffness. However, more tests should be carried out to develop a correlation of those shear parameters with the binder index.
  • Based on the microscopic investigation, marine clay makes an excellent contribution to gel formation. Heterogeneity of the interstitial transition zone improves with the incorporation of the wood-ash into a system. The high LOI value of wood-ash diminishes the negativity at later ages, acting as a water reservoir to enhance the hydration process to produce better-densified matrix properties. The porosity slightly reduces with the help of cement–clay–wood-ash interaction. The duration of laminar phases, which were observed in SEM images, decrease after 28 days; further, particles are interconnected with a strong bond. The authors believe that this beneficial effect would be more visible after 60 days and recommend the microscopic investigation beyond 60 days, especially for clay blends.
  • Reusing unsuitable soil and hazardous wastes will reduce environmental and financial impacts. Improving soil with additives will facilitate the use of the available soil on site. In addition to the environmental contribution of cement usage reduction, using waste material, such as WA, will enable safe disposal of those harmful materials.
  • The incorporation of such material on site does not require any specific tool; field application is conventional and straightforward.
  • Conducting bound water or heat release test to measure reactivity would be beneficial for mixtures composed of clay with cementitious constituents.

Supplementary Materials

The following are available online at https://www.mdpi.com/2075-163X/10/9/796/s1, Figure S1: Compaction curve of the clay used with the two chosen densities. Figure S2: EDX analysis: Resulting spectrum and tabulated results of marine deposited clay. Figure S3: EDX analysis: Resulting spectrum and tabulated results of Wood-ash.

Author Contributions

M.H. and A.E. conceived the study and were responsible for the scheduling and performing the experimental study. E.A. was responsible for microstructure interpretation. A.E. and M.H. wrote the first draft of the article and E.A. overlooked and finalized the study. All authors have read and agreed to the published version of the manuscript.

Funding

The authors express their appreciation to Office of Research Coordination and Support, Middle East Technical University, Northern Cyprus Campus for funding this research group. Scientific Research Project Code FEN-20-YG-4.

Acknowledgments

The authors greatly appreciate the discussions and help from Assoc. Pedro Ferreira from University College London and Nilo C. Consoli from Universidade de Federal do Rio Grande do Sul.

Conflicts of Interest

The authors declare no conflict of interest.

References

  1. Cyprus Turkish Chamber of Civil Engineers (Site Investigation Database). Available online: https://www.ktimo.org/Zemin (accessed on 27 June 2020).
  2. Rajasekaran, G.; Rao, S.N. Lime Stabilization Technique for the Improvement of Marine Clay. Soils Found. 1997, 37, 97–104. [Google Scholar] [CrossRef] [Green Version]
  3. Rao, K.D.; Anusha, M.; Pranav, P.R.T.; Venkatesh, G. A laboratory study on the stabilization of marine clay using saw dust and lime. Int. J. Eng. Sci. Adv. Technol. 2012, 2, 851–862. [Google Scholar]
  4. Venkateswarlu, D.; Anjan Kumar, M.; Prasada Raju, G.V.R.; Prasad, D.S.V. A study on the lime—Cement stabilized marine clay. Asian J. Microbiol. Biotechnol. Environ. Sci. 2014, 16, 437–442. [Google Scholar]
  5. Mohammed Al-Bared, M.A.; Marto, A. A review on the geotechnical and engineering characteristics of marine clay and the modern methods of improvements. Malays. J. Fundam. Appl. Sci. 2017, 13, 825–831. [Google Scholar] [CrossRef] [Green Version]
  6. Xiao, H.W.; Lee, F.H. Curing time effect on behavior of cement treated marine clay. Proc. World Acad. Sci. Eng. Technol. 2008, 33, 2070–3740. [Google Scholar]
  7. Xiao, H.; Shen, W.; Lee, F.H. Engineering properties of marine clay admixed with portland cement and blended cement with siliceous fly ash. J. Mater. Civ. Eng. 2017, 29, 04017177. [Google Scholar] [CrossRef]
  8. Basack, S.; Purkayastha, R.D. Engineering properties of marine clays from the eastern coast of India. J. Eng. Technol. Res. 2009, 1, 109–114. [Google Scholar]
  9. Siddique, R.; Singh, M.; Singhal, A.K. Use of unprocessed wood ash as partial replacement of sand in concrete. ACI Mater. J. 2019, 116, 77–86. [Google Scholar] [CrossRef]
  10. Shi, Z.; Lothenbach, B. The role of calcium on the formation of alkali-silica reaction products. Cem. Concr. Res. 2019, 126, 105898. [Google Scholar] [CrossRef]
  11. Aydin, E.; Arel, H.Ş. High-volume marble substitution in cement-paste: Towards a better sustainability. J. Clean. Prod. 2019, 237, 117801. [Google Scholar] [CrossRef]
  12. Siddique, R. Utilization of industrial by-products in concrete. Procedia Eng. 2014, 95, 335–347. [Google Scholar] [CrossRef] [Green Version]
  13. Miller, S.A.; John, V.M.; Pacca, S.A.; Horvath, A. Carbon dioxide reduction potential in the global cement industry by 2050. Cem. Concr. Res. 2018, 114, 115–124. [Google Scholar] [CrossRef]
  14. Ekinci, A. Effect of preparation methods on strength and microstructural properties of cemented marine clay. Constr. Build. Mater. 2019, 227, 116690. [Google Scholar] [CrossRef]
  15. Cheah, C.B.; Samsudin, M.H.; Ramli, M.; Part, W.K.; Tan, L.E. The use of high calcium wood ash in the preparation of Ground Granulated Blast Furnace Slag and Pulverized Fly Ash geopolymers: A complete microstructural and mechanical characterization. J. Clean. Prod. 2017, 156, 114–123. [Google Scholar] [CrossRef]
  16. Frías, M.; Rodríguez, O.; Sanchez de Rojas, M.I.; Villar-Cociña, E.; Rodrigues, M.S.; Savastano Junior, H. Advances on the development of ternary cements elaborated with biomass ashes coming from different activation process. Constr. Build. Mater. 2017, 136, 73–80. [Google Scholar] [CrossRef]
  17. Shearer, C.R.; Kurtis, K.E. Use of biomass and co-fired fly ash in concrete. ACI Mater. J. 2015, 112, 209–218. [Google Scholar] [CrossRef]
  18. Siddique, R. Utilization of wood ash in concrete manufacturing. Resour. Conserv. Recycl. 2012, 67, 27–33. [Google Scholar] [CrossRef]
  19. Kraus, R.; Naik, T. A New Source of Pozzolanic Material. Concr. Int. Des. Constr. 2003, 25, 55–63. [Google Scholar]
  20. Scrivener, K.L.; John, V.M.; Gartner, E.M. Eco-efficient cements: Potential economically viable solutions for a low-CO2 cement-based materials industry. Cem. Concr. Res. 2018, 114, 2–26. [Google Scholar] [CrossRef]
  21. Tamanna, K.; Raman, S.N.; Jamil, M.; Hamid, R. Utilization of wood waste ash in construction technology: A review. Constr. Build. Mater. 2020, 237, 117654. [Google Scholar] [CrossRef]
  22. Ekinci, A.; Scheuermann Filho, H.C.; Consoli, N.C. Copper Slag-Hydrated Lime-Portland Cement Stabilized Marine Deposited Clay. In Proceedings of the Institution of Civil Engineers-Ground Improvement; Ground Improvement: London, UK, 2019. [Google Scholar]
  23. Stolz, J.; Boluk, Y.; Bindiganavile, V. Wood ash as a supplementary cementing material in foams for thermal and acoustic insulation. Constr. Build. Mater. 2019, 215, 104–113. [Google Scholar] [CrossRef]
  24. Arel, H.Ş.; Aydin, E. Use of industrial and agricultural wastes in construction concrete. ACI Mater. J. 2018, 115, 55–64. [Google Scholar] [CrossRef]
  25. Kizinievic, O.; Kizinievic, V. Utilisation of wood ash from biomass for the production of ceramic products. Constr. Build. Mater. 2016, 127, 264–273. [Google Scholar] [CrossRef]
  26. Naik, T.R.; Kraus, R.N.; Siddique, R. Controlled low-strength materials containing mixtures of coal ash and new pozzolanic material. Mater. J. 2003, 100, 208–215. [Google Scholar]
  27. Mehta, P.K.; Monteiro, P.J. Concrete Microstructure, Properties and Materials; McGraw-Hill Education: New York, NY, USA, 2017. [Google Scholar]
  28. Kunther, W.; Lothenbach, B.; Skibsted, J. Influence of the Ca/Si ratio of the C-S-H phase on the interaction with sulfate ions and its impact on the ettringite crystallization pressure. Cem. Concr. Res. 2015, 69, 37–49. [Google Scholar] [CrossRef]
  29. Elinwa, A.U. Experimental characterization of Portland cement-calcined soldier-ant mound clay cement mortar and concrete. Constr. Build. Mater. 2006, 20, 754–760. [Google Scholar] [CrossRef]
  30. Chowdhury, S.; Mishra, M.; Suganya, O. The incorporation of wood waste ash as a partial cement replacement material for making structural grade concrete: An overview. Ain Shams Eng. J. 2015, 6, 429–437. [Google Scholar] [CrossRef] [Green Version]
  31. Cheah, C.B.; Ramli, M. The implementation of wood waste ash as a partial cement replacement material in the production of structural grade concrete and mortar: An overview. Resour. Conserv. Recycl. 2011, 55, 669–685. [Google Scholar] [CrossRef]
  32. Naik, T.R.; Kraus, R.N. Demonstration of manufacturing technology for concrete and clsm utilizing wood ash from wisconsin. UWM Cent. Prod. Util. 2002, 538, 124. [Google Scholar]
  33. Lothenbach, B.; Nonat, A. Calcium silicate hydrates: Solid and liquid phase composition. Cem. Concr. Res. 2015, 78, 57–70. [Google Scholar] [CrossRef]
  34. Siddique, R. Utilization of industrial by-products in concrete. In Proceedings of the Procedia Engineering, Chengdu, China, 20–22 June 2014. [Google Scholar]
  35. Consoli, N.C.; Foppa, D.; Festugato, L.; Heineck, K.S. Key parameters for strength control of artificially cemented soils. J. Geotech. Geoenviron. Eng. 2007, 133, 197–205. [Google Scholar] [CrossRef]
  36. Consoli, N.C.; Rosa, A.D.; Saldanha, R.B. Variables governing strength of compacted soil-fly ash-lime mixtures. J. Mater. Civ. Eng. 2011, 23, 432–440. [Google Scholar] [CrossRef]
  37. Nath, B.D.; Sarkar, G.; Siddiqua, S.; Rokunuzzaman, M.; Islam, M.R. Geotechnical Properties of Wood Ash-Based Composite Fine-Grained Soil. Adv. Civ. Eng. 2018, 2018, 9456019. [Google Scholar] [CrossRef] [Green Version]
  38. Consoli, N.C.; Da Silva Lopes, L.; Consoli, B.S.; Festugato, L. Mohr-Coulomb failure envelopes of lime-treated soils. Geotechnique 2014, 64, 165–170. [Google Scholar] [CrossRef]
  39. Soltani, A.; Deng, A.; Taheri, A.; Mirzababaei, M.; Jaksa, B. A dimensional description of the unconfined compressive strength of artificially cemented fine-grained soils. J. Adhes. Sci. Technol. 2020, 1–25. [Google Scholar] [CrossRef]
  40. Bellamy, C.V.; Jukes-Brown, A.J. The geology of Cyprus: Plymouth; William Brendon & Son: Brandon, UK, 1905. [Google Scholar]
  41. Hakyemez, Y.; Turhan, N.; Sönmez, İ.; Sümengen, M. The Geology of the Turkish Republic of Northern Cyprus; Department of the Geological Surveys, General Directorate of the Minerals Research and Exploration of Turkey: Ankara, Turkey, 2000; unpublished report; p. 44. [Google Scholar]
  42. Palamakumbura, R.N. Sedimentary Response to the Tectonic Uplift of the Kyrenia Range, Northern Cyprus, in its Eastern Mediterranean Tectonic Setting. Ph.D. Thesis, The University of Edinburgh, Edinburgh, UK, 2015. [Google Scholar]
  43. ASTM D4318-17e1. Standard Test Methods for Liquid Limit, Plastic Limit, and Plasticity Index of Soils; ASTM International: West Conshohocken, PA, USA, 2017. [Google Scholar]
  44. ASTM D6913/D6913M-17. Standard Test Methods for Particle-Size Distribution (Gradation) of Soils Using Sieve Analysis; ASTM International: West Conshohocken, PA, USA, 2017. [Google Scholar]
  45. ASTM D854-14. Standard Test Methods for Specific Gravity of Soil Solids by Water Pycnometer; ASTM International: West Conshohocken, PA, USA, 2014. [Google Scholar]
  46. ASTM D2487-17e1. Standard Practice for Classification of Soils for Engineering Purposes (Unified Soil Classification System); ASTM International: West Conshohocken, PA, USA, 2017. [Google Scholar]
  47. Consoli, N.C.; Vaz Ferreira, P.M.; Tang, C.S.; Veloso Marques, S.F.; Festugato, L.; Corte, M.B. A unique relationship determining strength of silty/clayey soils—Portland cement mixes. Soils Found. 2016, 56, 1082–1088. [Google Scholar] [CrossRef]
  48. ASTM C188-17. Standard Test Method for Density of Hydraulic Cement; ASTM International: West Conshohocken, PA, USA, 2017. [Google Scholar]
  49. Naik, T.R.; Kraus, R.N.; Siddique, R. A new source of pozzolanic material. Concr. Int. 2003, 25, 55–62. [Google Scholar]
  50. ASTM C150/C150M-18. Standard Specification for Portland Cement; ASTM International: West Conshohocken, PA, USA, 2018. [Google Scholar]
  51. ASTM C39/C39M-20. Standard Test Method for Compressive Strength of Cylindrical Concrete Specimens; ASTM International: West Conshohocken, PA, USA, 2020. [Google Scholar]
  52. Basma, A.A.; Al-Homoud, A.S.; Al-Tabari, E.Y. Effects of methods of drying on the engineering behavior of clays. Appl. Clay Sci. 1994, 9, 151–164. [Google Scholar] [CrossRef]
  53. Selig, E.; Ladd, R. Preparing Test Specimens Using Undercompaction. Geotech. Test. J. 1978, 1, 16. [Google Scholar] [CrossRef]
  54. ASTM C511-13. Standard Specification for Mixing Rooms, Moist Cabinets, Moist Rooms, and Water Storage Tanks Used in the Testing of Hydraulic Cements and Concretes; ASTM International: West Conshohocken, PA, USA, 2013. [Google Scholar]
  55. Consoli, N.C.; Filho, H.C.S.; Godoy, V.B.; Rosenbach, C.M.D.C.; Carraro, J.A.H. Durability of rap-industrial waste mixtures under severe climate conditions. Soils Rocks 2018, 41, 149–156. [Google Scholar] [CrossRef]
  56. ASTM C597-02. Standard Test Method for Pulse Velocity Through Concrete; ASTM International: West Conshohocken, PA, USA, 2002. [Google Scholar]
  57. ASTM D3080/D3080M-11. Standard Test Method for Direct Shear Test of Soils Under Consolidated Drained Conditions; ASTM International: West Conshohocken, PA, USA, 2011. [Google Scholar]
  58. Krzywiński, K.; Sadowski, Ł.; Szymanowski, J.; Zak, A.; Piechówka-Mielnik, M. Attempts to improve the subsurface properties of horizontally-formed cementitious composites using tin(ii) fluoride nanoparticles. Coatings 2020, 10, 83. [Google Scholar] [CrossRef] [Green Version]
  59. Sadowski, Ł.; Hoła, J.; Żak, A.; Chowaniec, A. Microstructural and mechanical assessment of the causes of failure of floors made of polyurethane-cement composites. Compos. Struct. 2020, 238, 112002. [Google Scholar] [CrossRef]
  60. Consoli, N.C.; Marques, S.F.V.; Floss, M.F.; Festugato, L. Broad-spectrum empirical correlation determining tensile and compressive strength of cement-bonded clean granular soils. J. Mater. Civ. Eng. 2017, 29, 1–7. [Google Scholar] [CrossRef]
  61. Diambra, A.; Ibraim, E.; Peccin, A.; Consoli, N.C.; Festugato, L. Theoretical derivation of artificially cemented granular soil strength. J. Geotech. Geoenviron. Eng. 2017, 143, 04017003. [Google Scholar] [CrossRef] [Green Version]
  62. Bishop, A.W.; Green, G.E. The influence of end restraint on the compression strength of a cohesionless soil. Geotechnique 1965, 15, 243–266. [Google Scholar] [CrossRef]
  63. Li, X.; Snellings, R.; Antoni, M.; Alderete, N.M.; Ben Haha, M.; Bishnoi, S.; Cizer, Ö.; Cyr, M.; De Weerdt, K.; Dhandapani, Y.; et al. Reactivity tests for supplementary cementitious materials: RILEM TC 267-TRM phase 1. Mater. Struct. Constr. 2018, 51, 151. [Google Scholar] [CrossRef] [Green Version]
  64. Mehta, B.Y.P.K.; Burrows, R.W. Building Durable Structures in the 21st Century. Concr. Int. 2001, 23, 57–63. [Google Scholar]
Figure 1. The grain Cumulative distribution (%) of studied marine deposited clay and wood-ash.
Minerals 10 00796 g001
Figure 2. X-ray diffraction pattern of studied clay sample.
Minerals 10 00796 g002
Figure 3. Tests setups; (A) load Frame for UCS, (B) Pundit for Ultrasonic Pulse Velocity (UPV), and (C) direct shear box for shear strength parameters.
Minerals 10 00796 g003
Figure 4. Variation of unconfined compressive strength (qu) with adjusted porosity/binder index for (A) compacted marine clay + cement + 10% wood-ash blends, (B) compacted marine clay + cement + 5% wood-ash, (C) compacted marine clay + cement blends, (D) regression curves of all blends at 7, 28, and 60 days of curing.
Minerals 10 00796 g004
Figure 5. Variation of unconfined compressive strength (qu) with adjusted porosity/binder index for all blends considering cement only, cement+5% wood-ash, and cement+ 10% wood-ash.
Minerals 10 00796 g005
Figure 6. Normalization of unconfined compressive strength (qu) (for the whole range of η/Xiv0.32) with adjusted porosity/binder index for all blends considering cement only, cement + 5% wood-ash, and cement + 10% wood-ash.
Minerals 10 00796 g006
Figure 7. Normalization of unconfined compressive strength (qu), (for the whole range of η/Xiv0.32) by dividing for qu at η/Xiv0.32 = 25. Considering all studied blends.
Minerals 10 00796 g007
Figure 8. Curve obtained using Equation (7) and laboratory testing data for Portugal Silty sand [47] cement blend tested for unconfined compression and London Clay [47] plus Portland cement blend tested for unconfined compression.
Minerals 10 00796 g008
Figure 9. Variation of initial shear modulus (G0) with adjusted porosity/binder index for all blends, considering cement + 5% wood-ash and cement + 10% wood-ash.
Minerals 10 00796 g009
Figure 10. Normalization of initial shear modulus (G0) (for the whole range of η/Xiv0.32) by dividing G0 at η/Xiv0.32 = 25, considering all studied blends.
Minerals 10 00796 g010
Figure 11. Variation in direct shear failure envelopes for blends considering marine clay, 7% cement, 10% cement, cement + 5% wood-ash, and cement + 10% wood-ash.
Minerals 10 00796 g011
Figure 12. SEM of pure wood-ash sample.
Minerals 10 00796 g012
Figure 13. SEM of marine deposited clay sample.
Minerals 10 00796 g013
Figure 14. The scanning electron microscopy images, conducted on (A) wood-ash at (B) 7 days, (C) 28 days, and (D) 60 days, for cured cement + wood-ash blend marine deposited clays.
Minerals 10 00796 g014
Figure 15. SEM of clay-cement–ash sample.
Minerals 10 00796 g015
Table 1. Physical properties of marine-deposited Clay, wood-ash, London clay, and Portugal silty sand.
PropertiesMarine ClayWood-AshLondon Clay [47]Portugal Silty Sand [47]
Liquid limit (%)40-7839
Plastic limit (%)21-3034
Plasticity index (%)19-485
Specific gravity2.611.72.752.64
Fine gravel (4.75 mm < diameter < 20 mm) (%)----
Coarse sand (2.00 mm < diameter < 4.75 mm) (%)2---
Medium sand (0.425 < diameter < 2.00 mm) (%)3---
Fine sand (0.075 mm < diameter < 0.425 mm) (%)2710021.5
Silt (0.002 mm < diameter < 0.075 mm) (%)19-4865.5
Clay (diameter < 0.002 mm) (%)49-5033
D50 particle diameter (mm)0.00350.180.0020.006
USCS classCLSPCHML
(-) cannot be performed/not present.
Table 2. Chemical analysis of the clay, Portland cement, and wood-ash.
CompoundClay (%)Portland Cement (%)Wood-ash (%)
SiO222.121.218.1
Al2O37.65.13.3
Fe2O36.72.52.8
CaO45.564.744.4
MgO2.30.92.8
K2O2.10.25.2
SO31.11.50.9
loss on ignition12.62.522.1
Table 3. Details of molding, curing, and normalization parameters of all blends.
Soil TypeCement Contents (%)Wood-Ash Content (%)Molding Dry Density (kg/m3)Curing Periods (Days)Test TypeNormalization Index (∇)qu for Normalization (kPa)
Marine Deposited Clay 7UCS, Go, Direct Shear *, SEM *η/(Xiv)0.32 = 251650
7, 10, and 13 1400 and 160028η/(Xiv)0.32 = 251800
60η/(Xiv)0.32 = 252050
7UCS, Go, Direct Shear *, SEM *η/(Xiv)0.32 = 251700
7, 10, and 135%1400 and 160028η/(Xiv)0.32 = 252100
60η/(Xiv)0.32 = 252400
7UCS, Go, Direct Shear *, SEMη/(Xiv)0.32 = 251500
7, 10, and 13 10% 1400 and 160028η/(Xiv)0.32 = 251650
60η/(Xiv)0.32 = 252000
* 7 days curing and 10% ash only. SEM on 1600 kg/m3 dry density.
Table 4. Shear strength parameters and average brittleness ratio of all blends.
Friction Angle (ϕ)Cohesion (kPa)Brittleness Index (%)
Marine Clay27100.00
7% Cement425742.60
7% Cement 10% Ash429125.87
7% Cement 5% Ash4112325.48
10% Cement 3916454.06
10% Cement 10% Ash4021632.87
10% Cement 5% Ash3923321.40

