A Multiproxy Approach to the Reconstruction of an Ancient Manufacturing Technology: A Case Study of a Faience Ptolemaic Bowl from Tell Atrib (Nile Delta)

 ,
, 
 , , and
Abstract
1. Introduction
- Determining of the raw material used to produce faience objects, particularly the admixtures which affected on conditions of moulding and firing;
- Recognition of the structural–textural features of the faience, as well as the relationship between glaze and body;
- Reconstruction of the process of silica paste preparation, relief decorating and glazing;
- Determining the number of firing stages, their temperatures, duration and conditions in the kiln.
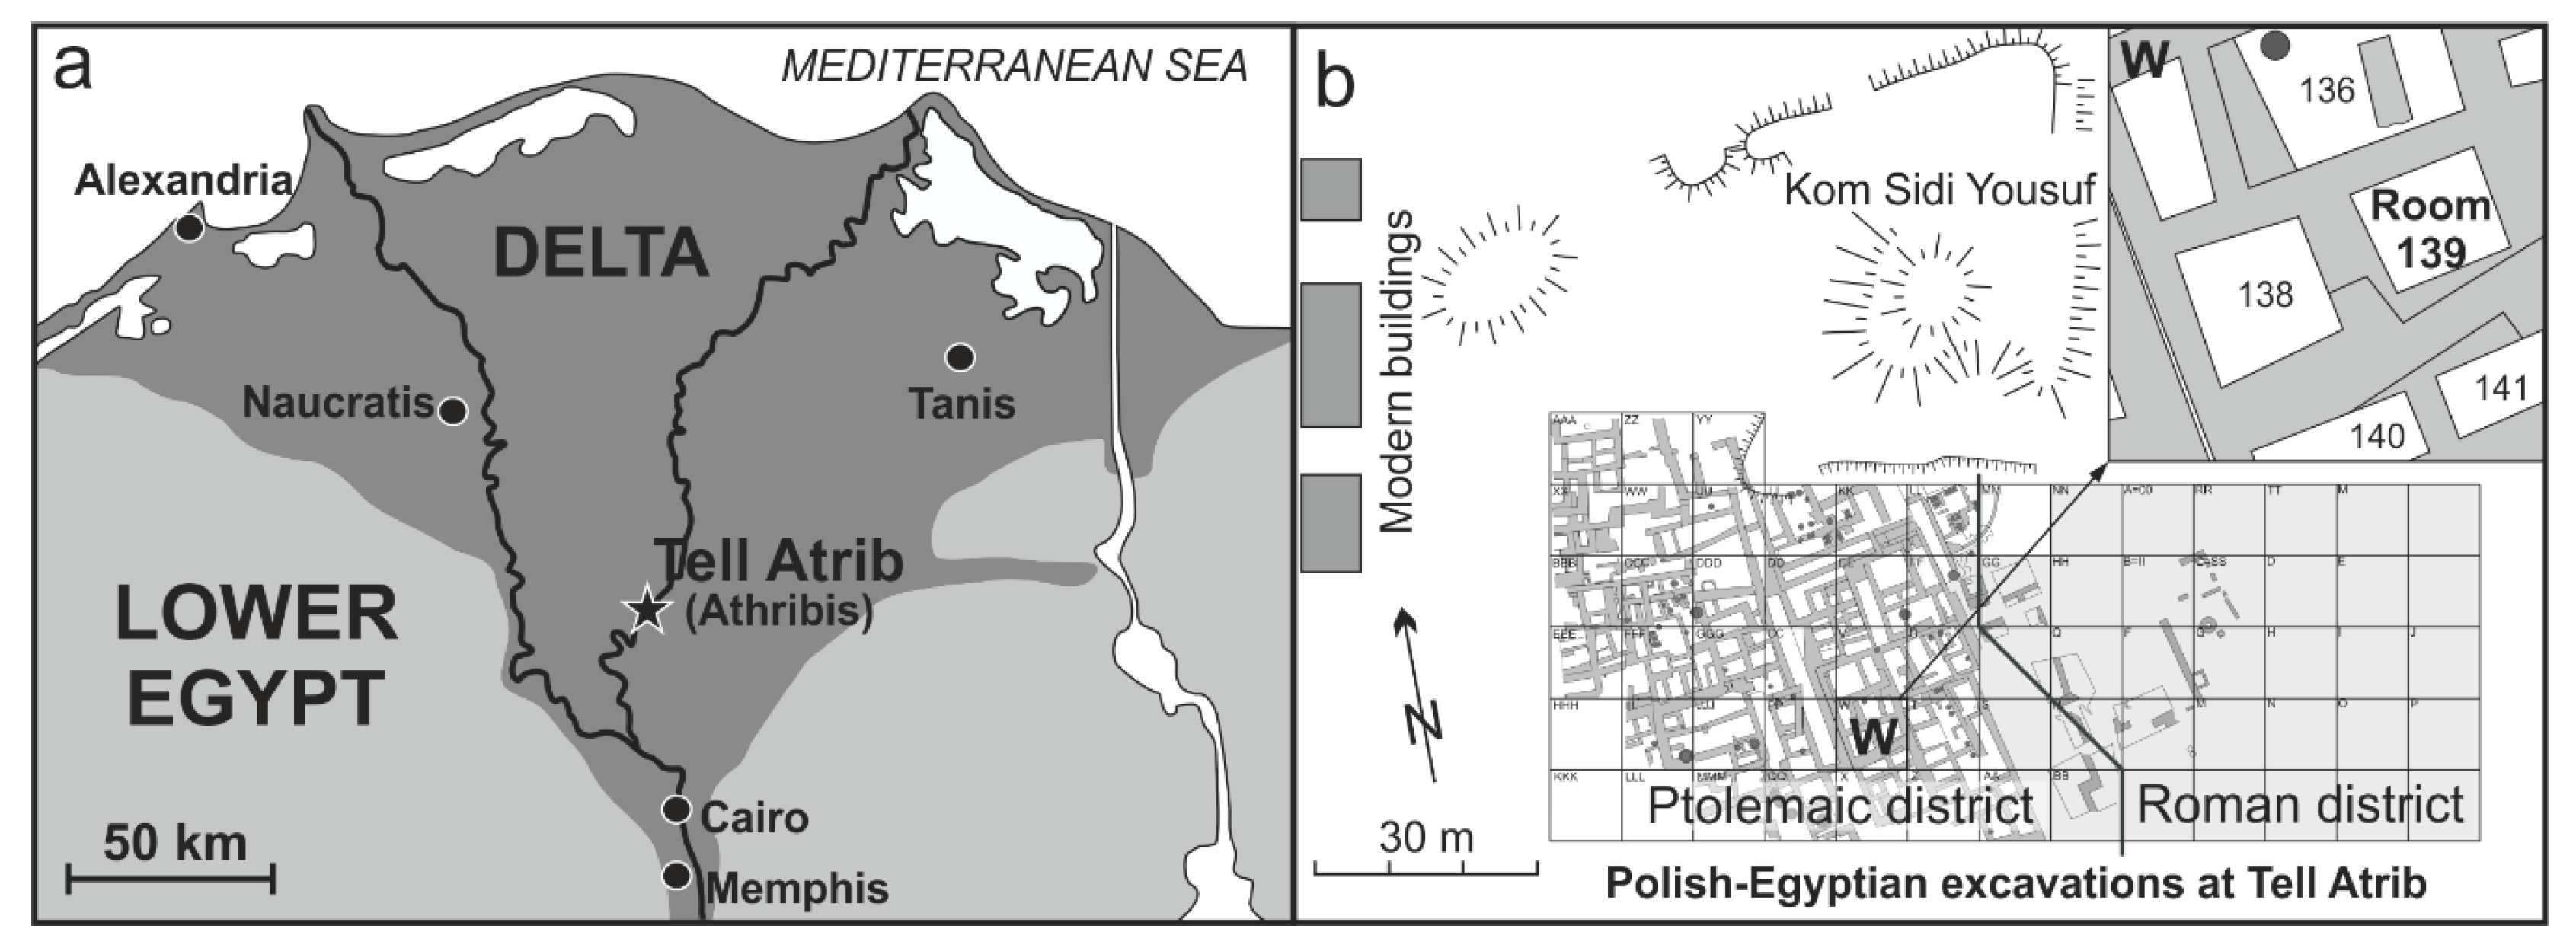
2. Archaeological Site and Faience Object
2.1. The Excavation at Tell Atrib
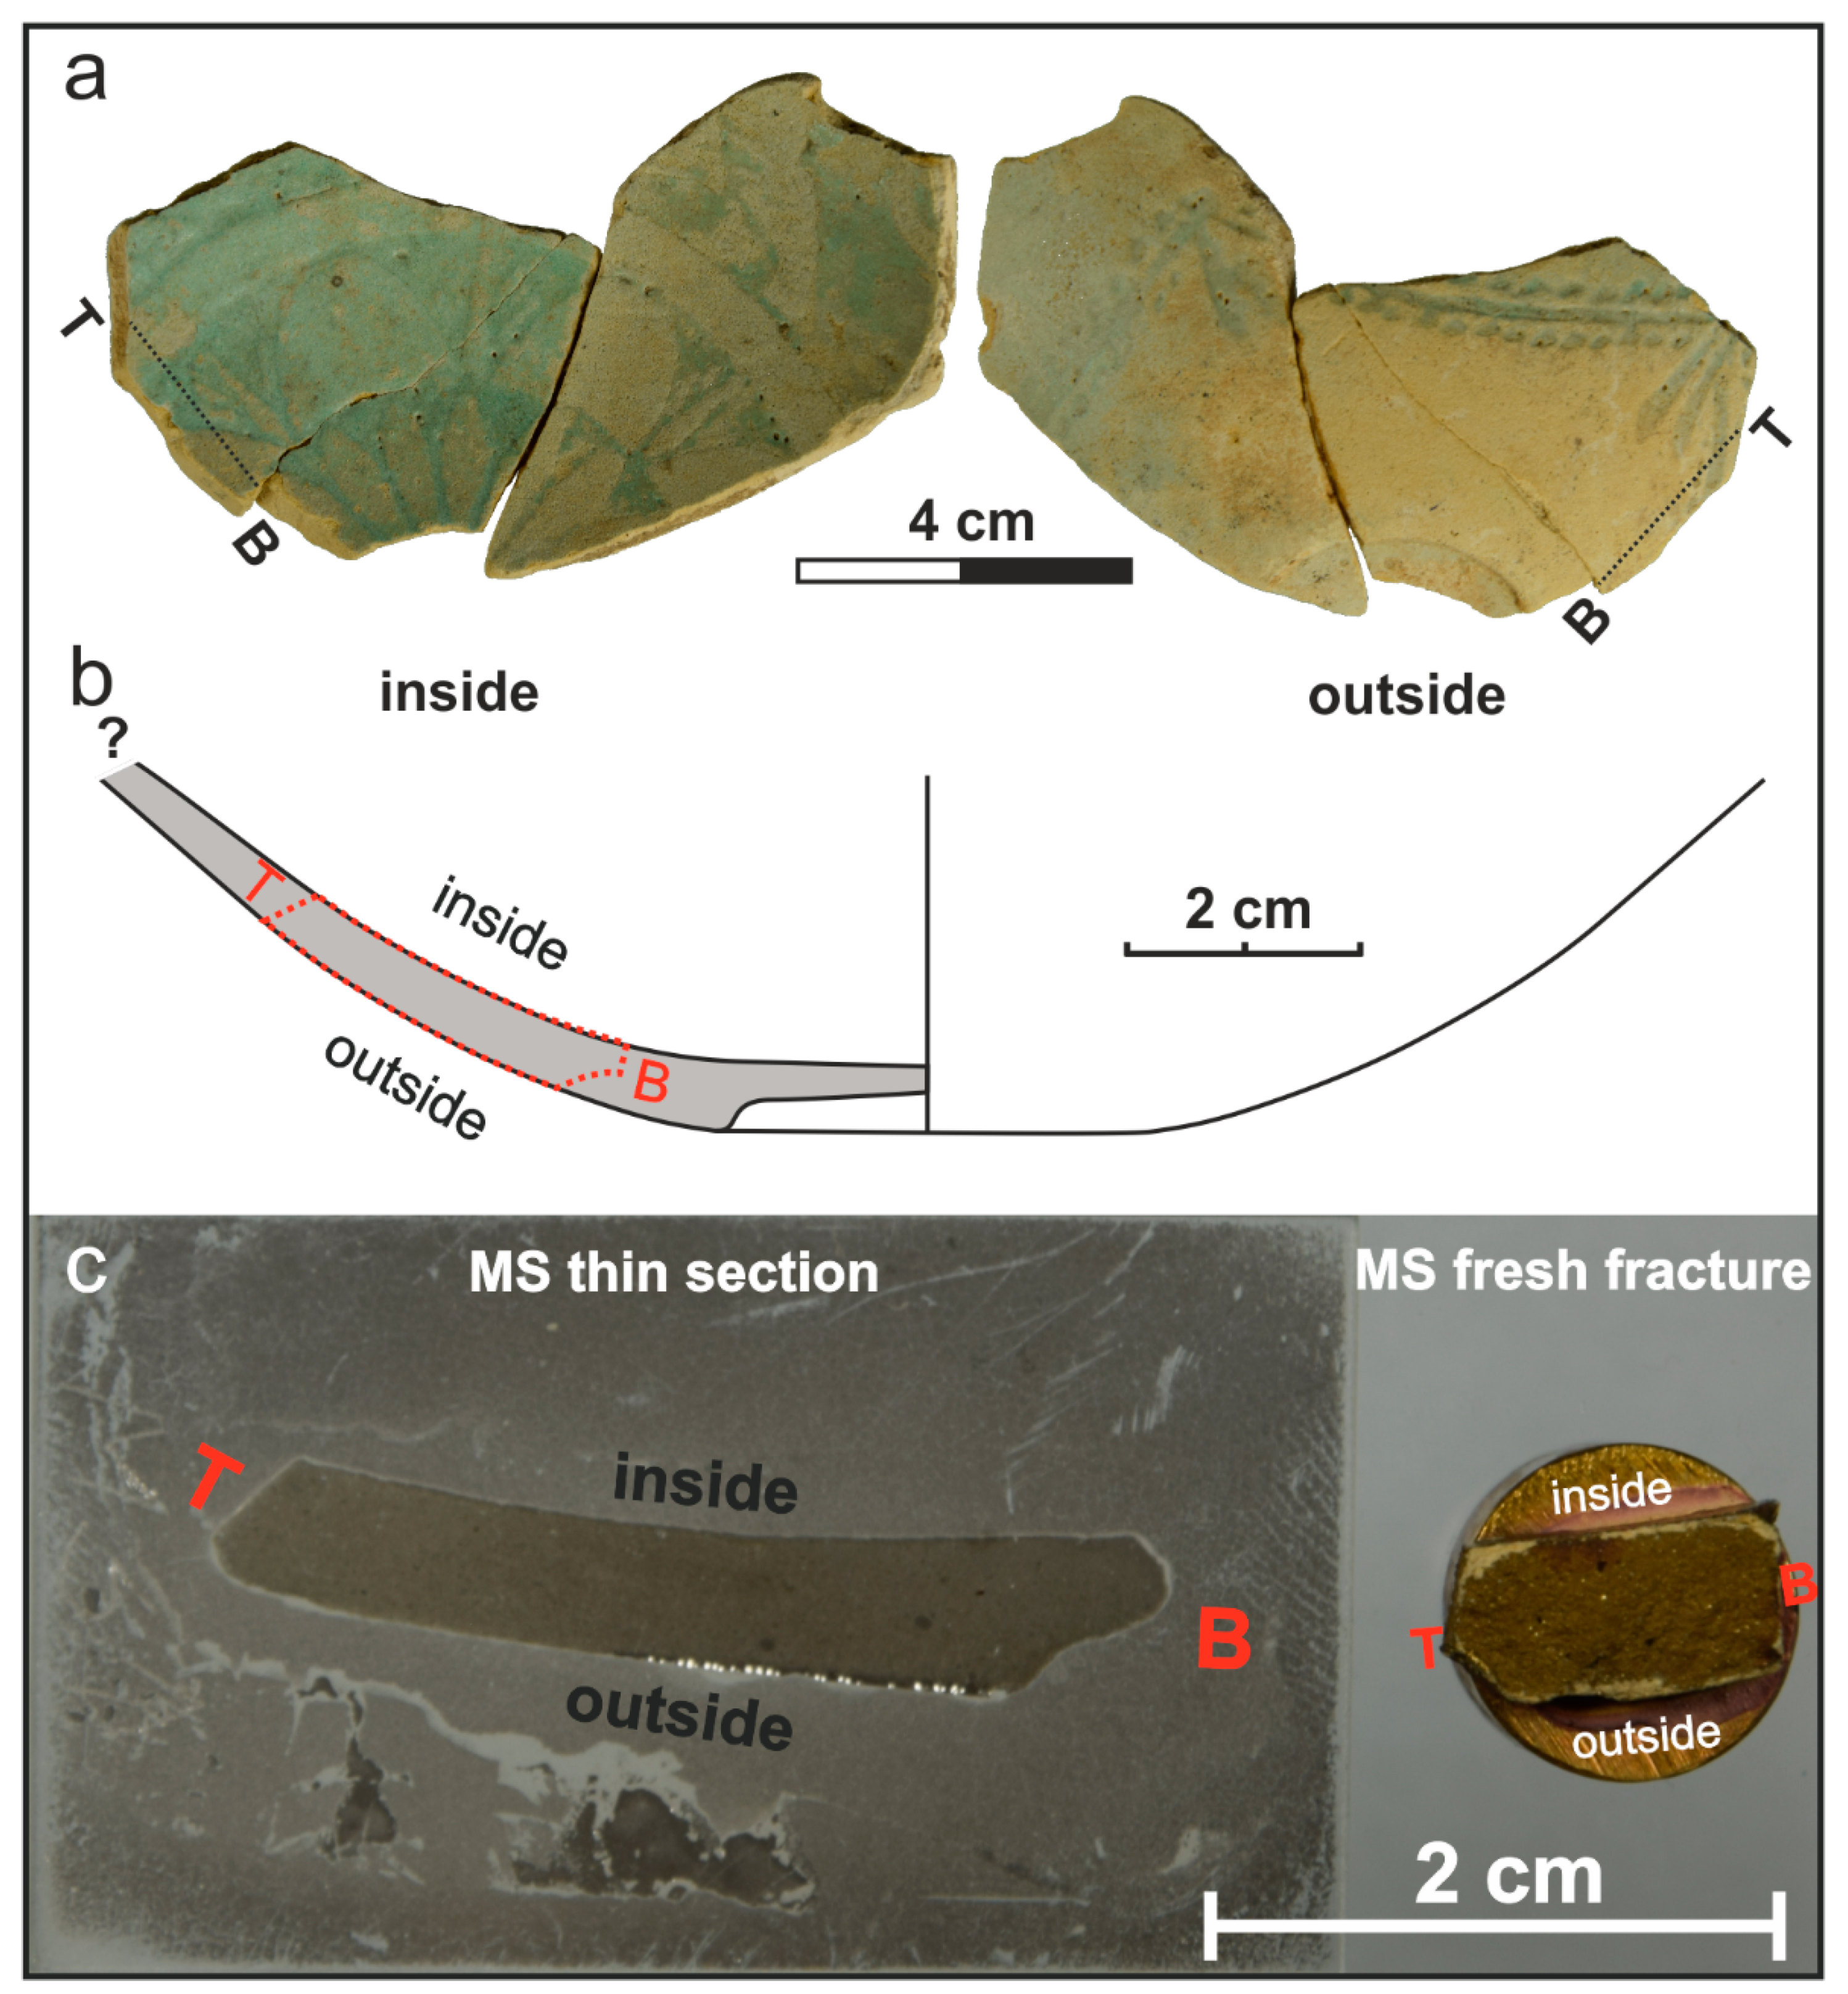
2.2. Relief-Decorated Faience Bowl
3. Analytical Methods
3.1. Digital and Stereoscopic Light Microscopy
3.2. Polarised Light Microscopy
3.3. Scanning Electron Microscopy (SEM) with Energy Dispersive Spectroscopy (EDS)
3.3.1. MS Fresh Fracture Sample
3.3.2. Fragments of the Faience Layered Structure
3.3.3. MS Thin Section Sample
3.4. Image Analysis
3.5. X-ray Powder Diffraction (XRD)
3.6. Physical Properties
3.7. Simultaneous Thermal Analysis (STA): TG-DSC with Evolved Gas Analysis (EGA): FTIR-QMS
4. Results and Interpretation
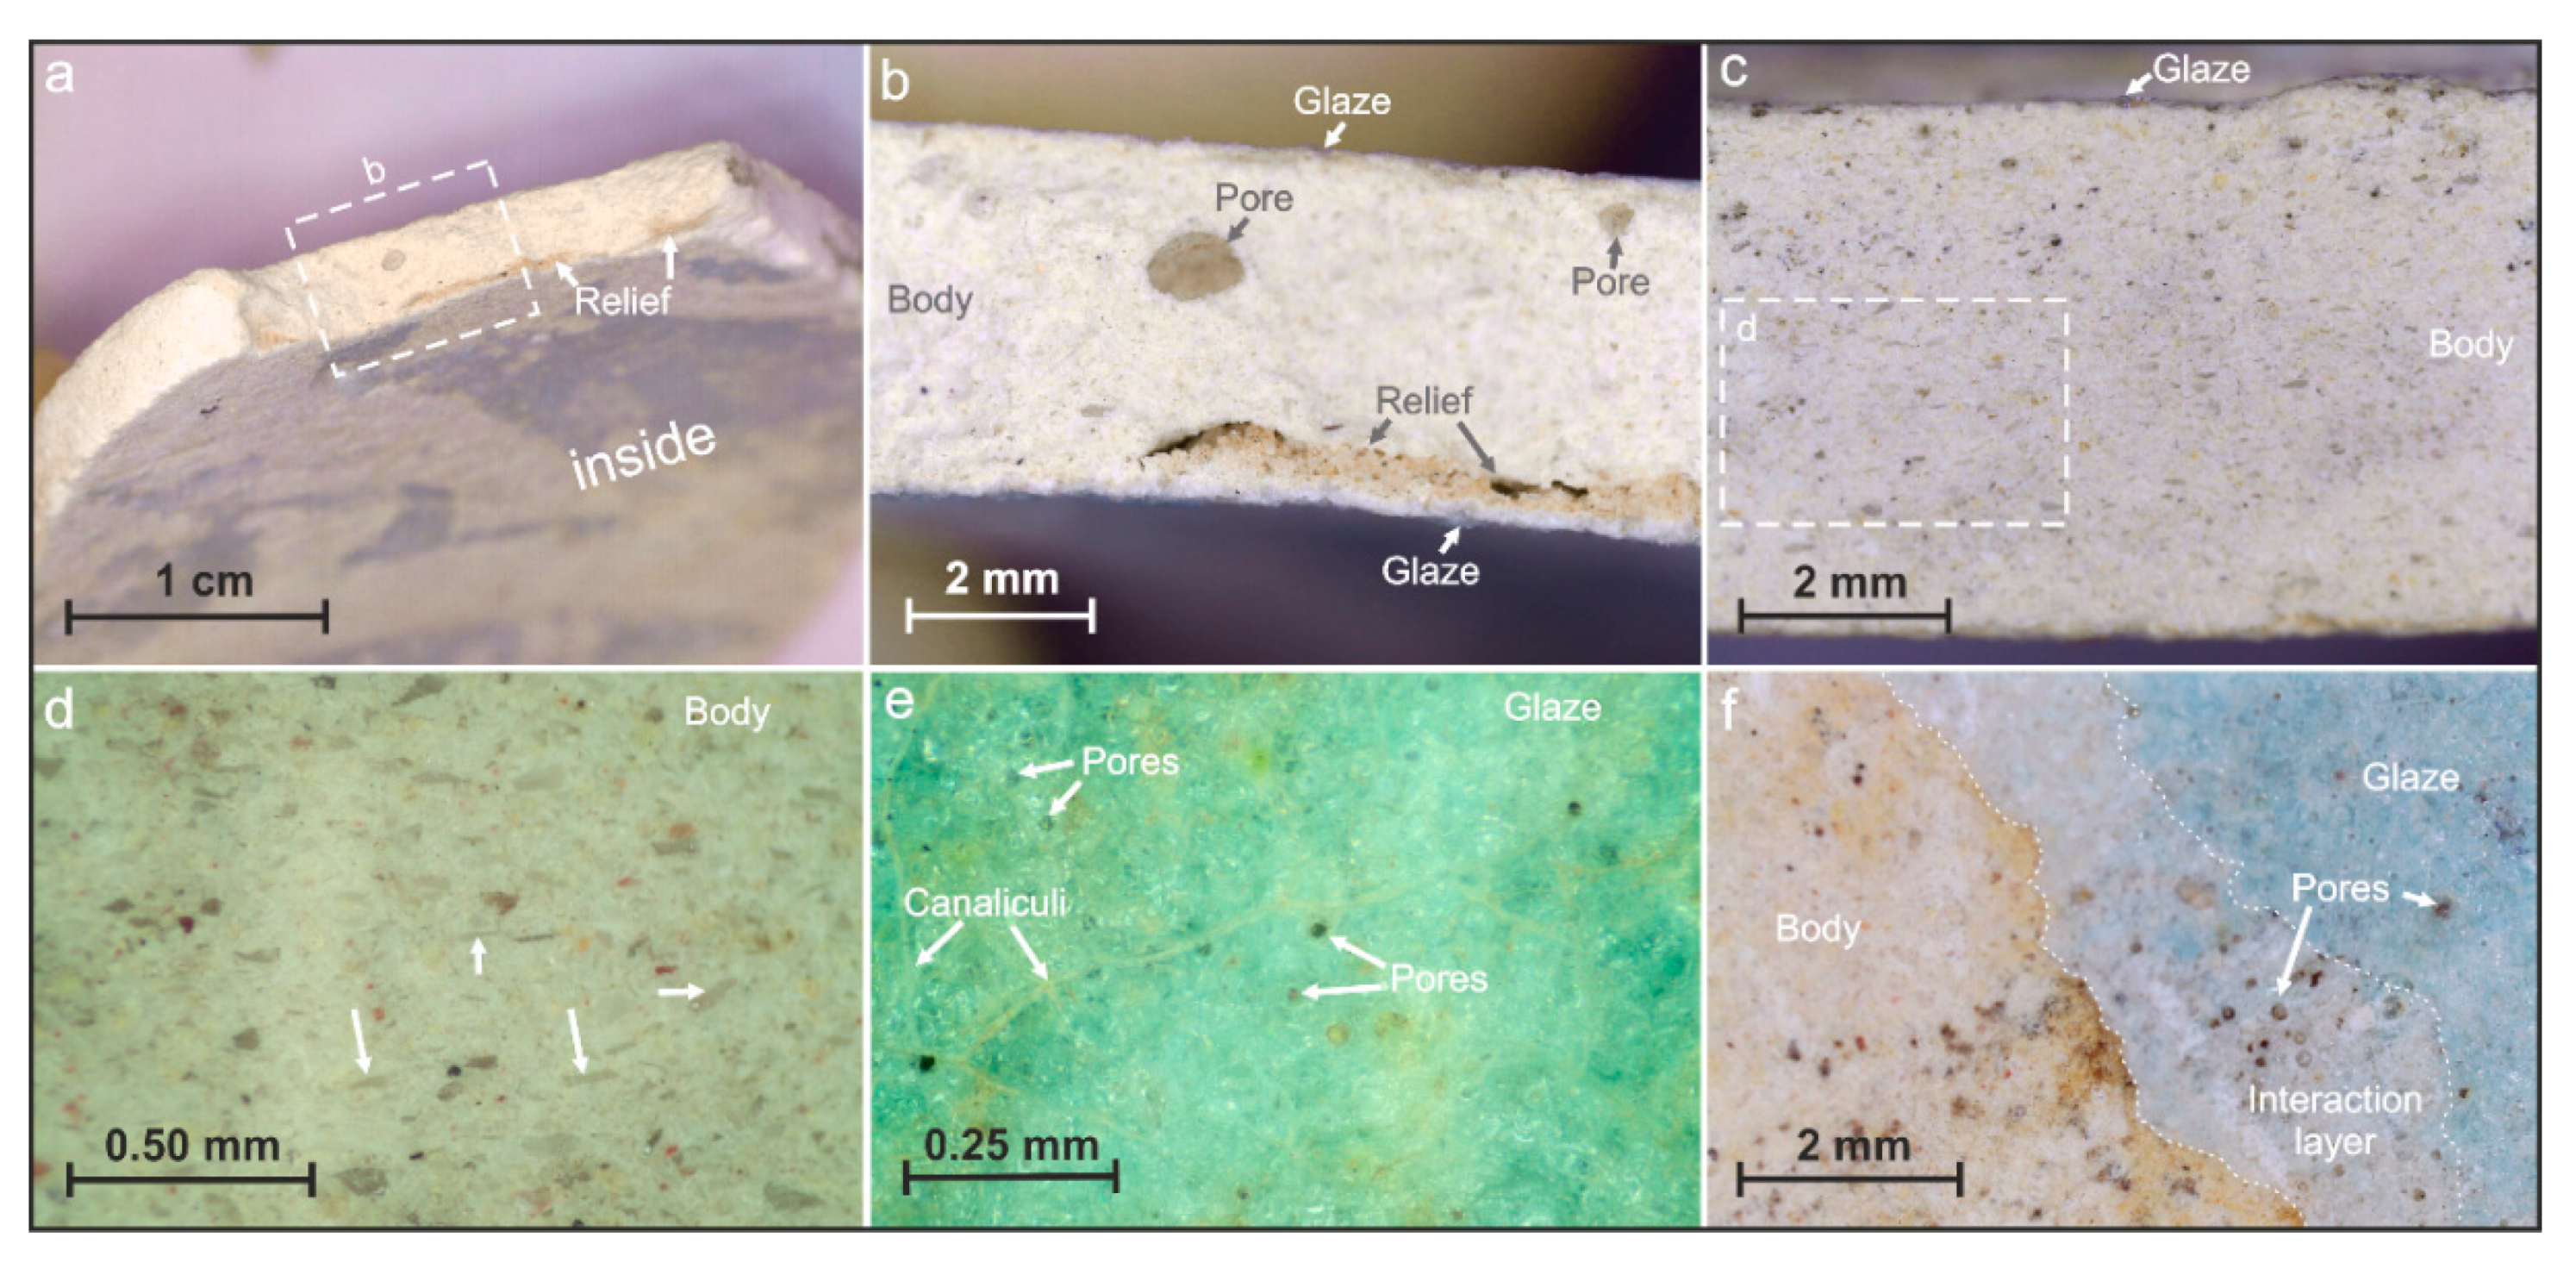
4.1. Digital and Stereoscopic Light Microscopy
Interpretation
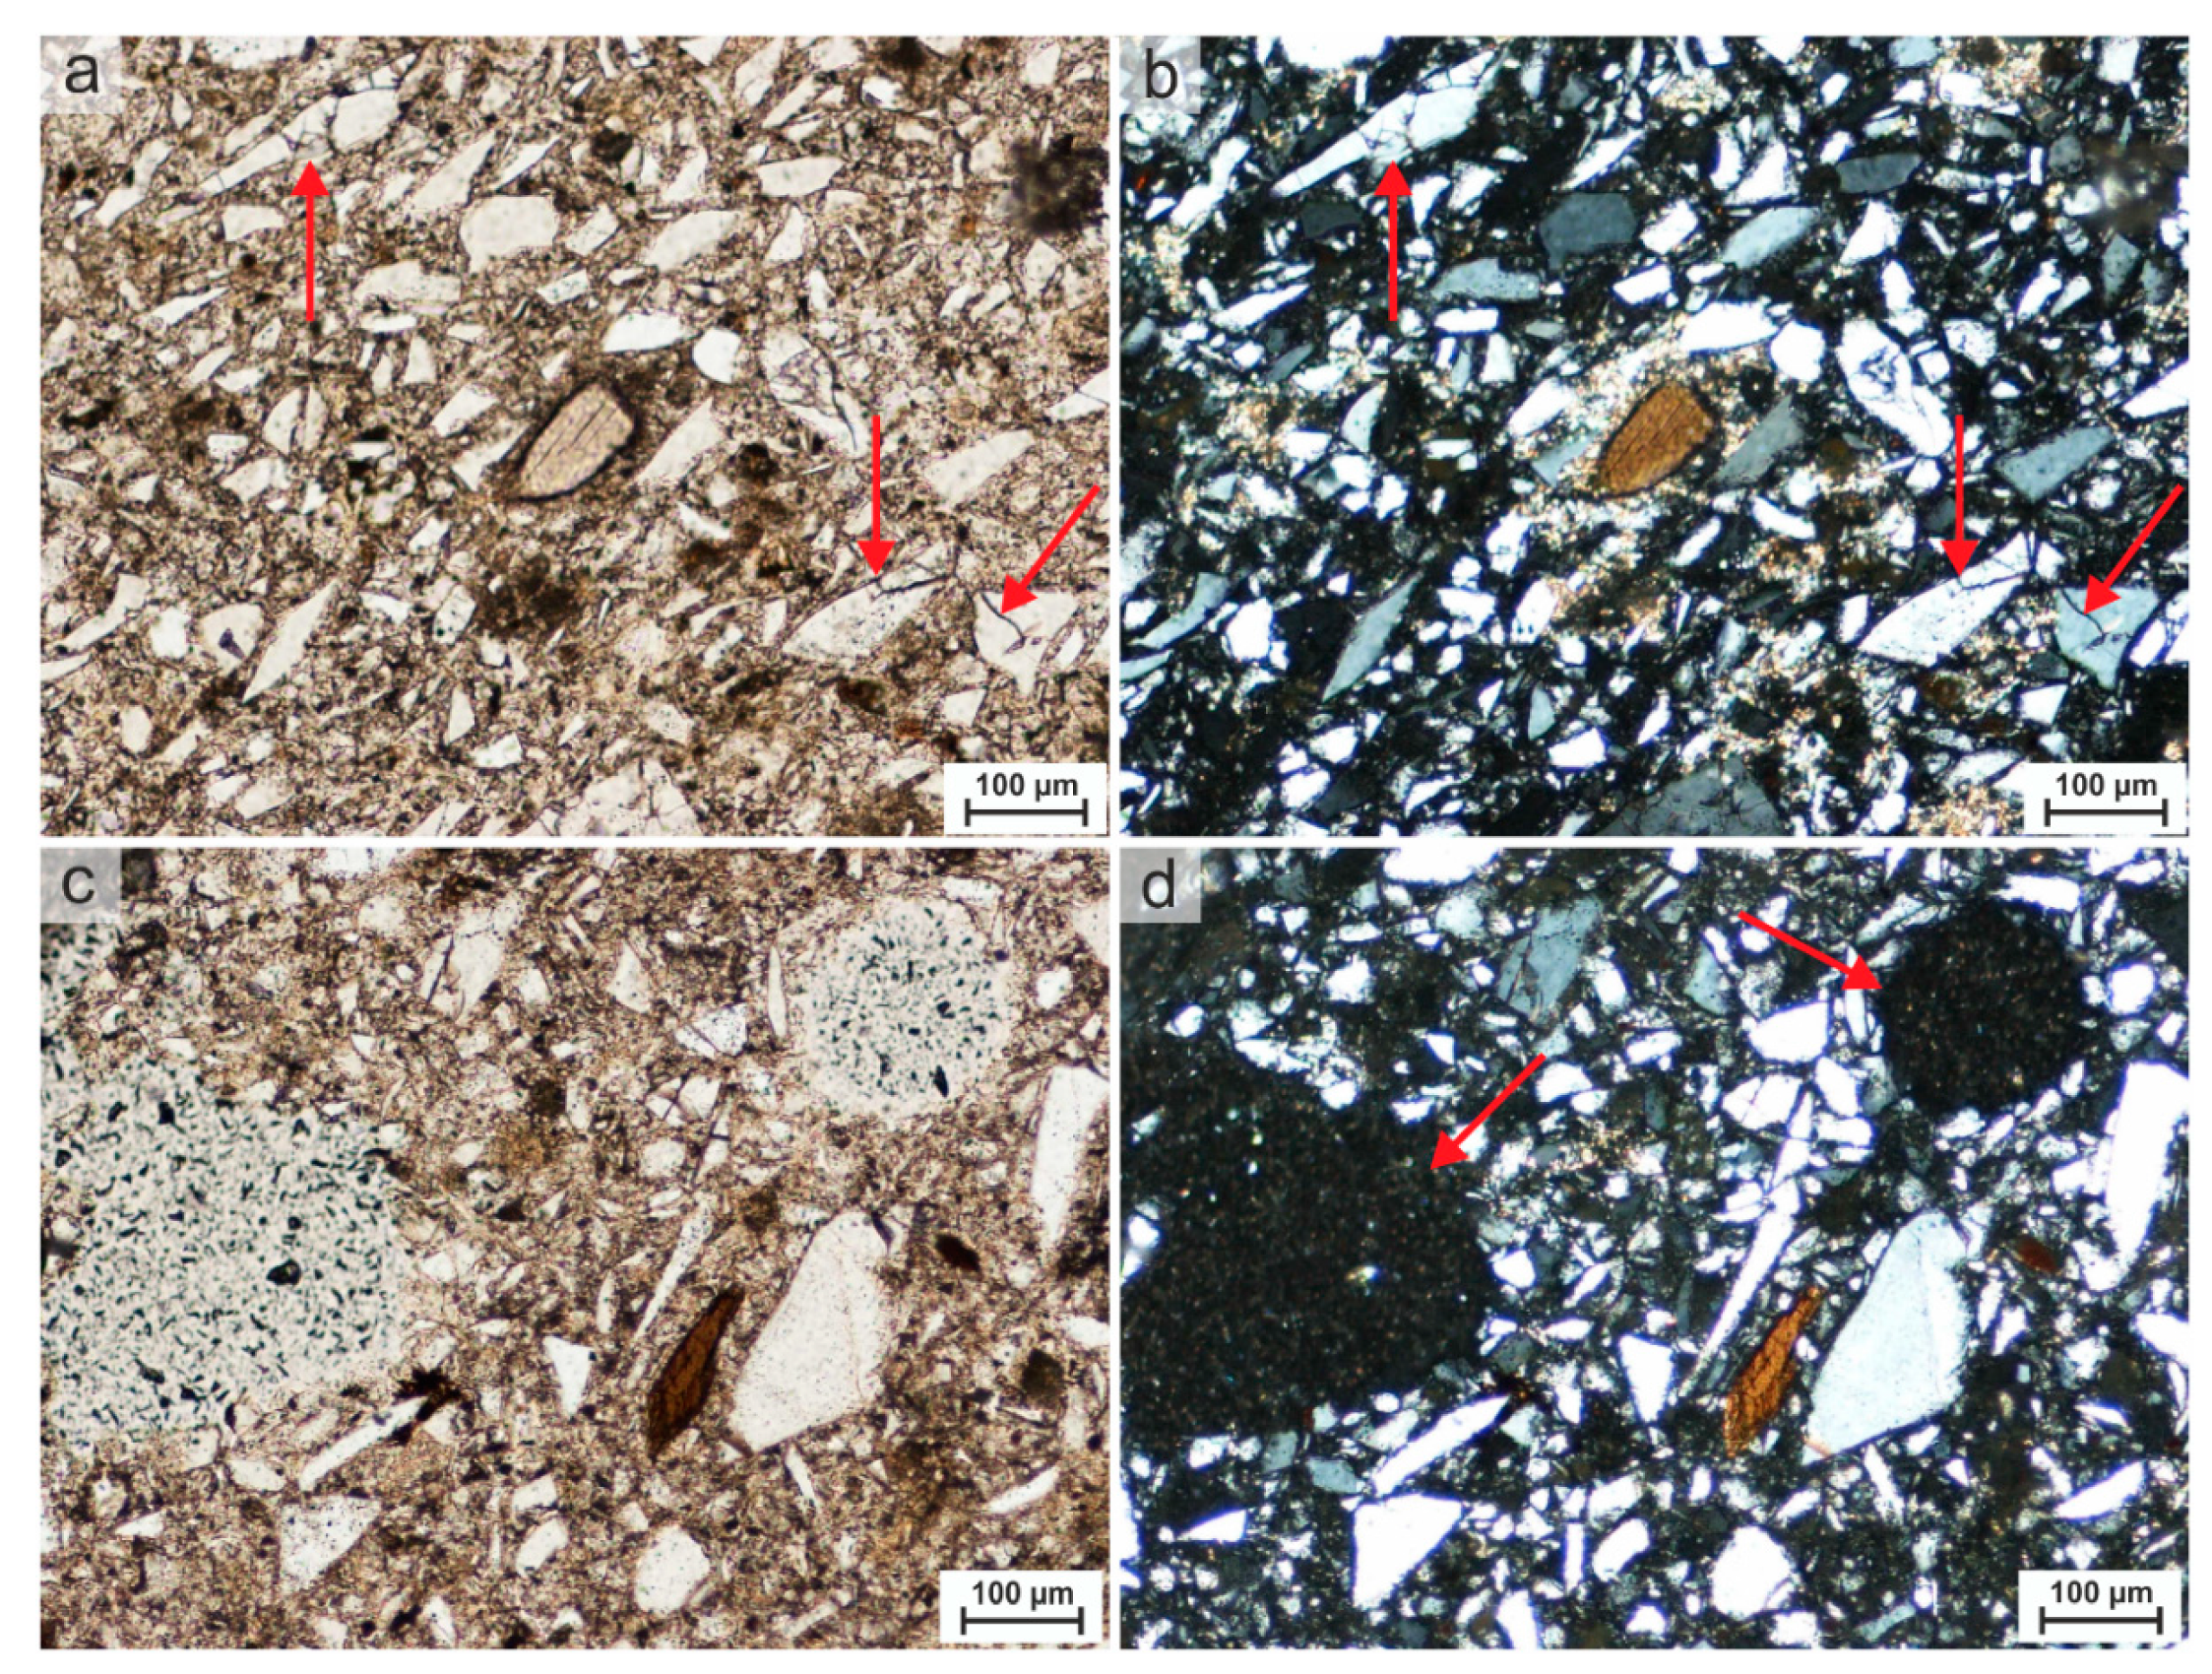
4.2. Polarised Light Microscopy
4.2.1. Analysis of the Large-Format Scan
4.2.2. Petrographic-Mineralogical Analysis
Interpretation
4.3. Scanning Electron Microscopy (SEM) with Energy Dispersive Spectroscopy (EDS)
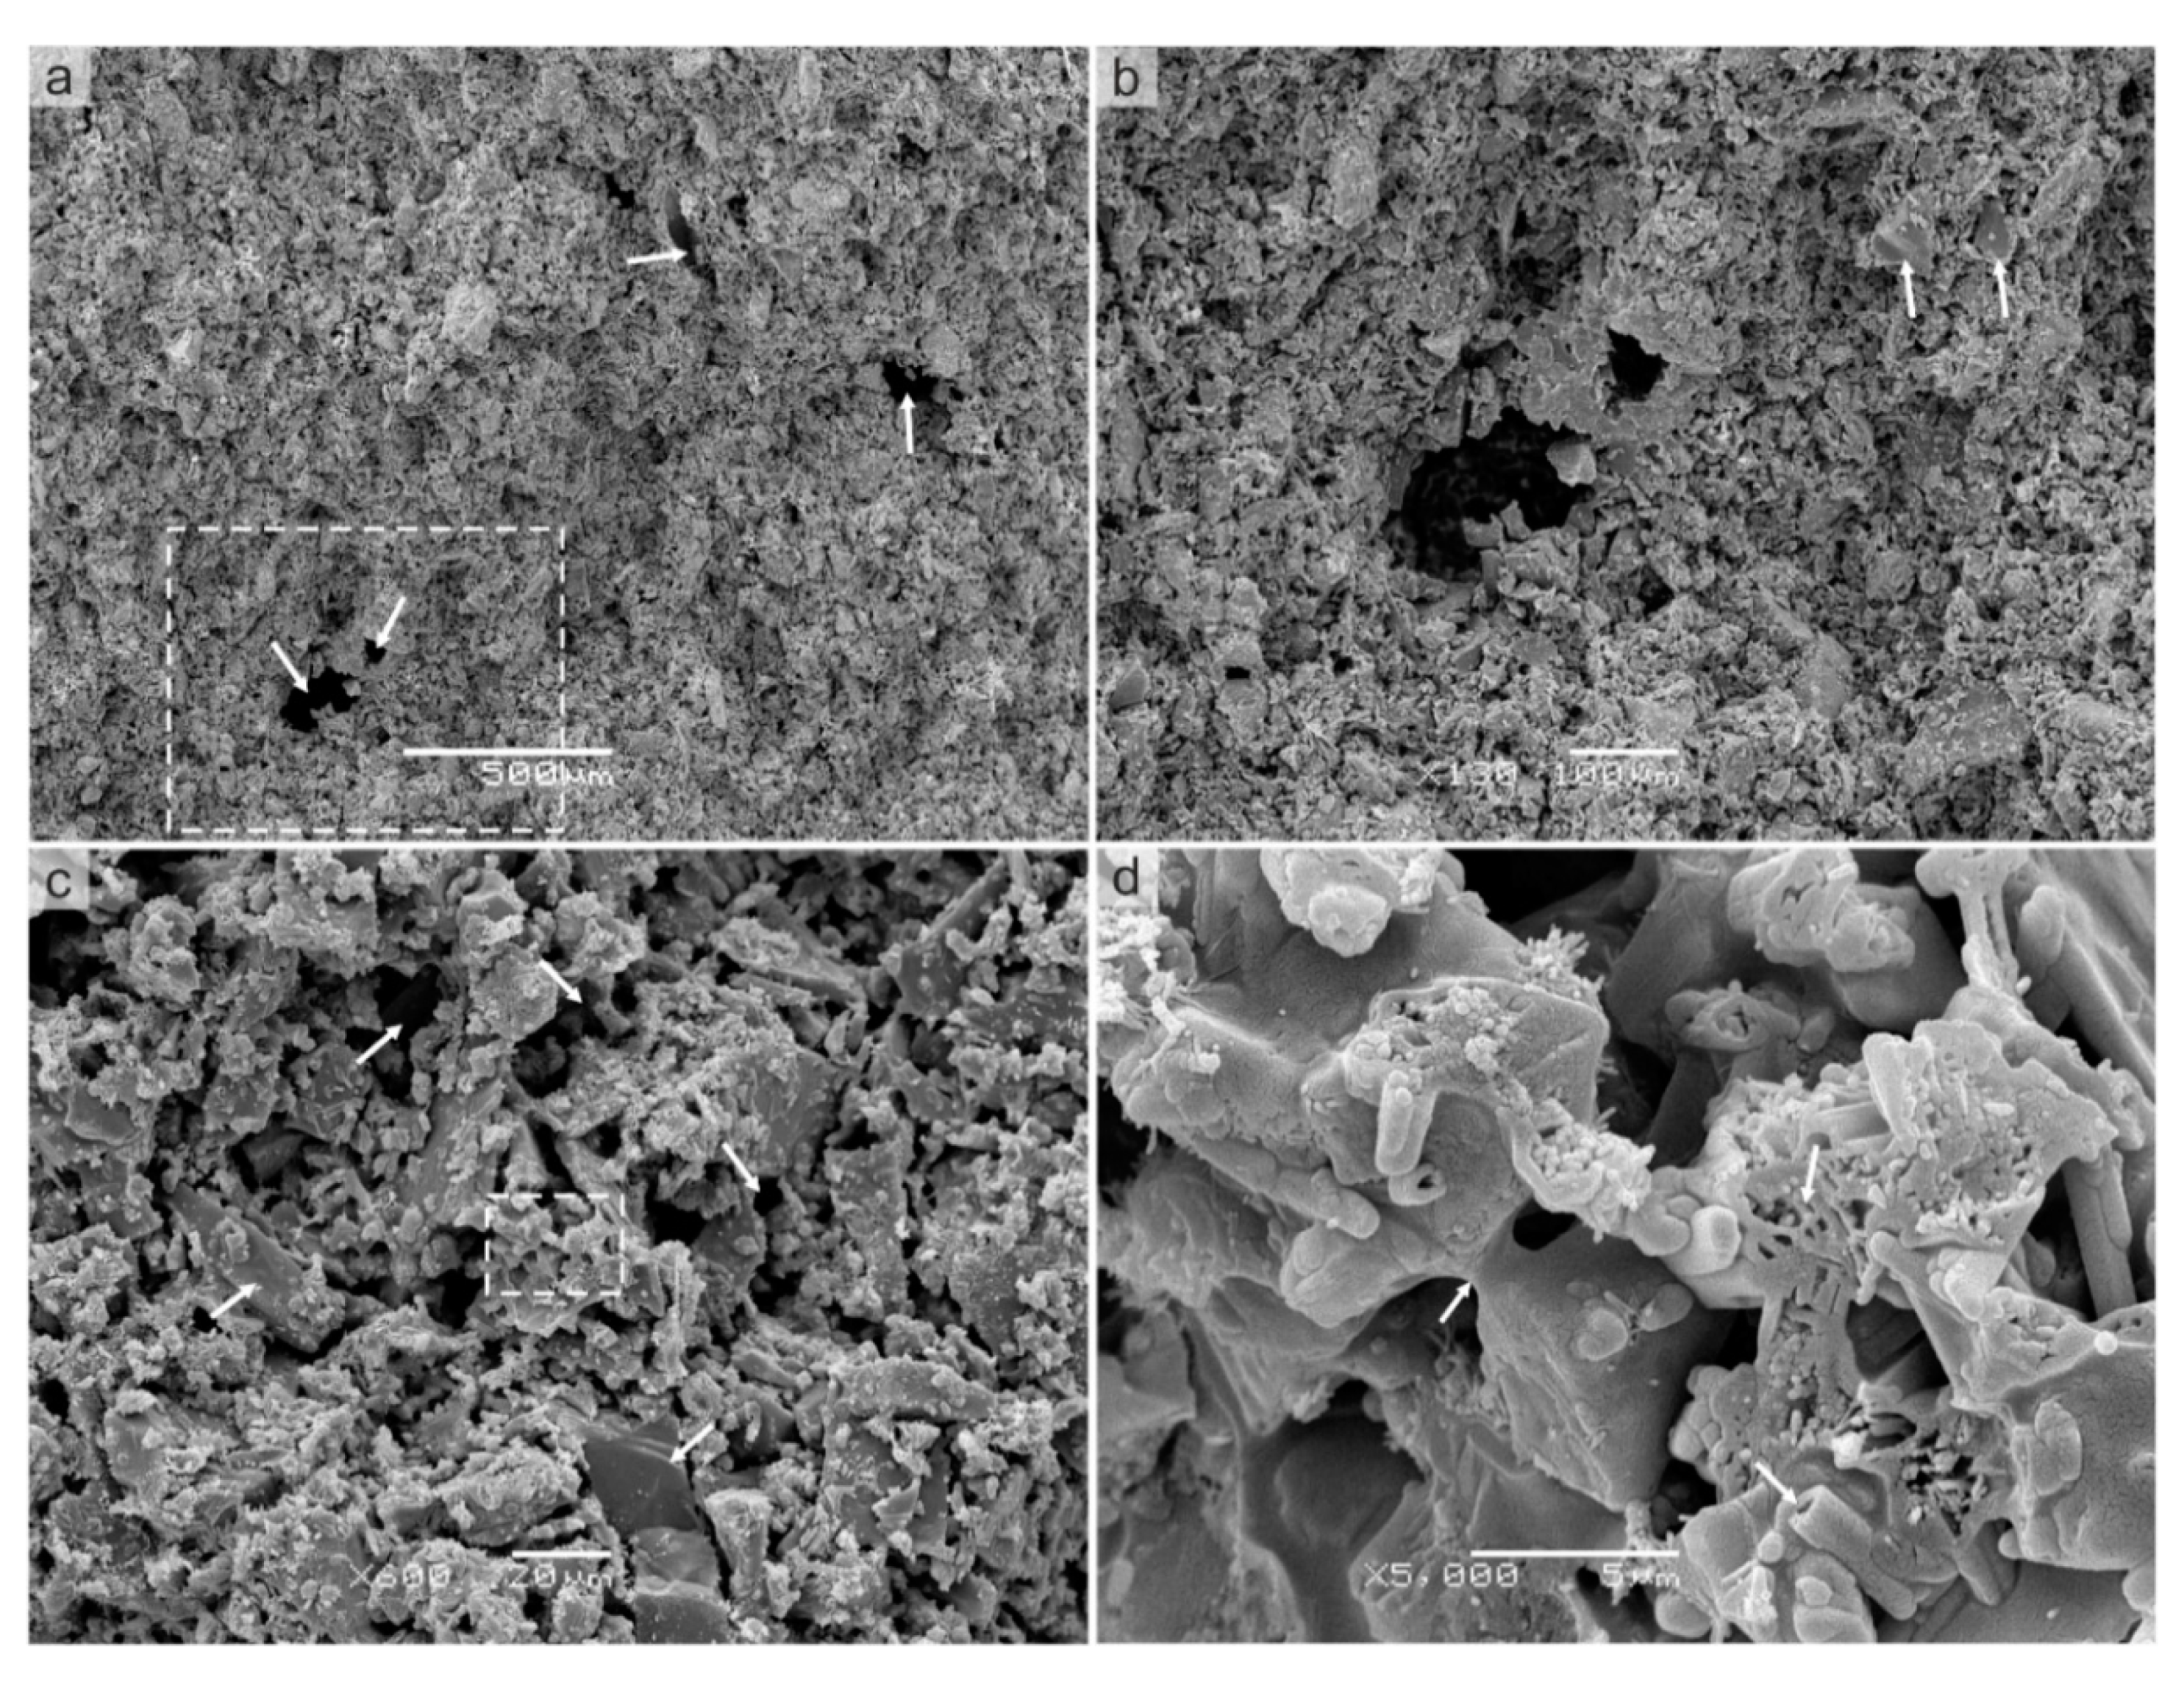
4.3.1. Microstructure—MS Fresh Fracture
Interpretation
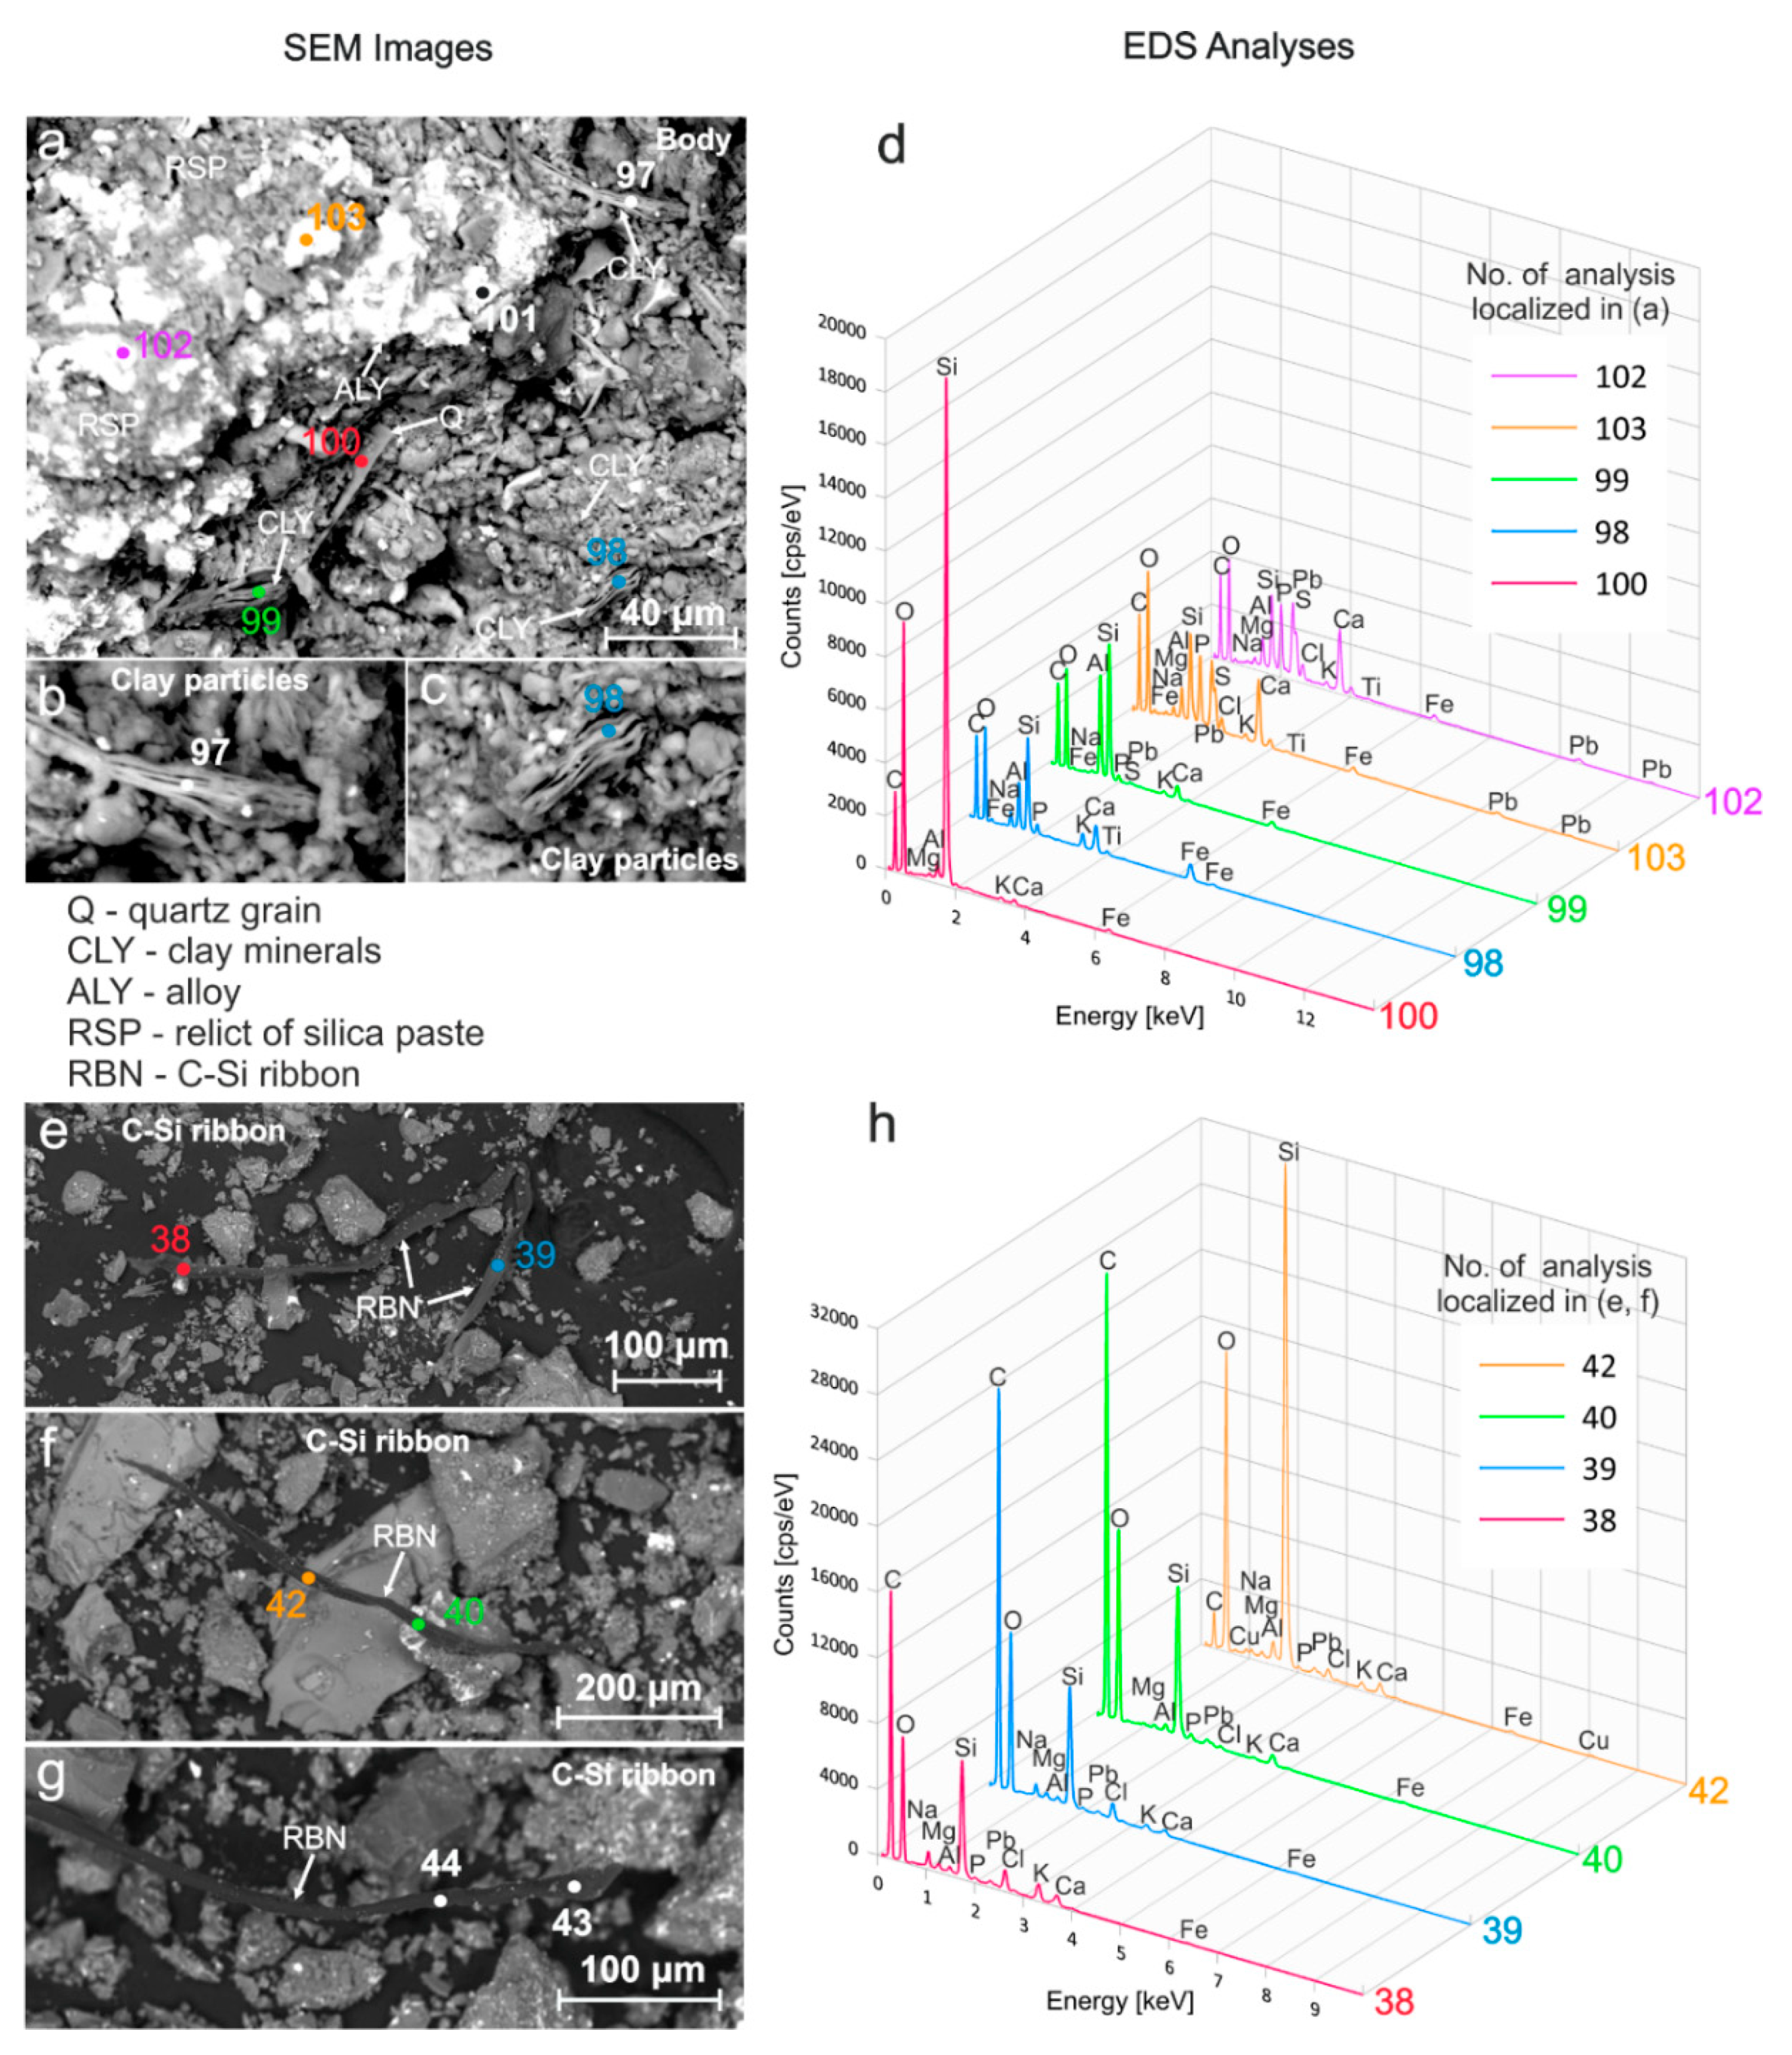
4.3.2. Microstructure and Elemental Composition—Fragments of the Faience Layered Structure
Interpretation
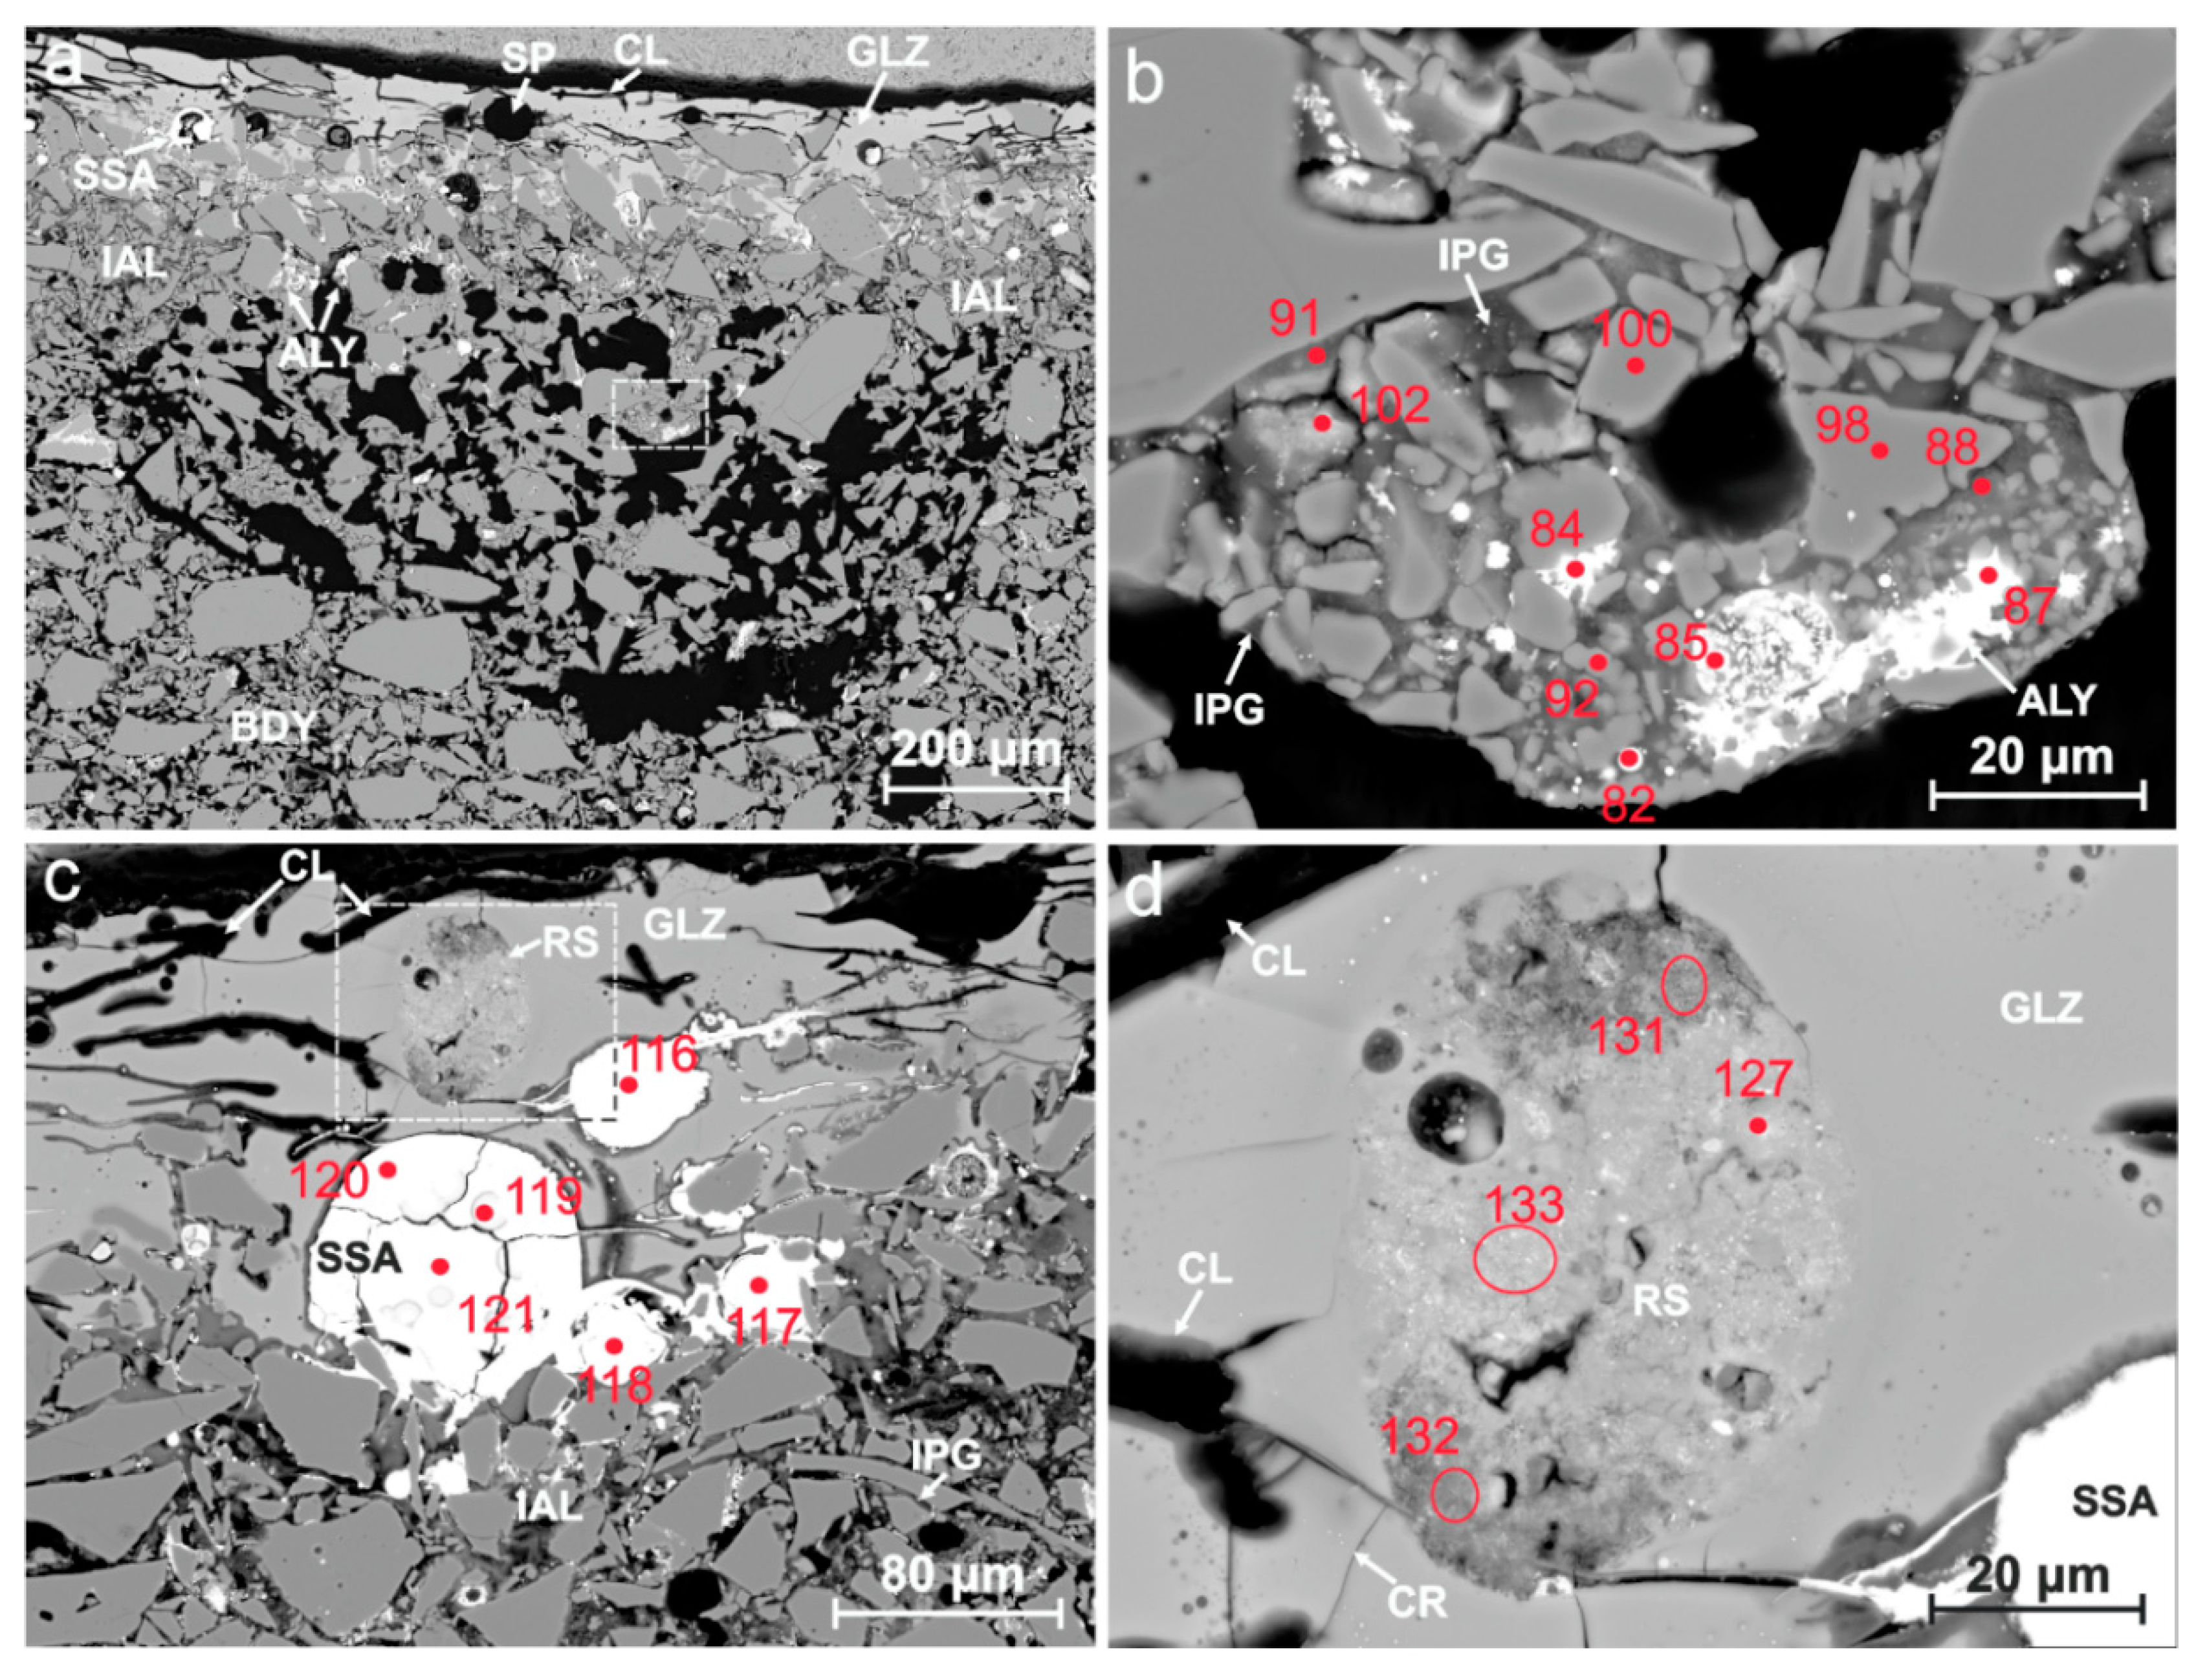
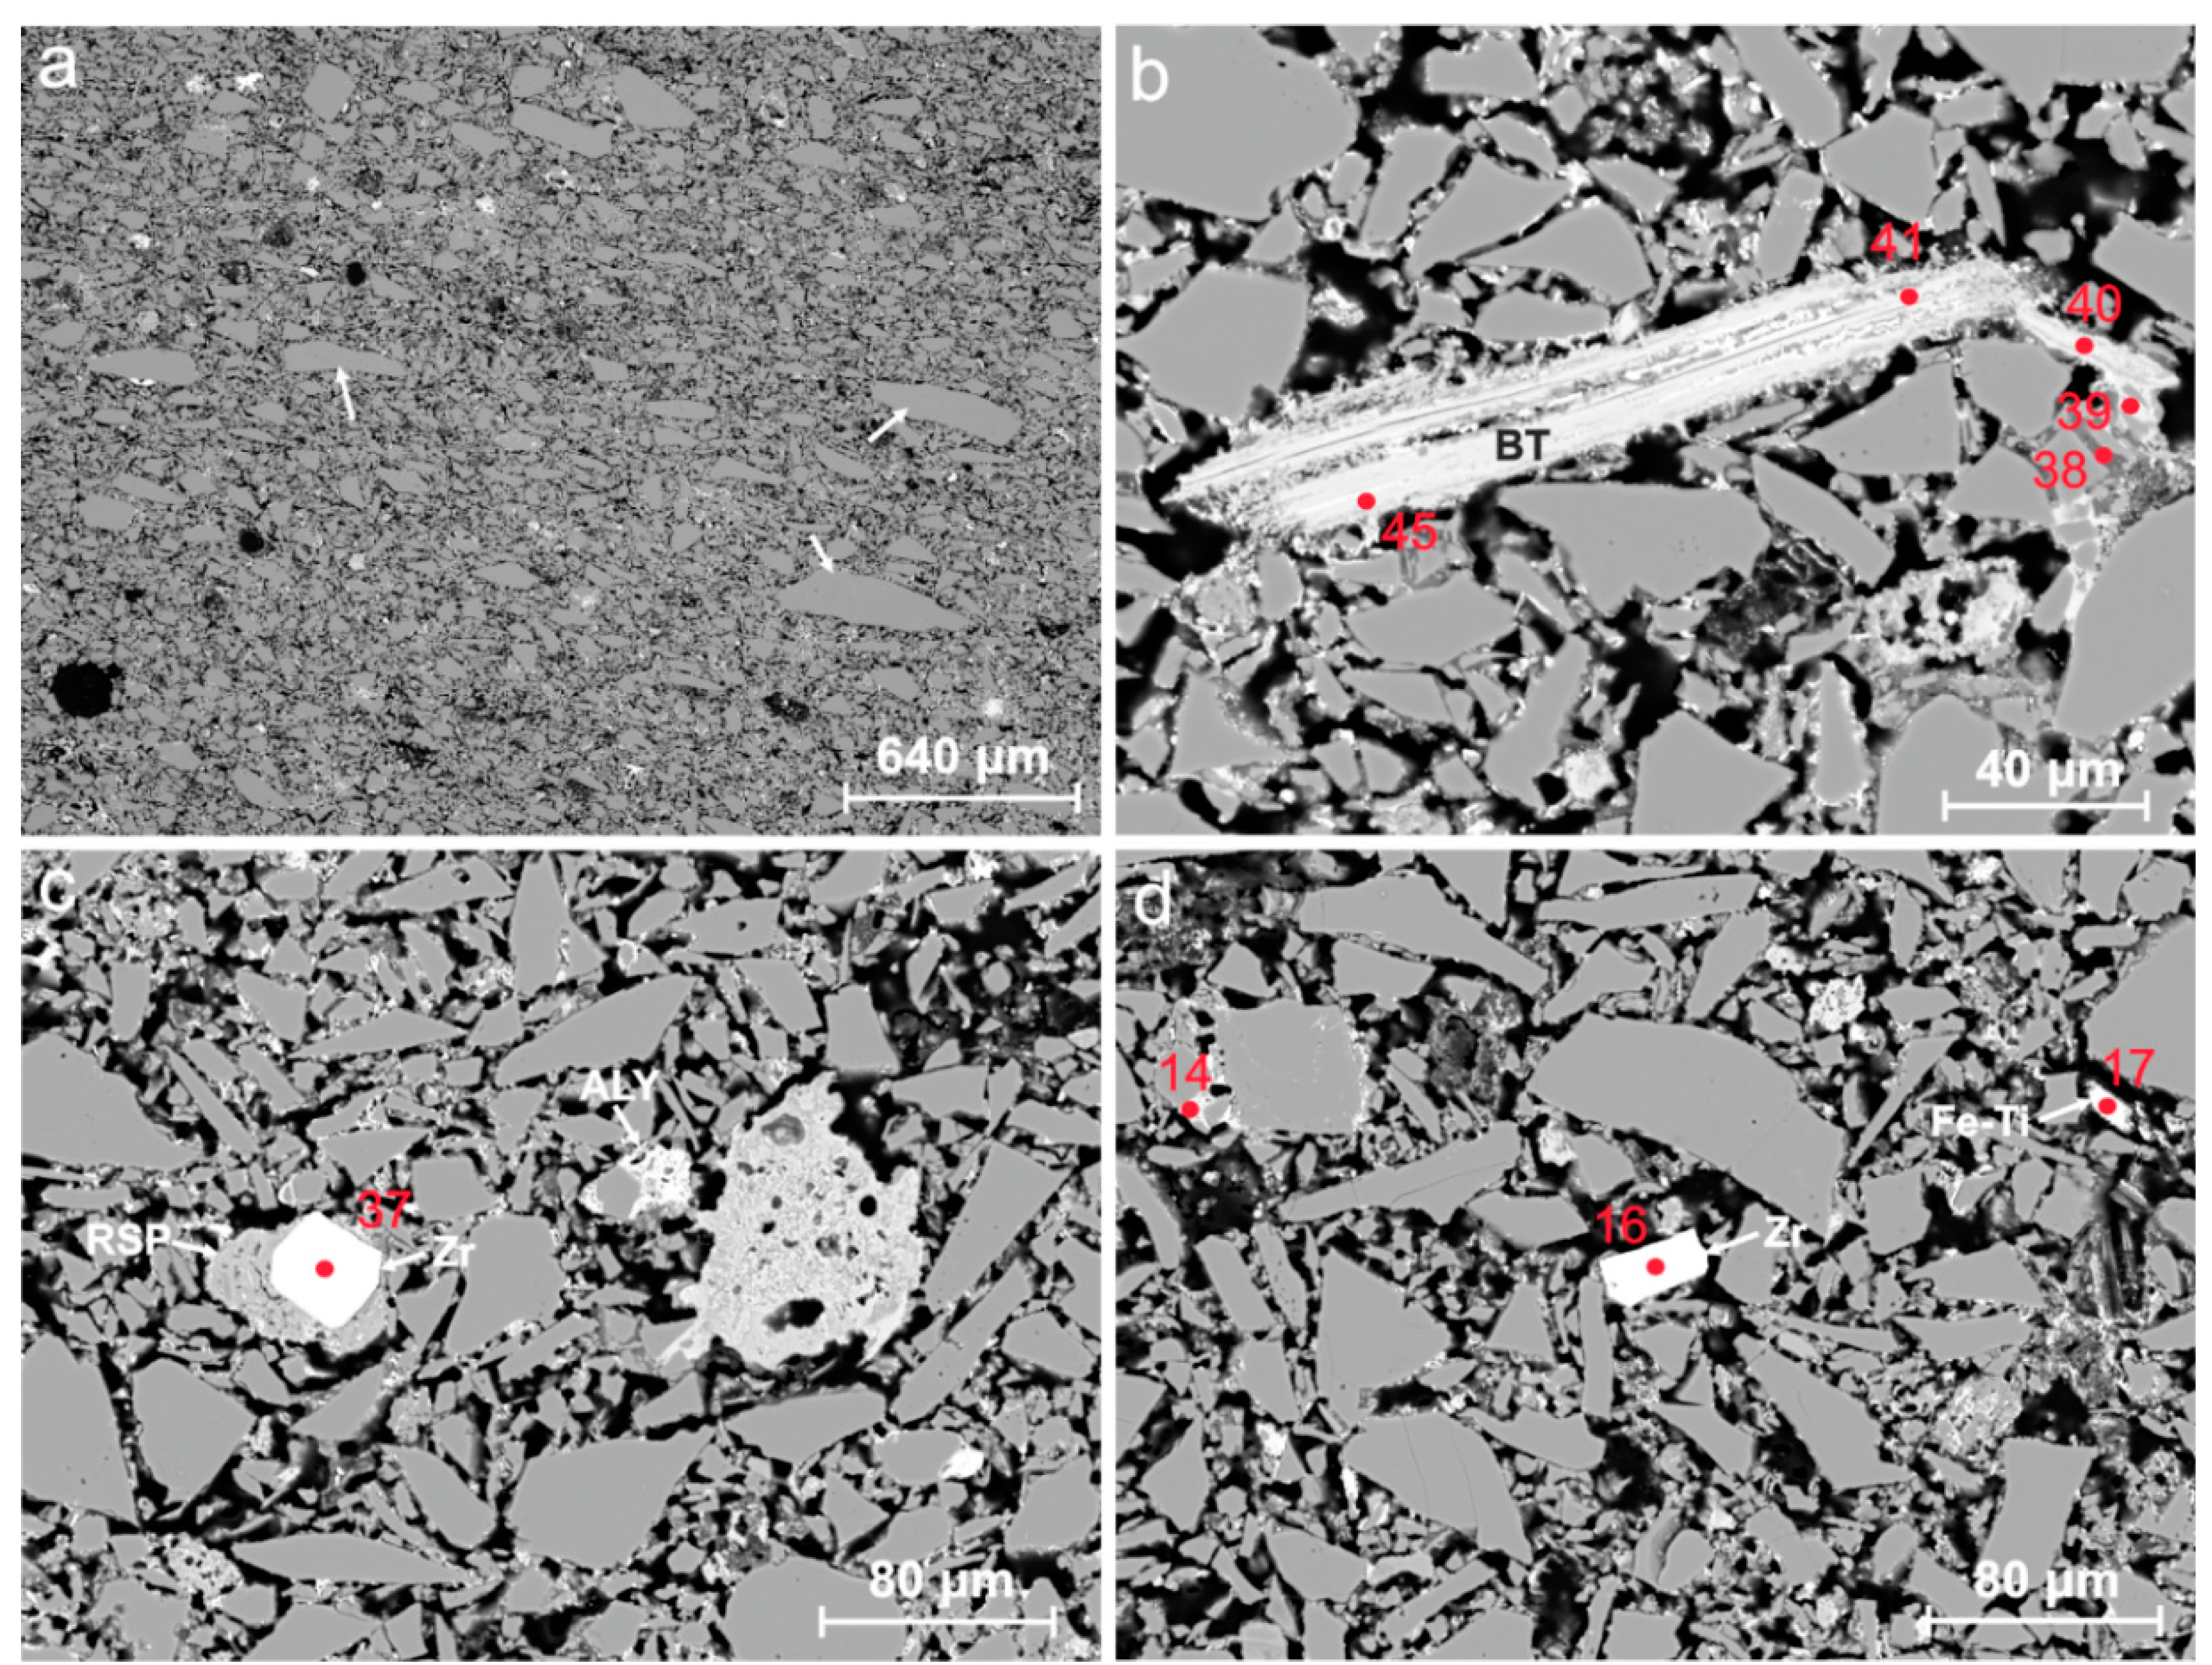
4.3.3. Microstructure and Elemental Composition—MS Thin Section
Glaze Layer
Interaction Layer
Body Layer
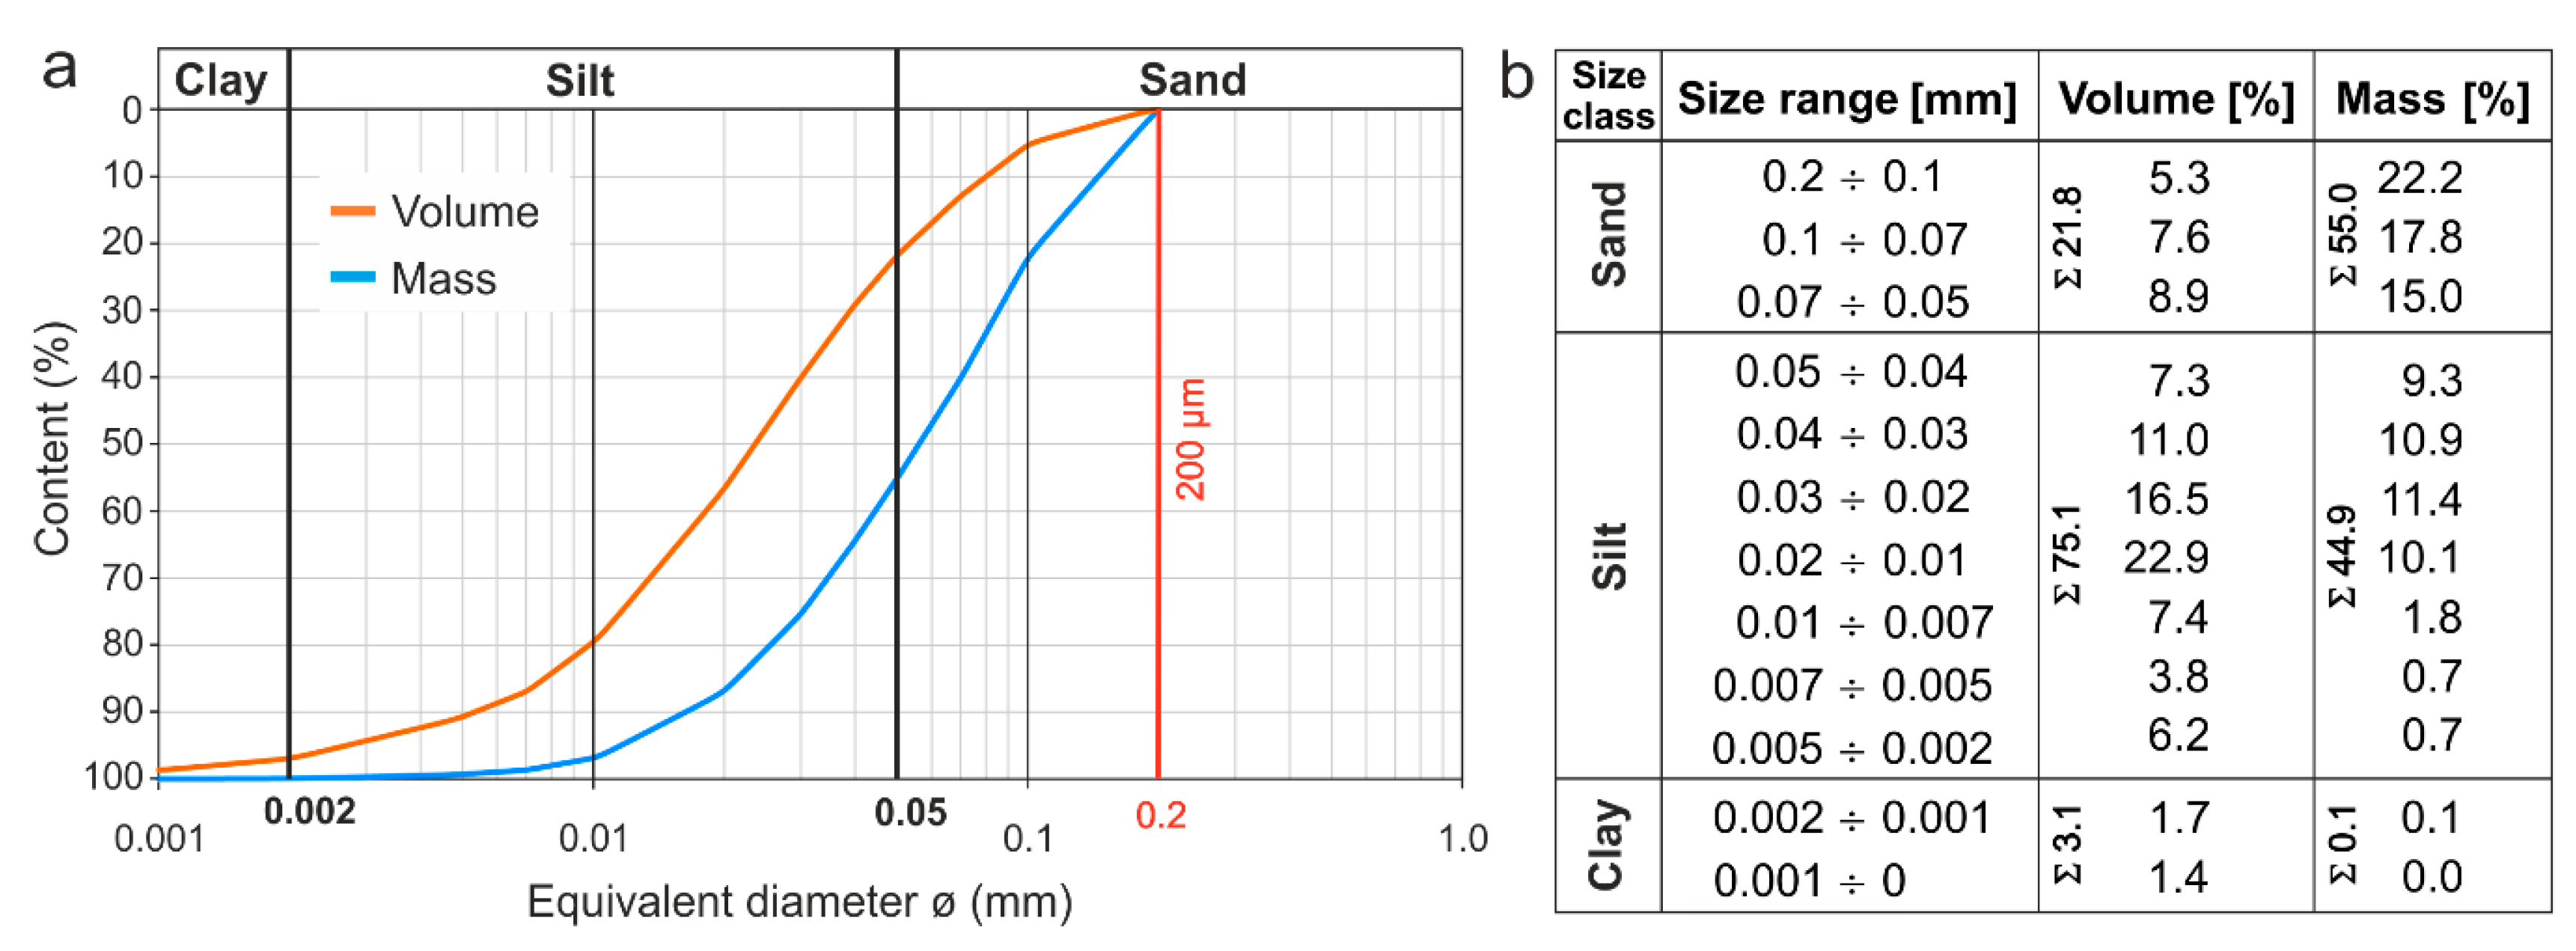
4.4. Image Analysis
4.4.1. Grain Skeleton
4.4.2. Pore Space
Interpretation
4.5. X-ray Powder Diffraction (XRD)
Interpretation
4.6. Physical Properties
Interpretation
4.7. Simultaneous Thermal Analysis (STA): TG-DSC with Evolved Gas Analysis (EGA): FTIR-QMS
Interpretation
5. Reconstruction of the Moulding and Firing Processes
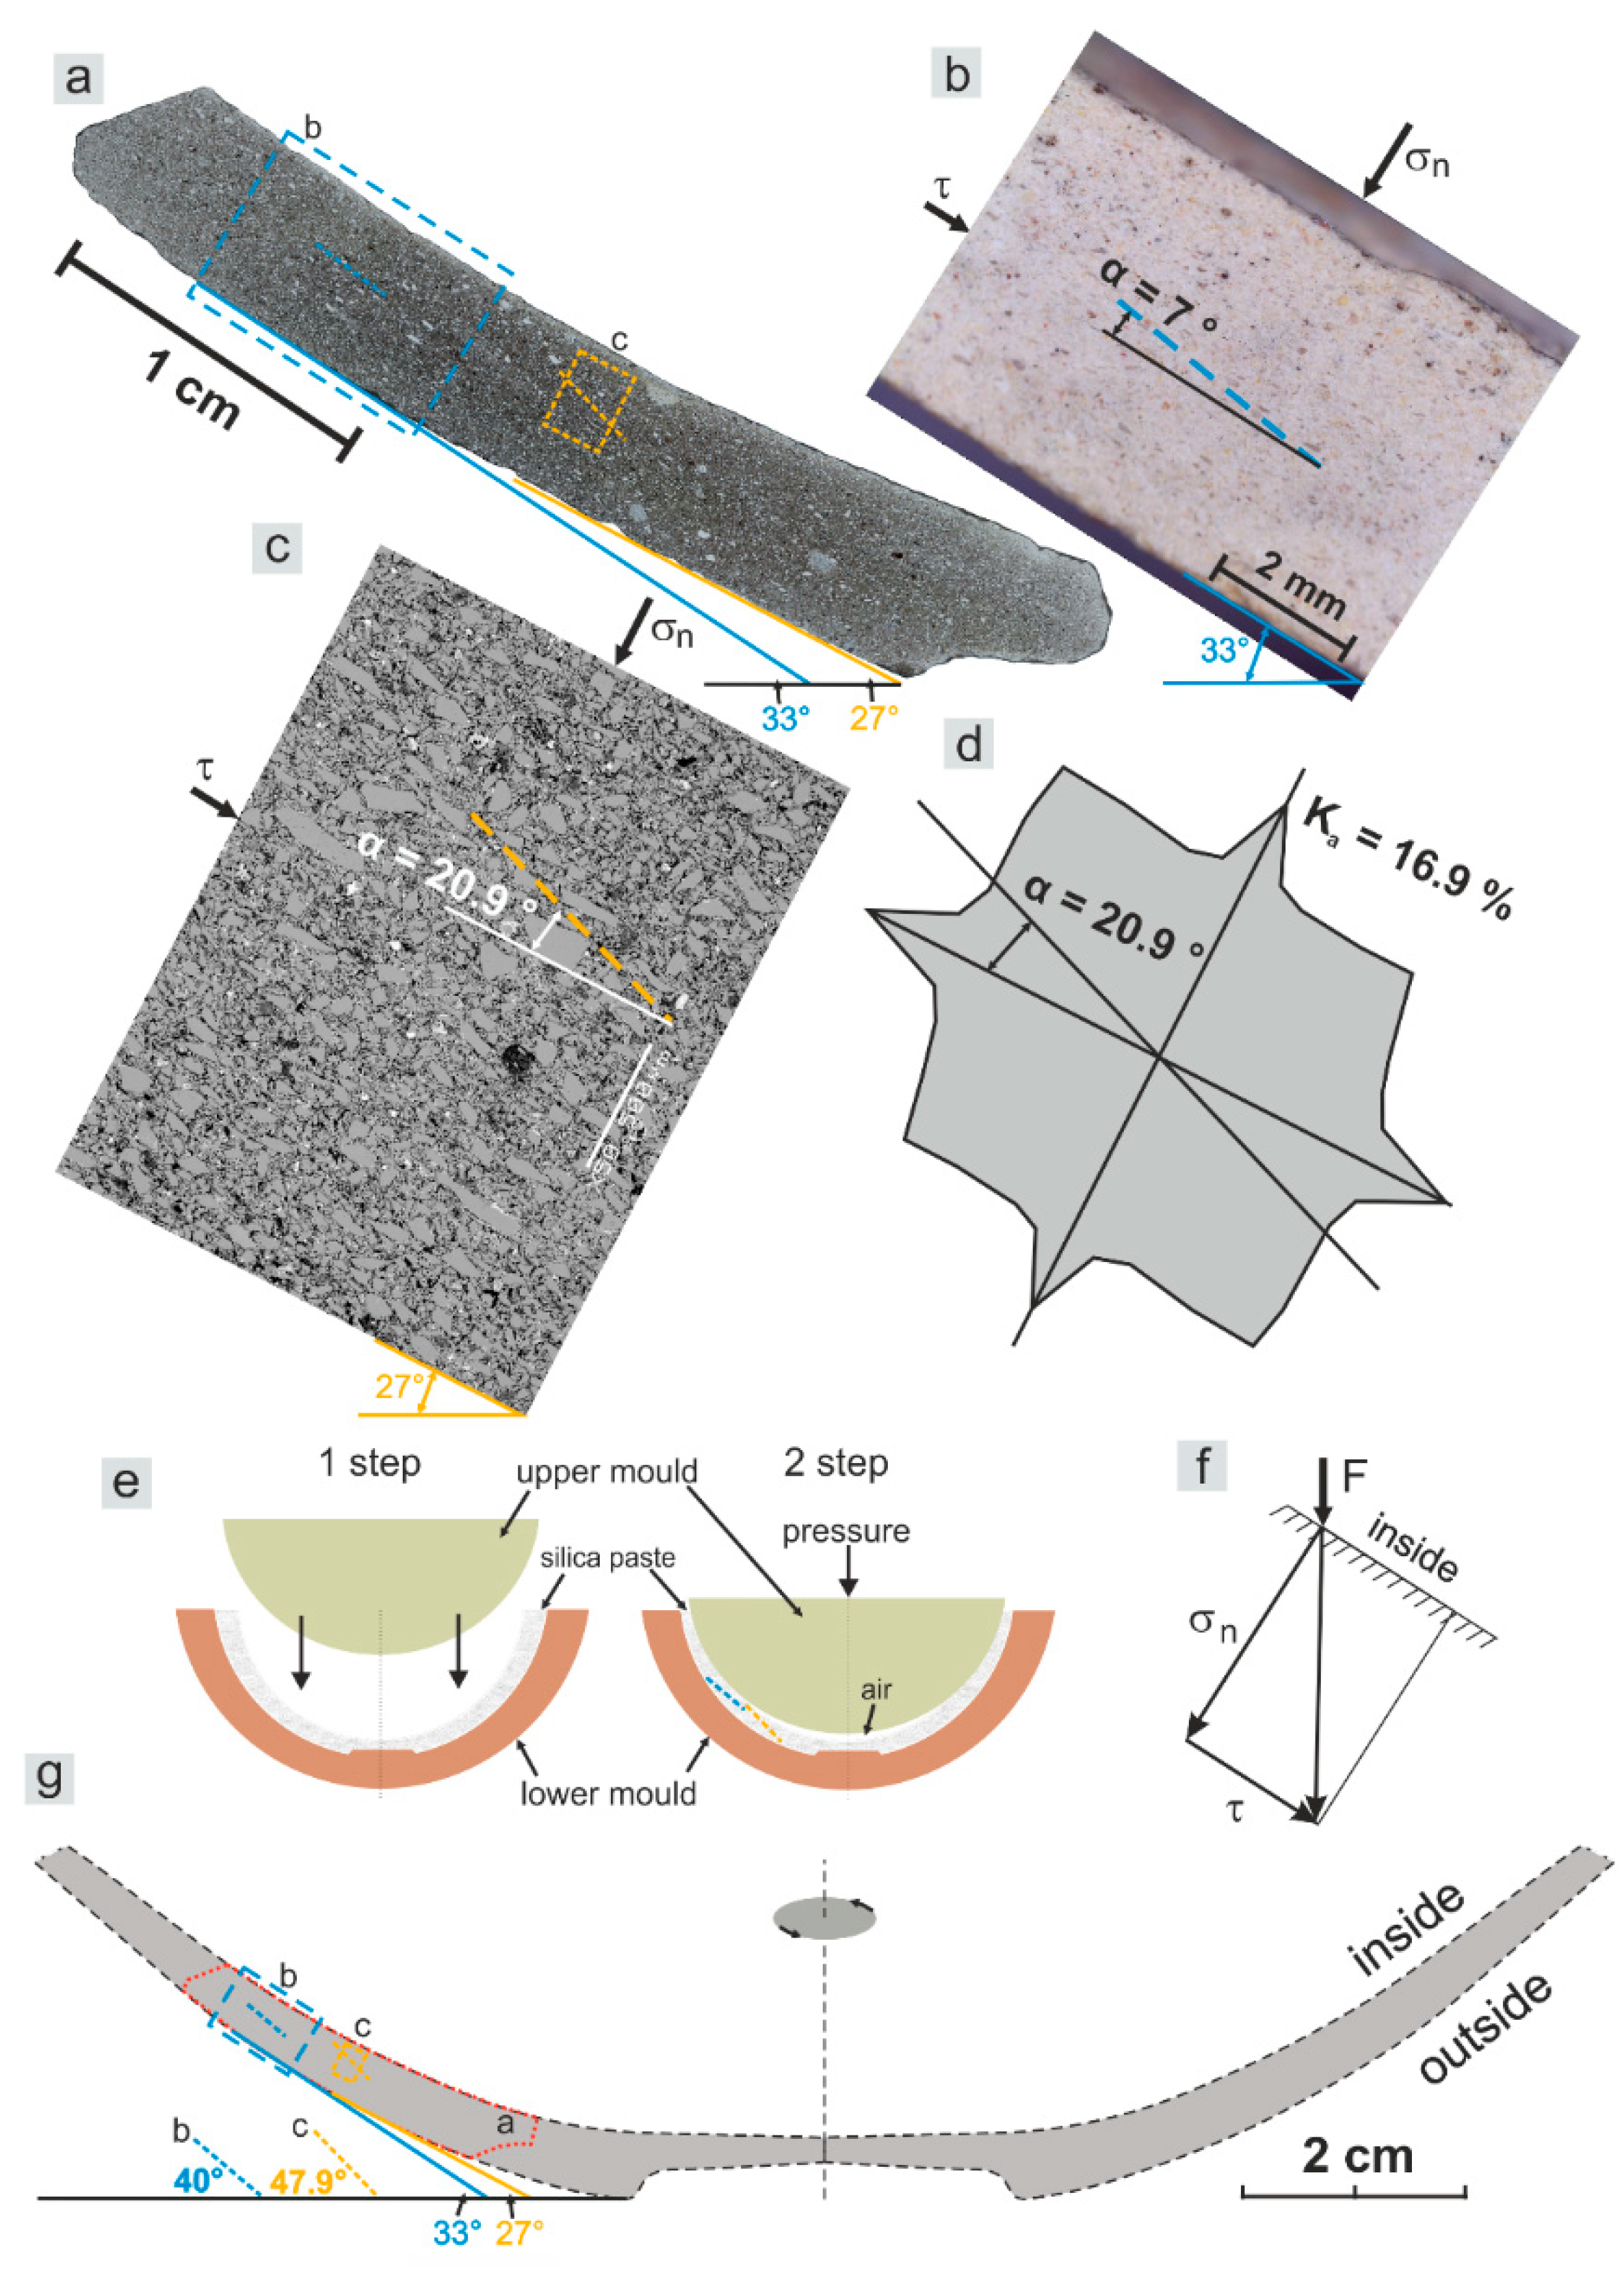
5.1. Moulding
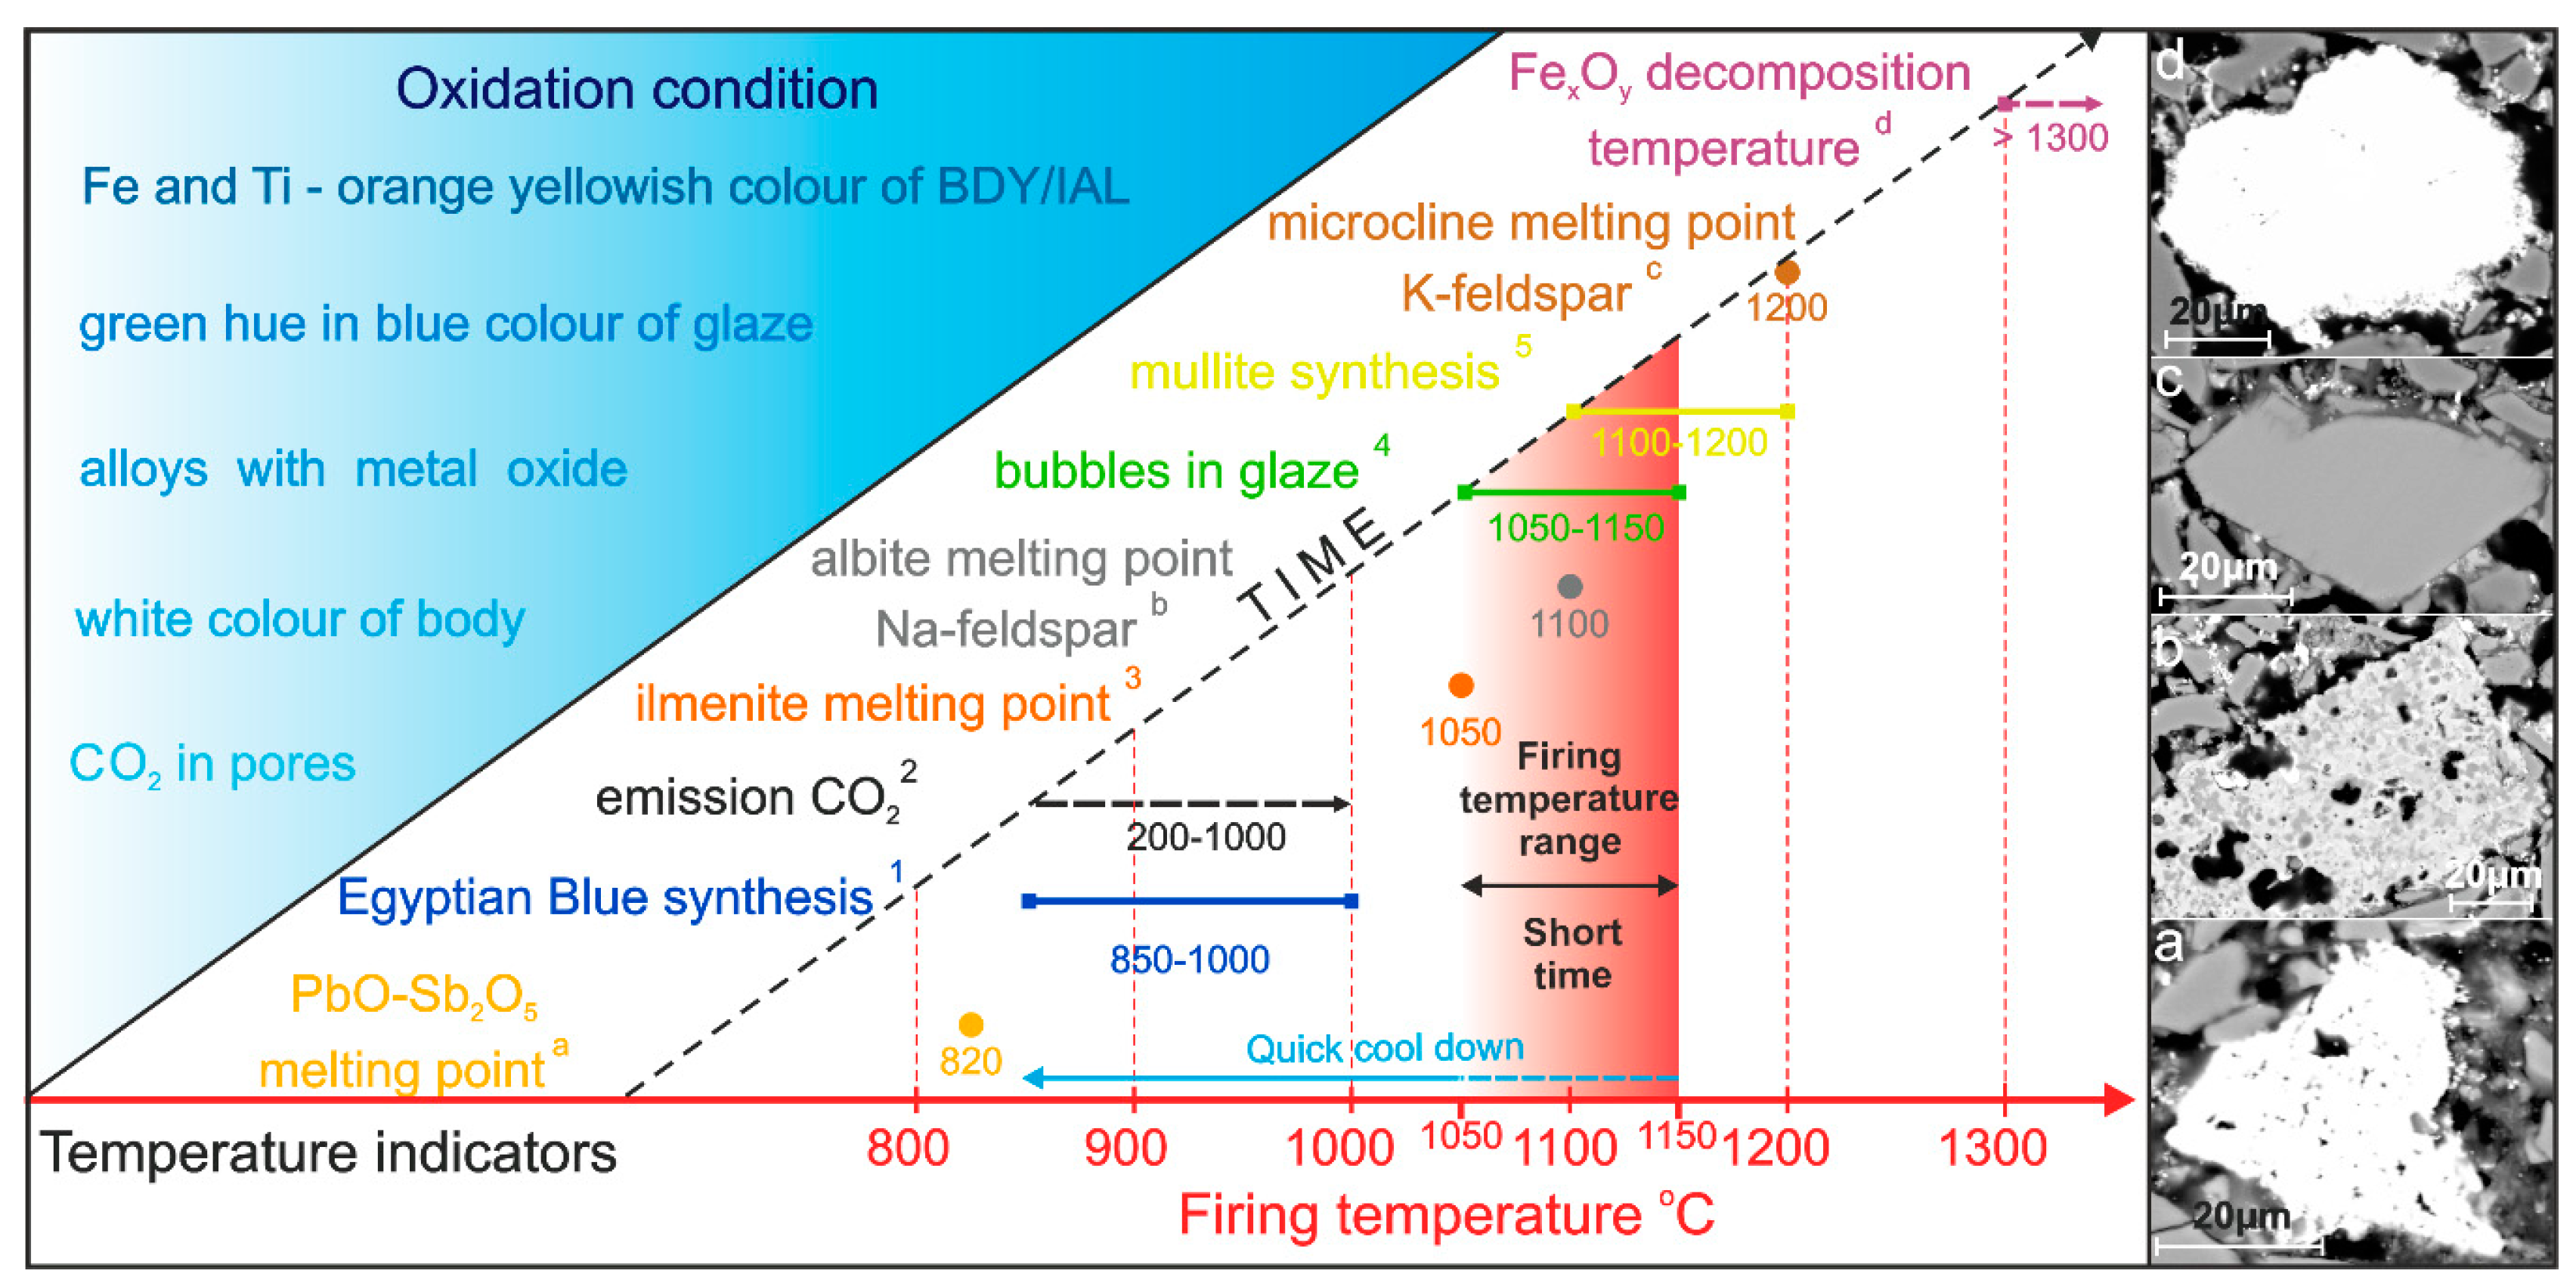
5.2. Firing
6. Discussion
6.1. Raw Materials—Silica Paste
6.2. Binders
6.3. Moulding
6.4. Glaze Slurry and Glazing
6.5. Firing
6.6. Methodological Recommendations
7. Conclusions
Supplementary Materials
Author Contributions
Funding
Acknowledgments
Conflicts of Interest
References
- Vandiver, P.B.; Kingery, W.D. Egyptian Faience, The First High-Tech Ceramic. In Ceramics and Civilization III: High-Technology Ceramics. Past, Present and Future; Kingery, W.D., Ed.; American Ceramics Society: Columbia, OH, USA, 1987; pp. 19–34. [Google Scholar]
- Nicholson, P.T. Egyptian Faience and Glass; Shire Publications LTD.: Buckinghamshire, UK, 1993. [Google Scholar]
- Welc, F. IV Tell Atrib 1985–1995. Faience Objects; University of Warsaw Press: Warsaw, Poland, 2014. [Google Scholar]
- Kaczmarczyk, A.; Hedges, R.E.M. Ancient Egyptian Faience: An Analytical Survey of Egyptian Faience from Predynastic to Roman Times; Aris & Phillips: Warminster, UK, 1983. [Google Scholar]
- Vandiver, P.B. Egyptian faience technology, Appendix A. In Ancient Egyptian Faience; Kaczmarczyk, A., Hedges, R.E.M., Eds.; Aris and Phillips: Warminster, UK, 1983; pp. A1–A144. [Google Scholar]
- Tite, M.S.; Freestone, I.C.; Bimson, M. Egyptian faience: An investigation of the methods of production. Archaeometry 1983, 25, 17–27. [Google Scholar] [CrossRef]
- Tite, M.S.; Bimson, M. Faience: An investigation of the microstructures associated with the different methods of glazing. Archaeometry 1986, 28, 69–78. [Google Scholar] [CrossRef]
- Vandiver, P. Egyptian faience technology. In Archaeological Ceramics; Franklin, A.D., Olin, J.S., Eds.; Smithsonian Institution Press: Washington, DC, USA, 1982; pp. 167–179. [Google Scholar]
- Tite, M.S.; Shortland, A.J.; Kaczmarczyk, A.; Vandiver, P. Faience production in Egypt. In Production Technology of Faience and Related Early Vitreous Materials; Shortland, A., Tite, M.S., Eds.; Oxford University School of Archaeology: Oxford, UK, 2008; pp. 57–91. [Google Scholar]
- Matin, M.; Matin, M. Egyptian faience glazing by the cementation method part 1: An investigation of the glazing powder composition and glazing mechanism. J. Archaeol. Sci. 2012, 39, 763–776. [Google Scholar] [CrossRef]
- Wulff, H.E. The Traditional Crafts of Persia, 1st ed.; MIT Press: Cambridge, UK, 1966. [Google Scholar]
- Petrie, W.M.F. Tell el Amarna; Methuen & Co.: London, UK, 1894. [Google Scholar]
- Nenna, M.D.; Seif el-Din, M. La Vaisseelle en Faience d’Epoque Gréco-Romaine, Catalogue du Musée Gréco-Romain d’Alexandrie; Institut Français d’Archéologie Orientale: Cairo, Egypt, 2000. [Google Scholar]
- Shortland, A.J.; Tite, M.S. Technological study of Ptolemaic—Early roman faience from Memphis, Egypt. Archaeometry 2005, 47, 31–46. [Google Scholar] [CrossRef]
- Mao, Y. Lead-Alkaline Glazed Egyptian Faience: Preliminary Technical Investigation of Ptolemaic Period Faience Vessels in the Collection of the Walters Art Gallery. J. Am. Inst. Conserv. 2000, 39, 185–204. [Google Scholar] [CrossRef]
- Scholl, T.; Daszkiewicz, M.; Raabe, J. Kilns from the Ptolemaic Period in Tell Atrib. Etudes Trav. 1995, 27, 279–307. [Google Scholar]
- Nicholson, P.T.; Jackson, C.M. Tell el-Amarna and the glassmakers’ workshop of the second millennium B.C. In La Route Du Verre. Ateliers Primaires Et Secondaires Du Second Millenaire Av. J.-C. Au Moyen Age; Nenna, M.-D., Ed.; Maison de l’Orient Méditerranéen: Lyon, France, 2000; pp. 11–20. [Google Scholar]
- Nicholson, P.T. Working in Memphis, The Production of Faience at Roman Period Kom Helul; Egypt Exploration Society: London, UK, 2013. [Google Scholar]
- Michałowski, K. Les fouilles polonaises à Tell Atrib (1957–1959). Ann. Serv. Antiq. l’Égypte 1962, 57, 49–66. [Google Scholar]
- Kołodziejczyk, K. Report of the Polish Archaeological Mission’s Excavations at Tell Atrib in 1963. Etudes Trav. 1972, 6, 137–145. [Google Scholar]
- Młynarczyk, J. Egyptian Types of Terracotta Lamps from Tell Atrib. Etudes Trav. 1973, 7, 81–113. [Google Scholar]
- Ruszczyc, B. Tell Atrib. In 50 lat Polskich Wykopalisk w Egipcie i na Bliskim Wschodzie; Kiss, Z., Ed.; Polish Centre of Mediterranean Archaeology: Warsaw, Poland, 1986; pp. 29–34. [Google Scholar]
- Myśliwiec, K. Polish-Egyptian excavations at Tell Atrib in 1989. In Polish Archaeology in the Mediterranean I Reports 1988–1989; Koliński, R., Ed.; Polish Centre of Mediterranean Archaeology: Warsaw, Poland, 1990; Volume 1, pp. 5–9. [Google Scholar]
- Myśliwiec, K. Polish-Egyptian excavations at Tell Atrib in 1990. In Polish Archaeology in the Mediterranean II: Reports 1989–1990; Gawlikowski, M., Daszewski, W.A., Eds.; Polish Centre of Mediterranean Archaeology: Warsaw, Poland, 1991; Volume 2, pp. 25–30. [Google Scholar]
- Szymańska, H. Tell Atrib. Excavations, 1998. In Polish Archaeology in the Mediterranean X: Reports 1998; Gawlikowski, M., Daszewski, W.A., Eds.; Polish Centre of Mediterranean Archaeology: Warsaw, Poland, 1999; Volume 10, pp. 71–76. [Google Scholar]
- Myśliwiec, K. In the Ptolemaic Workshops of Athribis. Egypt. Archaeol. 1996, 9, 34–36. [Google Scholar]
- Myśliwiec, K. Rescue Excavations at Tell Atrib in 1985–1995. In Tell Atrib 1985–1995 I; Myśliwiec, K., Sztetyłło, Z., Eds.; ZAŚ PAN & Neriton: Warsaw, Poland, 2000; pp. 13–68. [Google Scholar]
- Myśliwiec, K. Contexte archeologique. In Tell Atrib 1985-1995 II; Myśliwiec, K., Krzyżanowska, A., Eds.; ZAŚ PAN & Neriton: Warsaw, Poland, 2009; pp. 9–49. [Google Scholar]
- Młynarczyk, J. Terracotta Oil Lamps. Tell Atrib 1985-1995 III; IKŚiO & Neriton: Warsaw, Poland, 2012. [Google Scholar]
- Welc, F. Faiences from Greco-Roman Athribis. Ph.D. Thesis, University of Warsaw, Warsaw, Poland, 2009. [Google Scholar]
- Sztetyłło, Z. Pottery stamps. In Tell Atrib 1985–1995 I; Myśliwiec, K., Sztetyłło, Z., Eds.; ZAŚ PAN & Neriton: Warsaw, Poland, 2000; pp. 53–168. [Google Scholar]
- Krzyżanowska, A. Les monnaies. In Tell Atrib 1985–1995 II; Myśliwiec, K., Krzyżanowska, A., Eds.; ZAŚ PAN & Neriton: Warsaw, Poland, 2009; pp. 75–204. [Google Scholar]
- Myśliwiec, K. Polish-Egyptian excavations at Tell Atrib in 1994. In Polish Archaeology in the Mediterranean VI: Reports 1994; Gawlikowski, M., Daszewski, W.A., Eds.; Polish Centre of Mediterranean Archaeology: Warsaw, Poland, 1995; Volume 6, pp. 37–47. [Google Scholar]
- Welc, F. Decorated Ptolemaic faience bowl from Athribis (Tell Atrib), Nile Delta. Etudes Trav. 2011, 24, 243–270. [Google Scholar]
- Sergeyev, Y.M.; Spivak, G.V.; Sasov, A.Y.; Osipov, V.I.; Sokolov, V.N.; Rau, E.I. Quantitative morphological analysis in a SEM–microcomputer system–I. Quantitative shape analysis of single objects. J. Microsc. 1984, 135, 1–12. [Google Scholar] [CrossRef]
- Sergeyev, Y.M.; Spivak, G.V.; Sasov, A.Y.; Osipov, V.I.; Sokolov, V.N.; Rau, E.I. Quantitative morphological analysis in a SEM–microcomputer system–II. Morphological analysis of complex SEM images. J. Microsc. 1984, 135, 13–24. [Google Scholar] [CrossRef]
- Sokolov, V.N.; Yurkovets, D.I.; Razgulina, O.V. Stiman (Structural Image Analysis): A Software for Quantitative Morphological Analysis of Structures by Their Images (User’s Manual. Version 2.0); Laboratory of Electron Microscopy, Moscow State University: Moscow, Russia, 2002. [Google Scholar]
- Trzciński, J. Combined SEM and computerized image analysis of clay soils microstructure: Technique & application. In Advances in Geotechnical Engineering: The Skempton Conference, Proceedings of the Three Day Conference on Advances in Geotechnical Engineering, Royal Geographical Society, London, UK, 29–31 March 2004; Jardine, R.J., Potts, D.M., Higgins, K.G., Eds.; Thomas Telford: London, UK, 2004; pp. 654–666. [Google Scholar]
- Grabowska–Olszewska, B.; Osipov, V.I.; Sokolov, V.N. Atlas of the Microstructure of Clay Soils; Państwowe Wydawnictwo Naukowe: Warsaw, Poland, 1984. [Google Scholar]
- Smart, P.; Tovey, K. Electron Microscopy of Soils and Sediments: Techniques; Oxford University Press: Oxford, UK, 1982. [Google Scholar]
- Sokolov, V.N. Engineering–geological classification of clay microstructures. In Proceedings of the 6th International Congress IAEG, Amsterdam, The Netherlands, 6–10 August 1990; Price, D.G., Ed.; CRC Press: Cleveland, OH, USA, 1990; pp. 753–760. [Google Scholar]
- BS 1377-2: 1990 Methods of Test for Soils for Civil Engineering Purposes-Part 2: Classification Tests; British Standards Institution: London, UK, 1990; pp. 26–27.
- Simonis, H. Practical Suggestions for Control of Glaze Defects. Pt. 2. Keram. Z. 1980, 32, 593. [Google Scholar]
- Taylor, J.R.; Bull, A.C. Ceramics Glaze Technology; Pergamon Press: Oxford, UK, 1986. [Google Scholar]
- Zhang, H.; Ding, W.; He, K.; Li, M. Synthesis and Characterization of Crystalline Silicon Carbide Nanoribbons. Nanoscale. Res. Lett. 2010, 5, 1264–1271. [Google Scholar] [CrossRef] [PubMed]
- Britt, J. The Complete Guide to High-Fire Glazes; Lark Books: New York, NY, USA, 2007. [Google Scholar]
- Mohamed, N.; Chin, Y.M.; Pok, M.W. Leaching of lead from local ceramic tableware. Food Chem. 1995, 54, 245–249. [Google Scholar] [CrossRef]
- Garzanti, E.; Andò, S.; Limonta, M.; Fielding, L.; Najman, Y. Diagenetic control on mineralogical suites in sand, silt, and mud (Cenozoic Nile Delta): Implications for provenance reconstructions. Earth Sci. Rev. 2018, 185, 122–139. [Google Scholar] [CrossRef]
- Shen, Y.J.; Zhang, Y.L.; Gao, F.; Yang, G.S.; Lai, X.P. Influence of Temperature on the Microstructure Deterioration of Sandstone. Energies 2018, 11, 1753. [Google Scholar] [CrossRef]
- Lai, G.Y. High-Temperature Corrosion and Materials Applications; ASM International: Materials Park, OH, USA, 2007. [Google Scholar]
- Flörke, O.W.; Graetsch, H.; Jones, J.B. Hydrothermal deposition of cristobalite. N. Jb. Miner. Mh. 1990, 2, 81–95. [Google Scholar]
- Levine, E.M.; Robbins, R.; McMurdie, H.F.; Reser, M.R. Phase Diagrams for Ceramicists; American Ceramic Society: Columbus, OH, USA, 1964. [Google Scholar]
- Pradell, T.; Salvado, N.; Hatton, G.D.; Tite, M.S. Physical Processes Involved in Production of the Ancient Pigment, Egyptian Blue. J. Am. Ceram. Soc. 2006, 89, 1426–1431. [Google Scholar] [CrossRef]
- Greenwood, J.P.; Hess, P.C. Congruent melting kinetics of albite: Theory and experiment. J. Geophys. Res. Solid Earth 1998, 103, 29815–29828. [Google Scholar] [CrossRef]
- Xiong, L. Glaze Surface Tension Effects on Bubble Evolution. Master’s Thesis, Alfred University, Alfred, NY, USA, 2004. [Google Scholar]
- Kearey, P. The Encyclopedia of the Solid Earth Sciences, 2nd ed.; Wiley-Blackwell: Oxford, UK, 2009. [Google Scholar]
- Fang, H.Y.; Chaney, R.C. Introduction to Environmental Geotechnology, 1st ed.; CRC Press: Boca Raton, FL, USA, 1997. [Google Scholar]
- Samsonov, G.V. The Oxide Handbook, 2nd ed.; IFI/Plenum: New York, NY, USA, 1982. [Google Scholar]
- Simmonds, T.E. The High Temperature Decomposition of Hematite under Reactive Gas Atmospheres: For the Use in Chemical Looping Combustion. Master’s Thesis, The University of Queensland, St. Lucia, Australia, 2017. [Google Scholar]
- Tite, M.S.; Panagiota, M.; Shortland, A.J. A technological study of ancient faience from Egypt. J. Archaeol. Sci. 2007, 34, 1568–1583. [Google Scholar] [CrossRef]
- Ruszczyc, B. Tell Atrib Register of finds. Unpublished work. 1980. [Google Scholar]
- Myśliwiec, K. Tell Atrib Register of finds. Unpublished work. 1985. [Google Scholar]
- Myśliwiec, K. Tell Atrib Register of finds. Unpublished work. 1986. [Google Scholar]
- Said, R. The Geological Evolution of the River Nile; Springer: New York, NY, USA, 1981. [Google Scholar]
- Wysocka, A.; Welc, F.; Czarniecka, U. Sedimentary environment of the early Pleistocene gravels of the Edfu Formation from the Saqqara archaeological site (Egypt)—Preliminary results. Studia Quat. 2016, 33, 69–78. [Google Scholar] [CrossRef]
- Myśliwiec, K. Polish-Egyptian Excavations at Tell Atrib in 1991-1993. Etudes Trav. 1995, 17, 205–239. [Google Scholar]
- Myśliwiec, K.; Południkiewicz, A. A center of ceramic production in Ptolemaic Athribis. In Egyptian Pottery, Proceedings of the 1990 Pottery Symposium at the University of California, University of California, Berkeley, NC, USA, 2003; Redmount, C., Keller, C., Eds.; Regents of the University of California: Berkeley, NC, USA, 2003; pp. 133–152. [Google Scholar]
- Południkiewicz, A. Unfired Pottery from Ceramic Workshops at Tell Atrib with Appendix by Daszkiewicz, M., Raabe, J., The Clay and Unfired Ceramic Fragments from Tell Atrib—Preliminary Report on Technological Investigations. In Hellenistic and Roman Pottery in the Eastern Mediterranean—Advances in scientific studies, Acts of the II Nieborów Pottery Workshop, Nieborów, Poland, 18–20 December 1993; Meyza, H., Młynarczyk, J., Eds.; ZAŚ PAN: Warsaw, Poland, 1995; pp. 299–329. [Google Scholar]
- Jones, J.B.; Segnit, E.R. Genesis of cristobalite and tridymite at low temperatures. J. Geol. Soc. Aust. 1972, 18, 419–422. [Google Scholar] [CrossRef]
- Nenna, M.-D. Les artisanats du verre et de la faïence: Tradition et renouvellement dans l’Égypte gréco-romaine. In L’Apport de l’Égypte à l’Histoire des Techniques: Méthodes, Chronologie et Comparaisons; Mathieu, B., Meeks, D., Wissa, M., Eds.; Institut Français d’Archéologie Orientale: Cairo, Egypt, 2006. [Google Scholar]
- Myśliwiec, K. Tell Atrib field journal. Unpublished work. 1992. [Google Scholar]
- Kaczmarczyk, A.; Nenna, M.D. Analyses de faïences égyptiennes d’époque hellénistique et romaine conserves au musée du Louvre. In Alexandrina 4, En l’Honneur de Mervat Seif el-Din; Empereur, J.Y., Ed.; Centre d’Études Alexandrines: Alexandria, Egypt, 2014. [Google Scholar]
- Thompson, H.A. Two Centuries of Hellenistic Pottery. Hesperia 1934, 3, 311–476. [Google Scholar] [CrossRef]
- Tite, M.S.; Freestone, I.; Molera, J.; Vendrell-Saz, M.; Wood, N. Lead glazes in antiquity-methods of production and reasons for use. Archaeometry 1998, 40, 241–260. [Google Scholar] [CrossRef]
- Myślwiec, K. Tell Atrib field journal. Unpublished work. 1991. [Google Scholar]
- Kołodziejczyk, K.; Łajtar, A.; Pawlikowski, M. Fragments d’enduits peints de Tell Atrib. Etudes Trav. 1999, 18, 99–160. [Google Scholar]
- Południkiewicz, A. Arts and crafts workshops in Ptolemaic Athribis (Egypt). In De la Gaule à l’Orient Méditerranéen. Fonctions et Statuts des Mobiliers Archéologiques dans leur Context; Ballet, P., Lemaître, S., Bertrand, I., Eds.; Presses Universitaires de Rennes, IFAO: Rennes, France, 2018; pp. 317–324. [Google Scholar]
- Bontempi, E.; Benedetti, D.; Massardi, A.; Zacco, A.; Borgese, L.; Depero, L.E. Laboratory two-dimensional X-ray microdiffraction technique: A support for authentication of an unknown Ghirlandaio painting. Appl. Phys. A 2008, 92, 155–159. [Google Scholar] [CrossRef]


| Grain Skeleton | Value | Pore Space | Value |
|---|---|---|---|
| Relative grains area s (%) | 77.9 | Porosity n (%) | 31.4 |
| Number of grains Ns × 103 | 811 | Number of pores Np × 103 | 154 |
| Total area of grains Sst × 103 (µm2) | 4051 | Total area of pores Spt × 103 (µm2) | 1434 |
| Average area of grains Ssav (µm2) | 9487 | Average area of pores Spav (µm2) | 9.3 |
| Total perimeter of grains Pst × 103 (µm) | 4060 | Total perimeter of pores Ppt × 103 (µm) | 1234 |
| Average perimeter of grains Psav (µm) | 203 | Average perimeter of pores Ppav (µm) | 8 |
| Average diameter of grains Dsav (µm) | 5.5 | Average diameter of pores Dpav (µm) | 1.1 |
| Sand Ø > 50 µm (%) | 21.8 | Mesopores 10 < Ø < 1000 µm (%) | 16.3 |
| Silt 2 < Ø < 50 µm (%) | 75.1 | Micropores 0.1 < Ø < 10 µm (%) | 83.7 |
| Clay Ø < 2 µm (%) | 3.1 | Ultrapores Ø < 0.1 µm (%) | 0 |
| Average form index of grains Ksfav (-) * | 0.421 | Average form index of pores Kpfav (-) * | 0.444 |
| Isometric grains (%) | 14.1 | Isometric pores (%) | 14.4 |
| Anisometric grains (%) | 79.8 | Anisometric pores (%) | 81.2 |
| Elongated grains (%) | 6.1 | Fissure pores (%) | 4.4 |
© 2020 by the authors. Licensee MDPI, Basel, Switzerland. This article is an open access article distributed under the terms and conditions of the Creative Commons Attribution (CC BY) license (http://creativecommons.org/licenses/by/4.0/).
Share and Cite
Zaremba, M.; Trzciński, J.; Rogulska, M.; Kaproń, G.; Welc, F.; Południkiewicz, A. A Multiproxy Approach to the Reconstruction of an Ancient Manufacturing Technology: A Case Study of a Faience Ptolemaic Bowl from Tell Atrib (Nile Delta). Minerals 2020, 10, 785. https://doi.org/10.3390/min10090785
Zaremba M, Trzciński J, Rogulska M, Kaproń G, Welc F, Południkiewicz A. A Multiproxy Approach to the Reconstruction of an Ancient Manufacturing Technology: A Case Study of a Faience Ptolemaic Bowl from Tell Atrib (Nile Delta). Minerals. 2020; 10(9):785. https://doi.org/10.3390/min10090785
Chicago/Turabian StyleZaremba, Małgorzata, Jerzy Trzciński, Magdalena Rogulska, Grzegorz Kaproń, Fabian Welc, and Anna Południkiewicz. 2020. "A Multiproxy Approach to the Reconstruction of an Ancient Manufacturing Technology: A Case Study of a Faience Ptolemaic Bowl from Tell Atrib (Nile Delta)" Minerals 10, no. 9: 785. https://doi.org/10.3390/min10090785
APA StyleZaremba, M., Trzciński, J., Rogulska, M., Kaproń, G., Welc, F., & Południkiewicz, A. (2020). A Multiproxy Approach to the Reconstruction of an Ancient Manufacturing Technology: A Case Study of a Faience Ptolemaic Bowl from Tell Atrib (Nile Delta). Minerals, 10(9), 785. https://doi.org/10.3390/min10090785