Article

Role of Mg Impurity in the Water Adsorption over Low-Index Surfaces of Calcium Silicates: A DFT-D Study

1
School of Resources and Safety Engineering, Central South University, Changsha 410083, China
2
School of Civil, Environmental and Mining Engineering, University of Western Australia, Perth 6009, Australia
3
School of Molecular Sciences, University of Western Australia, Perth 6009, Australia
*
Author to whom correspondence should be addressed.
Minerals 2020, 10(8), 665; https://doi.org/10.3390/min10080665
Submission received: 5 June 2020 / Revised: 2 July 2020 / Accepted: 21 July 2020 / Published: 26 July 2020
(This article belongs to the Special Issue First Principles Calculations of Minerals and Related Materials)

Abstract

:
Calcium silicates are the most predominant phases in ordinary Portland cement, inside which magnesium is one of the momentous impurities. In this work, using the first-principles density functional theory (DFT), the impurity formation energy (Efor) of Mg substituting Ca was calculated. The adsorption energy (Ead) and configuration of the single water molecule over Mg-doped β-dicalcium silicate (β-C2S) and M3-tricalcium silicate (M3-C3S) surfaces were investigated. The obtained Mg-doped results were compared with the pristine results to reveal the impact of Mg doping. The results show that the Efor was positive for all but one of the calcium silicates surfaces (ranged from −0.02 eV to 1.58 eV), indicating the Mg substituting for Ca was not energetically favorable. The Ead of a water molecule on Mg-doped β-C2S surfaces ranged from –0.598 eV to −1.249 eV with the molecular adsorption being the energetically favorable form. In contrast, the Ead on M3-C3S surfaces ranged from −0.699 eV to −4.008 eV and the more energetically favorable adsorption on M3-C3S surfaces was dissociative adsorption. The influence of Mg doping was important since it affected the reactivity of surface Ca/Mg sites, the Ead of the single water adsorption, as well as the adsorption configuration compared with the water adsorption on pristine surfaces.

Graphical Abstract

1. Introduction

Population growth has driven the exponential increase in infrastructure demand, especially in developing countries like China and India [1,2]. As the main ingredients within construction materials, ordinary Portland cement (OPC) is thus attracting considerable attention. Many studies have been conducted not only for the efficient use of OPC, but also to reduce energy consumption and CO2 emission during OPC production [3,4]. However, the fine-tuning of OPC requires a more fundamental understanding of its hydration mechanism, which is vital for the sustainable development of the cement industry and effective application of cement-based materials [5].
OPC consists of four main compounds, namely alite (50–70 wt.%), belite (15–30 wt.%), aluminate (5–10 wt.%), and ferrite (5–15 wt.%). Alite and belite are the impurity-modified constituents of tricalcium silicate (Ca3SiO5 or C3S) and dicalcium silicate (Ca2SiO4 or C2S), respectively. In contrast to aluminate (Ca3Al2O6) and ferrite (Ca2AlxFe2-xO5, 0 ≤ x ≤ 1.4) [6], C3S and C2S are often referred to as calcium silicates and, in most cases, control the hydration characteristics of OPC [7]. Since phenomenological experiments could only provide an overall indicator for the cement hydration reactions, the theoretical method is a promising alternative to reveal the hydration mechanism of calcium silicates [8].
The structural and electronic properties of calcium silicates have been theoretically investigated using first-principles calculations or molecular dynamics [9,10,11,12,13,14,15]. For example, Durgun et al. [16] utilized first-principles calculations to reveal the relationship between the reactivity and electronic structure of calcium silicates. It was found that the high reactivity of C3S originated mainly from the reactive sites around its more ionic oxygen atoms compared with that of C2S. Laanaiya et al. [17] conducted a density functional theory (DFT) study to analyze the ground state properties of C3S, with an emphasis on investigating the reaction mechanism of C3S. Apart from the structural and electronic properties of calcium silicates, the water adsorption on calcium silicates surfaces, which is often regarded as the initial step for cement hydration [18,19], has also been studied. For example, Zhang et al. [13] conducted a DFT study to reveal the single water adsorption on C3S low-index surfaces and analyzed the electronic properties of the adsorption. Qi et al. [12] investigated the molecular and dissociative water adsorption on low-index surfaces of both β-C2S and M3-C3S. Other relevant studies regarding the water adsorption on calcium silicates surfaces include, but not limited to, Zhang et al. [20,21], Qi et al. [22], and Wang et al. [23]. However, the above studies mainly focus on the structural and electronic properties of pure calcium silicates, which is rarely observed in practice [7].
It is known that the most common impurities include Mg2+, Al3+, and Fe3+, which can substitute Ca2+ in calcium silicates [11]. Understanding the role of impurities is vital to reveal the hydration mechanism of calcium silicates [24]. A number of studies have thus been conducted to investigate the impact of chemical impurities on the structural and electronic properties of bulk calcium silicates [11,16,25,26,27]. For example, Tao et al. [26] investigated the Zn incorporation into silicate clinker using DFT calculations and proposed two indicators to characterize the Zn-doping mechanism. It was found that the preference of the zinc substitution was mainly controlled by the overall crystal deformation and local structural distortion. However, the impact of chemical impurities in the water adsorption over low-index surfaces of calcium silicates has not been well studied at the atomic level using first-principles DFT calculations.
In this work, the adsorption of a single water molecule over Mg-doped low-index surfaces of calcium silicates was investigated. Bader charge analysis was performed for the selection of doping sites and the impurity formation energy (Efor) was calculated. The water adsorption was investigated in both a molecular and dissociative way. The adsorption energy (Ead) was calculated and the adsorption configuration was analyzed. Electronic properties, i.e., Bader charge, the partial density of states (PDOS), and decomposed charge density, were studied to reveal the binding mechanism of the water molecule over Mg-doped calcium silicates surfaces. A detailed comparison was conducted on the structural and electronic properties before and after water adsorption, and the results of water adsorption over Mg-doped calcium silicates surfaces were compared with that over pristine calcium silicates surfaces.

2. Computational Methods

In this work, β-C2S and M3-C3S morphologies were investigated due to their frequent occurrence during industrial applications of OPC [28,29]. All first-principles DFT calculations were conducted using the projector augmented-wave (PAW) method implemented in the VASP code [30,31,32]. The exchange-correlation potential was approximated by the Perdew-Burke-Ernzerhof (PBE) functional within the generalized gradient approximation (GGA) [33]. Valence electrons of 3p64s2, 3s2, 3s23p2, 2s22p4, and 1s1 were selected for Ca, Mg, Si, O and H, respectively. After convergence tests, the kinetic energy cutoff was determined to be 600 eV and the energy tolerance was set to be 1.0 × 10⁻⁵ eV/atom. The structural relaxation of bulk calcium silicates was conducted until the maximum residual force on each atom was smaller than 0.01 eV/Å. Interested readers can refer to our previous work [12] for a detailed discussion about the bulk structures of β-C2S and M3-C3S.
Starting from the relaxed unit cells, low-index surfaces were cleaved with the retaining of the in-plane crystalline periodicity. Stoichiometry and neutrality were maintained during the surface cleavage. Moreover, the SiO4 tetrahedron is preserved since it is energetically costly to break the Si-O covalent bond. Multiple cuts were tested to ensure the lowest energy configuration, and the slab and vacuum thicknesses were verified by convergence tests. The surface relaxation was performed without considering the symmetry between the top surface and the bottom surface [10]. Dipole correction was applied during surface calculations and the maximum residual force on each atom = 0.03 eV/Å was used as the converging criterion. For all DFT calculations, the electronic minimization was performed following the blocked Davidson iteration scheme and the ions updating was performed using the conjugate gradient algorithm. The surface energy for all low-index surfaces was calculated. Table S1 summarizes the calculation details (i.e., the Brillouin zone mesh) and the surface energy (γ) of pristine low-index surfaces of calcium silicates.
To determine the doping site of Mg, the chemical reactivity of Ca atoms was investigated. In this work, the Bader charge was calculated for surface Ca atoms since it is well regarded as an effective way to indicate surface reactivities [34,35]. The surface Ca atom with the highest chemical reactivity, namely the lowest Bader charge, was selected as the doping site of Mg. The substitution of Ca2+ with Mg2+ was performed, and then the surface slab was relaxed. The same DFT settings, i.e., energy cutoff and maximum residual force, were applied for the Mg-doped surface relaxation. The authors note that the determination of the substitution site using chemical reactivity was mainly due to the availability of computational resources. Impurity formation energy (Efor) was used as the indicator to understand the solubility of the dopants inside host lattice, which can be calculated as follows [36]:
E for = E S ( Mg ) E S ( pristine ) μ Mg + μ Ca
where ES(Mg) is the total energy of the Mg-doped slab, ES(pristine) is the total energy of the pristine slab model, and μMg and μCa are the chemical potential of Mg and Ca atoms, respectively. The μMg and μCa were calculated from the total energy per atom in their stable structures, which were relaxed using the same DFT settings for the unit cell relaxation of calcium silicates.
Molecular water adsorption involved the placement of a free water molecule 3 Å above the Mg atom (Figure 1a). In terms of the dissociative water adsorption, one hydroxyl group was placed 3 Å above the Mg atom and the remaining proton was placed 1 Å above the adjacent dominating O atom, whose reactivity was determined by the Bader charge (Figure 1b). For the water adsorption calculations, the van der Waals correction D3 was also employed [37,38,39]. The adsorption energy (Ead) can be obtained using the following equation:
E ad = E total E c l e a n E w a t e r
where Etotal is the total energy of the (water + surface) system after adsorption, Eclean is the total energy of the clean surface slab before adsorption, and Ewater is the energy of an isolated H2O in a vacuum. Thermochemically speaking, the more negative of Ead, the more favorable of the adsorption.

3. Computational Results

3.1. Impurity Formation Energy

Table 1 summarizes the calculated Efor of Mg substituting for Ca in low-index calcium silicates surfaces. Almost all cases, except Mg substitution in M3-C3S (111) surface, were characterized by the positive Efor. More specifically, the Efor ranged from 0.51 eV to 1.21 eV for β-C2S, with 0.51 eV being observed at (101) and (111) surfaces while 1.21 eV was observed at the (001) surface. In the case of the Mg substitution in M3-C3S surfaces, the largest Efor occurred at the (101) surface (1.58 eV). A negative Efor of −0.02 eV, though quite small, was observed at the M3-C3S (111) surface. From a thermodynamic point of view, a positive Efor means the substitution is not energetically favorable [36]. Therefore, Mg substitution was unlikely to form under thermodynamically equilibrium conditions for most low-index surfaces of calcium silicates. On the contrary, only the Mg substitution on the M3-C3S (111) surface was marginally favorable in energy.

3.2. Adsorption Energy

In this section, we present our theoretical results for the Ead of the H2O over Mg-doped surfaces of β-C2S and M3-C3S. The calculated Ead are listed in Table 2.
For the H2O adsorption over β-C2S surfaces, the Ead ranged between −1.249 eV (dissociative adsorption on <100> surface) and −0.598 eV (dissociative adsorption on <011> surface). The hydroxyl group and the proton approached each other and formed a water molecule on β-C2S (001), (110), (101), and (111) surfaces. In contrast, dissociation of the H2O was only observed over the β-C2S (100) surface. Although the dissociative adsorption over the β-C2S (100) surface was found to be the most energetically favorable, molecular adsorption was generally more favorable considering the Ead of other β-C2S surfaces.
Though molecular adsorption was observed for the adsorption of water on β-C2S (001), (101), and (111) surfaces regardless of the initial water configuration, the final adsorption configuration was different. Figure S1 illustrates the final adsorption configuration on the β-C2S (001) surface as an example. The difference in the adsorption configuration led to the difference in the Ead.
Dissociative water adsorption was found to be more energetically favorable than molecular water adsorption over M3-C3S surfaces. The most negative Ead (−4.008 eV) was obtained at the dissociative adsorption over the M3-C3S (101) surface while the least negative Ead (−0.699 eV) was obtained at the molecular adsorption over the M3-C3S (100) surface. The dissociation of the H2O was observed at M3-C3S (101), (011), and (111) surfaces while no reformations of H2O from the hydroxyl group and the proton were observed. The above results imply the dissociative adsorption was more stable and energetically favorable on M3-C3S surfaces, which agrees well with the results in the literature [12,22]. Moreover, the Ead of M3-C3S surfaces was much more negative than that of β-C2S surfaces, indicating the H2O adsorption on M3-C3S surfaces was stronger than that on β-C2S surfaces.

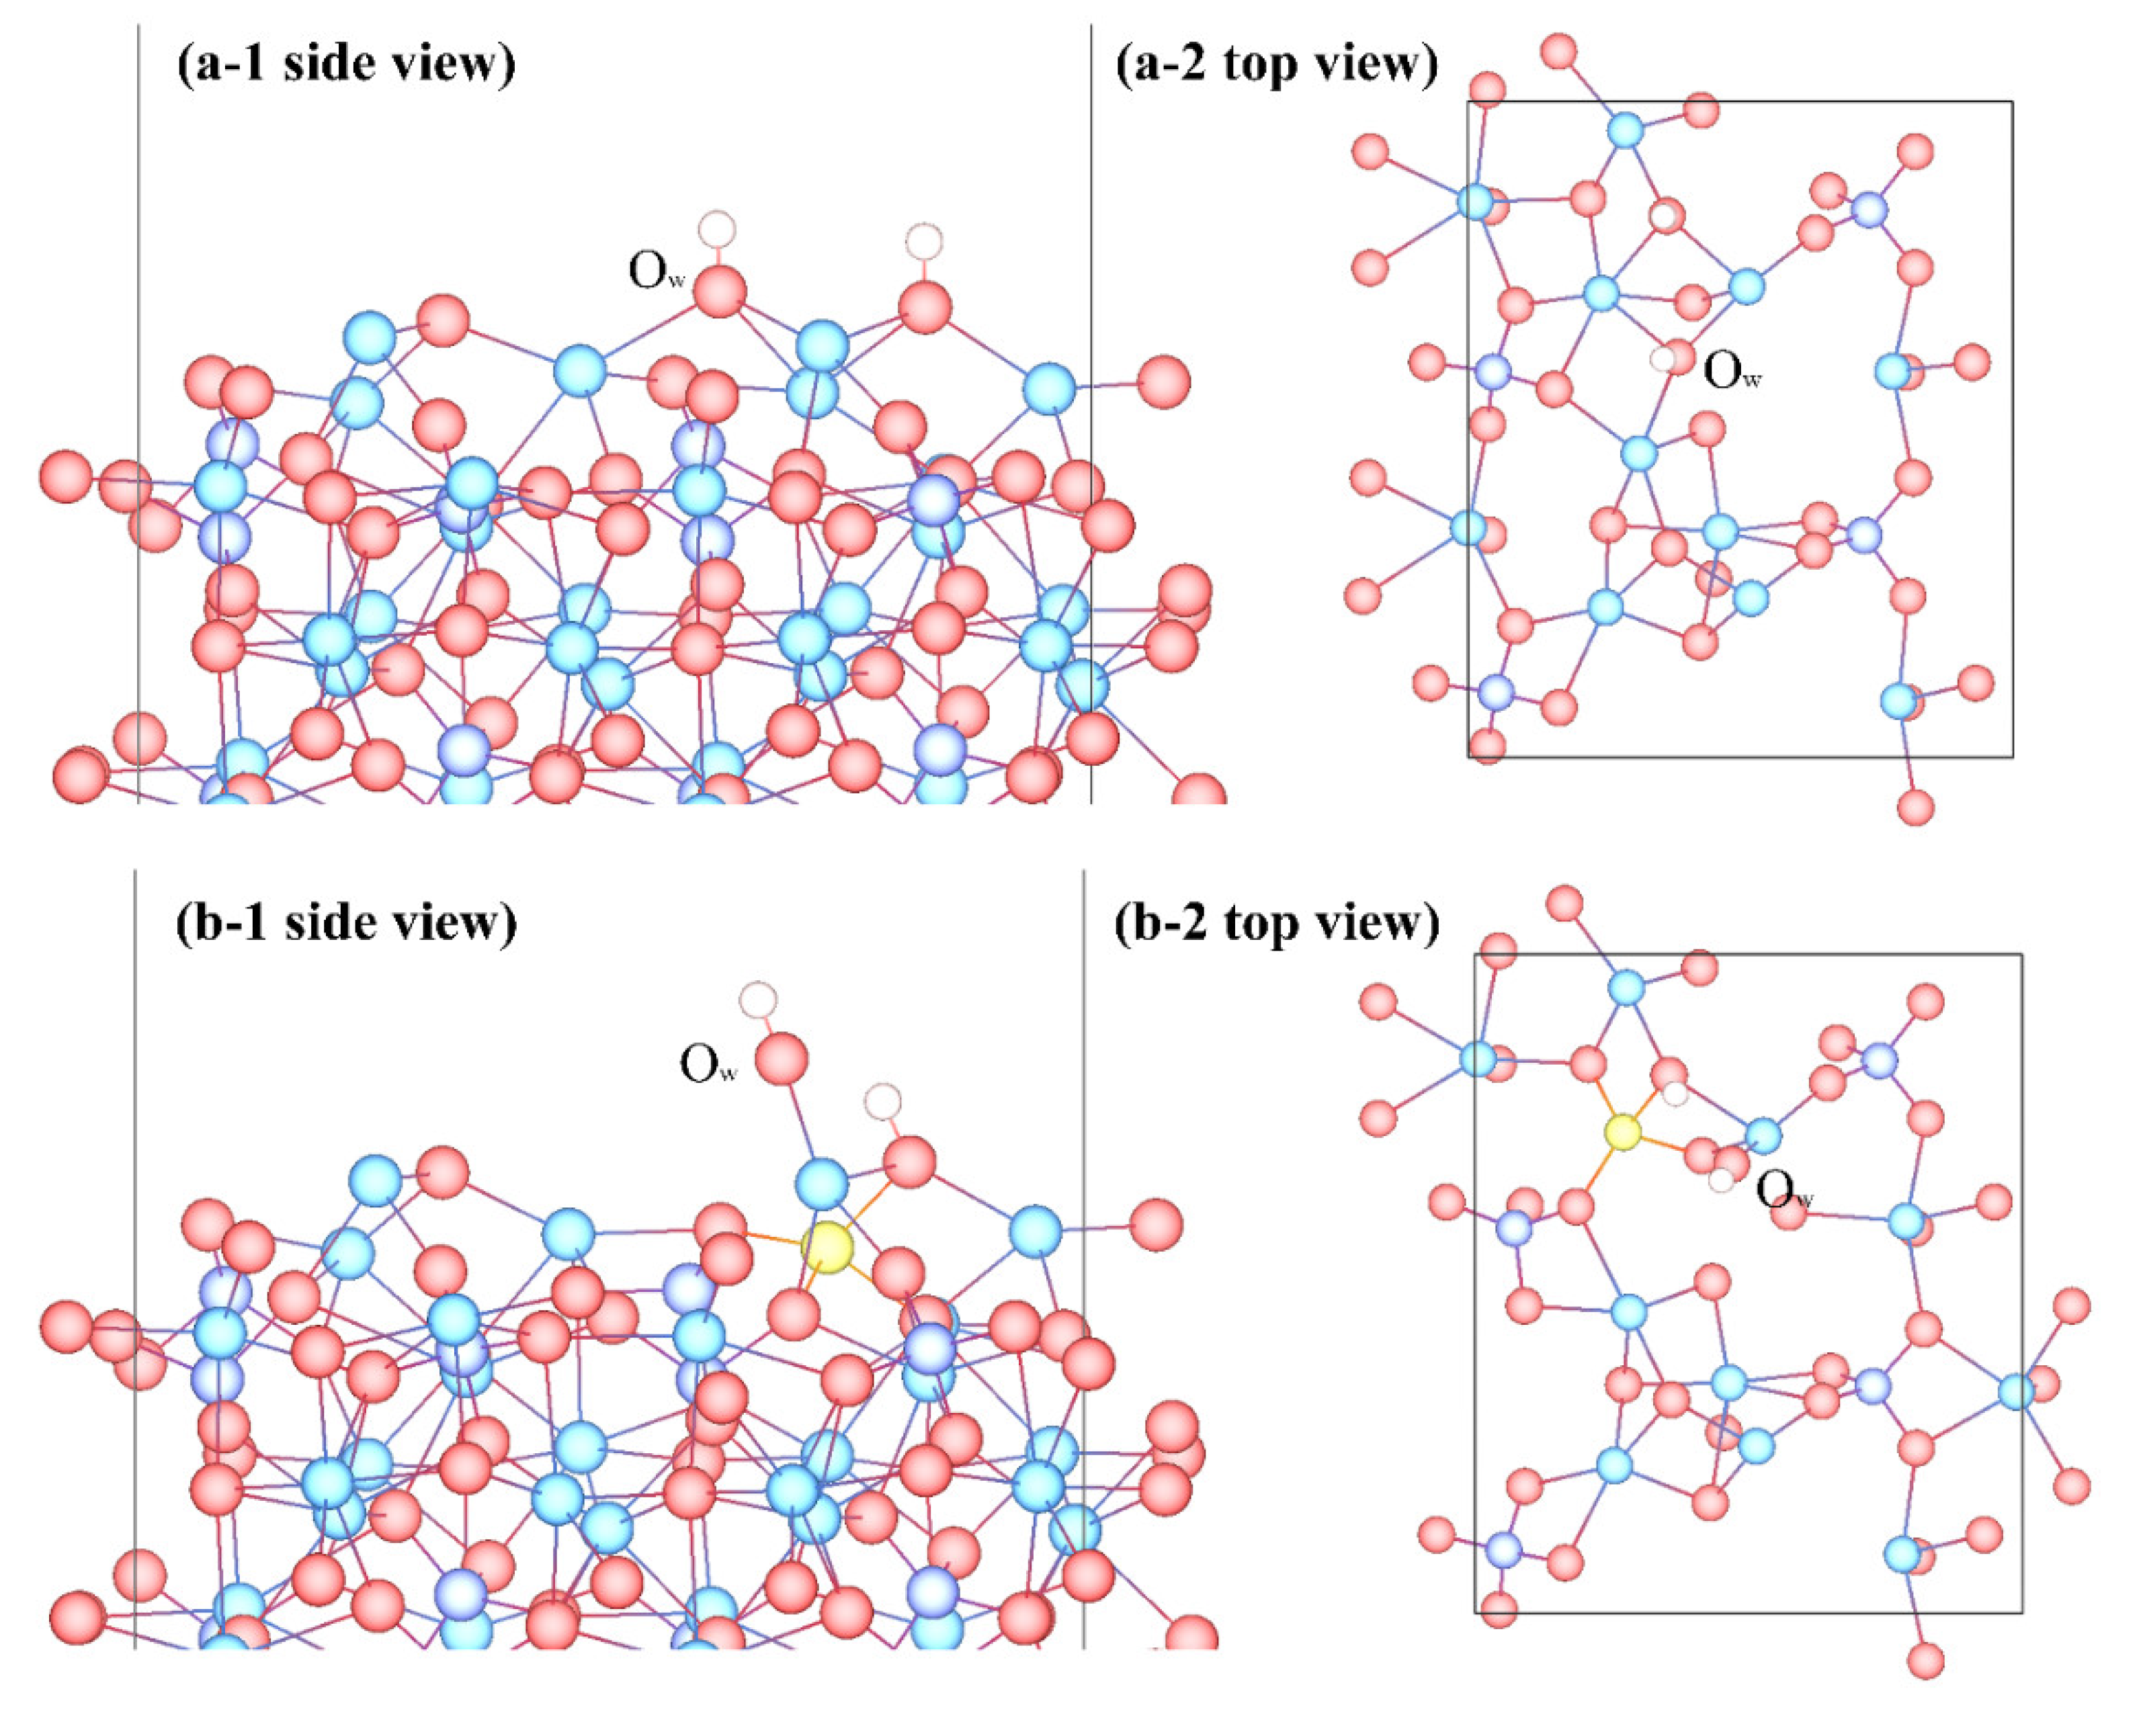
3.3. Adsorption Configuration

Table 3 summarizes the adsorption configuration of the H2O over β-C2S surfaces. In most cases, bonding was found between the surface Mg atom and the O atom from the water molecule (Ow). The Ow was attracted to surface Ca atoms in the molecular adsorption on (011) and (111) surfaces, indicating the Ca-Ow bond was more favorable than the Mg-Ow bond in these two cases. Both Ca-Ow and Mg-Ow bonds can be formed simultaneously for dissociative adsorption, which was not observed during the molecular adsorption.
The dissociated proton (Hd) was attracted to a surface O atom (Os) of the calcium silicates. Moreover, the dissociative configuration was also influenced by Ow and Os atoms. Although the adsorption configuration was mainly influenced by the Ca-Ow or the Mg-Ow bond for the molecular adsorption, the attraction between Os and H was also crucial, such as on β-C2S (010) and (111) surfaces.
Table 4 summarizes the adsorption configuration of the single water molecule on M3-C3S surfaces. As shown, the dissociative adsorption was mainly characterized by the Ca-Ow bond, the Mg-Ow bond, the Os-Hd bond, or was influenced by the attraction between Os and Hd. In contrast, the configuration of the molecular adsorption was influenced by the Mg-Ow bond, and in some cases such as (010) and (001), also influenced by the attraction between Os and H. The adsorption configurations for the most energetically favorable dissociative and molecular adsorptions are illustrated in Figure 2 as an example.

3.4. Partial Density of States

To reveal the bonding mechanism between the water molecule and surfaces, the partial density of states (PDOS) of atoms involved in the fresh-bond formation was analyzed. Figure 3a illustrates the bonding associated with the Ow atom during the dissociative adsorption over the β-C2S (100) surface. Ow 2p orbital overlapped with Ca 4s and Ca 3p orbitals near the Fermi energy during the Ow-Ca bond formation. Similarly, overlapping was observed between Ow 2p orbital and Mg 3s orbital for the Ow-Mg bond. It is noted that the Ow 2p orbital also overlapped marginally with Hd 1s orbital, indicating the Ow and Hd were attracted to each other.
The Os-Hd bonding was mainly originated from the overlapping between Os 2p and Hd 1s orbitals (Figure 3b). Moreover, Os 2s orbital overlapped marginally with Hd 1s orbital at around −5 eV. In the case of the molecular adsorption over β-C2S (011) surface, the orbital overlapping was similar to that during the dissociative adsorption, which was the Ow 2p orbital overlapping with Ca 4s and Ca 3p orbitals (Figure 3c). Similar orbital overlapping was observed during the water adsorption on other low-index surfaces of calcium silicates.
To summarize, the Ow-Mg bonding originated from the overlapping between Ow 2p orbital and Mg 3s orbital, the Ow-Ca bonding originated from the overlapping between Ow 2p orbital and Ca 4s/3p orbitals, and the Os-Hd bonding mainly originated from the overlapping between Os 2p and Hd 1s orbitals. The authors note that the PDOS results might show some difference with the results in the literature, such as in [40] and [27], due to the difference in DFT computational settings. Moreover, the PDOS near the conduction band minimum was not discussed since the overlapping was not as significant as that near the valence band maximum.

4. Discussion

4.1. What Does the Positive Efor Imply?

As indicated in Table 1, the Efor of Mg substituting for Ca was positive for most cases, indicating such a substitution was energetically unfavorable. However, Mg substitution in the current study was only used to investigate the influence of Mg substitution on water adsorption. In reality, the Mg substitution occurs in the solid solution during the cement production. Under such circumstances, the raw materials are heated up to 1400 °C [7,41], which can promote the Mg substitution in bulk and at the surface.
Moreover, the main objective of Mg substitution is in the polymorphic modification. A higher proportion of MgO during C3S crystallization stabilizes the M3 phase [7]. In the case of C2S, Chan et al. [42] found that the ionic substitution is vital in stabilizing the polymorphic form of C2S other than γ, the only stable form at room temperature without impurities [7].

4.2. Comparison before and after Water Adsorption

In this section, the change of structural and electronic properties of low-index surfaces after water adsorption is analyzed. Figure 4 illustrates the bond length distribution of surface Mg-O before and after water adsorption. An increase in surface Mg-O bond length was observed after water adsorption, indicating the weakening of surface Mg-O bonds [12]. More specifically, the average Mg-O bond was increased by 0.007 Å after the dissociative water adsorption over β-C2S low-index surfaces. In contrast, the average Mg-O bond was increased by 0.043 Å after the molecular water adsorption over β-C2S low-index surfaces. The above results imply the molecular adsorption could weaken the surface Mg-O bond to a larger extent for β-C2S surfaces.
In the case of the Mg-O bond length on M3-C3S surfaces, a 0.043 Å and 0.006 Å increase was found for the dissociative adsorption and molecular adsorption, respectively. Dissociative adsorption was better at weakening surface Mg-O bonds than molecular adsorption for M3-C3S surfaces. Since the weakening of surface bonds implies the increasing probability of bond breakage, the dissolution of Mg was promoted after the water adsorption [22]. Furthermore, molecular adsorption is more beneficial to Mg dissolution in β-C2S surfaces while dissociative adsorption is more beneficial to Mg dissolution in M3-C3S surfaces.
Figure 5 illustrates the effect of water adsorption on the Bader charge of surface atoms that were involved in the bond formation. As shown, the Bader charge of surface Mg, Ca, and Os increased after water adsorption, indicating a decrease of electrons. In contrast, the Ow and Hd accepted electrons, resulting in a decrease of the Bader charge. Taking β-C2S as an example, the Bader charge of Mg, Ca, and Os was increased from 1.665 eV, 1.564 eV, and −1.590 eV, respectively, to 1.670 eV, 1.585 eV, and −1.495 eV. The above results indicate that the electron is transferred from the surface to the H2O upon adsorption, which agrees well with the results in the literature [12,13,22].
The electron transfer can also be indicated by the decomposed charge density. In the current study, the decomposed charge density distribution around the top of the valance band (ρTVB, −6 eV to 0 eV) and around the bottom of the conduction band (ρBCB, 0 to 3 eV) was analyzed before and after water adsorption. Figure 6 illustrates the results of the molecular adsorption over the β-C2S (011) surface as an example. The ρTVB and ρBCB of surface and water atoms were changed during the water adsorption. The comparison between the density of ρTVB and ρBCB before and after adsorption indicates the electron transfer from the surface to the H2O.

4.3. Comparison with Pristine Low-Index Surfaces of Calcium Silicates

In this section, the Mg-doped surfaces are compared with pristine surfaces to reveal the role of Mg doping in the water adsorption over calcium silicate surfaces. As shown in Figure 5, the average Bader charge of Mg in β-C2S surfaces and M3-C3S surfaces was 1.665 eV and 1.635 eV, respectively. Compared with the Bader charge of surface Ca atoms (around 1.5 eV as shown in Figure 5 and in the literature [12]), the Mg site might be less reactive than the corresponding Ca site. The reactivity of surface Mg and Ca sites can also be revealed by the decomposed charge density. It can be seen from Figure 6c that the ρBCB was mainly distributed around surface Ca atoms, implying the surface Ca atoms were more reactive than surface Mg atoms under nucleophilic attack.
Figure 7 illustrates the comparison of the Ead of the single water adsorption on pristine and Mg-doped β-C2S and M3-C3S surfaces. Generally speaking, the Ead became less negative after the Mg impurity (lighter color in the upper two rows compared with the lower two rows, as shown in Figure 7). In the case of β-C2S (100), β-C2S (001), M3-C3S (101), and M3-C3S (011) surfaces, the Ead became more negative.
The authors note that the more negative Ead after Mg impurity on β-C2S (100), β-C2S (001), M3-C3S (101), and M3-C3S (011) surfaces is not due to the Mg-Ow bonding was more energetically favorable than Ca-Ow. Instead, more bonds were formed on these Mg-doped surfaces. More specifically, the coexistence of Mg-Ow and Ca-Ow bonds, as well as the attraction between H and Os even for the molecular adsorption, led to the more negative Ead.
The influence of Mg doping on the water adsorption can also be indicated by the water configuration. For one thing, the water adsorption could be influenced by the adjacent Ca site to a larger extent on the Mg-doped surfaces than the pristine surfaces. In some cases, the water molecule is absorbed into the adjacent Ca site even if it is placed above the Mg site in its initial configuration (Figure 2b). Figure 8 illustrates the difference between the dissociative adsorption configuration over the M3-C3S (111) surface. As shown, the Ow was attracted to one adjacent Ca site on the Mg-doped surface, instead of shared by three Ca sites on the pristine surface. The reason for such a difference in adsorption configuration is due to the relatively low reactivity of the Mg site, as discussed in Section 4.1. Therefore, the adjacent Ca site could be much more reactive compared with the Mg site, resulting in the water adsorption around the adjacent Ca site.
Another influence of Mg doping on the adsorption configuration could be revealed by comparing Table 3 and Table 4 with Table 6 in the literature [12]. As shown, water reformation from H+ and OH was not as frequently observed on Mg-doped β-C2S surfaces than on those pristine ones. On the pristine β-C2S surfaces, water reformation was observed on most surfaces, except the (011) surface. However, such water reformations were not observed on the (100), (010), and (011) Mg-doped surfaces. Moreover, water dissociation occurred on the β-C2S Mg-doped (100) surface, which was not observed on the pristine surface. The frequency of water dissociation on M3-C3S was quite similar on pristine and Mg-doped surfaces, even though occurring at different surfaces. The water reformation and dissociation are influenced by the relaxed surface structure, which in turn affect the energy barrier for such a process. Thus, a detailed discussion about the influence of Mg doping on the water reformation and dissociation would require further calculations and analysis.

5. Conclusions

In this work, using first-principles DFT calculations, we investigated the influence of Mg doping on the water adsorption over calcium silicates surfaces. Both molecular and dissociative adsorption were analyzed, and the influence of water adsorption was investigated. A detailed comparison between Mg-doped and pristine surfaces, both in terms of surface structures and water adsorption, was conducted. The following conclusions can be summarized based on the calculated results:
  • The Efor of Mg substituting for Ca ranged 0.51 to 1.21 eV on β-C2S surfaces and −0.02 to 1.58 eV on M3-C3S surfaces.
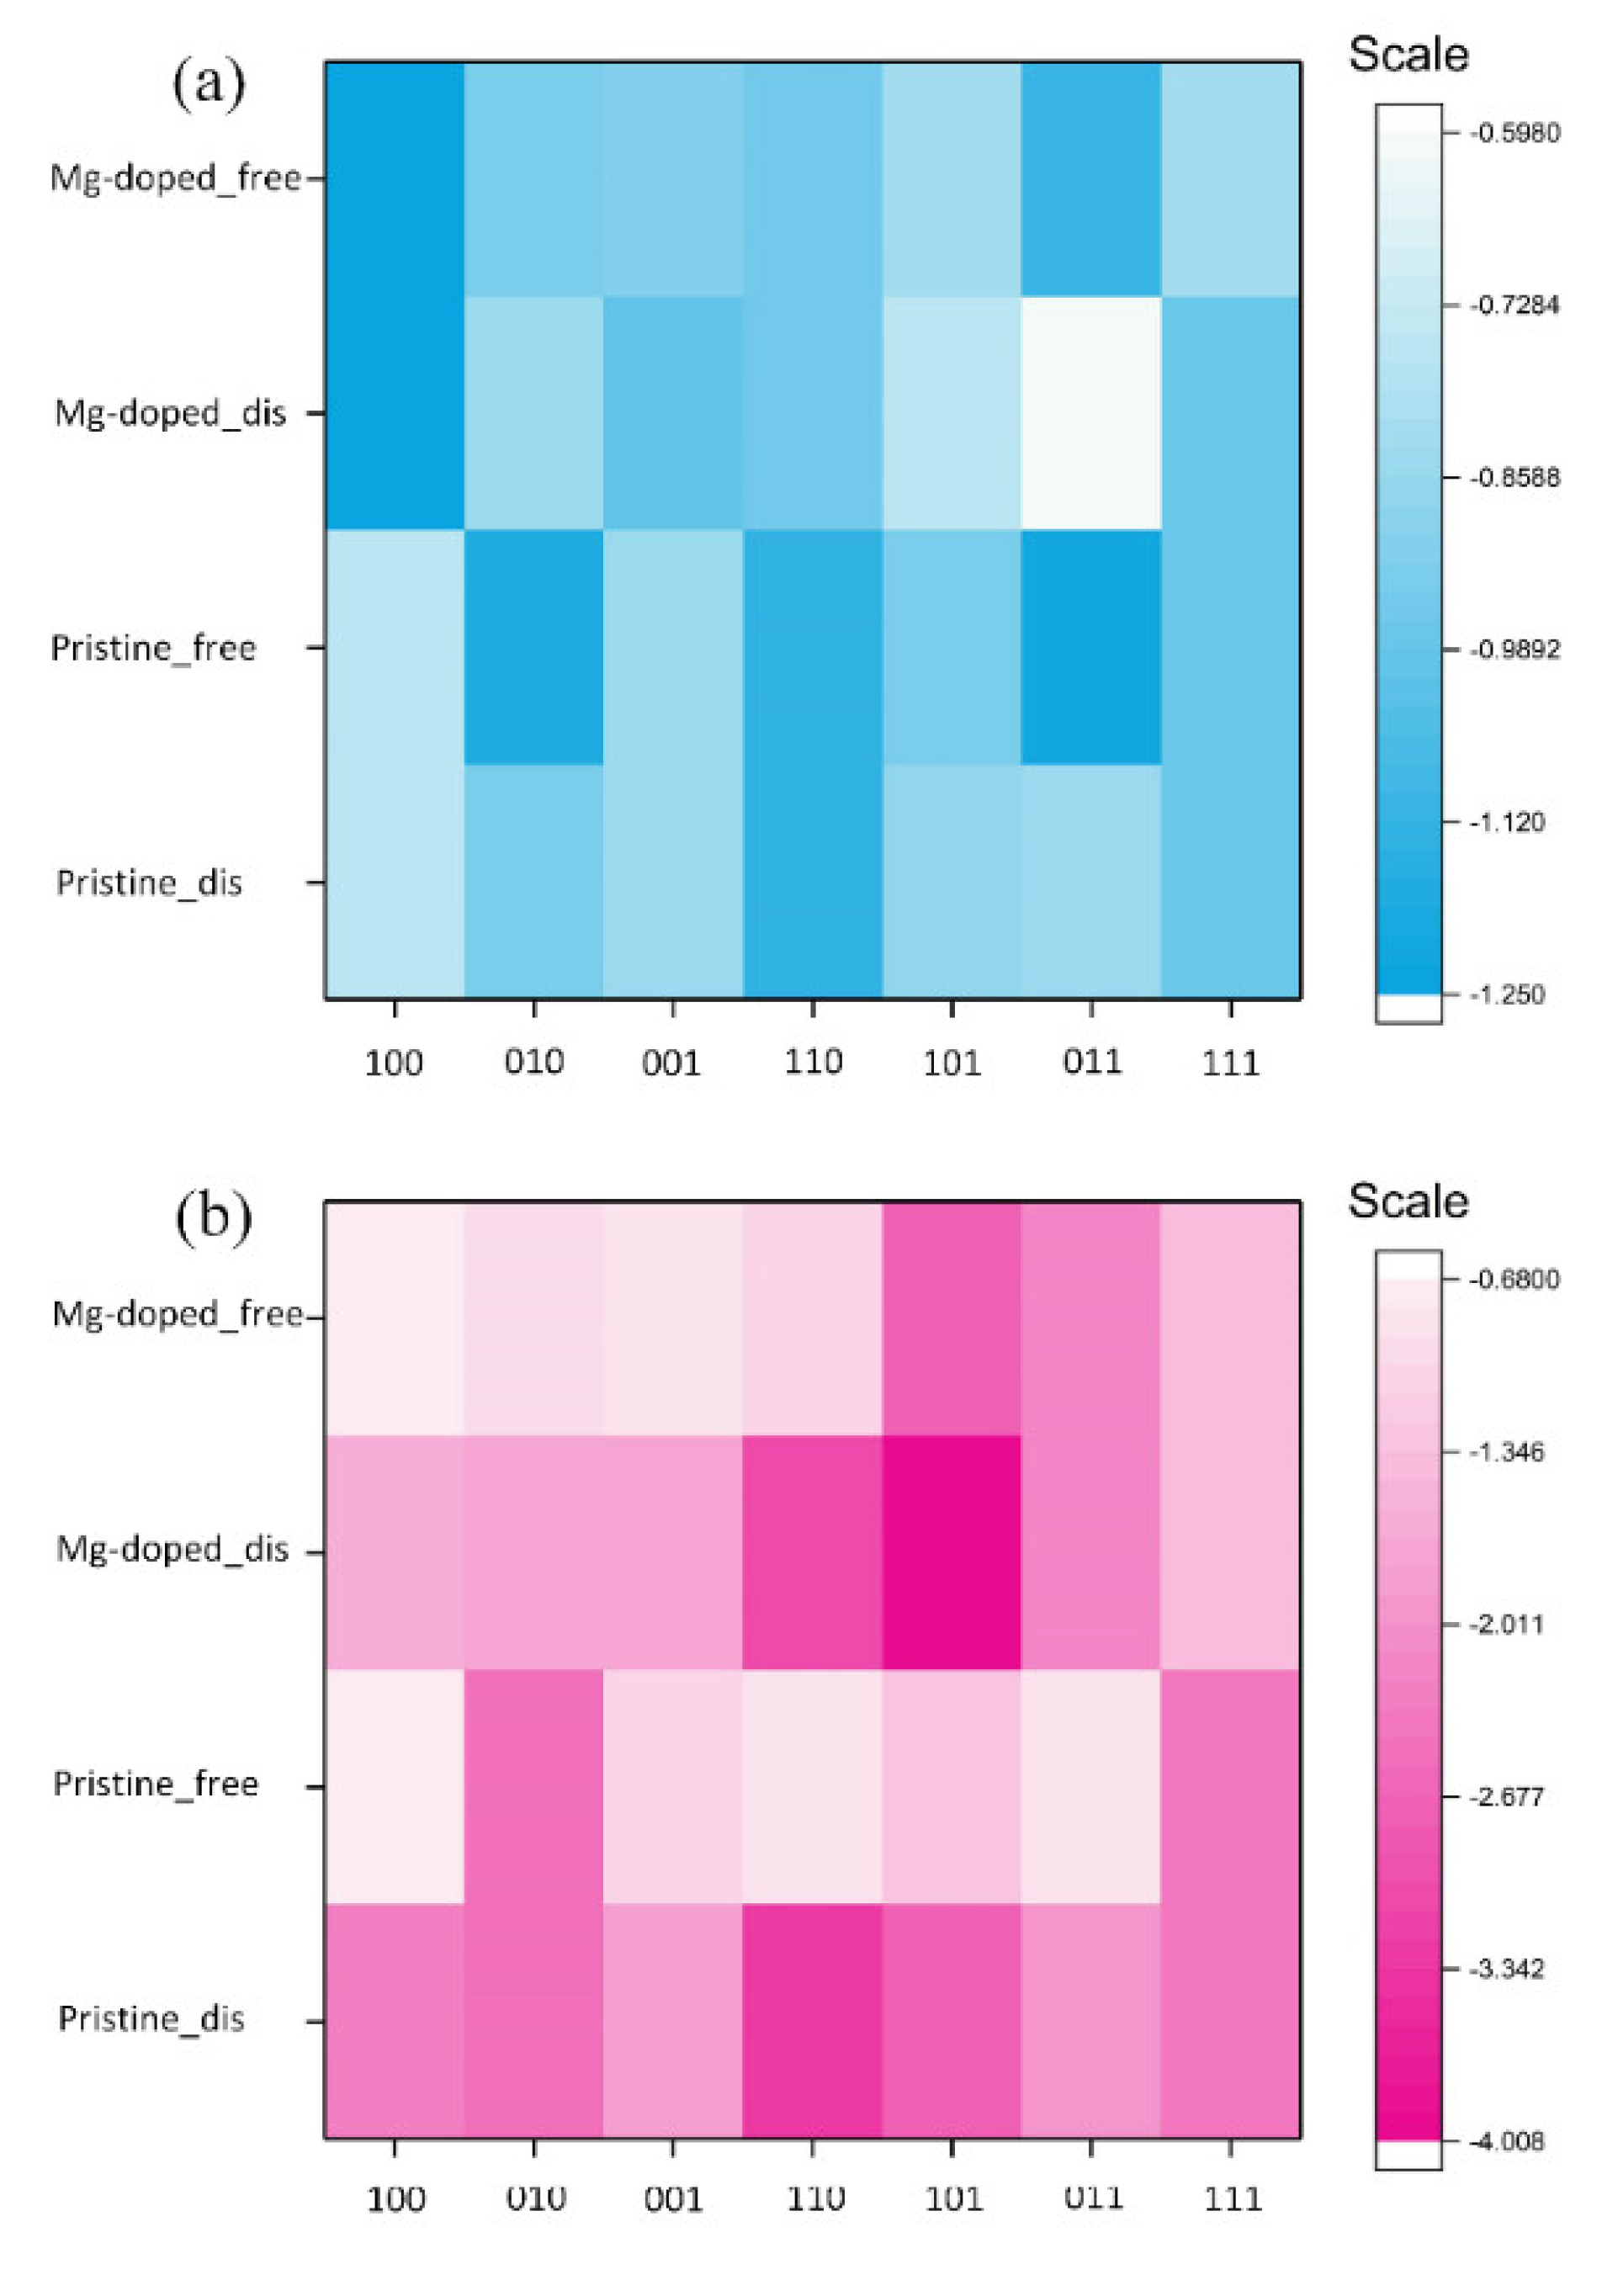
  • The Ead of an H2O over Mg-doped surfaces of β-C2S and M3-C3S ranged from −0.598 to −1.249 eV and −0.699 to −4.008 eV, respectively. Generally speaking, molecular adsorption was more energetically favorable on β-C2S surfaces and dissociative adsorption was more favorable on M3-C3S surfaces.
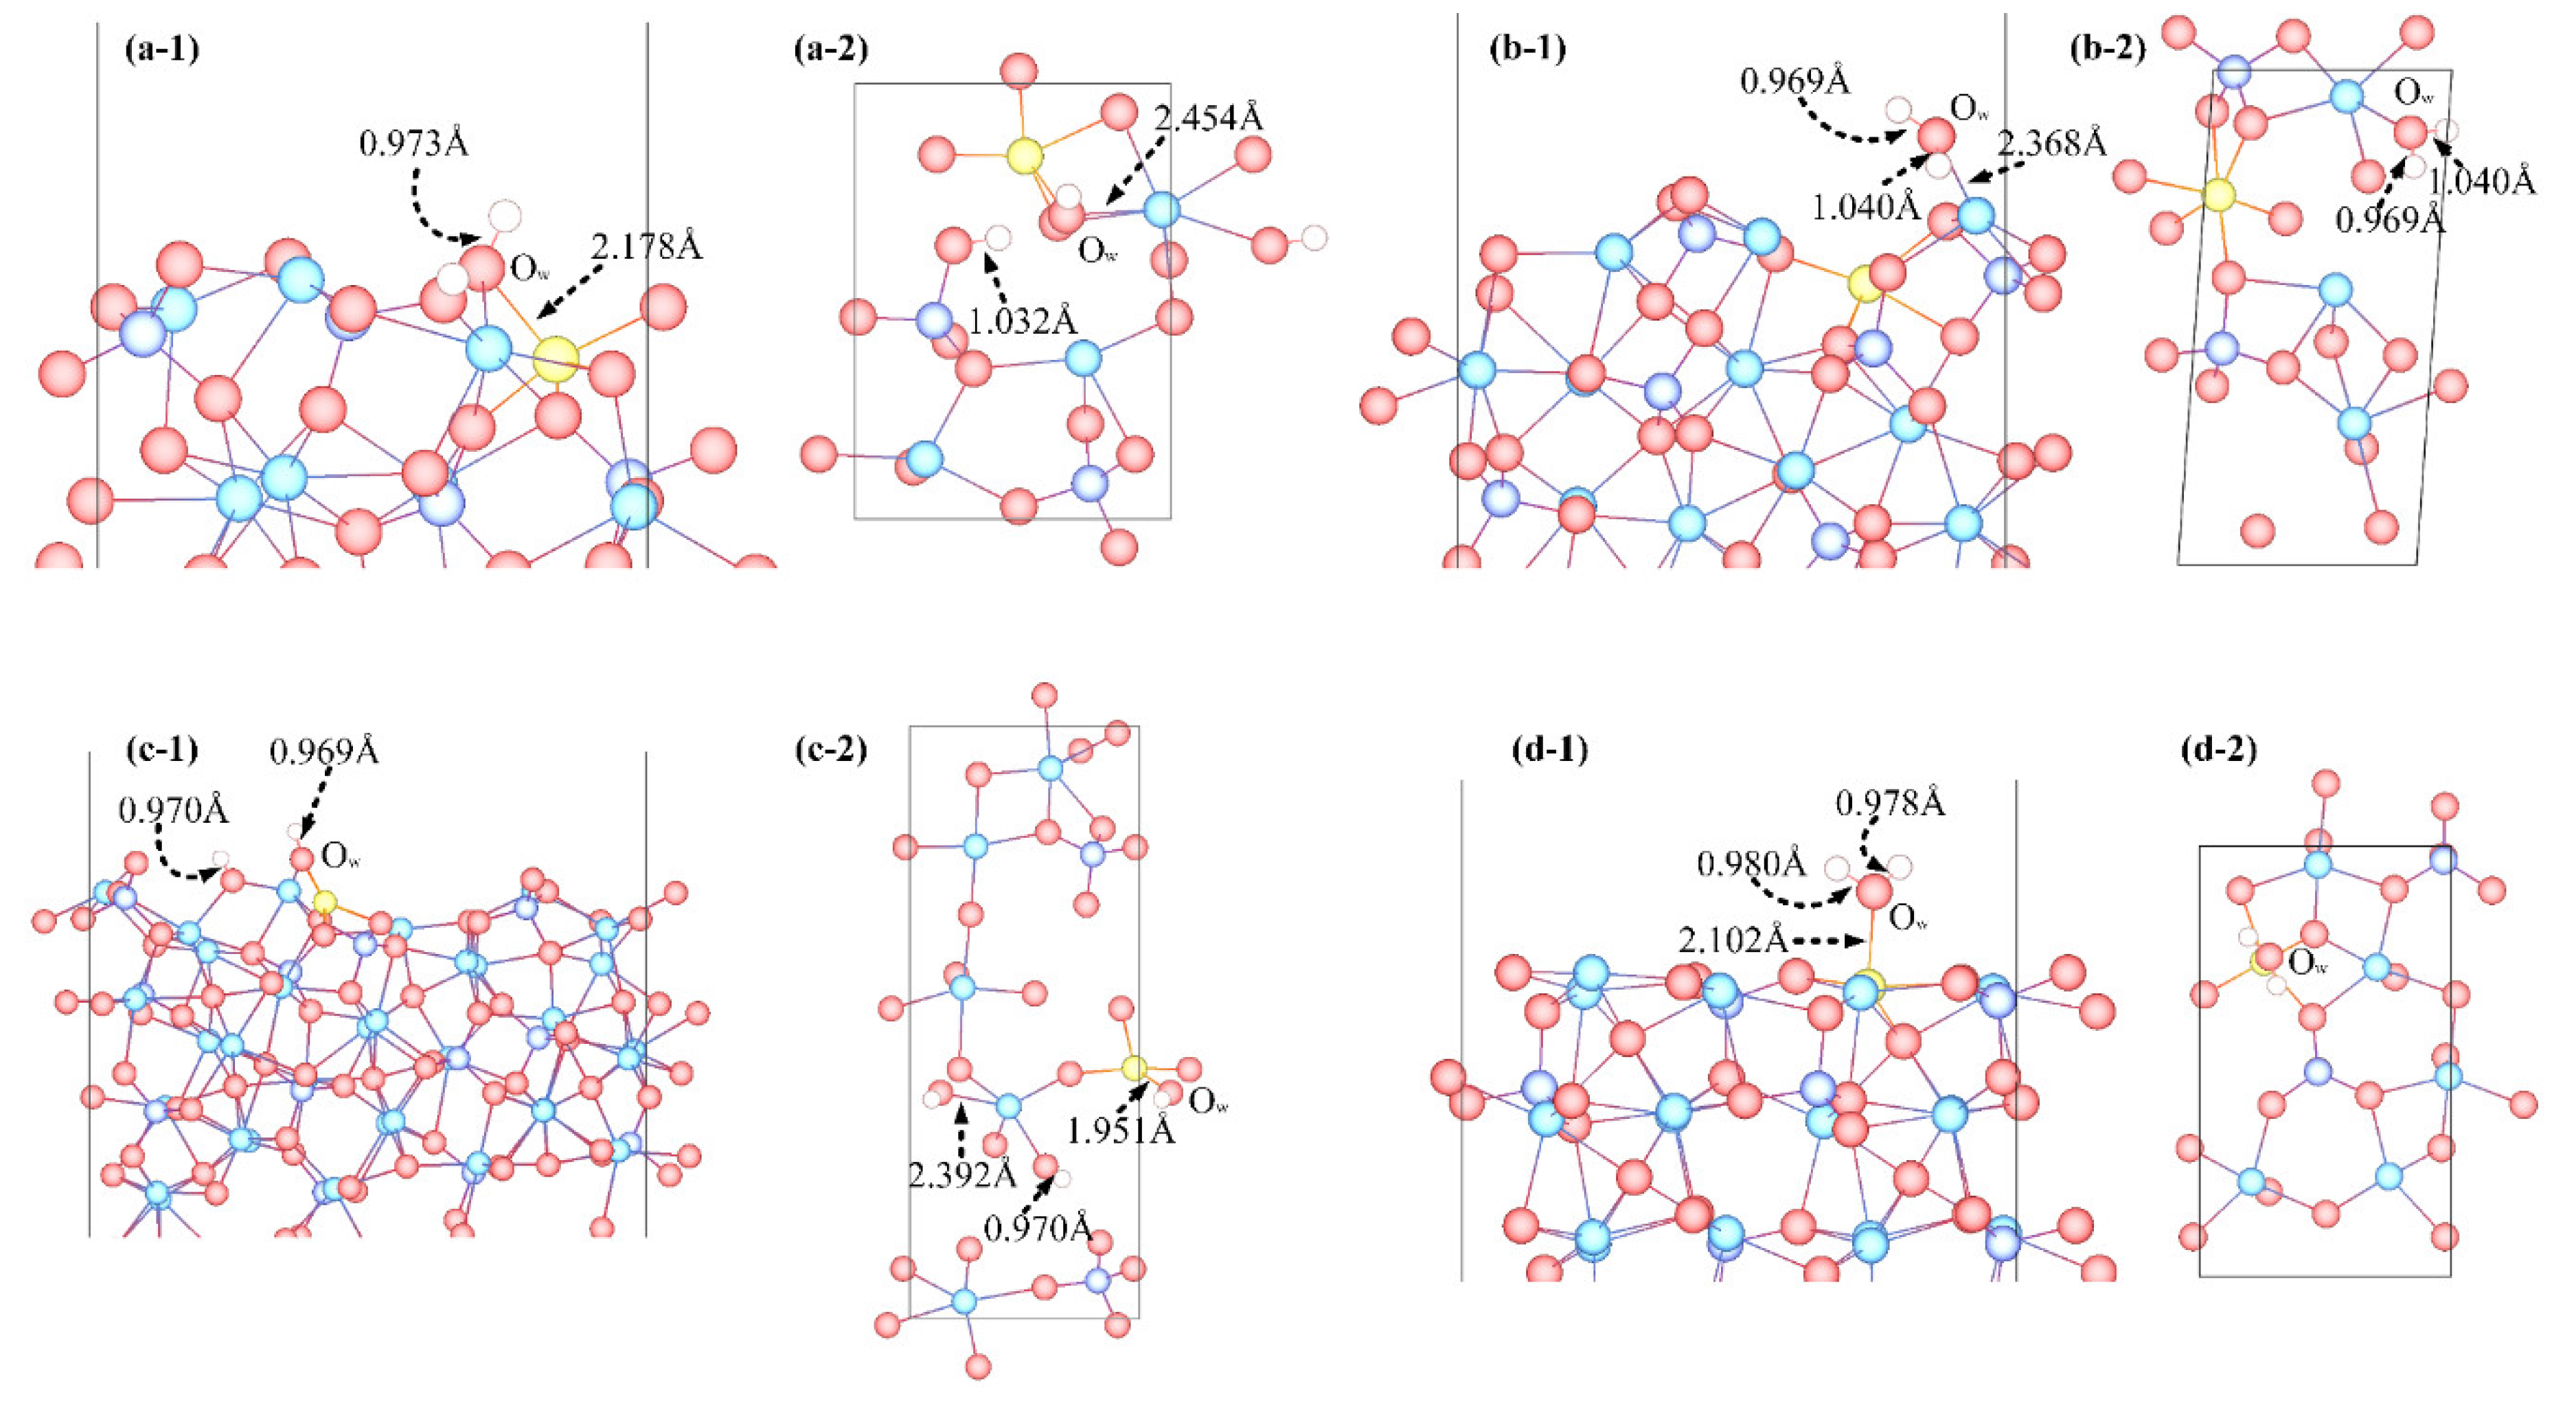
  • Molecular adsorption was characterized by the Mg-Ow bond and/or the Ca-Ow bond, and in some cases, was also influenced by the attraction between Os and H. Dissociative adsorption was mainly characterized by the Ca-Ow bond, Mg-Ow bond, Os-Hd bond, or was influenced by the attraction between Os and Hd.
  • Ow-Mg bonds were originated from the Ow 2p orbital and the Mg 3s orbital, Ow-Ca bonds were originated from the Ow 2p orbital and the Ca 4s/3p orbitals, and Os-Hd bonds was mainly originated from the Os 2p and the Hd 1s orbitals.
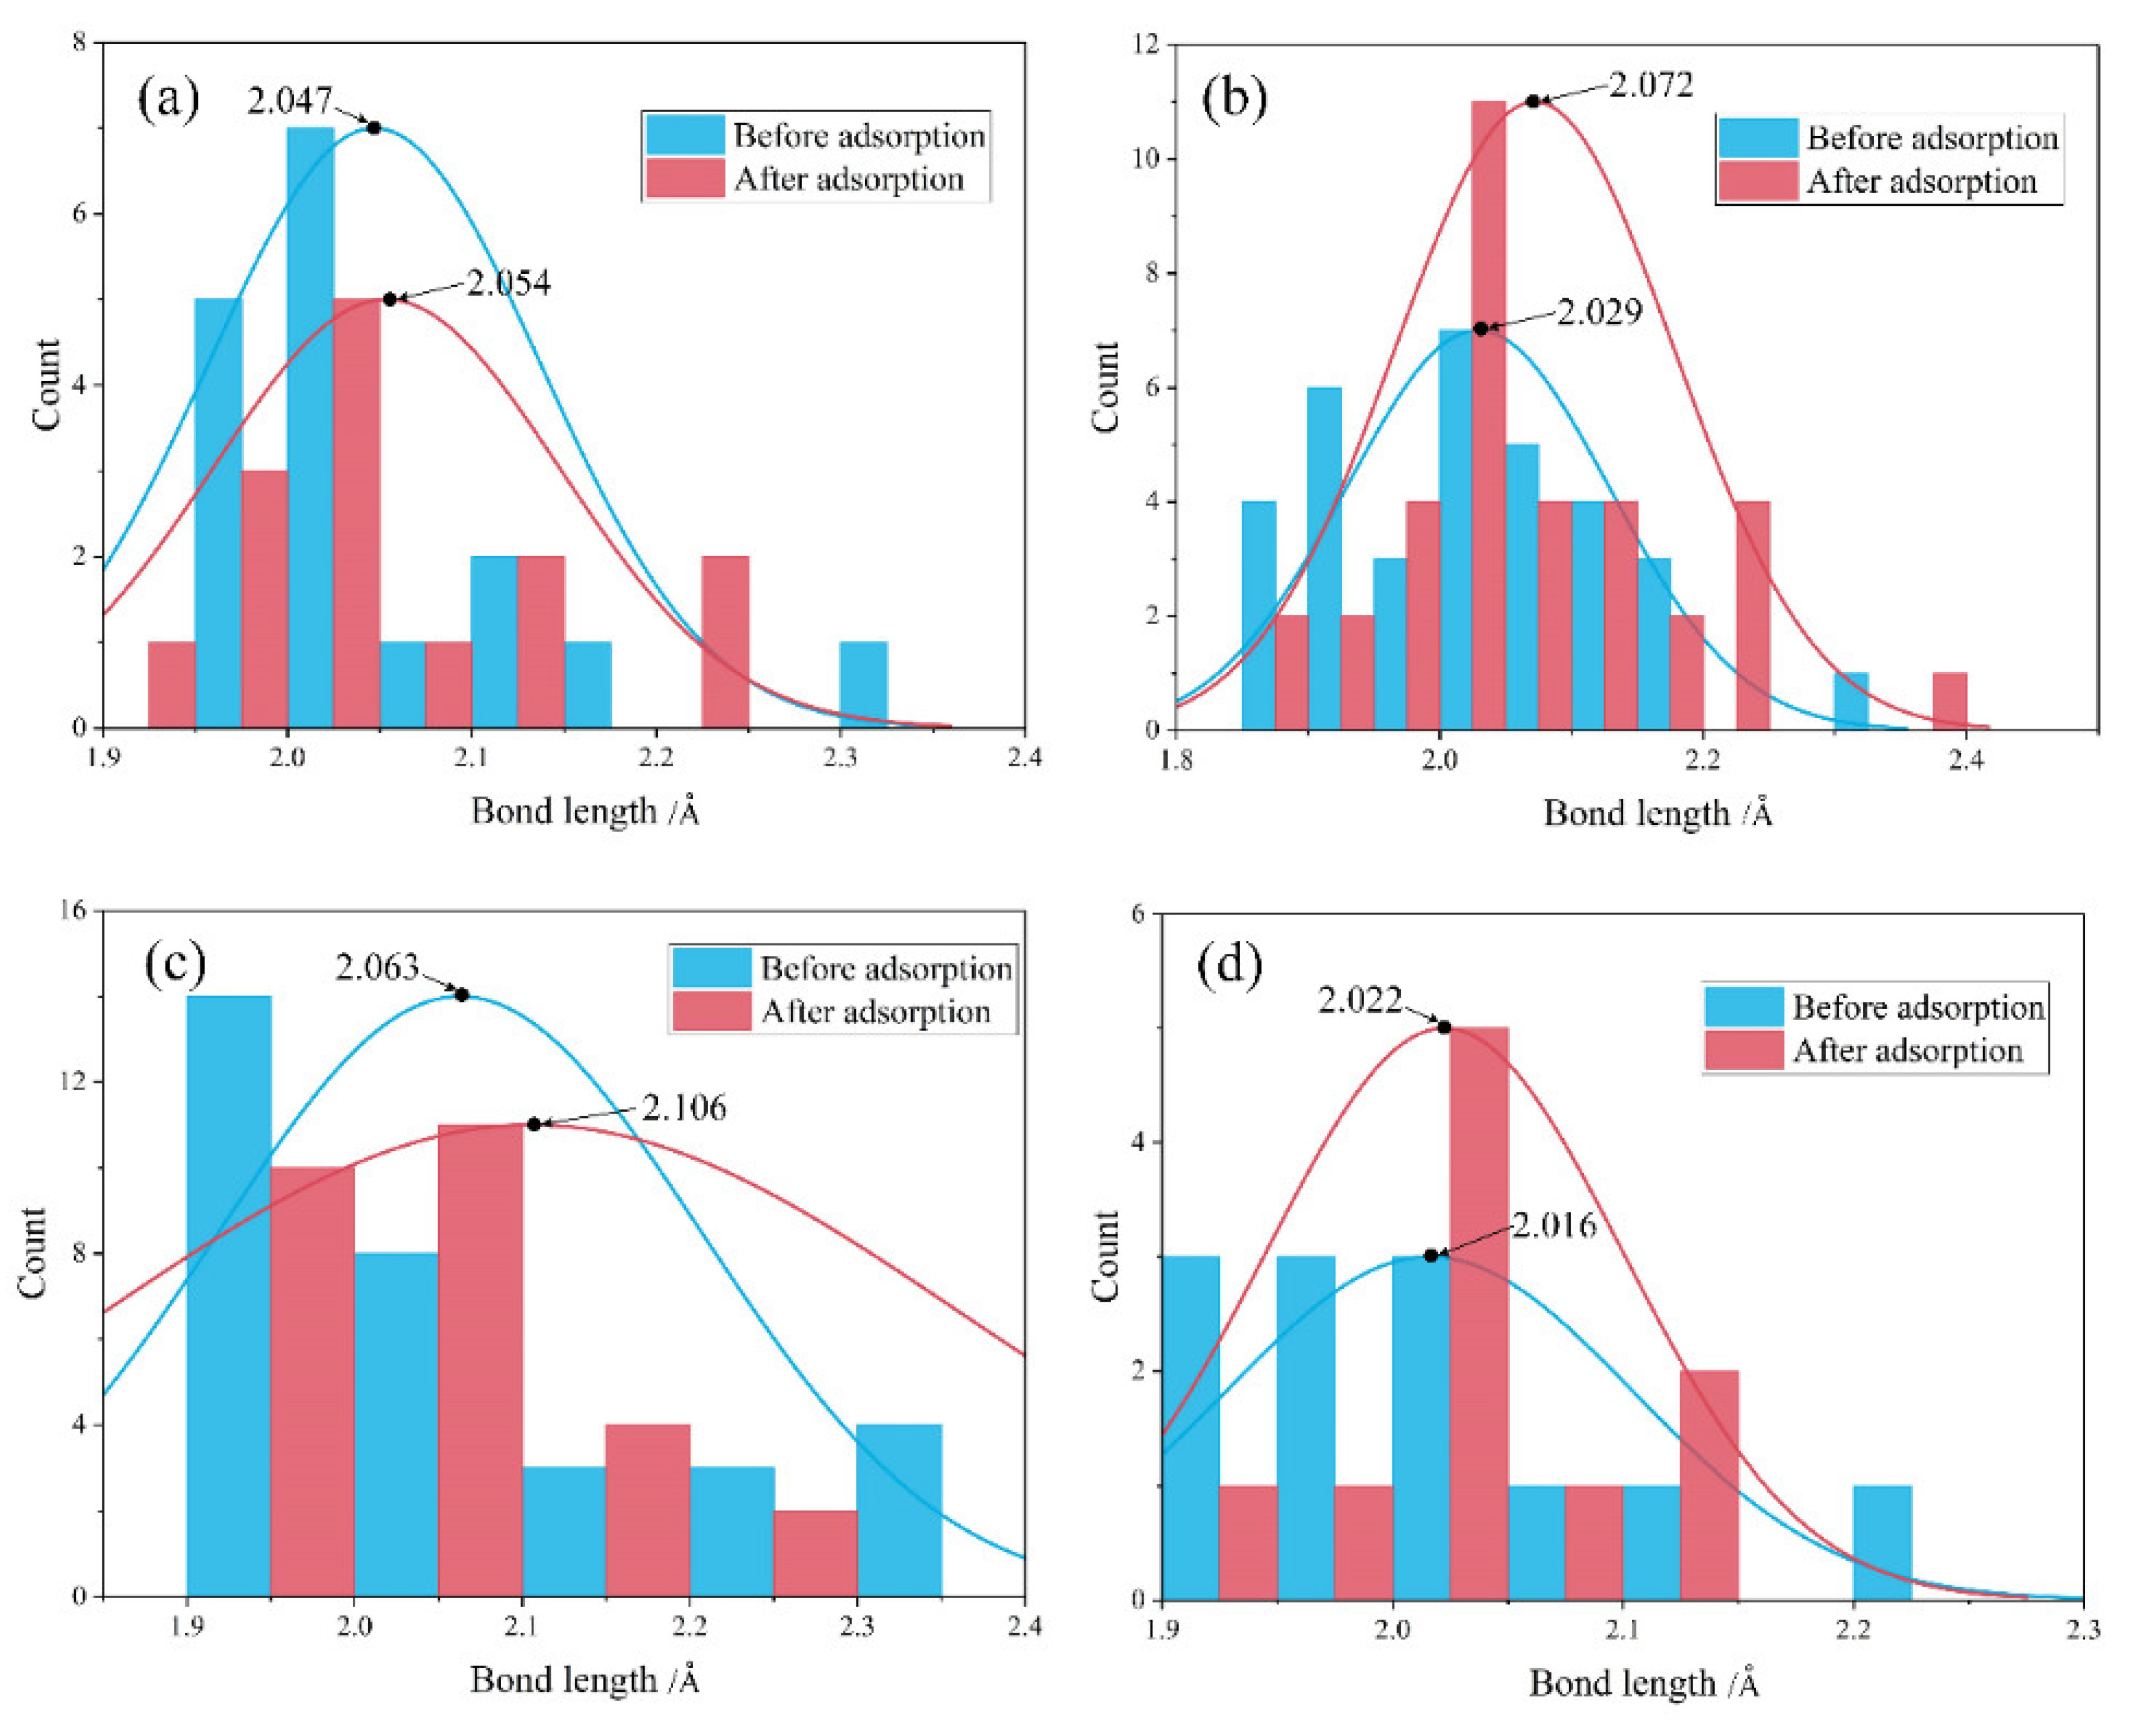
  • Water adsorption increased the bond length of surface Mg-O and promoted the Mg dissolution. Such a bond-weakening effect was more evident for the molecular adsorption over β-C2S surfaces and the dissociative adsorption over M3-C3S surfaces. The electron transfer was observed from the surface to H2O upon adsorption.
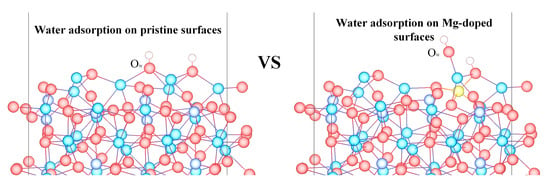
  • Mg doping influenced the reactivity of surface Ca/Mg sites, the Ead of the single water adsorption, as well as the adsorption configuration compared with the water adsorption on pristine surfaces.
In the future, the influence of Mg concentration on the water adsorption should be investigated. Moreover, a systematic study should be performed to determine the substitution site for more representative results. Finally, more adsorption sites could be investigated to better reveal the influence of Mg substitution on the water adsorption.

Supplementary Materials

The following are available online at https://www.mdpi.com/2075-163X/10/8/665/s1, Figure S1: Water adsorption configuration on β-C2S (001) surface: (a) −0.994 eV, and (b) −0.915 eV. Please refer to Figure 1 for the atom type, Table S1: Calculation details and the surface energy of pristine low-index surfaces of calcium silicates.

Author Contributions

Conceptualization, C.Q. and Q.C.; methodology, C.Q.; software, C.Q.; validation, A.F. and Q.C.; formal analysis, A.F.; writing—original draft preparation, C.Q.; writing—review and editing, Q.C. and A.F.; funding acquisition, Q.C. All authors have read and agreed to the published version of the manuscript.

Funding

This work was supported by resources provided by the Pawsey Supercomputing Centre (No. PAWSEY0308) with funding from the Australian Government and the Government of Western Australia, the State Key Laboratory of Safety and Health for Metal Mines (No.2019-JSKSSYS-02), and Natural Science Foundation of Hunan Province, China (No. 2020JJ5718).

Conflicts of Interest

There is no conflict of interest to declare.

References

  1. Singh, S.K.; Singh, A.; Singh, B.; Vashistha, P. Application of thermo-chemically activated lime sludge in production of sustainable low clinker cementitious binders. J. Clean. Prod. 2020, 264, 121570. [Google Scholar] [CrossRef]
  2. Wang, D.L.; Zhang, Q.L.; Chen, Q.S.; Qi, C.C.; Feng, Y.; Xiao, C.C. Temperature variation characteristics in flocculation settlement of tailings and its mechanism. Int. J. Miner. Metall. Mater. 2020. [Google Scholar] [CrossRef]
  3. Feng, Y.; Chen, Q.; Zhou, Y.; Yang, Q.; Zhang, Q.; Jiang, L.; Guo, H. Modification of glass structure via CaO addition in granulated copper slag to enhance its pozzolanic activity. Constr. Build. Mater. 2020, 240, 117970. [Google Scholar] [CrossRef]
  4. Chen, X.; Shi, X.; Zhou, J.; Yu, Z.; Huang, P. Determination of mechanical, flowability, and microstructural properties of cemented tailings backfill containing rice straw. Constr. Build. Mater. 2020, 246, 118520. [Google Scholar] [CrossRef]
  5. Chen, X.; Shi, X.; Zhang, S.; Chen, H.; Zhou, J.; Yu, Z.; Huang, P. Fiber-Reinforced Cemented Paste Backfill: The Effect of Fiber on Strength Properties and Estimation of Strength Using Nonlinear Models. Materials 2020, 13, 718. [Google Scholar] [CrossRef] [PubMed] [Green Version]
  6. Tao, Y.; Zhang, W.; Li, N.; Wang, F.; Hu, S. Atomic occupancy mechanism in brownmillerite Ca2FeAlO5 from a thermodynamic perspective. J. Am. Ceram. Soc. 2019, 103, 635–644. [Google Scholar] [CrossRef] [Green Version]
  7. Taylor, H.F.W. Cement Chemistry, 2nd ed.; Thomas Telford Publishing: London, UK, 1997. [Google Scholar]
  8. Qi, C.; Fourie, A.; Chen, Q.; Liu, P.-F. Application of first-principles theory in ferrite phases of cemented paste backfill. Miner. Eng. 2019, 133, 47–51. [Google Scholar] [CrossRef]
  9. Huang, J.; Valenzano, L.; Singh, T.V.; Pandey, R.; Sant, G. Influence of (Al, Fe, Mg) Impurities on Triclinic Ca3SiO5: Interpretations from DFT Calculations. Cryst. Growth Des. 2014, 14, 2158–2171. [Google Scholar] [CrossRef]
  10. Durgun, E.; Manzano, H.; Kumar, P.V.; Grossman, J.C. The Characterization, Stability, and Reactivity of Synthetic Calcium Silicate Surfaces from First Principles. J. Phys. Chem. C 2014, 118, 15214–15219. [Google Scholar] [CrossRef] [Green Version]
  11. Manzano, H.; Durgun, E.; Qomi, M.J.A.; Ulm, F.-J.; Pellenq, R.J.M.; Grossman, J.C. Impact of Chemical Impurities on the Crystalline Cement Clinker Phases Determined by Atomistic Simulations. Cryst. Growth Des. 2011, 11, 2964–2972. [Google Scholar] [CrossRef]
  12. Qi, C.; Spagnoli, D.; Fourie, A. DFT-D study of single water adsorption on low-index surfaces of calcium silicate phases in cement. Appl. Surf. Sci. 2020, 518, 146255. [Google Scholar] [CrossRef]
  13. Zhang, Y.; Lu, X.; Song, D.; Liu, S. The adsorption of a single water molecule on low-index C3S surfaces: A DFT approach. Appl. Surf. Sci. 2019, 471, 658–663. [Google Scholar] [CrossRef]
  14. Manzano, H.; Durgun, E.; López-Arbeloa, I.; Grossman, J.C. Insight on Tricalcium Silicate Hydration and Dissolution Mechanism from Molecular Simulations. ACS Appl. Mater. Interfaces 2015, 7, 14726–14733. [Google Scholar] [CrossRef] [PubMed]
  15. Wang, Q.; Manzano, H.; Guo, Y.; López-Arbeloa, I.; Shen, X. Hydration Mechanism of Reactive and Passive Dicalcium Silicate Polymorphs from Molecular Simulations. J. Phys. Chem. C 2015, 119, 19869–19875. [Google Scholar] [CrossRef]
  16. Durgun, E.; Manzano, H.; Pellenq, R.J.M.; Grossman, J.C. Understanding and Controlling the Reactivity of the Calcium Silicate phases from First Principles. Chem. Mater. 2012, 24, 1262–1267. [Google Scholar] [CrossRef]
  17. Laanaiya, M.; Bouibes, A.; Zaoui, A. Understanding why Alite is responsible of the main mechanical characteristics in Portland cement. Cem. Concr. Res. 2019, 126, 105916. [Google Scholar] [CrossRef]
  18. Dovál, M.; Palou, M.; Mojumdar, S.C. Hydration behavior of C2S and C2AS nanomaterials, synthetized by sol–gel method. J. Therm. Anal. Calorim. 2006, 86, 595–599. [Google Scholar] [CrossRef]
  19. Thissen, P.; Natzeck, C.; Giraudo, N.; Weidler, P.; Wöll, C. Hydration of Concrete: The First Steps. Chem. A Eur. J. 2018, 24, 8603–8608. [Google Scholar] [CrossRef]
  20. Zhang, Y.; Lu, X.; He, Z.; Song, D. Molecular and dissociative adsorption of a single water molecule on a β-dicalcium silicate (100) surface explored by a DFT approach. J. Am. Ceram. Soc. 2017, 101, 2428–2437. [Google Scholar] [CrossRef]
  21. Zhang, Y.; Lu, X.; Song, D.; Liu, S. The Adsorption Behavior of a Single and Multi-Water Molecules on Tricalcium Silicate (111) Surface from DFT Calculations. J. Am. Ceram. Soc. 2018, 102, 2075–2083. [Google Scholar] [CrossRef]
  22. Qi, C.; Liu, L.; He, J.; Chen, Q.; Yu, L.-J.; Liu, P.-F. Understanding Cement Hydration of Cemented Paste Backfill: DFT Study of Water Adsorption on Tricalcium Silicate (111) Surface. Minerals 2019, 9, 202. [Google Scholar] [CrossRef] [Green Version]
  23. Wang, Q.; Manzano, H.; López-Arbeloa, I.; Shen, X. Water Adsorption on the β-Dicalcium Silicate Surface from DFT Simulations. Minerals 2018, 8, 386. [Google Scholar] [CrossRef] [Green Version]
  24. Huang, J.; Wang, B.; Yu, Y.; Valenzano, L.; Bauchy, M.; Sant, G. Electronic Origin of Doping-Induced Enhancements of Reactivity: Case Study of Tricalcium Silicate. J. Phys. Chem. C 2015, 119, 25991–25999. [Google Scholar] [CrossRef]
  25. Saritas, K.; Ataca, C.; Grossman, J.C. Predicting Electronic Structure in Tricalcium Silicate Phases with Impurities Using First-Principles. J. Phys. Chem. C 2015, 119, 5074–5079. [Google Scholar] [CrossRef]
  26. Tao, Y.; Li, N.; Zhang, W.; Wang, F.; Hu, S. Understanding the zinc incorporation into silicate clinker during waste co-disposal of cement kiln: A density functional theory study. J. Clean. Prod. 2019, 232, 329–336. [Google Scholar] [CrossRef]
  27. Tao, Y.; Zhang, W.; Shang, D.; Xia, Z.; Li, N.; Ching, W.-Y.; Wang, F.; Hu, S. Comprehending the occupying preference of manganese substitution in crystalline cement clinker phases: A theoretical study. Cem. Concr. Res. 2018, 109, 19–29. [Google Scholar] [CrossRef]
  28. De Noirfontaine, M.-N.; Dunstetter, F.; Courtial, M.; Gasecki, G.; Signes-Frehel, M. Polymorphism of tricalcium silicate, the major compound of Portland cement clinker. Cem. Concr. Res. 2006, 36, 54–64. [Google Scholar] [CrossRef]
  29. Fukuda, K.; Ito, S. Improvement in Reactivity and Grindability of Belite-Rich Cement by Remelting Reaction. J. Am. Ceram. Soc. 1999, 82, 2177–2180. [Google Scholar] [CrossRef]
  30. Kresse, G.; Furthmüller, J. Efficiency of ab-initio total energy calculations for metals and semiconductors using a plane-wave basis set. Comput. Mater. Sci. 1996, 6, 15–50. [Google Scholar] [CrossRef]
  31. Kresse, G.; Furthmüller, J. Efficient iterative schemes for ab initio total-energy calculations using a plane-wave basis set. Phys. Rev. B Condens. Matter Mater. Phys. 1996, 54, 11169–11186. [Google Scholar] [CrossRef]
  32. Kresse, G.; Hafner, J. Ab initio molecular dynamics for liquid metals. Phys. Rev. B 1993, 47, 558–561. [Google Scholar] [CrossRef] [PubMed]
  33. Perdew, J.P.; Burke, K.; Ernzerhof, M. Generalized Gradient Approximation Made Simple. Phys. Rev. Lett. 1996, 77, 3865–3868. [Google Scholar] [CrossRef] [PubMed] [Green Version]
  34. Bader, R.F.W. A quantum theory of molecular structure and its applications. Chem. Rev. 1991, 91, 893–928. [Google Scholar] [CrossRef]
  35. Tang, W.; Sanville, E.; Henkelman, G. A grid-based Bader analysis algorithm without lattice bias. J. Phys. Condens. Matter 2009, 21, 084204. [Google Scholar] [CrossRef]
  36. Mahmoodi, T.; Mansouri, M. Structural effects of substitutional impurities on MoO3 bilayers: A first principles study. J. Korean Phys. Soc. 2016, 69, 1439–1444. [Google Scholar] [CrossRef]
  37. Jost, K.H.; Ziemer, B.; Seydel, R. Redetermination of the structure of β-dicalcium silicate. Acta Crystallogr. Sect. B Struct. Crystallogr. Cryst. Chem. 1977, 33, 1696–1700. [Google Scholar] [CrossRef] [Green Version]
  38. Tasker, P.W. The stability of ionic crystal surfaces. J. Phys. C Solid State Phys. 1979, 12, 4977–4984. [Google Scholar] [CrossRef]
  39. Noguera, C. Polar oxide surfaces. J. Phys. Condens. Matter 2000, 12, R367–R410. [Google Scholar] [CrossRef]
  40. Tao, Y.; Zhang, W.; Li, N.; Ching, W.-Y.; Wang, F.; Hu, S. Atomic-level insights into the influence of zinc incorporation on clinker hydration reactivity. Open Ceram. 2020, 1, 100004. [Google Scholar] [CrossRef]
  41. Hewlett, P.C.; Liska, M. Lea’s Chemistry of Cement and Concrete; Butterworth-Heinemann: Oxford, UK, 2019. [Google Scholar]
  42. Chan, C.-J.; Kriven, W.M.; Young, J.F. Analytical Electron Microscopic Studies of Doped Dicalcium Silicates. J. Am. Ceram. Soc. 1988, 71, 713–719. [Google Scholar] [CrossRef]
Figure 1. Initial water configuration for the (a) molecular and (b) dissociative water adsorption on the β-C2S (100) surface (side view).
Minerals 10 00665 g001
Figure 2. Water adsorption configuration of: (a) dissociative adsorption on the β-C2S (100) surface, (b) molecular adsorption on the β-C2S (011) surface, (c) dissociative adsorption on the M3-C3S (101) surface, and (d) molecular adsorption on the M3-C3S (100) surface. Note: 1—side view and 2—top view.
Minerals 10 00665 g002
Figure 3. Partial density of states (PDOS) of the water adsorption on the Mg-doped β-C2S (100) and (011) surfaces: (a) dissociative adsorption on the Mg-doped β-C2S (100) surface-Ow bonding, (b) dissociative adsorption on the Mg-doped β-C2S (100) surface-Hd bonding, and (c) molecular adsorption on Mg-doped β-C2S (011) surface. Note: right sub-figures are enlarged representations of regions in the box and the Fermi energy was set at 0.00 eV.
Minerals 10 00665 g003
Figure 4. Distribution of surface Mg-O bond length that was involved in water adsorption: (a) dissociative adsorption on β-C2S surfaces, (b) molecular adsorption on β-C2S surfaces, (c) dissociative adsorption on M3-C3S surfaces, and (d) molecular adsorption on M3-C3S surfaces.
Minerals 10 00665 g004
Figure 5. The influence of water adsorption on the Bader charge of surface atoms that were involved in the bond formation: (a) β-C2S surfaces, and (b) M3-C3S surfaces. Note: numbers in the box are mean values.
Minerals 10 00665 g005
Figure 6. Decomposed charge density of the molecular adsorption on the β-C2S (011) surface: (a) ρTVB before adsorption, (b) ρTVB after adsorption, (c) ρBCB before adsorption, and (d) ρBCB after adsorption. Note: isosurface level was 0.05 eV for ρTVB illustration and 0.02 eV for ρBCB illustration.
Minerals 10 00665 g006
Figure 7. Comparison of Ead of a single water molecule on pristine and Mg-doped surfaces of: (a) β-C2S, and (b) M3-C3S. Note: the dis and free in the y-axis represents dissociated water and free water in the initial configuration.
Minerals 10 00665 g007
Figure 8. The dissociative adsorption configuration on the M3-C3S (111) surface of: (a) pristine surface, and (b) Mg-doped surface.
Minerals 10 00665 g008
Table 1. Impurity formation energy (Efor) of Mg substituting for Ca in low-index calcium silicates surfaces.
Calcium Silicate PhaseLow-Index SurfacesEfor (eV)Calcium Silicate PhaseLow-Index SurfacesEfor (eV)
β-C2S(100)0.82M3-C3S(100)0.46
(010)0.74(010)0.53
(001)1.21(001)0.76
(110)0.78(110)0.19
(101)0.51(101)1.58
(011)0.94(011)0.48
(111)0.51(111)−0.02
Table 2. Ead (eV) of a single H2O over Mg-doped surfaces of β-C2S and M3-C3S.
β-C2SDissociatedFreeM3-C3SDissociatedFree
(100)−1.249 (D)(100)−1.624 (D)−0.699 (M)
(010)−0.869 (D)−0.937 (M)(010)−1.786 (D)−0.938 (M)
(001)−0.994 (M)−0.915 (M)(001)−1.708 (D)−0.868 (M)
(110)−0.952 (M)(110)−3.028 (D)−1.089 (M)
(101)−0.765 (M)−0.831 (M)(101)−4.008 (D)−2.711 (D)
(011)−0.598 (D)−1.116 (M)(011)−2.192 (D)
(111)−0.982 (M)−0.817 (M)(111)−1.454 (D)
Note: Dissociated and free represent the initial configuration of the H2O, M, and D in the brackets represent molecular and dissociative adsorption, respectively, after relaxation.
Table 3. Adsorption configurations of the H2O over Mg-doped β-C2S surfaces with respect to the adsorption energy in eV.
SurfacesSummary of Bonding
(100)−1.249D: Mg-Ow, Ca-Ow, Os-Hd, Ow--Hd
(010)−0.869D: Mg-Ow, Os-Hd, Ow--Hd; −0.937M: Mg-Ow, Os--H
(001)−0.994M and −0.915M: Mg-Ow, Os--H
(110)−0.952M: Mg-Ow, Os--H
(101)−0.765M and −0.831M: Mg-Ow, Os--H
(011)−0.598D: Mg-Ow, Ca-Ow(2), Os-Hd, Os--Hd; −1.116M: Ca-Ow
(111)−0.982M: Ca-Ow, Os-H(2); −0.817M: Ca-Ow, Os-H
Note: abbreviations in bold represent the adsorption energy (the number) and adsorption type (D stands for dissociative and M stands for molecular); Ow represents O atoms from the water molecule, Os represents surface O atoms, Hd represents the dissociated proton, ‘-‘ represents bonds formation, ‘--’ represents the two atoms are attracted to each without bond formation; the hydroxyl group from the water molecule is not shown for clarity.
Table 4. Adsorption configurations of the H2O over Mg-doped M3-C3S surfaces with respect to the adsorption energy in eV.
SurfacesSummary of Bonding
(100)−1.624D: Mg-Ow, Ca-Ow(2), Os--Hd; −0.699M: Mg-Ow
(010)−1.786D: Mg-Ow, Ca-Ow, Os-Hd; −0.938M: Mg-Ow, Os--H
(001)−1.708D: Mg-Ow, Ca-Ow(2), Os-Hd, Ow--Hd; −0.868M: Mg-Ow, Os--H
(110)−3.028D: Mg-Ow, Ca-Ow, Os-Hd, Os--Hd; −1.089M: Mg-Ow
(101)−4.008D: Mg-Ow, Ca-Ow, Os-Hd; −2.711D: Mg-Ow, Ca-Ow(2), Os-Hd
(011)−2.192D: Mg-Ow, Ca-Ow, Os-Hd, Ow--Hd
(111)−1.454D: Ca-Ow, Os-Hd, Ow--Hd
Note: abbreviations are explained in Table 3.

