Article

Hydrogeochemical Behavior of Reclaimed Highly Reactive Tailings, Part 2: Laboratory and Field Results of Covers Made with Mine Waste Materials

by
Alex Kalonji-Kabambi
1,*,
Bruno Bussière
1,2 and
Isabelle Demers
1,3
1
UQAT-Polytechnique Research Institute on Mine and Environment, Rouyn-Noranda, QC J9X 5E4, Canada
2
NSERC-UQAT Industrial Chair on Mine Site Reclamation, Rouyn-Noranda, QC J9X 5E4, Canada
3
Canada Research Chair on Integration of the Environment in the Mine Life Cycle, Rouyn-Noranda, QC J9X 5E4, Canada
*
Author to whom correspondence should be addressed.
Minerals 2020, 10(7), 589; https://doi.org/10.3390/min10070589
Submission received: 28 April 2020 / Revised: 26 June 2020 / Accepted: 29 June 2020 / Published: 30 June 2020
(This article belongs to the Special Issue Reutilization and Valorization of Mine Waste)

Abstract

:
The possibility of using mine wastes (low-sulfide tailings and waste rocks) as cover components to prevent acid mine drainage (AMD) generation from highly reactive tailings was previously investigated through a laboratory-based characterization of reactive tailings and cover materials (Part 1 of this study). Characterization results showed that the reactive tailings are highly acid-generating, and that the mine waste materials that were used in this study are non-acid-generating and have suitable hydrogeological and geochemical properties to be used in a cover with capillary barrier effects (CCBE). In order to further investigate the use of low-sulfide mining materials in the reclamation of highly reactive tailings, a large laboratory-based column and a field cell simulating a CCBE were constructed. The instrumented field cell used the same configuration and materials as the laboratory column. This paper presents the main findings from 504 days (column test) and three seasons (field test) of monitoring, and compares the hydrogeochemical behavior observed at the two scales. The results show that a CCBE made with low-sulfide mine wastes would be efficient at reducing oxygen fluxes and limiting AMD generation from highly reactive tailings at the laboratory and intermediate scale. However, at these two scales, the concentrations of some contaminants were not reduced to levels of the legally imposed environmental objectives. The results also showed differences in metal and sulfate concentrations in the drainage waters between the laboratory and field scales. The outcomes from this investigation highlight that the previous oxygen flux design targets and the typical configurations of multilayer covers developed for fresh non-oxidized tailings or pre-oxidized tailings may not always be directly applicable for fresh or pre-oxidized highly reactive tailings.

1. Introduction

This study is part of a research program which aims at evaluating the use of alternative materials in cover systems used to reclaim mine sites [1,2,3,4,5,6,7,8,9]. Materials for this study were gathered from the LaRonde mine site, which is located approximately 47 km west of Rouyn-Noranda (48°15′16″ N, 78°26′4″ W; Quebec, Canada) and is owned and operated by Agnico Eagle Mines (AEM, Canada). The site has been in operation and producing precious and base metals since 1957. The LaRonde deposit is composed of gold–copper and zinc–silver mineralization in the form of lenticular layers of massive and disseminated sulfides. Copper and zinc concentrates are produced by flotation and gold and silver ingots are produced by cyanidation and electrowinning. The LaRonde underground mining complex generates approximately 2.4 Mt of acid-generating tailings annually, which are disposed in a 165 ha tailings storage facility (TSF; Figure 1).
The LaRonde mine is currently in the process of identifying an optimal reclamation scenario for its acid-generating TSF. The review of existing reclamation techniques and the identification of reclamation methods for the LaRonde TSF were carried out. This selection process took into consideration the management of water at closure, the long-term physical and chemical stability of the storage facilities, the availability of cover materials, and the different sectors of the storage facilities (dikes, cofferdams, central part). One of the promising options for controlling AMD generation in the LaRonde TSF is the use of a cover with capillary barrier effects (CCBE) made with low-sulfide mine wastes.
Part 1 of this study presented the laboratory characterization work performed on the reactive LaRonde mine tailings and selected mine waste cover materials (i.e., low-sulfide tailings and waste rocks). It also examined the geochemical behavior of the uncovered reactive tailings at an intermediate field scale. The main conclusions of this study were that the low-sulfide mine wastes had the appropriate geochemical and hydrogeological properties for use as cover materials in a CCBE. The results also showed that the LaRonde tailings are highly reactive, with a pore water pH close to 2 and high concentrations of metals and sulfates. It has also been observed that the reactivity of the tailings was generally higher in the field than in the laboratory.
In Part 2 of this study, the authors use laboratory- and field-based experiments to test the capacity of a CCBE to control AMD generation from the LaRonde mine tailings. Laboratory column tests are commonly used to assess the hydrogeological and geochemical behavior of reclamation scenarios [4,6,7,10,11,12,13,14]. Several authors [15,16,17,18,19,20,21] have also stressed the importance of intermediate field scale experiments as tools in predicting cover performance at full scale. Indeed, intermediate field scale tests enable a more accurate accounting of site-specific, transient climatic conditions (e.g., temperature, precipitation, and freeze–thaw and wet–dry cycles) on the system’s geochemical behavior [20].
This study presents the results from the main laboratory and field hydrogeochemical experiments and evaluates the performance of the proposed cover system. The emphasis is on the capacity of a CCBE made with low-sulfide mine wastes to control the effluent quality from the highly reactive LaRonde tailings in the laboratory and in the field at an intermediate scale. The efficiency of the tested cover system with respect to controlling oxygen migration and the generation of contaminants is also quantified using various approaches.

2. Summary of the Material Characterization Results

Material characterizations for the reactive tailings (TR) and cover materials (i.e., low-sulfide tailings and waste rocks) were presented in Part 1 of this study [22]. Table 1 summarizes the most important mineralogical, geochemical, hydrogeological, and physical parameters of each material. This includes the total sulfur (Stotal), total carbon (Ctotal), net neutralization potential (NNP), effective reaction rate coefficient (Kr), specific gravity (GS), and saturated hydraulic conductivity (ksat).
The TR had a high acid-generating potential (AP; 531 kg CaCO3 eq/t) and negative net neutralization potential (NNP; −528 kg CaCO3 eq/t). Pyrite was the main sulfide mineral that was identified in the TR, which did not contain any carbonate minerals. The TR were highly acid-generating, while the mine waste cover materials (TG—low-sulfide tailings, WP—potentially acid-generating waste rocks, and WL—non-acid-generating waste rocks) were non-acid-generating. The hydrogeological properties of materials were similar to those found in the literature for other tailings and waste rocks [22]. The contrast between the ksat values of the fine and coarse materials was nearly three orders of magnitude, and thus expected to create the desired capillary barrier effects.

3. Materials and Methods

3.1. Construction and Instrumentation of the CCBE Column and Field Cell

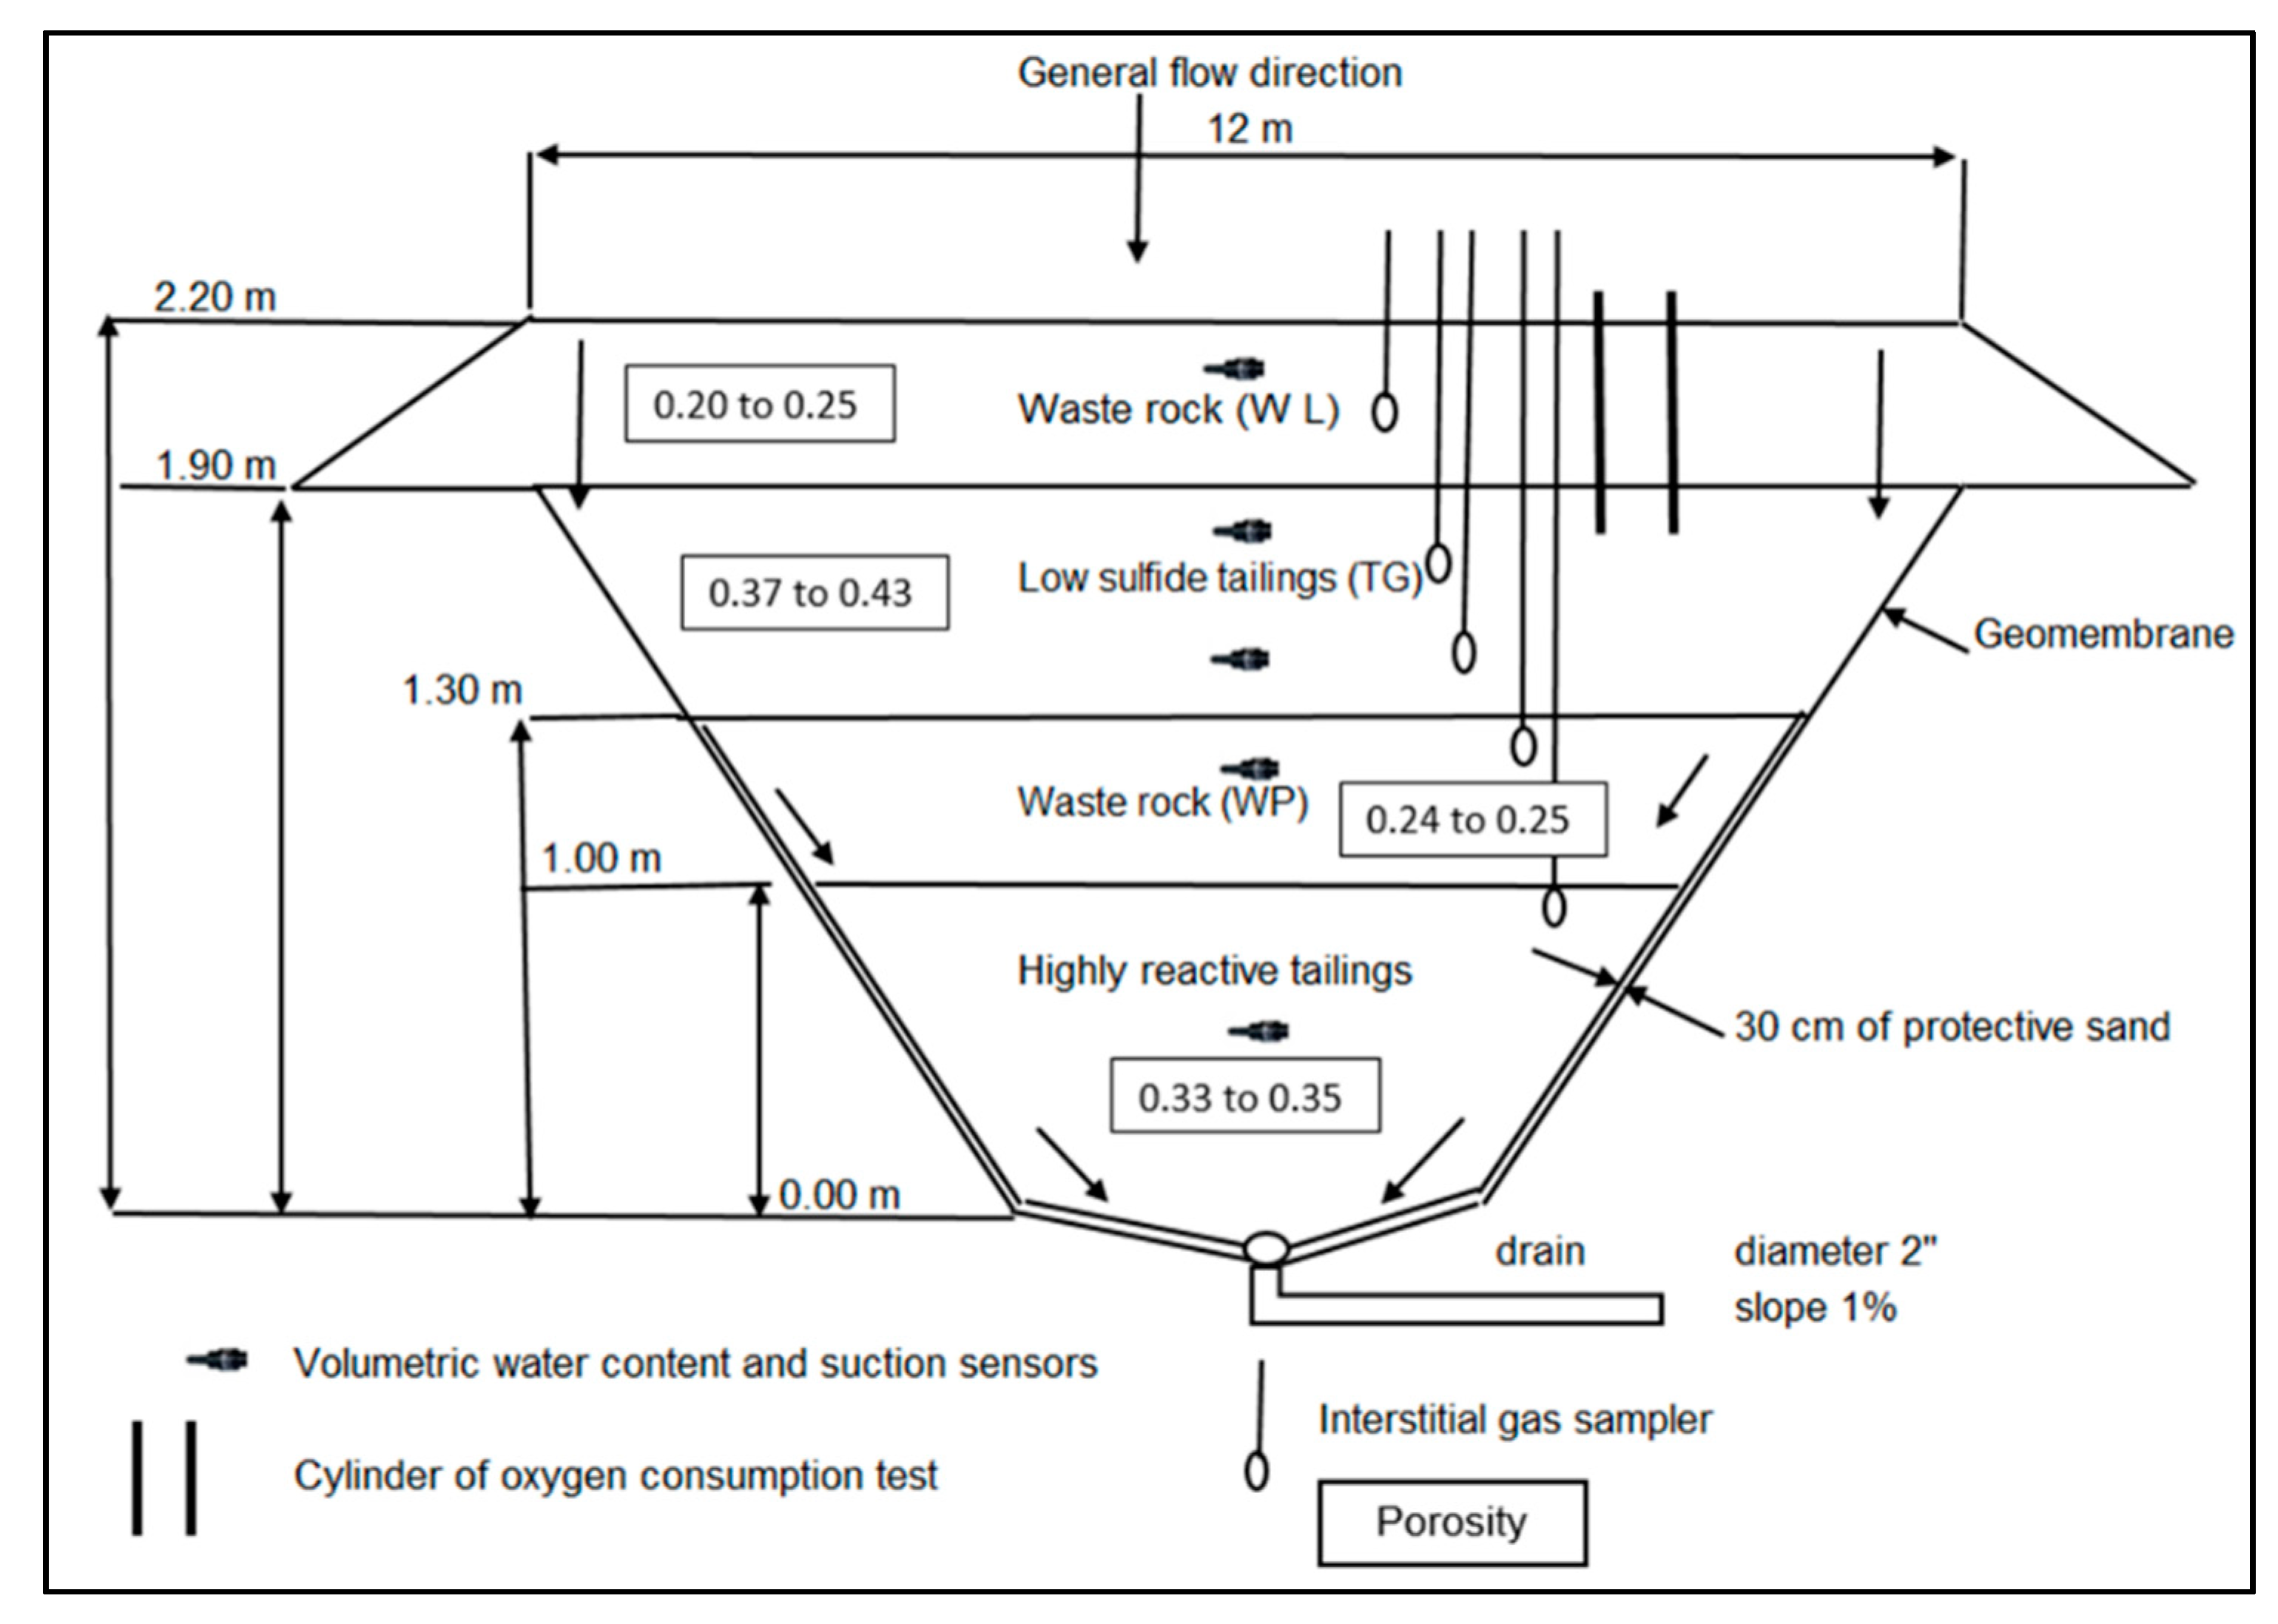
An HDPE column 170 cm in height and 30 cm in diameter was constructed to study the hydrogeochemical behavior of a CCBE made with mine waste materials. The column was filled from bottom to top with: TR (0.3), WP (0.3) as the bottom capillary break layer (CBL), TG (0.6 m) as the fine-grained moisture-retaining layer (MRL), and WL as the top CBL (0.3 m) or drainage layer (Figure 2). The reactive tailings and cover materials were placed in the column in 10- to 20-cm-thick layers and compacted using a Proctor hammer until reaching the target porosity (approximately 0.45 and 0.35 for the tailings and waste rock, respectively). The top of the column was left open to the atmosphere. The laboratory column required a gas relief valve to avoid a gas lock or a vacuum during drainage from a saturated condition at the beginning of each cycle [23]. A nitrogen-filled gas bag was attached to a valve to prevent oxygen contamination during drainage (see Figure 2). The boundary condition at the bottom of the column was controlled by a porous ceramic plate and a drainpipe, which maintained the water table level approximately 2 m below the base of the column. This water table level is a typical value observed in the field and it ensures that bottom waste rock layer desaturates and generates the desired capillary barrier effects [5].
Every 28 to 30 days, 7 L of deionized water was added at the top of the laboratory column. This volume was selected because it represents the void volumes of the TR layer, which also corresponds to approximately 70% of the monthly average precipitation based on the average local climate [1,24,25]. A total of 18 cycles (504 days) were applied to the laboratory column. Effluents from the column were recovered after a maximum flush time of 48 hours for each cycle and submitted to various physicochemical analyses [22].
The laboratory column was equipped with 5TM and GS3 sensors and an Em50 data logger (version 4, Decagon Devices, Pullman, WA, United States) that recorded the volumetric water content (θ) at various depths in the tailings and waste rocks, respectively (Figure 2).
The EC5 and GS3 probes were calibrated to the specific material prior to installation to improve the accuracy of measurements (±0.03 m3/m3 for a range of 0 to 100% humidity; see [26] for details). Suction (ψ) measurements were performed using WATERMARK sensors (model 200SS, IRROMETER Company, Riverside, CA, USA), which have a measurement range from 0 to 200 kPa and an accuracy of 1 kPa. Data points were acquired every four hours for θ and twice per month for ψ (i.e., at the beginning and end of the drainage cycles).
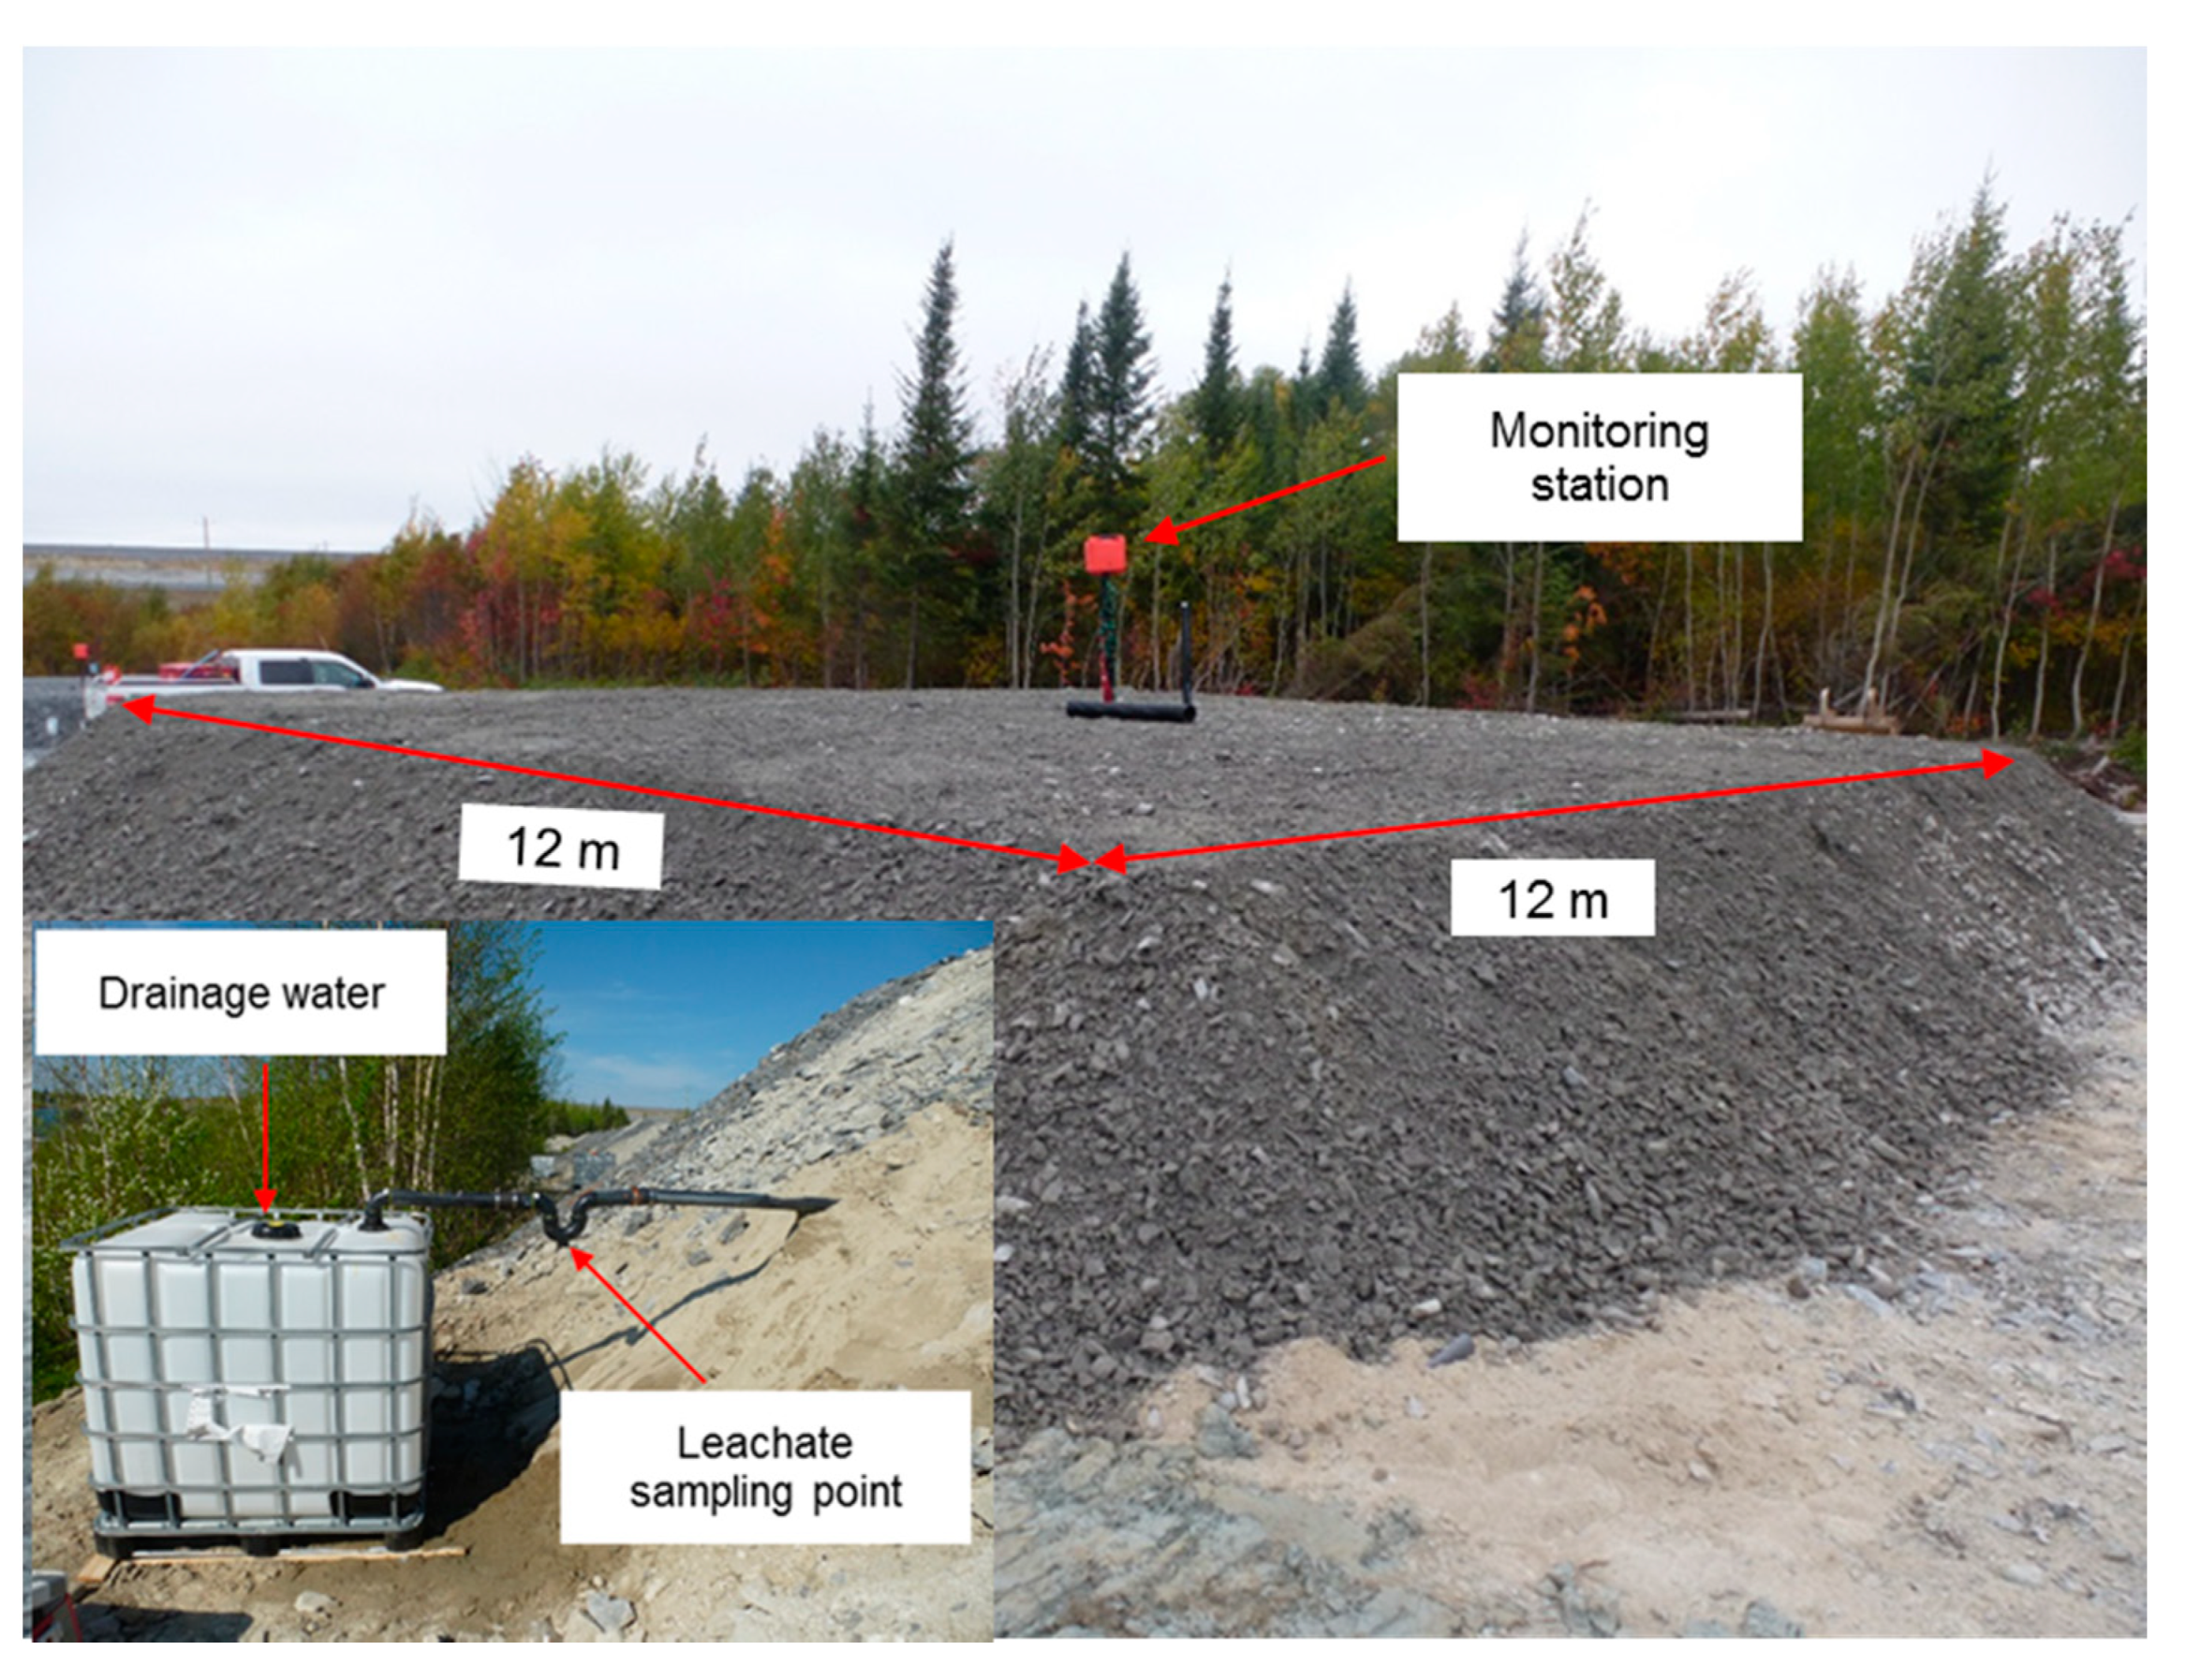
The field experimental cell was built in early autumn 2016 at the LaRonde mine site; similar cells have been used to assess the performance of reclamation scenarios to control AMD [16,17,18,27]. An excavation was created in a waste rock pad with a hydraulic excavator. The periphery of the excavation was filled with waste rock to give the cells the shape of an inverted truncated pyramid. The interior sides of the cell were sloped (2H:1V) to obtain the desired size and geometry, lined with a geomembrane (Figure 3a), and a drainpipe was installed at the bottom to recover water drainage from the cell (see [22] for more details). The cell was filled with the same materials as the laboratory column from the bottom to the top: TR (1.00), WP (0.30), TG (0.60), and WL (0.30 m) (Figure 3b,c). The surface of the cell was horizontal and had an area of approximately 144 m2 (12 m × 12 m) (Figure 4). The top of the cell was open to natural infiltration. The outlet of the water drain was equipped with a sampling point and connected to a tote tank with a capacity of more than 1000 L in order to quantify the volume of the drainage water (Figure 4).
Drainage waters from the cell were collected once every two weeks during the non-frozen months (May to October) over a period of three years (2017–2019). The biweekly samples for each month were mixed to form a composite sample for metal and sulfate analyses. Details on samples preparation and preservation before analyses can be found in the companion paper (Kalonji–Kabambi et al., 2020). Measurements of pH, EC, Eh, acidity, and alkalinity were performed on each sample. The pH, Eh, and EC of the leachates were measured directly on site after sampling (to avoid water quality evolution during transport). All other chemical analyses were performed in the laboratory. All water samples were immediately refrigerated until analyses could be performed.
The field experimental cell was equipped in the center with a monitoring station, which was comprised of 5TM and GS3 sensors and an Em50 data logger, that recorded θ at various depths (Figure 5). Sensors were located at: 0.20 m below ground level (bgl) in the WL CBL, near the top and bottom of the MRL at 0.50 and 0.80 m bgl, in the WP CBL at 1.10 m bgl, and in the TR at 1.40 m bgl. 5TM sensors were used to monitor θ in the tailings and GS3 sensors in the waste rocks. As in the laboratory column, the 5TM and GS3 probes were calibrated for each specific material to improve measurement accuracy [26]. Suction measurements were performed using the WATERMARK sensors. The measurement frequency was fixed at one measurement every four hours for θ and once every two weeks for ψ.
Climate data (air temperature, precipitation, relative humidity, and wind speed) were obtained from Environment Canada’s meteorological station at Val d’Or airport which is located approximately 50 km southeast of the LaRonde mine site.

3.2. Oxygen Flux Measurements

One of the primary objectives of a CCBE is to reduce the oxygen fluxes reaching underlying reactive tailings. Three different approaches were used to assess oxygen fluxes in this study: The oxygen consumption test (OCT) method, the oxygen gradient method (OGM) and the sulphate-release method (SRM).

3.2.1. Oxygen Consumption Tests Method

The laboratory column and field cell were also instrumented to assess the performance of the cover system to limit oxygen migration. In the columns and the field cell, oxygen consumption tests (OCT) were performed.
In the OCT method, decreases in the oxygen concentration in an air-tight chamber are monitored over a relatively short period of time (3 to 5 h) [28,29,30,31,32]. In the column tests, OCTs were performed by hermetically sealing the top of the column with a cap to create a headspace that acted as a source reservoir of O2, and in the cell tests, OCTs were performed by hermetically sealing the top of the cylinder placed in the MRL during the cell installation with also a cap to create a headspace (Figure 5). During the tests, oxygen diffused through the cover materials and into the tailings due to the formation of a concentration gradient as oxygen was consumed via the oxidation of sulfide minerals. The progressive decrease of oxygen concentration in the headspace was monitored over time using an Apogee oxygen sensor (model SO-110, Apogee Instruments, Logan, UT, USA). Data from the OCTs were converted into oxygen fluxes using the analytical method proposed by Elberling et al. [28], which is based on Fick’s laws. This interpretation suggests the existence of a pseudo-steady-state condition, for a semi-infinite reactive homogeneous media. This method provides the surface flux of O2, which could be influenced by the fact that the cover materials (TG) contain a small amount of sulfides. One to two oxygen consumption tests were performed per year for the field experimental cell and three oxygen consumption tests were carried out for the laboratory column. OCTs were also conducted on the laboratory control column and the field control cell described in Part 1 of this study to obtain reference values (uncovered tailings) for the efficiency calculations.

3.2.2. Oxygen Gradient Method

The oxygen gradient method (OGM) consists of measuring the interstitial oxygen concentration at different depths in the cover and reactive tailings [10,28,33]. In the field cell, sampling ports were placed at the same depths as the θ and ψ probes in order to determine the degree of saturation in parallel with the oxygen gradient. Using a vacuum pump, the interstitial gas is pumped, and the oxygen concentration is measured using an optical sensor connected to the OXY 10 system (version mini, PreSens Company, Ratisbonne, Germany). Knowing the water content and the porosity in the moisture retaining layer materials of the laboratory column and the field cell, the effective diffusion coefficient (De) was estimated using the equation of Millington and Shearer [34] modified by Aachib et al. [35,36]. The results were converted into an oxygen flux using Fick’s first law (see [37,38,39]). The OGM requires a large number of measurements to properly define the oxygen concentration gradient. The spatial variation of the gradient as well as the De often bring uncertainties in the interpretation of the measurements [40]. One to two interstitial oxygen measurement tests were performed per year during the first two years of monitoring for the field experimental cell.

3.2.3. Sulfate-Release Method

The sulfate-release method (SRM) consists of measuring the sulfate concentrations in leachates to evaluate the performance of the CCBE with respect to limiting oxygen fluxes [5,28,41,42]. The SRM is based on the total mass of sulfate measured in the leachate and on the stoichiometry of the pyrite oxidation reaction, which is represented by the following equation:
FeS2 (S) + 7/2O2 + H2O → Fe2+ + 2SO42− + 2H+ (with a factor O2:SO4 = 1.75)
Based on this equation, it is possible to convert the amount of sulfate produced into moles of oxygen consumed. The stoichiometric factor used to convert results from the sulfate release method into oxygen fluxes is 1.75 moles of oxygen consumed to 1 mole of sulfate produced. This approach is valid if oxygen is the only oxidizing agent, which is realistic at near-neutral pH [5,43], and if pyrite is the only sulfide mineral, which is mostly true for the reactive tailings. Another important assumption made for converting sulfate produced into oxygen fluxes is that there is no sulfate storage in the system before measuring its concentration.
A summary of the equipment used to monitor the column and the experimental cell is presented in Table 2.

4. Results and Discussion

In the following, the main hydrogeological, water quality, and oxygen flux results obtained at the laboratory and field scales for the covered scenarios are presented. At each step, results of the two scales (lab and field) are compared.

4.1. Hydrogeological Behavior

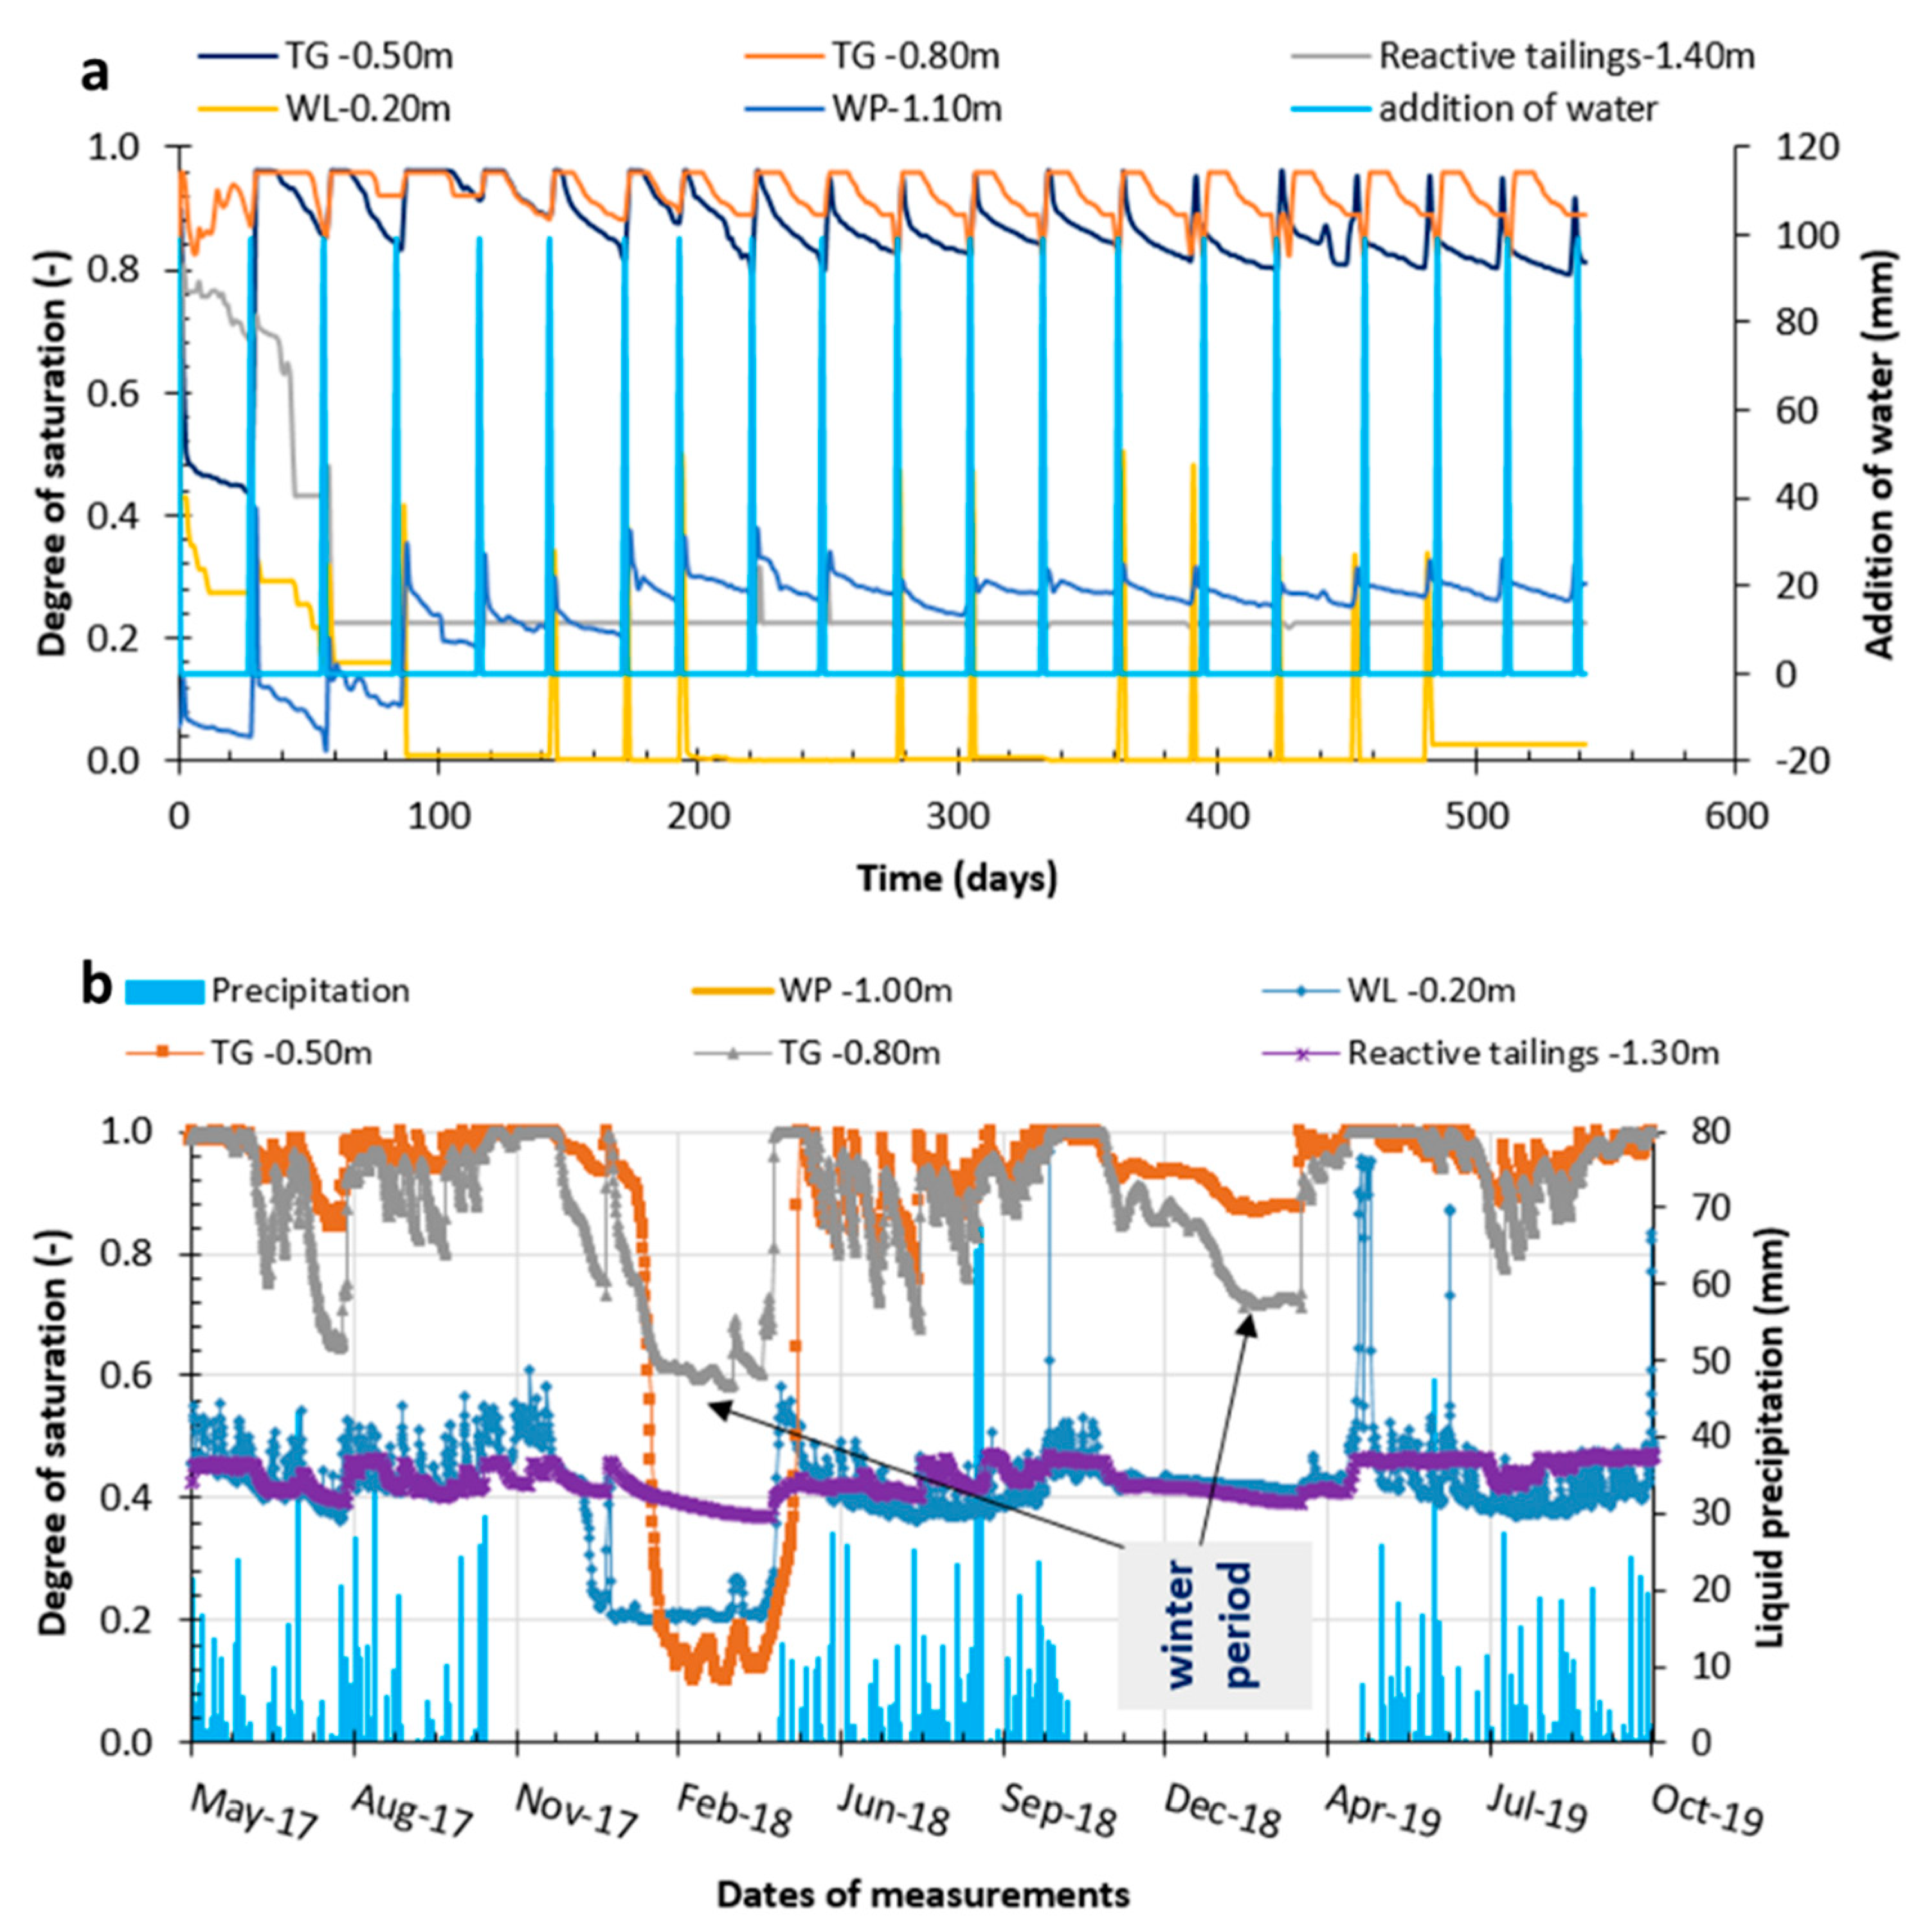
The hydrogeological behaviors of the CCBEs and the reactive tailings are presented in term of degree of saturation (Sw) and suction (ψ) values (Figure 6 and Table 3).

4.1.1. Degree of Saturation

Measured θ values were converted to Sw using the average porosity, n, of each layer that was determined at the start of the experiments (Figure 2 and Figure 5). For the laboratory column, average Sw values were between 5 and 50% in the two waste rock CBLs and between 89 and 96% in the low-sulfide MRL (Figure 6a). Sw values were higher at the beginning of each cycle when water was added to the column, then gradually reduced during the drainage period. Higher Sw values (approximately 50%) were occasionally observed in the top CBL due to the accumulation of water at the interface with the MRL; however, Sw values rapidly returned to lower values after infiltration into the MRL. As expected, Sw values were generally higher at the bottom of the MRL than at the top (due to the suction gradient).
For the experimental field cell (Figure 6b), the average Sw values were between 19 and 57% in the top WL waste rock layer and between 90 and 94% in the MRL (excluding during the frozen periods). Higher Sw values (>60%) were occasionally observed in the WL waste rock in September 2018 and April 2019, but Sw values rapidly returned to average values of around 45%. The Sw in the bottom (WP) waste rock layer was not measured because of a probe defect. In general, the Sw in the MRL varied seasonally. During spring (May–June), Sw values were higher due to snowmelt; in the summer (July and August), Sw values tended to drop (e.g., 70% at the top of the MRL in July 2018), especially during hot periods without rain; and in the fall (September–November), Sw values in the MRL approached their maximum.

4.1.2. Suction Values

Table 3 gives an overview of suction values measured over the tested period for all layers in the CCBE. For the laboratory column, average values were between 14 and 16 kPa in the MRL, and between 8 and 32 kPa in the waste rock layers. For the field cell, average values of ψ were between 9 and 13 kPa in the MRL, and between 10 and 15 kPa in the waste rock layers. The average values of ψ were usually less than the air entry value (AEV) of the MRL (25 kPa) in the laboratory column and in the field experimental cell, but during summers, some values were higher than the AEV at the top of the MRL in the field, which explains the lower Sw values.
Suction measurements confirmed the hydrogeological behavior displayed through the degree of saturation. The hydrogeological behaviors observed in the laboratory and in the field corresponded to what was expected for an effective CCBE with a nearly saturated MRL and well-drained capillary break layers made with waste rock. This confirms the existence of capillary barrier effects between the fine-grained and the coarse-grained layers [44,45,46,47].

4.1.3. Post-Testing Measurements and in Situ Water Retention Curves (WRCs)

At the end of the laboratory tests, the CCBE column was dismantled and samples were taken from several depths within the MRL. Similarly, in July 2018, coring was carried out to take samples from the MRL of the field cell. All samples were taken with a cylinder of known volume allowing for calculation of the porosity, volumetric water content, and degree of saturation in the MRL using mass–volume relationships.
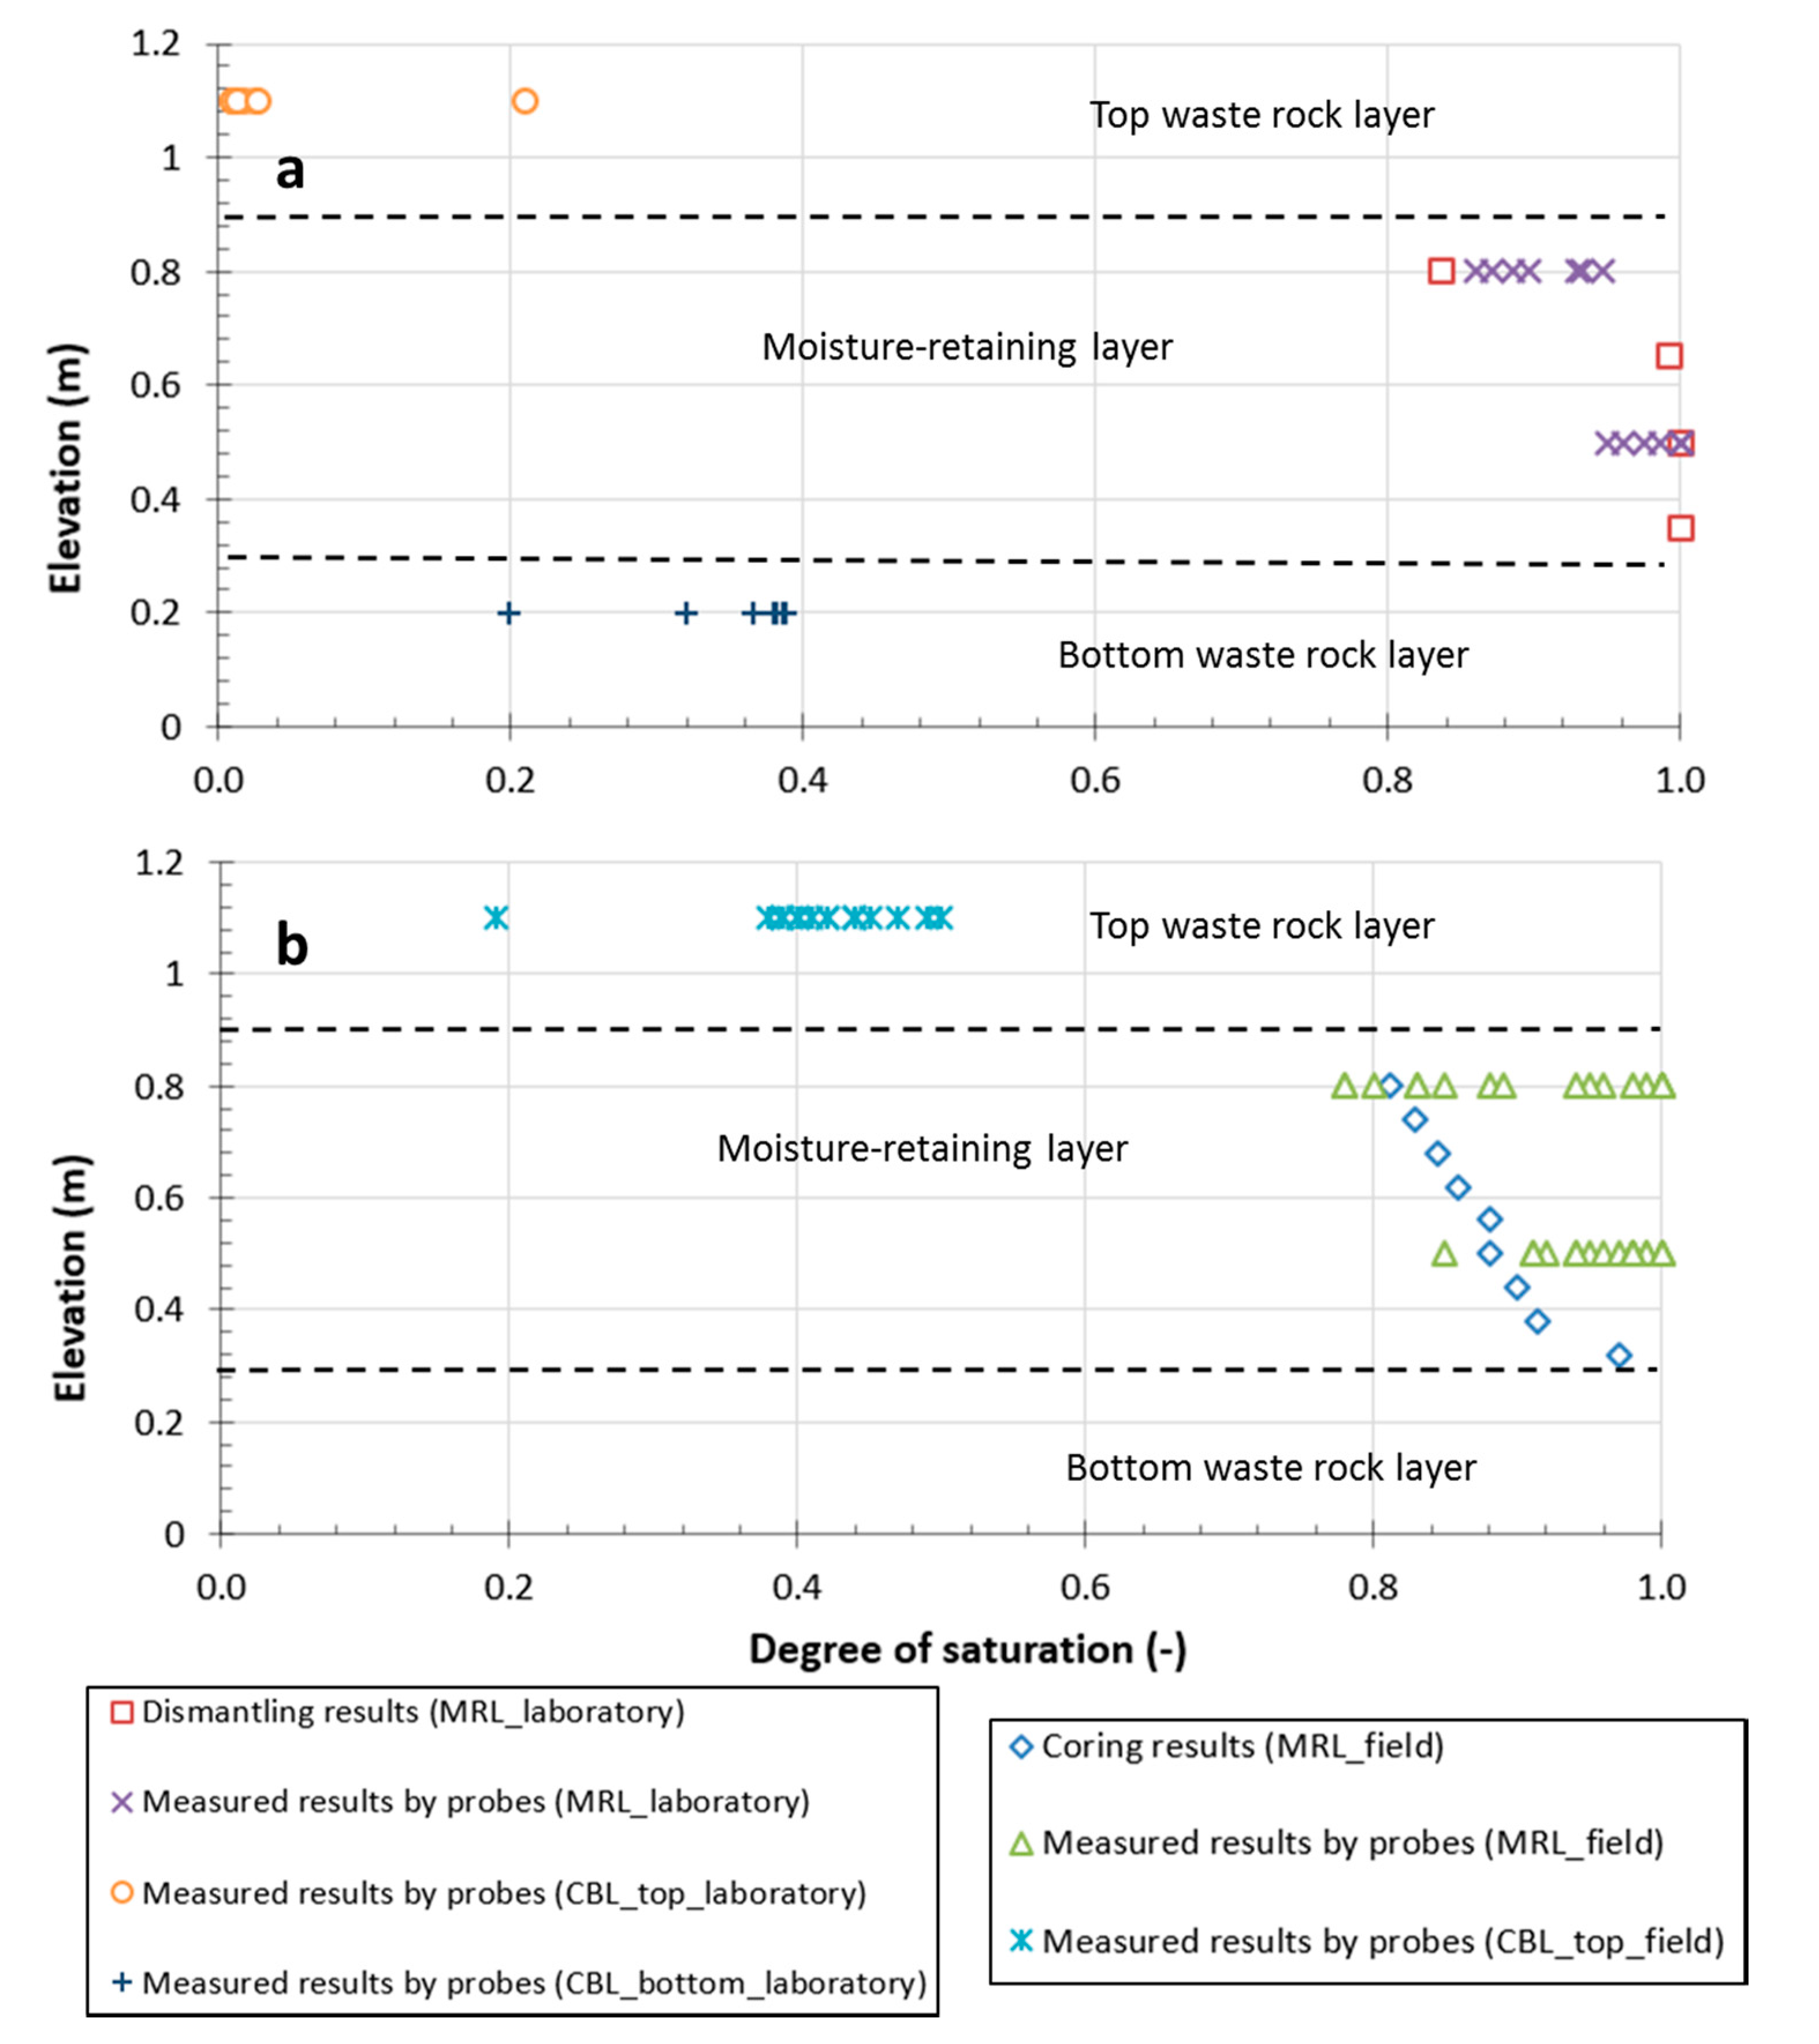
Figure 7 compares the degree of saturation (Sw) calculated from measurements made with the 5TM probes with the Sw values obtained from analyses performed on the post-testing samples. For the field cell, the probe data correspond to the average of the results measured on the fifteenth of each monitoring month (May to October) for the years 2017–2019. For the laboratory column, the probe data correspond to the average of the results measured during the wetting-drainage cycles 3, 5, 7, 9, 12, 15, and 18. The degree of saturation determined for samples taken from the column and field cell MRL and measured by probes were between 0.78 and 1.0 at the top of the layer and greater than 0.85 at the bottom of the layer. The degree of saturation values determined from probes measurements agree well with those determined from the laboratory and the field MRL samples, confirming the validity and the quality of the measurements taken in the column and the field cell.
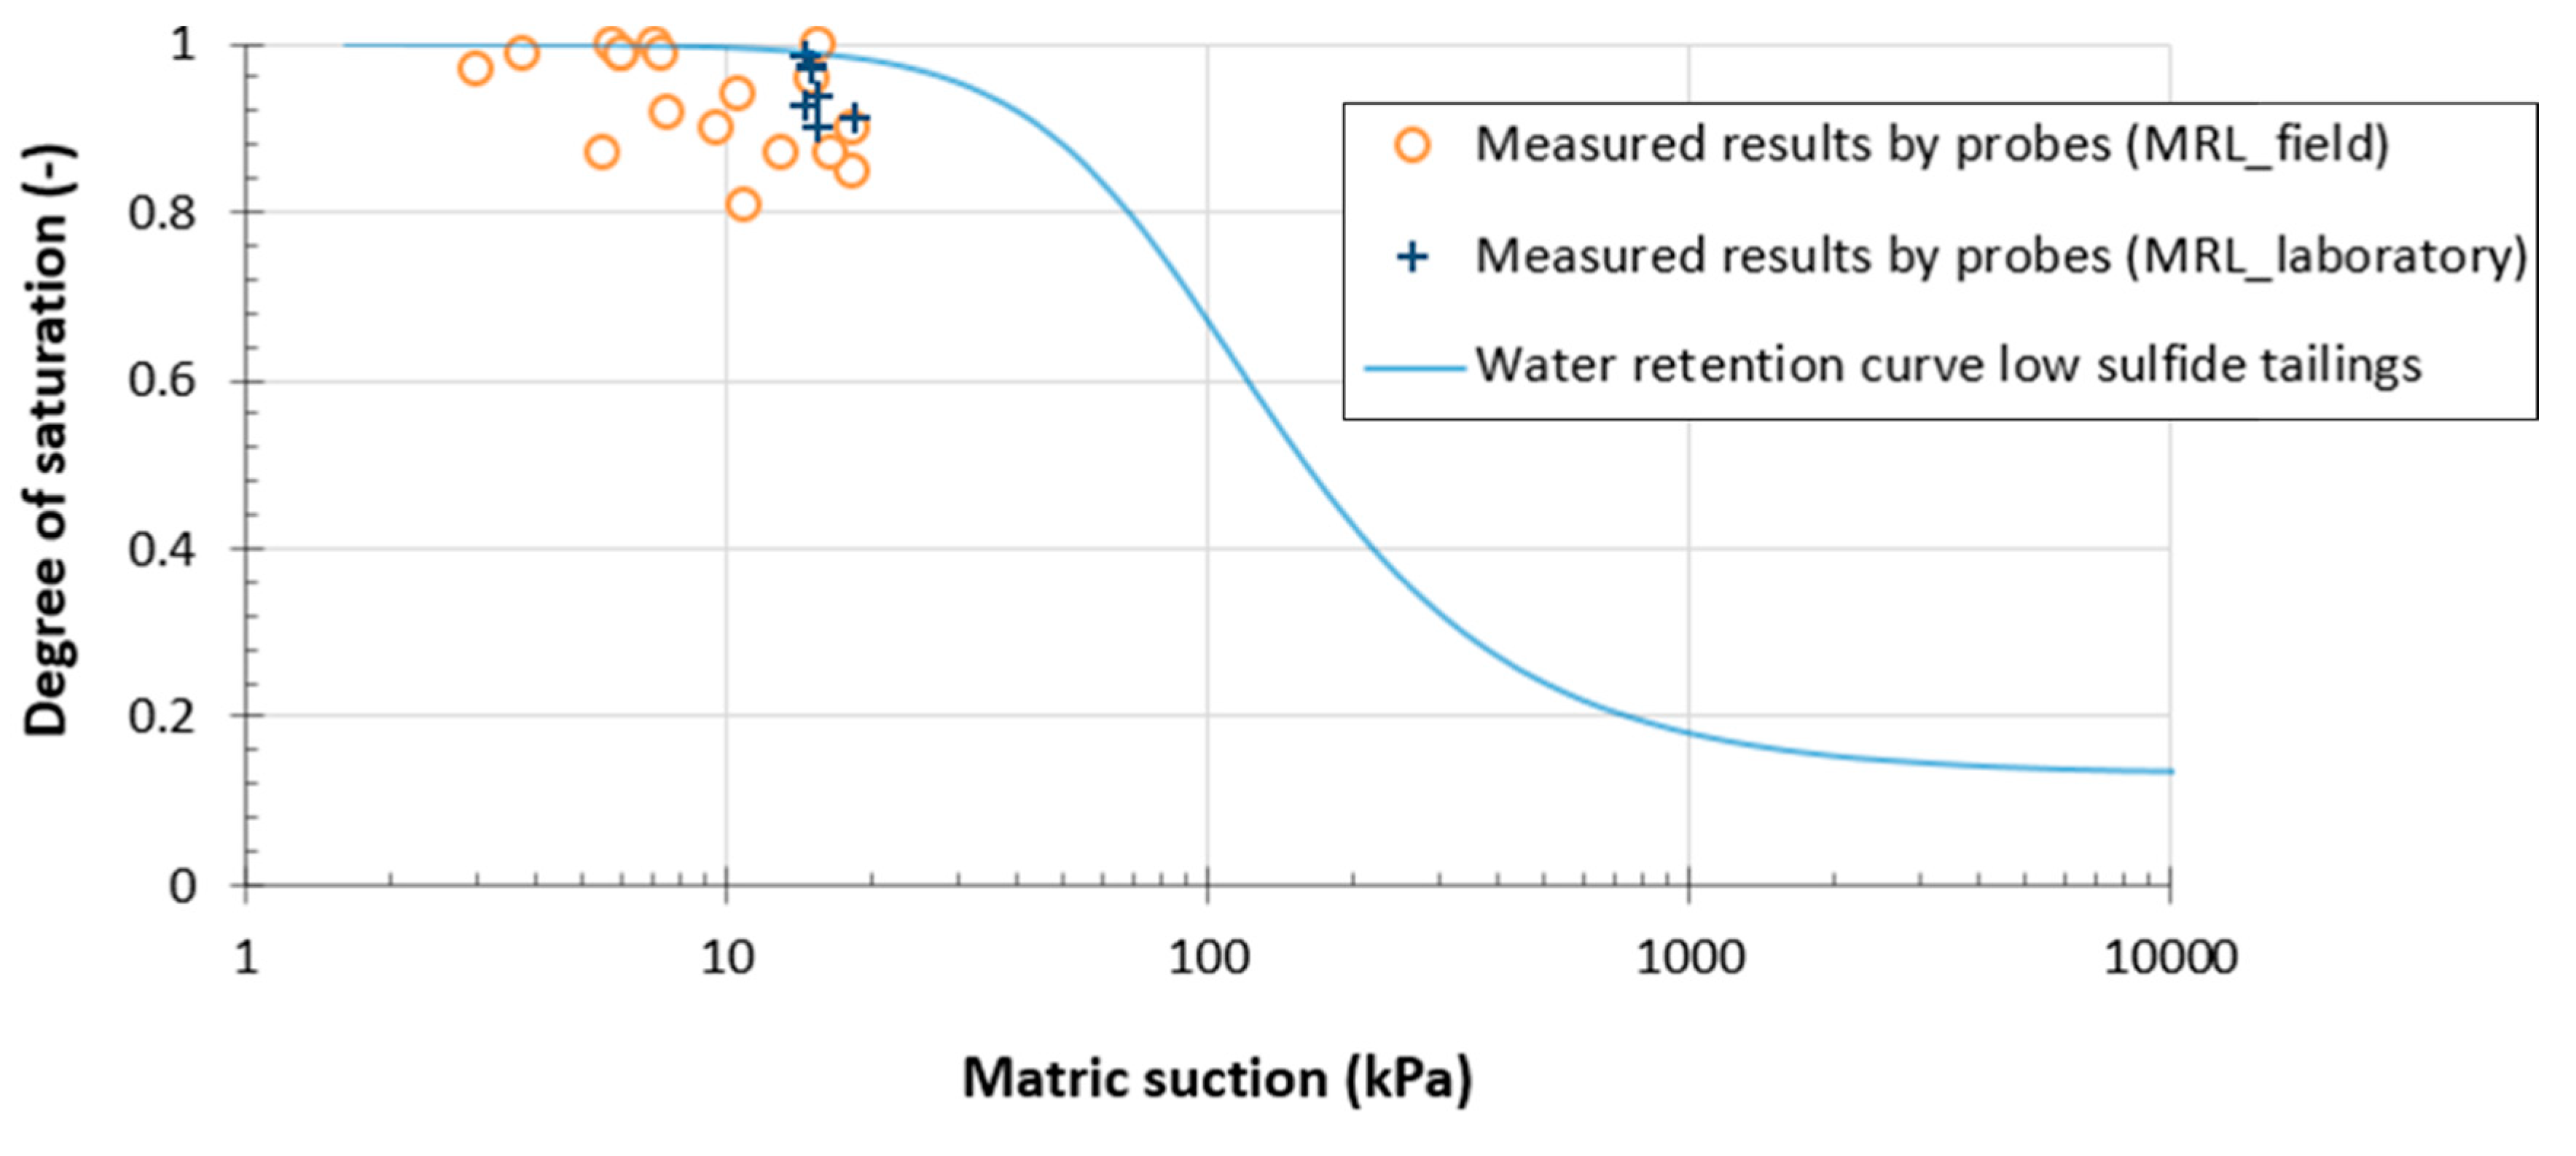
Figure 8 shows suction versus the degree of saturation based on the measured results (θ,ψ) by probes in the MRL of the CCBE column and field cell. These data are compared to the water retention curves (WRC) that were previously determined for the MRL material in the laboratory. Similar Sw-ψ values (when measured simultaneously) are observed in the column and field experimental cell. The Sw-ψ points from the column are very close to the laboratory WRC, while data from the field experimental cell are slightly more scattered. Differences between probes values and the laboratory WRC could be due to differences in porosity between the different experiments (column, field experimental cell, and Tempe cell), as well as measurement errors of the probes (Table 2). However, the differences are relatively small and confirm that the water retention properties of the material used in the MRL of the column and field experimental cell are similar to what was expected.

4.2. Water Quality

Table 4 summarizes the physicochemical quality (min, max, mean, and standard deviation) of leachates collected at the base of the laboratory column and the field cell. The table also presents the geochemical behavior of the control column and cell in order to assess the CCBE’s performance with respect to controlling the generation of contaminants. Average, minimum, and maximum laboratory values were generally higher than those of field values, while the standard deviation of values followed the same trend.
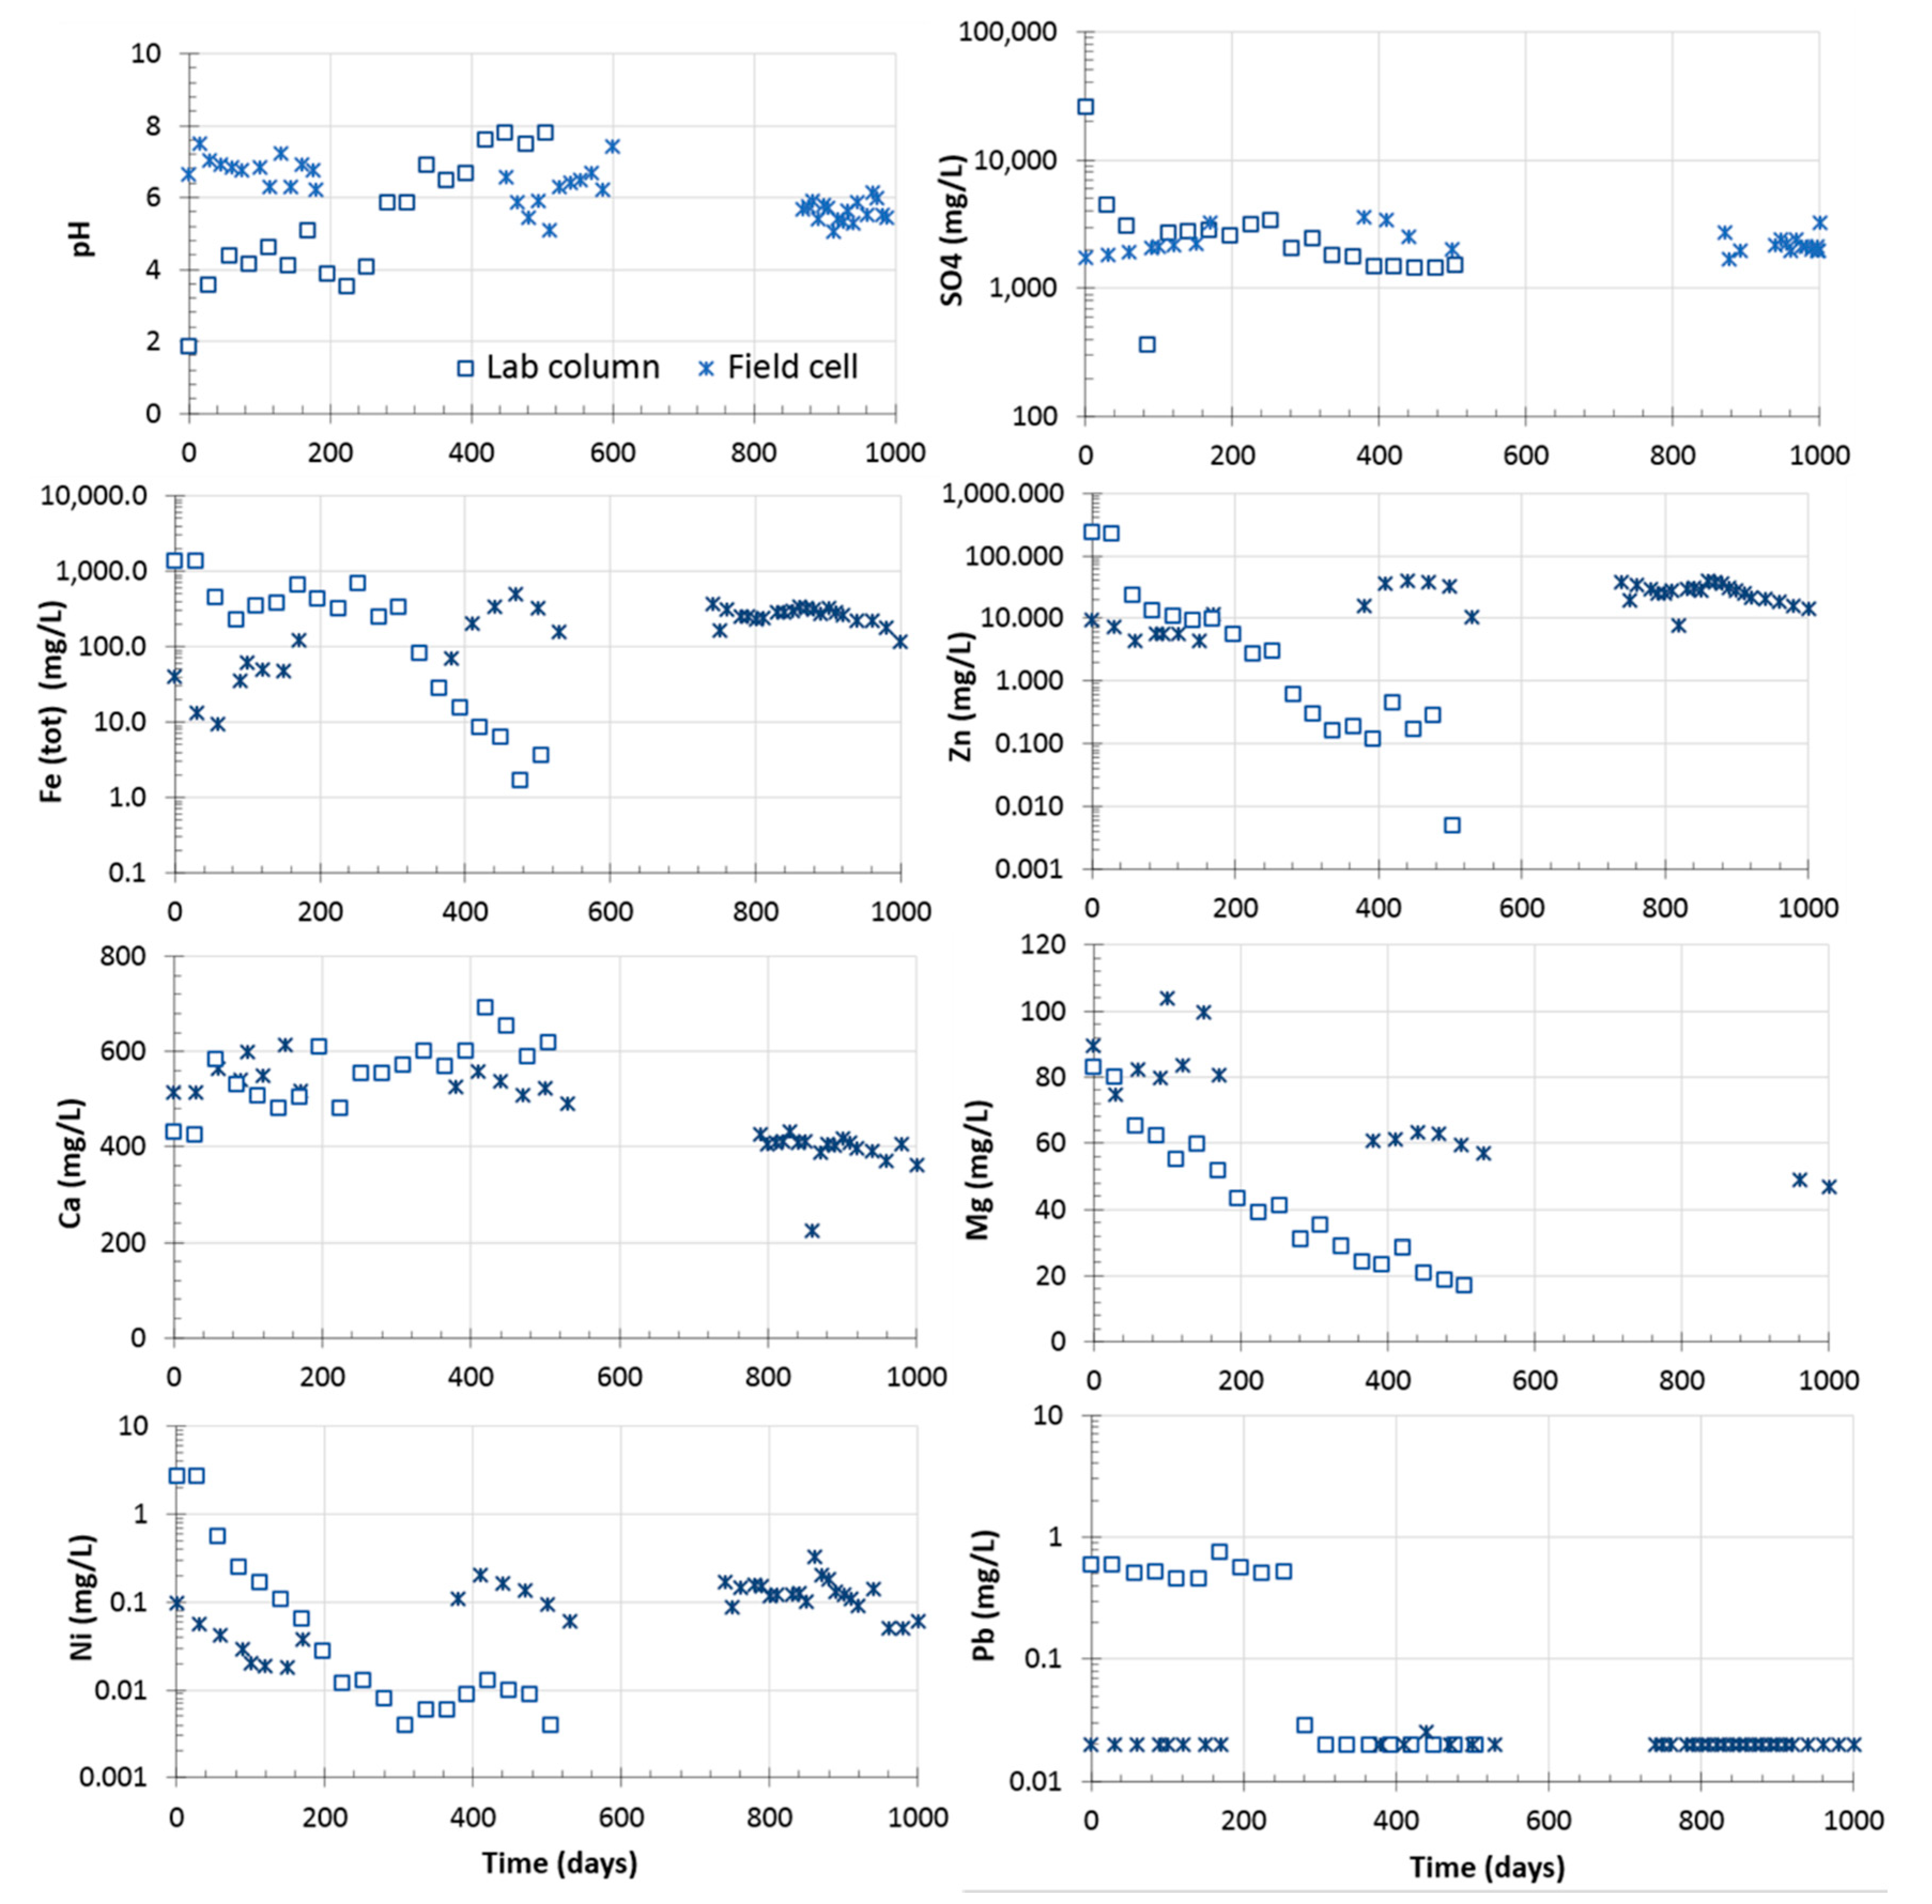
Figure 9 shows pH values, sulfate concentrations, and concentrations of different metals in drainage waters of the laboratory CCBE column and field experimental cell. In the field, the periods from 200 to 350 days and 520 to 720 days correspond to the winter periods during which leachates were not sampled because of frozen conditions.

4.2.1. Laboratory Columns

Results from the laboratory CCBE column show clearly two distinct behaviors; i.e., one before 300 days and one after 300 days. The initial sulfate concentration (26 g/L) and the pH values before 300 days (pH < 5) were influenced by the reactive tailings’ initial interstitial water quality: pH = 1.87 and Fe = 2.350, Zn = 2.940, and SO4 = 22.018 g/L. In this early period, concentrations of Fe varied from 226 to 1400 mg/L and concentrations of Zn ranged from 3 to 240 mg/L. Concentrations of Ca varied from 430 to 650 mg/L and concentrations of Mg varied from 40 to 80 mg/L. The concentrations of Ni and Pb ranged from 0.01 to 3 mg/L and from 0.4 to 0.8 mg/L, respectively. Concentrations of Ni decreased rapidly from the beginning of the test. Concentrations of As and Cu remained below the detection limits of the method (DLM, 0.06 mg/L for As and 0.003 mg/L for Cu). Concentrations of other elements, such as Al, Mn, Na, and Si (not presented here) decreased continuously over time.
For the period between day 300 and day 504, concentrations of Fe varied from 2 to 250 mg/L and concentrations of Zn ranged from <DLM to 0.6 mg/L. The concentrations of these two metals showed a decrease from 300 days due to increasing pH values. Concentrations of Ca varied from 550 to 700 mg/L and concentrations of Mg varied from 20 to 40 mg/L, with both decreasing continuously over time. Concentrations of Ni and Pb ranged from <DLM to 0.01 mg/L and ~0.02 mg /L, respectively. Lead concentrations decreased to <DLM (0.02 mg/L) at 300 days.
The pH of leachates in the laboratory control column varied between 1.2 and 2 (Table 4). High concentrations of metals and sulfate were measured in the leachates of the control column, with average values of: Fe = 1560, Zn = 230, Ca = 300, Mg = 50, As = 0.14, Pb = 0.5, Ni = 2.0, Cu = 32, and SO4 = 6300 mg/L. Differences in the mean concentrations of analytes in the control column and CCBE column were between 1 and 3 orders of magnitude. More information on the geochemical behavior of the laboratory control column can be found in the companion paper [22].

4.2.2. Field Experimental Cells

The pH of the leachates from the field CCBE cell varied from 5.0 to 7.5 and sulfate concentrations ranged from 60 to 3600 mg/L. Concentrations of Fe varied from 10 to 500 mg/L and concentrations of Zn ranged from 4 to 40 mg/L. Concentrations of these two metals increased at about 500 days (Summer 2018) due to the slight decrease in pH. Concentrations of Ca varied from 500 to 600 mg/L and concentrations of Mg varied from 60 to 100 mg/L. Nickel concentrations ranged from 0.02 to 0.33 mg/L. Similarly to the laboratory, concentrations of As, Cu, and Pb in leachates remained below the DLM during the three years of monitoring of the experimental cell. Concentration of other elements (Al, Mn, Na, and Si) continuously decreased over time. Unlike in the CCBE column test, the geochemical behavior of the field cell was relatively stable throughout the study period. This was likely because the tailings were taken directly from the TSF, in a portion of the site where the tailings were not already oxidized.
The pH of leachates in the field control cell varied between 1.0 and 5 (Table 4; more information can be found in the companion paper, Kalonji–Kabambi et al., 2020). As with the control column, high concentrations of metals and sulfate were measured in field control cell. Average values were: Fe = 4330, Zn = 170, Ca = 370, Mg = 300, As = 4.0, Pb = 7.0, Ni = 2.0, Cu = 15, and SO4 = 18,000 mg/L. Mean concentrations of Fe, Mg, Ca, As, Pb, and SO4 in the control cell were generally higher than concentrations in the control column. Differences in the mean concentrations of analytes in the field control cell leachates and CCBE field cell leachates were also between 1 to 3 orders of magnitude. More information on the geochemical behavior of the field control cell can be found in the companion paper [22].

4.3. Oxygen Fluxes

4.3.1. Oxygen Consumption Test

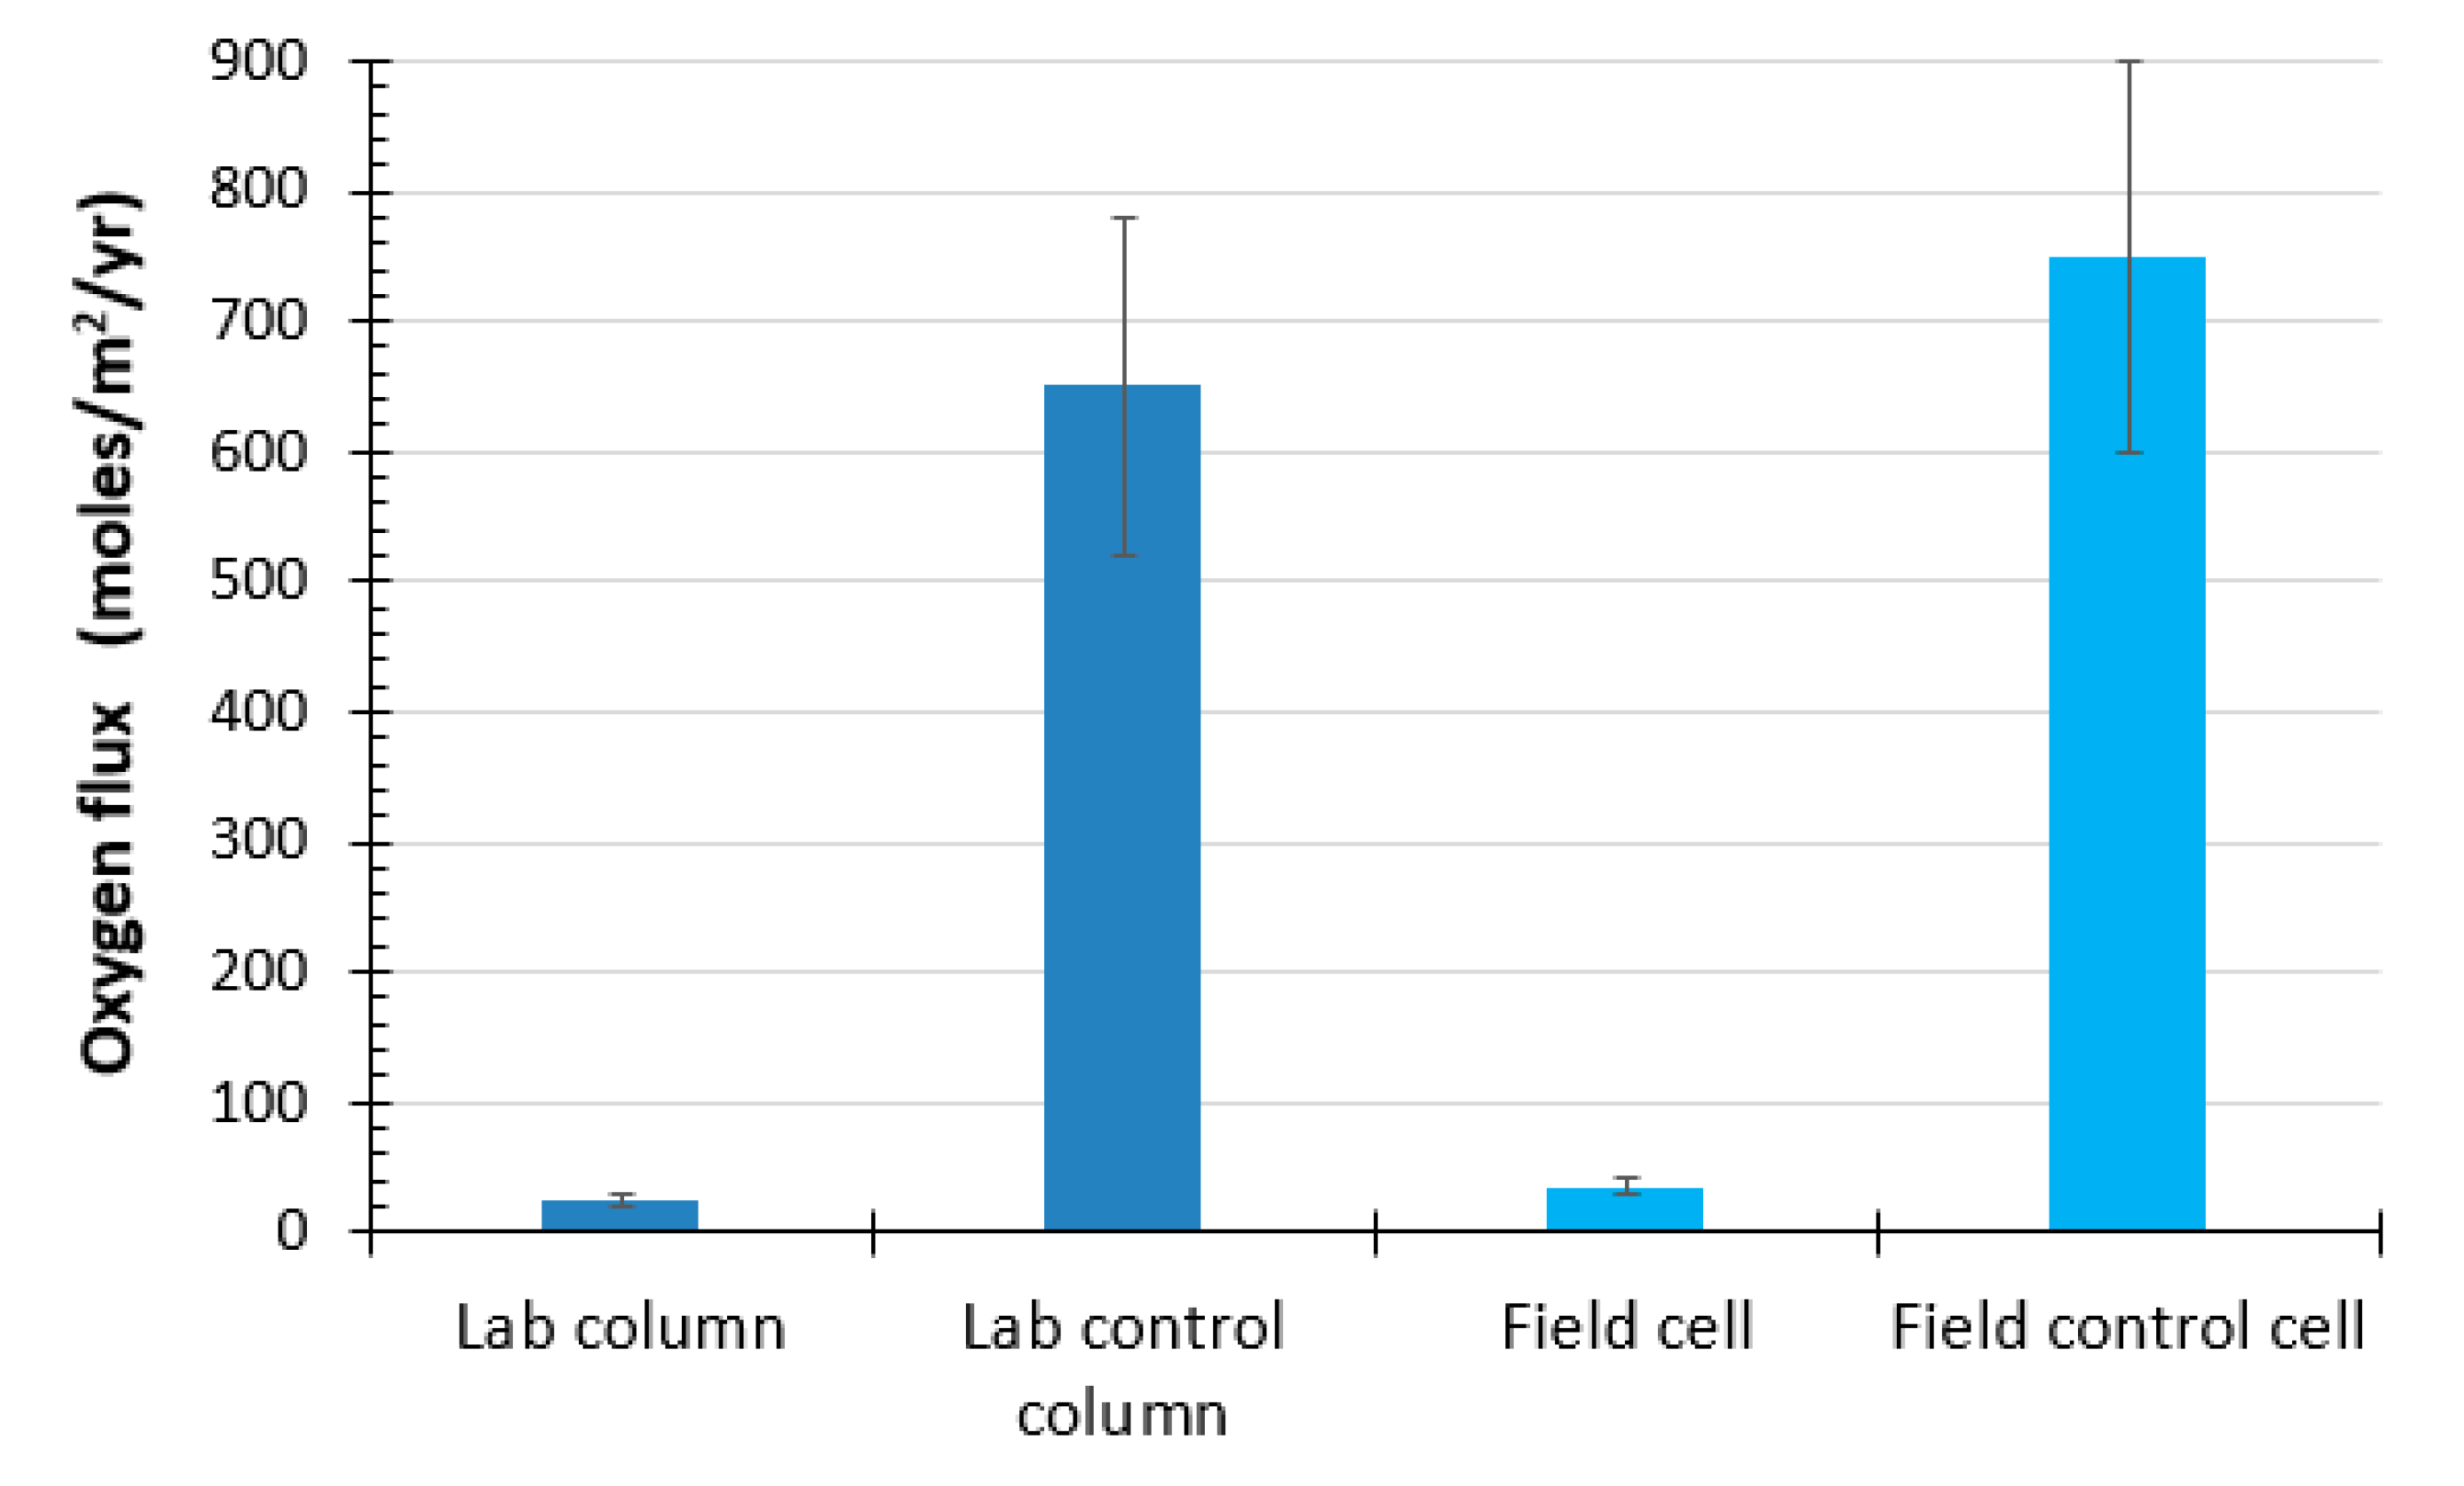
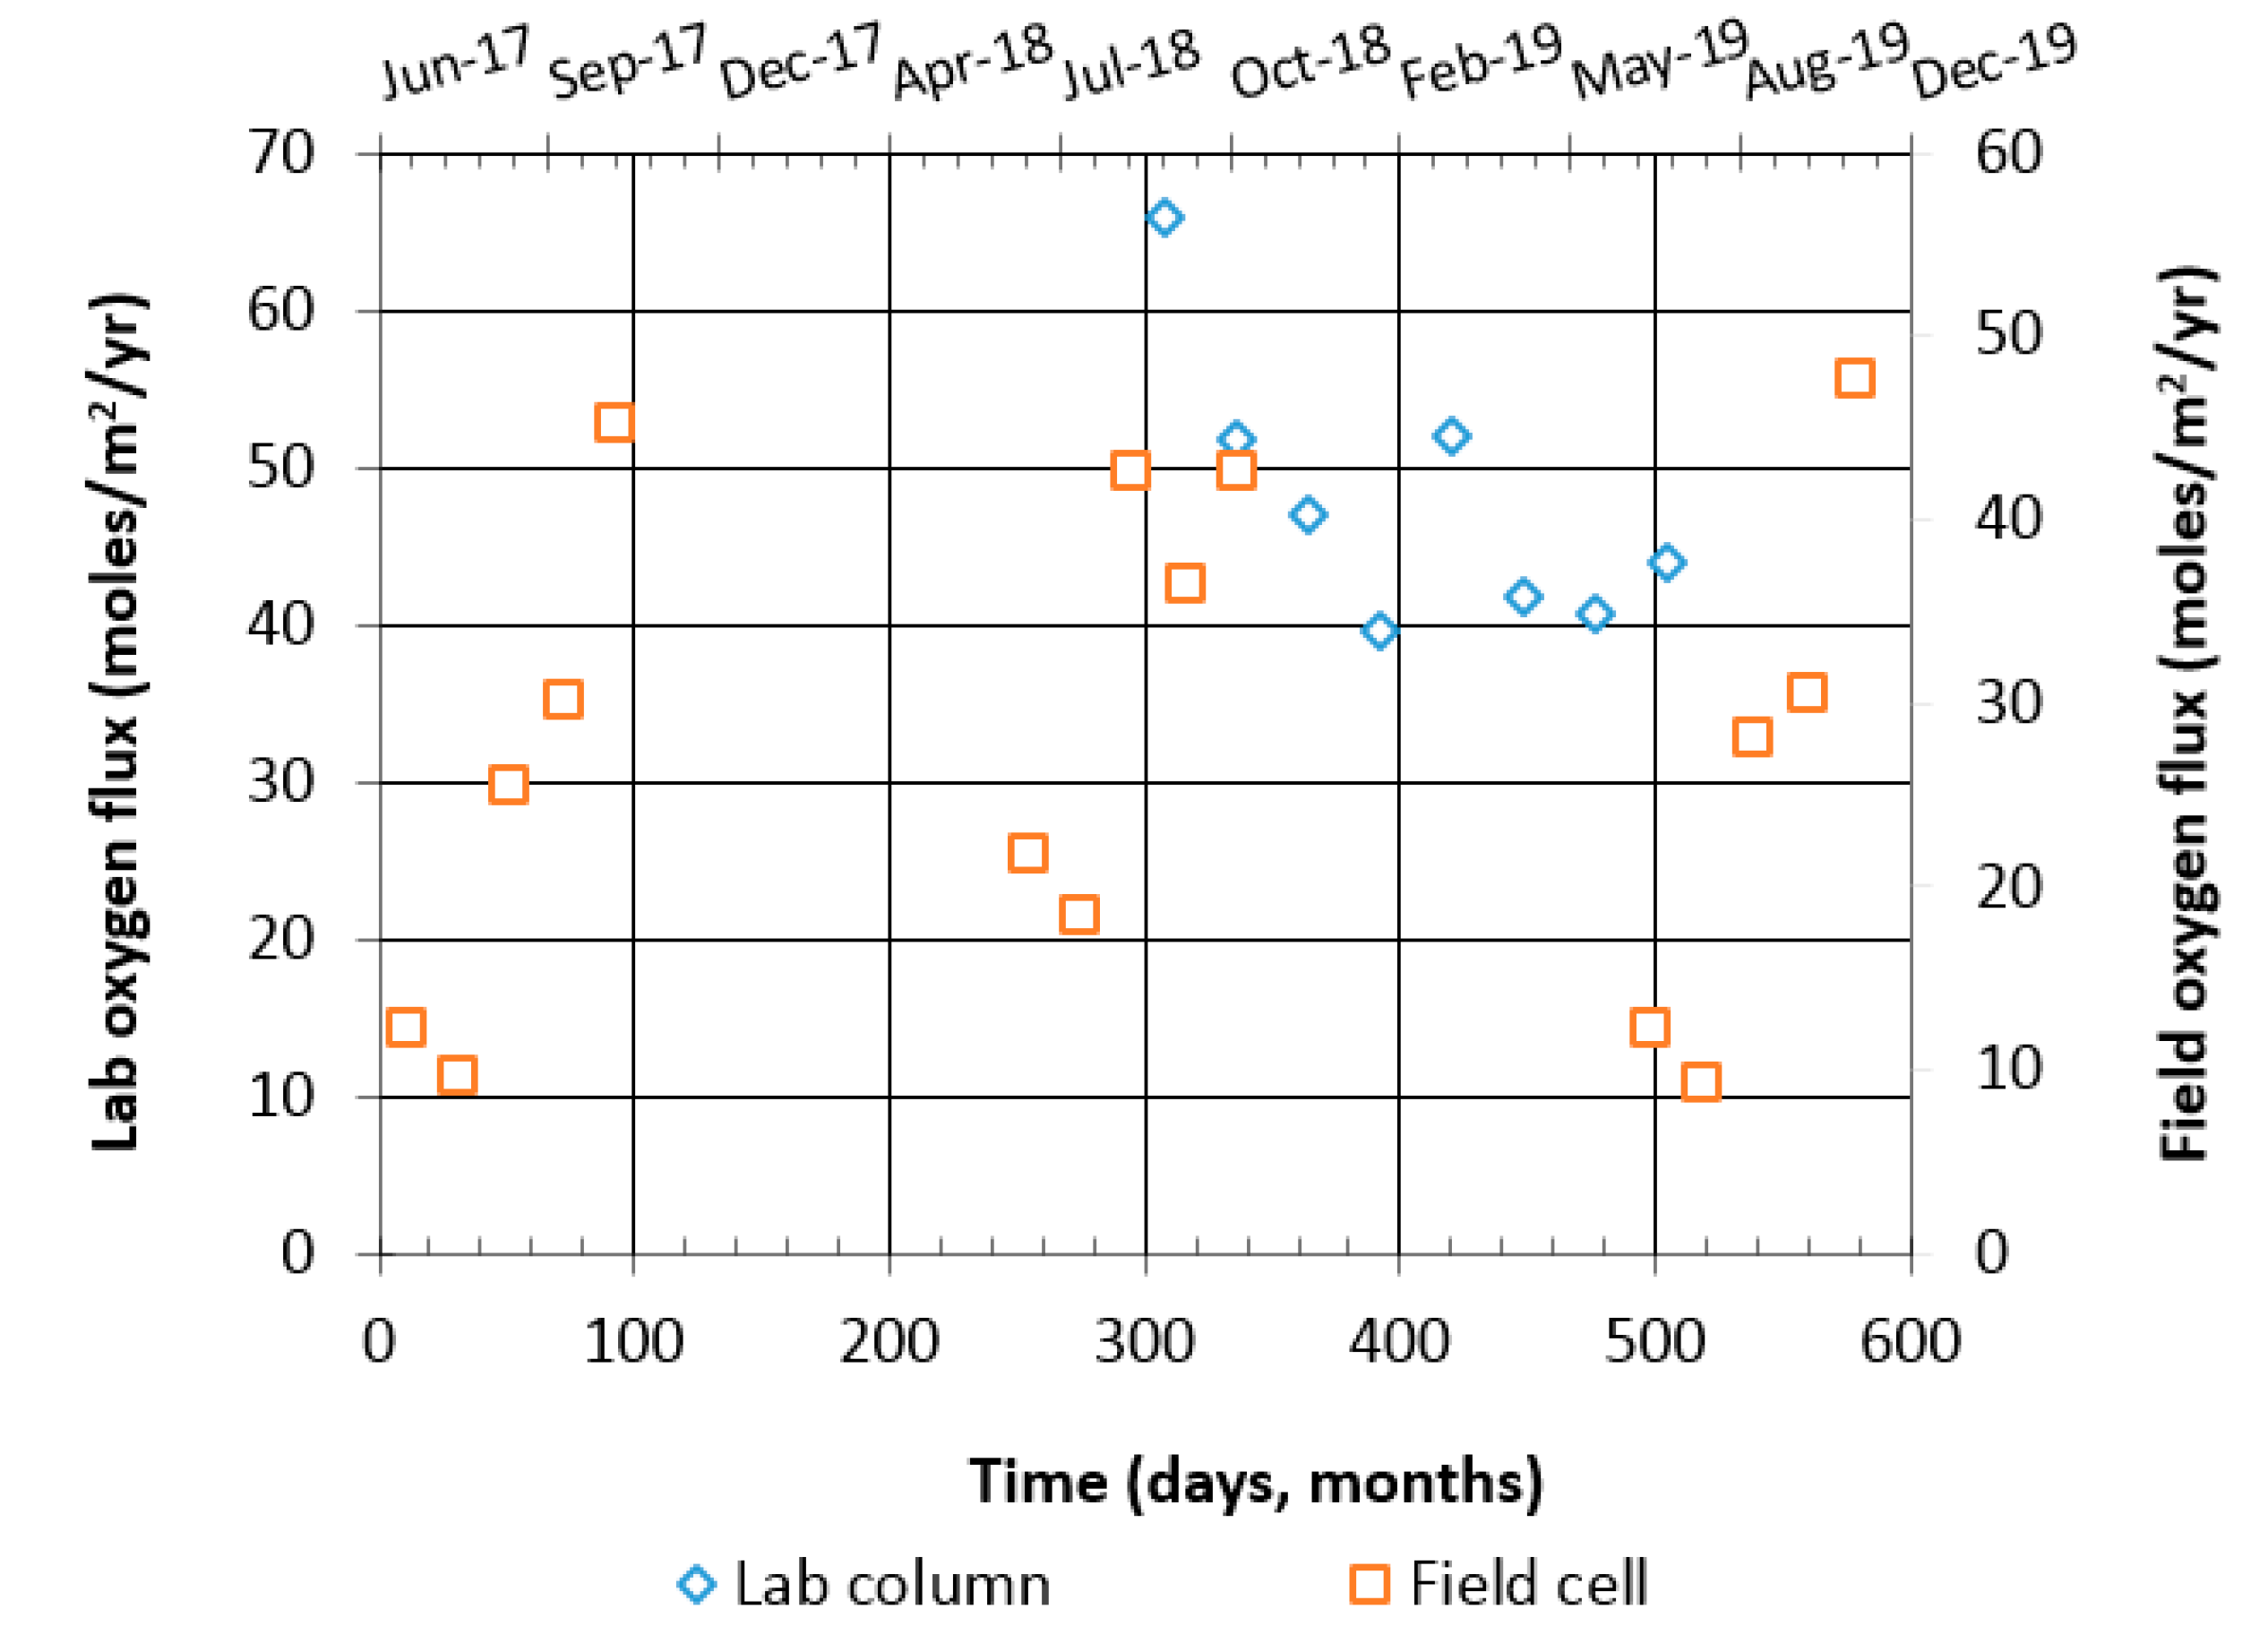
The decreases in oxygen concentrations over time recorded for the laboratory columns and field experimental cells were converted into steady-state oxygen fluxes passing through the cover (Section 3.2). The average oxygen fluxes passing through the surface of the MRL were 25 moles/m2/yr for the CCBE column and 35 moles/m2/yr for the CCBE field cell (Figure 10). For the control column and field control cell, oxygen fluxes averaged 650 and 750 moles/m2/yr, respectively, demonstrating the high reactivity of the material [48]. The values presented here are the average of the OCT results that were performed three times (beginning, middle, and end of the testing period) in the laboratory, and four times during the monitoring period in the field. Variations in oxygen fluxes between the tests were between 15 and 20%. The oxygen fluxes observed in the CCBE column and CCBE field cell demonstrate the ability of the CCBE to limit the migration of oxygen. These tests confirm that a CCBE made of low-sulfide mine wastes can significantly reduce the oxygen fluxes reaching reactive tailings (by a factor of 25 to 30).
Surface oxygen fluxes at the top of the cover were greater than the oxygen fluxes expected at the base of the cover. The desulfurized/low-sulfide tailings used here in the MRL contain 0.3% pyrite. These residual sulfides consume a portion of the oxygen migrating through the cover toward the underlying tailings [5,19]. This means that the flux at the bottom of the MRL, which will be available for consumption by the reactive tailings, is lower than the one measured at the top of the MRL; this is discussed further in Section 5.2.

4.3.2. Oxygen Gradient Method

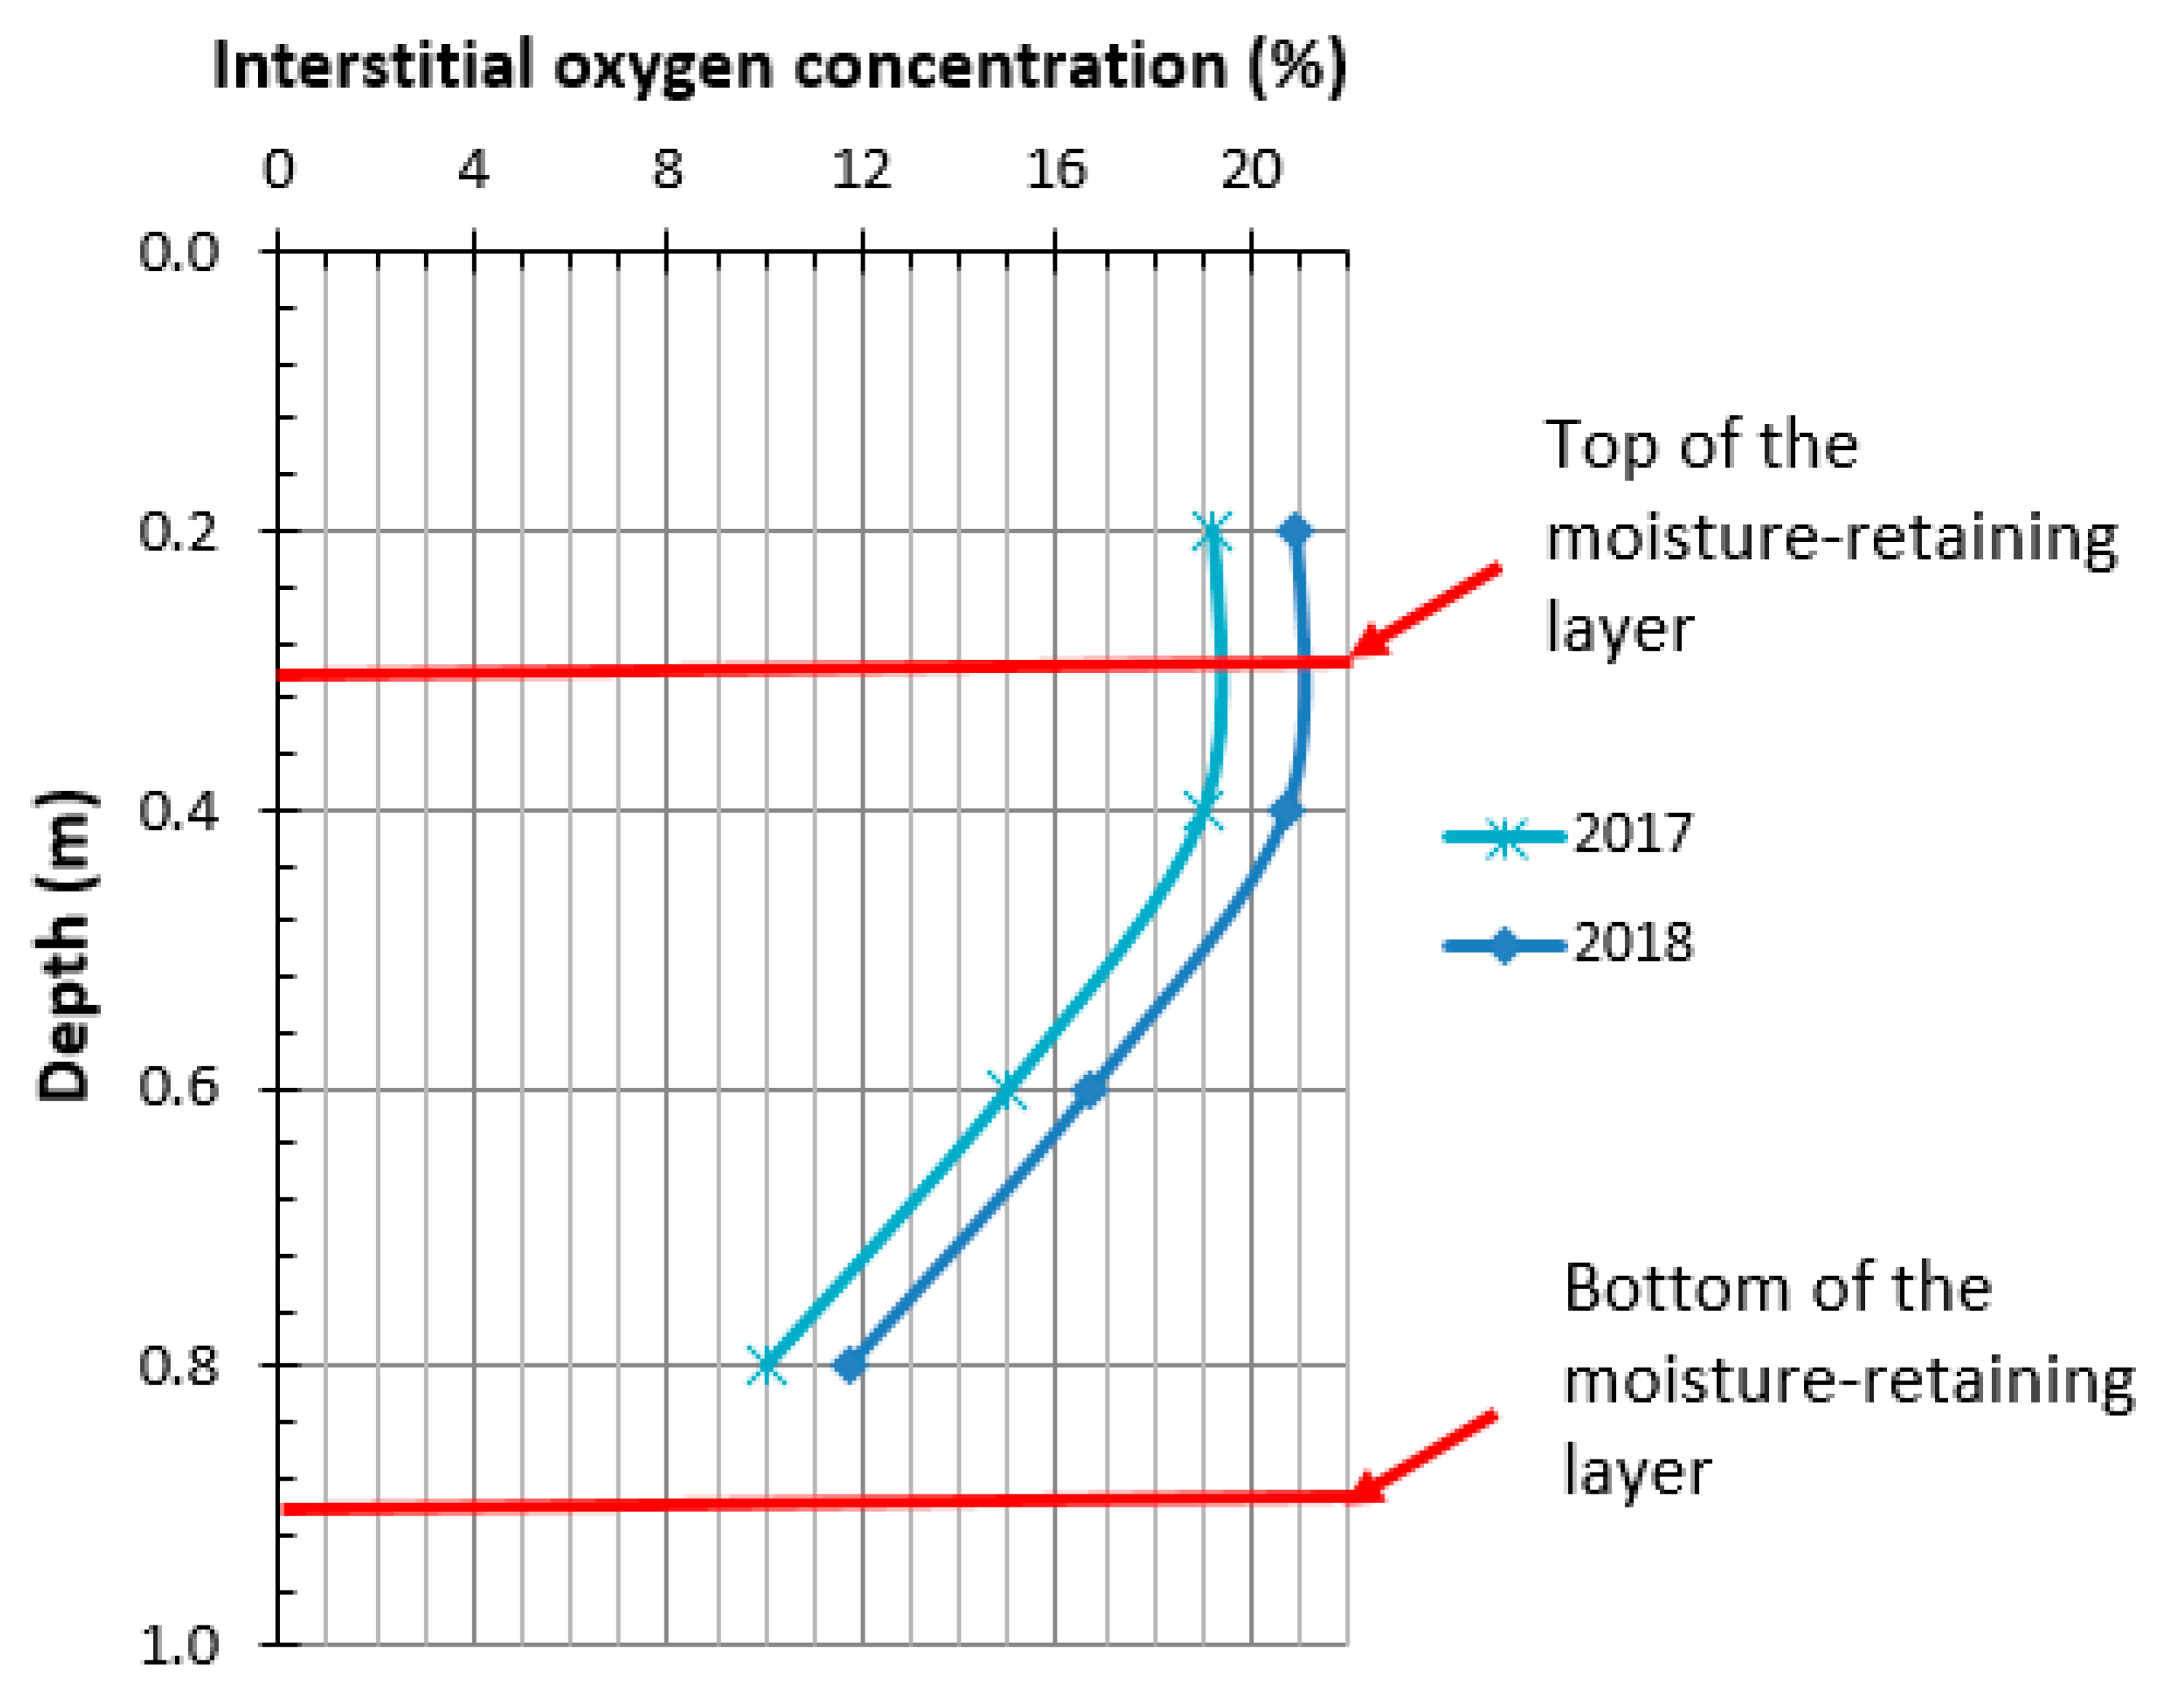
Oxygen concentration gradients were obtained from in situ measurements performed at three different elevations in the MRL. Typical results for 2017 and 2018 are presented in Figure 11.
Generally, the average interstitial oxygen concentration varied from 20 to 11% at 0.4 and 0.8 m depth in the MRL, respectively. These gradients were converted into oxygen fluxes using Fick’s first law, assuming steady-state conditions and De values estimated from average Sw and n values (see Section 3.2 for details). The average oxygen flux in the MRL for the three measurements in the field experimental cell was 4.5 × 10⁻¹ moles/m2/yr. The minimum and maximum oxygen fluxes were 3.4 × 10⁻¹ and 5.2 × 10⁻¹ moles/m2/yr, respectively.

4.3.3. Sulfate-Release Method

As a reminder, assumptions made for converting sulfate produced into oxygen fluxes were that oxygen was the only oxidizing agent, which is realistic at near-neutral pH, and that there was no sulfate storage in the system before measuring its concentration [28]. These assumptions were not valid for the first 300 days of the column tests during which the pH was low (~1.8–4.5). For this reason, the SRM was considered valid only for the monitoring period from 300 to 504 days. For the field cell, the SRM was considered valid for the entire monitored period.
Figure 12 presents the oxygen fluxes obtained using this method. The average oxygen fluxes calculated using the SRM were 49 and 28 moles/m2/yr for the CCBE column and field cell, respectively. As with the OCT method, these calculated oxygen fluxes correspond to the top of the MRL and include the reactivity of the MRL (assuming that the waste rock in the top CBL is not reactive).

5. Cover Efficiency

In this study, the effectiveness of the CCBE was evaluated in terms of its ability to reduce the generation of contaminants and its ability to reduce oxygen fluxes reaching the reactive tailings underlying the cover.

5.1. Efficiency with Respect to Controlling Contaminant Generation

The efficiency of the CCBE with respect to limiting the production of soluble contaminants can be expressed by the following equation [5]:
Efficiency   ( % ) = 100 × ( 1 Cumulative   mass   in   covered   column / cell   leachates   Cumulative   mass   in   control   column / cell   leachates )
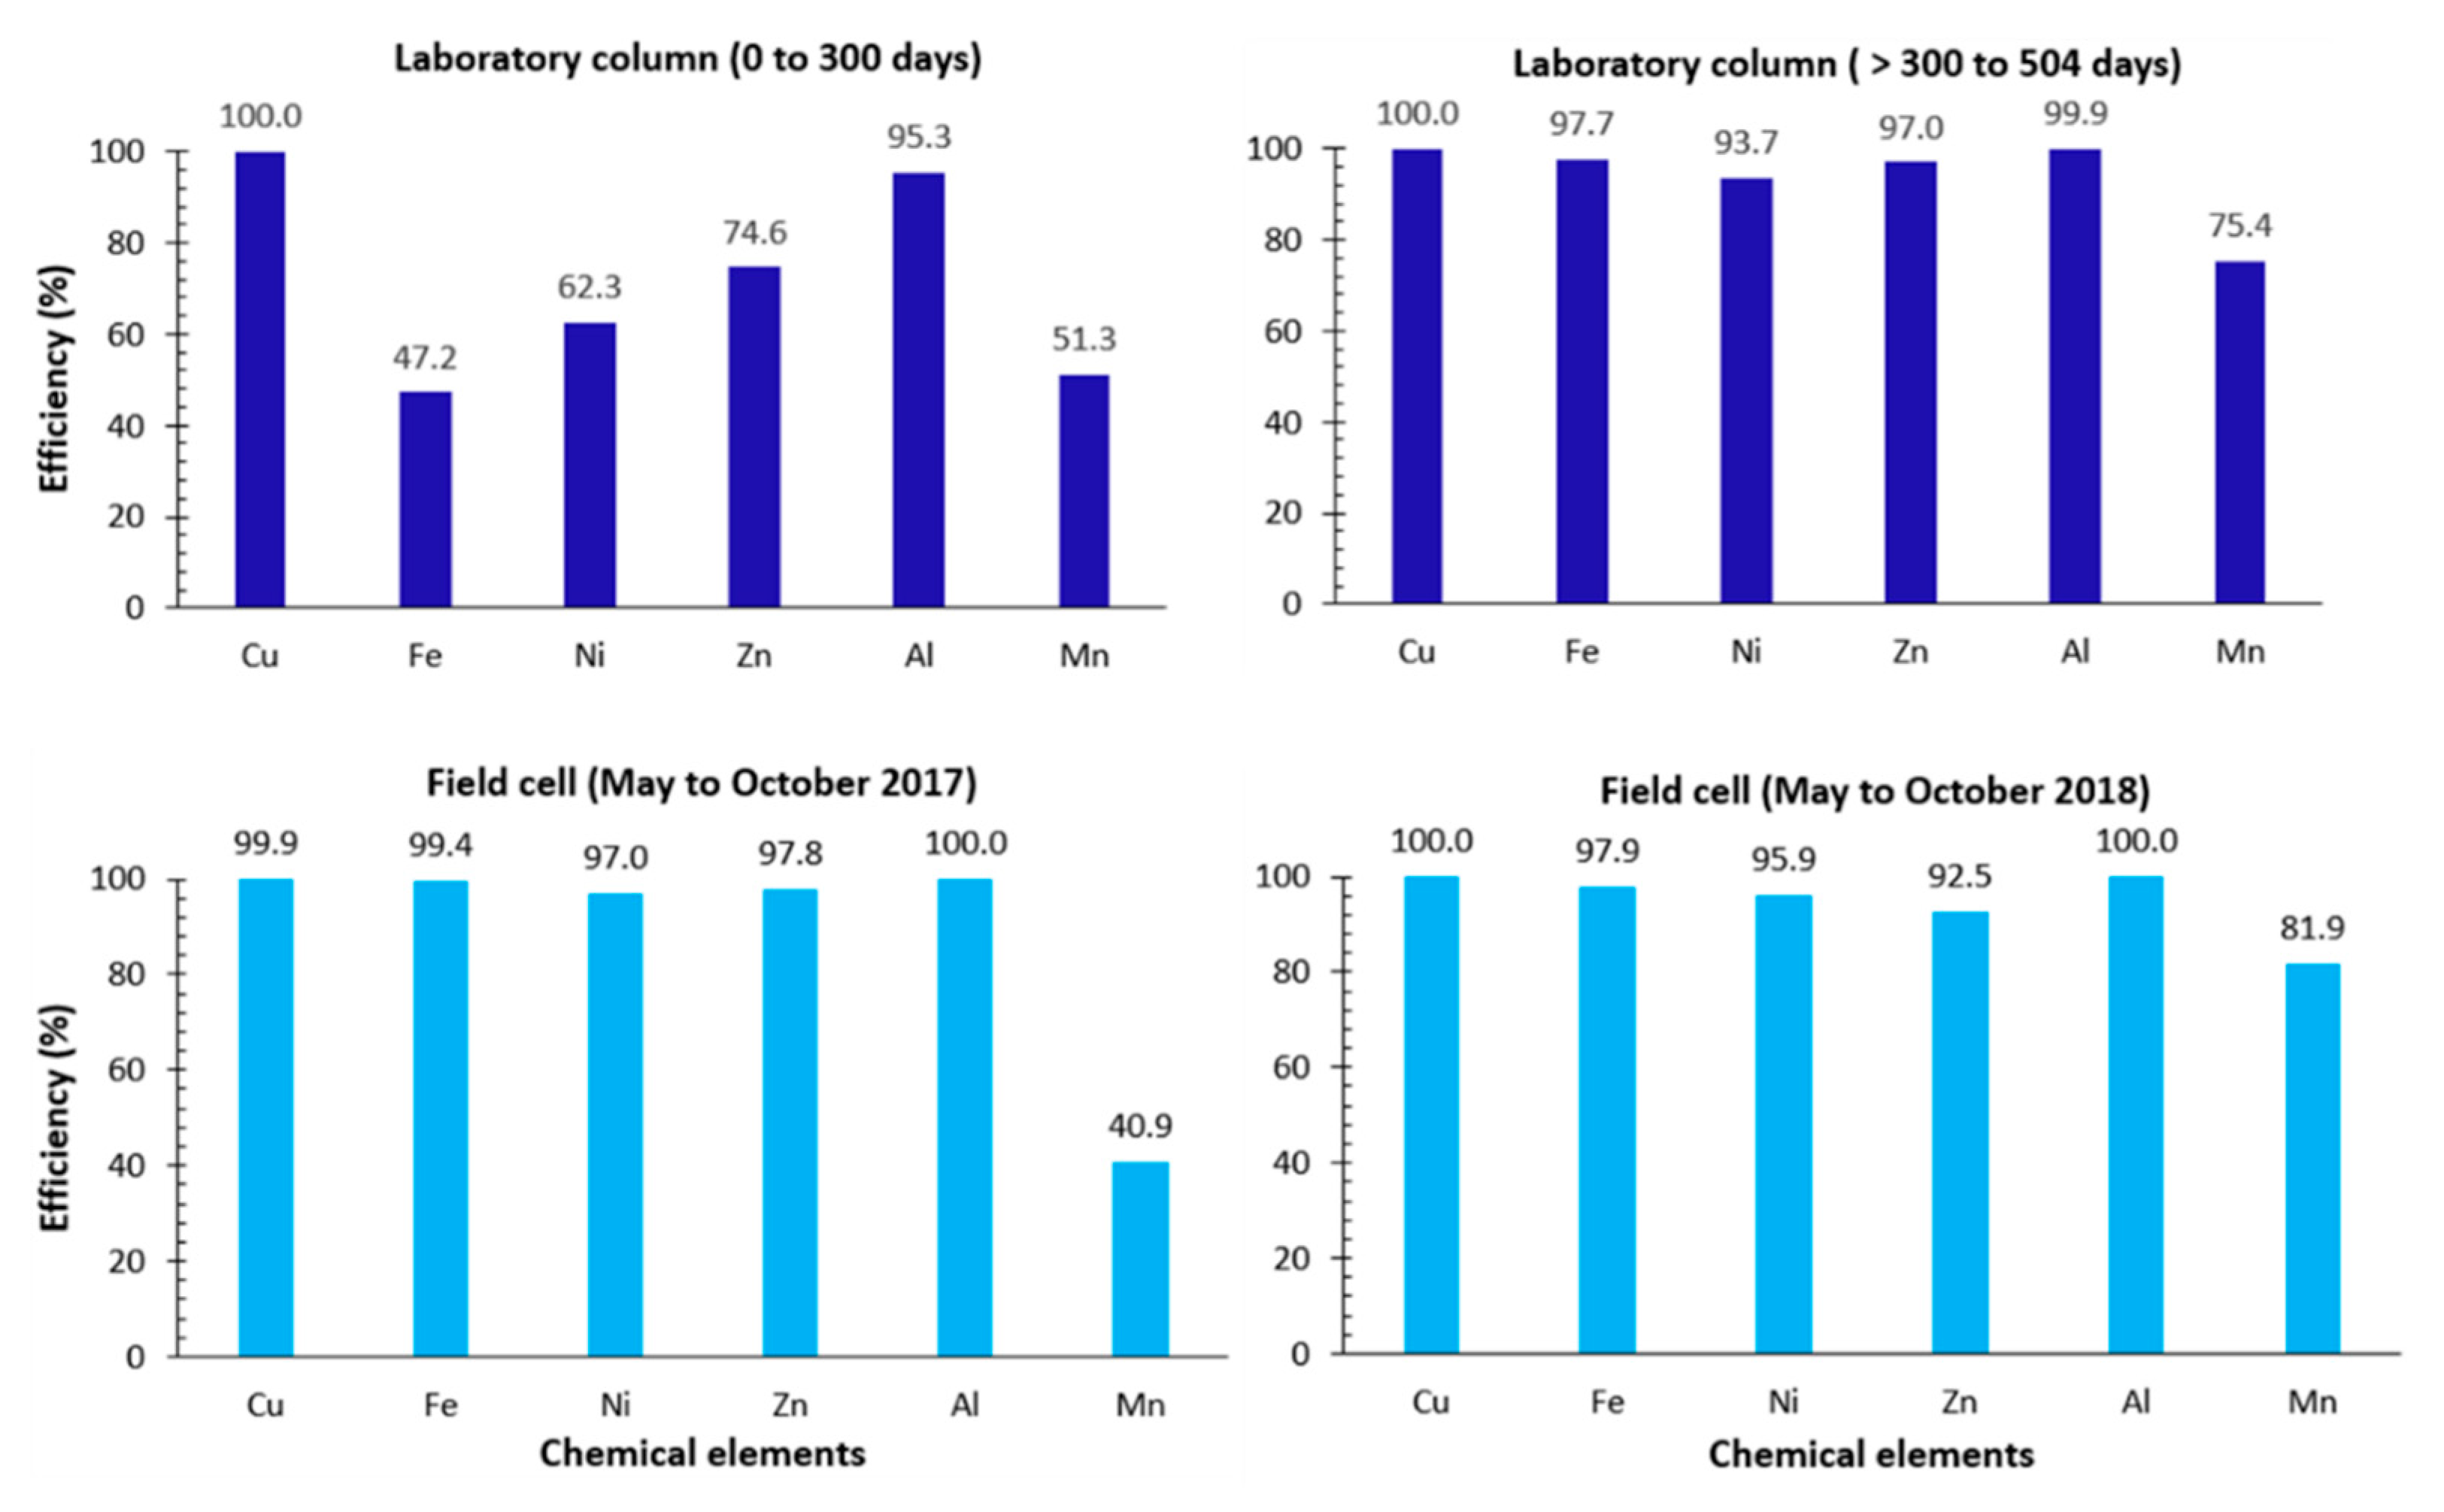
The CCBE column and field cell were compared with the control column and field cell. Efficiencies were calculated for Fe, Zn, Cu, Ni, Al, and Mn (Figure 13).
The efficiency of the CCBE column was calculated separately for the period between 0 to 300 days and the period between 300 and 504 days. The latter period corresponds to the geochemical equilibrium state (or the time needed to expulse the initial pore water contamination) during which the pH stayed above 6 and fluctuations in the concentrations of contaminants were minimal. The CCBE field cell efficiency was calculated for the years 2017 and 2018. The results were split into two graphs to see the change in efficiency from one year to the other. The geochemical results of reactive tailings alone (i.e., the control column and field control cell) are summarized in Table 4 and were presented in the companion article [22].
In general, the cover efficiency was greater for the field tests (2017 and 2018) compared to the laboratory tests for the first 300 days. For example, the field and laboratory efficiencies with respect to Fe, Zn, Cu, and Ni were (lab/field): Fe = 47.2/98.7%, Zn = 74.6/95.2%, Cu 100/99.9%, Ni = 62.3/96.5%. However, in the laboratory, after the pH rose above 6 (300 to 504 days), the efficiency of the CCBE improved considerably and reached between 75 and 100% for the monitored contaminants. The efficiency values obtained at the field scale in 2017 and 2018 were similar, but with a decrease for Zn in 2018. These results confirm that the cover contributed significantly in limiting contamination by the LaRonde tailings. Despite the high efficiency of the CCBE in limiting the release of metal contaminants, sulfate concentrations (average of 2000 to 3500 mg/L, Figure 9) in the CCBE column and field cell leachates indicated that some sulfide oxidation still took place. The concentrations of Fe and Zn exceeded standard regulation criteria imposed in Quebec, Canada, which were respectively of 3 mg/L and 0.5 mg/L.

5.2. Efficiency with Respect to Controlling Oxygen Fluxes at the Base of the CCBE

The presence of a residual sulfide content in the MRL can have a beneficial short-to-mid-term effects on the CCBE’s performance with respect to limiting the diffusion of oxygen into the reactive tailings [5]. In addition to serving as a barrier to oxygen diffusion, a CCBE made of materials with a small residual sulfide content will consume some of the diffusive oxygen that migrates downward. Mbonimpa et al. [38] developed the following equation to assess the steady-state oxygen flux FsR,L (g.m−2.yr−1) below the oxygen-barrier layer (z = L) of an MRL having a thickness of L (m):
F s R , L = C o D e L ( 1 + 2 K r * i = 1 ( 1 ) i i 2 π 2 D * L 2 + K r * )
where C0 is the concentration of oxygen in the atmosphere (0.28 kg/m3) and D * = D e / θ e q the bulk diffusion coefficient [L2·T−1].
This equation provides an estimate of oxygen fluxes at the base of a cover. It was developed for the following boundary conditions: i) Oxygen concentrations at the upper boundary are equal to atmospheric conditions, ii) oxygen concentrations at the lower boundary are equal to zero (i.e., oxygen is fully consumed by the reactive material below the cover), iii) initial oxygen concentrations inside the pores of the cover material are equal to zero, and iv) De and θeq are considered constant over the entire thickness of the MRL. In the case of the CCBE column and field cell, the analytical solution gives oxygen fluxes at the base of the MRL (thickness of 0.60 m) of 1 × 10⁻³ and 6 × 10⁻³ moles/m2/yr, respectively. Oxygen flux reduction efficiency was calculated using Equation (4) [12], where expressions Fbase cover represent the oxygen flux at the base of the covers and Fcontrol, the oxygen flux at the surface of the control column or control cell.
E ( % ) = 100 ( F c o n t r o l F b a s e   c o v e r ) F c o n t r o l
Efficiency results are presented in Table 5 and were approximately 99% for the CCBE column and field cell. This efficiency value is similar to that obtained using fluxes calculated from the oxygen gradient method for the field cell. The efficiency results for the CCBE column and field cell obtained from oxygen fluxes calculated using the sulfate-release method and the surface fluxes (OCTs) are also presented in Table 5. Lower efficiencies were expected for these methods since these fluxes integrate, in addition to the flux from the reactive tailings, the reactivity of the MRL, which contains a small amount of pyrite.
It is usually accepted in the literature that cover systems should limit oxygen fluxes to values below 0.5 to 2 moles/m2/yr in order to control the generation of AMD and other contaminants’ generation from non-oxidized, reactive tailings [3,25,42,49]. However, the results obtained here show that this criterion may not be directly applicable to fresh or pre-oxidized, highly reactive tailings since in this experiment the concentrations of some contaminants (e.g., Fe and Zn) exceed regulatory criteria even when oxygen fluxes reaching the reactive tailings were very low.

6. Conclusions

The LaRonde mine site is currently engaged in the process of identifying an optimal reclamation scenario for its highly reactive tailings. One of the promising reclamation options for controlling AMD from the LaRonde tailings is the use of a CCBE made with low-sulfide mine wastes. However, the capacity of such a cover to control contaminant generation in the tailings storage facility is uncertain because of the high reactivity of the LaRonde tailings. The main objective of this research was to study the hydrogeochemical behavior of the highly reactive tailings protected by a CCBE made with low-sulfide mine wastes (i.e., desulfurized tailings and non-acid-generating waste rocks).
The geochemical results and the extrapolation of the results of kinetic tests indicated that the reactive tailings were highly acid-generating and the cover materials were not acid-generating. Additionally, the low-sulfide mine wastes that were used in this study had suitable hydrogeological and geochemical properties to be used as CCBE materials (see the companion article [22]).
The results presented in the present study highlight the capacity of the tested cover system to control oxygen migration and to reduce the generation of contaminants from the LaRonde tailings. The hydrogeological behaviors of the CCBE column and field cell show that the average degree of saturation was between 89 to 96% in the moisture-retaining layer of the CCBE. Average suction values were usually lower than the air entry value of the MRL in the CCBE column and field cell. Oxygen fluxes at the base of the MRL that actually reached the reactive tailings were on the order of 1 × 10⁻³ and 5 × 10⁻³ moles/m2/yr for the laboratory and field tests, respectively. These oxygen fluxes correspond to an efficiency of approximately 99% compared to the uncovered reactive tailings.
The efficiency of the cover with respect to limiting the production of contaminants was evaluated in the laboratory and in the field. Field and laboratory results (after 300 days of testing) were similar for Fe, Zn, Cu, and Al (95 to 100%). However, the CCBE was not able to reduce Fe and Zn concentrations to below the regulatory limits imposed in Quebec, Canada in either the lab or the field.
This study showed that the previous oxygen flux design targets proposed in the literature for fresh non-oxidized tailings may not always be directly applicable to fresh or pre-oxidized highly reactive tailings. Therefore, there is a need to better select oxygen flux targets for highly reactive tailings. In the case of the LaRonde mine, it would be possible to increase the performance of the CCBE to control oxygen migration. This improvement may consist of either increasing the thickness of the MRL, changing the hydrogeological properties of the cover materials, or adding a passive treatment polishing step [50,51,52].
Finally, differences between testing scales were observed for metal and sulfate concentrations measured in the drainage waters. Typically, concentrations in the columns were higher at the beginning of the tests. But over time, laboratory concentrations became lower compared to field concentrations. This difference at the beginning of the test could be due to the initial geochemical conditions of the reactive tailings placed in the columns. In the field, the reactive tailings were introduced into the cell just after sampling, while, in the laboratory, the reactive tailings were submerged in water for several weeks prior to the column’s construction. Differences in the hydrological and gas-transport conditions (e.g., water infiltration and oxygen supply), and physical factors (e.g., temperature, low liquid to solid ratio (LSR), and contact times between liquid and solid phases) between the two scales could also have an impact on the release rates of contaminants [53,54].

Author Contributions

Conceptualization and methodology, A.K.-K., B.B., and I.D.; formal analysis and investigation, A.K.; writing—original draft preparation, A.K.; writing—review and editing, A.K., B.B., and I.D.; Supervision, B.B., and I.D. All authors have read and agreed to the published version of the manuscript.

Funding

This research was funded by Mitacs (https://www.mitacs.ca/fr, project number IT09666) and the NSERC-UQAT Industrial Research Chair on Mine Site Reclamation and its partners.

Acknowledgments

The authors would like to acknowledge the partners of the UQAT-Polytechnique Research Institute on Mines and the Environment (RIME), as well as the NSERC-UQAT Industrial Chair on Mine Sites Reclamation for their financial support. The authors would also like to thank the Unité de Recherche et Service en Technologie Minérale (URSTM) staff and LaRonde environmental team for their assistance on the LaRonde mine site.

Conflicts of Interest

The authors declare no conflict of interest.

References

  1. Aubertin, M.; Chapuis, R.P.; Aachib, M.; Bussière, B.; Ricard, J.F.; Tremblay, L. Evaluation en laboratoire de barrières sèches construites à partir de résidus miniers. In Ecole Polytechnique de Montréal; Rapport NEDEM/MEND: Ottawa, ON, Canada, 1995. [Google Scholar]
  2. Ricard, J.F.; Aubertin, M.; Firlotte, F.W.; Knapp, R.; McMullen, J. Design and construction of a dry cover made of tailings for the closure of Les Terrains Aurifères site. In Proceedings of the 4th International Conference on Acid Rock Drainage, Vancouver, BC, Canada, 31 May–6 June 1997; pp. 1515–1530. [Google Scholar]
  3. Ricard, J.F.; Aubertin, M.; Garand, P. Performance d’un recouvrement multicouche au site Barrick-Bousquet de Les Terrains Aurifères. In the 20th Symposium on Wastewater; Delisle, C.E., Bouchard, M.A., Eds.; Collection Environnement de l’Université de Montréal: Montréal, Canada, 1997; Volume 10, pp. 291–305. [Google Scholar]
  4. Aachib, M.; Aubertin, M.; Chapuis, R.P. Essais en colonne sur des couvertures avec effets de barrière capillaire. In Proceedings of the 51st Canadian Geotechnical Conference, Edmonton, AB, Canada, 4–7 October 1998; Volume 2, pp. 837–844. [Google Scholar]
  5. Bussière, B.; Benzaazoua, M.; Aubertin, M.; Mbonimpa, M. A laboratory study of covers made of low sulphide tailings to prevent acid mine drainage. Environ. Geol. 2004, 45, 609–622. [Google Scholar] [CrossRef]
  6. Kalonji-Kabambi, A.; Bussière, B.; Demers, I. Hydrogeological Behaviour of cover with Capillary Barrier Effect made of Mining Materials. Geotech. Geol. Eng. J. 2017, 35, 1199–1220. [Google Scholar] [CrossRef]
  7. Pabst, T.; Bussière, B.; Aubertin, M.; Molson, J. Comparative performance of cover systems to prevent acid mine drainage from pre-oxidized tailings: A numerical hydro geochemical assessment. J. Contam. Hydrol. 2018, 214, 39–53. [Google Scholar] [CrossRef] [PubMed]
  8. Maqsoud, A.; Bussière, B.; Turcotte, S.; Roy, M. Performance Evaluation of Covers with Capillary Barrier Effects under Deep Groundwater Conditions Using Experimental Cells. In Proceedings of the Géo Ottawa Conference, Ottawa, ON, Canada, 1–4 October 2017; p. 256. [Google Scholar]
  9. Larochelle, C.G.; Bussière, B.; Pabst, T. Acid-generating waste rocks as capillary break layers in covers with capillary barrier effects for mine site reclamation. Water Air Soil Pollut. 2019, 230, 57. [Google Scholar] [CrossRef]
  10. Yanful, E.K. Engineering soil covers for reactive tailings management: Theoretical concepts and laboratory development. In Proceedings of the Second International Conference on the Abatement of Acidic Drainage, Montréal, QC, Canada, 16–18 September 1991; pp. 461–485. [Google Scholar]
  11. Dagenais, A.-M.; Aubertin, M.; Bussière, B.; Martin, V. Large scale applications of covers with capillary barrier effects to control the production of acid mine drainage. In Proceedings of the Post-Mining, Nancy, France, 16–17 November 2005. [Google Scholar]
  12. Demers, I.; Bussière, B.; Benzaazoua, M.; Mbonimpa, M.; Blier, A. Column test investigation on the performance of monolayer covers made of desulphurized tailings to prevent acid mine drainage. Miner. Eng. 2008, 21, 317–329. [Google Scholar] [CrossRef]
  13. Pabst, T.; Aubertin, M.; Bussière, B.; Molson, J. Column Tests to Characterise the Hydrogeochemical Response of Pre-oxidised Acid-Generating Tailings with a Monolayer Cover. Water Air Soil Pollut. 2014, 225, 1841. [Google Scholar] [CrossRef]
  14. Pabst, T.; Molson, J.; Aubertin, M.; Bussière, B. Reactive transport modelling of the hydro-geochemical behaviour of partially oxidized acid-generating mine tailings with a monolayer Cover. Appl. Geochem. 2017, 78, 219–233. [Google Scholar] [CrossRef]
  15. Aubertin, M.; Bussière, B.; Chapuis, R.D.; Barbera, J.M. Construction of experimental cells with covers on acid producing tailings. In Proceedings of the 49th Canadian Geotechnical Conference, St-John’s, NL, Canada, 23–25 September 1996; pp. 655–662. [Google Scholar]
  16. Aubertin, M.; Bussière, B.; Barbera, J.M.; Chapuis, R.P.; Monzon, M.; Aachib, M. Construction and instrumentation of in situ test plots to evaluate covers built with clean tailings. In Proceedings of the 4th International Conference on Acid Rock Drainage (ICARD), Vancouver, BC, Canada, 31 May–6 June 1997; Volume 2, pp. 715–730. [Google Scholar]
  17. Adu-Wusu, C.; Yanful, E.K. Performance of engineered test covers on acidgenerating waste rock at Whistle mine, Ontario. Can. Geotech. J. 2006, 43, 1–18. [Google Scholar] [CrossRef]
  18. Bussière, B.; Aubertin, M.; Mbonimpa, M.; Molson, J.; Chapuis, R. Field experimental cells to evaluate the hydrogeological behaviour of oxygen barriers made of silty materials. Can. Geotech. J. 2007, 44, 245–265. [Google Scholar] [CrossRef]
  19. Demers, I.; Bussière, B.; Benzaazoua, M.; Mbonimpa, M. Preliminary optimization of a single-layer cover made of desulfurized tailings: Application to the Doyon Mine tailings impoundment. SME Trans. 2009, 326, 21–33. [Google Scholar]
  20. Demers, I.M.; Bouda, M.; Mbonimpa, M.; Benzaazoua, D.; Bois, M.; Gagnon, M. Valorization of acid mine drainage treatment sludge as remediation component to control acid generation from mine wastes, part 2: Field experimentation. Minerais Eng. 2015, 76, 117–125. [Google Scholar] [CrossRef]
  21. Plante, B.; Bussière, B.; Benzaazoua, M. Lab to field scale effects on contaminated neutral drainage prediction from the Tio mine waste rocks. J. Geochem. Explor. 2014, 137, 37–47. [Google Scholar] [CrossRef]
  22. Kalonji-Kabambi, A.; Bussière, B.; Demers, I. Hydrogeochemical behavior of reclaimed highly reactive tailings, Part 1: Characterization of reclamation materials. Miner. J. 2020, 10, 596. [Google Scholar] [CrossRef]
  23. Bussière, B.; NicholsonI, R.V.; Aubertin, M.; Servant, S. Effectiveness of covers built with desulphurized tailings: Column tests investigation. In Proceedings of the 4th International Conference on Acid Rock Drainage, Vancouver, BC, Canada, 31 May–6 June 1997; Volume 2, pp. 763–778. [Google Scholar]
  24. Aachib, M. Étude en Laboratoire de la Performance de Barrières de Recouvrement Constituées de Rejets Miniers Pour Limiter le DMA. Ph.D. Thesis, École Polytechnique de Montréal, Montréal, QC, Canada, 1997. [Google Scholar]
  25. Dagenais, A.M. Techniques de Contrôle du Drainage Minier Acide Basées sur les Effets Capillaires. Ph.D. Thesis, École Polytechnique de Montréal, Montréal, QC, Canada, 2005. [Google Scholar]
  26. Kalonji-Kabambi, A. Évaluation de la Performance des Recouvrements en Materiaux Miniers Pour la Restauration d’un parc à Résidus Miniers Hautement Reactifs. Ph.D. Thesis, École Polytechnique de Montréal (en extension à l’Université du Québec en Abitibi-Témiscarningue), Rouyn-Noranda, QC, Canada, 2020. [Google Scholar]
  27. Kalonji-Kabambi, A.; Demers, I.; Bussière, B. Short term in situ performance of a CCBE made entirely of mining materials to control acid mine drainage. In Proceedings of the 12th International Confrence on Mine Closure, Leipzig, Germany, 3–7 September 2018. [Google Scholar]
  28. Elberling, B.; Nicholson, R.V.; Reardon, E.J.; Tibble, P. Evaluation of sulphide oxidation rates: A laboratory study comparing oxygen fluxes and rates of oxidation product release. Can. Geotech. J. 1994, 31, 375–383. [Google Scholar] [CrossRef]
  29. Elberling, B.; Nicholson, R.V. Field Determination of Sulphide Oxidation Rates in Mine Tailings. Water Resour. Res. 1996, 32, 1773–1784. [Google Scholar] [CrossRef]
  30. Elberling, B.; Langdahl, B.R. Natural heavy-metal release by sulphide oxidation in the High Arctic. Can. Geotech. J. 1998, 35, 895–901. [Google Scholar] [CrossRef]
  31. Elberling, B. Environmental controls of the seasonal variation in oxygen uptake in sulfidic tailings deposited in a permafrostaffected area. Water Resour. Res. 2001, 37, 99–107. [Google Scholar] [CrossRef] [Green Version]
  32. Dagenais, A.-M.; Mbonimpa, M.; Bussière, B.; Aubertin, M. A modified oxygen consumption test to evaluate gas flux through oxygen barrier cover systems. Geotech. Test. J. 2012, 35. [Google Scholar] [CrossRef]
  33. Yanful, E.K. Development of Laboratory Methodology for Evaluating the Effectiveness of Reactive Tailings Covers; Final report; Centre de Technologie Noranda: Pointe-Claire, QC, Canada, 1991. [Google Scholar]
  34. Millington, R.J.; Shearer, R.C. Diffusion in aggregated porous media. Sail Sci. 1971, 111, 372–378. [Google Scholar] [CrossRef]
  35. Aachib, M.; Aubertin, M.; Mbonimpa, M. Laboratory Measurements and Predictive Equations for Gas Diffusion Coefficient of Unsaturated Soils. In Proceedings of the 55th Canadian Geotechnical Conference and 3rd joint IAH-CNC and CGS Groundwater Specialty Conference, Niagara Falls, ON, Canada, 20–23 October 2002; pp. 163–172. [Google Scholar]
  36. Aachib, M.; Mbonimpa, M.; Aubertin, M. Measurement and prediction of the oxygen diffusion coefficient in the unsaturated media, with applications to soil covers. Water Air Soil Pollut. 2004, 156, 163–193. [Google Scholar] [CrossRef]
  37. Mbonimpa, M.; Aubertin, M.; Dagenais, A.-M.; Bussière, B.; Julien, M.; Kissiova, M. Interpretation of field tests to determine the oxygen diffusion and reaction rate coefficients of tailings and soil covers. In Proceedings of the 55th Canadian geotechnical conference and 3rd joint IAH-CNC and CGS groundwater specialty conference, Niagara Falls, ON, Canada, 20–23 October 2002; pp. 147–154. [Google Scholar]
  38. Mbonimpa, M.; Aubertin, M.; Aachib, M.; Bussière, B. Diffusion and consumption of oxygen in unsaturated cover materials. Can. Geotech. J. 2003, 40, 916–932. [Google Scholar] [CrossRef]
  39. Mbonimpa, M.; Aubertin, M.; Bussière, B. Oxygen consumption test to evaluate the diffusive flux into reactive tailings: Interpretation and numerical assessment. Can. Geotech. J. 2011, 48, 878–890. [Google Scholar] [CrossRef]
  40. Ullom, W.L. Soil gas sampling. In Handbook of Vadose Zone Characterization & Monitoring; Wilson, L.G., Everett, L.G., Cullen, S.J., Eds.; CRC Press: Boca Raton, FL, USA, 1995; pp. 555–567. [Google Scholar]
  41. Bussière, B.; Nicholson, R.V.; Aubertin, M.; Benzaazoua, M. Evaluation of the effectiveness of covers built with desulfurized tailings for preventing Acid Mine Drainage. In Proceedings of the 50th Canadian Geotechnical Conference, Ottawa, ON, Canada, 20–22 October 1997; pp. 17–25. [Google Scholar]
  42. Aubertin, M.; Bussière, B.; Monzon, M.; Joanes, A.M.; Gagnon, D.; Barbera, J.M.; Aachib, M.; Bédard, C.; Chapuis, R.P.; Bernier, L. Étude sur les barrières sèches construites à partir des résidus miniers. Phase II, Essais en place; Rapport de Recherche; Projet CDT P1899.NEDEM/MEND 2.22.2c.: Ottawa, ON, Canada, 1999. [Google Scholar]
  43. Nicholson, R.V.; Gillham, R.W.; Reardon, E.J. Pyrite oxidation in carbonate-buffered solution: 1. Experimental kinetics. Geochim. Cosmochim. Acta 1988, 52, 1077–1085. [Google Scholar] [CrossRef]
  44. Nicholson, R.V.; Gillham, R.W.; Cherry, J.A.; Reardon, E.J. Reduction of acid generation in mine tailings through the use of moisture-retaining layers as oxygen barriers. Can. Geotech. J. 1989, 26, 1–8. [Google Scholar] [CrossRef]
  45. Akindunni, F.F.; Gillham, R.W.; Nicholson, R.V. Numerical simulations to investigate moisture-retention characteristics in the design of oxygen-limiting covers for reactive mine tailings. Can. Geotech. J. 1991, 28, 446–451. [Google Scholar] [CrossRef]
  46. Morel-Seytoux, H.J. L’effet de barrière capillaire à l’interface de deux couches de sol aux propriétés fort contrastées. Hydrol. Cont. 1992, 7, 117–128. [Google Scholar]
  47. Aubertin, M.; Bussière, B.; Aachib, M.; Chapuis, R.P.; Crespo, J.R. Une modélisation numérique des écoulements non saturés dans des couvertures multicouches en sols. Hydrogéologie 1996, 1, 3–13. [Google Scholar]
  48. Tibble, P.A.; Nicholson, R.V. Oxygen consumption on sulphide tailings and covers: Measured rates and applications. In Proceedings of the 4th International Confrence on Acid Rock Drainage, Vancouver, BC, Canada, 31 May–6 June 1997; Volume 2, pp. 647–661. [Google Scholar]
  49. Nastev, M.; Aubertin, M. Hydrogeological modelling for the reclamation work at the Lorraine mine site Québec. In Proceedings of the 1st Joint IAH-CNC-CGS Groundwater Specialty Conference, Montréal, QC, Canada, 15–18 October 2000; pp. 311–318. [Google Scholar]
  50. Neculita, C.M.; Zagury, G.J.; Bussière, B. Passive treatment of AMD in the bioreactors using sulfate-reducing bacteria: Critical review and research needs. J. Environ. Qual. 2007, 36, 1–16. [Google Scholar] [CrossRef]
  51. Genty, T.; Bussière, B.; Zagury, G.J.; Benzaazoua, M. Passivetreatment ofhighiron acid mine drainage using sulphate reducing bacteria: Comparison between eight biofilter mixtures. In Wolkersdorfer & Freud. In Proceedings of the IMW A, Sydney, NS, Canada, 5–9 September 2010. [Google Scholar]
  52. Skousen, J.; Zipper, C.E.; Rose, A.; Ziemkiewicz, P.F.; Naim, R.; McDonald, L.M.; Kleinmann, R.L. Review of passive systems for acid mine drainage treatment. Mine Waterandthe Environ. 2017, 36, 133–153. [Google Scholar] [CrossRef] [Green Version]
  53. Amos, R.T.; Blowes, D.W.; Bailey, B.L.; Sego, D.C.; Smith, L.; Ritchie, A.I.M. Waste-rock hydrogeology and geochemistry. Appl. Geochem. 2015, 57, 140–156. [Google Scholar] [CrossRef]
  54. RoyChowdhury, A.; Sarkar, D.; Datta, R. Remediation of acid mine drainage impacted water. Curr. Pollut. Rep. 2015, 1, 131–141. [Google Scholar] [CrossRef]
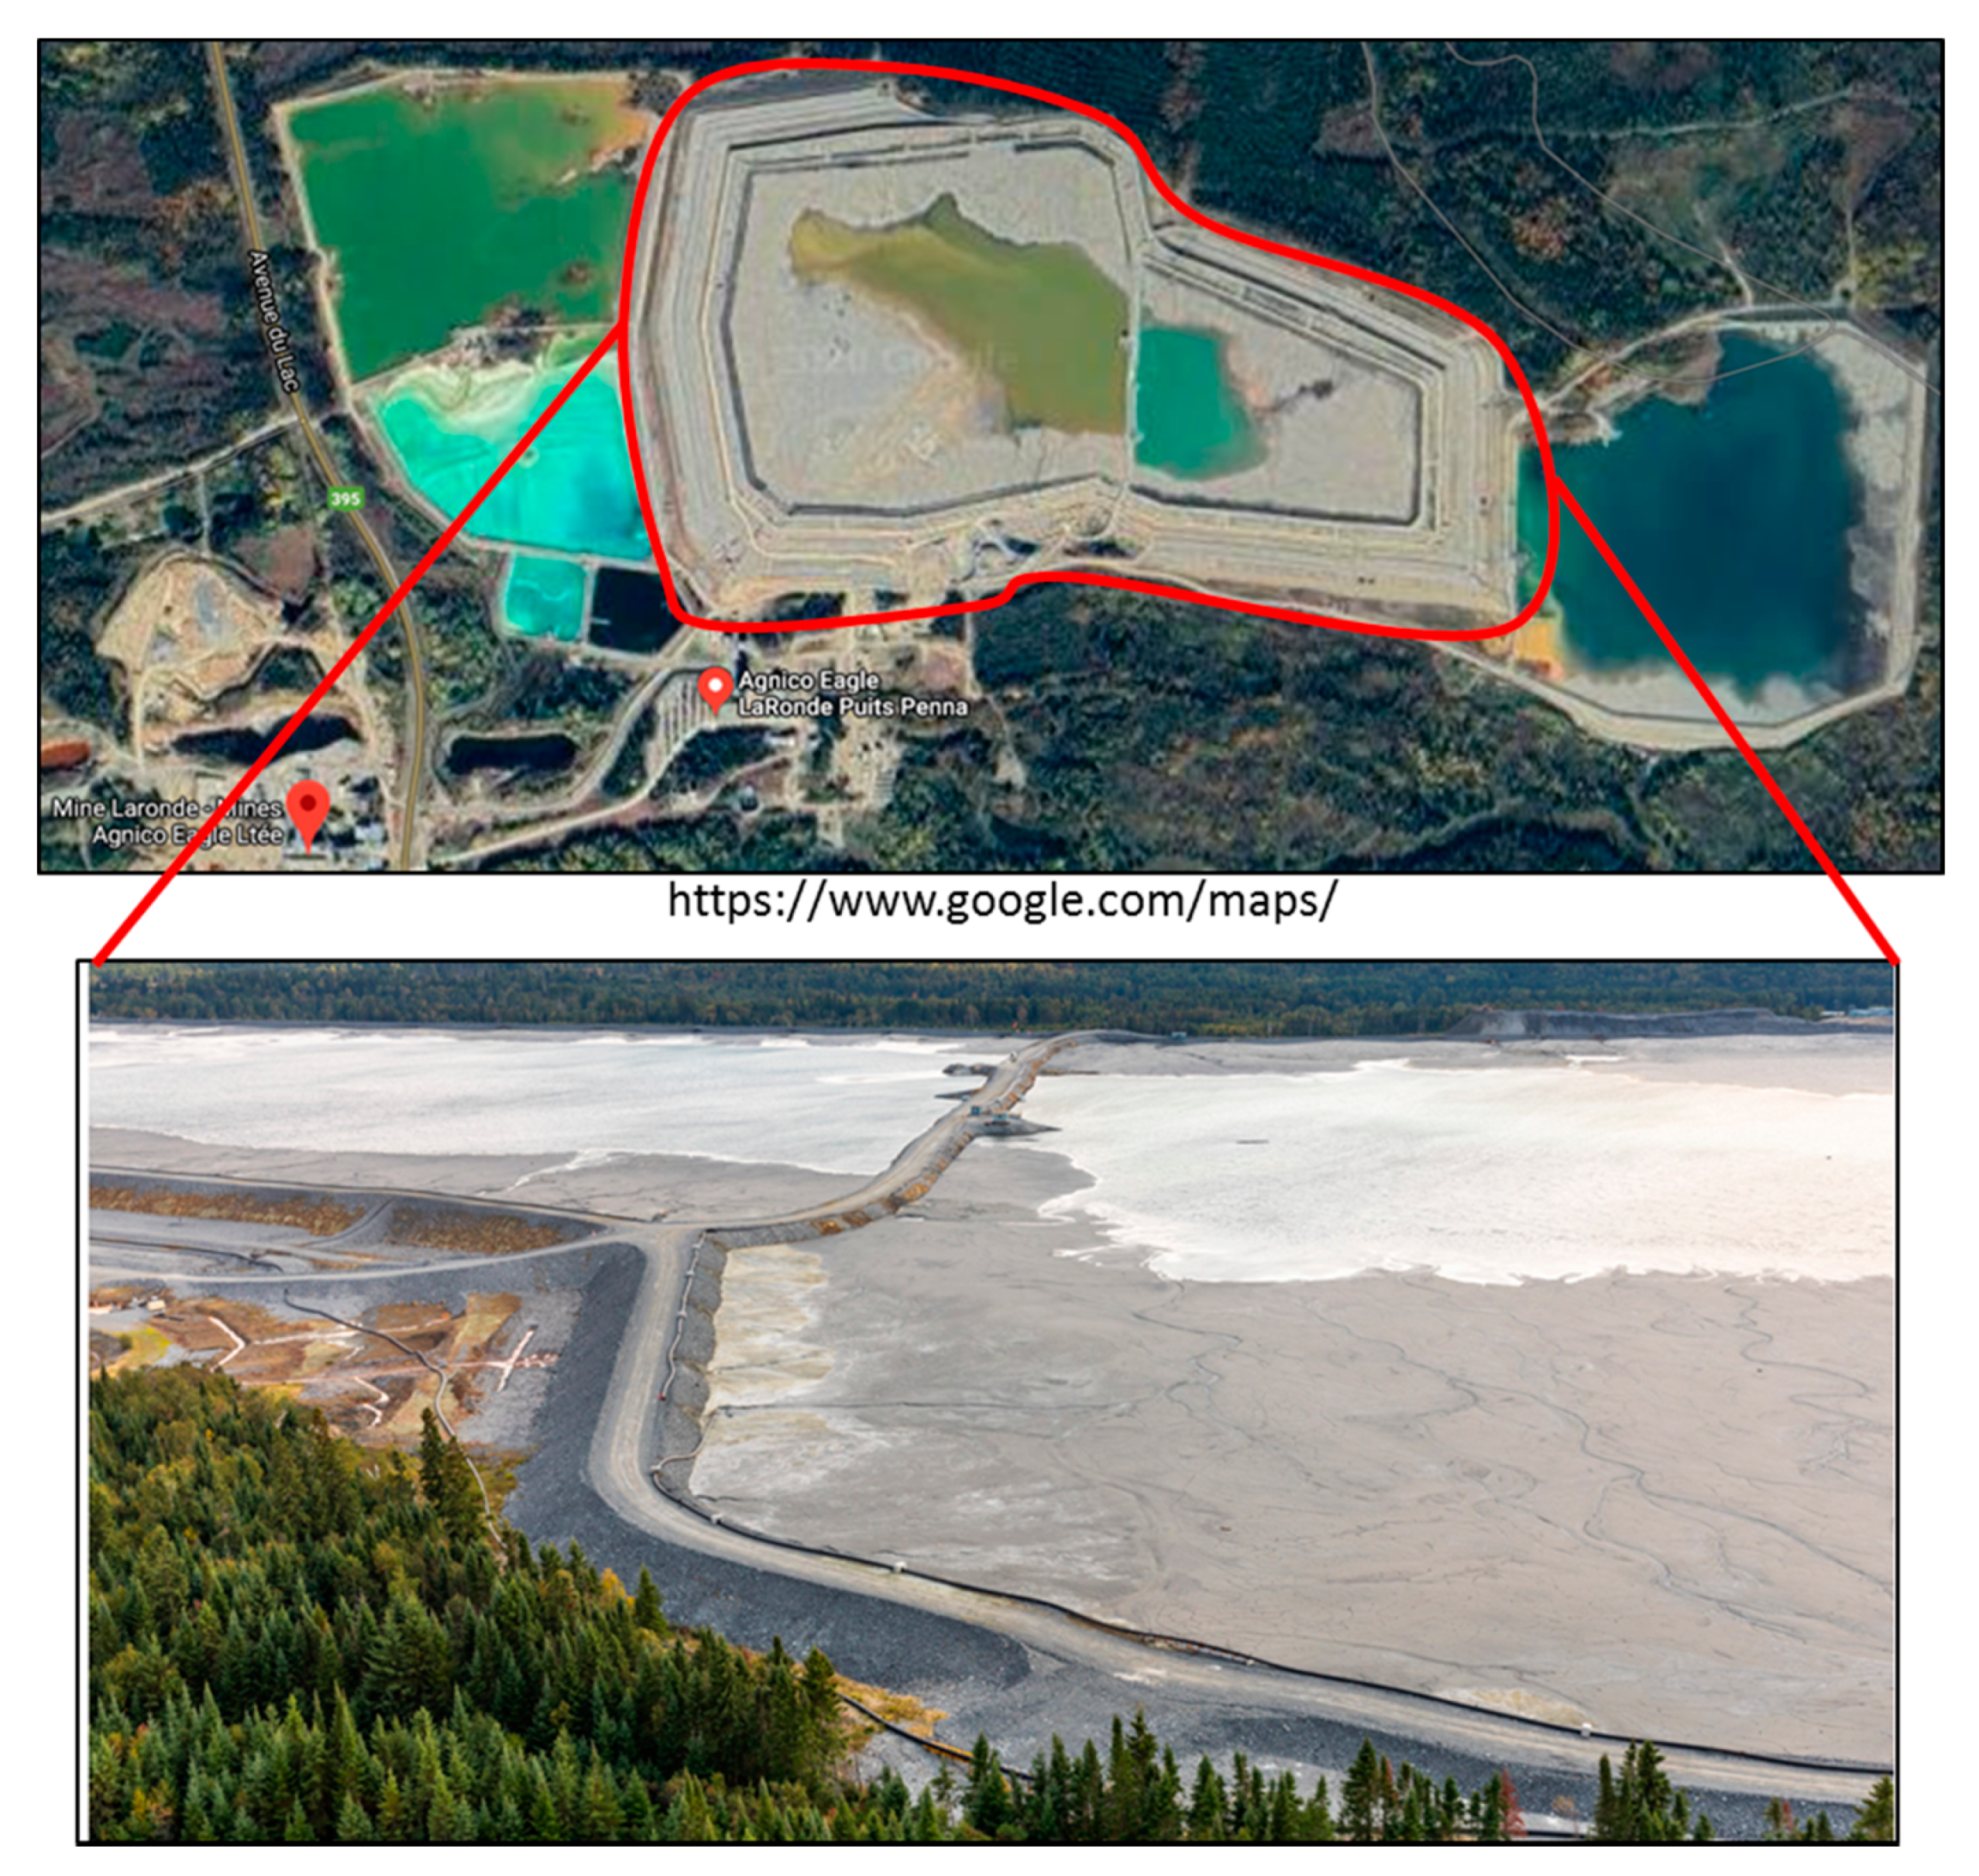
Figure 1. LaRonde tailings storage facility.
Minerals 10 00589 g001
Figure 2. Schematic of the cover with capillary barrier effects (CCBE) column and instrumentation.
Minerals 10 00589 g002
Figure 3. Geomembrane installation (a) and sensor placement and installation of the different layers of the field experimental cell (b) and (c).
Minerals 10 00589 g003
Figure 4. Picture of the CCBE field cell at the end of construction with the tote used to collect drainage water.
Minerals 10 00589 g004
Figure 5. Schematic showing the CCBE field cell with associated instrumentation.
Minerals 10 00589 g005
Figure 6. Hydrogeological behavior: (a) Laboratory column test and (b) field cell test.
Minerals 10 00589 g006
Figure 7. Degree of saturation measured in the moisture-retaining layer (MRL) and capillary break layer (CBL) and post-testing measurements: (a) Laboratory column and (b) field cell.
Minerals 10 00589 g007
Figure 8. Degree of saturation and matric suction measured in the MRL compared to water retention curve of the low-sulfide tailings.
Minerals 10 00589 g008
Figure 9. Evolution of leachate quality for the CCBE column and field cell.
Minerals 10 00589 g009
Figure 10. Oxygen fluxes passing through the surface of the MRL.
Minerals 10 00589 g010
Figure 11. Interstitial oxygen concentration values obtained in the field cell (measured in August 2017 and August 2018).
Minerals 10 00589 g011
Figure 12. Oxygen fluxes calculated using the sulfate release method for CCBE column and CCBE field cell.
Minerals 10 00589 g012
Figure 13. Efficiency with respect to limiting contaminant production for the CCBE column and field cell.
Minerals 10 00589 g013
Table 1. Selected material parameters.
ParameterReactive
Tailings (TR)
Low-Sulfide Tailings (TG)Waste Rock
(WP)
Waste Rock
(WL)
MineralogyQuartz 53%Albite 52%Quartz 68%Albite 38%
Pyrite 24%Quartz 22%Albite 27%Quartz 34%
Albite 8.2%Chlorite 13%Muscovite 3.4%Chlorite 14%
Pyrrhotite 4.5%Calcite 8.7%Pyrite 1.4%Actinolite 5%
Chlorite 4.4%Muscovite 2.8% Calcite 4%
Sphalerite 2%Dolomite 1.2% Pyrite 0.5%
Other 4.5%Other 1.2%
Stotal17%0.13%0.61%0.21%
Ctotal0.03%0.85%0.14%0.26%
NNP−52867−715
Kr3.2 × 10−4/s4.2 × 10−6/s--
USCS classificationPlastic silt (ML)MLwell-graded sand (SW)SW
GS (-)3.222.682.722.76
ksat (cm/s)2 × 10−45 × 10−53 × 10−22 × 10−2
-: not determined
Table 2. Equipment and monitoring approach used for the CCBE column and field cell.
Monitoring SettingsLaboratory ColumnField Cell
EquipmentDetailsEquipmentDetails
Hydrogeological parameters
θEC5 and GS3Accuracy: ±0.03; specific calibration curves5TM and GS3Accuracy: ±0.03; specific calibration curves
ψWATERMARK sensorsAccuracy: ±1 kPa; measurement range: 0–200 kPaWATERMARK sensorsAccuracy: ±1 kPa; measurement range: 0–200 kPa
O2 consumption test (OCT)10 cm void above column and an apogee SO-110 oxygen sensor Precision (good for oxygen flux >10 moles of O2/m2/yr). Allow to measure a nearly instantaneous oxygen flux15 cm cylinder and an apogee SO-110 oxygen sensorPrecision (good for oxygen flux >10 moles of O2/m2/yr). Allow to measure a nearly instantaneous oxygen flux
O2 gradient methodNot measured Sampling tubes, optical sensor, and OXY 10 system
Exfiltration waterBucket Tote tank
Water quality parameters
pH, EC, and temperatureOakton pHTestr®30 testerAccuracy: ±0.01 (pH) and ±0.5% (EC).Oakton pHTestr®30 testerAccuracy: ±0.01 (pH) and ±0.5% (EC).
EhOakton ORPTestr®30 testerRange: −999 mV to 1000 mV
Resolution: 1 mV
Accuracy: ±2 mV
Oakton ORPTestr®30 testerRange: −999 mV to 1000 mV
Resolution: 1 mV
Accuracy: ±2 mV
Alkalinity and acidityMetrohm 848 Titrino plus automatic titratorHigh precision and accuracy (±15%.)Metrohm 848 Titrino plus automatic titratorHigh precision and accuracy (±15%).
Sulfate anion850 Professional IC Anion–MCSDetection limit: 1 mg/L850 Professional IC Anion–MCSDetection limit: 1 mg/L
Metals concentrationICP-AES analysisDetection limit depending of the chemical elements (0.001 to 0.1 mg/L)ICP-AES analysisDetection limit depending of the chemical elements (0.001–0.1 mg/L)
Table 3. Maximum, minimum, and mean suction values measured over the testing period.
Overview of Suction Laboratory Column
Suctions (kPa)TG—0.50 m TG—0.80 m TRWL WP
Min/Max12/18 7/16 0/275/80 1/10
Mean16 14 632 8
Field experimental cell
Min/Max2/261/232/183/273/19
Mean13991510
Table 4. Summary of the water quality results from laboratory control column, field control cell, CCBE column and cell.
Physicochemical Parameters Lab Control ColumnLab Column with CCBEField Control CellField Cell with CCBE
Min/MaxMeanSTDMin/MaxMeanSTDMin/MaxMeanSTDMin/MaxMeanSTD
pH1.2/2.01.60.231.9/7.85.41.71.1/5.12.30.775.1/7.56.50.56
Fe (mg/L)65/3210156011421.7/1400373424495/14700432540509.5/491140148
Zn (mg/L)7/29402306620/232297357/3681631004.3/401614
Sulfates (mg/L)1533/22,00063004424364/25,951352355114660/47,64418,02210,08358/35592219896
Ca (mg/L)23/660300214427/69355771.4307/44736941491/61454035
Mg (mg/L)0.8/400508717/80432069/62129815057/1047615
As (mg/L)0.06/0.480.140.12<DLMN.D.N.D.0.06/343.97.5<DLMN.D.N.D.
Cu (mg/L)8.53/723219<DLMN.D.N.D.0.3/731515<DLMN.D.N.D.
Ni (mg/L)0.028/302.07.00.004/2.750.360.860.7/3.02.00.60.02/0.330.110.06
Pb (mg/L)0.13/2.00.50.400.020/0.760.300.280.34/357.00.79<DLMN.D.N.D.
S (mg/L)650/760021001527516/1660855140.1/11,900561836150.1/933674223
EC (mS/cm)2.5/1152.31.2/142.82.74.2/20104.31.4/7.72.81.2
Alkalinity<DLMN.D.N.D.0/1474458<DLMN.D.N.D.1/2199585
Acidity 900/14,0001500354221/1470553481447/34,020158641112823/1136360375
STD: Standard deviation; Alkalinity and acidity: (mg CaCO3/L); Redox potential: (mV); DLM: detection limit of the method; N.D.: Not determined.
Table 5. Efficiency values for CCBE column and field cell.
ParametersAnalytical SolutionOxygen Gradient MethodSulfate-Release MethodOxygen Consumption Test Method
Lab columnField cellLab columnField cellLab columnField cellLab columnField cell
Porosity (n)0.390.40
Effective diffusion coefficients (De, m2/s)2 × 10−122 × 10−11
Pyrite content over mass of dry tailings (Cp, kg/kg)2.5 × 10−32.5 × 10−3
Fcontrol (moles/m2/yr)650750650750650750650750
Fbase cover (moles/m2/yr)1 × 10−36 × 10−3N.C.4.5 × 10−149282535
Efficiency (%)99.999.9N.C.99.992.596.396.295.3
N.C.: not calculated.