Abstract
To improve the recovery of rare earth elements (REEs) from a refractory ore, this study investigated two different chemical decomposition methods, namely sulfuric acid baking and caustic digestion, with their respective leaching processes. The studied lateritic ore contained goethite (FeOOH) as a major constituent with REEs scattered around and forming submicron grains of phosphate minerals, such as apatite and monazite. Therefore, despite the substantially high content of REEs (3.4% total rare earth oxide), the normal acidic leaching efficiency of REEs reached only 60–70%. By introducing sulfuric acid baking and caustic digestion, the REE-leaching efficiency was significantly improved. After sulfuric acid baking at 2.0 acid/solid ratio and 200 °C for 2 h, the leaching efficiency reached 97–100% in the subsequent water-leaching. When the ore was digested with a solid/liquid ratio of 100 g/L in a 30 wt% NaOH solution at 115 °C and 300 rpm for 3 h, the REE-leaching efficiency of 99–100% was attained at 80 °C using a 3.0 M HCl solution. The correlation between the REE and the Fe-leaching was determined. The improvements in REE-leaching in both methods were mostly attributed to the mineral phase and crystallinity changes of Fe-bearing minerals due to the ore pretreatments. Such findings were also supported by X-ray diffraction and scanning electron microscopy analyses.
1. Introduction
The rare earth elements (REEs) comprise 17 elements in the periodic table, namely the 15 lanthanide elements (La–Lu) plus Sc and Y. These 17 elements are generally divided into two groups: La–Eu (Nos. 57–63) are light REEs (LREEs), whereas Gd–Lu (Nos. 64–71) and Y (No. 39) are heavy REEs (HREEs). Sc is not classified in any of the two groups. The REEs are used in various high-tech industries, e.g., the manufacturing of computers, cell phones, optical glasses, phosphors, hybrid cars and batteries, because of their unique electrical and magnetic properties [1,2,3,4].
REEs can be recovered from different minerals. More than 250 rare earth minerals have been discovered to date [1], and the representative minerals are monazite (REEPO4), bastnasite (REECO3F) and xenotime (YPO4). Monazite is an REE phosphate mineral that is very stable and difficult to leach under mild conditions. In contrast, bastnasite is an REE fluorocarbonate. When bastnasite is used as an REE resource, the fluorocarbonate should be converted first into an oxide or a sulfate to facilitate the succeeding leaching process. Xenotime is an yttrium phosphate mineral, which also has a very stable form; thus, similar to monazite, it is also difficult to leach under mild conditions. Other REE minerals include apatite, cheralite, eudialyte, loparite, phosphorite, secondary monazite and spent uranium solutions [4]. REEs are also found in ion-adsorbed clays; they are physically adsorbed onto the clays and are mostly HREEs [5,6,7].
Although there are several REE minerals in nature, only monazite, bastnasite and xenotime are commercially utilized [8]. General processing methods have been developed for these well-known REE minerals: acid baking (mostly by sulfuric acid) followed by water-leaching can be applied to treat them [8,9,10,11,12,13]. The REE phosphate minerals, i.e., monazite and xenotime, can also be effectively pretreated using a NaOH solution, and then, the converted REE hydroxide compounds are mostly leached in a weak acid solution [8,12,14,15]. Bastnasite can be leached by hydrochloric or sulfuric acid after a roasting process to decompose fluorine and carbonate [12]. The REEs from ion-adsorbed clays can be leached using an ammonium sulfate solution, the mechanism of which is similar to that of the ion exchange process [5,6,7].
However, the described methods are effective only when the minerals are recovered as high-grade concentrates and when the REE minerals exist as major minerals in the ores. Furthermore, the minerals contained within an ore vary depending on the mine; therefore, different processing methods need to be applied based on the ore type. Some researchers studied the leaching behavior of apatite containing considerable quantities of REEs. Habashi [16] reviewed the REE recovery from Kola apatite, and Jorjani et al. [17] conducted a leaching study using an apatite concentrate from the Chadormalu Plant in Iran. For the two studies, nitric acid was used as the leaching agent to prevent gypsum production. In addition, REEs in apatite can generally be recovered as a byproduct from calcium sulfate sludge from the wet processing of phosphoric acid [18,19]. REEs contained in apatite can also be treated by a two-step leaching method using hydrochloric acid as a leaching agent [20]. In the first step, approximately 80% of Ca and 60% of P are removed with almost no REEs loss, and the REEs are recovered at the second step with less impurities. Several metallurgical studies of refractory REE ores have also been conducted. In Brazil, Neumann and Medeiros [21] tried to separate the REE minerals from Araxá REE ore by physical methods; however, they decided to omit physical separation due to the complex mineralogy, fine REE crystals and particles having strong intergrowth with the gangue mineral. In a pilot plant, Araxá REE ore was introduced into direct leaching after sulfuric acid baking [15]. The REE ores in Chuktukon deposits from Russia showed similar mineralogical properties as the Araxá ores and direct chemical processing was also considered, i.e., nitric acid-leaching in an autoclave [22]. The processes mentioned above are summarized in Table 1.

Table 1.
Rare earth elements (REEs) recovery metallurgical processes.
As indicated in Table 1, appropriate processing methods based on the ore properties have to be developed to handle gangue minerals as well as REE minerals. This study investigated the enhancement in REE recovery from a refractory ore containing 3.4% total rare earth oxide (TREO) by applying two different chemical decomposition methods followed by leaching processes, i.e., sulfuric acid baking—water-leaching and caustic digestion–acid-leaching.
2. Materials and Methods
2.1. Ore Characteristics
The ore used in this study was a lateritic ore containing goethite as a major mineral. Figure 1 shows an X-ray diffraction (XRD) analysis of the REE ore, where the goethite, ettringite, muscovite, maghemite, and apatite peaks can be observed. However, no REE mineral peaks appeared because their concentrations were much lower than those of Fe-bearing minerals, and the REEs were scattered throughout the ore. REE-containing particles were observed through a scanning electron microscopy (SEM) analysis, as displayed in Figure 2. In the subsequent energy-dispersive X-ray (EDX) analysis (Figure 3), Ce oxide and mixed REE grains were observed, and some REEs were likely to substitute Ca in the apatite lattice. In addition, considering the high intensity of REEs and P in the mixed REE particle presented in Figure 3c, the presence of an REE phosphate mineral, i.e., monazite, was also expected.
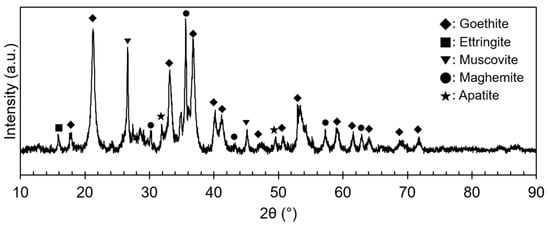
Figure 1.
XRD pattern of the REE ore.
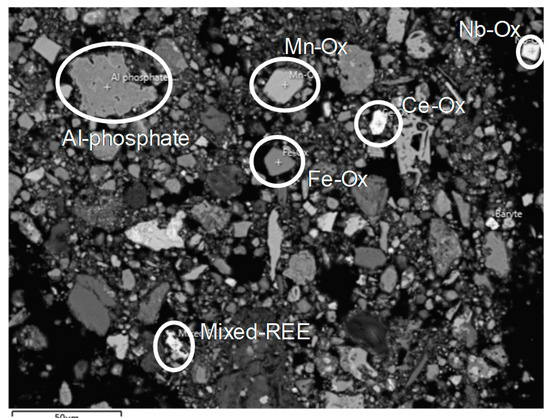
Figure 2.
SEM image of the REE ore.
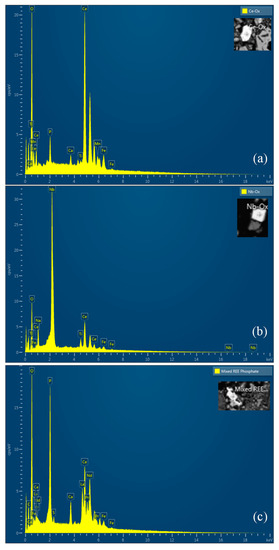
Figure 3.
EDX spectra of REE-containing grains: (a) Ce oxide grain; (b) Nb oxide grain, which is host to minor Ce; (c) mixed REE oxide grain with Ca and P.
Because the ore was lateritic, the iron content was significantly high (more than 50% as Fe2O3) and 10% of manganese was present as an oxide as presented in Table 2. The TREO grade was 3.4%, which is relatively high as an REE ore. Ce was the most abundant element, followed by La, Nd and Y (Table 2). The ore was obtained as a ground material, and the 80% passing size was 30 µm (Figure 4).
Table 2.
Chemical composition of the REE ore.
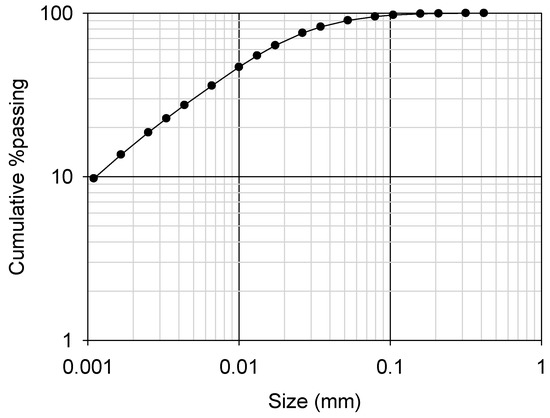
Figure 4.
Cumulative particle size distribution of the ground REE ore (P80 of 30 µm).
2.2. Preliminary Leaching
Generally, REE oxide can dissolve at a slightly acidic pH (pH of less than 4.0–5.0), and REE phosphate dissolves at a highly acidic pH of approximately −1.0 [20,23], respectively. The purpose of preliminary leaching was to determine if the REE minerals in the ore could really dissolve at those pH ranges. The suggested pH ranges can be achieved by hydrochloric or nitric acid concentrations of 2.0 M or less. Using sulfuric acid for the preliminary tests was avoided because it can cause the REEs to co-precipitate with Ca minerals and interfere with the analysis of the REE-leaching behavior. In the preliminary leaching, 1.0–3.0 M of nitric acid was used as a leaching reagent as it has less effect on the REE-leaching behavior since nitrate anions rarely react with any metal cations. The leaching temperature was varied as 25, 50 and 80 °C, with leaching times of 10 h, 3 h and 3 h, respectively. All leaching tests were conducted with a pulp density of 10% (w/w). The leaching efficiency and final metal recovery were calculated as follows, respectively:
Here, is the metal concentration dissolved in the leaching solution (mg/L), is the volume of the leaching solution (L), and are the metal contents in the leaching residue and ore (mg/g), respectively, and and are the amounts of the leaching residue and the ore used in the leaching test (g), respectively.
The leaching solution was sampled at regular intervals, and the samples were analyzed using inductively coupled plasma optical emission spectrometry (ICP-OES) to measure the metal concentration in the solution. The leaching residue and the ore were first fused by NaOH, with an ore to NaOH ratio of 1:10 (w/w) at 400 °C for 1 h. The fused products were then dissolved in aqua regia to measure the metal contents in the residue and the ore. They were also analyzed by ICP-OES. This solution analysis procedure was applied to all leaching tests in this study.
2.3. Sulfuric Acid Baking–Water-Leaching
To decompose the ore to a more soluble form, sulfuric acid baking was applied to the ore treatment. Various acid/solid ratios (w/w) were tested, i.e., 0.5, 1.0 and 2.0, and the ore and acid mixture was baked in a muffle furnace at 200 °C for 2 h. The baked ore was subsequently introduced to the water-leaching step. Water-leaching was conducted at 25, 50 and 80 °C for 3 h with a pulp density of 10% (w/w).
2.4. Caustic Digestion–Acid-Leaching
For caustic digestion, sodium hydroxide was used as a caustic chemical, and NaOH solutions with concentrations of 20, 30, 40 and 50% (w/w) were prepared. For the caustic digestion step, the highest temperature without boiling was chosen for each NaOH solution concentration, i.e., 105 °C at 20%, 115 °C at 30%, 120 °C at 40% and 145 °C at 50%. The digestion was conducted for 3 h, and the digested solid was then prepared for the subsequent acid-leaching reaction after solid/liquid separation and washing. The metal contents in the solid before and after digestion were measured by X-ray fluorescence (XRF). The digested solid was leached by hydrochloric acid (1.0–3.0 M) at 80 °C and 10% (w/w) pulp density for 3 h.
3. Results and Discussion
3.1. Preliminary Leaching Results
As a baseline, ore-leaching tests in nitric acid solution at different HNO3 concentrations and temperatures were conducted. In the preliminary leaching, the leaching efficiency was equal to the final recovery as it was a single-step process.
Prior to the leaching tests, Eh–pH diagrams of REEs were considered. According to the Eh–pH diagrams (Figure 5), REE(III) hydroxide can simply dissolve in an acidic pH region. Cerium shows a slightly different characteristic because it can exist as two valence states, i.e., +3 and +4. Ce(III) hydroxide behaves in a similar manner to other REE(III) hydroxides; however, if it oxidizes to a higher valence state, Ce(IV), its leaching can be inhibited under mild acidic conditions. The leaching behavior of Ce(IV) will be discussed thoroughly in later sections.
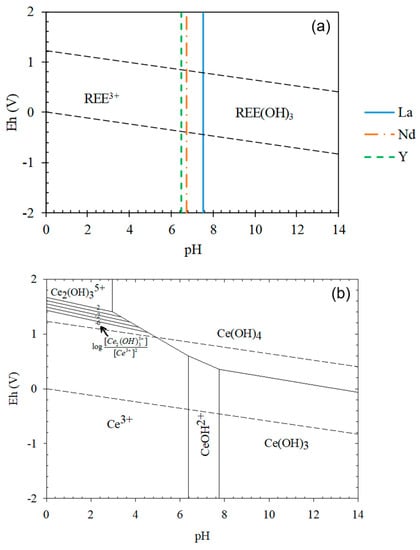
Figure 5.
Eh–pH diagrams of REE systems: (a) (La, Nd and Y)–OH; (b) Ce–OH ([Ce], [La], [Nd], [Y] = 0.01 M).
As depicted in Figure 6 and Table 3, the REE-leaching efficiency generally increased with increasing acid concentration from 1.0 to 2.0 M at 25 °C (Ce = 8.4–17.3%, La = 10.2–18.6%, Nd = 13.8–26.3% and Y = 23.2–31.3%) and temperature from 25 to 80 °C in 2.0 M HNO3 solution (Ce = 17.3–43.6%, La = 18.6–49.9%, Nd = 26.3–57.3% and Y = 31.3–48.2%). At 3.0 M HNO3 and 80 °C, the REE recovery further improved to 63.0% Ce, 61.4% La, 72.3% Nd and 55.9% Y. However, even though the REE-leaching efficiency was improved by the high acid concentration and temperature, the maximum efficiency only ranged from 61% to 73% and approximately 30–40% of the REEs remained in the solid phase.
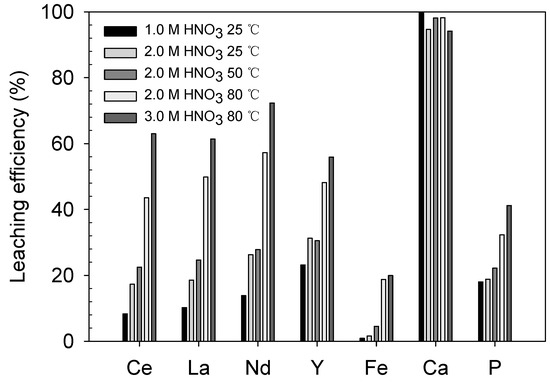
Figure 6.
Preliminary leaching results: leaching efficiency (%) of REEs and impurities at different HNO3 concentrations and temperatures.
Table 3.
Preliminary leaching results: leaching efficiency (%) of REEs and impurities at different HNO3 concentrations and temperatures.
The leaching levels of the major impurities, namely Fe, Ca and P, were also examined. The leaching levels of Fe and P were not significant because their maximum values were only 20.0% and 41.2%, respectively, at 3.0 M HNO3 and 80 °C. However, the Ca-leaching level was as high as 94–100% even at the most moderate condition of 1.0 M HNO3 and 25 °C. Considering the mineralogy of the ore, Ca was mostly derived from apatite, and the pH of the solution was sufficiently low to dissolve apatite (less than 0.25, Table 3), which is available at pH values between 1.0 and 3.3 [20]. The impurity-leaching behavior will be discussed in more detail in later sections related to the REE-leaching behavior.
In the succeeding residue analysis by SEM-EDX, some REE oxide particles or REE-containing grains were trapped in other mineral matrices (Figure 7). The size of REE grains was in the range between 1.5 and 12 µm, which suggests that further liberation was essential. However, the ore particle size was already very fine at P80 of 30 µm; therefore, the authors decided to conduct chemical decomposition methods to free the REE-containing grains from the trapping matrices and improve the leaching recovery.
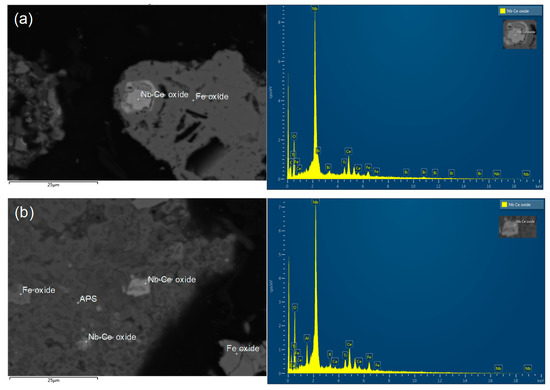
Figure 7.
SEM-EDX analysis of preliminary leaching residue (leached at 3.0 M HNO3 and 80 °C): (a) Fe oxide grain trapping Nb–Ce oxide; (b) micro-breccia of alumino-phosphate-sulfate (APS) bearing Fe oxide and Nb–Ce oxide.
3.2. Sulfuric Acid Baking–Water-Leaching
3.2.1. Effect of Acid/Solid Ratio
Sulfuric acid baking was expected to decompose the minerals trapping the REEs and the REE phosphate mineral itself (monazite and REE-substituted apatite). Because the entire baking product was sent to the next water-leaching step, it was considered that the leaching efficiency was equal to the final recovery. The detailed recovery and mass balance data are provided in Table S1 of a Supplemental data.
Through the sulfuric acid baking, the expected chemical reactions are likely to be those indicated in Equations (3)–(5). The ore and acid mixture before and after baking are displayed in Figure 8. According to Equation (3) and other previous studies [11,24], FeOOH, an Fe(III)-containing mineral, can only convert to Fe(III) sulfate species during sulfuric acid baking. Similarly, in this study, it was confirmed that most of the FeOOH was converted to Fe2(SO4)3 after the acid baking, regardless of the acid amount, at 1.0 and 2.0 acid/solid ratios (Figure 9). Although it was not detected from the XRD analysis, Fe(II) sulfate species seemed to be also formed, because the baked product color was pale green. This implied that a reductive reaction occurred during the baking process, but the mechanism was not clear. The authors assumed that it was the effect of unknown reductive materials in the ore and lack of oxygen sources in the closed muffle furnace.
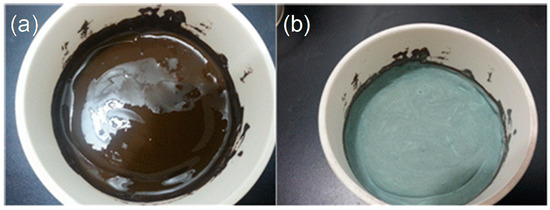
Figure 8.
The ore and sulfuric acid mixture (a) before and (b) after baking at 200 °C for 2 h.
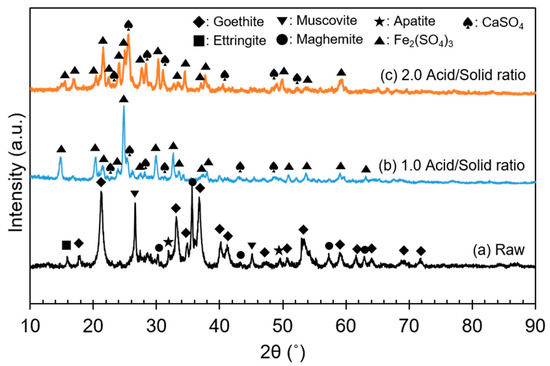
Figure 9.
XRD patterns before and after sulfuric acid baking at different acid/solid ratios: (a) raw ore; (b) acid/solid ratio = 1.0; (c) acid/solid ratio = 2.0.
In the succeeding water-leaching step, the REE recovery was significantly improved as shown in Figure 10, as the maximum levels were Ce 98.4%, La 99.1%, Nd100% and Y 96.5% after baking at an acid/solid ratio of 2.0. The sulfuric acid concentration in the leaching step was calculated simply from the amount added for the baking step. The corresponding sulfuric acid concentrations in leaching solutions with acid/solid ratios of 0.5, 1.0 and 2.0 were 0.57, 1.13 and 2.27 M, respectively, although some part of the acid was consumed during the baking step. In the preliminary leaching results, when 0.5, 1.0 and 2.0 M of nitric acid were used, the REE-leaching efficiency was significantly less than that of the baked sample. Thus, it can be concluded that the sulfuric acid baking effectively decomposed the minerals in the ore.
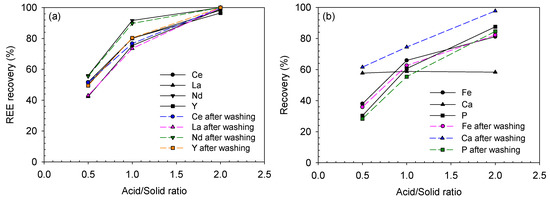
Figure 10.
Leaching recoveries of (a) REEs and (b) impurities after water-leaching of the baked ore at different acid/solid ratios of sulfuric acid baking (baked at 200 °C for 2 h and leached at 25 °C for 3 h).
In terms of impurity-leaching, the Fe and P recoveries were considerably increased to 38.0% and 30.3%, 65.9% and 60.6% and 81.1% and 87.5% after baking at 0.5, 1.0 and 2.0 acid/solid ratios, respectively, compared with the maximum Fe and P recoveries of 20.0% and 41.2%, respectively, at 3.0 M nitric acid and 80 °C. This also implied that the minerals were effectively decomposed via the acid baking process. In addition, the Fe recovery was much higher in this study than in the previous one [24], which was approximately 20% at 1.5 acid/ore ratio. This was because the Fe(II) species formed in the current study were more soluble, whereas in the previous study, only less soluble Fe(III) species were present even after sulfuric acid baking.
In contrast, the Ca acted in a different manner from other metals. Its recovery remained at the same level of 57–58% regardless of the acid/solid ratio. This level was 1.62–1.65 times less than the recovery of the preliminary leaching results of 94.1% at 3.0 M nitric acid and 80 °C. Interestingly, the Ca recovery was considerably improved to 61.6, 74.4 and 97.7% after washing the leaching residues of 0.5, 1.0 and 2.0 acid/solid ratios, respectively. This is because calcium can easily form Ca-sulfate precipitates in a leaching solution in the presence of sulfate ions [20,25]; thus, the Ca recovery was not so high initially. After washing the residue with 3–4 times more water than the leaching solution amount, i.e., 300–400 mL, some of the Ca-sulfate precipitates were solubilized. More Ca dissolved at the higher acid/solid ratio because more residual acid remained in the solid residue pore. The precipitation problem will be further discussed in Section 3.2.2.
3.2.2. Effect of Leaching Temperature
The effect of temperature on the leaching process was examined for the ore treated with an acid/solid ratio of 2.0, which was the best condition for the highest recovery. As shown in Figure 11, the REE recovery decreased with increasing temperature from 25 to 80 °C. Between 25 and 50 °C, only a slight decrease in recovery occurred, but the REE recovery significantly decreased to 60–72% at 80 °C, compared with 96–100% at 25 °C. This trend was also observed in the recovery of impurities: the Fe, Ca and P recoveries decreased to 57.9, 51.2% and 73.2% at 80 °C, respectively, from 81.1, 58.3% and 87.5% at 25 °C, respectively.
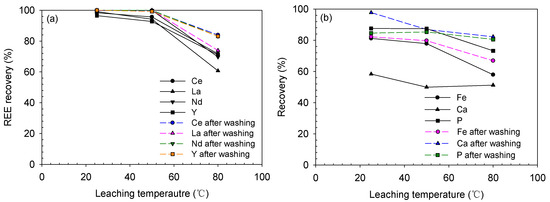
Figure 11.
Leaching recoveries of (a) REEs and (b) impurities after water-leaching of the baked ore at 25–80 °C for 3 h (baked at 2.0 acid/solid ratio and 200 °C for 2 h).
The decrease in recovery was because of Ca-sulfate precipitation. Calcium can easily form precipitates with sulfate ions owing to its low solubility as presented in Table 4. The solubility of Ca sulfate, i.e., calcium sulfate dihydrate (CaSO4·2H2O, CSD), is only 2.68 g/L at 25 °C (equivalent to 0.62 g/L Ca); then, it increases between 25 and 40 °C, and reduces to 2.59 g/L (0.60 g/L Ca) at 50 °C and 2.30 g/L (0.54 g/L Ca) at 80 °C [26,27]. The REE sulfates also showed a decrease in solubility with increasing temperature, but their solubility concentrations were significantly higher than their concentrations in the leaching solution (1.01 g/L Ce, 0.61 g/L La, 0.36 g/L Nd and 0.09 g/L Y at 2.0 acid/solid ratio and 25 °C). Despite these characteristics, the recoveries of REEs, Fe and P decreased at 80 °C. It seemed that these metals were adsorbed onto CSD and complexly reacted with each other to form co-precipitates. A similar behavior of REE co-precipitation and adsorption onto CSD was also observed in several previous studies [20,25,28]. They showed that the REE removal from the solution occurred at pH regions lower than the thermodynamic REE precipitation pH; thus, the adsorption onto the CSD surface would be a major process.
Table 4.
Solubilities of Ca sulfate and REE sulfate compounds at 25, 50 and 80 °C (the numbers inside the parentheses are the solubility of Ca and REEs).
Moreover, it is known that the solubility of REE phosphates also decreases with increasing temperature [29,30,31]; therefore, the REE phosphate precipitation also seemed to affect the recoveries of REEs and impurities. After leaching at 80 °C, the recoveries of REEs and impurities were significantly improved by the washing process because of the solubilization of the precipitated CSD, which contained the adsorbed metals.
3.3. Caustic Digestion–Acid-Leaching
3.3.1. Caustic Digestion Behavior
The second decomposition method, i.e., caustic digestion, was conducted at different concentrations of NaOH solution, i.e., 20–50 wt%. The significant chemical reactions of caustic digestion are shown in Equations (6)–(9).
It was expected that due to caustic digestion, the Al and P would be dissolved into the solution because they are very soluble in strong basic solutions, whereas the REEs would remain in the solid phase as a hydroxide. Actually, as the NaOH concentration was increased, the REEs were concentrated in the digested product, except Y (Y is slightly amphoteric [33]), and the Al and P contents decreased in the solid phase and finally reached 1.0 wt% and 0.1 wt%, respectively, in the 50 wt% NaOH digested product (Figure 12). Iron is not soluble in basic solutions; thus, it was also concentrated in the digested product.
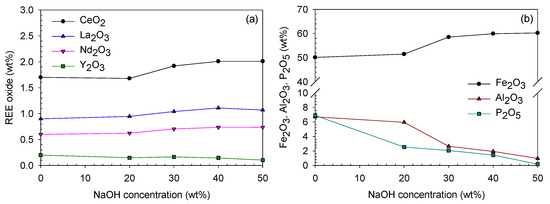
Figure 12.
Oxide contents (wt%) of (a) REE and (b) Fe, Al and P of the digested product at different digesting NaOH concentrations.
Figure 13 shows that the intensity of goethite peaks in the digested product decreased. Representatively, at 2θ value of 21.3°, the peak intensity of goethite was 1019 and 363 before and after the digestion, respectively. Even some of the goethite peaks disappeared after digestion, although the Fe concentration increased. In contrast, the intensities of gangue mineral peaks, such as those of muscovite and ettringite, were relatively improved. These phenomena implied that the crystallinity of the goethite weakened, and it may be possible to free the trapped REE particles. Actually, as indicated in Figure 14, the surface of ore particles were chemically affected and eroded after caustic digestion.
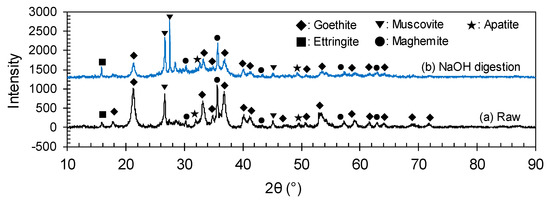
Figure 13.
XRD patterns before and after caustic digestion using 50 wt% NaOH solution.
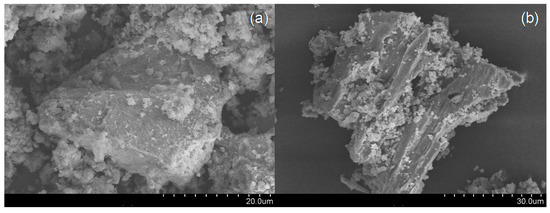
Figure 14.
SEM images of the ore (a) before and (b) after caustic digestion (digestion condition: 50 wt% NaOH and 145 °C for 3 h).
3.3.2. Acid-Leaching Behavior
The caustic digested product was introduced to the succeeding acid-leaching step. During the digestion step, some elements of the ore were lost to the liquid phase, e.g., Al and P; thus, the leaching efficiency and final recovery were different in this test. The leaching efficiency was calculated based on the amount of elements in the digested product, whereas the recovery was based on the amount in the raw ore. The detailed recovery and mass balance data are provided in Table S2 of the Supplemental data.
The effect of acid concentration was initially investigated using 1.0–3.0 M hydrochloric acid. The digested ore was produced using a 50 wt% NaOH solution. As presented in Figure 15, the REE-leaching efficiency generally increased as the acid concentration increased, while Ce behaved in a slightly different manner.
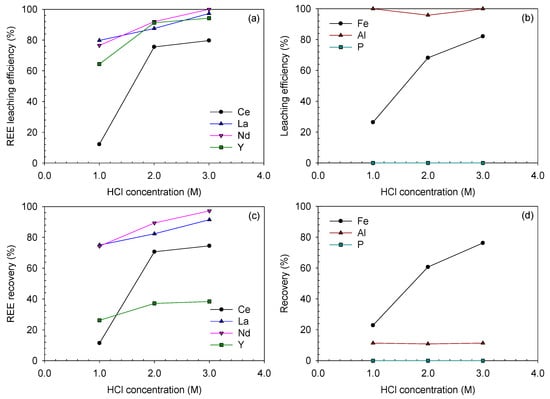
Figure 15.
Leaching efficiencies and recoveries after acid-leaching of the caustic digested ore at HCl concentrations of 1.0–3.0 M and 80 °C for 3 h (digested using 50 wt% NaOH solution for 3 h): (a) REE and (b) Fe-, Al- and P-leaching efficiencies (%); (c) REE and (d) Fe, Al and P recoveries (%).
In the case of Ce, its leaching efficiency only reached 12.1% at 1.0 M HCl. It was improved at elevated HCl concentrations of 2.0 and 3.0 M as 75.5% and 79.7%, respectively; however, these values were still lower than those of other REEs at 2.0 and 3.0 M HCl, which were in the range of 87–92% and 94–100%, respectively. It seemed that some part of Ce was converted from Ce(III) to Ce(IV) compound during the digestion step, probably Ce(OH)4, which led to the low recovery of Ce. Ce(OH)4 is less soluble than Ce(OH)3 as the solubility product of Ce(OH)4 is and that of Ce(OH)3 is [34]. This can be also confirmed from the Eh–pH diagram of the Ce-OH system in Figure 5; Ce(OH)3 can simply be leached at a slightly acidic pH, but Ce(OH)4 needs a highly acidic pH. Although Ce(OH)4 was not detected from the XRD analysis due to its low concentration, it was probable that Ce(OH)4 was formed during the caustic digestion because of the significantly lower Ce-leaching efficiency than those of the other REEs.
The final recoveries of Ce, La and Nd showed almost similar trends with their leaching efficiencies. However, that of Y was significantly low, i.e., 26.2–38.4% at 1.0–3.0 M HCl. This was because Y was dissolved and lost during the digestion step, and only 40% of Y from the raw ore was introduced into the acid-leaching step.
In terms of impurity-leaching, the Fe-leaching efficiency and recovery almost linearly increased as the acid concentration increased. The Al-leaching efficiency ranged from 95% to 100%; hence, its final recovery was similar to that in the digestion step, which was in the range of 10–12%. Phosphorus was not detected in any leaching solutions because it was removed during the digestion step.
Figure 16 illustrates variation of leaching results with the digesting NaOH concentration. In terms of leaching efficiency and recovery, both were maximized at 30 wt% NaOH concentration, and those of La and Nd were not much changed at higher NaOH concentrations. However, Ce showed an evident decrease in the leaching efficiency and recovery at NaOH concentrations higher than 30 wt%, which was caused by the less soluble Ce(OH)4 formation at higher NaOH concentrations. The final recovery of Y also significantly decreased as the NaOH concentration increased from 30 wt% to 50 wt%, although the leaching efficiency remained high at 93–94%. This was because its recovery from the digestion step decreased from 68% to 40% as the NaOH concentration increased from 30 wt% to 50 wt%.
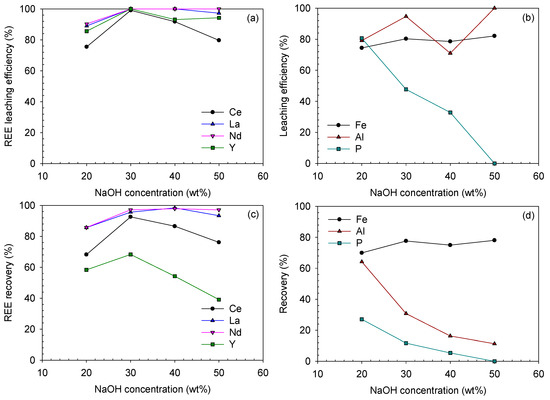
Figure 16.
Leaching efficiencies and recoveries after acid-leaching of the caustic digested ore at digesting NaOH concentrations of 20–50 wt% (leached using 3.0 M HCl at 80 °C for 3 h): (a) REE and (b) Fe-, Al- and P-leaching efficiencies (%); (c) REE and (d) Fe, Al and P recoveries (%).
Concerning the impurities, the Fe-leaching efficiency had a similar trend to that of the REEs (except Ce), which increased between 20 wt% and 30 wt% in the range of 74–82%. The Fe recovery was similar to its leaching efficiency, which ranged from 70% to 78%. However, the Al and P recoveries considerably decreased from 64.2% to 11.3% and 27.0% to 0%, respectively, as they were removed from the solution phase during the digestion step. In terms of leaching efficiency, that of P monotonously decreased, while that of Al fluctuated. It seemed that the residual NaOH in the digested product using 40 wt% NaOH solution suppressed the Al-leaching. A small amount of Al remained in the digested product using 50 wt% NaOH solution; thus, the Al-leaching efficiency reached 100%, although a higher NaOH concentration was applied.
3.4. Determination of the Optimum Condition for Analyzing the REE–Fe-Leaching Efficiency Correlation
To statistically analyze the REE-leaching behavior, correlation curves of the REE–Fe-leaching efficiency are plotted in Figure 17 and Figure 18 and the calculated R2 values are listed in Table 5.
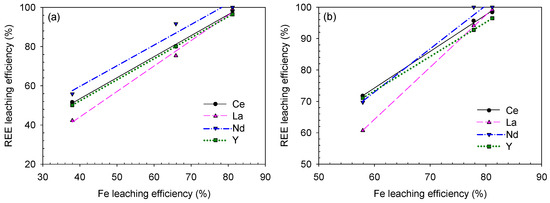
Figure 17.
REE–Fe-leaching efficiency correlation for the sulfuric acid baking–water-leaching results based on (a) acid/solid ratio and (b) leaching temperature.
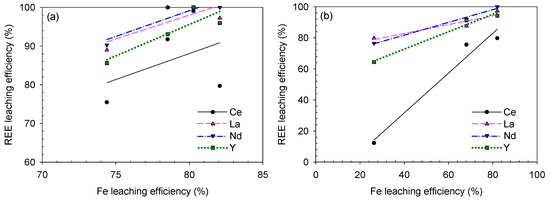
Figure 18.
REE–Fe efficiency correlation for the caustic digestion–acid-leaching results based on (a) digesting NaOH solution concentration and (b) leaching HCl concentration.
Table 5.
R2 values of REE–Fe correlation curves based on the decomposition method and leaching condition.
According to the analysis, the REE and Fe-leaching efficiencies were generally positively correlated. Specifically, the correlation was stronger during sulfuric acid baking–water-leaching (because the R2 values were much closer or even equal to 1.0000) than during caustic digestion–acid-leaching. This means that (i) REE-leaching highly depends on the Fe-bearing mineral decomposition, which traps the REE constituents during the sulfuric acid baking–water-leaching process and (ii) REEs and Fe co-precipitation by CSD affected a good R2 value; from REEs and Fe recovery trend before/after the residue washing process shown in Figure 10 and Figure 11, their leaching behavior was somewhat governed by CSD formation as both the dissolved REEs and Fe can adsorb and desorb from CSD in a similar extent.
The curves showed a weaker REE–Fe correlation for the caustic digestion–acid-leaching test results, and the Ce–Fe curve based on the NaOH concentration showed the weakest correlation with an R2 value of 0.1657. This is because of the Ce oxidation to the Ce(IV) species of Ce(OH)4 as discussed earlier. In addition, the La and Nd leaching efficiencies showed weak correlations with that of Fe based on the digestion condition (Figure 18a) because they reached 100% recovery at 80% Fe-leaching efficiency, which is slightly lower than the maximum Fe recovery of 82%. If the points corresponding to the 50 wt% NaOH digestion are removed, the REE–Fe correlations are improved: 0.9998 Ce–Fe, 0.9158 La–Fe, 0.9158 Nd–Fe and 0.9575 Y–Fe. This implies that both the Fe-bearing mineral decomposition and digesting NaOH concentration can considerably affect the succeeding acid-leaching step in the caustic digestion–acid-leaching process. Based on the leaching condition, i.e., HCl concentration, the REE–Fe correlation was satisfactory regardless of the elements (Figure 18b).
Consequently, under the applied decomposition methods and leaching conditions in this study, the REE-leaching was more affected by Fe-leaching during sulfuric acid baking–water-leaching. At the Fe-leaching efficiencies of 68% and 66%, the REE-leaching efficiencies (except Ce) were 88–92% and 75–80% from the caustic digestion–acid-leaching and sulfuric acid baking–water-leaching, respectively. Therefore, caustic digestion was a better decomposition method in terms of REE-leaching, and the REE-leaching was inhibited by CSD co-precipitation in the sulfuric acid baking–water-leaching process as the leaching efficiency was lower than in caustic digestion–acid-leaching at the same corresponding Fe-leaching level.
Overall, as the Fe-leaching reaches the maximum, the REE-leaching efficiency also attains its highest value; among the factors, the Fe-bearing mineral decomposition has the most significant effect on REE-leaching. Thus, considering the REE-leaching efficiency only, the optimum decomposition-leaching conditions are as follows: 2.0 acid/solid ratio sulfuric acid baking +25 °C water-leaching for the sulfuric acid baking–water-leaching process and 30 wt% NaOH digestion + 3.0-M HCl-leaching at 80 °C for the caustic digestion–acid-leaching.
4. Conclusions
In this study, the effects of two different chemical decomposition methods, namely sulfuric acid baking and caustic digestion, to enhance the REE recovery from a refractory ore were investigated. The REE-containing particles were scattered throughout the ore, and some of them were even trapped in other minerals such as Fe oxide, although the total REE concentration was relatively high at 3.4% TREO. From the preliminary leaching tests using nitric acid, the maximum REE recovery only reached 61–73%; thus, a significant amount of REEs was still left in the residue.
Using sulfuric acid baking–water-leaching, the REE recovery was improved to 97–100% after the ore was baked at 2.0 acid/solid ratio and 200 °C for 2 h. The REE recovery reduced with increasing leaching temperature because of the CSD solid formation at elevated temperatures and the accompanying REE co-precipitation.
During the caustic digestion reaction, the REEs were concentrated in the solid phase as Al and P were removed to the solution phase by the decomposition reaction. In the succeeding acid-leaching, all REE-leaching efficiencies reached the maximum after 30 wt% NaOH digestion for 3 h and 3.0 M HCl-leaching at 80 °C for 3 h. With increasing NaOH concentration, Ce became oxidized to Ce(IV) species of Ce(OH)4, and its leaching efficiency from the acid-leaching step decreased.
From the REE–Fe correlation analysis, a stronger correlation between the REEs and Fe was observed for the sulfuric acid baking–water-leaching results because of not only Fe-bearing mineral decomposition to iron sulfate, but also CSD precipitation with REEs and Fe. In addition, comparing the sulfuric acid baking–water-leaching and caustic digestion–acid-leaching, the caustic digestion showed a more powerful effect on enhancing the REE-leaching as it resulted to a higher REE-leaching efficiency at the same Fe-leaching level than that of sulfuric acid baking. It can be concluded that in terms of REE-leaching efficiency, as the Fe-leaching reached the maximum, the REE-leaching efficiency also attained its highest value. Furthermore, the Fe-bearing mineral decomposition significantly affected the REE-leaching of the studied ore.
Supplementary Materials
The following are available online at https://www.mdpi.com/2075-163X/10/6/532/s1, Table S1. Mass balance of sulfuric acid baking–water-leaching process; Table S2. Mass balance of caustic digestion–acid-leaching process.
Author Contributions
Conceptualization, R.K. and H.C.; methodology, R.K. and H.C.; validation, R.K., J.J., J.K. and S.L.; formal analysis, R.K., J.J., J.K. and S.L.; investigation, R.K.; resources, H.C., K.W.C., H.-S.Y. and C.-J.K.; data curation, R.K.; writing—original draft preparation, R.K.; writing—review and editing, H.C., K.W.C., H.-S.Y. and C.-J.K.; visualization, R.K.; supervision, H.C.; funding acquisition, H.C. and K.W.C. All authors have read and agreed to the published version of the manuscript.
Funding
This research was supported by the Energy Efficiency and Resources Core Technology Program of the Korea Institute of Energy Technology Evaluation and Planning (KETEP) granted financial resource from the Ministry of Trade, Industry and Energy (MOTIE) of the Korean government (No. 20122010300041). This research was also supported by the R&D Center for Valuable Recycling (Global-Top R&BD Program) of the Ministry of Environment of the Korean government (No. 2019002220001/KIGAM 20-9894).
Conflicts of Interest
The authors declare no conflicts of interest.
References
- Jordens, A.; Cheng, Y.P.; Waters, K.E. A review of the beneficiation of rare earth element bearing minerals. Miner. Eng. 2013, 41, 97–114. [Google Scholar] [CrossRef]
- Massari, S.; Ruberti, M. Rare earth elements as critical raw materials: Focus on international markets and future stategies. Resour. Policy 2013, 38, 36–43. [Google Scholar] [CrossRef]
- Golev, A.; Scott, M.; Erskine, P.D.; Ali, S.H.; Ballantyne, G.R. Rare earths supply chains: Current status, constraints and opportunities. Resour. Policy 2014, 41, 52–59. [Google Scholar] [CrossRef]
- Xie, F.; Zhang, T.A.; Dreisinger, D.; Doyle, F. A critical review on solvent extraction of rare earths from aqueous solutions. Miner. Eng. 2014, 56, 10–28. [Google Scholar] [CrossRef]
- Tian, J.; Chi, R.; Yin, J. Leaching process of rare earths from weathered crust elution-deposited rare earth ore. Trans. Nonferrous Met. Soc. China 2010, 20, 892–896. [Google Scholar] [CrossRef]
- Chen, Z. Global rare earth resources and scenarios of future rare earth industry. J. Rare Earths 2011, 29, 1–6. [Google Scholar] [CrossRef]
- Moldoveanu, G.A.; Papangelakis, V.G. Recovery of rare earth elements adsorbed on clay minerals: II. Leaching with ammonium sulfate. Hydrometallurgy 2013, 131–132, 158–166. [Google Scholar] [CrossRef]
- Sadri, F.; Nazari, A.M.; Ghahreman, A. A review on the cracking, baking and leaching processes of rare earth element concentrates. J. Rare Earths 2017, 35, 739–752. [Google Scholar] [CrossRef]
- Berry, L.; Agarwal, V.; Galvin, J.; Safarzadeh, M.S. Decomposition of monazite concentrate in sulphuric acid. Can. Metall. Quart. 2018, 57, 422–433. [Google Scholar] [CrossRef]
- Demol, J.; Ho, E.; Senanayake, G. Sulfuric acid baking and leaching of rare earth elements, thorium and phosphate from a monazite concentrate: Effect of bake temperature from 200 to 800 °C. Hydrometallurgy 2018, 179, 254–267. [Google Scholar] [CrossRef]
- Borra, C.R.; Mermans, J.; Blanpain, B.; Pontikes, Y.; Binnemans, K.; Gerven, T.V. Selective recovery of rare earths from bauxite residue by combination of sulfation, roasting and leaching. Miner. Eng. 2016, 92, 151–159. [Google Scholar] [CrossRef]
- Jha, M.K.; Kumari, A.; Panda, R.; Kumar, J.R.; Yoo, K.; Lee, J.Y. Review on hydrometallurgical recovery of rare earth metals. Hydrometallurgy 2016, 165, 2–26. [Google Scholar] [CrossRef]
- Soltani, F.; Abdollahy, M.; Petersen, J.; Ram, R.; Javad Koleini, S.M.; Moradkhani, D. Leaching and recovery of phosphate and rare earth elements from an iron-rich fluorapatite concentrate: Part II: Selective leaching of calcium and phosphate and acid baking of the residue. Hydrometallurgy 2019, 184, 29–38. [Google Scholar] [CrossRef]
- Huang, Y.; Dou, Z.; Zhang, T.; Liu, J. Leaching kinetics of rare earth elements and fluoride from mixed rare earth concentrate after roasting with calcium hydroxide and sodium hydroxide. Hydrometallurgy 2017, 173, 15–21. [Google Scholar] [CrossRef]
- Buchanan, J.; Reveley, S.; Forrester, K.; Cummings, A. Review of current rare earth processing practice. In Proceedings of the ALTA 2014, Perth, Australia, 24–31 May 2014. [Google Scholar]
- Habashi, F. The recovery of the lanthanides from phosphate rock. J. Chem. Technol. Biotechnol. Chem. Technol. 1985, 35, 5–14. [Google Scholar] [CrossRef]
- Jorjani, E.; Bagherieh, A.H.; Chelgani, S.C. Rare Earth Elements Leaching from Chadormalu Apatite Concentrate: Laboratory Studies and Regression Predictions. Korean J. Chem. Eng. 2011, 28, 557–562. [Google Scholar] [CrossRef]
- Preston, J.S.; Cole, P.M.; Craig, W.M.; Feather, A.M. the recovery of rare earth oxides from a phosphoric acid by-product. Part 1: Leaching of rare earth values and recovery of a mixed rare earth oxide by solvent extraction. Hydrometallurgy 1996, 41, 1–19. [Google Scholar] [CrossRef]
- Wang, L.; Long, Z.; Huang, X.; Yu, Y.; Cui, D.; Zhang, G. Recovery of rare earths from wet-process phosphoric acid. Hydrometallurgy 2010, 101, 41–47. [Google Scholar] [CrossRef]
- Kim, R.; Cho, H.; Han, K.N.; Kim, K.; Mun, M. Optimization of acid leaching of rare-earth elements from mongolian apatite-based ore. Minerals 2016, 6, 63. [Google Scholar] [CrossRef]
- Neumann, R.; Medeiros, E.B. Comprehensive mineralogical and technological characterisation of the Araxá (SE Brazil) complex REE (Nb-P) ore, and the fate of its processing. Int. J. Miner. Process. 2015, 144, 1–10. [Google Scholar] [CrossRef]
- Kuzmin, V.I.; Pashkov, G.L.; Lomaev, V.G.; Voskresenskaya, E.N.; Kuzmina, V.N. Combined approaches for comprehensive processing of rare earth metal ores. Hydrometallurgy 2012, 129–130, 1–6. [Google Scholar] [CrossRef]
- Kim, R.; Cho, H.; Han, K.N. Behavior of anions in association with metal ions under hydrometallurgical environments: Part I–OH- effect on various cations. Min. Metall. Explor. 2014, 31, 34–39. [Google Scholar] [CrossRef]
- Guo, X.; Li, D.; Park, K.; Tian, Q.; Wu, Z. Leaching behavior of metals from a limonitic nickel laterite using a sulfation–roasting–leaching process. Hydrometallurgy 2009, 99, 144–150. [Google Scholar] [CrossRef]
- Sadri, F.; Kim, R.; Yang, Z.; Ghahreman, A. The effect of calcium sulfate crystallization and the crystal modification on aqueous REE stability in Ca saturated REE-Ca-SO4-H2O systems. Hydrometallurgy 2018, 182, 82–96. [Google Scholar] [CrossRef]
- Dutrizac, J.E. Calcium sulphate solubilities in simulated zinc processing solutions. Hydrometallurgy 2002, 65, 109–135. [Google Scholar] [CrossRef]
- Azimi, G.; Papangelakis, V.G.; Dutrizac, J.E. Modelling of calcium sulphate solubility in concentrated multi-component sulphate solutions. Fluid Phase Equilibr. 2007, 260, 300–315. [Google Scholar] [CrossRef]
- Sadri, F.; Kim, R.; Ghahreman, A. Substitution of Calcium with Ce, Nd, Er, and Tb in the Structure of Microcrystals of Calcium Sulfates with Controlled Hydration Water: A Proposed Mechanism. Cryst. Growth Des. 2019, 19, 2621–2631. [Google Scholar] [CrossRef]
- Firsching, F.H.; Brune, S.N. solubility products of the trivalent rare-earth phosphates. J. Chem. Eng. Data 1991, 36, 93–95. [Google Scholar] [CrossRef]
- Poitrasson, F.; Oelkers, E.; Schott, J.; Montel, J. Experimental determination of synthetic NdPO4 monazite end-member solubility in water from 21 °C to 300 °C: Implications for rare earth element mobility in crustal fluids. Geochim. Cosmochim. Acta 2004, 68, 2207–2221. [Google Scholar] [CrossRef]
- Cetiner, Z.S.; Wood, S.A.; Gammons, C.H. The aqueous geochemistry of the rare earth elements. Part XIV. The solubility of rare earth element phosphates from 23 to 150 °C. Chem. Geol. 2005, 217, 147–169. [Google Scholar] [CrossRef]
- Das, G.; Lencka, M.M.; Eslamimanesh, A.; Wang, P.; Anderko, A.; Riman, R.E.; Mavrotsky, A. Rare earth sulfates in aqueous systems: Thermodynamic modeling of binary and multicomponent systems over wide concentration and temperature ranges. J. Chem. Thermodyn. 2019, 131, 49–79. [Google Scholar] [CrossRef]
- Ivano-Emie, B.N.; Nisel’son, L.A.; Ivolgina, A.T. Solubility of yttrium hydroxide in sodium hydroxide solution. Zhur. Neorg. Khim. 1961, 6, 1483–1484. [Google Scholar]
- Joshi, S.; Kulp, E.A.; Fahrenholtz, W.G.; O’Keefe, M.J. Dissolution of cerium from cerium-based conversion coatings on Al 7075-T6 in 0.1 M NaCl solutions. Corros. Sci. 2012, 60, 290–295. [Google Scholar] [CrossRef]


© 2020 by the authors. Licensee MDPI, Basel, Switzerland. This article is an open access article distributed under the terms and conditions of the Creative Commons Attribution (CC BY) license (http://creativecommons.org/licenses/by/4.0/).