Article

Comparison of Geochemical and Mineralogical Characteristics of Palaeogene Oil Shales and Coals from the Huangxian Basin, Shandong Province, East China

1
College of Earth Science and Engineering, Shandong University of Science and Technology, Qingdao 266590, China
2
College of Geoscience and Survey Engineering, China University of Mining and Technology (Beijing), Beijing 221116, China
3
Department of Earth Sciences, Natural History Museum, Cromwell Road, London SW7 5BD, UK
4
School of Marine Sciences, University of Haifa, Haifa 3498838, Israel
*
Author to whom correspondence should be addressed.
Minerals 2020, 10(6), 496; https://doi.org/10.3390/min10060496
Submission received: 26 April 2020 / Revised: 26 May 2020 / Accepted: 28 May 2020 / Published: 29 May 2020

Abstract

:
Coal and oil shale are both organic matter-rich sedimentary rocks. However, their sources of organic matter and their depositional environments are different. The present study focuses on the Palaeogene Lijiaya Formation sequence in the Huangxian Basin, Shandong Province, East China, which has oil shales showing marine geochemical indicators overlain by coals indicating marine regression. We investigated the C1 coal seam and underlying OS2 oil shale layers, compared their geochemical and mineralogical characteristics, clarified the details of their constituents, in order to elucidate the features of their sources, their depositional environments, and the post depositional processes in the context of the geological evolution of the basin. The Al2O3/TiO2 (18.1–64.9) and TiO2/Zr ratios (28.2–66.5) in the C1 coals and OS2 oil shales, respectively, suggest a felsic to intermediate source, and the Mesozoic granite on the South of Huangxian Fault may be one of the provenances of these sediments. The low sulphur content (0.53–0.59%) and low Sr/Ba ratios (0.32–0.67) suggest a freshwater depositional environment for the C1 coals. In contrast, the higher total sulphur contents (0.60–1.44%), the higher Sr/Ba ratios (0.31–1.11%), and the occurrence of calcareous shells, indicate seawater intrusions during deposition of the oil shales. The V/Ni, V/(V + Ni), and V/Cr ratios of the OS2 oil shale suggest oxic to suboxic conditions with a distinct change in palaeo-redox between the lower and upper parts of OS2 seam. The high boron contents in C1 coals (average, 504 ppm) is related to the high content of analcime (with the correlation coefficient of 0.96), and the high concentration of boron was attributed to a secondary enrichment by epigenetic hydrothermal solutions. The occurrence of idiomorphic-authigenic albite in association with analcime and quartz in veins in the coals suggests that albite is a product of a reaction between analcime and silica, both of volcanic origin. The reaction takes place at about 190 °C, indicating that the area was affected by hydrothermal fluids.

1. Introduction

Oil shale is defined as organic matter-rich sedimentary rock, which can be distilled to yield oil or gas [1,2]. Oil shale usually has a lower content of organic matter, with higher hydrogen and lower oxygen contents than coal [2]. The significant difference in the maceral composition between oil shale and humic coal is that, normally, the dominant maceral of oil shale is alginite [3]. In contrast, vitrinite is a major maceral group of many coals (e.g., Carboniferous coals of the Northern Hemisphere) [4]. Oil shale was usually deposited in environments with dense algal flora, such as marshes, shallow lakes, or seas [1]. According to the environment and habitat of the original organisms, oil shales can be classified into three groups: terrestrial, lacustrine, and marine oil shales [5]. In contrast, coal is commonly deposited in alluvial, coastal, estuarine/lagoon, barrier, and back-barrier environments [6]. Both coals and oil shales contain inorganic matter in addition to the biogenic organic matter [1,7]. Although the organic matter is the central part of their fuel value, the inorganic matter is also significant for the characterisation of oil shale and coal, in the context of exploration, mining, environmental aspects and economic value [8] such as critical elements in coal [9]. Furthermore, geological records in coal and oil shale can also provide information on the palaeoenvironment, palaeoclimate, and the geological evolution of the sequences in which they occur [6,7,10,11].
The present study was carried out in the Huangxian Basin, which is a paralic lacustrine basin, located in Shandong Province, East China. It has an area of about 350 km2, and hosts coal-bearing strata covering about 300 km2, and oil shale-bearing strata of about 200 km2 [12]. These various modes of coal and oil shale combinations [13] provide an appropriate geological setting for the study of the formation of coal and oil shale. Maceral and organic geochemical characteristics [14], sequence stratigraphy [13], and the sedimentary model [15] of oil shales and coals in the Huangxian Basin have been studied. However, the geochemical and mineralogical characteristics of the coals and oil shales have not been well addressed to date, even though they constitute the records of the processes of the formation of the coal and oil shales, the palaeoenvironmental conditions, and the record of the geological evolution of the basin.
Here, we present the results of our study of the geochemical and mineralogical characteristics of the coals and oil shales of Palaeogene age in the Liangjia Coal Mine, Huangxian Basin. This study aims to compare the geochemical and mineralogical characteristics between coals and oil shales and to discuss the characteristics of the provenance, depositional environment (palaeosalinity and palaeoredox), and the post-depositional process of the coals and oil shales.

2. Geological Setting

The Liangjia Coal Mine is located in the Huangxian Basin, Shandong Province, East China (Figure 1A,B). The Huangxian Basin is a coal-bearing faulted basin that formed and developed in the Mesozoic–Cenozoic [16]. It is adjacent to the Bohai Sea in the West and North and is bounded by the Beilin–Wagou (Beiwa) Fault in the East and the Huangxian Fault in the South (Figure 1B). The Huangxian Fault is syn-sedimentary, which controlled the formation of the Huangxian Basin, and resulted in the thickness contours having the same trend as the direction of extension of the fault [15]. The Liangjia Coal Mine, located in the northwestern part of the Huangxian Basin, is adjacent to the Bohai Sea in the west. Other coal mines in this basin are the Beizao Coal Mine, the Sangyuan Coal Mine, and the Wadong Coal Mine (Figure 1B).
The base of the Huangxian Basin consists of the Archean metamorphic rocks of the Jiaodong Group. The stratigraphic sequences from old to young are: Archean Jiaodong Group, Palaeoproterozoic Fenzishan Group, Neoproterozoic Penglai Group, Mesozoic Cretaceous, Cenozoic Palaeogene Wutu Group and Quaternary. The coal and oil shale-bearing strata belong to the Palaeogene Wutu Group. It includes Zhubidian Formation, Lijiaya Formation, and Xiaolou Formation. The Lijiaya Formation is the major coal and oil shale-bearing formation.
In the Huangxian Basin, the Lijiaya Formation has an average thickness of 216 m. The Lijiaya Formation unconformably overlies the Zhubidian Formation and conformably underlies the Xiaolou Formation. It consists of mudstone, siltstone, and sandstone. There are six coal seams and four oil shale seams in the Lijiaya Formation. Coal seam No. 1 (C1), coal seam No. 2, coal seam No. 4, and oil shale seam No. 2 (OS2) are the major mining coal seams and oil shale seam. The C1 overlies OS2, and the roof of C1 and the floor of OS2 are oil-bearing mudstones (Figure 1C). The present investigation focuses on the coals of C1, the oil shales of OS2, and their host rock samples (roof and floor samples). They were deposited in a lacustrine environment as indicated by drill hole data, fauna, and geological setting [18].

3. Sampling and Analytical Techniques

A total of 18 samples were investigated, including four coal samples of C1, 12 oil shale samples of OS2, one roof sample of C1, and one floor sample of OS2 (Figure 1C). These samples were collected from the underground working faces of the Liangjia Coal Mine, Huangxian Basin.
A sub-sample of each sample was ground to <200 mesh with a mill made of chromium-free steel and split into representative portions for the mineralogical and the chemical analyses. The ash yields, moisture, and volatile matter of coal samples were determined by a thermogravimetric analyser (LECO, TGA 801). One empty crucible and one certified coal standard (Leco coal standard LCRM reference 502–682) were analysed with no more than 18 samples in each run (there are 20 positions in the ceramic carousel). The calorific values of coals and oil shales were determined by LECO AC600. Two certified coal standards (GBW11101F and GBW11104L) were analysed along with every 10–15 samples to control the quality of the results. The total sulphur content was analysed by an automatic sulphur analyser (LECO SC832). The analyser was calibrated with certified coal standards (GBW11101f, GBW11104L, and GBW11110p) to cover a range of S concentrations 0.47% to 4.11% sulphur contents. Ultimate analysis, including carbon, hydrogen, and nitrogen content, were performed using a Vario Macro Elemental Analyzer. Vitrinite random reflectance was determined using a Leica DM4 P LED microscope equipped with a Fossil spectrophotometer, using incident light passing through a 546-nm band filter on the path to the photomultiplier.
All the coal, oil shale, and host rock samples were ashed at 815 °C (following a Chinese Standard for high-T ash yield, GB/T212-2008) [19]. The ashes were analysed by X-ray fluorescence spectrometry (XRF, Bruker S8 Tiger) to determine the concentrations of major elements oxides (i.e., SiO2, TiO2, Al2O3, Fe2O3, MnO, MgO, CaO, Na2O, K2O, P2O5).
Concentrations of trace elements in the coal, oil shale, roof, and floor samples were determined by inductively coupled plasma–mass spectrometry (ICP-MS), except B and Hg. Prior to ICP-MS analysis, the coal, oil shale, and host rock powder samples were subjected to microwave dissolution in a mixed HNO3+HF acid. The digestion reagent was a mixture of 5 mL HNO3 and 2 mL HF for coal and low-ash oil shale (ash yield <50%) samples, and a mixture of 2 ml HNO3 and 5 mL HF for each 50 mg host rock and high-ash oil shale (ash yield >50%) samples [20]. The procedures of digestion and ICP-MS analyses are more fully described by Dai et al. [20]. For boron analysis, the addition of H3PO4 to the HNO3 and HF aims to diminish boron volatilisation during acid-drying after sample digestion [21]. The concentrations of boron in the samples were determined by inductively coupled plasma optical emission spectrometry (ICP-OES). The mercury contents of the samples were determined using the Direct Mercury Analyser (Milestone DMA-80), and the detection limit of Hg is 0.005 ng.
Mineralogical compositions were determined using a Rigaku D/ max-2500/PC X-ray powder diffractometer (XRD) with Ni-filtered Cu-Kα radiation and a scintillation detector. Before XRD analysis, low-temperature ashing (LTA, <150 °C) of the coal samples and oil shale samples with low ash yield (<50%) was carried out using an EMITECH K1050X plasma asher. XRD analysis was carried out on the low-temperature ashes of the coals and low ash oil shales, and powdered samples of the high ash oil shale and host rock samples. Each XRD pattern was recorded over a 2θ interval of 2–70° with 0.02° steps. The Rietveld-based Siroquant™ commercial interpretation software was used to determine the mineral percentages from the X-ray diffractograms [22]. A field emission scanning electron microscope (FE SEM) in conjunction with an EDAX energy-dispersive X-ray spectrometer (Genesis Apex 4) was used to observe and record the morphological features and modes of occurrence of the minerals, and also to determine the distribution of selected elements in polished pellets of the coal and oil shale samples.

4. Results

4.1. Proximate and Ultimate Analyses

Table 1 presents the proximate and ultimate analyses, thickness, total sulphur, and gross calorific value of individual coal and oil shale benches of C1 and OS2. The coals of C1 are classified as ultra-low ash (Ad ≤ 10%) and low ash (10% < Ad ≤ 20%) coals according to the Chinese Standard GB/T 15224.1-2018 [23] (coals with ash yields of no more than 10% and 10–20% are considered as ultra-low-ash coals and low-ash coals, respectively), and low-sulphur coals (St,d < 1%) according to [24]. The GCVim, MMF values, varying from 24.545 MJ/kg to 26.324 MJ/kg, is in the range of subbituminous A coal (24.418–26.743 MJ/kg) according to ASTM D 388-18 [25].

4.2. Geochemistry

4.2.1. Major-Element Oxides

The OS2 oil shales of the Liangjia Coal Mine have much higher ash yield (47.11% on average) than that of the C1 coals (9.35% on average) (Table 1). Therefore, values calculated on ash-basis are used to compare the concentrations of major-element oxides. The OS2 oil shales have relatively high concentrations of SiO2, Fe2O3, and P2O5 in comparison with C1 coals. In contrast, C1 coals have higher concentrations of Al2O3 and Na2O, and the concentrations of TiO2, MnO, MgO, CaO, and K2O are close to each other (Table 2). Silicon and aluminium are the dominant elements in most coal samples, although high proportions of calcium occur in LJ1-3. Besides, the LJ1-2 and LJ1-4 have high contents of Na2O. Silicon is the dominant element in all oil shale samples of OS2, followed by Ca and Al. Samples U2-2-2 and U2-2-5 have high contents of Fe2O3, and U2-2-4 has a high content of CaO. Samples U2-2-1, -6, and -7 are distinctive in having high contents of SiO2 and low contents of CaO and Fe2O3. The floor of OS2 is chemically similar to the oil shales, but the roof of C1 has higher Fe2O3, MgO, K2O, and P2O5 and lower Na2O than C1 coals on ash basis (Table 2).
On a whole-coal basis, the concentrations of most of the major-element oxides in C1 coals are lower than those of the average Chinese coals [26], but CaO and Na2O are enriched.

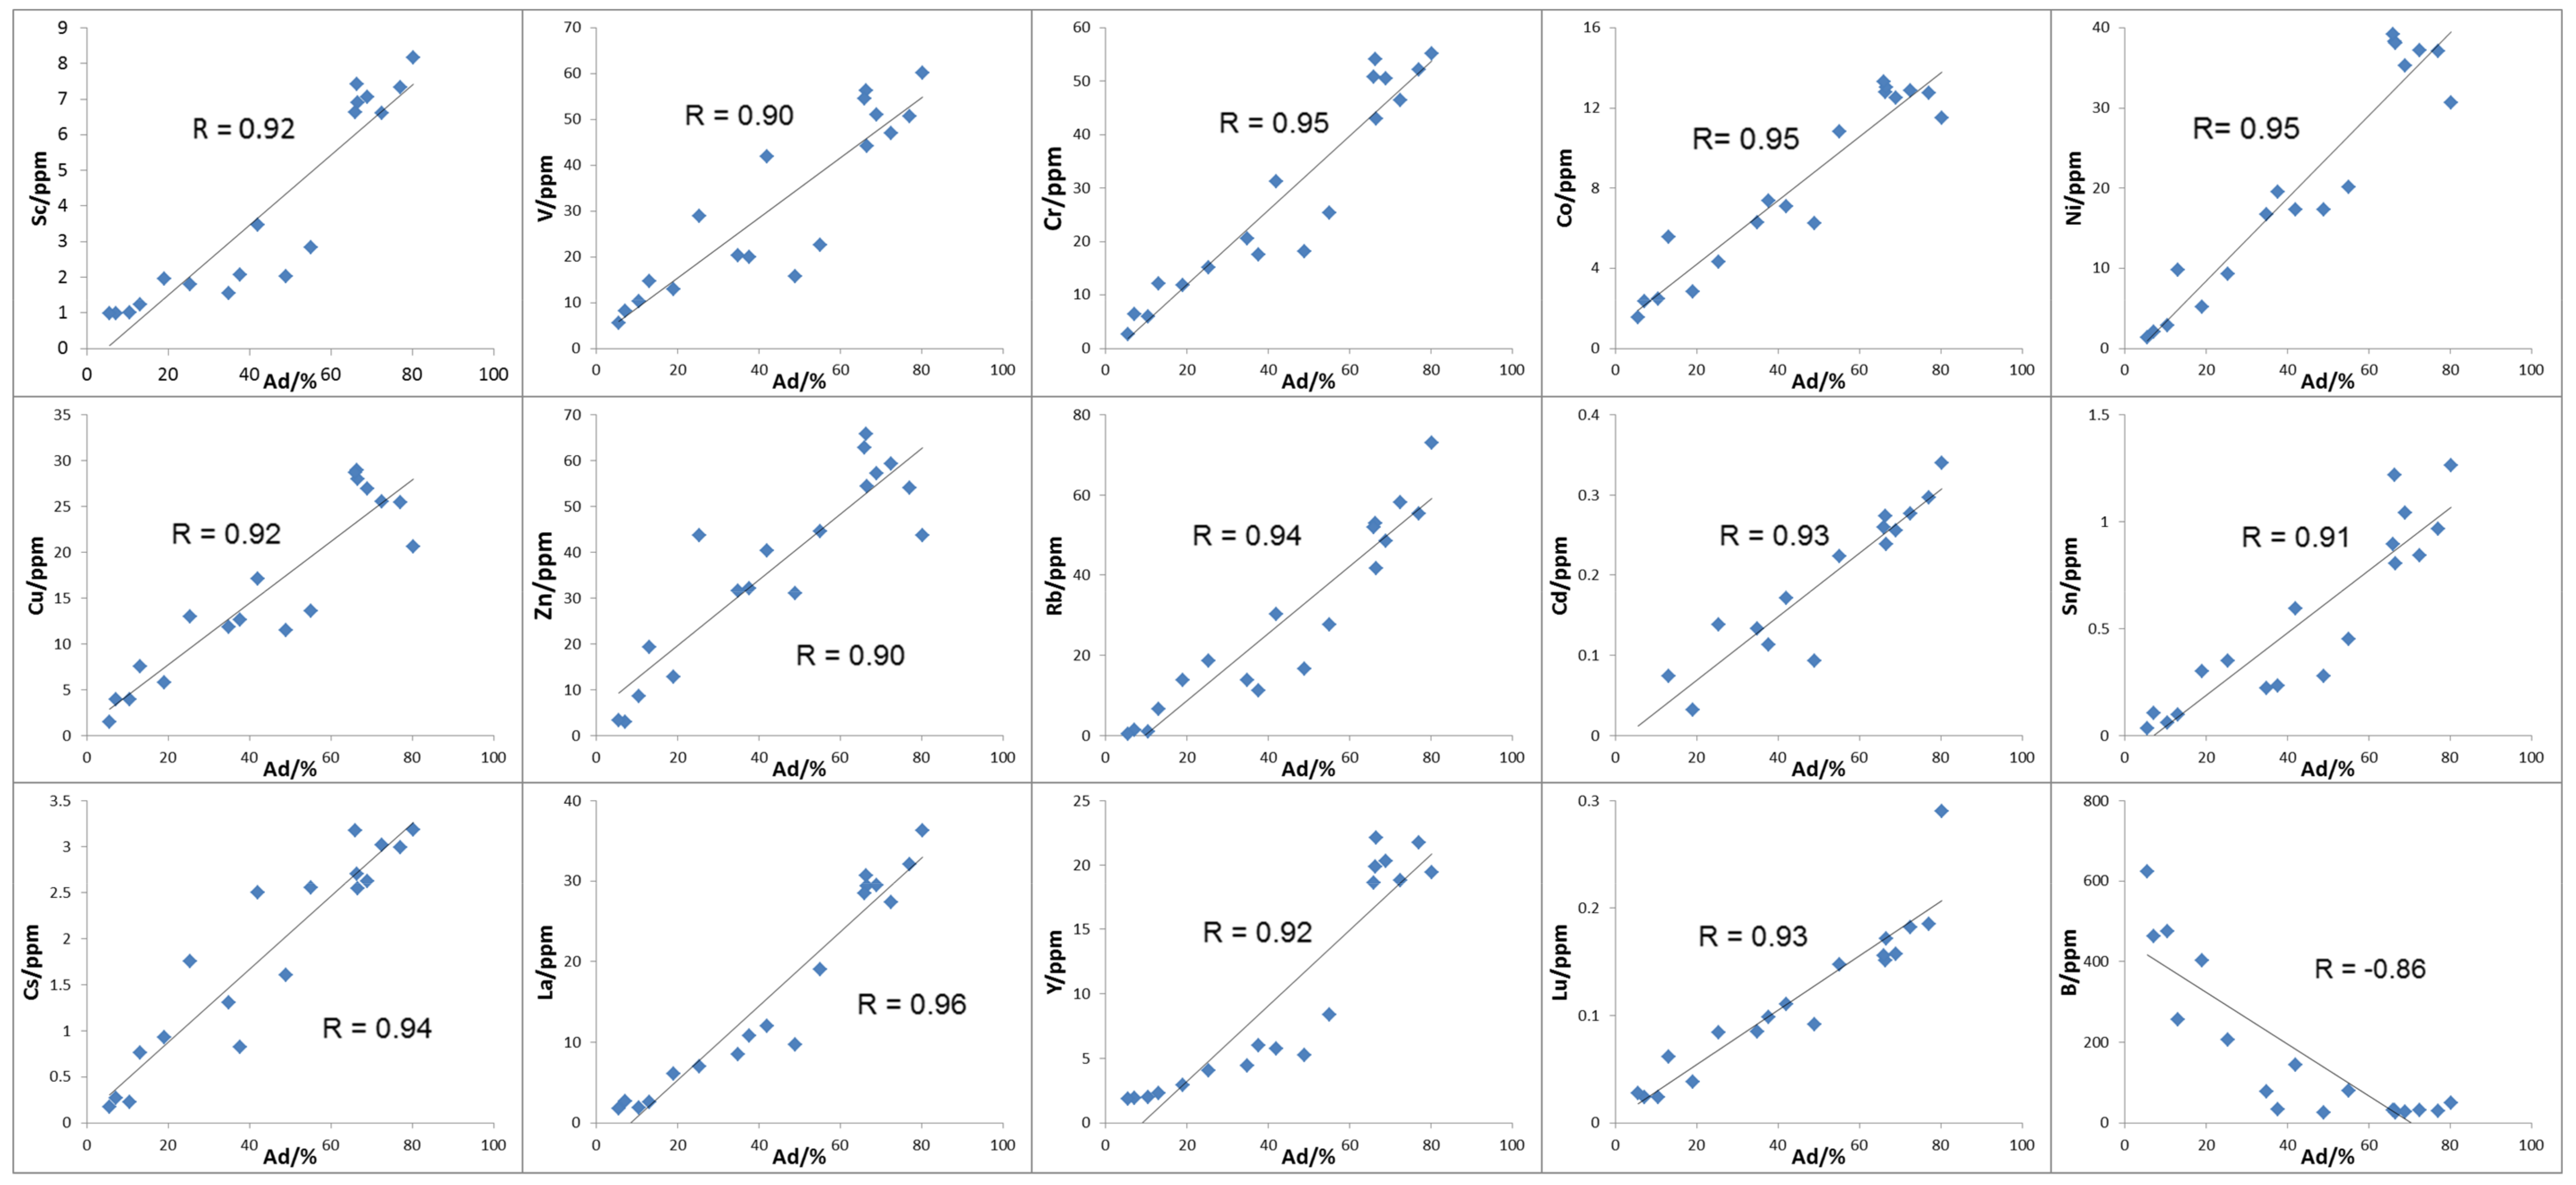
4.2.2. Trace Elements

Compared with the average values for world low-rank coals [27], trace elements of C1 coals in Liangjia Coal Mine are depleted, except for B and Ba. Boron is highly enriched, with a concentration coefficient (CC, the ratio of element concentrations in investigated samples vs. corresponding averages for world low-rank coals) of 9.0 [28]. The concentration of Ba is slightly higher than the average values for world low-rank coals [27] (CC = 1.1) (Table 3).
Compared with the average values for world terrigenous and volcanic-sedimentary shales reported by Ketris and Yudovich [27], the concentrations of Sr and B in OS2 oil shales are slightly enriched (CC values of 1.47, 1.06), and other trace elements are depleted.
A strong positive correlation exists between concentrations of most trace elements and ash yields in all coal, oil shale, roof, and floor samples (Table 3). The correlation coefficients (r) of concentrations of Sc, V, Cr, Co, Ni, Cu, Zn, Rb, Cd, Sn, Cs, REE and yttrium and ash yield are higher than 0.9. However, boron is negatively correlated with ash yield, with a correlation coefficient of −0.86 (Table 3). In order to show the inorganic matter affinity of these elements, X-Y plots of the concentrations and ash yields of these elements are shown in Figure A1 [29].
The total concentrations of rare earth elements and yttrium (REY) in coals range from 11.8 to 31.7 ppm, with an average of 17.1 ppm (Table 3). The oil shales have higher REY (average 88.3 ppm) than the coals, and CC values of 0.51 in comparison with the average values for world terrigenous and volcanic-sedimentary shales (Table 3) [27]. Normalised to the Upper Continental Crust (UCC) [30], Eu shows positive anomalies (δEu = EuN/EuN* = EuN/(0.33 × SmN + 0.67 × TbN, N means REEs normalised by UCC) [31]. However, barium could cause significant interference on Eu in sedimentary rocks [31], since Ba-based polyatomic ions (135Ba16O/134Ba16OH and 137Ba16O/136Ba16OH,) could cause overestimation of 151Eu and 153Eu during quadrupole-based ICP-MS analysis when the Ba contents are much higher than the Eu contents in the samples analysed (Ba/Eu > 1000) [32]. In the C1 coals, OS2 oil shales and the host rock samples, the Ba/Eu ratios have an average of 748, most coals and some oil shales have Ba/Eu ratios of more than 1000 (Table 3). Therefore, the positive Eu anomalies in the studied samples are due to Ba interference, and therefore the Eu values interfered by Ba are not interpreted in this study.

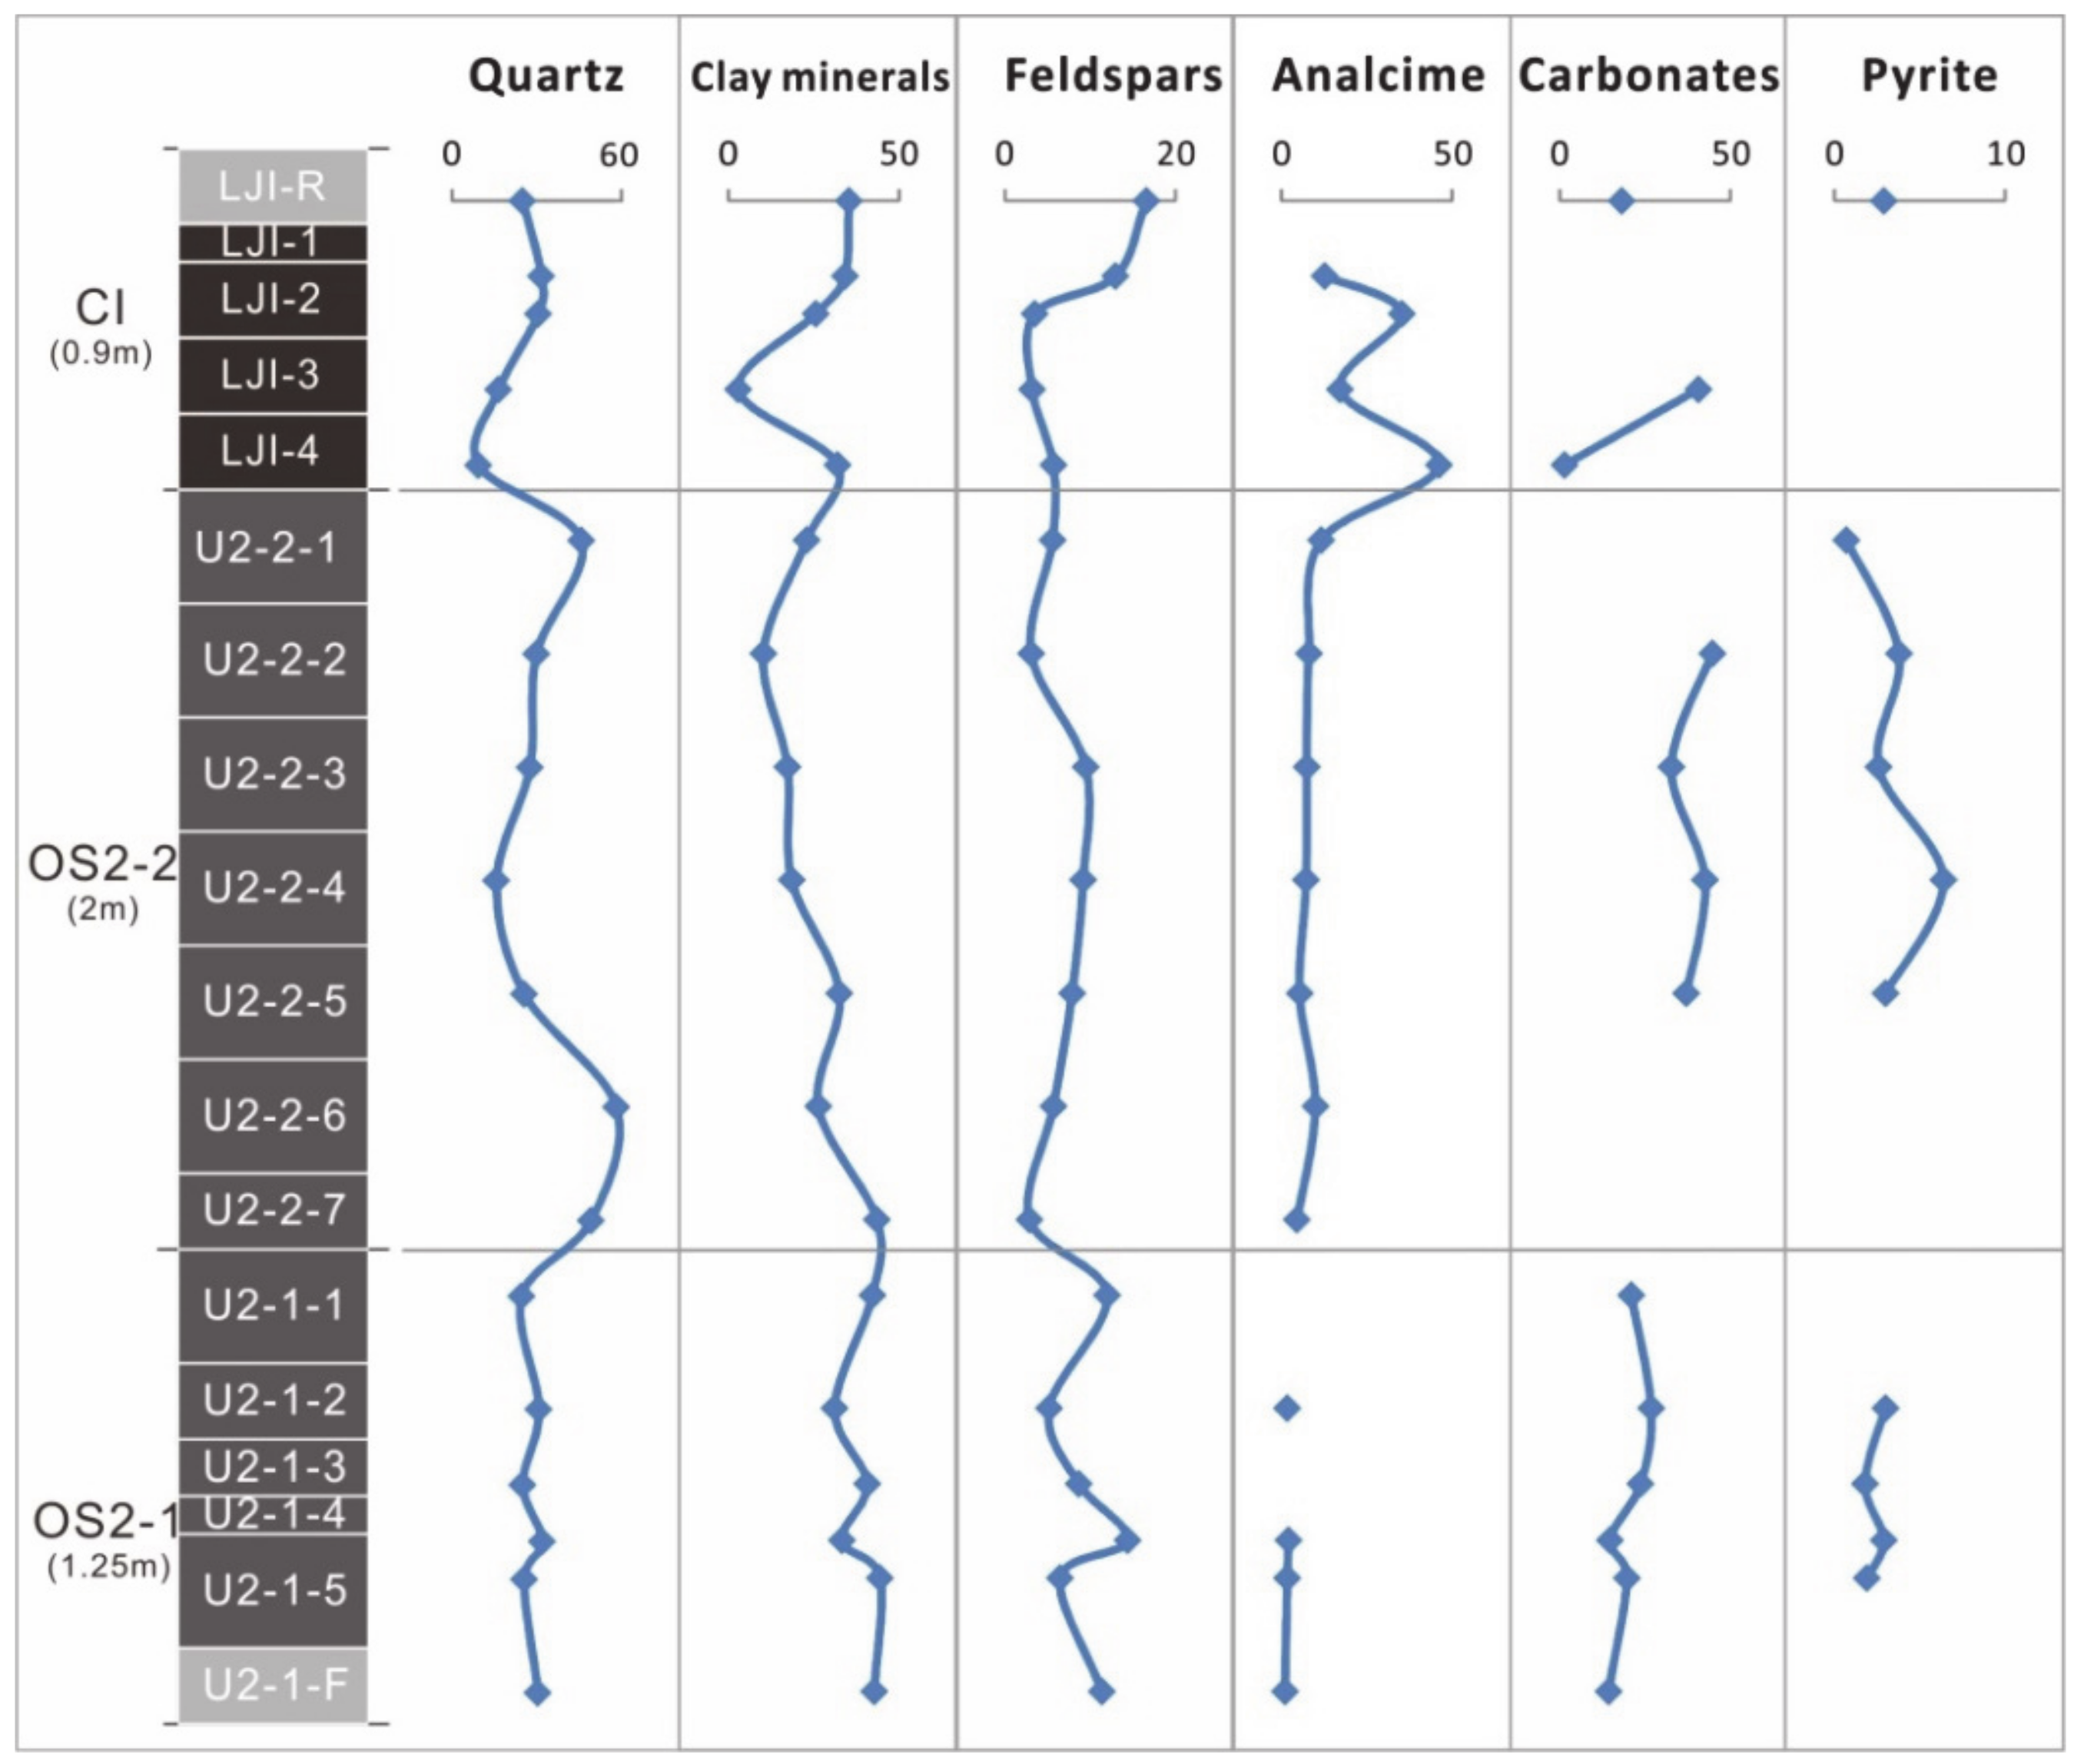
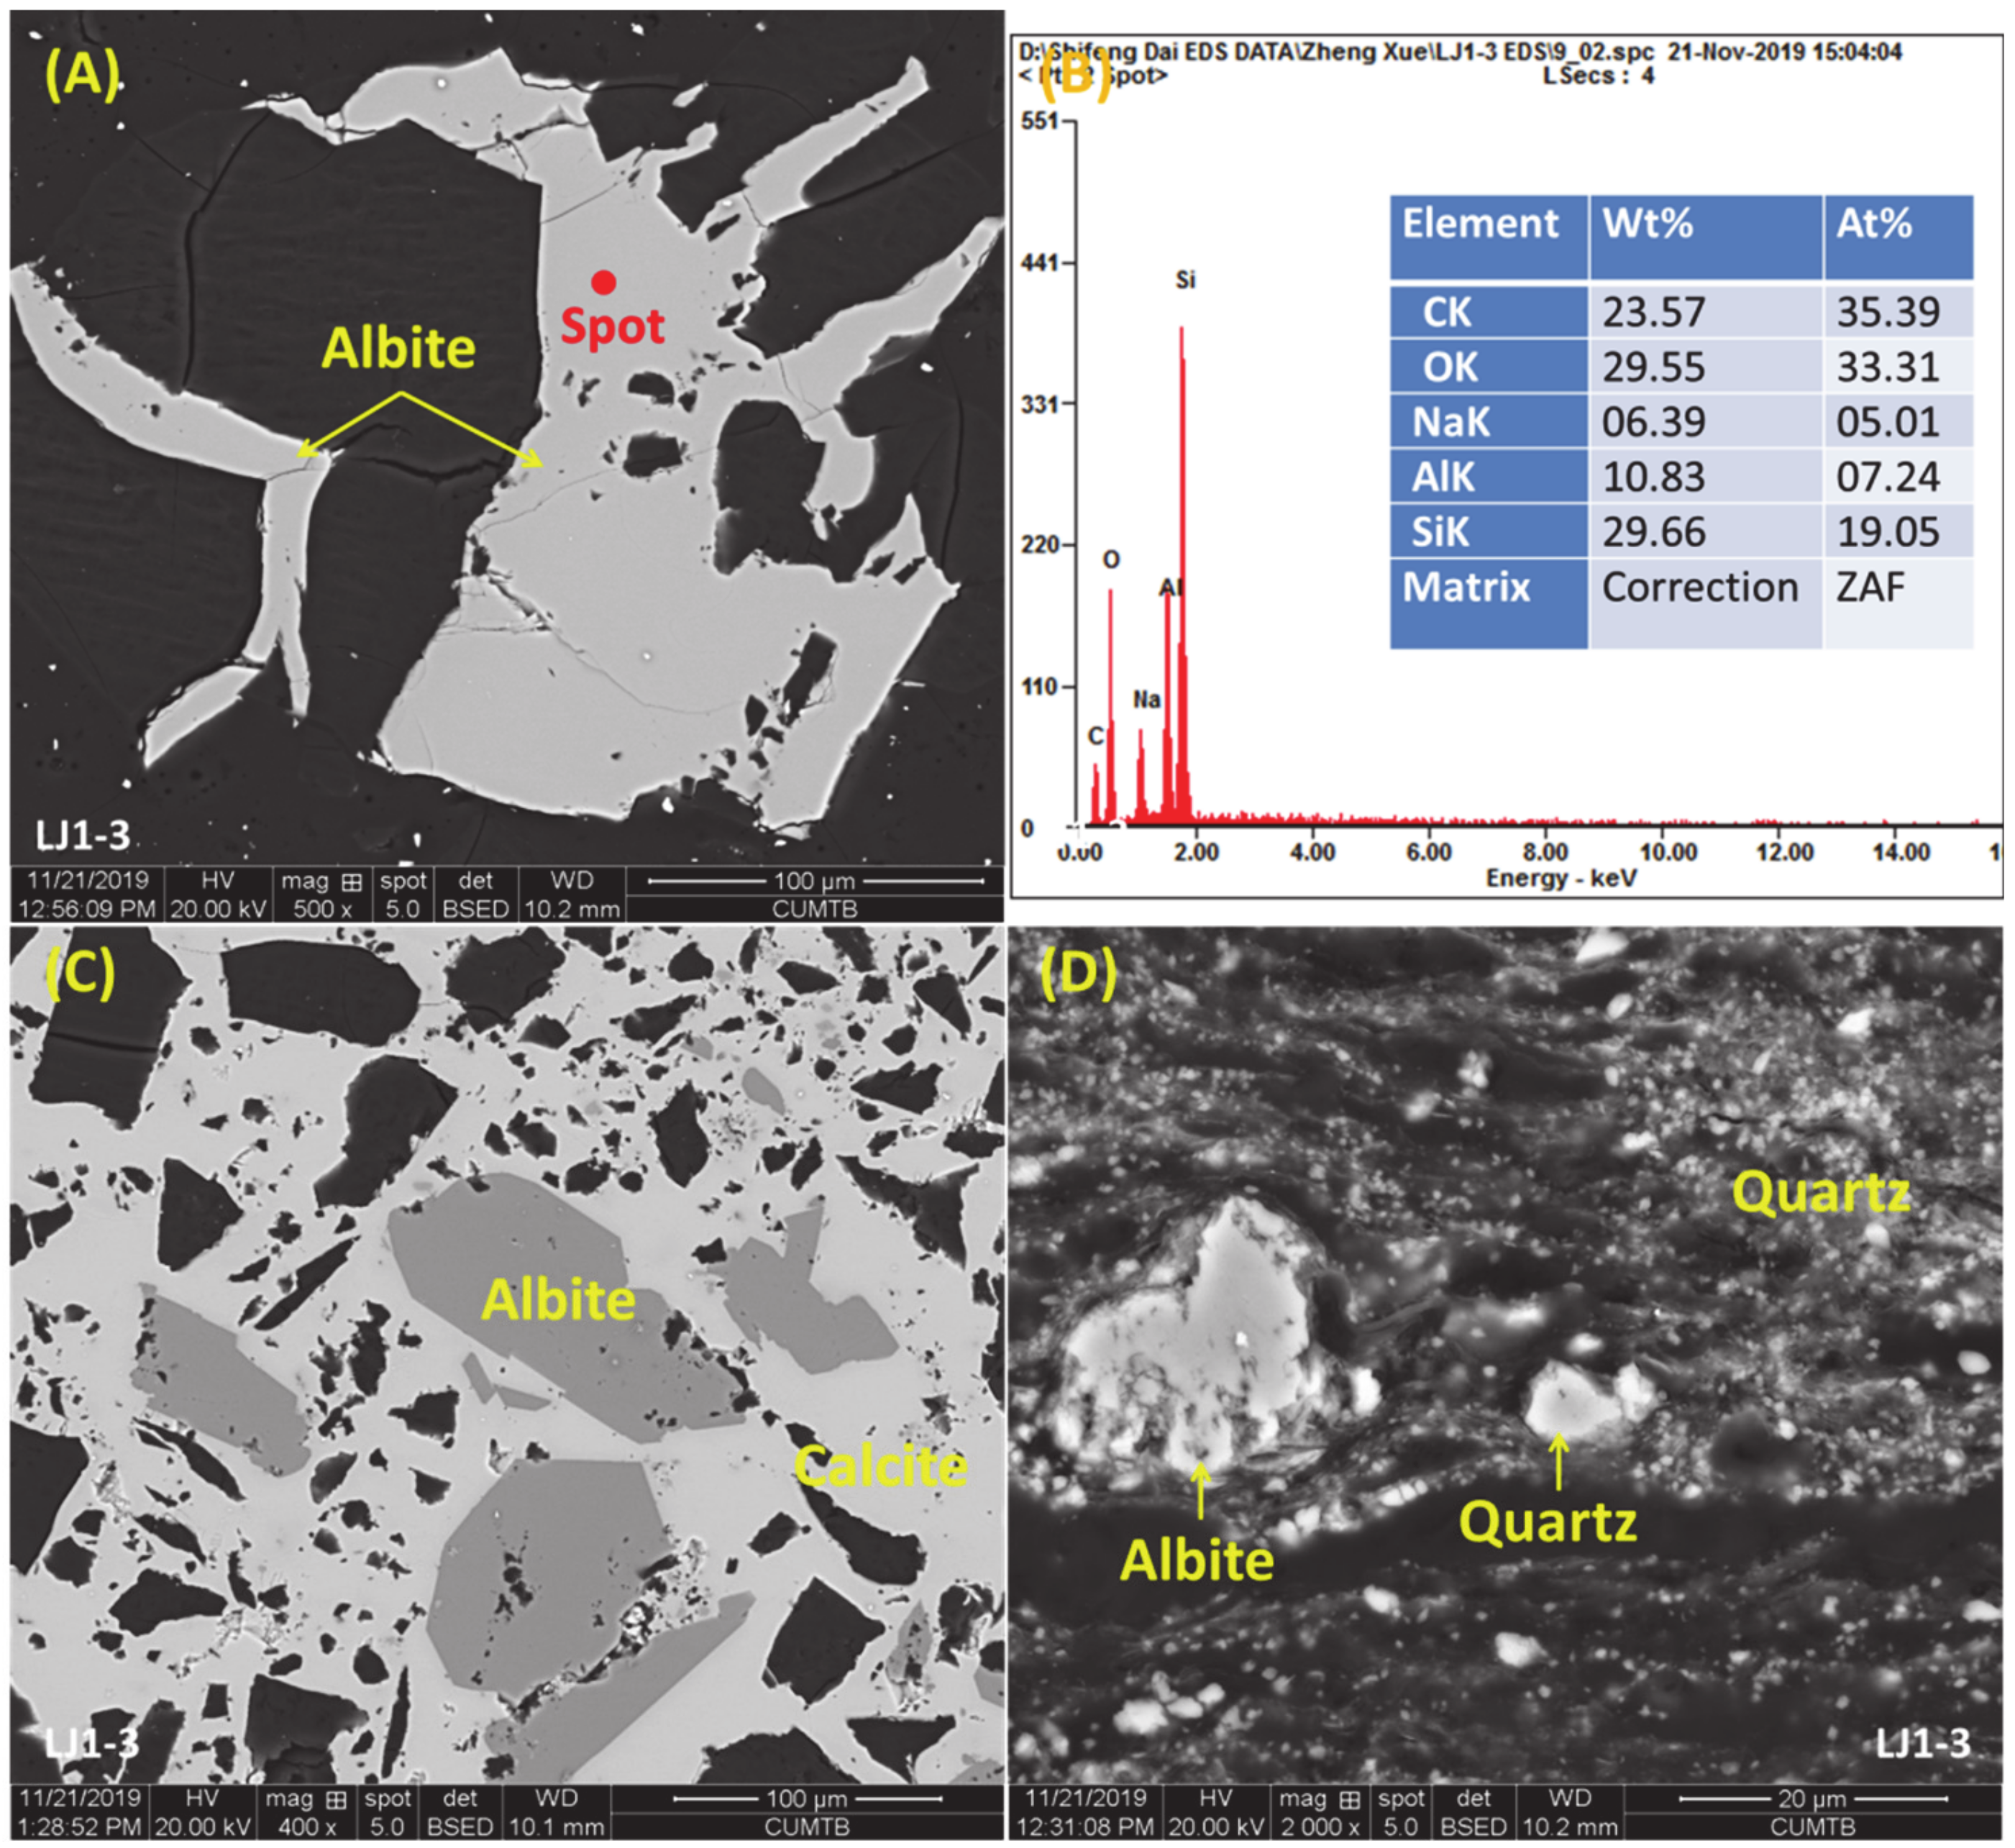
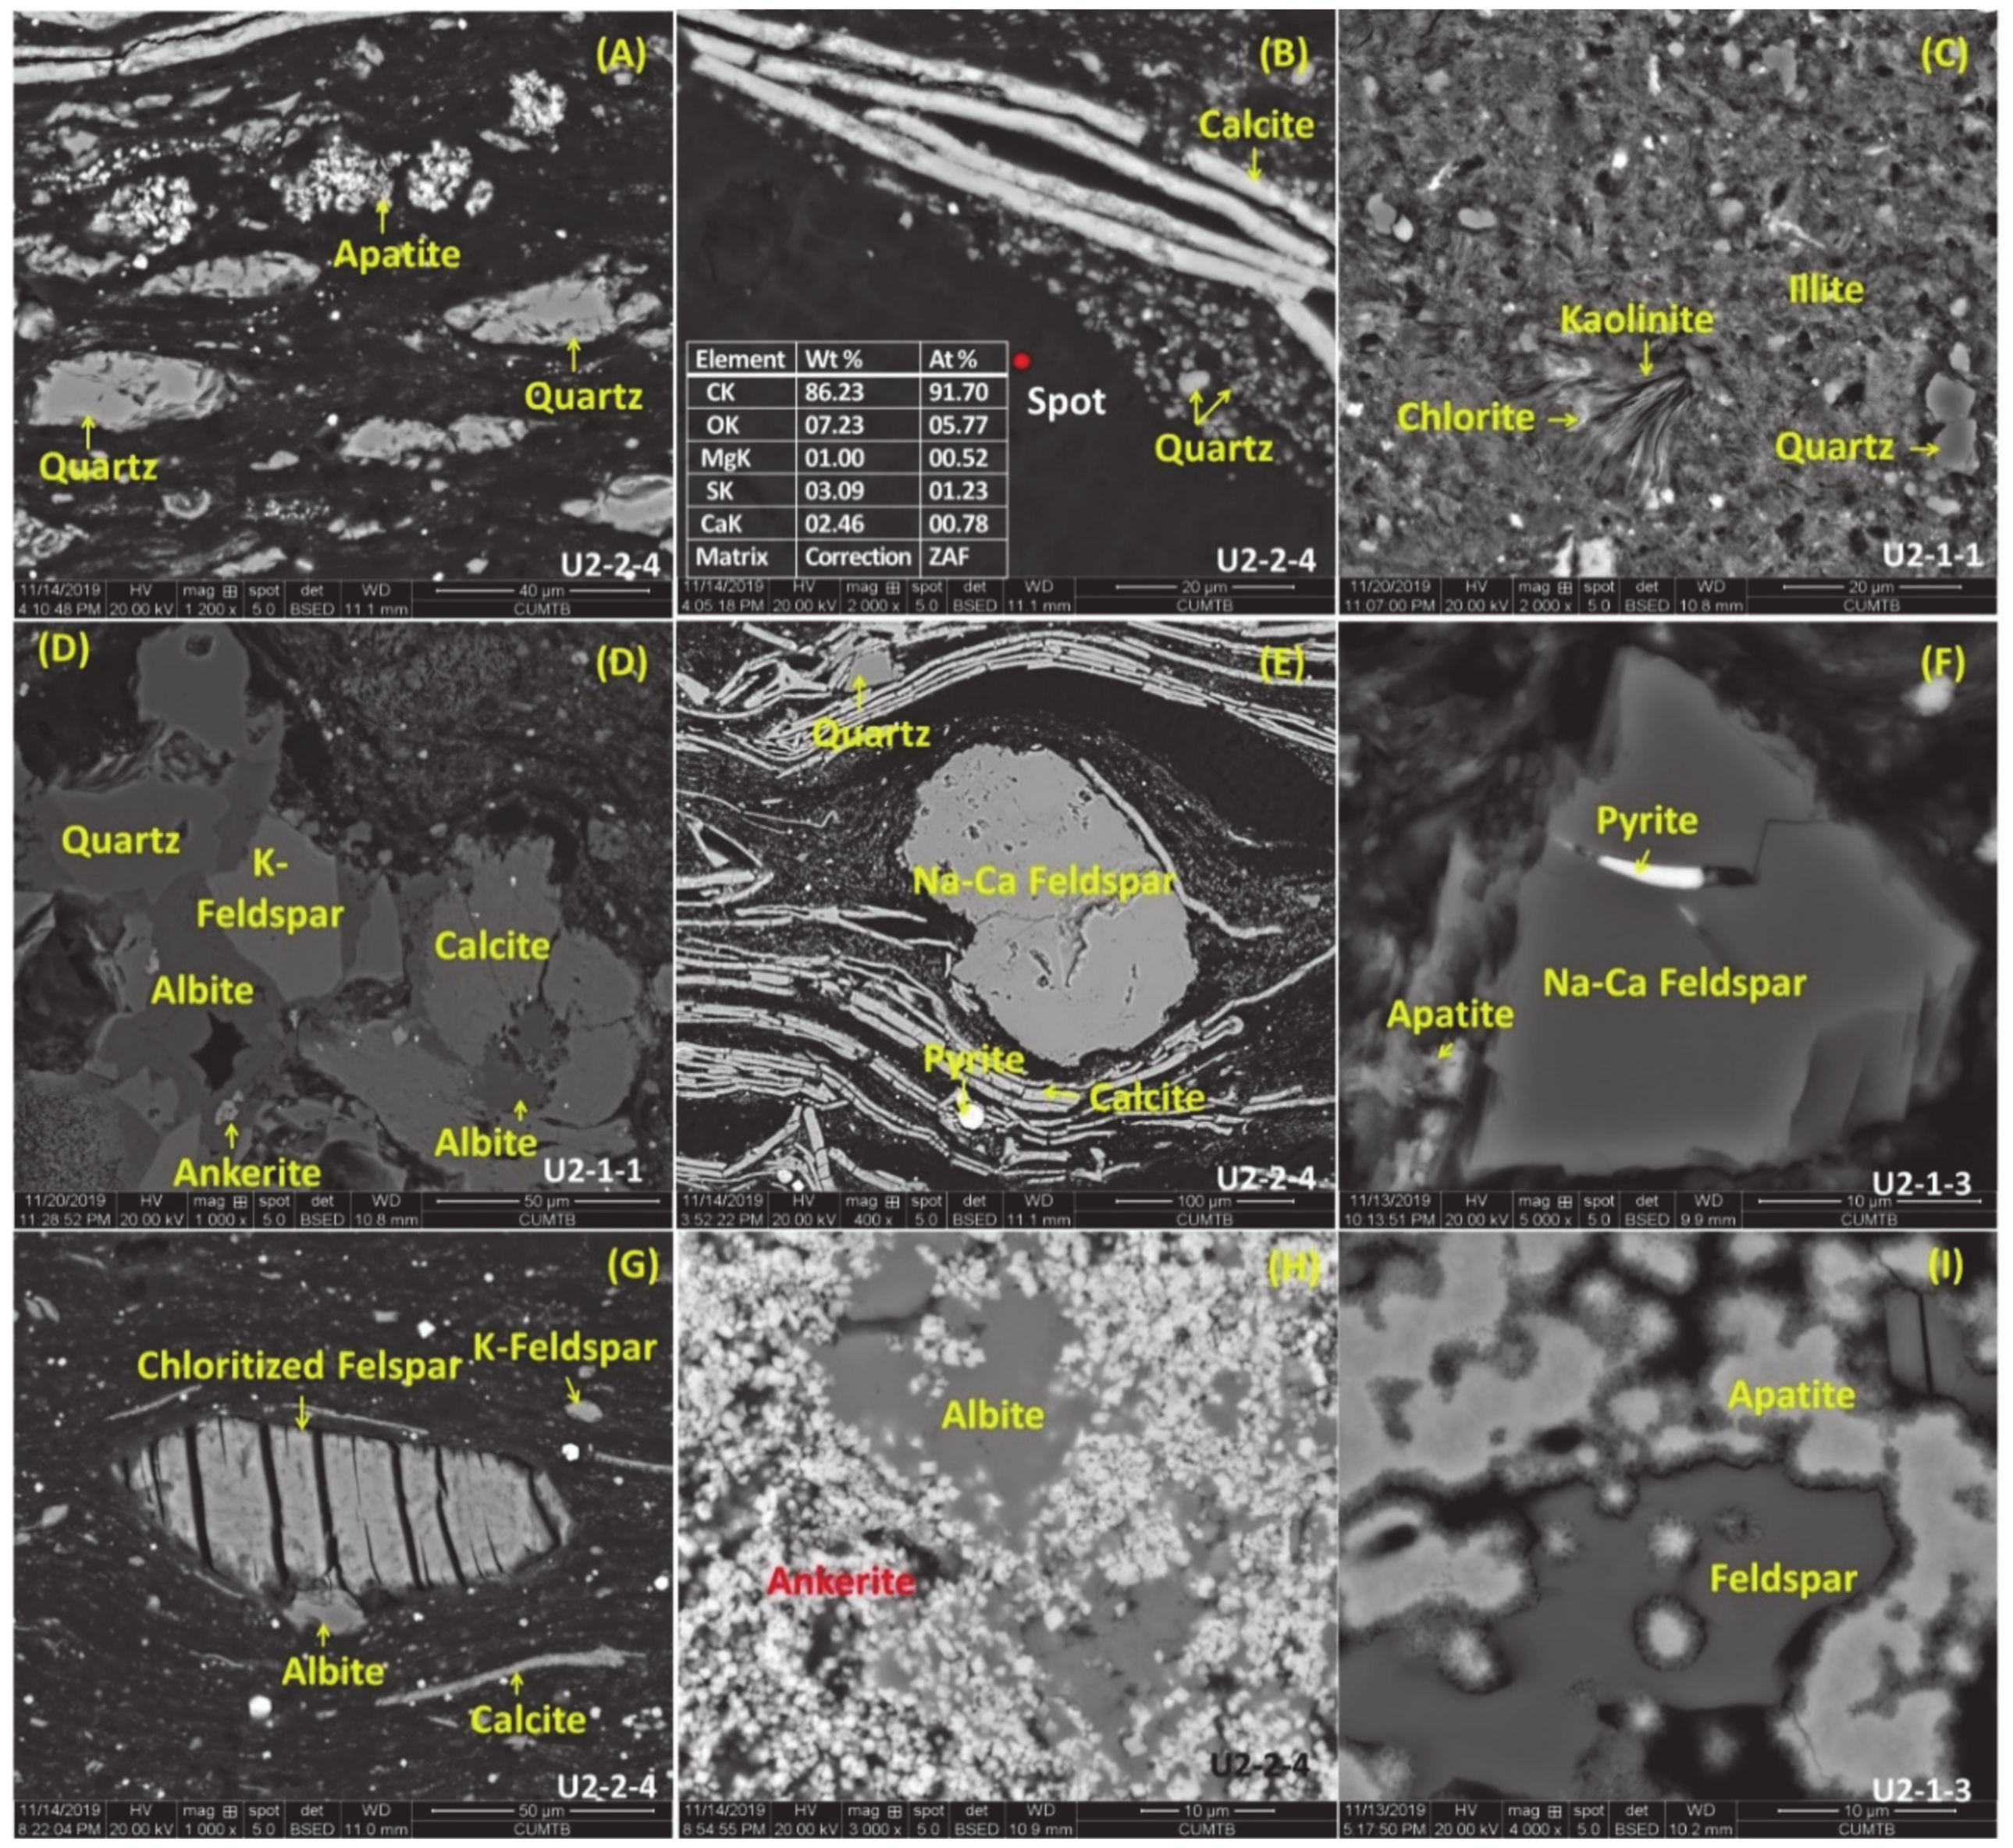
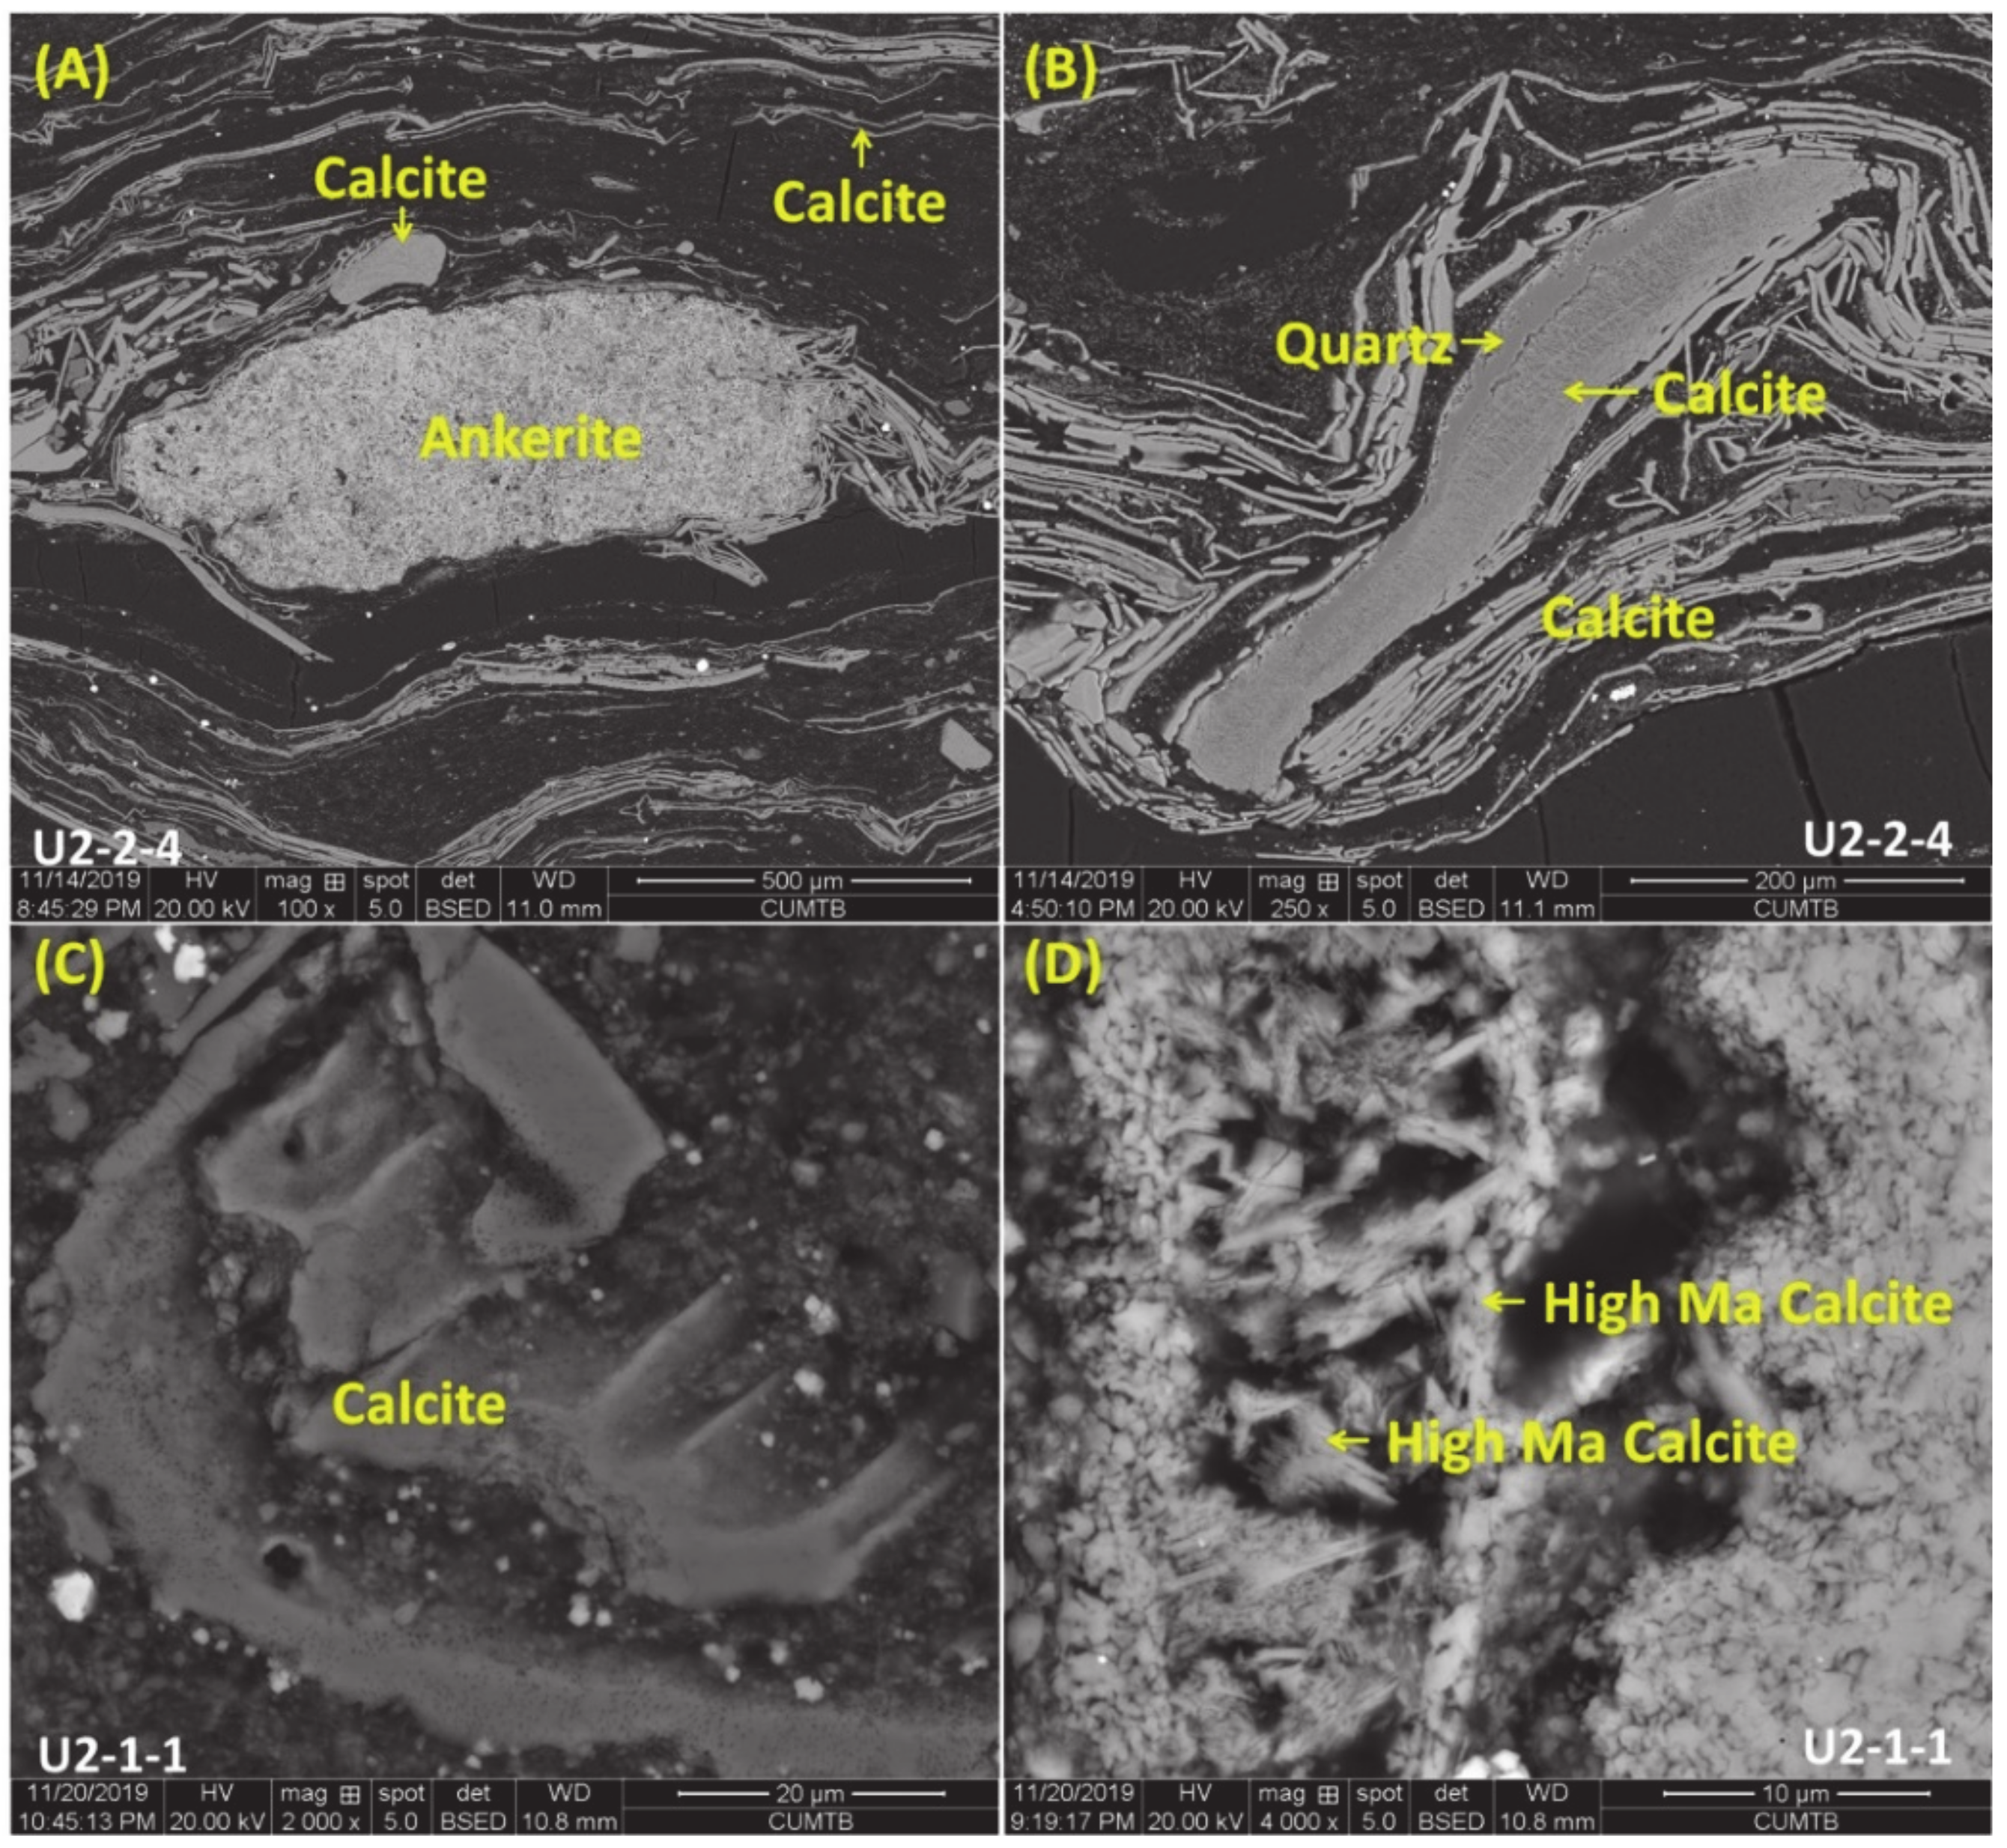
4.3. Mineralogical Composition

The mineralogical compositions identified by XRD are presented in Table 4. The minerals in coal and low-ash oil shales (ash yield <50%) are reported on low-temperature ash basis, and the roof, floor, and high ash oil shales (ash yield >50%) are on an organic-free basis.

4.3.1. Minerals in the C1 Coals

The main minerals of the C1 coals are quartz, kaolinite, mixed-layer I/S, anorthite, analcime, calcite, and bassanite. The minerals of the roof sample are mainly quartz, mixed-layer I/S, muscovite, kaolinite, albite, orthoclase, calcite, pyrite, and apatite (Table 4). In order to show more directly the distribution of the main minerals among coal, oil shales, roof, and floor, we divided the minerals into six groups: quartz, clay minerals (kaolinite, mixed-layer I/S, illite, muscovite, and chamosite), feldspar (anorthite, albite, and orthoclase), analcime, carbonate minerals (calcite, high-Mg calcite, siderite, and ankerite), and pyrite (Figure 2). Sample LJ1-3 is unique in its high content of calcite (40.7%, on a low-temperature ash basis), corresponding to the high concentration of CaO (39.36%, on ash basis). Compared with the OS2 oil shales, the C1 coals have high contents of analcime, especially LJ1-4 (46.2%, on a low-temperature ash basis). Bassanite is identified by XRD in most LTA residues of C1 coals. However, we could not detect bassanite in C1 coals under the analytical SEM, and no bassanite was identified in raw oil shale, roof, and floor samples by XRD. Moreover, we detected sulphur in organic matter using a SEM-EDS, so bassanite may represent an artifact derived from the interaction of non-mineral Ca with organic S during plasma ashing [7].
Quartz occurs as fine particles in the crack in organic matter, or as grains scattered in the organic matter (Figure 3A,B), as large discrete grains indicating terrigenous origin, as fracture fillings with calcite indicating epigenetic origin (Figure 3).
Albite occurs as a fracture filling across the coal bedding, indicating deposition from epigenetic solutions (Figure 4A,B). Albite also occurs as irregular polygons in the cement of calcite (Figure 4C). The albite particle along the bedding plane indicates the syngenetic detrital origin (Figure 4D). SEM-EDS analysis reveals that the albite of different occurrences in C1 coals does not contain detectable concentrations of potassium or calcium, indicating that it is a pure end member.
Calcite in C1 coals commonly occurs as filling cracks of organic matter, indicating an epigenetic origin (Figure 3A), fracture filling with quartz cement (Figure 3D), and cement around albite and organic matter (Figure 4C).

4.3.2. Minerals in the OS2 Oil Shales

The main minerals of OS2 oil shales are quartz, kaolinite, mixed-layer I/S, illite, anorthite, analcime, pyrite, calcite, high-Mg calcite, and siderite. Clay minerals in OS2 oil shales identified by XRD include kaolinite, mixed-layer I/S, and illite. Compared with clay minerals in C1 coals, the average concentration of illite in the OS2 oil shales is high, and that of kaolinite is low. Anorthite is the most common feldspar in OS2 oil shales like in C1 coals, and albite was also identified in U2-1-2 and U2-1-3 oil shales by XRD. The carbonate minerals in OS2 oil shales include high-Mg calcite, siderite, and ankerite identified by XRD. Pyrite is common in OS2 oil shales, but it was not detected by XRD in the C1 coals, in agreement with the relatively low sulphur content in C1 coals (Table 1).
The SEM results indicate the following features: Quartz in the OS2 oil shales from the Liangjia deposit occurs as cell filling (Figure 5A), fine grains scattered in the organic matter matrix (Figure 5B), detrital particles in illite matrix (Figure 5C), and also intergrown with albite, K-feldspar, and calcite (Figure 5D). Broom-like kaolinite in the illite matrix occurs with the edge altered to chlorite (Figure 5C). The feldspars in OS2 oil shale vary in their proportions (Figure 5E–G). Crystals of pure albite are intergrown with those of ankerite (Figure 5H). Chloritized feldspar occurs as detrital grains in the matrix of organic matter, indicating its syngenetic origin (Figure 5G). Feldspars are also intergrown with apatite (Figure 5I).
The upper part of the OS2 seam (OS2-2) has a higher content of carbonate minerals than the lower part (OS2-1), with calcite as the dominant component (Table 4). U2-2-4 has a high content of calcite (42.7%, on low-temperature ash basis), unlike the massive or fracture-filling occurrence in C1 coals, calcite mainly occurs as laminae in organic matter, with the long-axes of the laminae aligned along the bedding, indicating its syngenetic and biogenic origin, and the calcareous shells may be their potential precursors (Figure 5E, and Figure 6A,B) [7]. To a lesser extent, calcite also occurs as large grains surrounded by calcite laminae (Figure 6A,B). In some cases, calcite replaces the biological cell wall (Figure 6C). High-Mg calcite was only detected by XRD in the lower part of the OS2. High-Mg calcite was also imaged using a SEM in U2-1-1 (Figure 6D).
Pyrite mainly occurs as framboids and euhedral crystals (Figure 7A–D). Two types of framboidal pyrite were identified using a SEM: one with massive mineralisation (Figure 7A), another type consists of euhedral pyrite crystals [24,33] (Figure 7A,B). Framboidal pyrite is assumed to have two kinds of origin: biogenetic and inorganic origin. To test the different origins, experiments were performed under different conditions. Kizilstein and Minaeva performed the laboratory experiments in the presence of multiple types of bacteria [34]; Farrand performed the experiments using mineral solutions with organics, but without any bacteria [35]. The massive mineralisation having globular texture is supposed to be of bacterial origin, and the well-shaped crystals in the framboids are considered to be the crystallisation from mineralising solutions in the organic matter [33]. The bacterial pyrite framboids usually occur as aggregates of small or large globules, irregular in shape. In contrast, inorganic framboidal pyrite exhibits a relatively uniform mineralisation, and the pyrite crystals in individual framboidal bodies are usually equal in size [33]. In this study, the framboidal pyrite with massive mineralisation is supposed to be of bacterial origin (Figure 7A), and the framboids consist of euhedral pyrite crystals are likely to be of inorganic origin (Figure 7B). Euhedral pyrite crystals dispersed in the organic matrix or occur as aggregates bounded by calcite laminae (Figure 7C,D). Pyrite also occurs in dense radial forms in the organic matter matrix, and clusters of nodular pyrite (Figure 7E,F).
The modes of occurrence of pyrite in OS2 oil shales are closely related to apatite and calcite. Pyrite occurs as filling the cavities in apatite (Figure 8A) and scattered among the apatite particles (Figure 8B). Small pyrite grains dispersed over a large apatite grain, indicating that the pyrite formed later than the apatite (Figure 8C). Pyrite in the calcite matrix occurs as fine particles or thin crystals (Figure 8D).
Apatite occurs in various forms in the OS2 oil shales, including a rod-like shape (Figure 9A), the aggregations of subrounded particles (Figure 8B), lens-shaped aggregate (Figure 9B), jagged-shape bands associated with biogenetic calcite laminae along bedding planes (Figure 9C), the dense arrangement of apatite grains with anorthite inclusions (Figure 9D), and intergrown with feldspar with frost boundaries (Figure 5I). The jagged-shape apatite (Figure 9C) may represent a cell wall and biogenic origin.

5. Discussion

5.1. Provenance

Although Ti and Al, as reported, are mobile in acidic conditions [36,37,38], they are relatively immobile in supergene environments. Therefore, the Al2O3/TiO2 ratio has been effectively used as an indicator of the provenance of sedimentary rock [39], including coals [40], and oil shales [11]. Typical Al2O3/TiO2 ratios are 3–8, 8–21, and 21–70 for sedimentary rocks derived from mafic, intermediate, and felsic dominated sediment source regions, respectively [39]. The high values of Al2O3/TiO2 ratios of the C1 coals and OS2 oil shales (18.1–64.9) are indicative of a felsic to intermediate sediment source (Figure 10.). The TiO2/Zr ratio range from 28.2 to 66.5, which is in agreement with felsic to intermediate source rock [39]. In the diagram of Nb/Y versus Zr/TiO2 (Figure 11) [41], the C1 coals, OS2 oils shales and their host rocks fall into the andesite, dacite and trachyandsite categories also suggest that the source magmas had a felsic to intermediate composition.
The angular shapes of detrital quartz grains and their greatly varying sizes (Figure 3C, Figure 4D, and Figure 9A,B) indicate that they were deposited a short distance from their source. The Huangxian Basin is fault controlled, and the Mesozoic granite on the South of Huangxian Fault may be a major source provenance of the sediments (Figure 1).

5.2. Depositional Environment

The concentrations of several indicative elements and/or their ratios, such as sulphur, boron, Sr/Ba, V/Cr, V/Ni, V/(V + Ni), have been used as indicators for the depositional environments of coal [6,42] and oil shale [2,11,43].

5.2.1. Palaeosalinity

The sulphur contents in coal and oil shales have been widely used as indicators for freshwater- and seawater-influenced depositional environments [6,24,43,44,45,46,47,48,49,50]. The concentrations of total sulphur in CI coals is 0.53% to 0.59% (Table 1), indicating freshwater environments [24]. However, in the OS2 oil shales, the total sulphur varies from 0.60% to 1.44% (Table 1). These values may indicate a higher proportion of seawater in the depositional environment of the oil shales than in that of the coal. Moreover, the occurrence of pyrite as euhedral crystal and framboids (Figure 6) and the widespread occurrence of organic sulphur (Figure 5B) indicate the syngenetic origin of sulphur bearing phases and varying degrees of seawater inputs during depositions [24], although framboidal pyrite could be derived from epithermal solutions [51], but the organic sulphur is generally low [24]. The calcitic shells in oil shale (U2-2-4) probably indicate a lacustrine environment, and the shell-rich band may indicate the deepening of the water and a deeper-water faunal accumulation [7].
In summary, the calcareous shells that contribute calcite, together with the relatively higher total sulphur concentrations and higher Sr/Ba ratios of the oil shales, are interpreted as indications for a higher contribution of seawater during the deposition of the oil shales in comparison with a lesser effect associated with the deposition of the overlying coals. Therefore the transition from oil shale to coal observed in the Liangija Coal Mine indicates a marine regression.

5.2.2. Palaeoredox

The V/Ni, V/(V + Ni), and V/Cr ratios are widely used as geochemical indexes of palaeoredox in sedimentary rocks [6,52,53,54]. Vanadium and Ni occur in tetrapyrrole structures, which are highly stable under reducing conditions. Furthermore, when the organic matter is exposed to oxic conditions, the tetrapyrrole content will decrease, resulting in low contents of V and Ni [53]. Thermodynamics predict that V/Ni in bitumens and oils will increase when the depositional conditions become reducing due to the preferential removal of Ni as sulfide under anoxic conditions [52]. Galarraga et al. [55] suggested V/Ni ratios of 1.9–3 and >3, represent suboxic and anoxic conditions, respectively. Hatch and Leventhal [56] related V/(V + Ni) ratios to depositional conditions, the high V/(V + Ni) ratios (0.84–0.89) represent a strongly stratified water body and anoxic conditions, the intermediate V/(V + Ni) ratios (054–0.82) represent less strongly stratified and anoxic conditions, and the low ratios (0.46–0.60) indicate a weakly stratified and dysoxic condition. Chromium can substitute for Al in clay, and can be absorbed by clay or occur as chromite [52], and is not affected by redox condition [54]. Jones and Manning [52] suggested that V/Cr ratios of >2 indicate anoxic condition, and the lower values indicate more oxidising conditions.
In the present study, the concentrations of V, Ni and Cr show positive correlations with the ash yields (with correlation coefficients of 0.90, 0.95 and 0.95, Figure A1), indicating inorganic affinities. V, Cr, and Ni are associated with silicates, most likely the clay minerals [57]. The correlation coefficients of concentrations of V, Cr, and Ni with the concentrations of clay minerals are 0.70, 0.68, and 0.58, respectively, indicating the clay minerals may be the major hosts. Therefore, the concentrations of V, Cr, and Ni show negative correlations with the concentrations of analcime (with correlation coefficients of −0.72, −0.73, and −0.74, respectively). The analcime in this study is supposed to be of epigenetic origin (discussed in Section 5.3), and the clay minerals are supposed to be of syngenetic or diagenetic origin (Figure 5C), indicating that the hosting minerals of V, Cr, and Ni are not epigenetic. The V/Ni, V/(V + Ni), and V/Cr ratios have similar trends along C1 and OS2 section in the Liangjia Coal Mine (Figure 12), and they are in agreement with each other in interpreting the redox conditions. The coal samples have relatively higher V/Ni, V/(V + Ni), and V/Cr ratios. However, one should be cautious about concluding that the coal formed in less oxic conditions because V and Ni mainly occur in tetrapyrrole structures of organic matter, and the coal and oil shales are thought to have different source plants, leading to the different organic matter compositions. The higher V/Ni, V/(V + Ni), and V/Cr ratios in coals than in oil shales may be caused by the higher chlorophyllinite or the different palaeoredox conditions during deposition. The V/Ni, V/(V + Ni), and V/Cr ratios of the OS2 oil shales and floor samples have a rise in the U2-2-6 and 7, indicating a palaeo-redox change between the upper and lower part of OS2 seam. All the OS2 oil shales and the floor samples have V/Cr ratios of lower than 2, indicating oxic conditions. The oil shales and floor samples have V/(V + Ni) and V/Ni ratios between 0.46–0.6 and <1.9, respectively, indicating dysoxic conditions, with the exceptions of U2-2-6 and -7 which have V/(V + Ni) ratios of 0.76 and 0.71 and V/Ni ratios of 3.1 and 2.4, indicating anoxic and suboxic conditions.

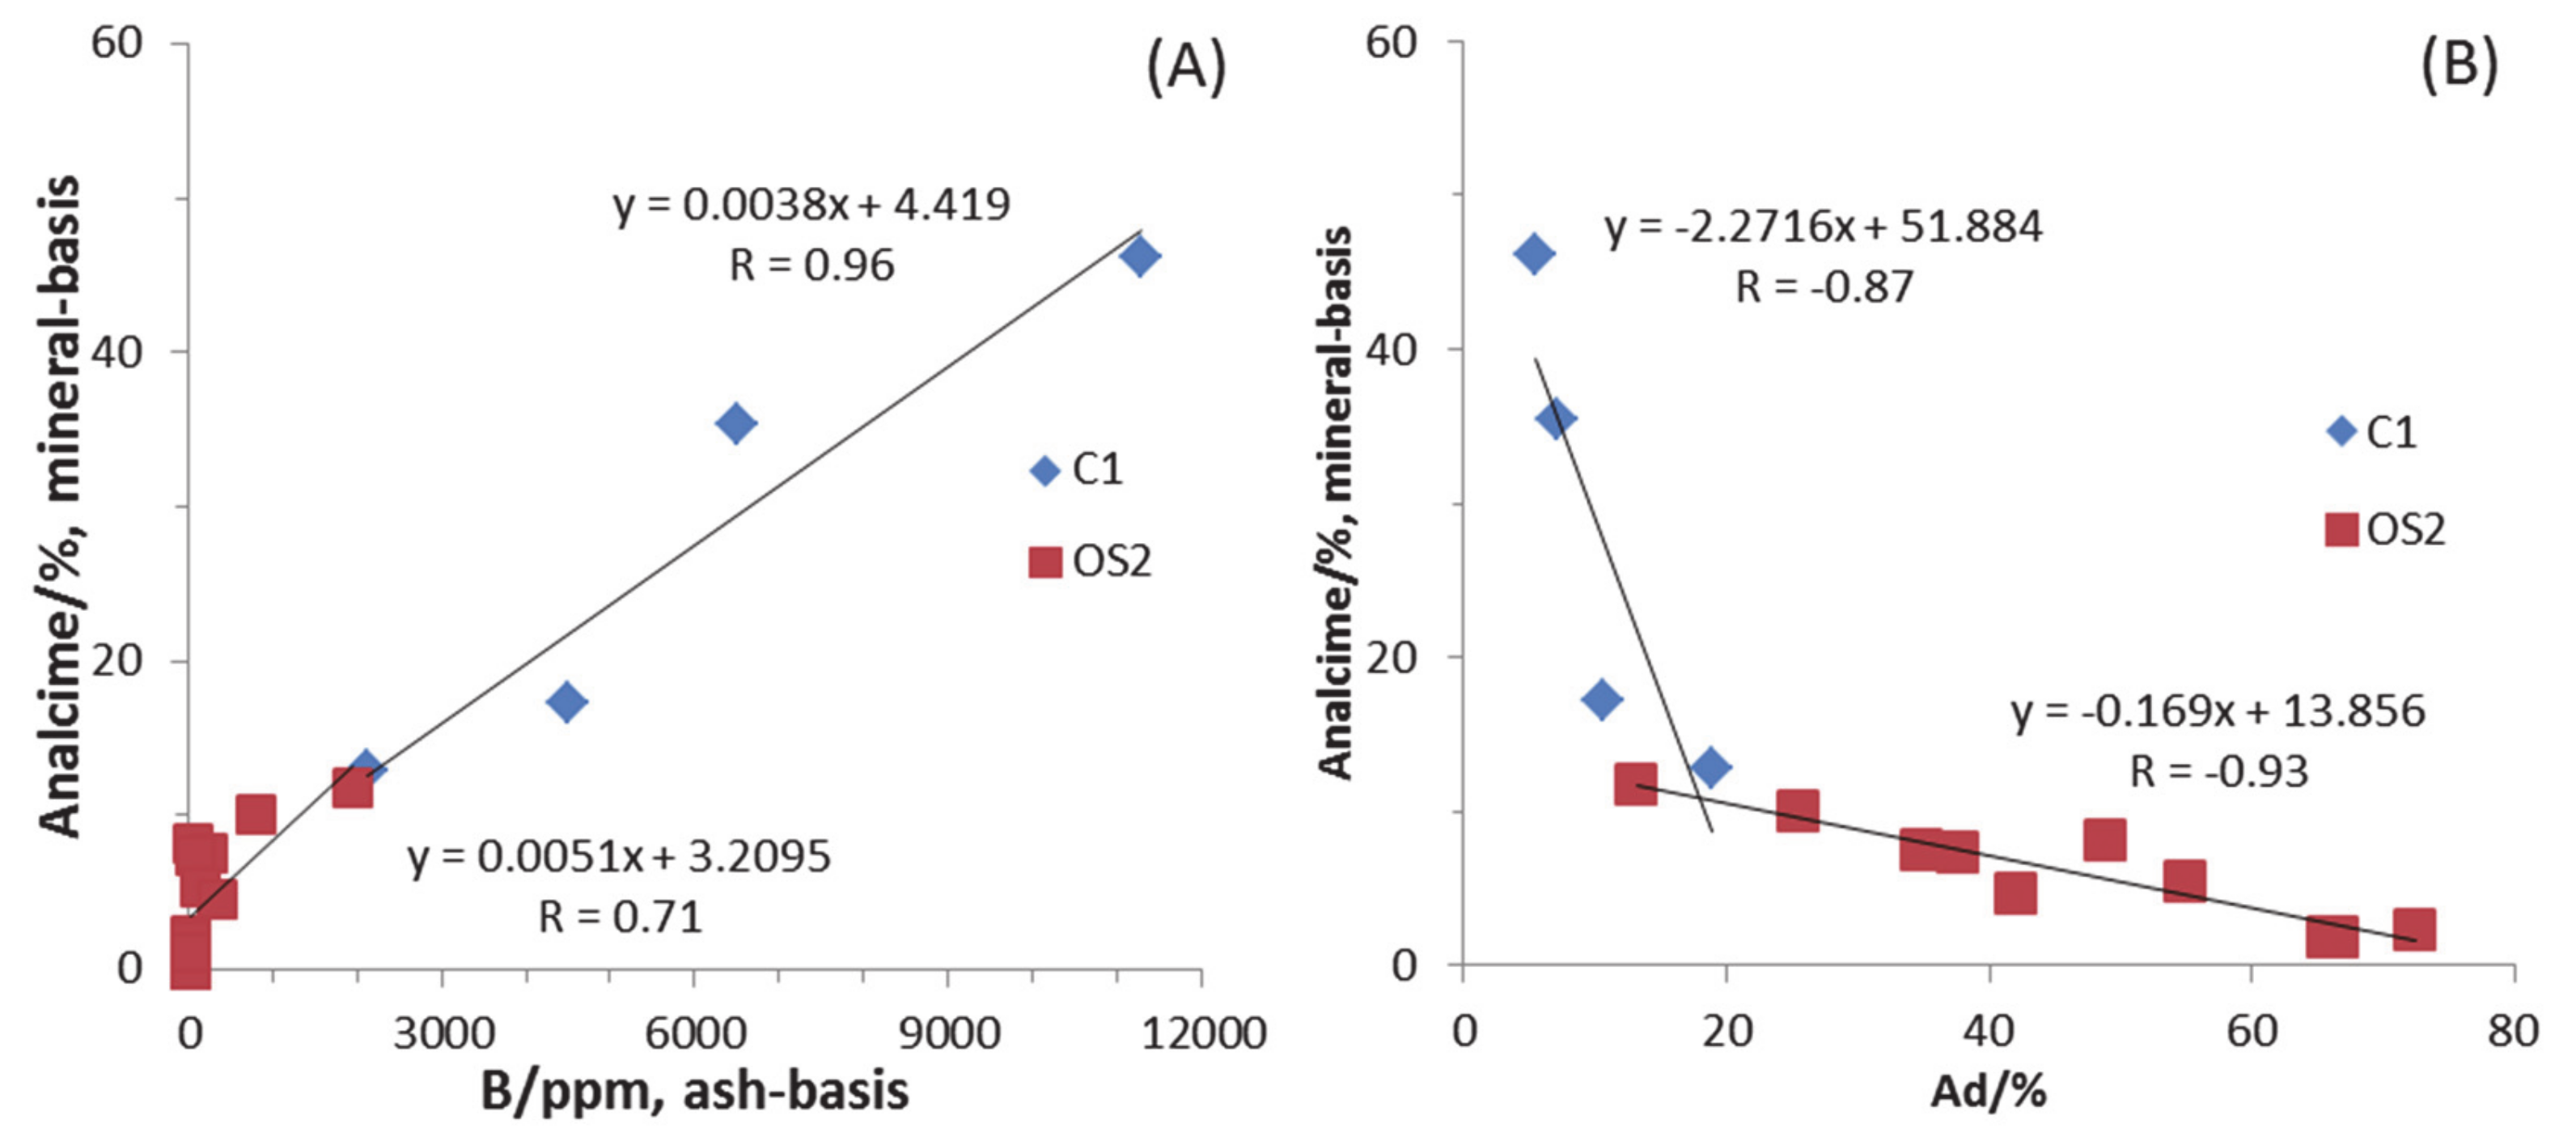
5.3. Analcime, Albite and Boron

5.3.1. Analcime and Albite

Analcime, a type of Na-rich zeolite, was detected by XRD in all C1 coals and most OS2 oil shales (Table 4, Figure 2). The contents of analcime in C1 coals range from 12.8% to 46.2% on a mineral basis. The high zeolite concentrations in coal can be related to the volcanic activity [58]. When the original volcanic glass is Na-rich, the Na-rich solution will cause alkaline activation of the aluminosilicate glass, and produce Na-rich zeolite, like analcime [58]. Volcanic glass is the primary precursor for zeolites, and zeolites can alter to feldspar when the physicochemical environment changes or time is sufficient for transformation to a stable phase [59]. Campbell and Fyfe [60] suggested the reaction analcime + quartz = albite + liquid water is in equilibrium near 190 °C or possibly at even lower temperatures. This mineral assemblage may, therefore, indicate the ambient temperature of the coal at the time of the formation of the idiomorphic albite. Effects of high temperatures were reported from Palaeogene reservoir rocks in boreholes the Bohai Bay area and were related to volcanic activity in this area [61,62].
In general, the reported occurrences of albite in coal are of detrital origin [7,63,64]. In some cases, albite is derived from epigenetic hydrothermal solutions [65,66], and some occurrences characterised by sharp edges are of pyrogenic origin [40,67]. Albite in the C1 coals mainly occurs as fracture filling (Figure 4A,B), indicating an epigenetic origin.
The occurrence of quartz (Figure 3A,B) and albite (Figure 4A), the last being of pure chemical composition in the form of large crystals filling cracks in the organic matter in coals (Figure 4A,B), raises the possibility that the fracture-filling albite is a product of alteration of analcime, the precursor was volcanic glass and formed analcime through a dissolution and precipitation process [58,59]. The transformation of analcime to albite takes place at a high temperature of around 190 °C [60]. It thus provides an indication of the thermal regime in the Huangxian Basin.

5.3.2. Analcime and Boron

The average concentration of B in the C1 coals is 504 ppm on a whole-rock basis, which is much higher than the average in world low-rank coals (56 ppm) [27]. The OS2 oil shales have an average B concentration of 86.1 ppm, which is near the average value of terrigenous and volcanic-sedimentary shales (81 ppm) [27]. Boron concentration is used as an indicator of the palaeosalinity of the depositional environment of coals or other sedimentary rocks [2,68,69,70]. Concentrations of B of <50, 50–110, and >110 ppm in coal are interpreted as indicative of freshwater, mildly brackish water, and brackish water, respectively [70]. Successful applications of this method were reported from the Hongmao and Luocheng deposits in Jiangxi Province, China [71], Datanhao deposit in Inner Mongolia, China [72], and lacustrine Big Marsh oil shale from Nova Scotia, Canada [2]. However, the use of boron concentration as a palaeosalinity indicator remains controversial [6,73] because increased B contents in coal may be the result of secondary enrichment [6], caused by hydrothermal activity [74], acid water [75,76], volcanic activity [73,77], or climatic variations [77]. Even some seawater-influenced coals have low B concentrations [78,79], and this was explained by the screening of the coal seam overlain by a clay layer, insulating peat from the seawater effects during the accumulation of the overlying limestone [78]. The concentrations of boron in the C1 coals and OS2 oil shales show positive correlations with analcime (with the correlation coefficient of 0.96 and 0.71, respectively) (Figure 13A), indicating that the increased B contents due to their secondary enrichment by epigenetic hydrothermal solutions. Furthermore, analcime shows positive correlations with ash yield, with correlation coefficient values of 0.87 and 0.93 for C1 coals and OS2 oil shales, respectively (Figure 13B). This may illustrate that epigenetic fracturing is common in the organic matter. The higher the concentration of organic matter is, the more fractures may be generated for potential analcime filling.

6. Mineralogical and Geochemical Characteristics of An Example “Marine Oil Shales” for Comparison with Those from the Huanxian Basin

The present study of oil shales from the Huagxian Basin revealed mineralogical and geochemical features indicative of a diminishing influence of sea water on the environment of deposition. It may be interesting to compare them with an example of "marine oil shale", showing clear indication of their marine origin. An example of such "oil shales" of marine origin is the Campanian–Maastrichtian (Upper Cretaceous) calcareous bituminous rocks of the Ghareb Formation, which extend over large areas around the eastern Mediterranean. Several occurrences in Israel have the following general characteristics. The dominant mineral is calcite occurring in various forms, including well-preserved planktonic foraminifera. Other minerals are scarce; low contents of clay minerals, gypsum and pyrite—around 1%. The total organic matter content is up to 19% and it shows a large compositional variation [80]. The kerogen (non extractable fraction) is characterized by H/C atomic ratios of 1.2–1.5, and S/C atomic ratios (after removal of pyrite) of 0.045–0.063 [80].
The occurrence of idiomorphic calcite crystals adjacent to gypsum which shows textures of dissolution, all within a foraminiferal chamber indicate the process of sulphate reduction and calcite precipitation [81]. This observation is supported by the presence organo-geochemical indicators for sulphate-reducing bacteria [80]. It is interesting that idiomorphic crystals of microcline of various habits, and also idiomorphic heulandite and anatase, were observed in these calcareous bituminous rocks (similar to Huangxian). Upon burial in the Dead Sea graben, these bituminous rocks produced asphalt and oil, as indicated by their high S content and biomarker compounds [82].
It might be of interest to explore whether there are organo-geochemical indicators in oil occurrences in the Huangxian basin that can be related to these oil shales.

7. Conclusions

The geochemical and mineralogical features of the C1 coals and OS2 oil shales in the Linagjia Coal Mine of the Huangxian Basin provide clear indications about their composition, their environment of deposition, and the post-depositional processes:
(1) The C1 coals from the Liangjia Coal Mine are subbituminous A coals with ultra-low to low ash yield, and low-sulphur contents.
(2) The Al2O3/TiO2 ratio and TiO2/Zr ratio suggest a felsic to intermediate sediment source, and the Mesozoic granite on the South of Huangxian Fault may be the source of the inorganic components of the Palaeogene coals and oil shales.
(3) The OS2 oil shales were influenced by seawater intrusion to the lake, which caused high values of total sulphur contents and Sr/Ba ratios, brought about the appearance of the calcareous-calcitic shells and syngenetic pyrite. However, The C1 coals were deposited in a freshwater-dominated lacustrine environment. The marine regression seems to be the factor that transformed the deposition of oil shale to coal in the Huangxian Basin.
(4) The OS2 oil shales were deposited under anoxic to suboxic conditions with a palaeo-redox change between the lower and upper parts of the OS2 section.
(5) The high boron contents in C1 coals (average, 504 ppm) are related to the high content of analcime (with a correlation coefficient of 0.96), and they have an epigenetic origin.
(6) The albite in the form of large crystals filling cracks in the organic matter of coal and their pure chemical composition raises the possibility that the albite was produced by the reaction of analcime and quartz. This reaction takes place at over 190 °C and thus provides an indication of the effects of hydrothermal fluids on the Palaeogene coal beds investigated.

Author Contributions

Conceptualization, X.Z. and Z.H.; methodology, X.Z.; resources, Z.H.; writing—original draft preparation, X.Z. and B.S. All authors have read and agreed to the published version of the manuscript.

Funding

This research was funded by the National Natural Science Foundation of China (No. 41902166) and the Open Fund of State Key Laboratory of Coal Resources and Safe Mining (No. SKLCRSM19KFA15).

Acknowledgments

The authors are grateful to the four anonymous reviewers and the collection editors (Shifeng Dai and David French) for their valuable suggestions and comments.

Conflicts of Interest

The authors declare no conflict of interest.

Appendix A

Figure A1. Relations between Sc, V, Cr, Co, Ni, Cu, Zn, Rb, Cd, Sn, Cs, La, Y, Lu and B with ash yields in the coal and oil shale samples of the Liangjia Coal Mine, Huangxian Basin.
Minerals 10 00496 g0a1

References

  1. Yen, T.F.; Chilingarian, G.V. Oil Shale; Elsevier Scientific Publishing Company: New York, NY, USA, 1976; ISBN 044-441-408-8. [Google Scholar]
  2. Goodarzi, F. Comparison of the geochemistry of lacustrine oil shales of Mississippian age from Nova Scotia and New Brunswick, Canada. Int. J. Coal Geol. 2020, 220, 103398. [Google Scholar] [CrossRef]
  3. Cook, A.C.; Sherwood, N.R. Classification of oil shales, coals and other organic-rich rocks. Org. Geochem. 1991, 17, 211–222. [Google Scholar] [CrossRef]
  4. International Committee for Coal Petrology (ICCP). The new vitrinite classification (ICCP system 1994). Fuel 1998, 77, 349–358. [Google Scholar] [CrossRef]
  5. Hutton, A.C. Petrographic classification of oil shales. Int. J. Coal Geol. 1987, 8, 203–231. [Google Scholar] [CrossRef]
  6. Dai, S.; Bechtel, A.; Eble, C.F.; Flores, R.M.; French, D.; Graham, I.T.; Hood, M.M.; Hower, J.C.; Korasidish, V.A.; Moore, T.A.; et al. Recognition of peat depositional environments in coal: A review. Int. J. Coal Geol. 2020, 219, 103383. [Google Scholar] [CrossRef]
  7. Ward, C.R. Analysis and significance of mineral matter in coal seams. Int. J. Coal Geol. 2002, 50, 135–168. [Google Scholar] [CrossRef]
  8. Finkelman, R.B.; Dai, S.; French, D. The importance of minerals in coal as the hosts of chemical elements: A review. Int. J. Coal Geol. 2019, 212, 103251. [Google Scholar] [CrossRef]
  9. Dai, S.; Finkelman, R.B. Coal as a promising source of critical elements: Progress and future prospects. Int. J. Coal Geol. 2018, 186, 155–164. [Google Scholar] [CrossRef]
  10. McLennan, S.M.; Hemming, S.; McDaniel, D.K.; Hanson, G.N.; Johnsson, M.J.; Basu, A. Geochemical approaches to sedimentation, provenance, and tectonics. Processes Controlling the Composition of Clastic Sediments. Spec. Papers-Geol. Soc. Am. 1993, 284, 21–40. [Google Scholar]
  11. Tao, S.; Xu, Y.; Tang, D.; Xu, H.; Li, S.; Chen, S.; Liu, W.; Cui, Y.; Gou, M. Geochemistry of the Shitoumei oil shale in the Santanghu Basin, Northwest China: Implications for paleoclimate conditions, weathering, provenance and tectonic setting. Int. J. Coal Geol. 2017, 184, 42–56. [Google Scholar] [CrossRef]
  12. Xu, S.; Dong, Q.; Yan, L.; Yu, W.; Du, J.; Hou, G. The Characteristics and the Formation Mechanism of the Oil Shale in Huangxian Faulted Basin, Shandong Province. J. Jilin Univ. (Earth Sci. Ed.) 2006, 36, 954–958. (In Chinese) [Google Scholar]
  13. Lv, D.; Wang, D.; Li, Z.; Liu, H.; Li, Y. Depositional environment, sequence stratigraphy and sedimentary mineralization mechanism in the coal bed- and oil shale-bearing succession: A case from the Paleogene Huangxian Basin of China. J. Pet. Sci. Eng. 2017, 148, 32–51. [Google Scholar] [CrossRef]
  14. Sun, Y.-Z.; Wang, B.-S.; Lin, M.-Y. Maceral and geochemical characteristics of coal seam 1 and oil shale 1 in fault-controlled Huangxian Basin, China. Org. Geochem. 1998, 29, 583–591. [Google Scholar] [CrossRef]
  15. Lv, D.; Li, Z.; Wang, D.; Li, Y.; Liu, H.; Liu, Y.; Wang, P. Sedimentary Model of Coal and Shale in the Paleogene Lijiaya Formation of the Huangxian Basin: Insight from Petrological and Geochemical Characteristics of Coal and Shale. Energy Fuels 2019, 33, 10442–10456. [Google Scholar] [CrossRef]
  16. Cai, J.; Wang, B.; Gong, J. Tectonic characteristics of the Huangxian Basin. Coal Geol. Explor. 1982, 2, 21–25. (In Chinese) [Google Scholar]
  17. Li, X.-H.; Fan, H.-R.; Zhang, Y.-W.; Hu, F.-F.; Yang, K.-F.; Liu, X.; Cai, Y.-C.; Zhao, K.-D. Rapid exhumation of the northern Jiaobei Terrane, North China Craton in the Early Cretaceous: Insights from Al-in-hornblende barometry and U-Pb geochronology. J. Asian Earth Sci. 2018, 160, 365–379. [Google Scholar] [CrossRef]
  18. Chen, H.; Sun, S. Lithofacies and depositional environments of the Tertiary coal-bearing series in Huangxian Basin, Shandong Province. Acta Petrol. Sin. 1988, 2, 50–58. (In Chinese) [Google Scholar]
  19. State Administration for Market Regulation of China, Standardization Administration of China. Chinese National Standard GB/T212-2008, Proximate Analysis of Coal; Standand Press of China: Beijing, China, 2008. (In Chinese) [Google Scholar]
  20. Dai, S.; Wang, X.; Zhou, Y.; Hower, J.C.; Li, D.; Chen, W.; Zhu, X.; Zou, J. Chemical and mineralogical compositions of silicic, mafic, and alkali tonsteins in the late Permian coals from the Songzao Coalfield, Chongqing, Southwest China. Chem. Geol. 2011, 282, 29–44. [Google Scholar] [CrossRef]
  21. Dai, S.; Song, W.; Zhao, L.; Li, X.; Hower, J.C.; Ward, C.R.; Wang, P.; Li, T.; Zheng, X.; Seredin, V.V.; et al. Determination of Boron in Coal Using Closed-Vessel Microwave Digestion and Inductively Coupled Plasma Mass Spectrometry (ICP-MS). Energy Fuels 2014, 28, 4517–4522. [Google Scholar] [CrossRef]
  22. Taylor, J.C. Computer programs for standardless quantitative analysis of minerals using the full powder diffraction profile. Powder Diffr. 1991, 6, 2–9. [Google Scholar] [CrossRef] [Green Version]
  23. State Administration for Market Regulation of China, Standardization Administration of China. Chinese Standard Method GB/T 15224.1-2018. Classification for Quality of Coal-Part 1: Ash; Standand Press of China: Beijing, China, 2018. (In Chinese) [Google Scholar]
  24. Chou, C.-L. Sulfur in coals: A review of geochemistry and origins. Int. J. Coal Geol. 2012, 100, 1–13. [Google Scholar] [CrossRef]
  25. American Society for Testing and Materials (ASTM). ASTM Standard D388-18. Standard Classification of Coals by Rank; ASTM International: West Conshohocken, PA, USA, 2018. [Google Scholar]
  26. Dai, S.; Ren, D.; Chou, C.-L.; Finkelman, R.B.; Seredin, V.V.; Zhou, Y. Geochemistry of trace elements in Chinese coals: A review of abundances, genetic types, impacts on human health, and industrial utilization. Int. J. Coal Geol. 2012, 94, 3–21. [Google Scholar] [CrossRef]
  27. Ketris, M.P.; Yudovich, Y.E. Estimations of Clarkes for Carbonaceous biolithes: World averages for trace element contents in black shales and coals. Int. J. Coal Geol. 2009, 78, 135–148. [Google Scholar] [CrossRef]
  28. Dai, S.; Wang, P.; Ward, C.R.; Tang, Y.; Song, X.; Jiang, J.; Hower, J.C.; Li, T.; Seredin, V.V.; Wagner, N.J.; et al. Elemental and mineralogical anomalies in the coal-hosted Ge ore deposit of Lincang, Yunnan, southwestern China: Key role of N2–CO2-mixed hydrothermal solutions. Int. J. Coal Geol. 2015, 152, 19–46. [Google Scholar] [CrossRef]
  29. Dai, S.; Hower, J.C.; Finkelman, R.B.; Graham, I.T.; French, D.; Ward, C.R.; Eskenazy, G.; Wei, Q.; Zhao, L. Organic associations of non-mineral elements in coal: A review. Int. J. Coal Geol. 2020, 218, 103347. [Google Scholar] [CrossRef]
  30. Taylor, S.R.; McLennan, S.M. The Continental Crust: Its Composition and Evolution; Blackwell: Oxford, UK, 1985; p. 312. Available online: https://www.osti.gov/biblio/6582885 (accessed on 29 May 2020).
  31. Dai, S.; Graham, I.T.; Ward, C.R. A review of anomalous rare earth elements and yttrium in coal. Int. J. Coal Geol. 2016, 159, 82–95. [Google Scholar] [CrossRef]
  32. Yan, X.; Dai, S.; Graham, I.T.; He, X.; Shan, K.; Liu, X. Determination of Eu concentrations in coal, fly ash and sedimentary rocks using a cation exchange resin and inductively coupled plasma mass spectrometry (ICP-MS). Int. J. Coal Geol. 2018, 191, 152–156. [Google Scholar] [CrossRef]
  33. Kortenski, J.; Kostova, I. Occurrence and morphology of pyrite in Bulgarian coals. Int. J. Coal Geol. 1996, 29, 273–290. [Google Scholar] [CrossRef]
  34. Kizilstem, L.Y.; Minaeva, L.C. Proiskhozhdenije framboidalnikh form pyrita. Dokl. Acad. Nauk SSSR 1972, 206, 1187–1189. [Google Scholar]
  35. Farrand, M. Framboidal sulphides precipitated synthetically. Miner. Depos. 1970, 5, 237–247. [Google Scholar] [CrossRef]
  36. Ward, C.R. Analysis, origin and significance of mineral matter in coal: An updated review. Int. J. Coal Geol. 2016, 165, 1–27. [Google Scholar] [CrossRef]
  37. Dai, S.; Li, T.; Jiang, Y.; Ward, C.R.; Hower, J.C.; Sun, J.; Liu, J.; Song, H.; Wei, J.; Li, Q.; et al. Mineralogical and geochemical compositions of the Pennsylvanian coal in the Hailiushu mine, Daqingshan Coalfield, Inner Mongolia, China: Implications of sediment-source region and acid hydrothermal solutions. Int. J. Coal Geol. 2015, 137, 92–110. [Google Scholar] [CrossRef]
  38. Dai, S.; Hower, J.C.; Ward, C.R.; Guo, W.; Song, H.; O’Keefe, J.M.K.; Xie, P.; Hood, M.M.; Yan, X. Elements and phosphorus minerals in the middle Jurassic inertinite-rich coals of the Muli Coalfield on the Tibetan Plateau. Int. J. Coal Geol. 2015, 144, 23–47. [Google Scholar] [CrossRef]
  39. Hayashi, K.-I.; Fujisawa, H.; Holland, H.D.; Ohmoto, H. Geochemistry of ∼1.9 Ga sedimentary rocks from northeastern Labrador, Canada. Geochim. Cosmochim. Acta 1997, 61, 4115–4137. [Google Scholar] [CrossRef]
  40. Zheng, X.; Wang, Z.; Wang, L.; Xu, Y.; Liu, J. Mineralogical and Geochemical Compositions of the Lopingian Coals and Carbonaceous Rocks in the Shugentian Coalfield, Yunnan, China: With Emphasis on Fe-Bearing Minerals in a Continental-Marine Transitional Environment. Minerals 2017, 7, 170. [Google Scholar] [CrossRef] [Green Version]
  41. Winchester, J.A.; Floyd, P.A. Geochemical discrimination of different magma series and their differentiation products using immobile elements. Chem. Geol. 1977, 20, 325–343. [Google Scholar] [CrossRef] [Green Version]
  42. Spiro, B.F.; Liu, J.; Dai, S.; Zeng, R.; Large, D.; French, D. Marine derived 87Sr/86Sr in coal, a new key to geochronology and palaeoenvironment: Elucidation of the India-Eurasia and China-Indochina collisions in Yunnan, China. Int. J. Coal Geol. 2019, 215, 103304. [Google Scholar] [CrossRef]
  43. Makeen, Y.M.; Abdullah, W.H.; Ayinla, H.A.; Shan, X.; Liang, Y.; Su, S.; Noor, N.M.; Hasnan, H.K.; Asiwaju, L. Organic geochemical characteristics and depositional setting of Paleogene oil shale, mudstone and sandstone from onshore Penyu Basin, Chenor, Pahang, Malaysia. Int. J. Coal Geol. 2019, 207, 52–72. [Google Scholar] [CrossRef]
  44. Dinur, D.; Spiro, B.; Aizenshtat, Z. The distribution and isotopic composition of sulfur in organic-rich sedimentary rocks. Chem. Geol. 1980, 31, 37–51. [Google Scholar] [CrossRef]
  45. Dai, S.; Hou, X.; Ren, D.; Tang, Y. Surface analysis of pyrite in the No. 9 coal seam, Wuda Coalfield, Inner Mongolia, China, using high-resolution time-of-flight secondary ion mass-spectrometry. Int. J. Coal Geol. 2003, 55, 139–150. [Google Scholar] [CrossRef]
  46. Chou, C.-L. Geologic factors affecting the abundance, distribution, and speciation of sulfur in coals. In Geology of Fossil Fuels, Proceedings of the 30th International Geological Congress: Part B; Yang, Q., Ed.; VSP: Utrecht, The Netherlands, 1997; Volume 18, pp. 47–57. ISBN 906764238X. [Google Scholar]
  47. Medunic’, G.; Radenovic’, A.; Bajramovic’, M.; Švec, M.; Tomac, M. Once grand, now forgotten: What do we know about the superhigh-organic-sulphur Raša coal? Rud.-Geološko-Naft. Zb. 2016, 31, 27–45. [Google Scholar] [CrossRef] [Green Version]
  48. Gayer, R.A.; Rose, M.; Dehmer, J.; Shao, L. Impact of sulphur and trace element geochemistry on the utilization of a marine-influenced coal—Case study from the South Wales Variscan foreland basin. Int. J. Coal Geol. 1999, 40, 151–174. [Google Scholar] [CrossRef]
  49. Spears, D.A. The geochemistry and mineralogy of high-S coals, with examples mainly from the East Pennines Coalfield in Yorkshire and Nottinghamshire, UK: An overview. Proc. Yorks. Geol. Soc. 2015, 60, 204–226. [Google Scholar] [CrossRef]
  50. Turner, B.R.; Richardson, D. Geological controls on the sulphur content of coal seams in the Northumberland Coalfield, Northeast England. Int. J. Coal Geol. 2004, 60, 169–196. [Google Scholar] [CrossRef]
  51. Dai, S.; Yang, J.; Ward, C.R.; Hower, J.C.; Liu, H.; Garrison, T.M.; French, D.; O’Keefe, J.M.K. Geochemical and mineralogical evidence for a coal-hosted uranium deposit in the Yili Basin, Xinjiang, northwestern China. Ore Geol. Rev. 2015, 70, 1–30. [Google Scholar] [CrossRef]
  52. Jones, B.; Manning, D.A.C. Comparison of geochemical indices used for the interpretation of palaeoredox conditions in ancient mudstones. Chem. Geol. 1994, 111, 111–129. [Google Scholar] [CrossRef]
  53. Lewan, M.D. Factors controlling the proportionality of vanadium to nickel in crude oils. Geochim. Cosmochim. Acta 1984, 48, 2231–2238. [Google Scholar] [CrossRef]
  54. Rimmer, S.M. Geochemical paleoredox indicators in Devonian–Mississippian black shales, Central Appalachian Basin (USA). Chem. Geol. 2004, 206, 373–391. [Google Scholar] [CrossRef]
  55. Galarraga, F.; Reategui, K.; Martïnez, A.; Martínez, M.; Llamas, J.F.; Márquez, G. V/Ni ratio as a parameter in palaeoenvironmental characterisation of nonmature medium-crude oils from several Latin American basins. J. Pet. Sci. Eng. 2008, 61, 9–14. [Google Scholar] [CrossRef]
  56. Hatch, J.R.; Leventhal, J.S. Relationship between inferred redox potential of the depositional environment and geochemistry of the Upper Pennsylvanian (Missourian) Stark Shale Member of the Dennis Limestone, Wabaunsee County, Kansas, USA. Chem. Geol. 1992, 99, 65–82. [Google Scholar] [CrossRef]
  57. Finkelman, R.B.; Palmer, C.A.; Wang, P. Quantification of the modes of occurrence of 42 elements in coal. Int. J. Coal Geol. 2018, 185, 138–160. [Google Scholar] [CrossRef]
  58. Querol, X.; Whateley, M.K.G.; Fernández-Turiel, J.L.; Tuncali, E. Geological controls on the mineralogy and geochemistry of the Beypazari lignite, central Anatolia, Turkey. Int. J. Coal Geol. 1997, 33, 255–271. [Google Scholar] [CrossRef]
  59. Hay, R.L.; Sheppard, R.A. Occurrence of zeolites in sedimentary rocks: An overview. Rev. Mineral. Geochem. 2001, 45, 217–234. [Google Scholar] [CrossRef]
  60. Campbell, A.S.; Fyfe, W.S. Analcime-albite equilibria. Am. J. Sci. 1965, 263, 807–816. [Google Scholar] [CrossRef]
  61. Qiu, N.; Zuo, Y.; Zhou, X.; Li, C. Geothermal regime of the Bohai offshore area, Bohai Bay Basin, North China. Energy Explor. Exploit. 2010, 28, 327–350. [Google Scholar] [CrossRef] [Green Version]
  62. Sun, Z.; Zhu, H.; Xu, C.; Yang, X.; Du, X.; Wang, Q.; Qiao, J. Pore fluid evolution influenced by volcanic activities and related diagenetic processes in a rift basin: Evidence from the Paleogene medium-deep reservoirs of Huanghekou Sag, Bohai Bay Basin, China. Geofluids 2017, 2017, 1–16. [Google Scholar] [CrossRef]
  63. Ruppert, L.F.; Stanton, R.W.; Cecil, C.B.; Eble, C.F.; Dulong, F.T. Effects of detrital influx in the Pennsylvanian Upper Freeport peat swamp. Int. J. Coal Geol. 1991, 17, 95–116. [Google Scholar] [CrossRef]
  64. Moore, F.; Esmaeili, A. Mineralogy and geochemistry of the coals from the Karmozd and Kiasar coal mines, Mazandaran province, Iran. Int. J. Coal Geol. 2012, 96, 9–21. [Google Scholar] [CrossRef]
  65. Dai, S.; Ren, D.; Zhou, Y.; Chou, C.-L.; Wang, X.; Zhao, L.; Zhu, X. Mineralogy and geochemistry of a superhigh-organic-sulfur coal, Yanshan Coalfield, Yunnan, China: Evidence for a volcanic ash component and influence by submarine exhalation. Chem. Geol. 2008, 255, 182–194. [Google Scholar] [CrossRef]
  66. Zhao, L.; Ward, C.R.; French, D.; Graham, I.T. Mineralogy of the volcanic-influenced Great Northern coal seam in the Sydney Basin, Australia. Int. J. Coal Geol. 2012, 94, 94–110. [Google Scholar] [CrossRef]
  67. Dai, S.; Luo, Y.; Seredin, V.V.; Ward, C.R.; Hower, J.C.; Zhao, L.; Liu, S.; Zhao, C.; Tian, H.; Zou, J. Revisiting the late Permian coal from the Huayingshan, Sichuan, southwestern China: Enrichment and occurrence modes of minerals and trace elements. Int. J. Coal Geol. 2014, 122, 110–128. [Google Scholar] [CrossRef]
  68. Dai, S.; Seredin, V.V.; Ward, C.R.; Hower, J.C.; Xing, Y.; Zhang, W.; Song, W.; Wang, P. Enrichment of U–Se–Mo–Re–V in coals preserved within marine carbonate successions: Geochemical and mineralogical data from the Late Permian Guiding Coalfield, Guizhou, China. Miner. Depos. 2014, 50, 159–186. [Google Scholar] [CrossRef]
  69. Bohor, B.F.; Gluskoter, H.J. Boron in illite as an indicator of paleosalinity of Illinois coals. J. Sediment. Res. 1973, 43, 945–956. [Google Scholar] [CrossRef]
  70. Goodarzi, F.; Swaine, D.J. The influence of geological factors on the concentration of boron in Australian and Canadian coals. Chem. Geol. 1994, 118, 301–318. [Google Scholar] [CrossRef]
  71. Dai, S.; Ji, D.; Ward, C.R.; French, D.; Hower, J.C.; Yan, X.; Wei, Q. Mississippian anthracites in Guangxi Pprovince, southern China: Petrological, mineralogical, and rare earth element evidence for high-temperature solutions. Int. J. Coal Geol. 2018, 197, 84–114. [Google Scholar] [CrossRef]
  72. Zhao, L.; Dai, S.; Nechaev, V.P.; Nechaeva, E.V.; Graham, I.T.; French, D.; Sun, J. Enrichment of critical elements (Nb-Ta-Zr-Hf-REE) within coal and host rocks from the Datanhao mine, Daqingshan Coalfield, northern China. Ore Geol. Rev. 2019, 111, 102951. [Google Scholar] [CrossRef]
  73. Eskenazy, G.; Delibaltova, D.; Mincheva, E. Geochemistry of boron in Bulgarian coals. Int. J. Coal Geol. 1994, 25, 93–110. [Google Scholar] [CrossRef]
  74. Lyons, P.C.; Palmer, C.A.; Bostick, N.H.; Fletcher, J.D.; Dulong, F.T.; Brown, F.W.; Brown, Z.A.; Krasnow, M.R.; Romankiw, L.A. Chemistry and origin of minor and trace elements in vitrinite concentrates from a rank series from the eastern United States, England, and Australia. Int. J. Coal Geol. 1989, 13, 481–527. [Google Scholar] [CrossRef]
  75. Guo, W.; Dai, S.; Nechaev, V.P.; Nechaeva, E.V.; Wei, G.; Finkelman, R.B.; Spiro, B.F. Geochemistry of Palaeogene coals from the Fuqiang Mine, Hunchun Coalfield, northeastern China: Composition, provenance, and relation to the adjacent polymetallic deposits. J. Geochem. Explor. 2019, 196, 192–207. [Google Scholar] [CrossRef]
  76. Dai, S.; Liu, J.; Ward, C.R.; Hower, J.C.; Xie, P.; Jiang, Y.; Madison, M.H.; Jennifer, M.K.O.; Song, H. Petrological, geochemical, and mineralogical compositions of the low-Ge coals from the Shengli Coalfield, China: A comparative study with Ge-rich coals and a formation model for coal-hosted Ge ore deposit. Ore Geol. Rev. 2015, 71, 318–349. [Google Scholar] [CrossRef]
  77. Bouska, V.; Pesek, J. Boron in the aleuropelites of the Bohemian Massif. In Proceedings of the European Clays groups Meeting. 5, Prague, Czech Republic, 31 August 1983; pp. 147–155. [Google Scholar]
  78. Dai, S.; Zhang, W.; Ward, C.R.; Seredin, V.V.; Hower, J.C.; Li, X.; Song, W.; Wang, X.; Kang, H.; Zheng, L.; et al. Mineralogical and geochemical anomalies of Late Permian coals from the Fusui Coalfield, Guangxi Province, southern China: Influences of terrigenous materials and hydrothermal fluids. Int. J. Coal Geol. 2013, 105, 60–84. [Google Scholar] [CrossRef]
  79. Dai, S.; Zhang, W.; Seredin, V.V.; Ward, C.R.; Hower, J.C.; Song, W.; Wang, X.; Li, X.; Zhao, L.; Kang, H.; et al. Factors controlling geochemical and mineralogical compositions of coals preserved within marine carbonate successions: A case study from the Heshan Coalfield, southern China. Int. J. Coal Geol. 2013, 109, 77–100. [Google Scholar] [CrossRef]
  80. Spiro, B.; Dinur, D.; Aizenshtat, Z. Evaluation of source, environments of deposition and diagenesis of some israeli “oil shales”—N-alkanes, fatty acids, tetrapyrroles and kerogen. Chem. Geol. 1983, 39, 189–214. [Google Scholar] [CrossRef]
  81. Spiro, B. Bacterial sulphate reduction and calcite precipitation in hypersaline deposition of bituminous shales. Nature 1977, 269, 235–237. [Google Scholar] [CrossRef]
  82. Spiro, B.; Welte, D.H.; Rullkötter, J.; Schaefer, R.G. Asphalts, oils, and bituminous rocks from the dead sea area—A geochemical correlation study. AAPG Bull. 1983, 67, 1163–1175. [Google Scholar] [CrossRef]
Figure 1. Palaeogeography, location, and sedimentary sequence of Liangjia Coal Mine. (A) Palaeogeographic map of East Shandong Province, modified from Lv et al. [13,15,17]; (B) Location of the Liangjia Coal Mine in the Huangxian Basin; (C) the sedimentary sequences of the Liangjia Coal Mine and the lithological log of the studied C1 and OS2 seam.
Minerals 10 00496 g001
Figure 2. Vertical variations of quartz, clay minerals, feldspar, analcime, carbonate minerals, and pyrite (wt%) in C1 and OS2 of Liangjia Coal Mine. The absent values of analcime, carbonate minerals and pyrite are also determined by the XRD+Siroquant, but are below the detection limit of XRD; The horizontal lines separate C1, the upper and the lower part of OS2 (OS2-2, OS2-1).
Minerals 10 00496 g002
Figure 3. SEM backscattered electrons images of quartz and calcite in C1 coals of Liangjia Coal Mine. (A,B) Fine quartz particles in cracks or scattered in the organic matter; (C) quartz of detrital origin; (D) fracture-filling quartz and calcite.
Minerals 10 00496 g003
Figure 4. SEM backscattered electrons images of albite and other minerals in C1 coals and EDS data of a selected spot. (A) fracture-filling albite; (B) EDS spectrum of the red spot in (A); (C) calcite cement around albite and organic matter; (D) albite grain along the bedding.
Minerals 10 00496 g004
Figure 5. SEM backscattered electron images of OS2 oil shales from the Liangjia Coal Mine. (A) Quartz as cell filling; (B) fine quartz grains scattered in the organic matter matrix; (C) quartz particle, broom-like kaolinite in illite matrix; (D) quartz, feldspar, calcite, and ankerite in massive aggregates; (E) a well-rounded detrital feldspar grain; (F) pyrite filling the cleat of feldspar; (G) chloritized feldspar in the matrix of organic matter; (H) massive albite surrounded by ankerite fine particles; (I) feldspar co-exists with apatite.
Minerals 10 00496 g005
Figure 6. SEM backscattered electron images of calcite, high-Mg calcite, ankerite, and quartz in OS2 oil shales. (A) Calcite particles and massive ankerite in organic matter matrix surrounded by biogenic calcite; (B) biogenic calcite laminae along massive calcite and quartz; (C) calcite replacing cell wall; (D) high-Mg calcite crystals as void filling showing euhedral forms.
Minerals 10 00496 g006
Figure 7. SEM backscattered electrons images of pyrite, as well as calcite and albite, in the oil shales. (A) bacterial pyrite framboids; (B) individual inorganic framboidal pyrite; (C) abundant euhedral pyrite crystals bounded by calcite strips; (D) Enlargement of the rectangle in (C) showing euhedral pyrite crystals, albite, and calcite; (E) dense radial pyrite; (F) nodular pyrite clusters.
Minerals 10 00496 g007
Figure 8. Backscattered electron images of pyrite that co-exists with apatite and calcite in OS2 oil shales. (A) Pyrite fills a cavity within apatite; (B) fine pyrite crystals scattered among apatite particles; (C) small pyrite grains dispersed over a large apatite grain; (D) small pyrite grains on the surface of a large calcite grain.
Minerals 10 00496 g008
Figure 9. SEM backscattered electron images showing modes of occurrence of apatite in OS2 oil shales. (A) Rod-like apatite surrounds ankerite; (B) massive apatite surrounded by calcite laminae; (C) apatite replacing cell wall along calcite laminae; (D) dense apatite grains with anorthite inclusion.
Minerals 10 00496 g009
Figure 10. Al2O3 (wt%) versus TiO2 (wt%) and TiO2 (wt%) versus Zr (ppm) diagrams for the C1 coals and OS2 oil shales.
Minerals 10 00496 g010
Figure 11. Zr/TiO2 versus Nb/Y diagrams [41] for C1 coals, OS2 oil shales, and their host rocks as compared with various kinds of volcanic rocks.
Minerals 10 00496 g011
Figure 12. Variations in geochemical indicators for the marine influence on the lacustrine environment of the section of the C1 coal seam and OS2 oil shale seam in the Liangjia Coal Mine. The horizontal grey lines separate the C1, the upper part, and the lower part of OS2. The vertical dashed lines are the specific value of each ratio.
Minerals 10 00496 g012
Figure 13. Relationships between B and ash yield with analcime in C1 coals and OS2 oil shales. (A) analcime on mineral basis vs. B on ash basis; (B) analcime on mineral basis vs. ash yield on a dry basis.
Minerals 10 00496 g013
Table 1. Proximate and ultimate analysis (%), thickness (cm), total sulphur (%) and gross calorific value (MJ/kg) of the coals and oil shales from Liangjia Coalmine, Huangxian Basin.
SamplesThicknessMAdVMd,mmfRo,ranSt,dNdafCdafHdafGCVim,MMf
LJ1-R205.4280.25ndnd1.27ndndndnd
LJ1-11013.6019.0042.880.320.532.7277.946.3425.625
LJ1-22013.707.1441.870.380.572.7178.056.6426.324
LJ1-32013.8010.6043.19nd0.572.6477.776.7125.072
LJ1-42014.705.5239.370.370.592.5577.836.6824.545
U2-2-1308.0713.19nd0.350.792.5478.597.4631.090
U2-2-2301.6848.98ndnd1.171.6571.258.3429.742
U2-2-3303.1334.87ndnd0.731.8876.138.7032.332
U2-2-4302.037.77ndnd1.131.5073.328.6631.106
U2-2-5305.4455.02ndnd1.102.1167.386.9922.436
U2-2-6308.0625.48nd0.330.722.7076.537.2329.581
U2-2-7206.7142.08ndnd0.622.6075.678.0930.187
U2-1-1304.266.50ndnd0.991.9065.369.0625.031
U2-1-2204.3566.56ndnd0.851.8467.189.0926.638
U2-1-3153.8369.07ndnd1.002.0063.268.0923.103
U2-1-4103.5272.60ndnd1.431.9560.627.7021.757
U2-1-5304.3465.98ndnd1.122.0362.827.6722.668
U2-1-F204.0577.06ndnd1.19ndndndnd
M, moisture; A, ash yield; VM, volatile matter; St, total sulphur; C, carbon; H, hydrogen; N, nitrogen; GCV, gross calorific value; ad, air dry basis; d, dry basis; daf, dry and ash-free basis; im, inherent moisture basis; MMf, mineral-matter-free basis; nd, not detected.
Table 2. Concentrations of major-element oxides (%), loss on ignition (LOI, %) and Al2O3/TiO2 in the Liangjia C1, OS2, the roof and floor samples (on ash basis), determined by XRF analysis.
SampleLOISiO2TiO2Al2O3Fe2O3MnOMgOCaONa2OK2OP2O5Al2O3/TiO2
LJ1-R19.7554.960.6713.708.710.171.9815.831.742.030.2220.56
LJ1-181.0262.130.6818.203.510.051.497.234.831.790.0826.65
LJ-1-292.8662.340.5317.643.800.201.012.4411.260.740.0433.24
LJ1-389.4139.480.319.764.080.170.9039.365.590.320.0431.47
LJ-1-4 *94.4845.570.2717.645.380.240.8815.8113.640.520.0464.93
U2-2-186.8177.550.4010.313.350.021.022.084.141.010.1225.63
U2-2-251.0249.780.193.9515.030.481.6026.701.300.550.4220.77
U2-2-365.1354.840.295.738.400.261.4026.351.700.610.4219.89
U2-2-462.2333.810.206.355.400.481.2549.331.850.540.7932.49
U2-2-544.9850.250.366.5911.900.401.1226.501.570.930.3818.08
U2-2-674.5279.820.3611.092.270.210.901.192.581.410.1730.72
U2-2-757.9279.190.4111.832.940.221.120.672.211.300.1228.85
U2-1-133.5061.270.5611.856.840.151.9913.741.761.480.3621.17
U2-1-233.4465.610.429.257.580.271.3012.451.821.060.2521.97
U2-1-330.9358.820.5110.918.450.212.0815.551.731.350.4121.53
U2-1-427.4060.610.5010.557.650.191.7815.241.821.360.3021.02
U2-1-534.0261.110.5310.558.530.211.8713.701.711.480.3319.75
U2-1-F22.9458.640.5512.447.040.172.0315.561.831.390.3522.66
Ave-C 51.870.4715.075.270.181.2317.127.701.000.0931.99
Ave-OS 60.340.399.027.400.261.4517.682.031.070.3523.07
Ave-C, the average value of coal samples; Ave-OS, the average value of oil shale samples; *: calculated by stoichiometry.
Table 3. Concentrations of trace elements (ppm) in the Liangjia C1 coals, OS2 oil shales, the roof and floor samples (whole-rock basis).
SampleLiBeBScVCrCoNiCuZnGaGeRbSrZrNbMoCdInSnCsBaBa/EuLa
LJ1-R26.31.3148.88.1760.255.111.530.720.643.713.91.0573.06421769.352.380.340.041.263.1872758736.3
LJ1-18.410.884031.9513.011.92.845.175.7412.74.210.3313.811322.51.850.310.030.0100.300.9325510496.11
LJ1-22.310.404630.998.196.412.342.113.882.891.160.071.3752.65.350.420.23bdl0.0020.100.271629512.71
LJ1-31.910.424761.0110.35.992.482.903.878.491.391.310.901016.260.900.24bdlbdl0.060.2215011011.91
LJ1-41.180.346240.985.592.631.571.321.483.301.000.050.3255.02.260.260.29bdlbdl0.030.1713411651.79
U2-2-14.940.652561.2314.712.15.579.827.5319.21.840.146.4866.810.00.680.380.070.0020.100.7621613122.60
U2-2-214.80.6525.52.0215.718.26.2317.311.531.03.380.3316.743316.41.720.420.090.0100.281.6159210669.65
U2-2-39.430.6277.51.5420.320.66.2716.711.831.53.120.3813.832219.22.090.540.130.0100.221.314629298.48
U2-2-453.02.3533.02.0820.017.67.3919.512.632.012.90.3511.190.817.91.780.780.110.0610.230.8281.413410.8
U2-2-510.80.9278.52.8322.525.410.820.213.544.65.560.5227.642941.22.920.580.220.0160.452.5540347719.0
U2-2-66.971.082051.7928.815.14.309.2413.043.73.370.4018.568.122.51.680.590.140.0080.351.761595136.95
U2-2-712.21.381443.4641.831.37.0717.317.140.46.391.8630.383.345.04.700.590.170.0200.592.5020041012.0
U2-1-119.41.6631.37.4256.254.212.838.328.965.811.61.1353.047078.810.32.890.270.0121.222.7059457230.7
U2-1-219.21.5525.56.9044.243.013.038.127.954.39.630.4341.728957.55.200.610.240.0080.802.5444445229.4
U2-1-319.71.6826.77.0551.150.512.535.326.957.211.00.9548.451380.58.482.180.260.0141.042.6264366629.5
U2-1-420.11.6631.76.6046.946.512.937.225.559.310.90.8258.045781.46.050.870.280.1840.843.0266571727.4
U2-1-521.41.6930.96.6454.550.813.339.228.762.911.81.1052.045273.55.820.620.260.0260.903.1866571428.5
U2-1-F22.21.5829.67.3450.752.212.737.125.454.112.00.9355.346699.46.750.480.300.0180.962.9973964132.1
Ave-C12.70.55041.18.76.02.22.53.56.01.60.52.775.67.20.70.30.00.00.10.316410692.7
Ave-OS217.51.386.13.832.629.98.923.317.743.57.20.728.629440.83.90.90.20.00.52.040867516.5
R0.570.70-0.860.920.900.950.950.950.920.900.870.470.940.890.850.870.600.930.350.910.940.88nd0.96
Ave-C101.2564.122154.2915185.5210120353.32.20.240.0210.790.98150nd10
CC-C10.270.389.00.280.400.400.530.280.230.330.290.230.270.630.210.220.120.020.100.120.331.1nd0.27
Ave-S442.481142001001784100140202.89320015012185.34.66.65.9560nd31
CC-OS20.400.531.060.270.160.300.520.280.180.310.360.230.311.470.270.330.050.030.000.080.340.73nd0.53
SampleCePrNdSmEuGdTbDyYHoErTmYbLuHfTaWHg(ppb)TlPbBiThU∑REY
LJ1-R75.77.1226.84.871.245.140.683.4719.40.681.970.291.890.294.410.640.89bdl0.5743.70.146.521.52186
LJ1-112.51.375.180.850.241.000.100.592.930.100.320.040.330.040.640.240.455.530.032.880.041.930.3931.7
LJ1-27.260.763.100.610.170.610.060.391.940.060.220.020.210.020.140.030.051.57bdl1.710.011.090.2718.2
LJ1-35.200.552.340.510.140.510.060.391.990.060.220.020.210.020.140.030.222.56bdl1.380.0020.830.2714.1
LJ1-43.610.492.070.400.120.420.050.391.840.070.230.030.230.030.060.000.340.58bdl0.70 0.590.2211.8
U2-2-16.090.692.790.560.160.570.060.452.300.080.300.040.330.060.240.04bdl7.840.011.770.041.810.4917.1
U2-2-220.02.409.281.650.561.810.191.075.220.190.590.070.590.090.420.28bdl50.30.245.110.072.720.5353.4
U2-2-319.22.188.691.580.501.750.190.954.400.180.540.070.480.080.510.15bdl20.80.103.760.052.660.6049.3
U2-2-424.62.7011.22.120.612.190.251.305.990.230.710.090.710.100.460.13bdl40.20.135.420.422.960.6363.5
U2-2-543.44.8418.33.200.843.510.391.908.400.341.010.130.960.151.200.30bdl1050.5011.20.125.590.98106
U2-2-615.01.937.471.430.311.410.170.974.080.170.540.060.610.080.620.120.515.100.073.320.073.441.7341.2
U2-2-725.93.1012.02.050.492.260.261.355.710.250.760.100.730.111.180.240.139.330.126.250.104.441.3667.1
U2-1-160.46.0323.03.931.044.440.502.5919.90.471.360.131.270.152.613.876.6249.30.059.340.076.821.73156
U2-1-257.56.0722.94.040.984.880.532.9022.10.511.580.171.400.171.830.811.0434.60.029.010.045.790.98155
U2-1-357.05.5620.63.700.974.210.442.5120.30.451.400.141.360.162.532.534.5631.40.0911.00.035.741.11148
U2-1-453.74.9818.73.420.933.850.482.3518.80.461.340.181.170.182.490.720.7249.90.4110.30.455.631.23138
U2-1-555.65.4320.03.520.933.960.452.4018.60.431.300.141.190.162.260.50bdl69.30.1411.00.076.351.30143
U2-1-F62.56.2523.24.241.154.750.532.8921.80.501.610.181.420.193.130.700.3057.60.3011.90.087.131.46163
Ave-C16.40.72.90.60.20.60.10.42.10.10.20.00.20.00.20.00.22.10.01.50.01.00.317.1
Ave-OS234.13.613.82.50.72.70.31.610.20.30.90.10.80.11.20.71.040.30.16.90.14.31.088.3
R0.970.970.970.970.980.970.970.960.920.960.960.920.950.930.890.530.430.740.550.680.300.950.730.97
Ave-C223.5111.90.52.60.3228.60.50.850.3110.191.20.261.21000.686.60.843.32.965.3
CC-C10.290.200.260.290.310.220.200.210.240.140.280.080.230.140.160.190.200.020.010.230.010.300.090.26
Ave-S614.1254.51.15.50.63.9290.5720.32.90.43.80.832.42202.6291.17.414172
CC-OS20.560.880.550.550.600.500.510.420.350.510.450.340.290.300.320.900.430.180.060.240.100.580.070.51
Ave-C1, the average value of C1 coals; Ave-OS2, the average value of OS2 oil shales; R, correlation coefficient between concentrations of elements and ash yield of the studied samples; Ave-C, average value of world low-rank coal by Ketris and Yudovich [27]; Ave-S, average values for world terrigenous and volcanic-sedimentary shales reported by Ketris and Yudovich [27]; CC-C1, concentration coefficient of trace element in C1 coals, the ratio of the element concentration in C1 coals vs. Ave-C; CC-OS2, concentration coefficient of trace element in OS2 oil shales, the ratio of the element concentration in OS2 oil shales vs. Ave-S; nd, not detected; bdl, below detection limit.
Table 4. Mineral compositions of coals, oil shales, roof and floor samples by XRD and Siroquant (wt%, on organic matter-free basis).
SamplesLTAQuartzKaoliniteI/SIlliteMuscoviteAnorthiteAlbiteAnalcimeBassaniteHigh-Mg CalciteCalciteSideritePyriteApatite
LJ1-R 254.721.6 9.1 11.4 18.3 2.91.9
LJ1-122.8631.611.522.7 13 12.88.4
LJ1-27.1430.58.4 17.3 3.5 35.4
LJ1-313.1816.52.9 3.217.210.3 40.7
LJ1-46.179.4 28.3 5.7 46.25.2 1.5
U2-2-115.4245.6 235.6 11.7 0.7
U2-2-264.4829.8 10.3 3.1 8.1 28.8163.8
U2-2-344.8427.5 17.49.5 7.52.7 26.46.42.6
U2-2-451.7515.83.1 15.5 9.2 7.3 42.7 6.4
U2-2-5 25.5 25.27.4 7.9 5.4 27.39.93
U2-2-625.7857.910.8 15.6 5.7 10
U2-2-744.50495.7 37.9 2.9 4.6
U2-1-179.1624.67.911.722.7 12 4.816.2
U2-1-2 30.73.327.9 5.21.8 21.45.531.2
U2-1-3 253.532.34.9 8.7 8.815 1.8
U2-1-4 31.94.920.97.5 14.4 2.2 3.810.4 2.90.5
U2-1-5 25.57.426.310.8 6.5 1.8 4.815 1.9
U2-1-F 30.43.923.915 11.4 1.1 6.57.9
The minerals in coal and low ash oil shales (ash yield <50%) are on low-temperature ash basis, and the roof, floor and high ash oil shales (ash yield >50%) are on an organic-free basis. Minerals are determined not listed in the table include 5.2% orthoclase in LJ1-R, 12.3% tamarugite in U2-2-1, 0.6% ankerite in U2-1-4, 1% rutile in U2-2-1, 5% apatite in LJ1-2, 3.7% chamosite in LJ1-4, and 9.3% glauberite in LJ1-3.

