An Evaluation of the Potential for Determination of the Geographic Origin of Ruby and Sapphire Using an Expanded Trace Element Suite Plus Sr–Pb Isotope Compositions

 ,
,
Abstract
1. Introduction
2. Materials and Methods
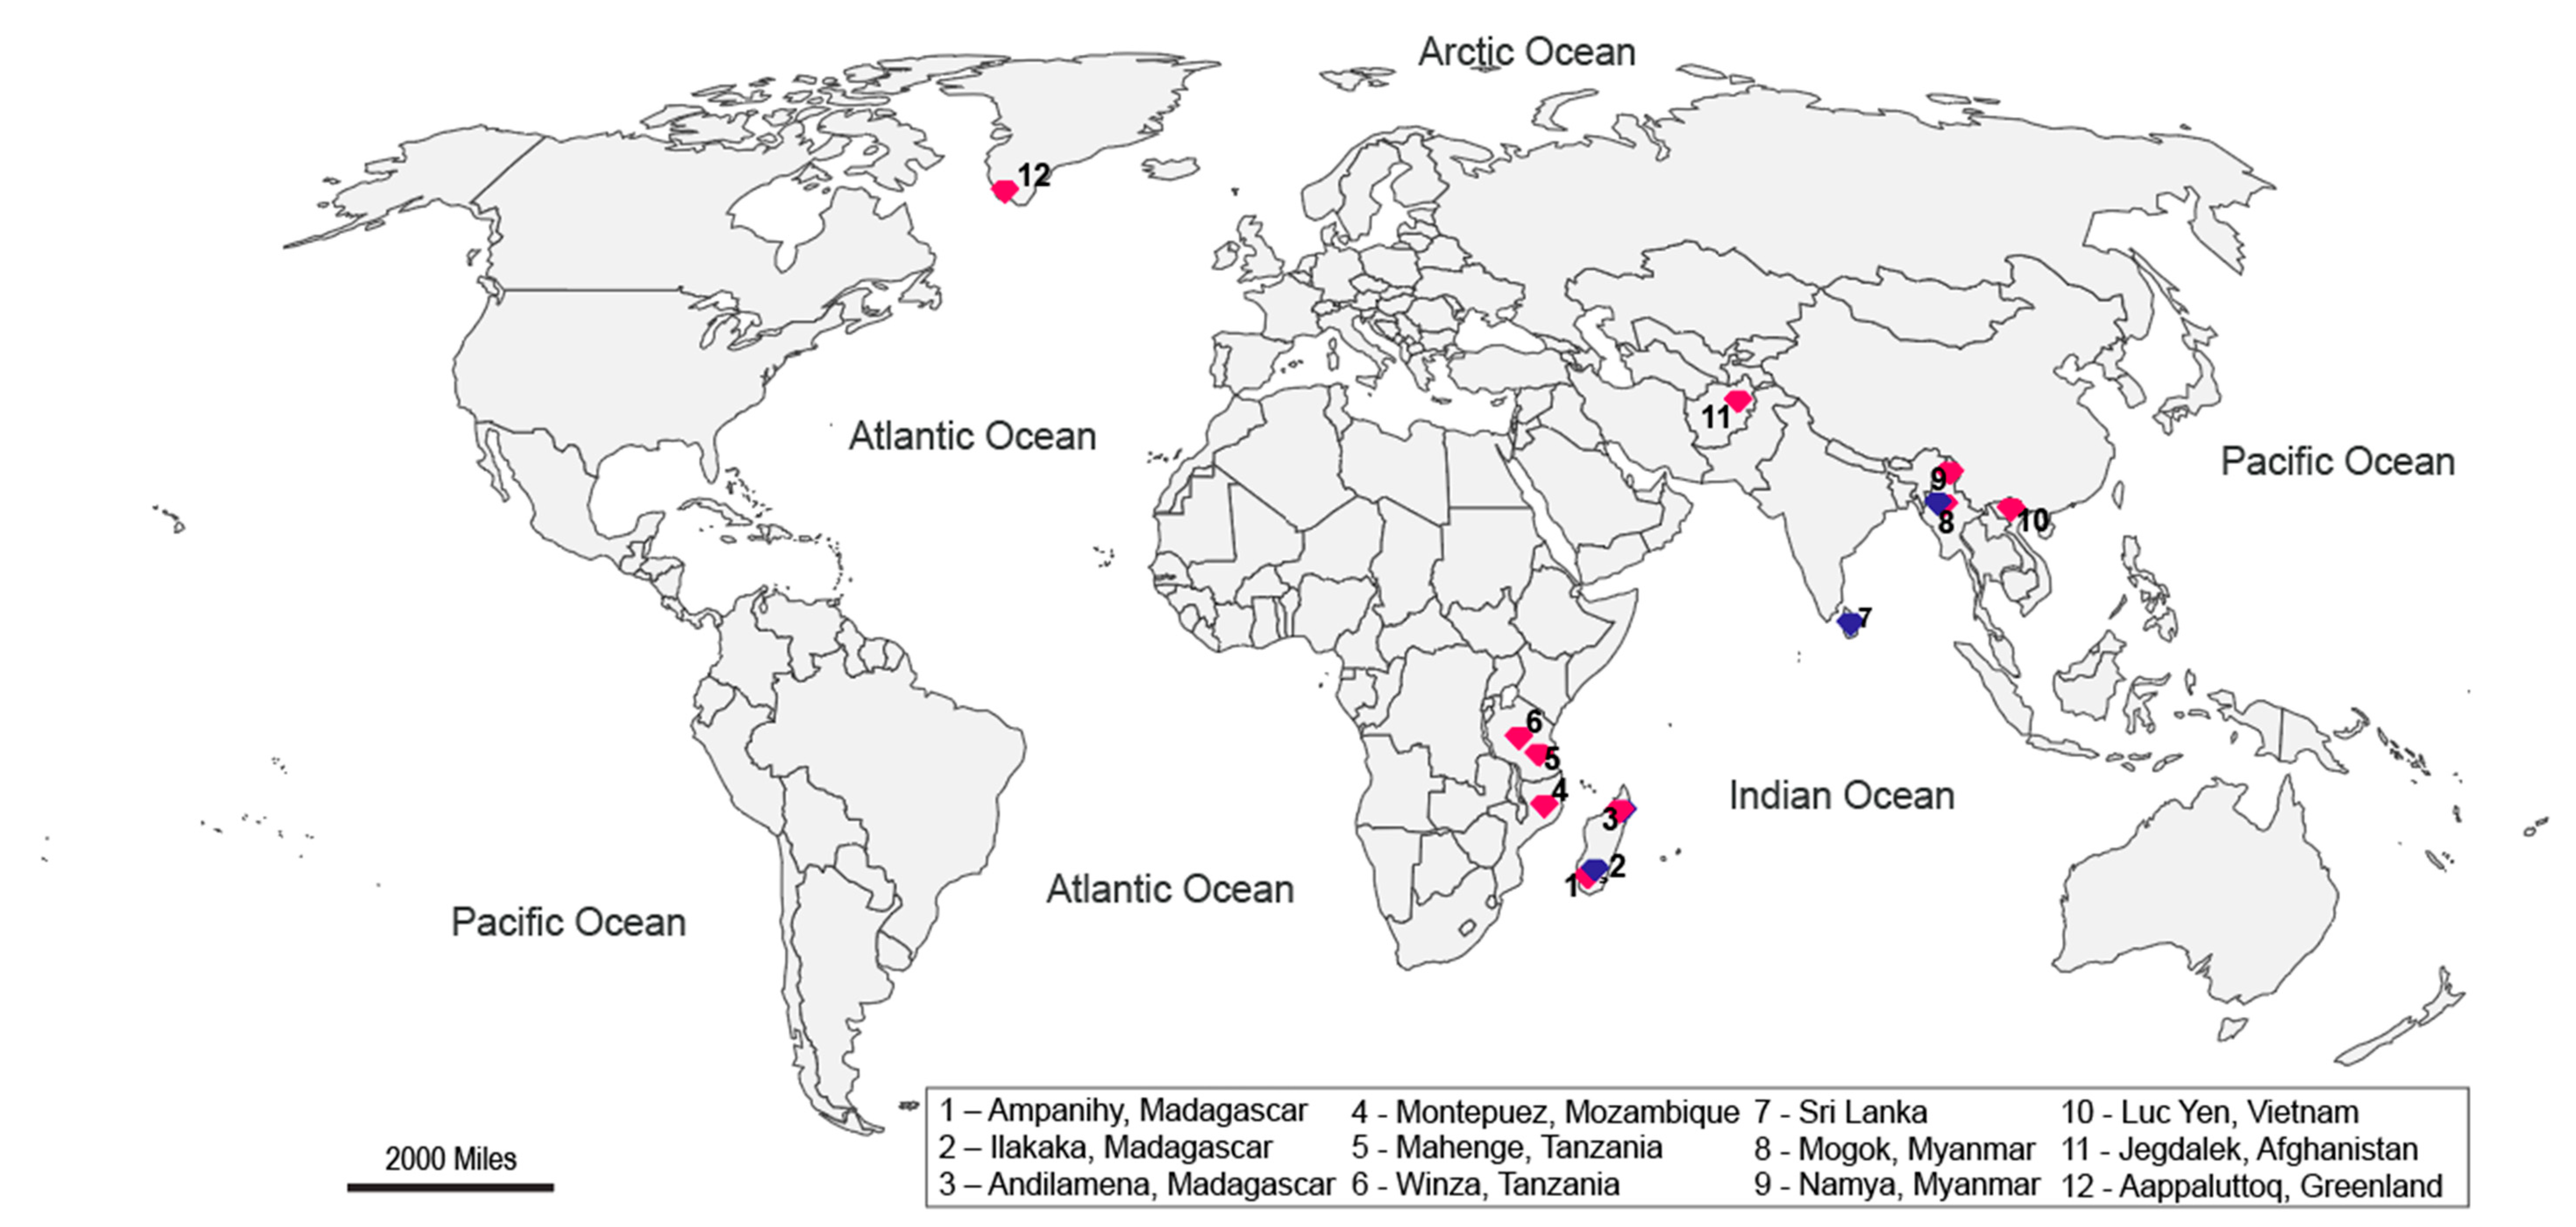
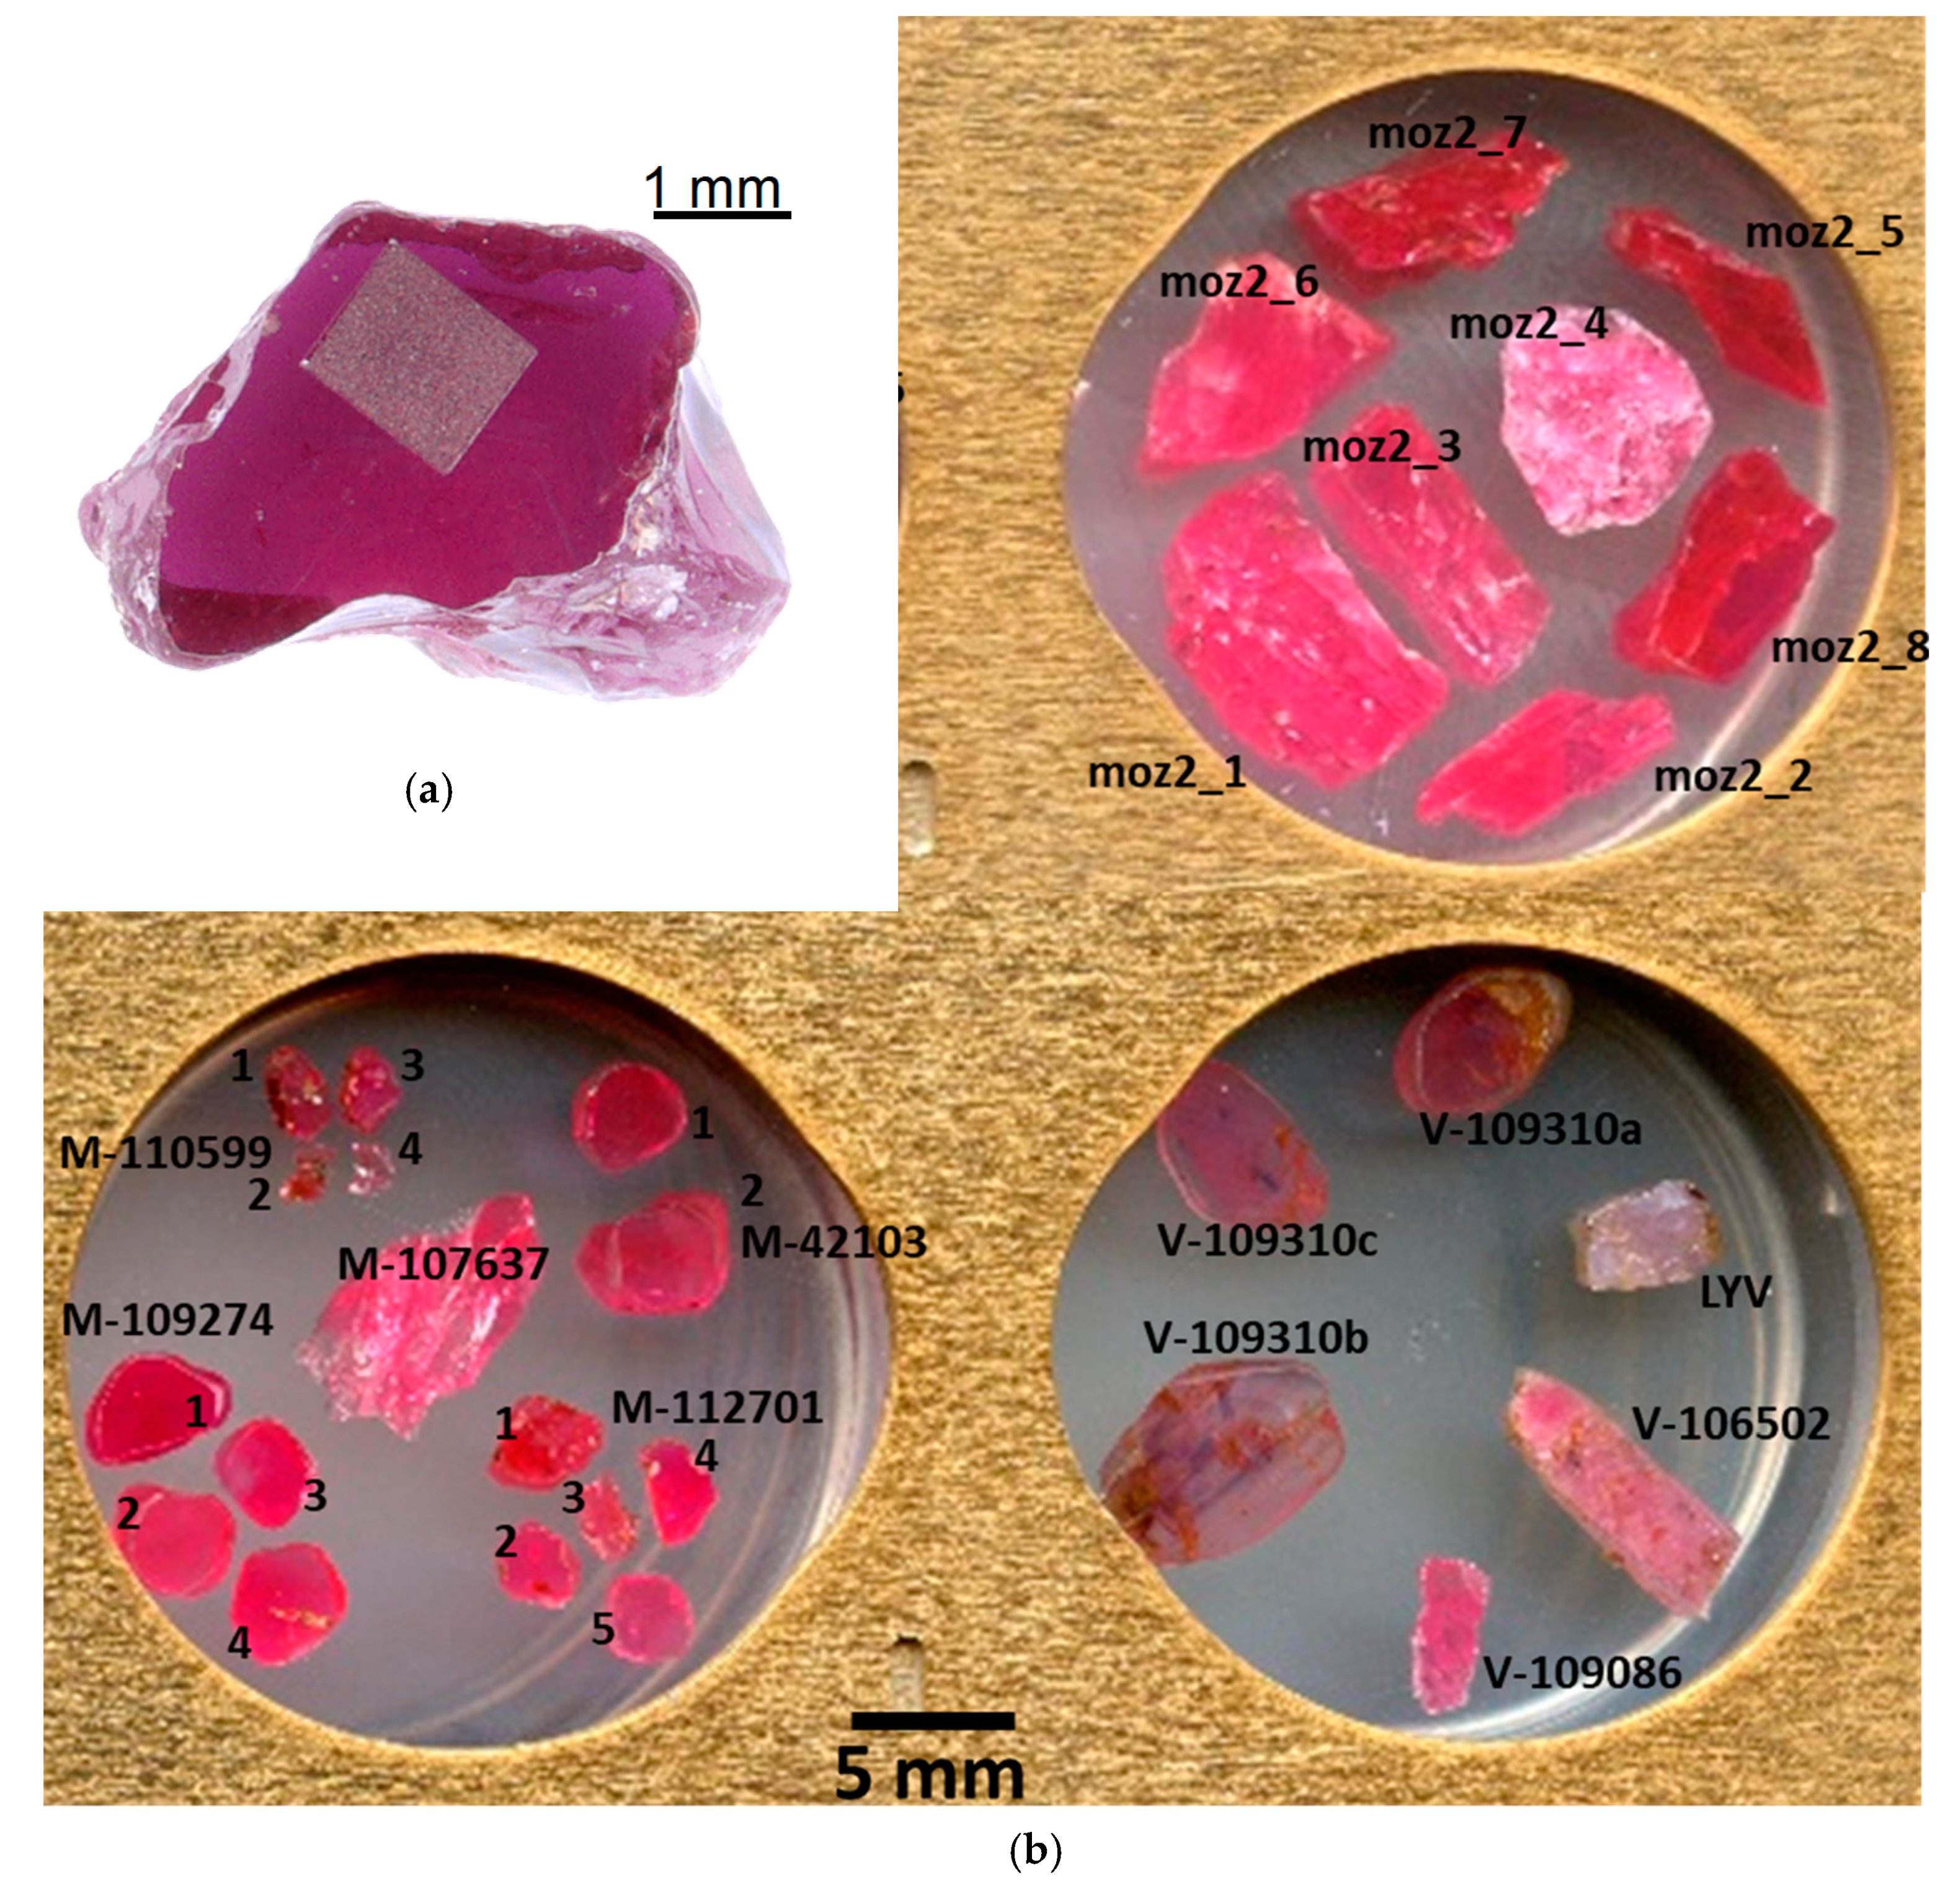
2.1. Materials
2.1.1. Amphibolite-Type Ruby
2.1.2. Marble-Hosted Ruby
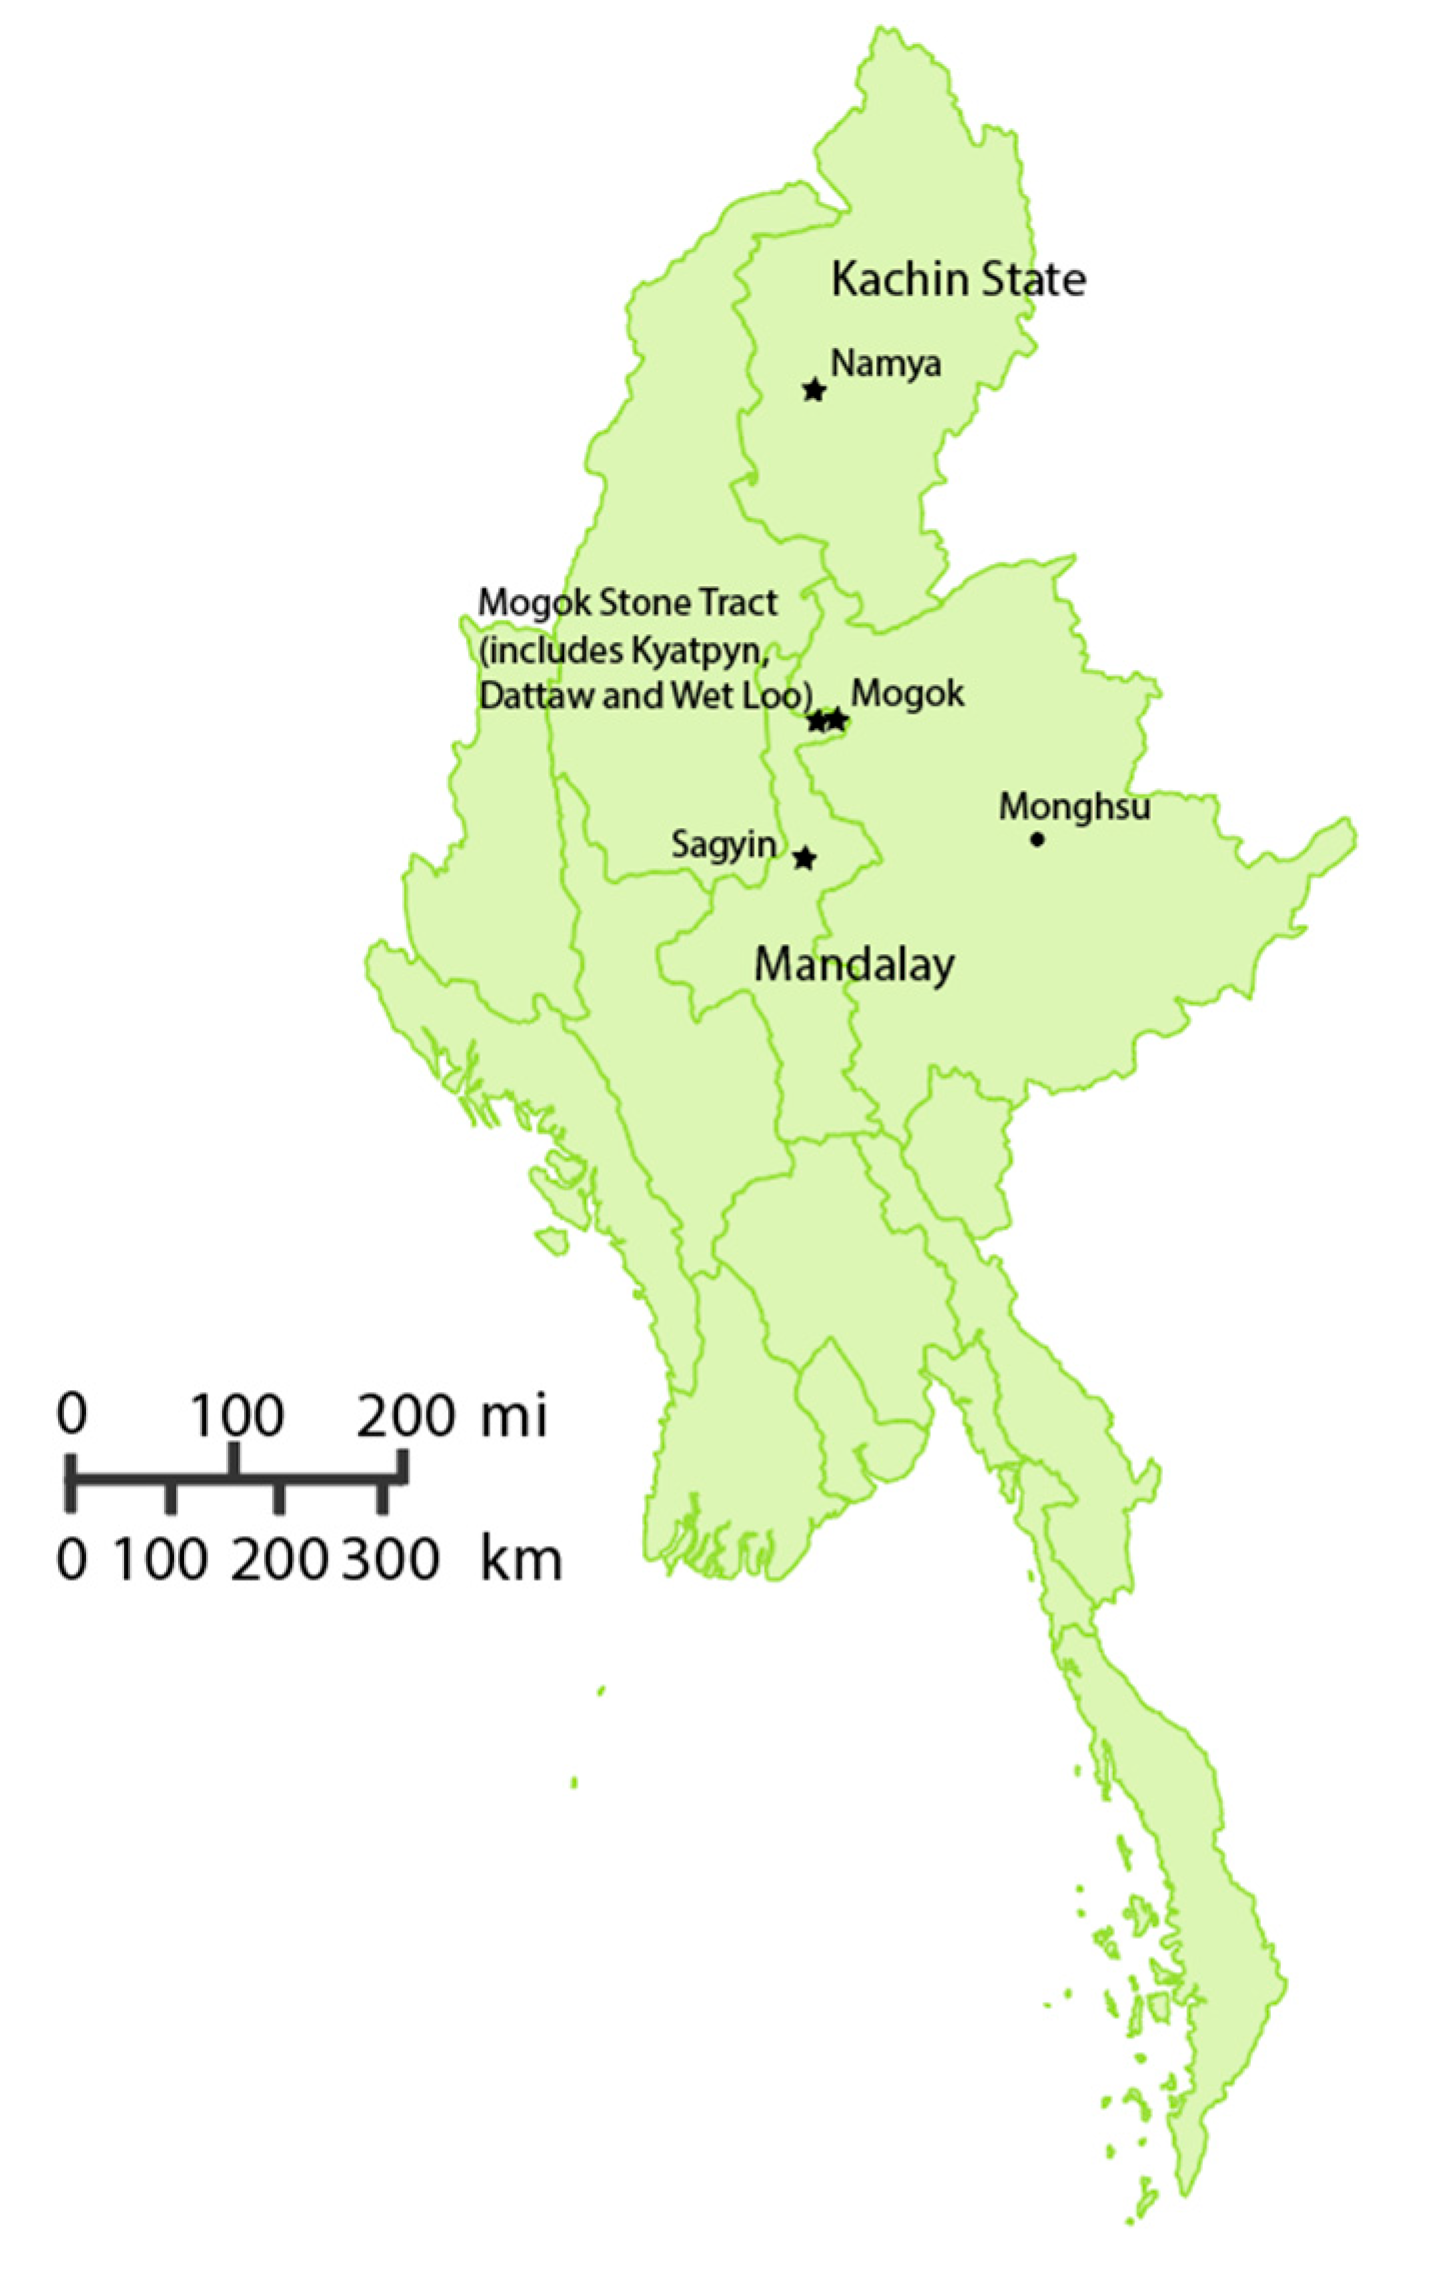
2.1.3. Metamorphic Blue Sapphires
2.2. Methods
2.2.1. Trace Element Analysis
2.2.2. Radiogenic Isotope Analysis
3. Results
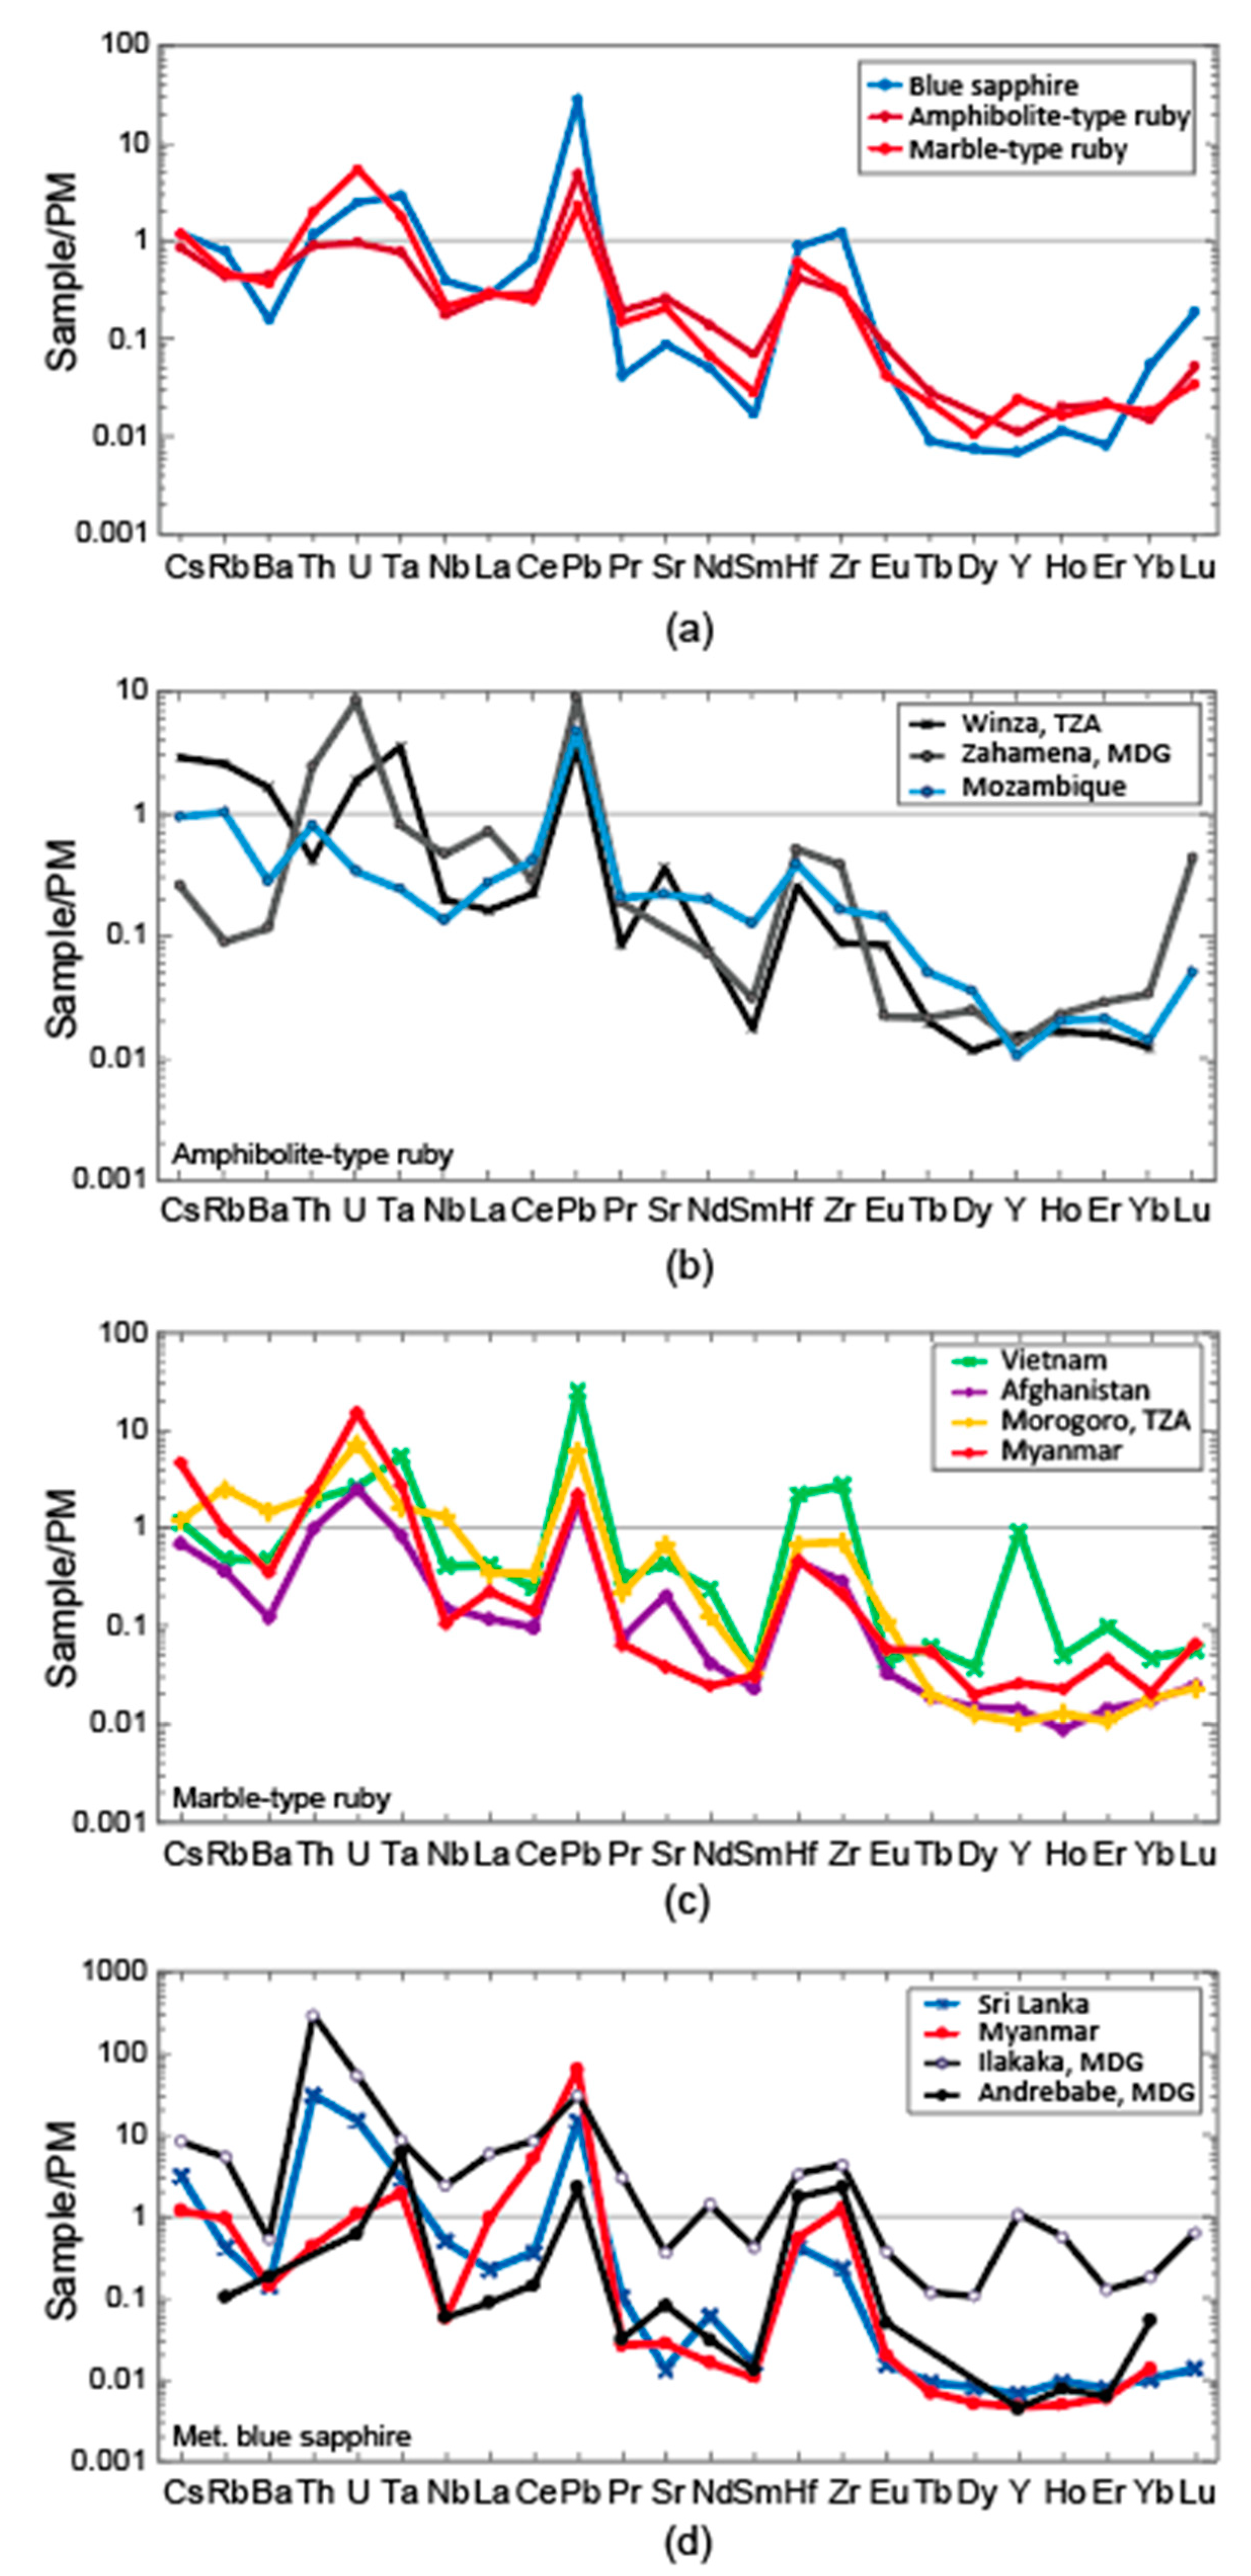
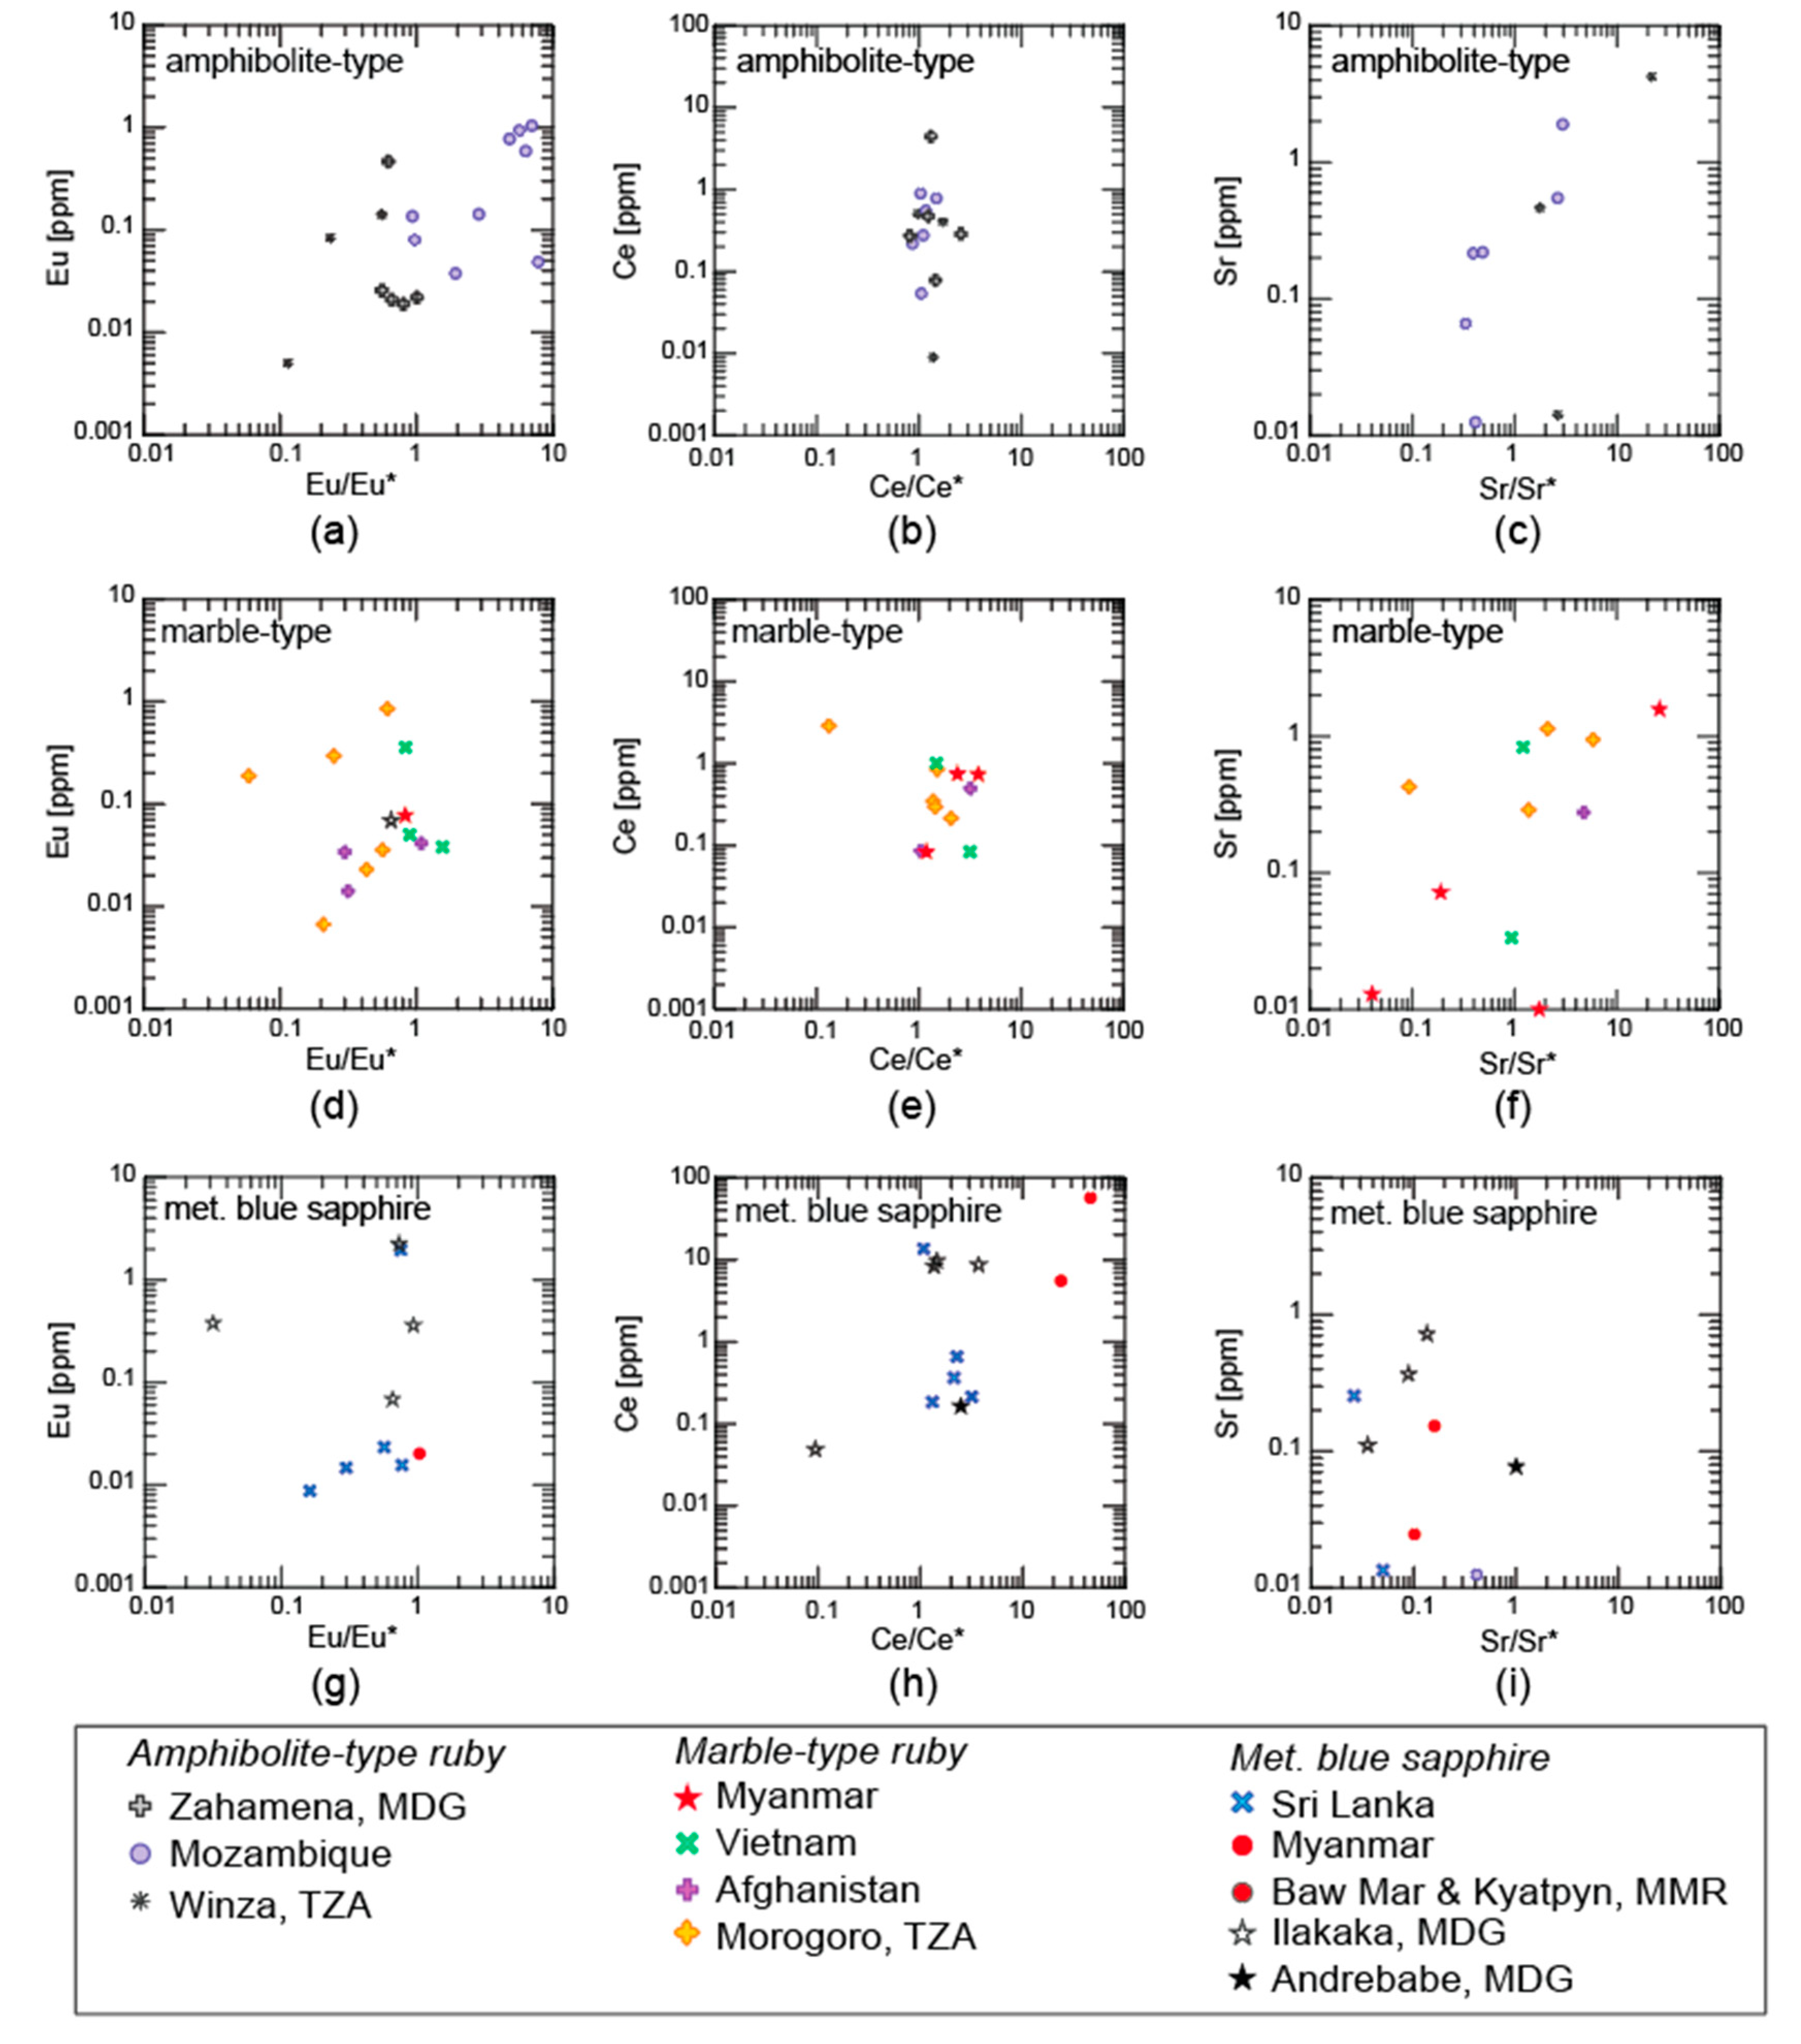
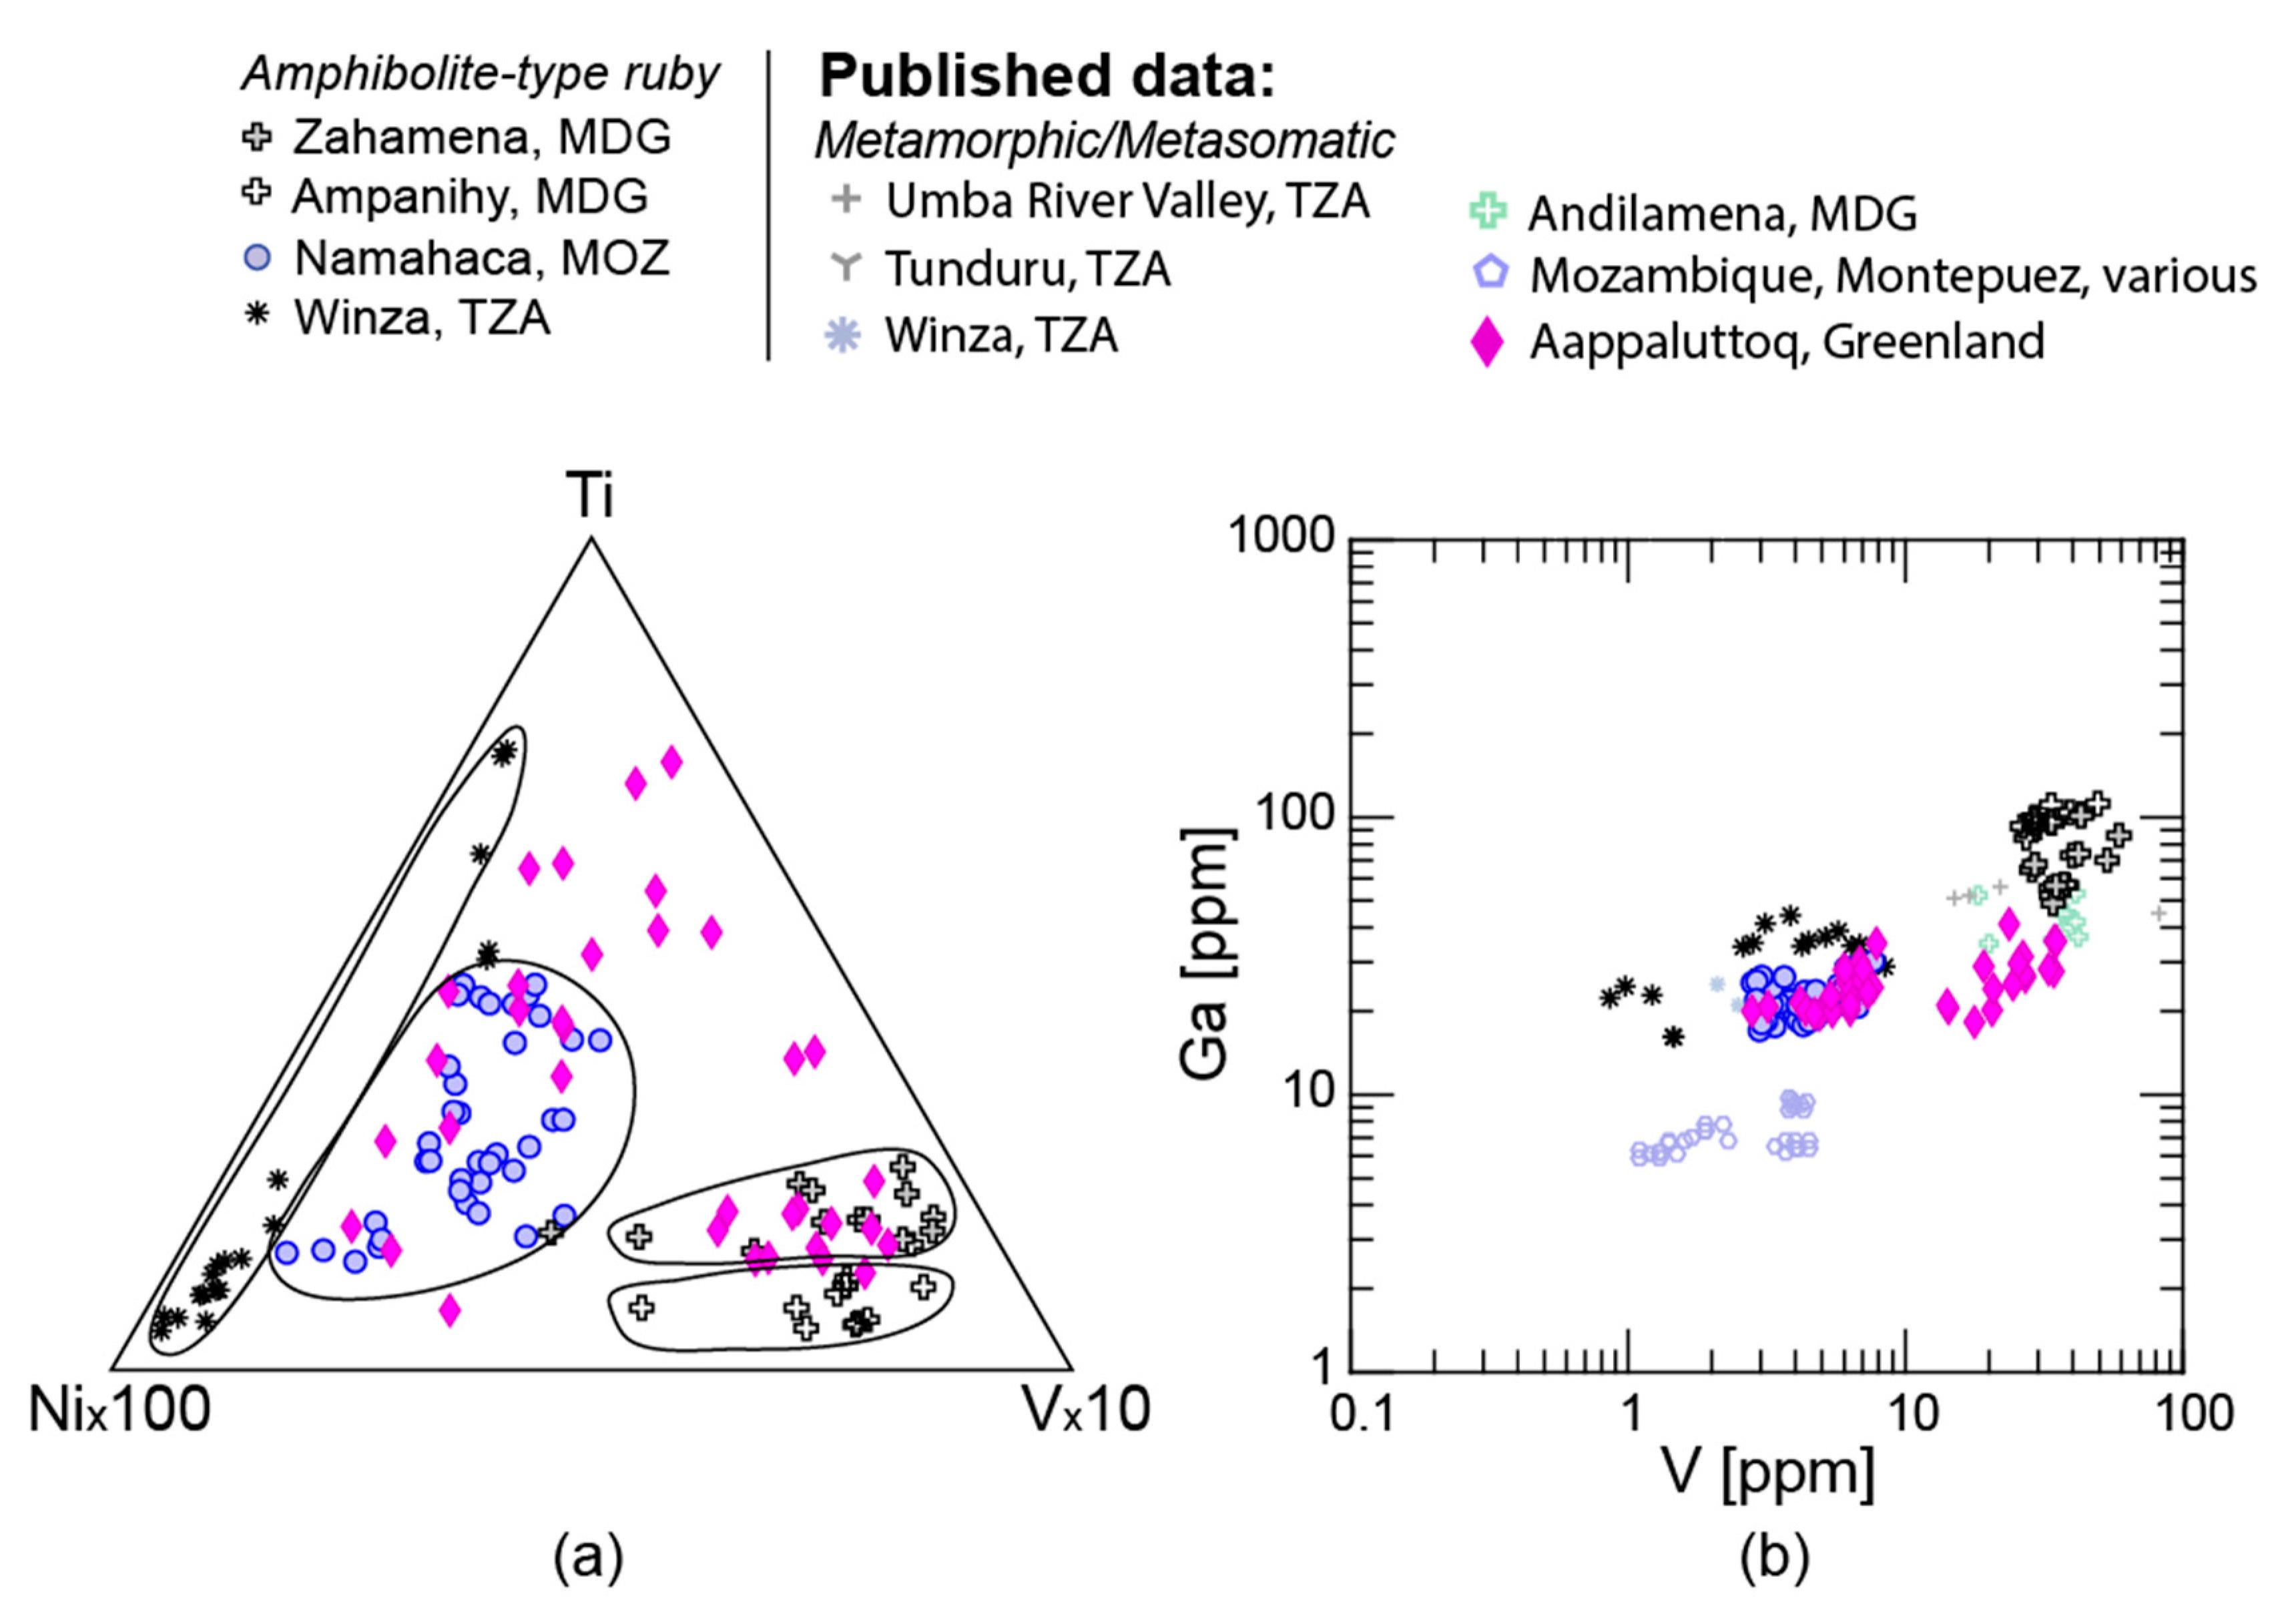
3.1. Trace Elements
3.1.1. LA-ICP-MS
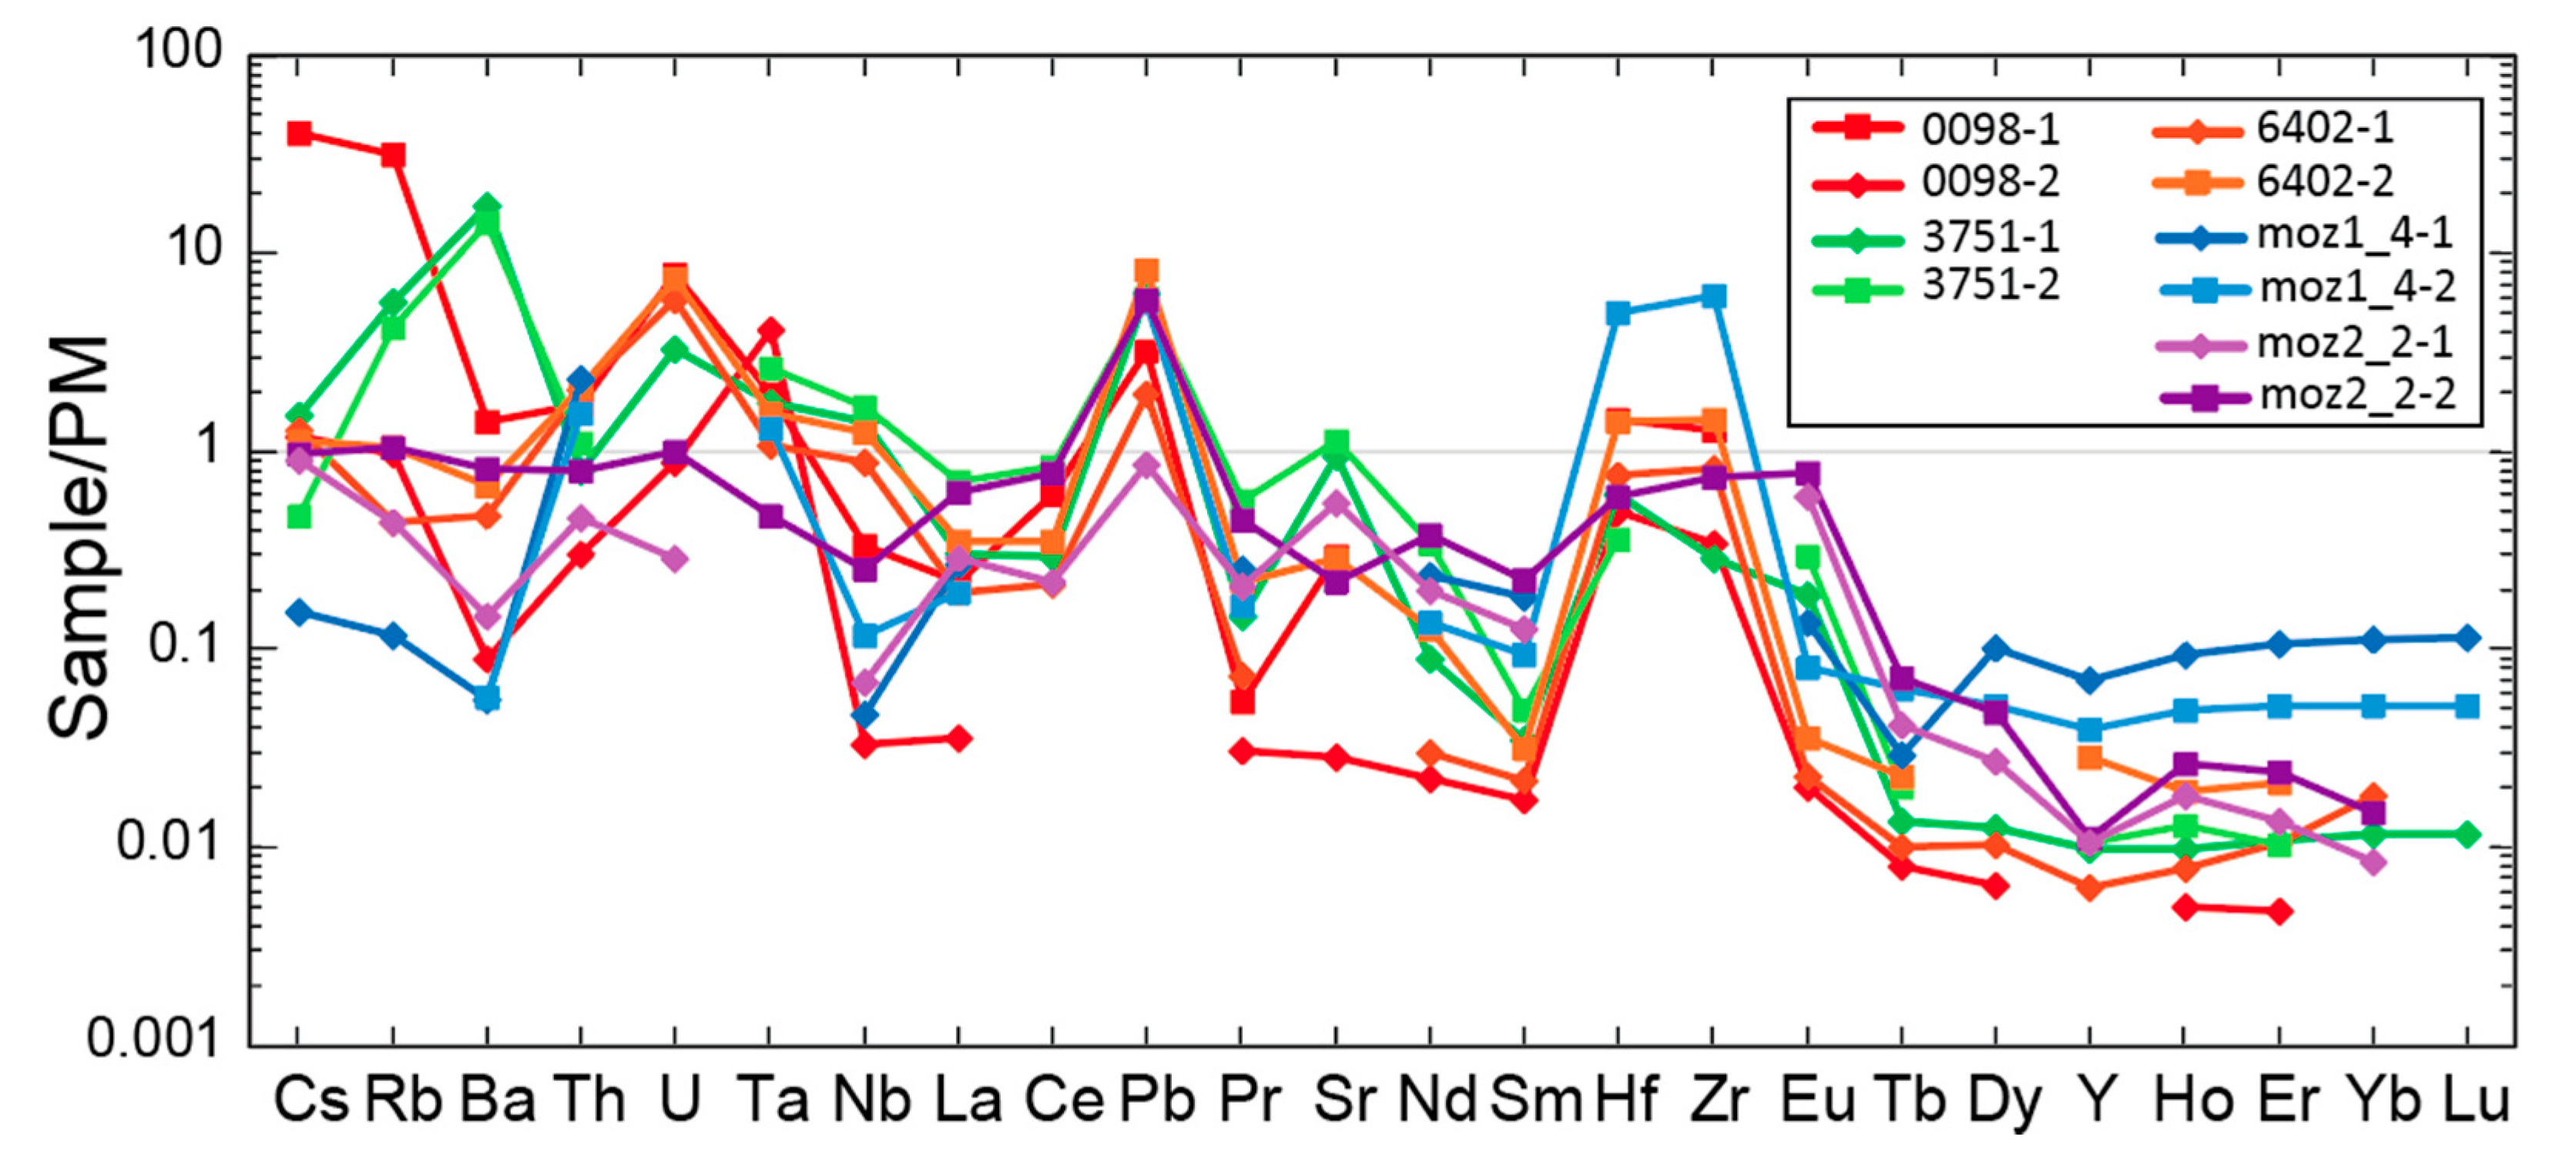
3.1.2. Solution ICP-MS
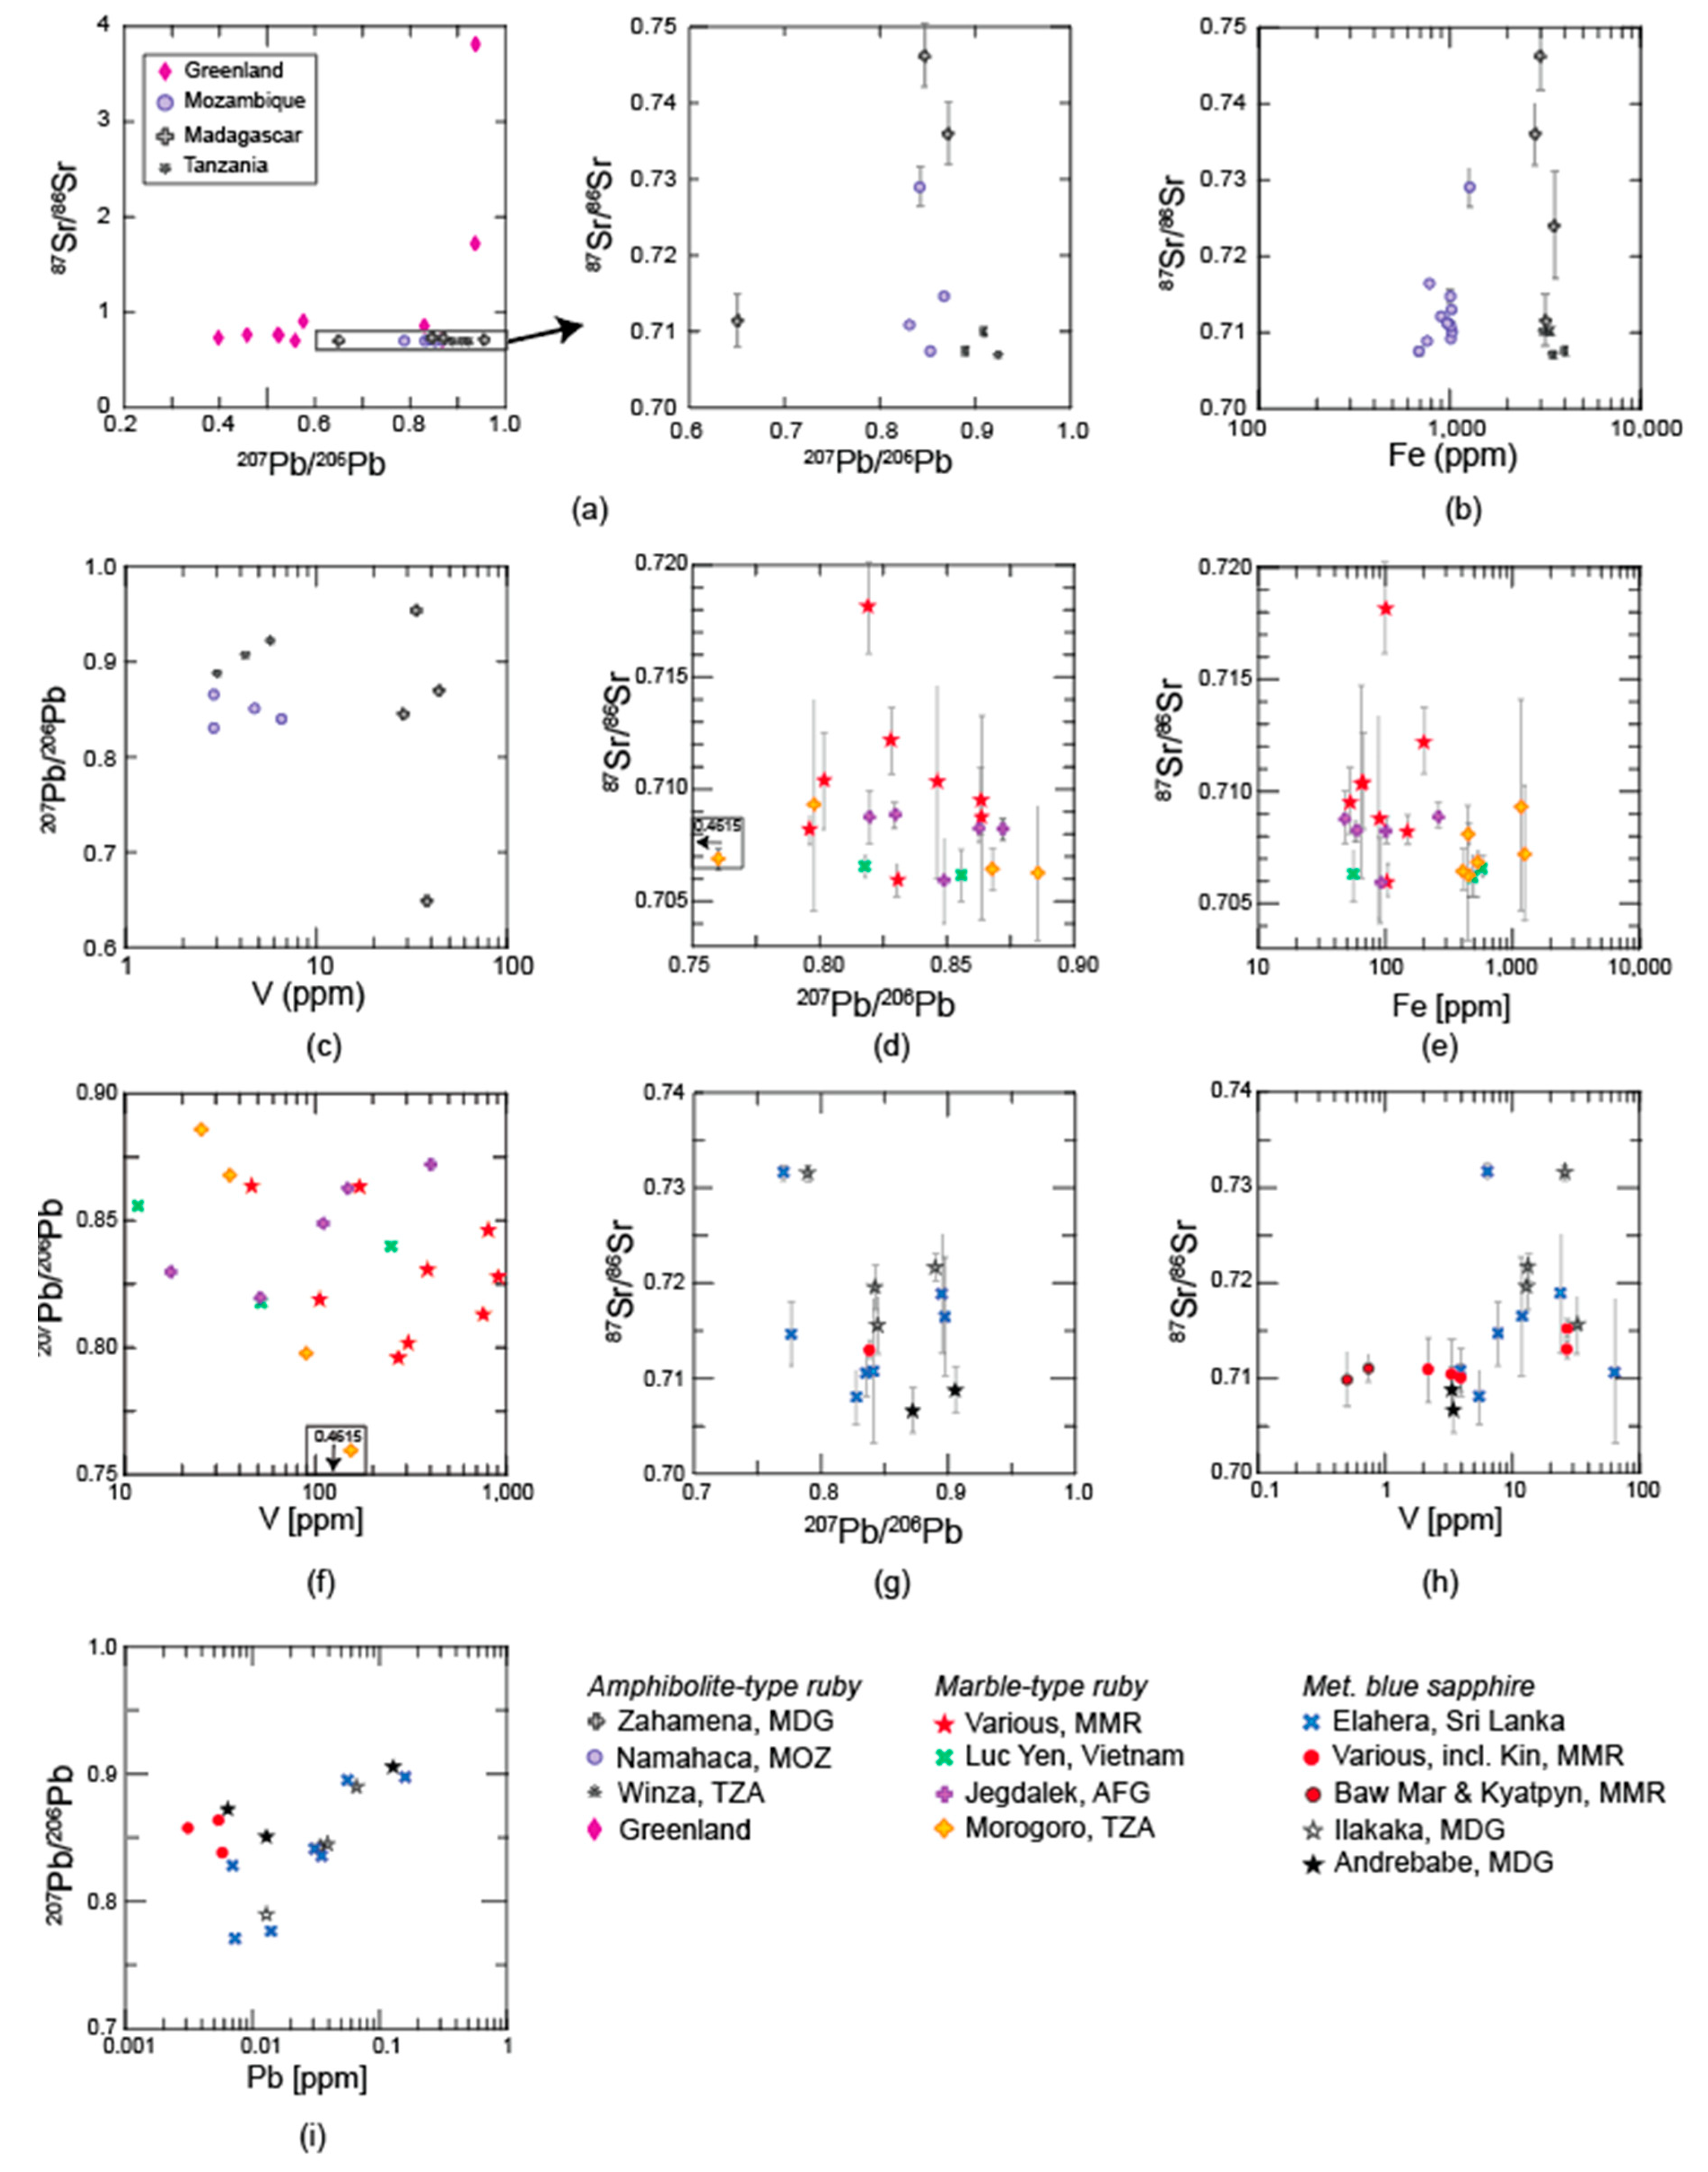
3.2. Radiogenic Isotopes
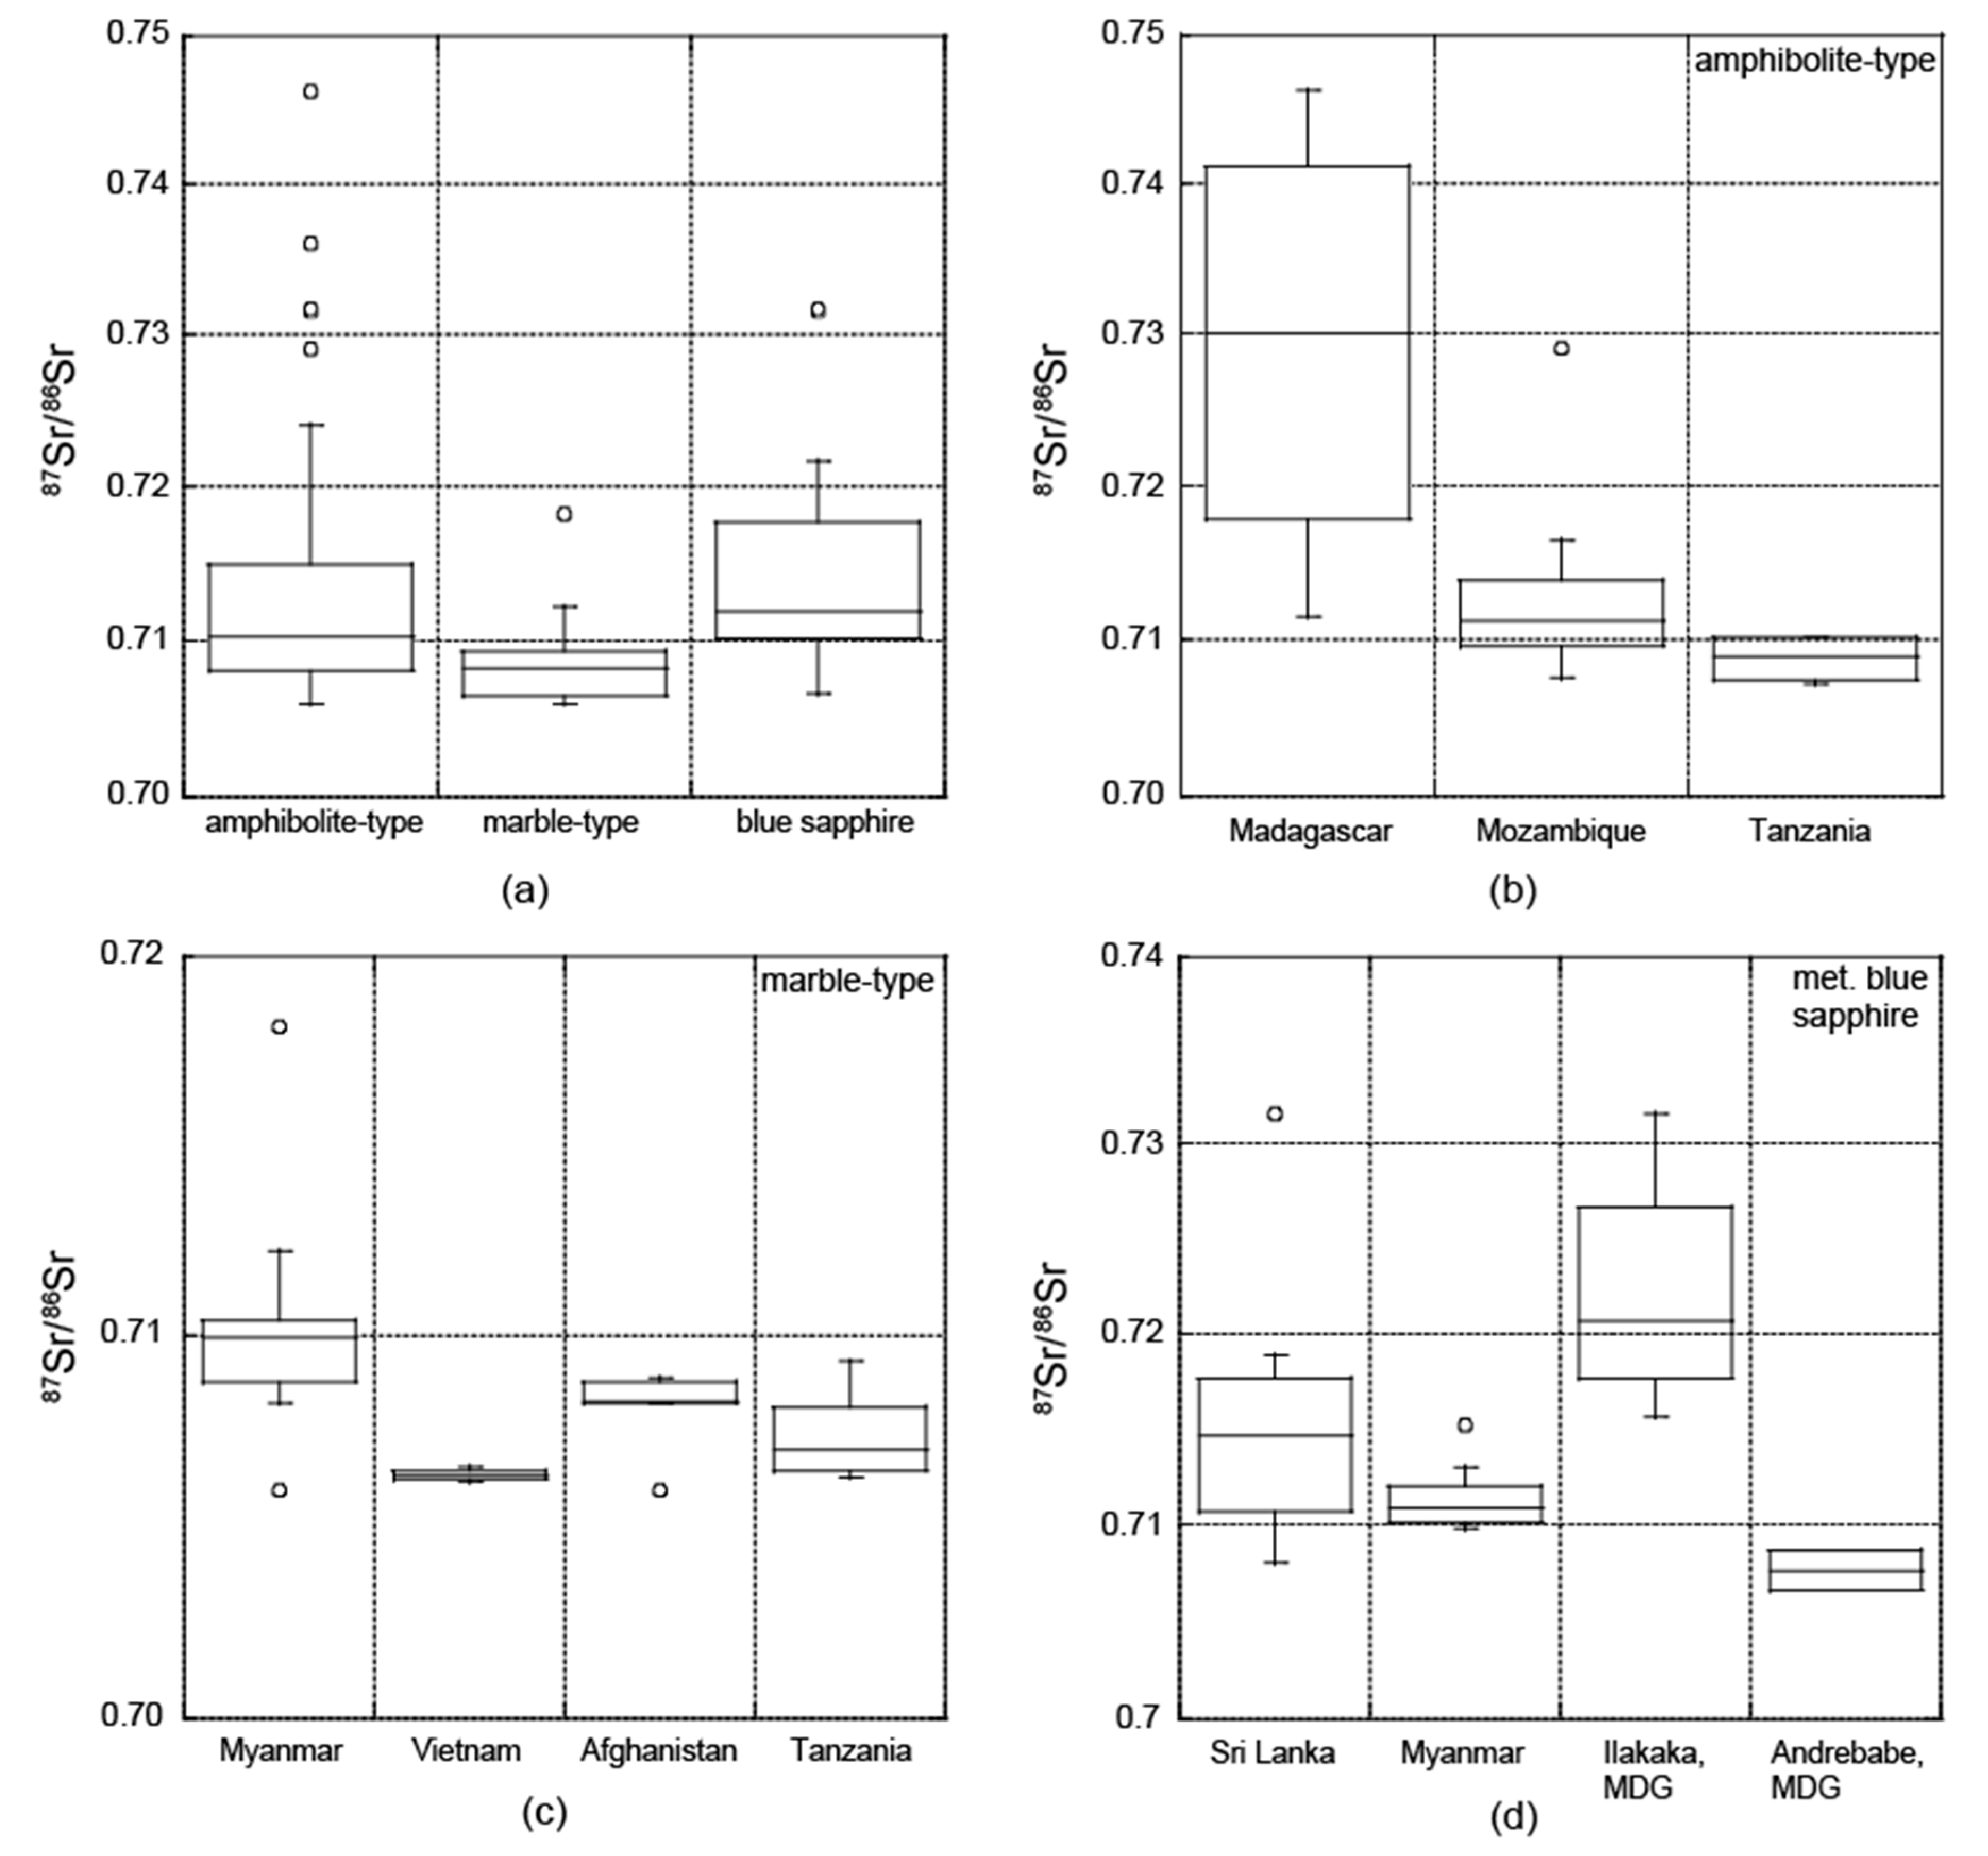
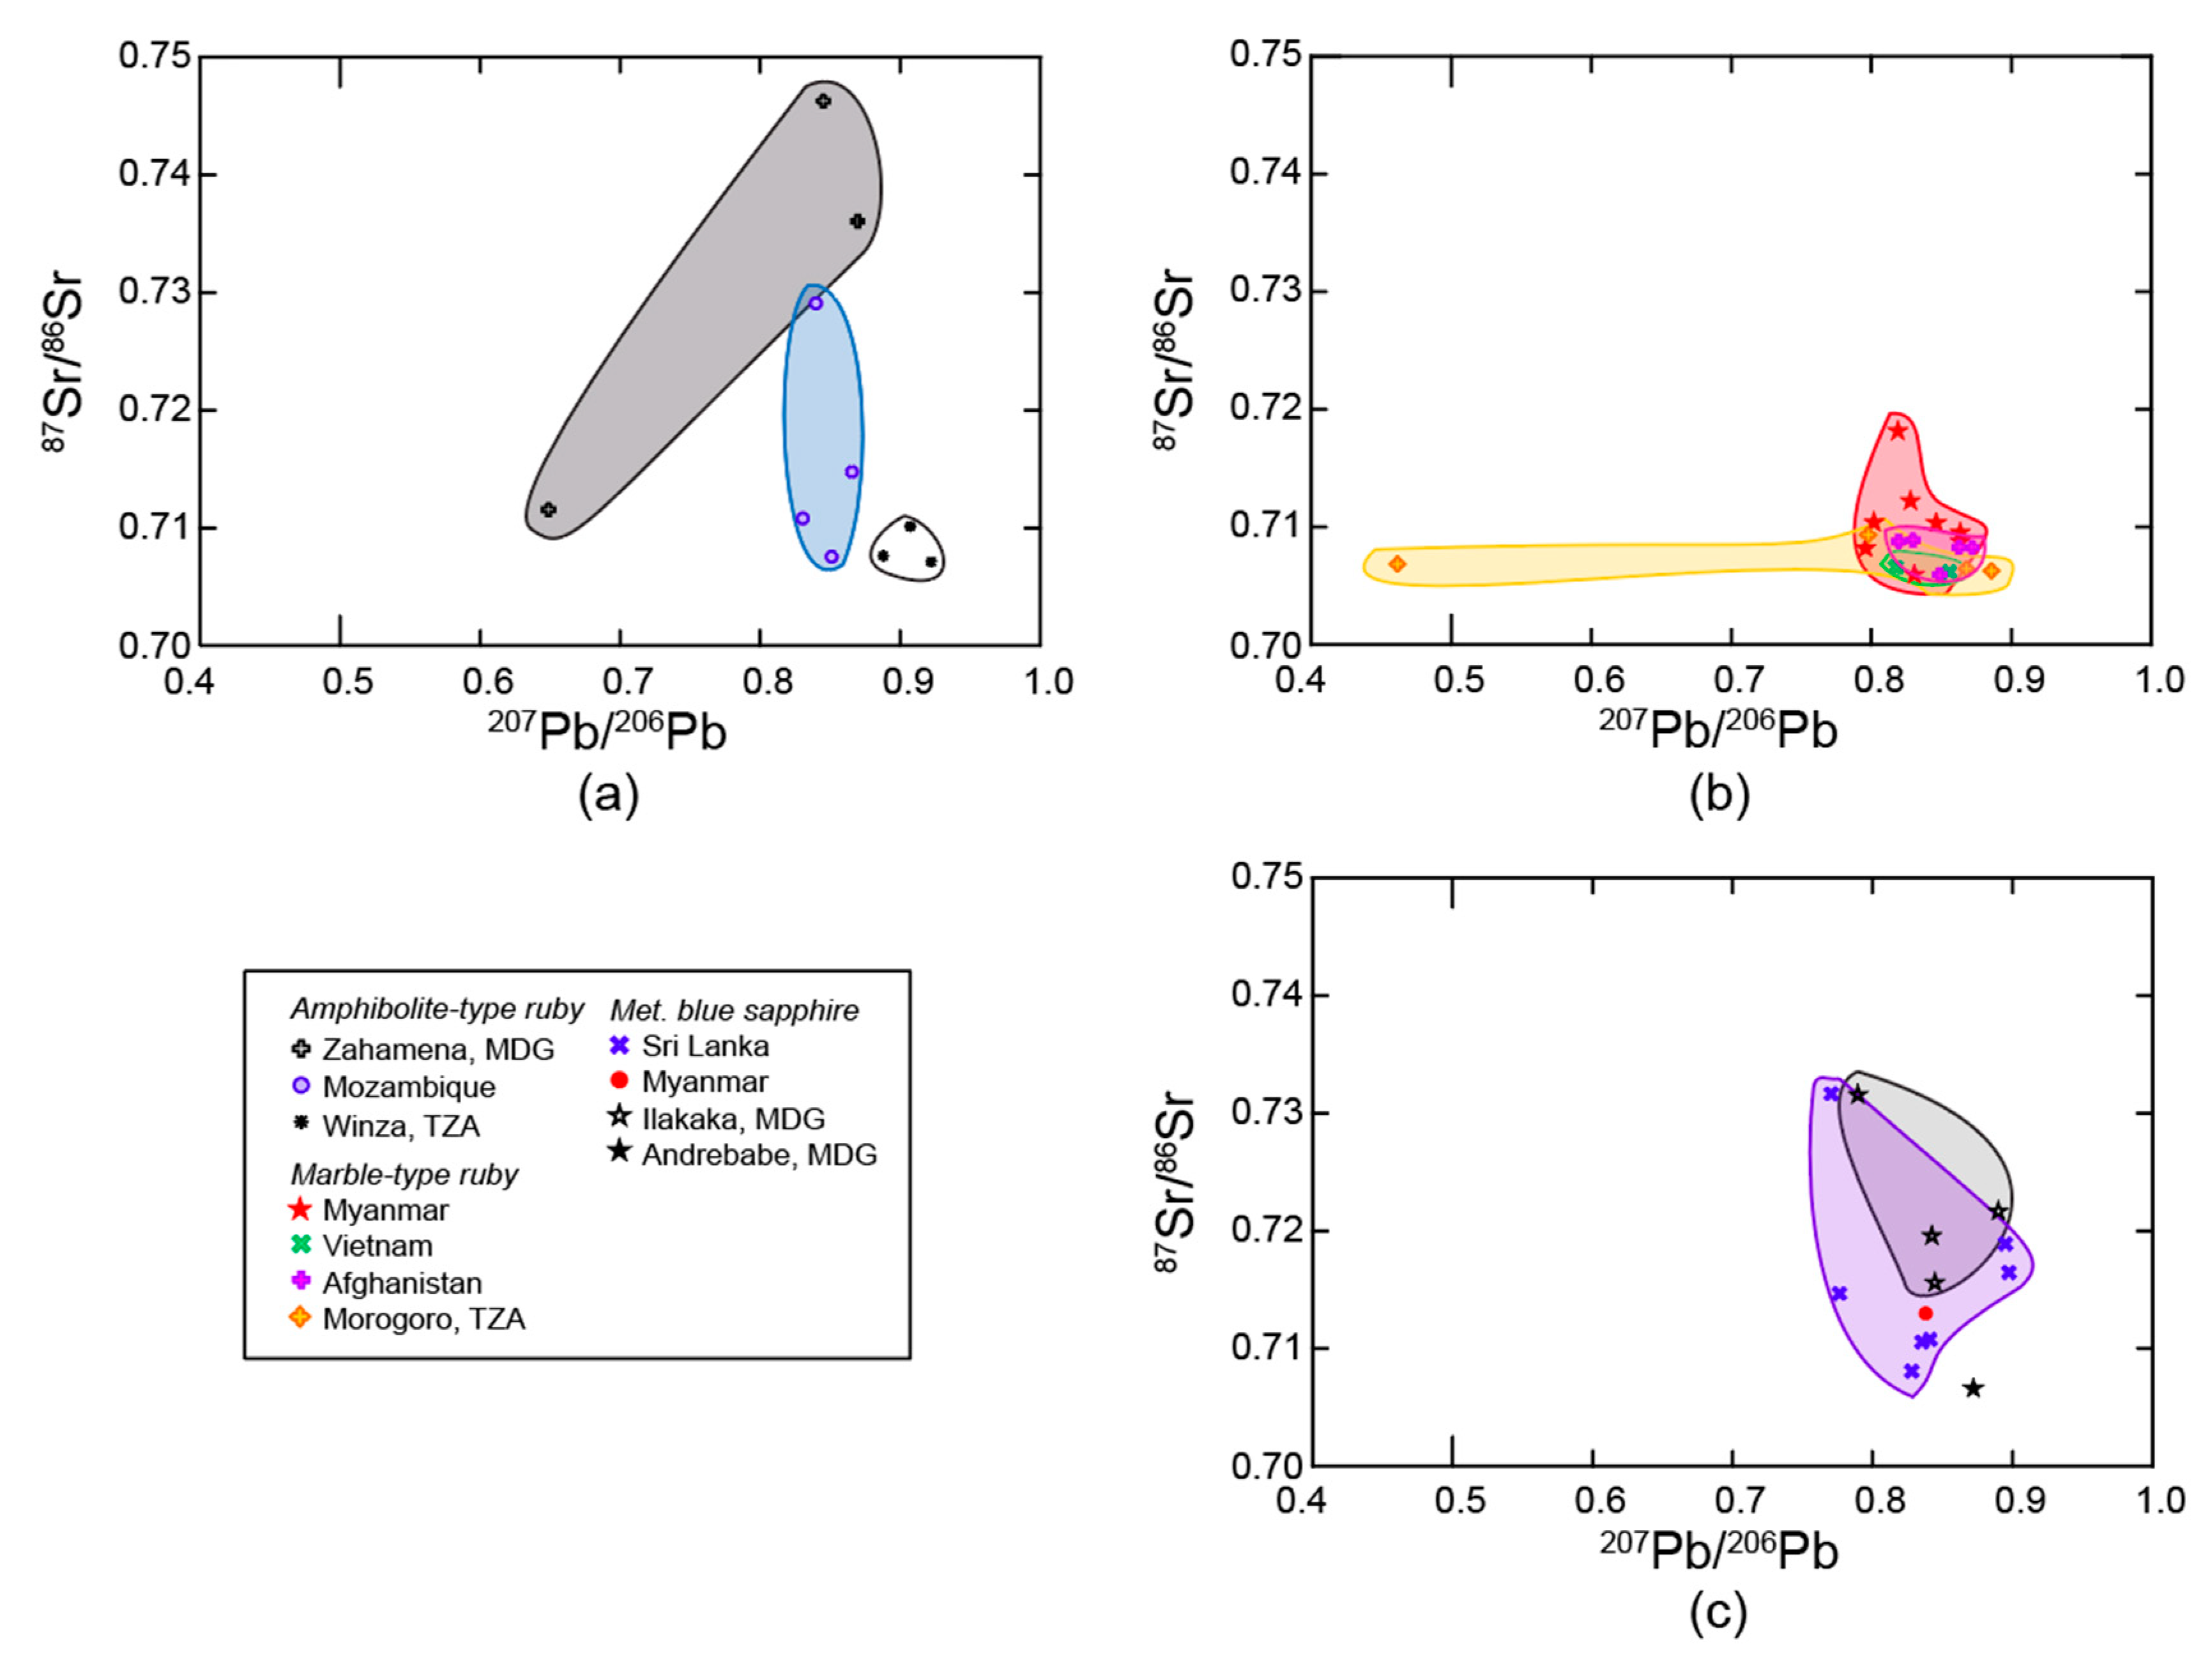
3.2.1. Sr Isotopic Composition
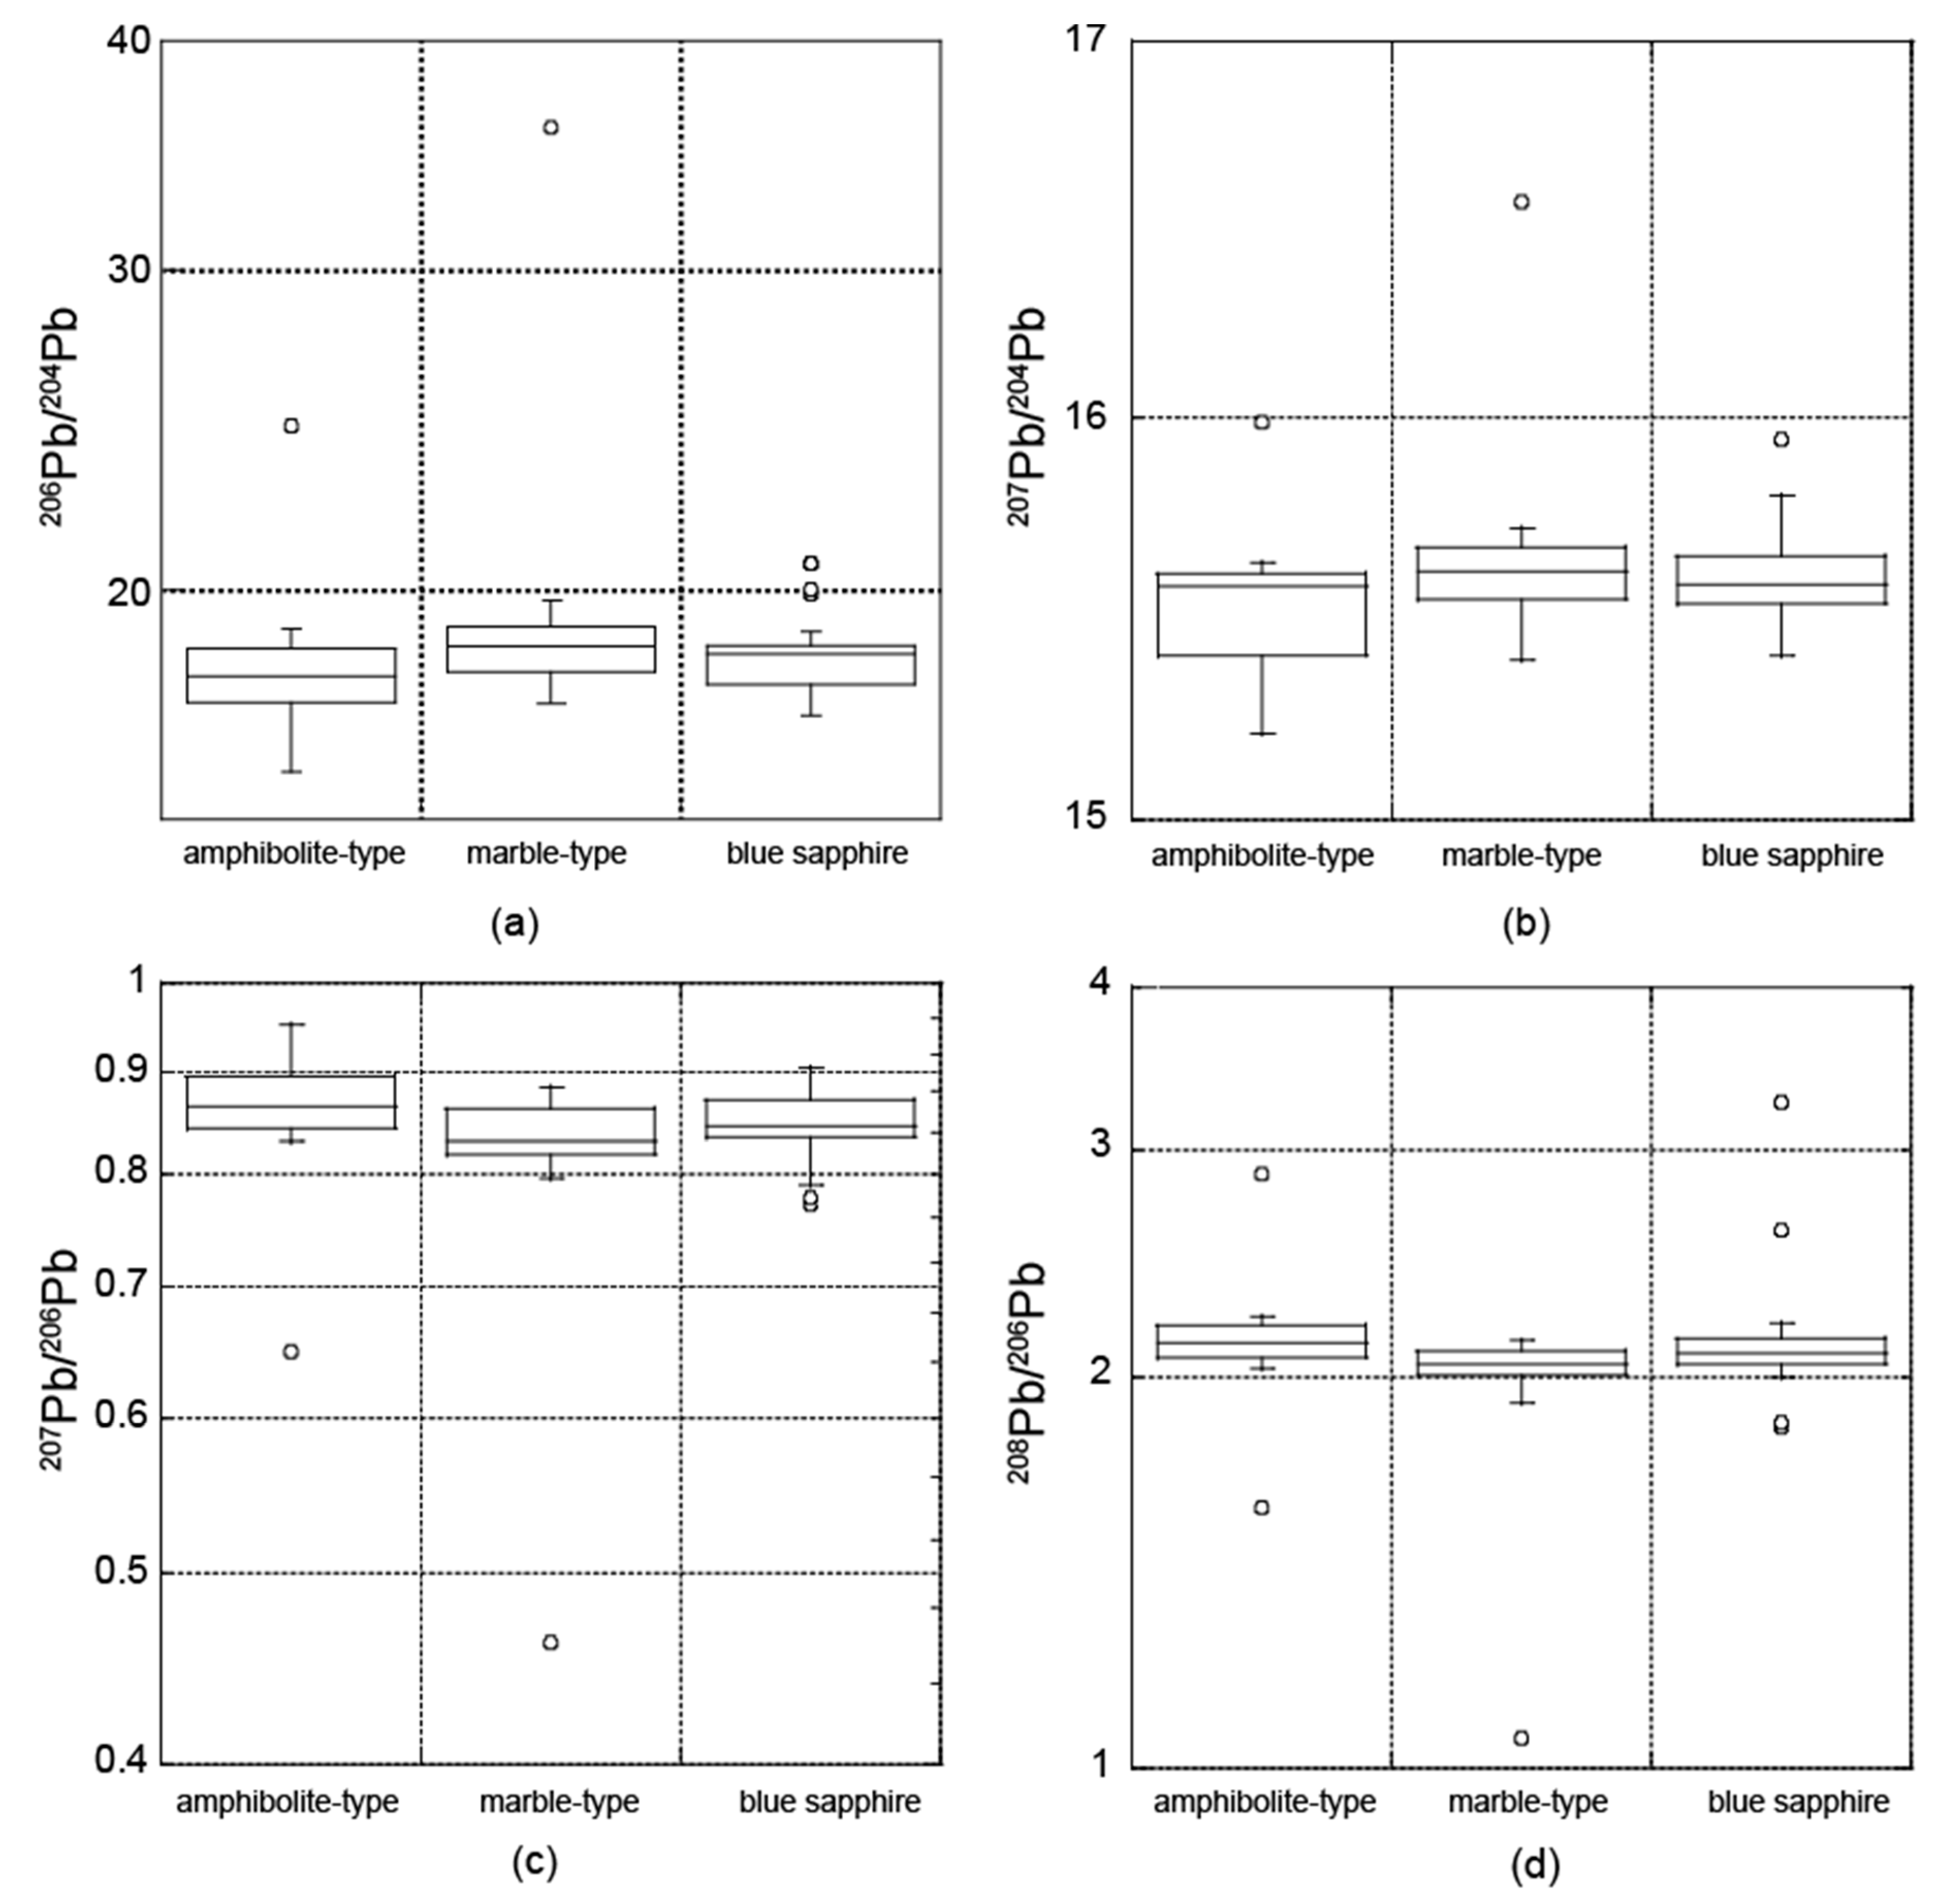
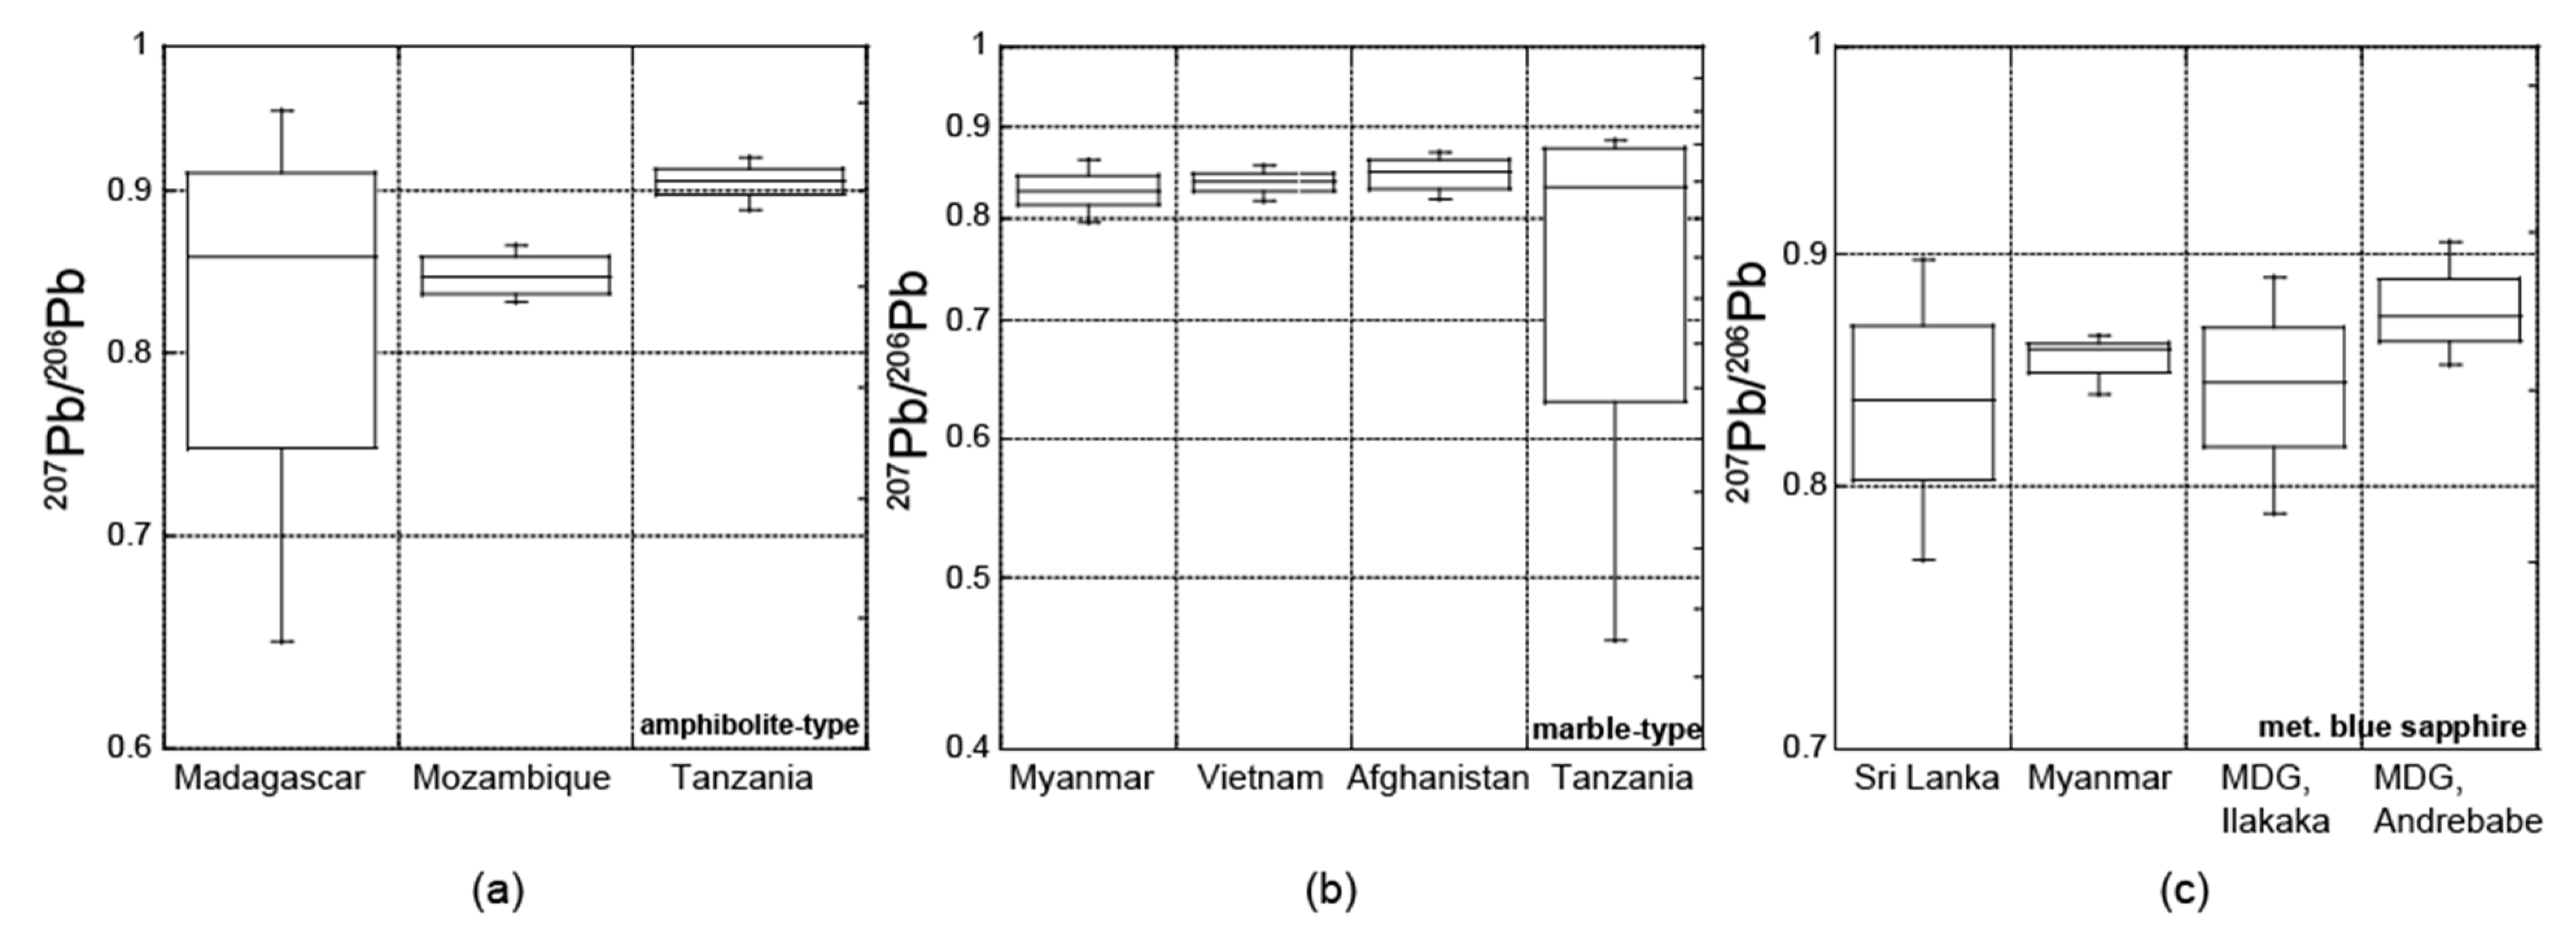
3.2.2. Pb Isotopic Composition
4. Discussion
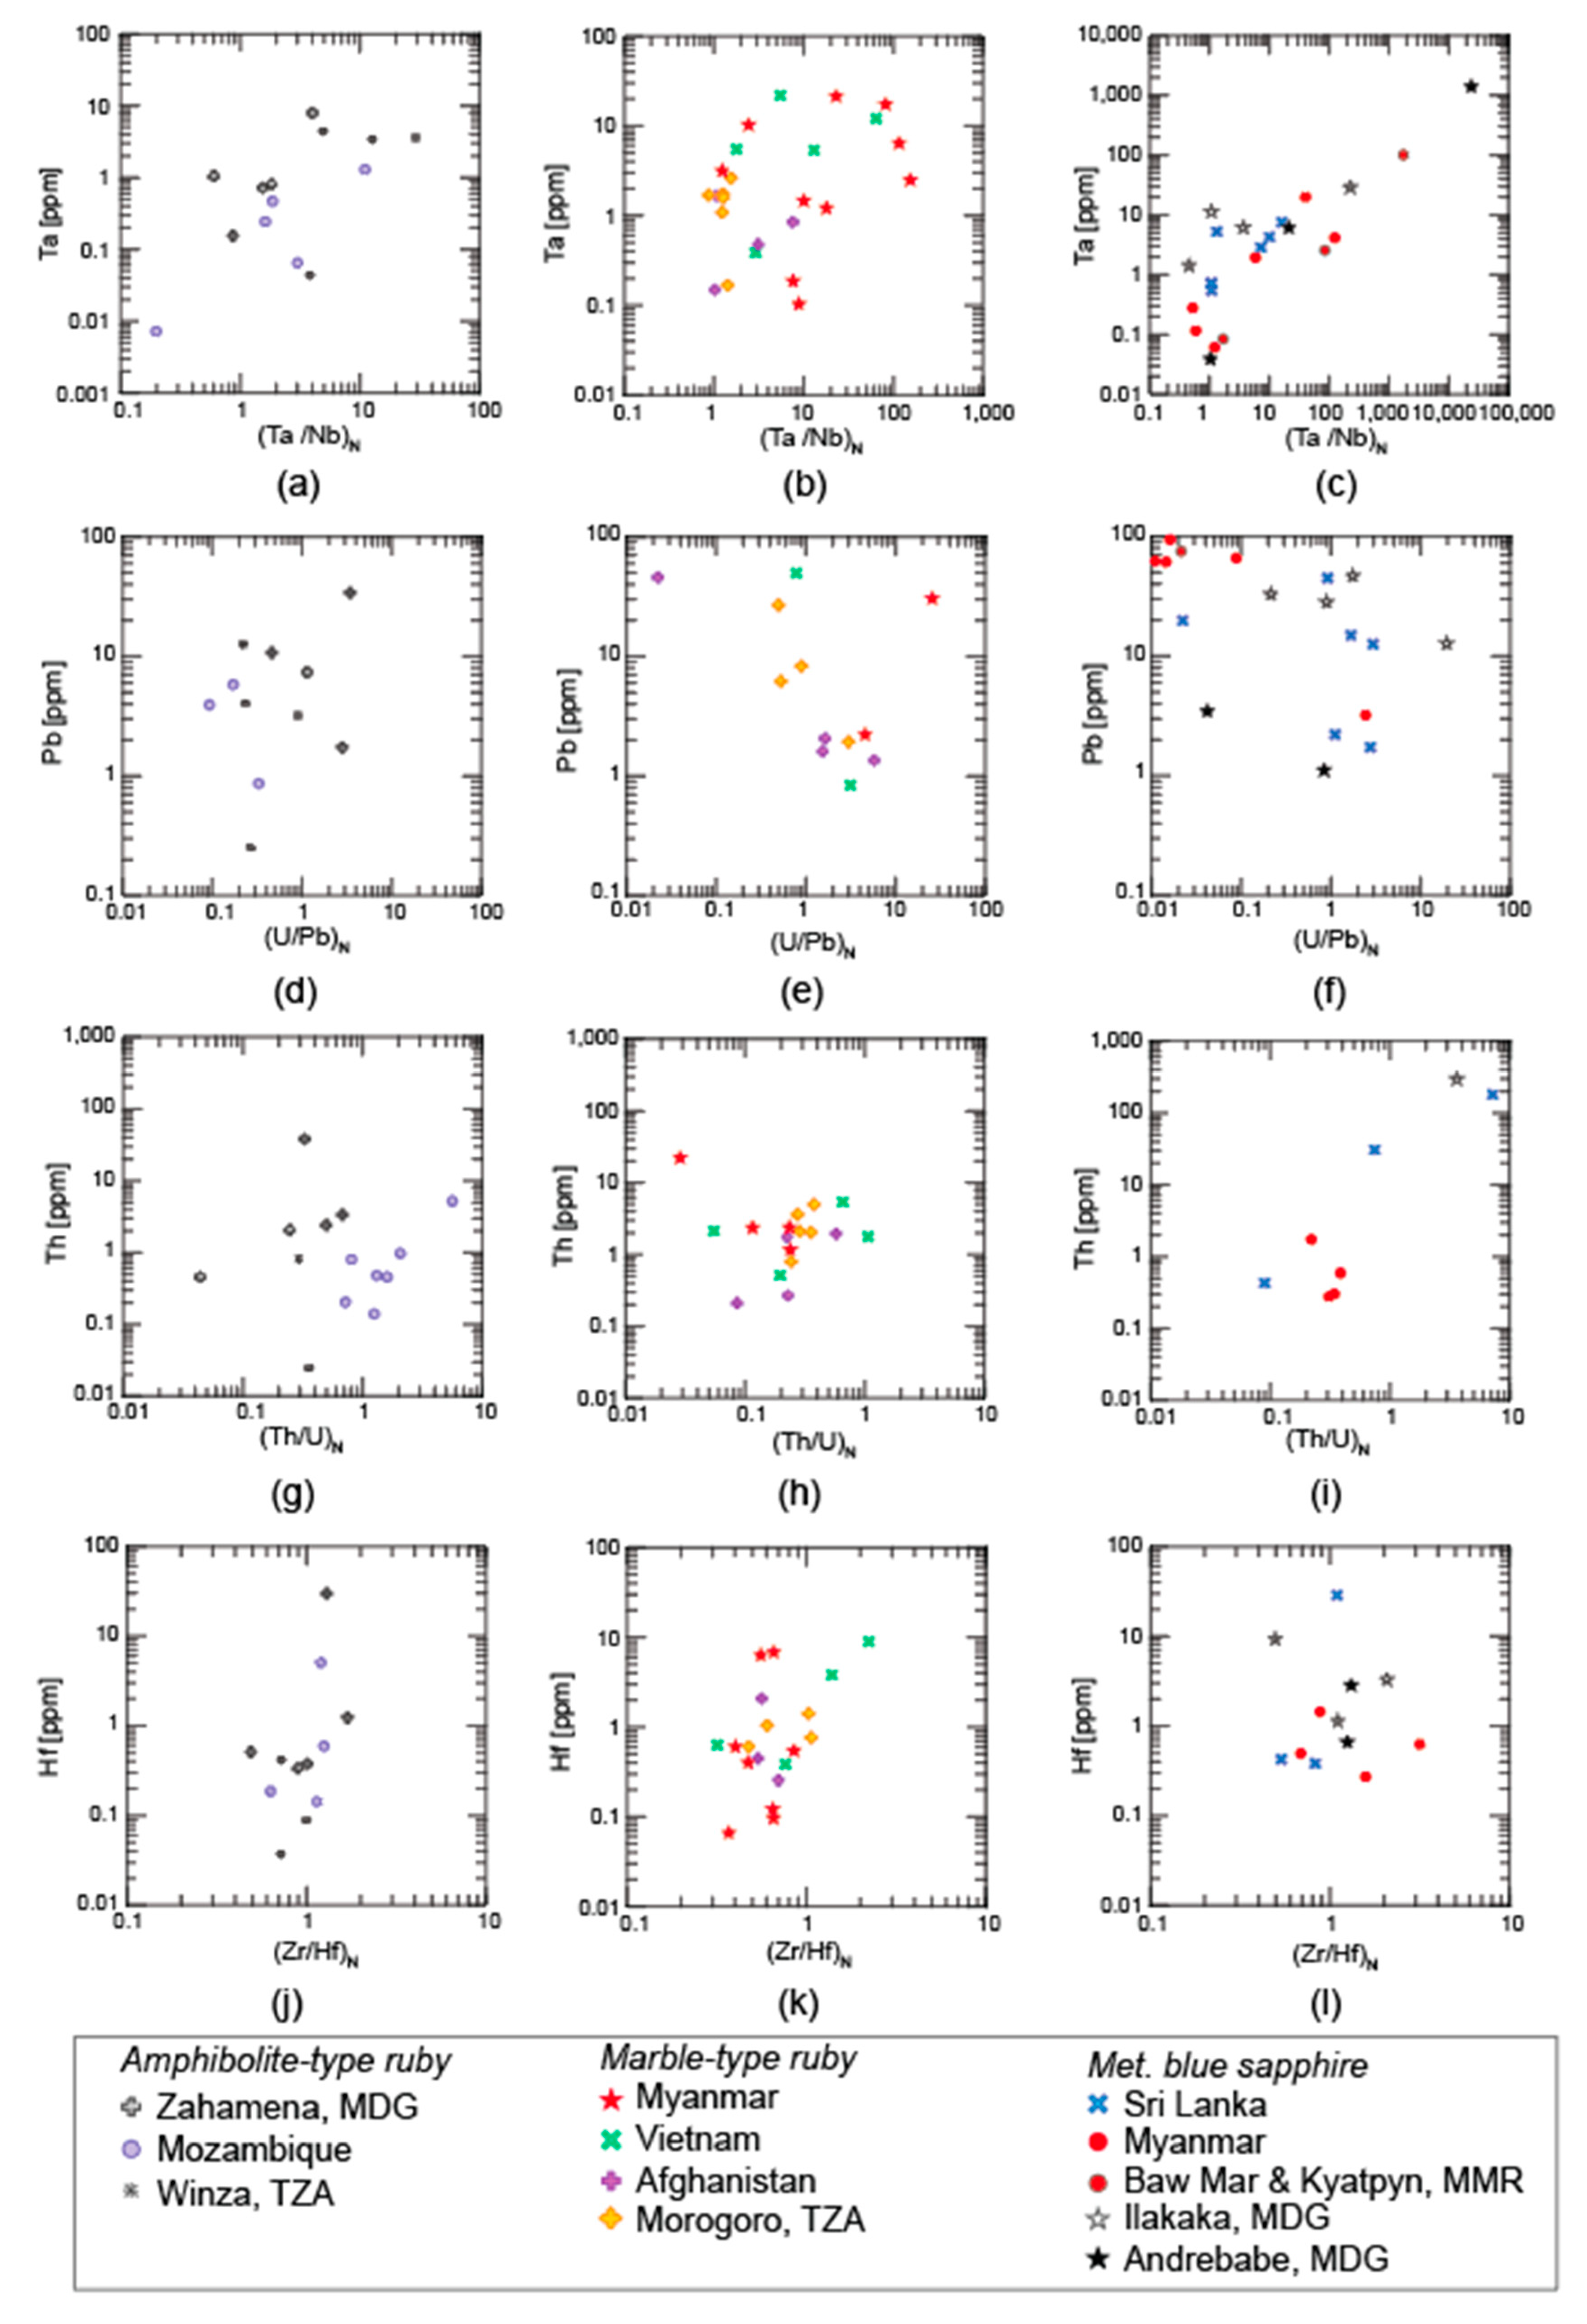
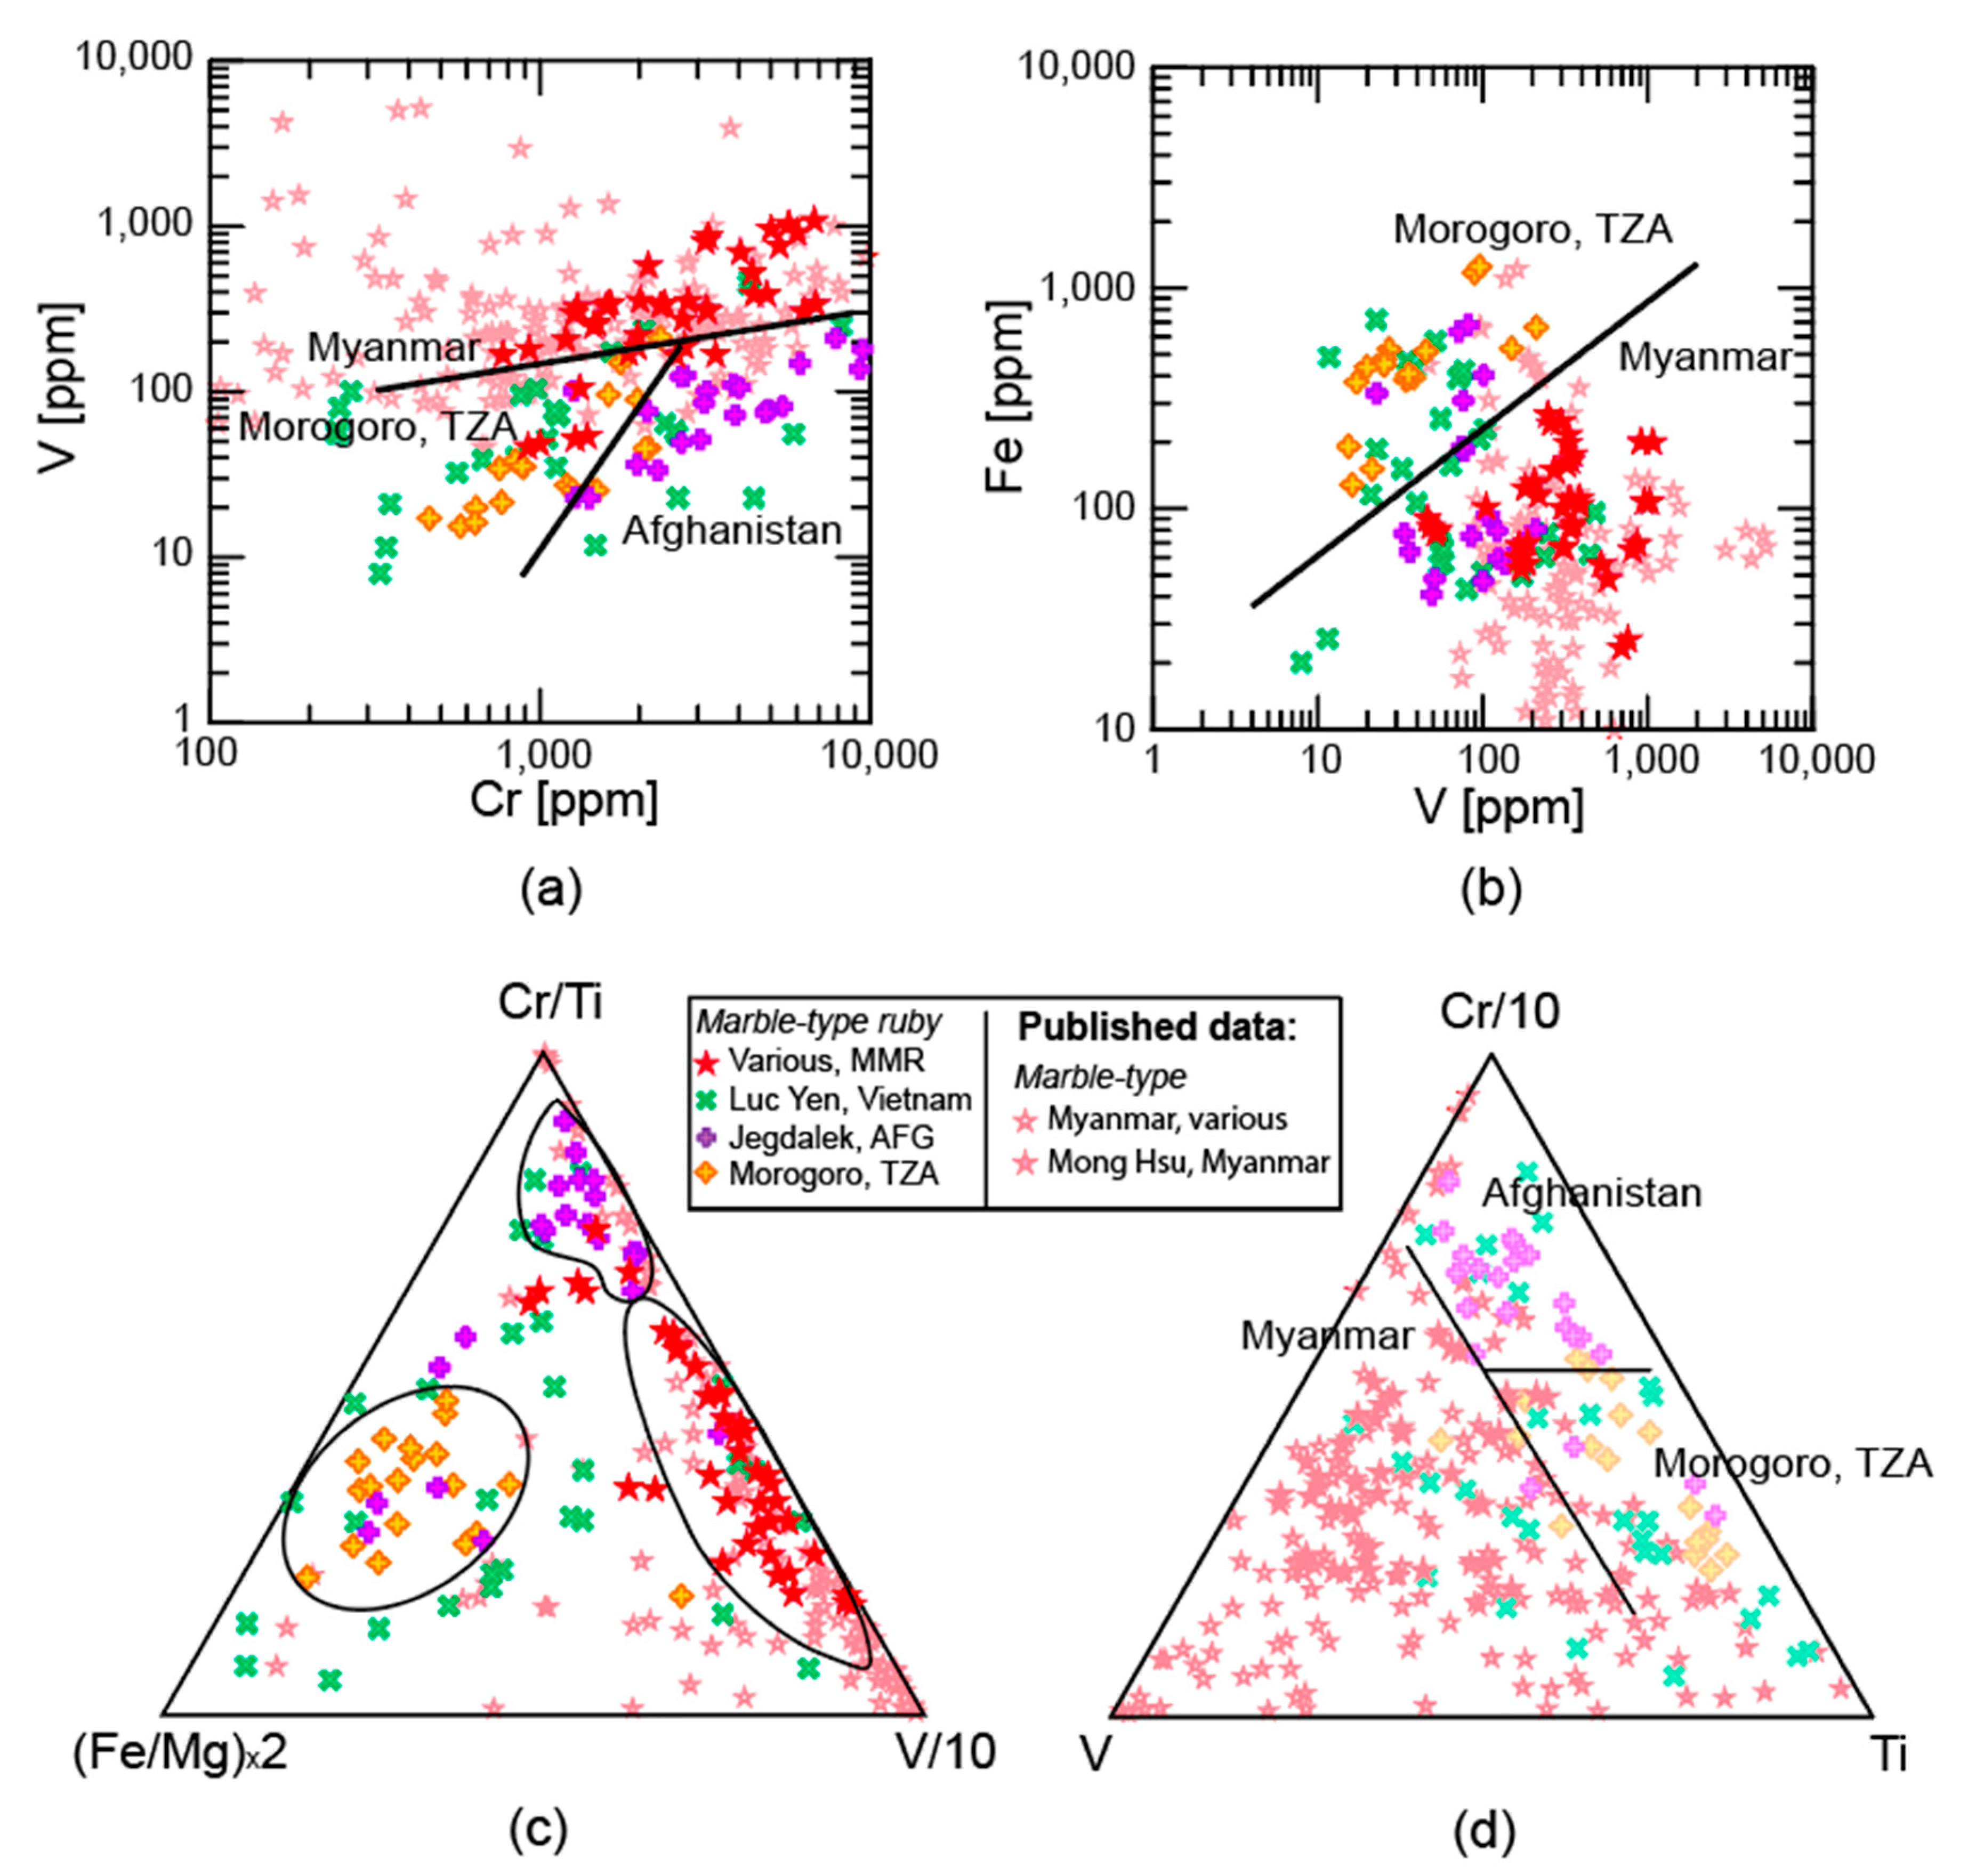
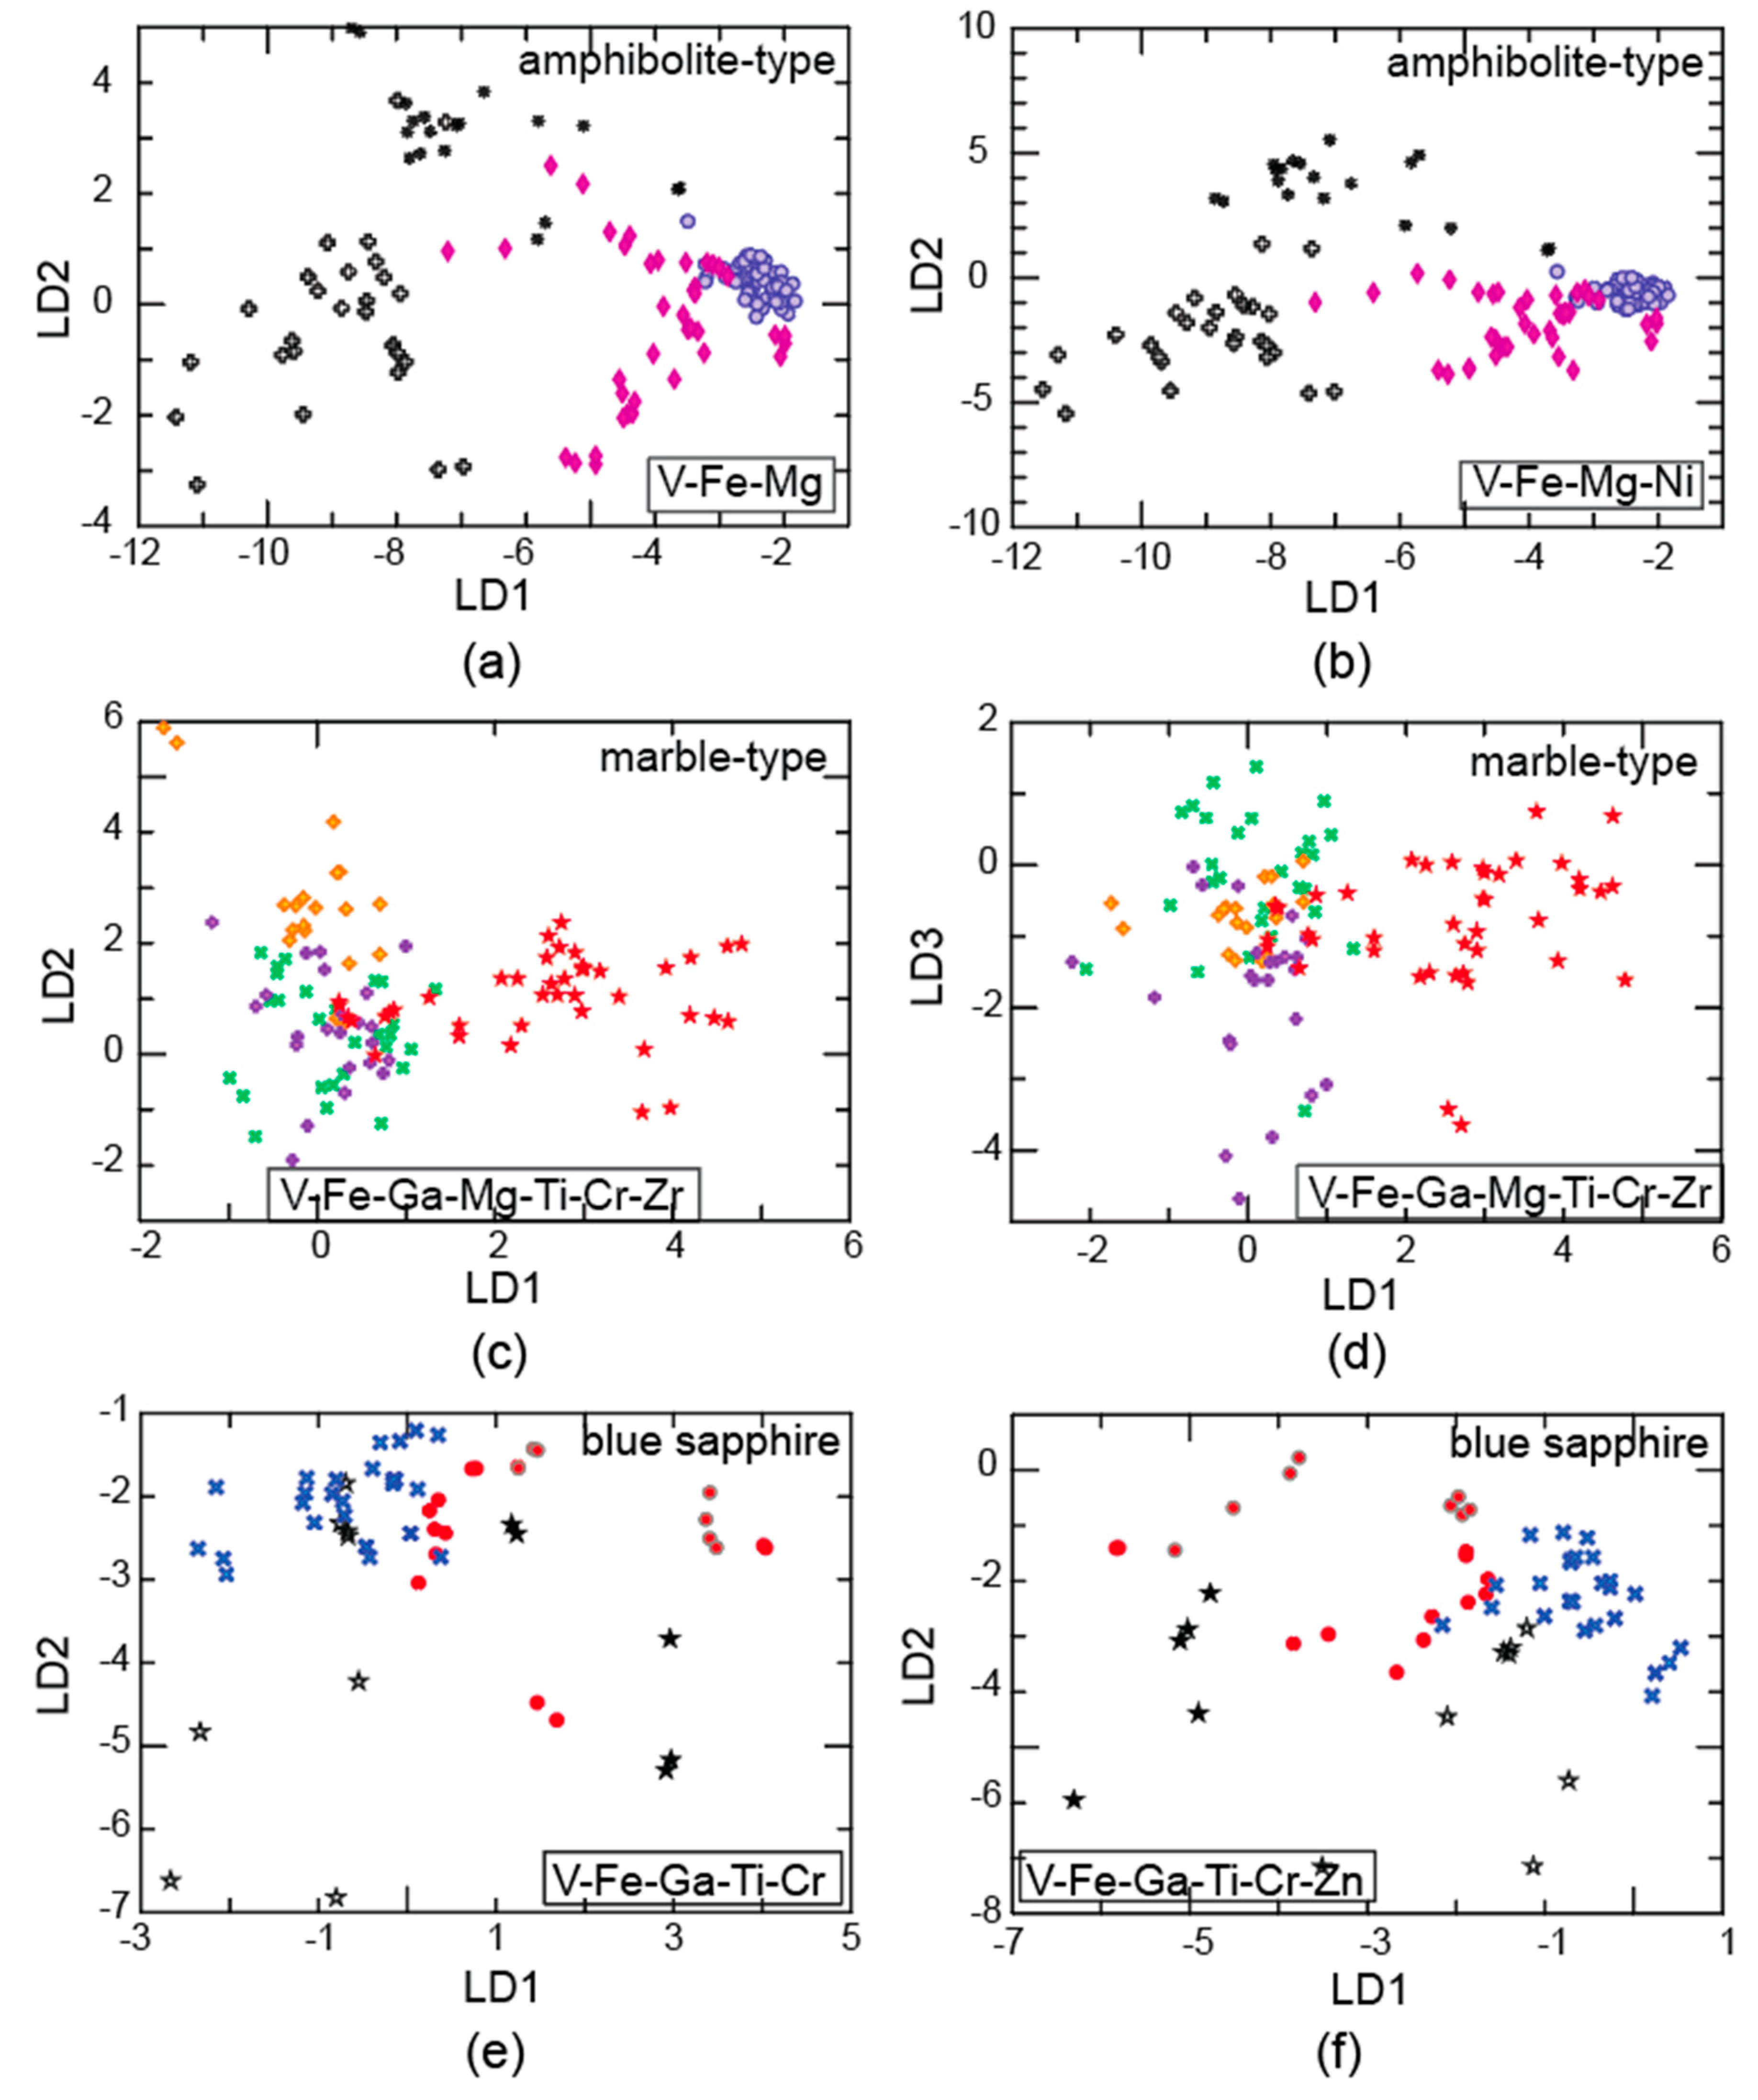
4.1. Trace Elements
Comparison of Online and Offline Laser Ablation Approaches
4.2. Radiogenic Isotopes
5. Conclusions
Supplementary Materials
Author Contributions
Funding
Acknowledgments
Conflicts of Interest
Appendix A


References
- McClure, S.F.; Moses, T.M.; Shigley, J.E. The geographic origin dilemma. Gems Gemol. 2019, 55, 457–462. [Google Scholar]
- Bui, H.A.N.; Fritsch, E.; Rondeau, B. Geographical origin: Branding or science. InColor Mag. 2012, 19, 30–39. [Google Scholar]
- Cartier, L. Environmental stewardship in gemstone mining: Quo vadis? InColor Mag. 2010, 15, 9. [Google Scholar]
- Palke, A.C.; Saeseaw, S.; Renfro, N.D.; Sun, Z.; Mcclure, S.F. Geographic origin determination of blue sapphire. Gems Gemol. 2019, 55, 536–579. [Google Scholar] [CrossRef]
- Palke, A.C.; Saeseaw, S.; Renfro, N.D.; Sun, Z.; Mcclure, S.F. Geographic origin determination of ruby. Gems Gemol. 2019, 55, 580–613. [Google Scholar] [CrossRef]
- The Gübelin Gemological Laboratory. A Holistic Method to Determing Gem Origin. 2006. Available online: https://www.gubelingemlab.com/tl_files/content/03%20Gemmology/Gem%20Lab/Documents/Origin_Article_Sep2006.pdf (accessed on 15 May 2020).
- Giuliani, G.; Fallick, A.E.; Garnier, V.; France-Lanord, C.; Ohnenstetter, D.; Schwarz, D. Oxygen isotope composition as a tracer for the origins of rubies and sapphires. Geology 2005, 33, 249–252. [Google Scholar] [CrossRef]
- Saminpaya, S.; Manning, D.A.C.; Droop, G.T.R.; Henderson, C.N.B. Trace elements in Thai gem corundums. J. Gemmol. 2003, 28, 399–416. [Google Scholar] [CrossRef]
- Abduriyim, A.; Kitawaki, H. Applications of Laser Ablation—Inductively Coupled Plasma—Mass Spectrometry (LA-ICP-MS) to gemology. Gems Gemol. 2006, 42, 98–118. [Google Scholar] [CrossRef]
- Peucat, J.J.; Ruffault, P.; Fritsch, E.; Bouhnik-Le Coz, M.; Simonet, C.; Lasnier, B. Ga/Mg ratio as a new geochemical tool to differentiate magmatic from metamorphic blue sapphires. Lithos 2007, 98, 261–274. [Google Scholar] [CrossRef]
- Graham, I.T.; Sutherland, L.; Zaw, K.; Nechaev, V.; Khanchuk, A. Advances in our understanding of the gem corundum deposits of the West Pacific continental margins intraplate basaltic fields. Ore Geol. Rev. 2008, 34, 200–215. [Google Scholar] [CrossRef]
- Krebs, M.Y.; Pearson, D.G.; Fagan, A.J.; Bussweiler, Y.; Sarkar, C. The application of trace elements and Sr–Pb isotopes to dating and tracing ruby formation: The Aappaluttoq deposit, SW Greenland. Chem. Geol. 2019, 523, 42–58. [Google Scholar] [CrossRef]
- Dickin, A.P. Radiogenic Isotope Geology, 2nd ed.; Cambridge University Press: New York, NY, USA, 2005; ISBN 9780521823166. [Google Scholar]
- Garnier, V.; Giuliani, G.; Ohnenstetter, D.; Schwarz, D. Saphirs et rubis. Classification des gisements de corindon. Règne Minér. 2004, 55, 4–47. [Google Scholar]
- Muhlmeister, S.; Fritsch, E.; Shigley, J.E.; Devouard, B.; Laurs, B.M. Separating natural and synthetic rubies on the basis of trace-element chemistry. Gems Gemol. 1998, 34, 80–101. [Google Scholar] [CrossRef]
- Kievlenko, E.Y. Geology of Gems; Ocean Pictures Ltd.: Littleton, CO, USA, 2003. [Google Scholar]
- Simonet, C.; Fritsch, E.; Lasnier, B. A classification of gem corundum deposits aimed towards gem exploration. Ore Geol. Rev. 2008, 34, 127–133. [Google Scholar] [CrossRef]
- Giuliani, G.; Fallick, A.E.; Rakotondrazafy, M.; Ohnenstetter, D.; Andriamamonjy, A.; Ralantoarison, T.; Rakotosamizanany, S.; Razanatseheno, M.; Offant, Y.; Garnier, V.; et al. Oxygen isotope systematics of gem corundum deposits in Madagascar: Relevance for their geological origin. Miner. Depos. 2007, 42, 251–270. [Google Scholar] [CrossRef]
- Stern, R.J.; Tsujimori, T.; Harlow, G.; Groat, L. Plate tectonic gemstones. Geology 2013, 41, 723–726. [Google Scholar] [CrossRef]
- Giuliani, G.; Ohnenstetter, D.; Fallick, A.E.; Groat, L.A.; Fagan, A.J. The geology and genesis of gem corundum deposits. In Mineralogical Association of Canada Short Course; Mineralogical Association of Canada: Québec, QC, Canada, 2014; Volume 44, pp. 29–112. [Google Scholar]
- Harlan, S.S. Timing of emplacement of the sapphire-bearing Yogo Dike, Little Belt Mountains, Montana. Econ. Geol. 1996, 91, 1159–1162. [Google Scholar] [CrossRef]
- Vertriest, W.; Palke, A.C.; Renfro, N.D. Field gemology: Building a research collection and understanding the development of gem deposits. Gems Gemol. 2019, 55, 490–511. [Google Scholar] [CrossRef]
- Pardieu, V.; Sangsawong, S.; Muyal, J.; Chauviré, B.; Massi, L.; Sturman, N. Rubies from the Montepuez area (Mozambique). GIA News; Bangkok, Thailand, 2013. Available online: https://www.gia.edu/doc/GIA_Ruby_Montepuez_Mozambique.pdf (accessed on 10 May 2020).
- Peretti, A.; Peretti, F.; Kanpraphai, A.; Bieri, W.P.; Mametner, K.; Guenther, D. Winza Rubies Identified, 2nd ed.; Peretti, A., Ed.; GRS Gem Research Swisslab: Lucerne, Switzerland, 2008; ISBN 9783952335970. [Google Scholar]
- Schwarz, D.; Pardieu, V.; Saul, J.M.; Schmetzer, K.; Laurs, B.M.; Giuliani, G.; Klemm, L.; Malsy, A.; Erel, E.; Hauzenberger, C.; et al. Rubies and sapphires from Winza, Central Tanzania. Gems Gemol. 2008, 44, 322–347. [Google Scholar] [CrossRef]
- Pardieu, V.; Sangsawong, S.; Detroyat, S. Rubies from a new deposit in zahamena national park, Madagascar. Gems Gemol. 2015, 51, 454–456. [Google Scholar]
- Rakotondrazafy, A.F.M.; Giuliani, G.; Ohnenstetter, D.; Fallick, A.E.; Rakotosamizanany, S.; Andriamamonjy, A.; Ralantoarison, T.; Razanatseheno, M.; Offant, Y.; Garnier, V.; et al. Gem corundum deposits of Madagascar: A review. Ore Geol. Rev. 2008, 34, 134–154. [Google Scholar] [CrossRef]
- Smith, C.P. Ruby and pink sapphire from Aappaluttoq, Greenland. J. Gemmol. 2016, 35, 294–306. [Google Scholar] [CrossRef]
- Keulen, N.; Kalvig, P. Fingerprinting of corundum (ruby) from Fiskenaesset, West Greenland. Geol. Surv. Den. Greenl. Bull. 2013, 28, 53–56. [Google Scholar] [CrossRef]
- Fagan, A.J. The Ruby and Pink Sapphire Deposits of SW Greenland: Geological Setting, Genesis, and Exploration Techniques. Ph.D. Thesis, The University of British Columbia, Vancouver, BC, Canada, 2018. [Google Scholar]
- Fanka, A.; Sutthirat, C. Petrochemistry, mineral chemistry, and pressure—Temperature model of corundum-bearing amphibolite from Montepuez, Mozambique. Arab. J. Sci. Eng. 2018, 43, 3751–3767. [Google Scholar] [CrossRef]
- Bowersox, G.W.; Foord, E.E.; Laurs, B.M.; Shigley, J.E.; Smith, C.P. Ruby and sapphire from Jegdalek, Afghanistan. Gems Gemol. 2000, 36, 110–126. [Google Scholar] [CrossRef]
- Harlow, G.E.; Bender, W. A study of ruby (corundum) compositions from the Mogok Belt, Myanmar: Searching for chemical fingerprints. Am. Miner. 2013, 98, 1120–1132. [Google Scholar] [CrossRef]
- Van Long, P.; Giuliani, G.; Fallick, A.E.; Boyce, A.J.; Pardieu, V. Trace elements and oxygen isotopes of gem spinels in marble from the Luc Yen—An Phu areas, Yen Bai province, North Vietnam. Vietnam J. Earth Sci. 2018, 40, 166–179. [Google Scholar]
- Van Long, P.; Vinh, H.Q.; Garnier, V.; Giuliani, G.; Ohnenstetter, D.; Lhomme, T.; Schwarz, D.; Fallick, A.E.; Dubessy, J.; Trinh, P.T.; et al. Gem corundum deposits in Vietnam. J. Gemmol. 2004, 29, 129–147. [Google Scholar] [CrossRef]
- Garnier, V.; Giuliani, G.; Ohnenstetter, D.; Fallick, A.E.; Dubessy, J.; Banks, D.; Vinh, H.Q.; Lhomme, T.; Maluski, H.; Pêcher, A.; et al. Marble-hosted ruby deposits from Central and Southeast Asia: Towards a new genetic model. Ore Geol. Rev. 2008, 34, 169–191. [Google Scholar] [CrossRef]
- Haenni, H.A.; Schmetzer, K. New rubies from the Morogoro area, Tanzania. Gems Gemol. 1991, 27, 156–167. [Google Scholar] [CrossRef]
- Balmer, W.A.; Hauzenberger, C.A.; Fritz, H.; Sutthirat, C. Marble-hosted ruby deposits of the Morogoro Region, Tanzania. J. Afr. Earth Sci. 2017, 134, 626–643. [Google Scholar] [CrossRef]
- Kan-Nyunt, H.P.; Karampelas, S.; Link, K.; Thu, K.; Kiefert, L.; Hardy, P. Blue sapphires from the Baw Mar mine in Mogok. Gems Gemol. 2013, 49, 223–232. [Google Scholar] [CrossRef]
- Hughes, E.B.; Perkins, R. Madagascar sapphire: Low-temperature heat treatment experiments. Gems Gemol. 2019, 55, 184–196. [Google Scholar] [CrossRef]
- Guznawardenea, M.; Rupasinghe, M.S. The elahera gem field in Central Sri Lanka. Gems Gemol. 1986, 22, 80–95. [Google Scholar] [CrossRef]
- Atikarnsakul, U.; Vertriest, W.; Soonthorntantikul, W. Characterization of Blue Sapphires from the Mogok Stone Tract, Mandalay Region, Burma (Myanmar). GIA News. 19 June 2018, pp. 1–56. Available online: https://www.gia.edu/doc/Characterization-of-blue-sapphires-from-the-Mogok-Stone-Tract-Mandalay-region-Burma-Myanmar.pdf (accessed on 10 May 2020).
- Soonthorntantikul, W.; Vertriest, W.; Raynaud-flattot, V.L.; Sangsawong, S. An in-Depth Gemological Study of Blue Sapphires From the Baw Mar Mine (Mogok, Myanmar); GIA: Bangkok, Thailand, 2017. [Google Scholar]
- Milisenda, C.C.; Henn, U.; Henn, J. New gemstone occurrences in the south-west of Madagascar. J. Gemmol. 2001, 27, 385–394. [Google Scholar] [CrossRef]
- Pardieu, V.; Rakotosaona, N. Ruby and Sapphire Rush Near Didy, Madagascar (April–June 2012); GIA: Bangkok, Thailand, 2012. [Google Scholar]
- Dissanayake, C.B.; Chandrajith, R.; Tobschall, H.J. The geology, mineralogy and rare element geochemistry of the gem deposits of Sri Lanka. Bull. Geol. Soc. Finl. 2000, 72, 5–20. [Google Scholar] [CrossRef]
- Pardieu, V.; Sangsawong, S.; Vertriest, W.; Detroyat, S.; Raynaud, V.; Engniwat, S. Blue sapphires from a new deposit near Andranondambo, Madagascar. Gems Gemmol. 2016, 52, 96–97. [Google Scholar]
- Schwarz, D.; Petsch, E.J.; Kanis, J. Sapphires from the Andranondambo Region, Madagascar. Gems Gemol. 1996, 32, 80–99. [Google Scholar] [CrossRef]
- Stone-Sundberg, J.; Thomas, T.; Sun, Z.; Guan, Y.; Cole, Z.; Equall, R.; Emmett, J.L. Accurate reporting of key trace elements in ruby and sapphire using matrix-matched standards. Gems Gemol. 2017, 53, 438–451. [Google Scholar] [CrossRef]
- Paton, C.; Hellstrom, J.; Paul, B.; Woodhead, J.; Hergt, J. Iolite: Freeware for the visualisation and processing of mass spectrometric data. J. Anal. At. Spectrom. 2011, 26, 2508. [Google Scholar] [CrossRef]
- McNeill, J.; Pearson, D.G.; Klein-Bendavid, O.; Nowell, G.M.; Ottley, C.J.; Chinn, I. Quantitative analysis of trace element concentrations in some gem-quality diamonds. J. Phys. Condens. Matter 2009, 21, 364207. [Google Scholar] [CrossRef]
- Klein-BenDavid, O.; Pearson, D.G.; Nowell, G.M.; Ottley, C.; McNeill, J.C.R.; Cartigny, P. Mixed fluid sources involved in diamond growth constrained by Sr-Nd-Pb-C-N isotopes and trace elements. Earth Planet. Sci. Lett. 2010, 289, 123–133. [Google Scholar] [CrossRef]
- Krebs, M.Y.; Pearson, D.G.; Stachel, T.; Laiginhas, F.; Woodland, S.; Chinn, I.; Kong, J. A common parentage-low abundance trace element data of gem diamonds reveals similar fluids to fibrous diamonds. Lithos 2019, 324–325. [Google Scholar] [CrossRef]
- Charlier, B.L.A.; Ginibre, C.; Morgan, D.; Nowell, G.M.; Pearson, D.G.; Davidson, J.P.; Ottley, C.J. Methods for the microsampling and high-precision analysis of strontium and rubidium isotopes at single crystal scale for petrological and geochronological applications. Chem. Geol. 2006, 232, 114–133. [Google Scholar] [CrossRef]
- Harlou, R.; Pearson, D.G.; Nowell, G.M.; Ottley, C.J.; Davidson, J.P. Combined Sr isotope and trace element analysis of melt inclusions at sub-ng levels using micro-milling, TIMS and ICPMS. Chem. Geol. 2009, 260, 254–268. [Google Scholar] [CrossRef]
- Sarkar, C.; Pearson, D.G.; Heaman, L.M.; Woodland, S.J. Precise Pb isotope ratio determination of picogram-size samples: A comparison between multiple Faraday collectors equipped with 1012Ω amplifiers and multiple ion counters. Chem. Geol. 2015, 395, 27–40. [Google Scholar] [CrossRef]
- Todt, W.; Cliff, R.A.; Hanser, A.; Hofmann, A.W. Evaluation of a 202Pb–205Pb double spike for high-precision lead isotope analysis. In Earth Processes: Reading the Isotopic Code; Basu, A., Hart, S.R., Eds.; American Geophysical Union Geophysical Monograph: Washington, DC, USA, 1996; pp. 429–437. [Google Scholar]
- McDonough, W.F.; Sun, S.-S. The composition of the earth. Chem. Geol. 1995, 120, 223–253. [Google Scholar] [CrossRef]
- Pornwilard, M.M.; Hansawek, R.; Shiowatana, J.; Siripinyanond, A. Geographical origin classification of gem corundum using elemental fingerprint analysis by laser ablation inductively coupled plasma mass spectrometry. Int. J. Mass Spectrom. 2011, 306, 57–62. [Google Scholar]
- Sutherland, F.; Zaw, K.; Meffre, S.; Yui, T.-F.; Thu, K. Advances in trace element “Fingerprinting” of gem corundum, ruby and sapphire, Mogok Area, Myanmar. Minerals 2014, 5, 61–79. [Google Scholar] [CrossRef]
- Sutherland, F.L.; Abduriyim, A. Geographic typing of gem corundum: A test case from Australia. J. Gemmol. 2009, 31, 203–210. [Google Scholar] [CrossRef]
- Sutherland, F.; Zaw, K.; Meffre, S.; Thompson, J.; Goemann, K.; Thu, K.; Nu, T.; Zin, M.; Harris, S. Diversity in ruby geochemistry and its inclusions: Intra- and inter-continental comparisons from Myanmar and Eastern Australia. Minerals 2019, 9, 28. [Google Scholar] [CrossRef]
- Sutherland, F.L.; Zaw, K.; Meffre, S.; Giuliani, G.; Fallick, A.E.; Graham, I.T.; Webb, G.B. Gem-corundum megacrysts from east Australian basalt fields: Trace elements, oxygen isotopes and origins. Aust. J. Earth Sci. 2009, 56, 1003–1022. [Google Scholar] [CrossRef]
- Zaw, K.; Sutherland, L.; Yui, T.F.; Meffre, S.; Thu, K. Vanadium-rich ruby and sapphire within Mogok Gemfield, Myanmar: Implications for gem color and genesis. Miner. Depos. 2014, 50, 25–39. [Google Scholar] [CrossRef]
- Sutherland, F.L.; Piilonen, P.C.; Zaw, K.; Meffre, S.; Thompson, J. Sapphire within zircon-rich gem deposits, Bo Loei, Ratanakiri Province, Cambodia: Trace elements, inclusions, U–Pb dating and genesis. Aust. J. Earth Sci. 2015, 62, 761–773. [Google Scholar]
- Sutherland, F.L.; Graham, I.T.; Harris, S.J.; Coldham, T.; Powell, W.; Belousova, E.A.; Martin, L. Unusual ruby–sapphire transition in alluvial megacrysts, Cenozoic basaltic gem field, New England, New South Wales, Australia. Lithos 2017, 278–281, 347–360. [Google Scholar] [CrossRef]
- Sorokina, E.S.; Rassomakhin, M.A.; Nikandrov, S.N.; Karampelas, S.; Kononkova, N.N.; Nikolaev, A.G.; Anosova, M.O.; Somsikova, A.V.; Kostitsyn, Y.A.; Kotlyarov, V.A.; et al. Origin of blue sapphire in newly discovered spinel–chlorite–muscovite rocks within meta-ultramafites of ilmen mountains, South Urals of Russia: Evidence from mineralogy, geochemistry, RB-SR and Sm-Nd isotopic data. Minerals 2019, 9, 36. [Google Scholar] [CrossRef]
- Graham, I.T.; Harris, S.J.; Martin, L.; Lay, A.; Zappettini, E. Enigmatic alluvial sapphires from the Orosmayo Region, Jujuy Province, Northwest Argentina: Insights into their origin from in situ oxygen isotopes. Minerals 2019, 9, 390. [Google Scholar] [CrossRef]
- Cartier, L.E. Ruby and sapphire from Marosely, Madagascar. J. Gemmol. 2009, 31, 171–180. [Google Scholar] [CrossRef]
- Baldwin, L.C.; Ballhaus, F.T.C.; Fonseca, A.G.R.O.C. Petrogenesis of alkaline basalt-hosted sapphire megacrysts. Petrological and geochemical investigations of in situ sapphire occurrences from the Siebengebirge Volcanic Field, Germany. Contrib. Miner. Pet. 2017, 172, 1–27. [Google Scholar] [CrossRef]
- Guillong, M.; Günther, D. Quasi “non-destructive” laser ablation-inductively coupled plasma-mass spectrometry fingerprinting of sapphires. Spectrochim. Acta-Part B At. Spectrosc. 2001, 56, 1219–1231. [Google Scholar] [CrossRef]
- Boyd, R.; Nordgulen, O.; Thomas, R.J.; Bingen, B.; Bjerkgård, T.; Grenne, T.; Henderson, I.; Melezhik, V.A.; Often, M.; Sandstad, J.S.; et al. The geology and geochemistry of the East African orogen in northeastern Mozambique. S. Afr. J. Geol. 2010, 113, 87–129. [Google Scholar] [CrossRef]
- Barley, M.E.; Pickard, A.L.; Zaw, K.; Rak, P.; Doyle, M.G. Jurassic to Miocene magmatism and metamorphism in the Mogok metamorphic belt and the India-Eurasia collision in Myanmar. Tectonics 2003, 22, 22. [Google Scholar] [CrossRef]
- Searle, M.P.; Noble, S.R.; Cottle, J.M.; Waters, D.J.; Mitchell, A.H.G.; Hlaing, T.; Horstwood, M.S.A. Tectonic evolution of the Mogok metamorphic belt, Burma (Myanmar) constrained by U-Th-Pb dating of metamorphic and magmatic rocks. Tectonics 2007, 26, 26. [Google Scholar] [CrossRef]
- Silva, K.K.M.W.; Siriwardena, C.H.E.R. Geology and the origin of the corundum-bearing skarn at Bakamuna, Sri Lanka. Miner. Depos. 1988, 23, 186–190. [Google Scholar] [CrossRef]
- Thu, K. The Igneous Rocks of the Mogok Stone Tract. Ph.D. Thesis, University of Yangon, Yangon, Myanmar, 2007. [Google Scholar]


| Sample ID | Country of Origin | Location | Color | N |
|---|---|---|---|---|
| Amphibolite-type ruby deposits | ||||
| MozX_X | Mozambique (MOZ) | Montepuez, Namahaca Deposit | Pale pink–red | 27 |
| AD402, AD403, AD406-408, AD410, AD413, AD432, AD435, AD442 | Tanzania (TZA) | Winza | red | 10 |
| 1968, 1986, 1994, 1996, 2006, 2008, 2048, 2049 | Madagascar (MDG) | Andilamena/Zahamena mining area | Red–purplish red | 8 |
| A-37145a–c, A-36928a–b, A-91729 | Madagascar (MDG) | Ampanihy, Toliara | red | 6 |
| Marble-hosted ruby deposits | ||||
| M_112701-1–4 1; M_110599-1–4 2; (M_42103-1–2, 0469, 2306, 2307, 9233, 9239) 3; M_107637 4; M_109274-1–4 5 | Myanmar (MMR) | Mandalay Region: 1 Sagyin, 2 Wet Loo, 3 Mogok Stone Tract, 4 Dattaw 5 Kachin State: Namya | Pink–red | 21 |
| V-109310a–c, V-106502, V-109086, 0402, 1402, 2002, 2502, 3102, 4902, 6502, 7802, 8102, 8302 | Vietnam (VNM) | Luc Yen | Pink–red | 15 |
| 0902, 1059, 1064, 1088, 1117, 1902, 2707, 3202, 3802, 5402, 5602 | Afghanistan (AFG) | Jegdalek | Pinkish red–purplish red | 11 |
| 3748, 3751, 3753, 3755, 3760, 3797, 5202, 6402, 7902 | Tanzania (TZA) | Mahenge, Morogoro region | Red | 9 |
| Blue sapphire deposits | ||||
| (AD279, AD283, AD292, AD296) 1, (AD019, AD026, AD027, 4900) 2 | Madagascar (MDG) | 1 Andilamena/Andrebabe (NE), 2 Ilakaka (S) | Blue–dark blue | 8 |
| 0098, (5210,5159) 1, (AD721, AD773) 2, (AD725, AD727-730) 3 | Myanmar (MMR) | Mogok Stone Tract; 1 Baw Mar mine, 2 Kyatpyn, 3 Kin | Pale blue–blue | 10 |
| 1320, 1388, 6702, AD030, AD036, AD039, AD044, AD049, AD095 | Sri Lanka (LKA) | Elahera | Greyish blue–blue | 9 |
| Element | LOQ | Element | LOQ | Element | LOQ |
|---|---|---|---|---|---|
| 25Mg | 378 | 64Zn | 136 | 141Pr | 0.59 |
| 29Si | 16266 | 65Cu | 78 | 146Nd | 2.55 |
| 39K | 322 | 71Ga | 20 | 165Ho | 0.37 |
| 43Ca | 34500 | 88Sr | 5.5 | 178Hf | 1.4 |
| 49Ti | 253 | 90Zr | 5.1 | 181Ta | 0.95 |
| 51V | 14 | 93Nb | 1.37 | 184W | 1.04 |
| 52Cr | 299 | 120Sn | 9.9 | 208Pb | 3.9 |
| 57Fe | 2530 | 139La | 0.81 | 232Th | 0.4 |
| 60Ni | 112 | 140Ce | 0.56 | 238U | 0.18 |
| Sample | 25Mg | 49Ti | 51V | 52Cr | 57Fe | 60Ni | 64Zn | 71Ga |
|---|---|---|---|---|---|---|---|---|
| Amphibolite-type ruby deposits | ||||||||
| MOZ n = 54 | 18–67 (38) | 21–104 (42) | 2.9–8.5 (4.1) | 1119–9190 (1812) | 688–1522 (1001) | 0.4–3.2 (1) | 0.3–5.6 (0.8) | 17–36 (22) |
| TZA, Winza n = 19 | 6.4–128 (91) | 16–584 (99) | 0.9–8 (3.1) | 526–2850 (991) | 1648–3937 (3204) | 0.4–9.7 (6.6) | 0.2–1 (0.6) | 16–44 (34) |
| MDG, Zahamena n = 13 | 48–103 (78) | 73–149 (109) | 29–59 (37) | 1782–8770 (2839) | 1878–3521 (2940) | 0.3–3.5 (0.8) | 0.3–1 (0.4) | 49–101 (64) |
| MDG, Ampanihy n = 12 | 13–40 (27) | 21–86 (42) | 26–49 (32) | 1704–2679 (2189) | 2720–3560 (3095) | 0.5–2.7 (0.8) | 0.4–1.4 (0.8) | 84–112 (97) |
| Marble-hosted ruby deposits | ||||||||
| MMR n = 40 | 13–129 (61) | 35–207 (109) | 46–1074 (310) | 772–6850 (2352) | 23–267 (101) | 0.2–2.6 (0.6) | 0.2–1.8 (0.5) | 12–192 (131) |
| VNM n = 39 | 12–161 (39) | 36–627 (126) | 8–480 (63) | 242–8190 (875) | 20–718 (122) | 0.1–3.9 (0.4) | 0.2–1.3 (0.4) | 9.3–133 (58) |
| AFG n = 23 | 26–144 (59) | 47–367 (111) | 16–210 (82) | 1267–9507 (3145) | 41–679 (81) | 0.07–3.2 (0.6) | 0.2–1.9 (0.5) | 33–92 (48) |
| TZA, Morogoro n = 19 | 42–162 (71) | 84–360 (126) | 15–212 (34) | 462–2319 (1207) | 128–1250 (449) | 0.08–1.7 (0.2) | 0.2–0.6 (0.4) | 42–117 (60) |
| Blue Sapphire deposits | ||||||||
| MDG, Andrebabe n = 7 | 6.4–44 (19) | 22–35 (26) | 1.8–7 (3.6) | 2.7–11 (5.4) | 2218–4975 (3460) | 0.2–4.2 (1.9) | 0.3–3.1 (1.3) | 125–216 (159) |
| MDG, Ilakaka n = 6 | 21–133 (63) | 41–841 (164) | 12–34 (23) | 2.2–20 (6) | 804–2136 (924) | 0.09–0.4 (0.23) | 0.25–0.75 (0.5) | 50–233 (63) |
| LKA n = 18 | 28–146 (63) | 50–283 (138) | 3.8–62 (9.4) | 0.9–4.9 (1.8) | 497–2402 (997) | 0.8–1.9 (0.33) | 0.1–0.9 (0.3) | 46–131 (97) |
| MMR n = 20 | 5.8–77 (25) | 8.7–275 (59) | 0.5–27 (1.5) | 1.6–9.8 (2.6) | 1186–5617 (2040) | 0.4–3.2 (1) | 0.1–1.3 (0.5) | 51–193 (89) |
| Sample | 87Sr/86Sr | 206Pb/204Pb | 207Pb/204Pb | 207Pb/206Pb | 208Pb/206Pb |
|---|---|---|---|---|---|
| Amphibolite-type deposits | |||||
| MOZ | 0.7075–0.72 91(n = 12) | 17.86–19.00 (n = 4) | 15.33–15.60 (n = 4) | 0.8305–0.8655 (n = 4) | 2.0292–2.0955 (n = 4) |
| TZA, Winza | 0.7071–0.7101 (n = 4) | 16.88–17.57 (n = 3) | 15.57–15.62 (n = 3) | 0.8880–0.9223 (n = 4) | 2.1290–2.1786 (n = 3) |
| MDG, Zahamena | 0.7115–0.7463 (n = 4) | 15.92–24.64 (n = 4) | 15.21–15.99 (n = 4) | 0.6488–0.9539 (n = 4) | 1.5866–2.8679 (n = 4) |
| Marble-hosted deposits | |||||
| MMR | 0.7059–0.7182 (n = 8) | 18.02–19.75 (n = 9) | 15.55–15.72 (n = 9) | 0.7959–0.8636 (n = 9) | 1.9643–2.1037 (n = 9) |
| VNM | 0.7062–0.7066 (n = 3) | 18.11–19.08 (n = 3) | 15.50–15.64 (n = 3) | 0.8177–0.8558 (n = 3) | 2.0223–2.0819 (n = 3) |
| AFG | 0.7059–0.7089 (n = 5) | 17.77–19.13 (n = 5) | 15.48–15.67 (n = 5) | 0.8196–0.9721 (n = 5) | 2.0090–2.1081 (n = 5) |
| TZA, Morogoro | 0.7063–0.7093 (n = 5) | 17.38–35.86 (n = 4) | 15.39–16.57 (n = 4) | 0.4616–0.8858 (n = 4) | 1.0561–2.1320 (n = 4) |
| Blue sapphire deposits | |||||
| MDG, Andrebabe | 0.7066–0.7087 (n = 2) | 17.08–18.30 (n = 3) | 15.47–15.57 (n = 3) | 0.8505–0.9056 (n = 3) | 2.1113–2.1484 (n = 3) |
| MDG, Ilakaka | 0.7156–0.7316 (n = 4) | 17.45–20.01 (n = 4) | 15.54–15.80 (n = 4) | 0.7895–0.8899 (n = 4) | 2.0243–2.5975 (n = 4) |
| LKA | 0.7081–0.7316 (n = 7) | 17.24–20.69 (n = 7) | 15.49–15.95 (n = 7) | 0.7706–0.8974 (n = 7) | 1.8330–3.2644 (n = 7) |
| MMR | 0.7098–0.7152 (n = 7) | 17.86–18.65 (n = 3) | 15.40–15.65 (n = 3) | 0.8381–0.8634 (n = 3) | 2.0629–2.0856 (n = 3) |
© 2020 by the authors. Licensee MDPI, Basel, Switzerland. This article is an open access article distributed under the terms and conditions of the Creative Commons Attribution (CC BY) license (http://creativecommons.org/licenses/by/4.0/).
Share and Cite
Krebs, M.Y.; Hardman, M.F.; Pearson, D.G.; Luo, Y.; Fagan, A.J.; Sarkar, C. An Evaluation of the Potential for Determination of the Geographic Origin of Ruby and Sapphire Using an Expanded Trace Element Suite Plus Sr–Pb Isotope Compositions. Minerals 2020, 10, 447. https://doi.org/10.3390/min10050447
Krebs MY, Hardman MF, Pearson DG, Luo Y, Fagan AJ, Sarkar C. An Evaluation of the Potential for Determination of the Geographic Origin of Ruby and Sapphire Using an Expanded Trace Element Suite Plus Sr–Pb Isotope Compositions. Minerals. 2020; 10(5):447. https://doi.org/10.3390/min10050447
Chicago/Turabian StyleKrebs, Mandy Y., Matthew F. Hardman, David G. Pearson, Yan Luo, Andrew J. Fagan, and Chiranjeeb Sarkar. 2020. "An Evaluation of the Potential for Determination of the Geographic Origin of Ruby and Sapphire Using an Expanded Trace Element Suite Plus Sr–Pb Isotope Compositions" Minerals 10, no. 5: 447. https://doi.org/10.3390/min10050447
APA StyleKrebs, M. Y., Hardman, M. F., Pearson, D. G., Luo, Y., Fagan, A. J., & Sarkar, C. (2020). An Evaluation of the Potential for Determination of the Geographic Origin of Ruby and Sapphire Using an Expanded Trace Element Suite Plus Sr–Pb Isotope Compositions. Minerals, 10(5), 447. https://doi.org/10.3390/min10050447