Article

Gemological Characteristics and Origin of the Zhanguohong Agate from Beipiao, Liaoning Province, China: A Combined Microscopic, X-ray Diffraction, and Raman Spectroscopic Study

1
School of Gemology, China University of Geosciences, Beijing 100083, China
2
State Key Laboratory of Geological Processes and Mineral Resources, China University of Geosciences, Beijing 100083, China
*
Author to whom correspondence should be addressed.
Minerals 2020, 10(5), 401; https://doi.org/10.3390/min10050401
Submission received: 20 February 2020 / Revised: 27 April 2020 / Accepted: 28 April 2020 / Published: 30 April 2020
(This article belongs to the Special Issue Agates: Types, Mineralogy, Deposits, Host Rocks, Ages and Genesis)

Abstract

:
The Zhanguohong agate from Beipiao (Liaoning province, China), which occurs in the intermediate–felsic volcanic breccias of the Early Cretaceous Yixian Formation, generally shows massive and banded structures, with red, yellow, and/or white layers or zones. Little research has been done on its mineralogical and gemological characteristics or its genesis. In this study, we present petrographic and spectroscopic constraints on the mineral composition and micro-texture of the silica matrix, as well as the ferruginous inclusions within the agates, in order to deduce the origin of the Zhanguohong agate. According to the microscopic observations, sandwich-like interlayered micro-granular quartz, fibrous chalcedony, and jigsaw quartz bands are common in the banded agates. X-ray diffraction (XRD) and Raman spectroscopic analyses revealed that all of the samples were mainly composed of α-quartz and moganite, with minor hematite and goethite. The moganite content (17–54 wt%) of the silica matrix decreases by varying degrees from the outermost to the innermost part of the banded agates. The crystal defects and ferric iron in the microcrystalline silica grains probably contributed to the moganite crystallization. The red, yellow, and orange zones are rich in hematite, goethite, and their mixtures, respectively. The ore-forming fluids fluctuated between acidic and alkaline within a temperature range of 100–200 °C and at a sustained positive Eh. Combined with the field observations, these results suggest that the multiperiod precipitation of the agates probably resulted from the episodic volcanic activity during the Early Cretaceous lithospheric extension in eastern China.

1. Introduction

Agate, generally defined as banded chalcedony, is mainly composed of silica phases (i.e., α-quartz, moganite, opal-CT, opal-C, and opal-A) [1,2,3,4], with minor impurities, such as Fe compounds, sulfates, and carbonates [4,5,6]. The different colors and patterns of agates make each specimen unique from the others. Although agates have been found in igneous, metamorphic, and sedimentary rocks all over the world [7,8,9,10], their genesis is still not completely understood. Several studies have reported that the formation of agates is probably associated with syn- and/or post-volcanic alteration or weathering of volcanic wall rocks [6,9,11].
Agates mainly exhibit microcrystalline fibrous, granular, and jigsaw textures with different contents of moganite [1,3,12] which belongs to the monoclinic group. The structure of moganite has been described as the alternate stacking of layers of left- and right-handed α-quartz corresponding to a periodic Brazil-law twinning on the unit-cell scale [13,14]. As a metastable phase, moganite can be easily transformed into α-quartz, given sufficient time or by changing ambient conditions [2,15,16]. Rodgers and coworkers have suggested that moganite, as a part of the silica sinter maturation sequence, can be derived from the crystallization of noncrystalline and pseudocrystalline opaline silica [17,18]. Moganite has been found in different environments [19,20,21,22,23], including lunar meteorites [24].
Agate deposits are extensively distributed throughout China, such as in Taiwan [25], Hebei [26,27], Liaoning [28,29], Inner Mongolia [30], Heilongjiang, Sichuan, and Yunnan [31]. As one of the most famous kinds of agates, the Zhanguohong agate, which is mainly red and yellow in color and is found locally in Beipiao and Xuanhua, draws a great deal of attention from the public. Detailed studies have been done on the Zhanguohong agate in Xuanhua, Hebei province, including investigations of its microstructural characteristics, mineral composition, coloration mechanism, and ore genesis [26,27,32]. In general, the agates occurred as amygdales in the intermediate–mafic volcanic rocks of the Middle Jurassic Tiaojishan Formation, which is equivalent to the Lanqi Formation in west Liaoning [27,32]. Elaborate fieldwork was conducted to clarify the geological characteristics of the different types of agates and their volcanic wall rocks in the Fuxin district, Liaoning province [29,33]. Similar conclusions were obtained, which emphasized the key roles of the vesicles and fractures in volcanic rocks in the formation of agate deposits. Occurring in the intermediate–felsic volcanic breccias of the Early Cretaceous Yixian Formation in the Beipiao district, Liaoning province, the Zhanguohong agate has been highly neglected. Little attention has been paid to its mineralogical and gemological characteristics, let alone its genesis [28,34]. Through microscopic observations, X-ray diffraction (XRD) analysis, and Raman spectroscopic analysis, this study presents detailed information on the mineralogical and gemological characteristics of the Zhanguohong agate in the Beipiao district. Combined with field investigations, we try to provide an insight into the origin of the Zhanguohong agate.

2. Geological Setting

The agate deposit is located near Cunzhuyingzi village, Beipiao, Liaoning province, China, and it is adjacent to the northeastern part of the Jurassic Beipiao basin in the east Yanshan belt, northern North China Craton (NCC). The NEE striking Lingyuan–Beipiao–Shahe fault zones and the NNE striking Chaoyang–Yaowangmiao fault zones intersect in this area (Figure 1).
Two rock units are present in the Beipiao district: a Cretaceous sedimentary–volcanic unit and a pre-Cretaceous unit. The latter is comprised of Archean crystalline basement rocks and Jurassic sedimentary–volcanic rocks [35,36].
The Archean crystalline basement rocks are mainly composed of granulite, gneiss, and leptynite, with some supracrustal enclaves. It has been suggested that these rocks underwent amphibolite–granulite facies metamorphism at ~2.8 Ga, which was overprinted by upper greenschist facies metamorphism at ~2.5 Ga [35]. Anshan-type iron deposits occur in these rocks.
The Jurassic volcanic and terrestrial coal-bearing clastic rocks in the Beipiao basin, >1.6 km in thickness, have traditionally been divided, from the base upward, into the Xinglonggou, Beipiao, Haifanggou, Lanqi, and Tuchengzi formations [35,36,37]. The Yanshan movement was defined based on detailed work near Beipiao and the Western Hills of Beijing [38,39]. It is characterized by stratigraphic unconformities and intense intracontinental compression deformation, e.g., folds and thrusts, of the Middle–Late Jurassic and even the earliest Cretaceous volcanic and sedimentary strata (e.g., the Haifanggou, Lanqi, and Tuchengzi formations and their coeval strata elsewhere in the Yanshan belt) [40,41]. However, whether the Early Jurassic and earliest Middle Jurassic strata (e.g., the Xinglonggou and Beipiao formations and the other equivalent formations) in the northern NCC were formed in rift basins or in flexural basins is still controversial [42,43,44].
The Cretaceous sedimentary–volcanic unit includes, from bottom to top, the Early Cretaceous Yixian, Jiufotang, and Fuxin formations and the Late Cretaceous Sunjiawan Formation [35,36,37]. The Jehol Biota, which is defined by its characteristic Eosestheria–Ephemeropsis–Lycoptera assemblage, is widely distributed in this unit [45]. Unconformably overlying the Tuchengzi Formation, the Yixian Formation consists primarily of basalt in the lower part, and andesite, andesitic rhyolite, and their corresponding volcaniclastic rocks, with minor conglomerate, sandstone, and shale interlayers, in the upper part. The Zhanguohong agate deposits locally occur in these beds. The accurate age of the Yixian Formation has long been a matter of debate in early paleontological and biostratigraphic studies [45,46,47]. Recently, radio-isotropic age dating of these extrusive rocks, which were generally thought to be formed by the intermittent crevasse eruptions of volcanoes in rift basins, reveals a conclusive Early Cretaceous age (135–120 Ma) [48,49,50]. The Jiufotang and Fuxin formations are predominantly comprised of shale, siltstone, and sandstone, with subordinate conglomerate and coal-bearing interlayers, which indicates a lacustrine depositional environment. In the uppermost part of this unit, the Sunjiawan Formation is predominantly comprised of conglomerate, with minor sandstone, siltstone, and shale interlayers. The Lower Cretaceous strata were formed in rift basins due to the intense lithospheric extension and thinning in eastern China, and throughout east Asia, in the Late Mesozoic [51,52,53,54,55,56,57].
With prolonged lithospheric extension, the Cretaceous intermediate, felsic, and alkaline intrusive rocks were extensively emplaced to the east of our study area ([58,59,60] and references therein). Additionally, Permian granite and granitic diorite and Jurassic andesitic porphyrite locally occur to the west of our study area.
An ore-bearing zone has been found in the Yixian Formation near Cunzhuyingzi village, which generally strikes E–W and dips gently (30°) to the N (Figure 1 and Figure 2a). It extends for up to 4 km with various widths (<150 m) [34]. Interbedded by andesite to the bottom and rhyolitic andesite to the top, the intermediate–felsic volcanic breccias with tuffaceous matrix constitute the wall rock of the agates. In general, the agates occur as veins (Figure 2b,c) and as irregular shapes (Figure 2d–f) in the fractures and pores of these pyroclastic rocks. They have various colors and weights ranging from the gram to kilogram scales (Figure 2).

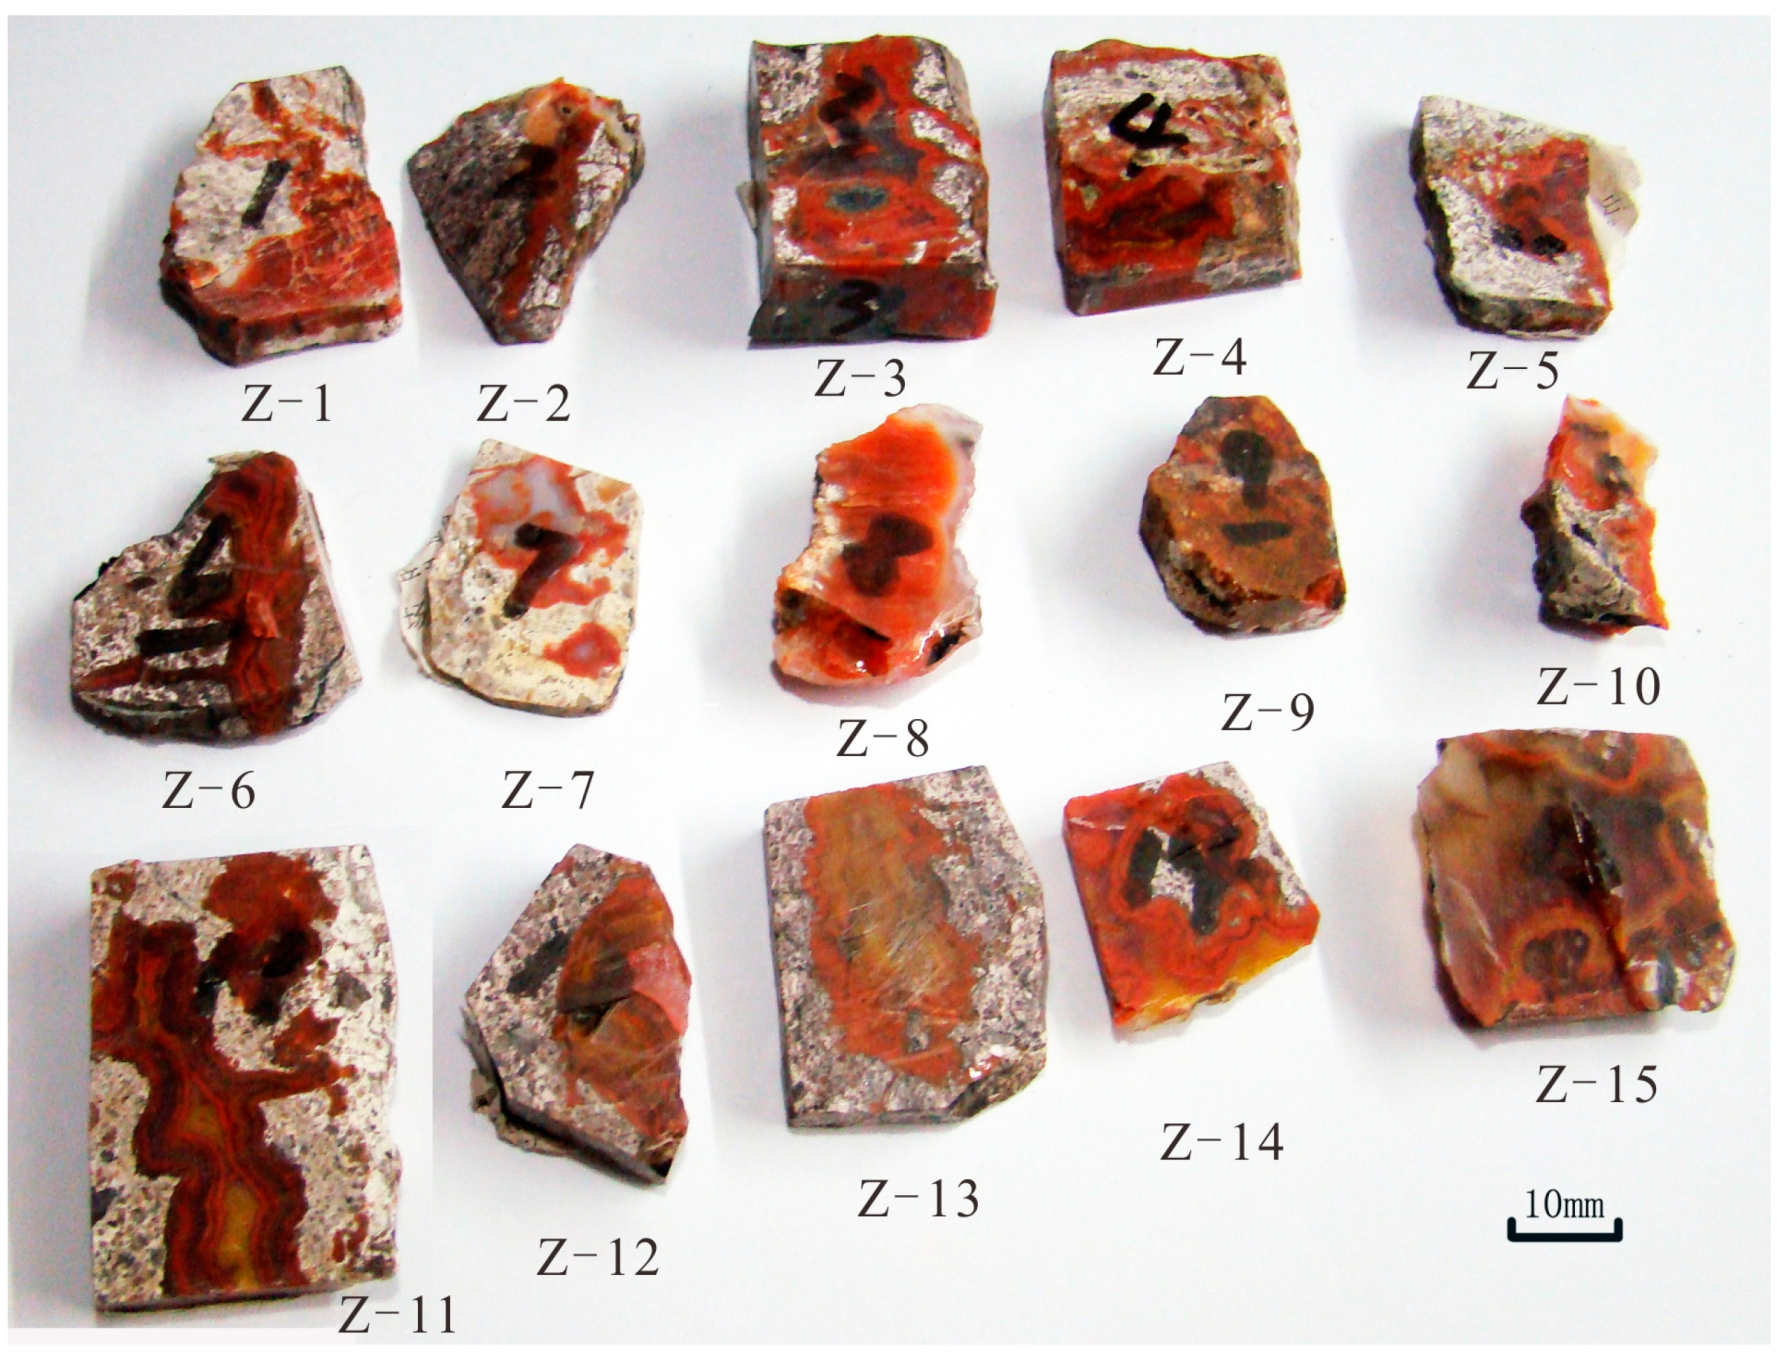
3. Materials and Methods

Fifteen agate samples (Z–1 to Z–15) with different shapes and colors were collected and studied, especially irregularly-shaped examples (Figure 3). Featuring red, yellow, and/or white colors, the majority of the samples show banded structures (Figure 2c–e and Figure 3), while the others exhibit massive structures (Figure 2f and Figure 3). Macrocrystalline quartz grains are common at the center of the banded agates (Figure 2d and Figure 3) and sometimes act as middle layers (Figure 2e and Figure 3).
The XRD analysis was carried out by a Rigaku D/max-rA type 12 kW rotating target diffractometer with a Cu-Kα radiation (40 kV, 100 mA) and a graphite monochromator at the Beida Micro-Structure Analytical Lab of Beijing, China. Measurements were conducted in the range between 10–40° 2θ with a scan rate of 2°/min.
Raman spectra of the silica matrix and inclusions were acquired between 100 and 1500 cm−1 using the Horiba LabRAM HR Evolution equipped with a Peltier-cooled charged-coupled device (CCD) detector, edge filters, and a Nd-YAG laser (100 mW, 532 nm) at the School of Gemology, China University of Geosciences, Beijing, China. The confocal hole was fixed at 100 μm, and the diffraction grating was 600 grooves/mm. The laser focusing and sample viewing were operated through 100×, 50×, and 10× objective lens with a polaroid. With this configuration, the spatial resolution was <1 μm, and the spectral resolution was determined to be ~1 cm−1. The spectrometer calibration was set using the 520.5 cm−1 band of a silicon wafer. The spectra were recorded at a laser power of 50 mW with 3 s acquisition time and twice accumulation.
The spectra of the silica phases were background corrected by the polynomial method using the LabSpec software (Version LabSpec 6, Horiba Ltd., Kyoto, Japan) and were normalized by the strongest band (465 cm−1) intensity normalization method [61]. The curve-fitting algorithm in the OriginPro sofware (Version OriginPro 2018 SR1, OriginLab, Northampton, MA, USA) was used to fit the pre-processed spectra in the 400–600 cm−1 range. The spectra were deconvoluted with Fourier Self-Deconvolution (Pro), and only two peaks were found at 502 cm−1 (moganite) and 465 cm−1 (quartz). The peak parameters (e.g., position, width, and area) were obtained by fitting the spectra with Lorentzian functions constrained by a constant minimum baseline.

4. Results

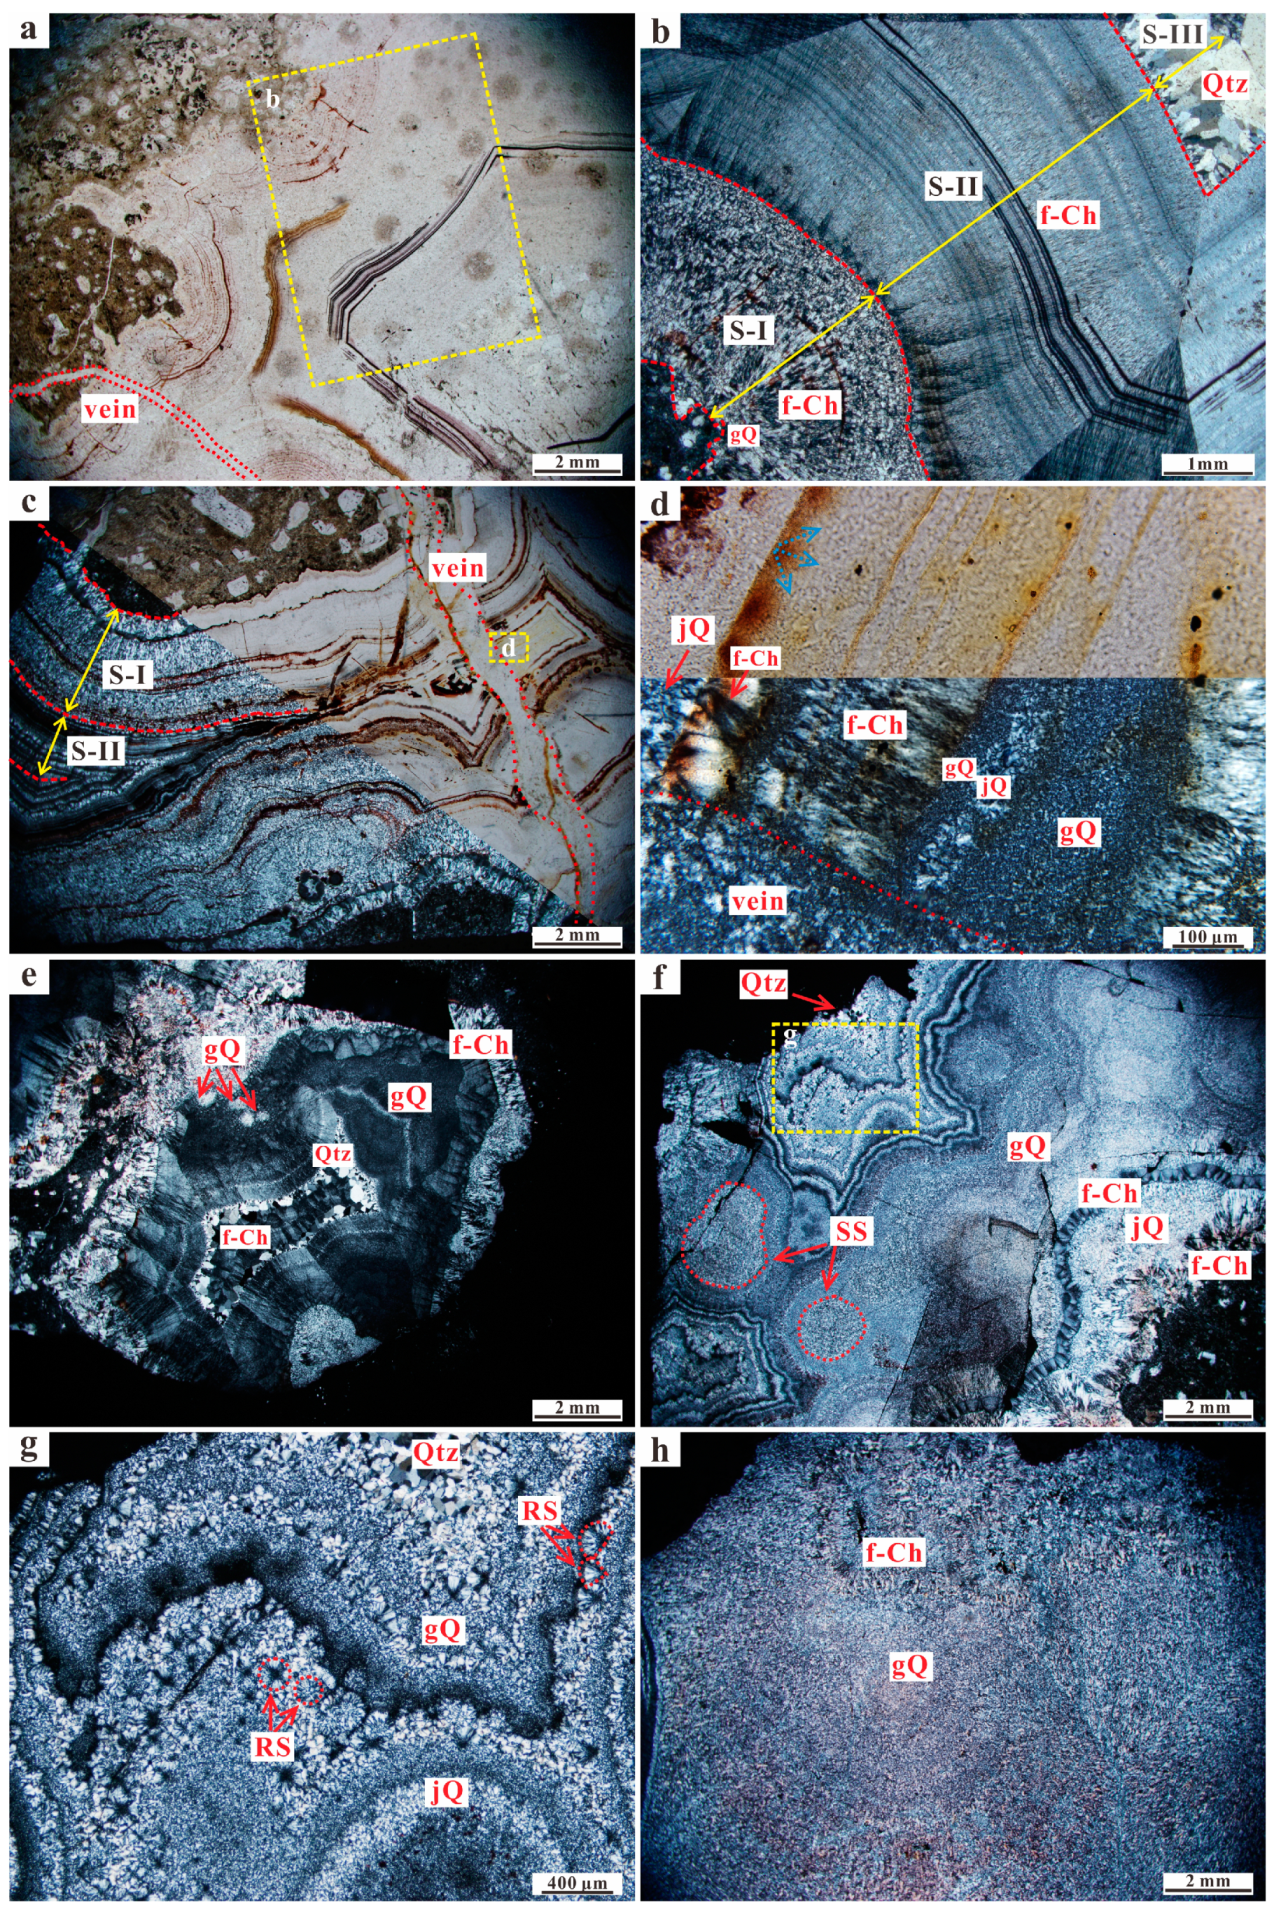
4.1. Microscopic Observations

The Zhanguohong agates in the Beipiao district are mainly composed of microcrystalline silica phases with different micro-textures (i.e., micro-granular quartz, fibrous chalcedony, and jigsaw quartz) and macro-quartz, with minor Fe compounds (Figure 4 and Figure 5). Two distinct types of agates with banded and massive structures were observed.
Concentric and rhythmic bands resulting from changes in composition and/or texture are common in the banded agates, which are emphasized by the Fe compounds (Figure 4a–g). Here, the terms micro-granular quartz, fibrous chalcedony, jigsaw quartz, and macro-quartz bands are used to describe the microscopic characteristics of the banded agates. The macro-quartz (~0.05–1 mm in size) bands are preferentially located in the center of the banded agates (Figure 4a,b,f,g) and occasionally occur as interlayers among the microcrystalline silica bands (Figure 4e). Sandwich-like interlayered micro-granular quartz (~5–20 μm in size) and fibrous chalcedony bands comprise the majority of the concentric and rhythmic bands (Figure 4c–g), with a few jigsaw quartz band interlayers (Figure 4c,d,f,g). However, some banded agates are predominant with micro-granular quartz bands or fibrous chalcedony bands (Figure 4a,b). Near the boundary between the volcanic wall rock and the agate, banded and/or blocky macro-quartz and micro-granular quartz aggregates were observed (Figure 4b). The complex changes in texture (e.g., size and shape) (Figure 4a–g) suggest that the formation of the banded agates may have been a multi-stage process. Spherical and radiated structures are locally present in some of the banded agates (Figure 4f,g). The former, which is thought to be the result of nucleation and growth starting in the innermost part of a free space [6], is composed of micro-granular quartz grains (Figure 4f), and the latter of microcrystalline silica aggregates (i.e., fibrous chalcedony and jigsaw-like quartz) (Figure 4g). At least two periods of silica precipitation occurred, based on the occurrence of microcrystalline silica veins which cross-cut the concentric and rhythmic bands (Figure 4a,c). However, without concentric and rhythmic bands, massive agates are predominantly comprised of micro-granular quartz grains and/or fibrous chalcedony aggregates (Figure 4h).
Red and yellow zones and bands in the agates are highly impregnated with Fe-oxides and Fe-hydroxides, which were identified using Raman spectroscopic analysis (as discussed later in Section 4.3.2). The Fe compounds are generally present as short prismatic (Figure 5a), spherical (Figure 5b), and granular (Figure 5c) inclusions distributed perpendicular to the growth direction of the agate. The majority of these inclusions form Fe-rich layers (Figure 5a,c), while the others are scattered randomly in the silica matrix (Figure 5b). However, in some of the red and yellow zones, the ferruginous particles are too small to identify under the optical microscope (Figure 5b). In addition, the transmission of Fe compounds is common in agates (Figure 4d and Figure 5d).

4.2. XRD Analysis

Two samples (Z–4 and Z–9) were chosen for XRD analysis (Figure 6). Their moganite contents were significantly different. It was low in sample Z–9, which was demonstrated by the negligible moganite peaks; while it was relatively high in sample Z–4, but was still low compared with the α-quartz content. The moganite contents of samples Z–4 (11%) and Z–9 (7%) were estimated by the peak area ratio method [16]. Hematite and albite were also present as minor phases in sample Z–4. The existence of the latter phase was probably due to the entrainment of pieces of wall rocks (Figure 3 and Figure 4a). Pseudocrystalline and amorphous silica phases were not detected. None was goethite.

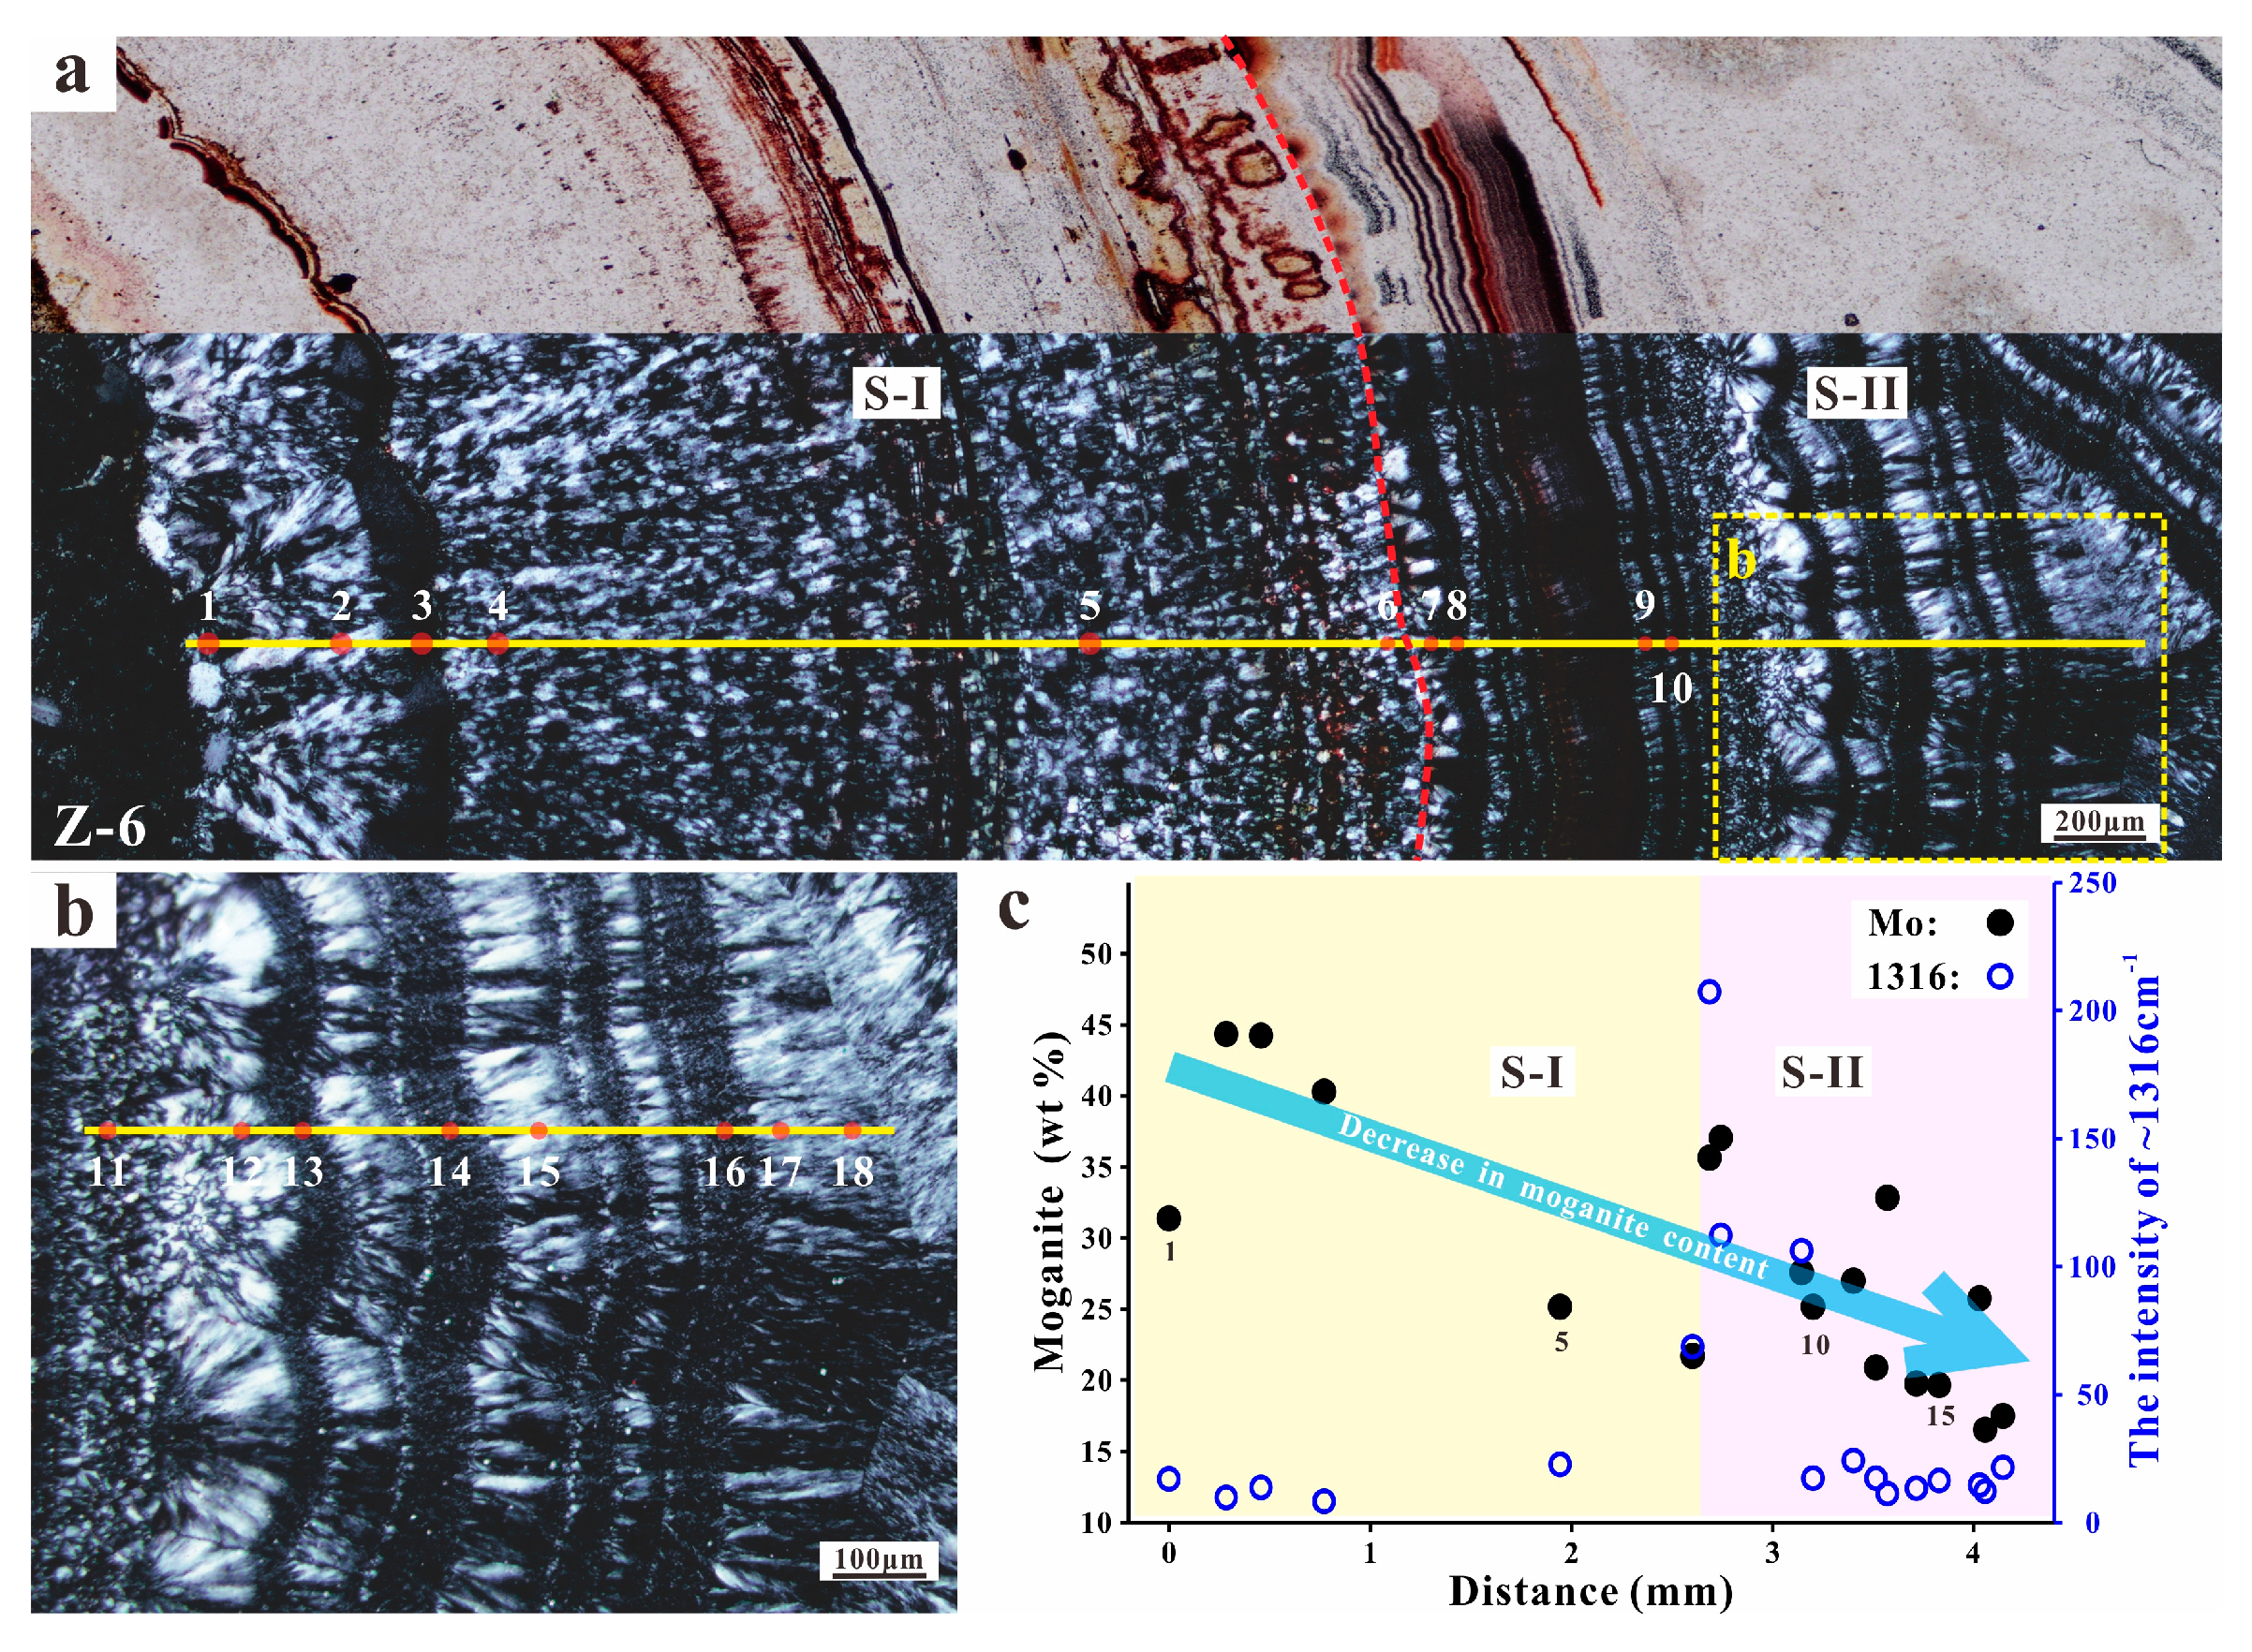
4.3. Raman Spectroscopic Analysis

Compared with XRD analysis, in-situ Raman spectroscopy is a more effective method of distinguishing between different silica phases at the micron-scale [62,63]. Both the silica matrix and the ferruginous inclusions in the Zhanguohong agates were analyzed using Raman spectroscopy. The relative Raman calibration model proposed by Götze et al. (1998) [3] was used to evaluate the moganite content of the silica matrix.

4.3.1. Silica Matrix

The silica matrix consists of α-quartz and moganite. However, hematite and goethite also appear in the Raman spectra, which is attributed to the presence of fine-grained Fe-bearing particles in the matrix (Figure 7). Pseudocrystalline and amorphous silica phases were not detected in any of the samples. Marker bands were assigned for the silica phases (i.e., α-quartz and moganite) and Fe compounds (i.e., hematite and goethite), and are listed in Table 1.
Figure 8, Figure 9 and Figure 10 illustrate the spatial distribution of the moganite content, which ranges from 17 to 54 wt%, in the Zhanguohong agates (samples Z–2, –4, –6, –8, and –12). Detailed microscopic observations were conducted before the Raman spectroscopic analysis to ensure that the Fe-bearing zones were excluded as much as possible. The micro-granular quartz contains up to 54 wt% moganite near the wall rock (Figure 8, point 1), whereas the moganite content is much lower among the micro-granular quartz aggregates, which have a spherical structure (Figure 10b,d). In general, the majority of the moganite contents are between 20 and 45 wt% (Figure 8, Figure 9 and Figure 10). With the consistent precipitation of silica phases, the moganite content fluctuates and decreases with different degrees in the banded agates (Figure 8 and Figure 9). Moreover, this variation in moganite content is found in microcrystalline silica grains formed in different periods as well (Figure 10c,d), which may reflect the physicochemical differences in their parent fluids [2].
In the matrix, hematite is evidenced by marker bands at 225, 246, 411, 499, 610, and 1316 cm−1, while goethite is evidenced by maker bands at 298 and 394 cm−1 (Figure 7). Several studies have suggested that ferric iron acts as an agent in the formation of moganite [2,3,4]. In order to determine whether there is a correlation between ferric iron and moganite, this study qualitatively analyzed the intensity of the band at ~1316 cm−1 (hematite) in the normalized spectra (Figure 8d, Figure 9c, and Figure 10d). This band was chosen due to its relatively high intensity and lack of overlap with other bands. Because of the superimposition of the ferruginous inclusions (faintly red, orange, and/or yellow fine grains under the microscope) underlying the sample surface, some of the Raman spectroscopic analysis points (i.e., the open circles in Figure 11) were omitted when we determined the correlation. After this omission, a positive correlation was obtained between the intensity of Raman peak ~1316 cm−1 and the moganite content of the silica matrix (Figure 11).

4.3.2. Ferruginous Inclusions

The ferruginous inclusions are found to be mixtures of hematite, goethite, α-quartz, and moganite (Figure 12). The spectrum of hematite displays bands at 225, 246, 292, 411, 499, 610, and 1316 cm−1. The bands at 225 and 499 cm−1 result from the A1g vibrational mode (Fe–O symmetric stretching vibrations), and the band at 1316 cm−1 corresponds to the second-order 2LO mode with 2Eu symmetry. The other bands were assigned to the Eg vibrational mode (Fe–O symmetric bending vibrations) [65,66]. Goethite is evidenced by bands at 242, 297, 394, 416, 546, 682, and 995 cm−1 [65,66]. The spectrum of goethite consists of two strong bands at 394 cm−1 (Fe–O–Fe/–OH symmetric stretching vibrations) and 297 cm−1 (Fe–OH symmetric bending vibrations) [6,67]. The bands at 546 and 682 cm−1 originate from Fe–OH asymmetric stretching vibrations and Fe–O symmetric stretching vibrations, respectively [67]. The extra bands at 126, 205, 263, 356, 464, and 502 cm−1 come from the silica phases.
The dark red inclusions consist mainly of hematite with minor α-quartz (Figure 12, points 1 and 2), and the presence of goethite makes their color more orangish (Figure 12, points 3 and 4). Furthermore, the high goethite content of these inclusions leads to a yellow appearance (Figure 12, point 5).

5. Discussion

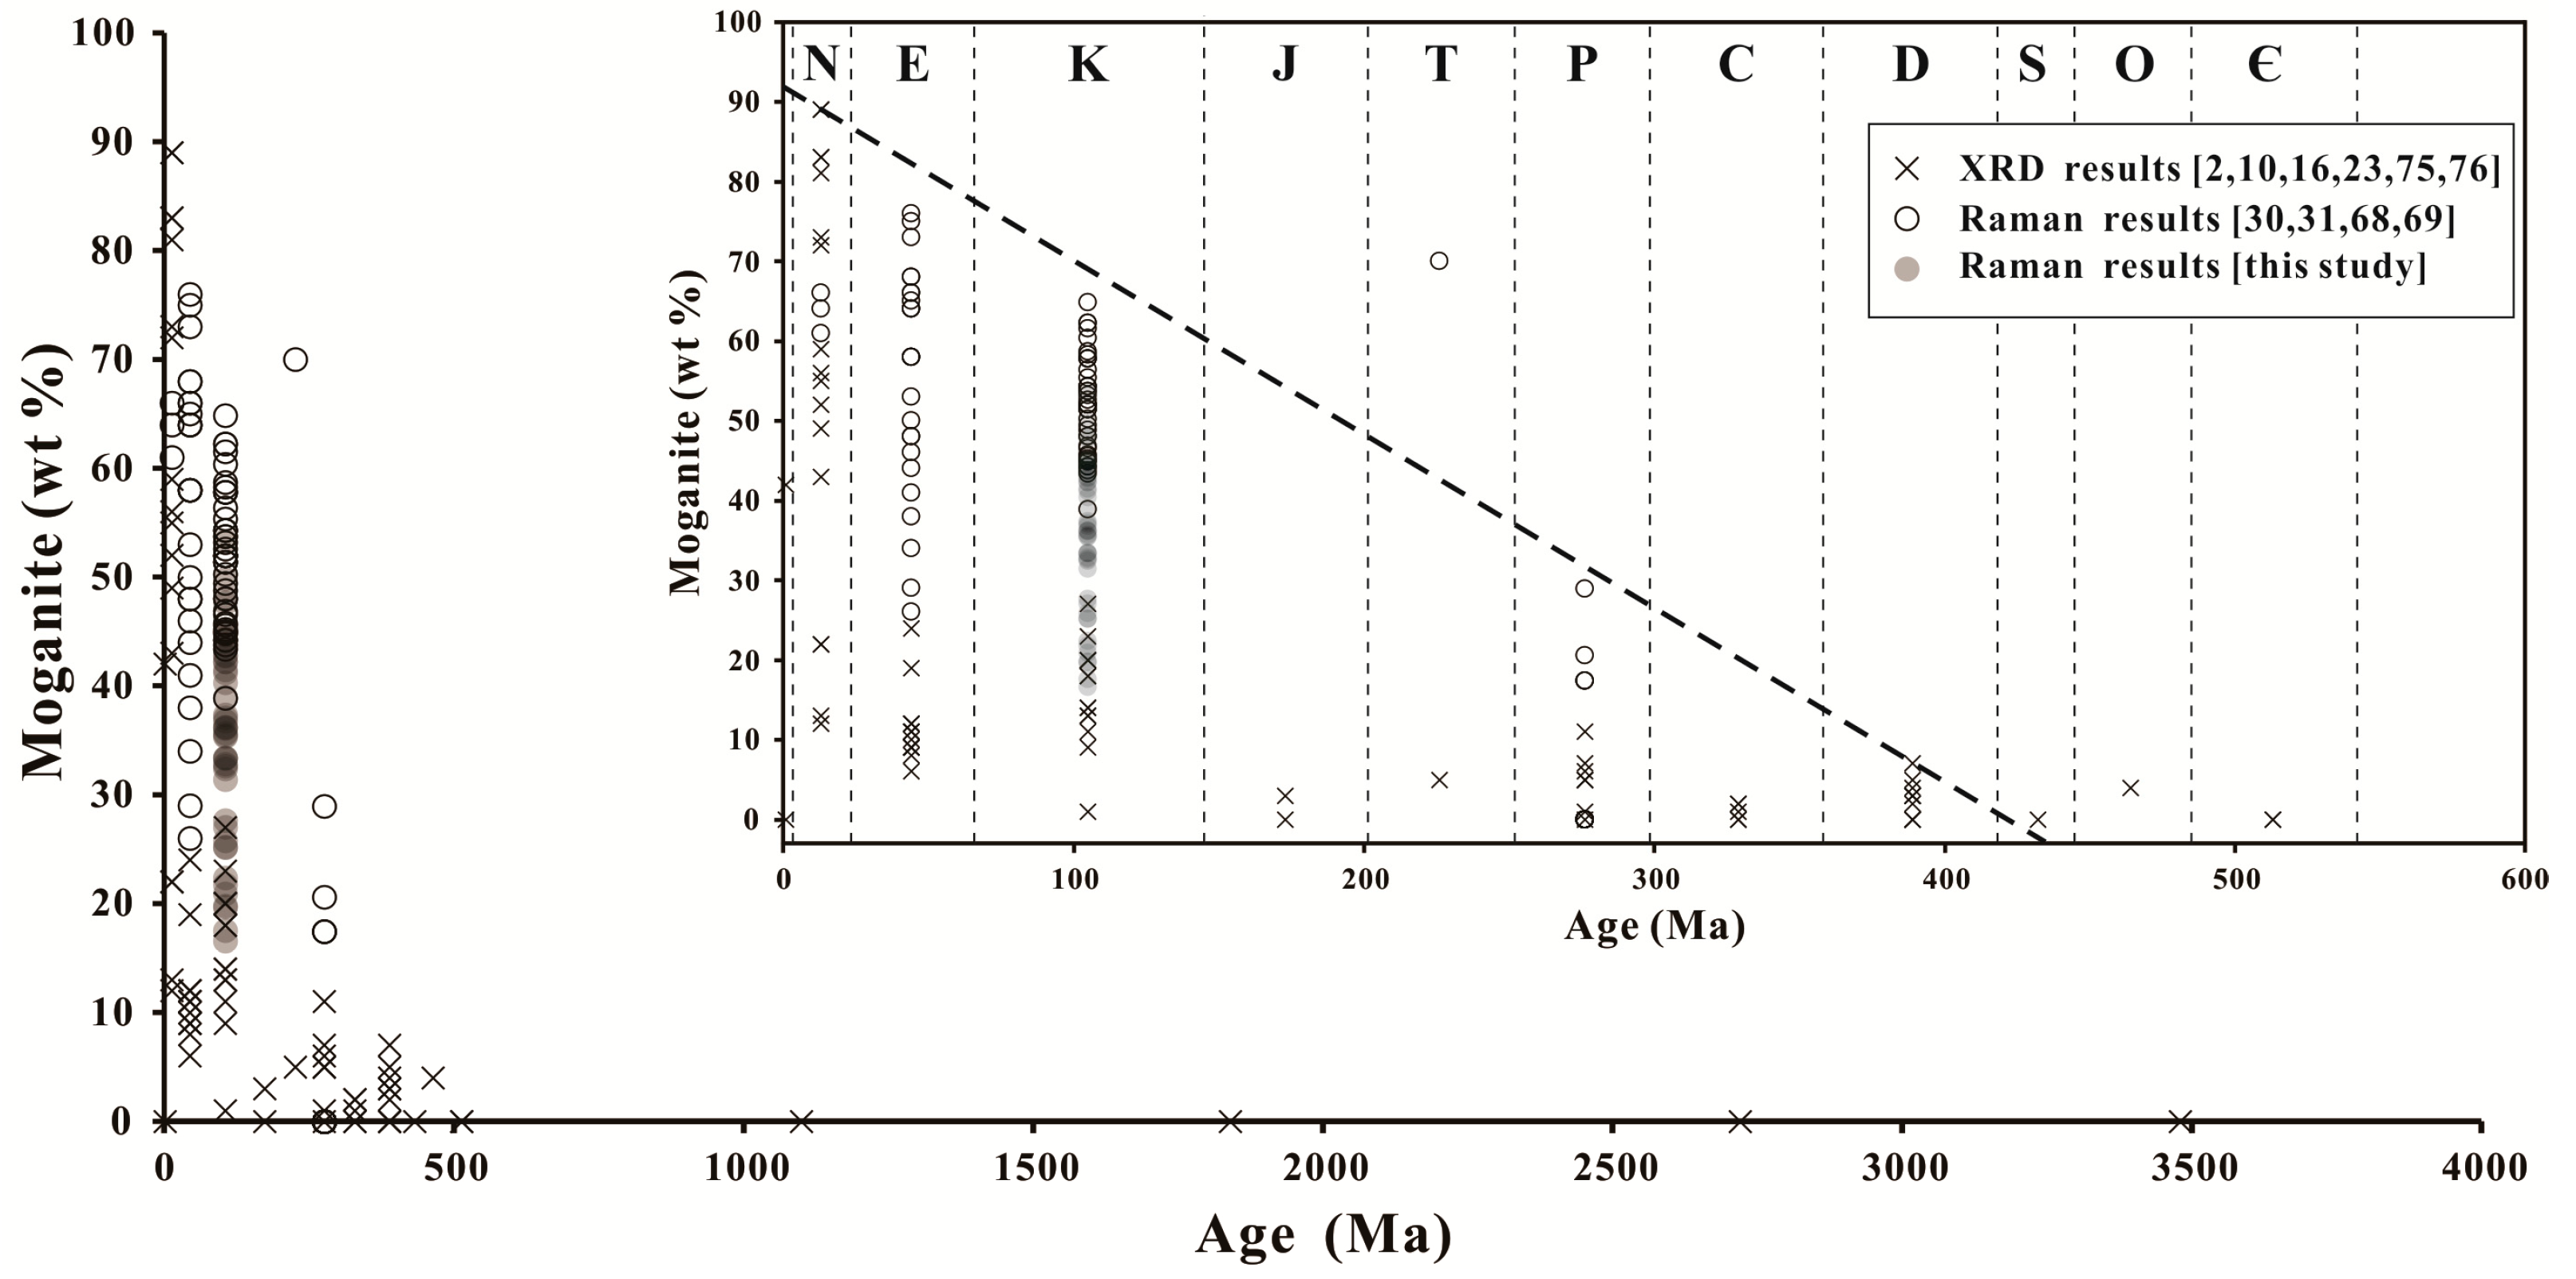
5.1. Moganite in the Zhanguohong Agate

The Raman spectroscopic analysis revealed that the moganite contents of the Zhanguohong agates in the Beipiao district vary significantly (17–54 wt%, Figure 8, Figure 9 and Figure 10), which is in agreement with the findings that the moganite contents are significantly different for the different samples, and even for different zones of the same sample collected from other places [20,62,68,69]. In general, the moganite content decreases and fluctuates with different degrees in the banded agates during the progressive precipitation of silica (Figure 8 and Figure 9). Moganite crystallization appears to be favorable in the initial stage (Figure 8 and Figure 9), which indicates that moganite formation may be attributed to the high structural defects generated by rapid silica growth from a strongly supersaturated solution [70,71,72]. With progressive precipitation, the degree of silica supersaturation and the crystallization rate of silica gradually decrease [70]. As a consequence, the density of the defects decreases, which results in the decreasing moganite contents observed in the Zhanguohong agates (Figure 8 and Figure 9). However, the moganite contents also exhibit significant fluctuations (Figure 8 and Figure 9), which are likely caused by local oscillations in the degree of silica supersaturation [73,74].
The relatively low moganite content (Figure 9, point 1) at the very beginning of stage Ⅰ can be ascribed to the recrystallization of the pre-existing silica phases [6] next to the wall rock where alteration is easier. Alternatively, it can be attributed to the mixing of the micro-granular quartz with the underlying macro-quartz grains. In addition, the moganite content deviates slightly from the trendline at the end of stage Ⅰ (e.g., points 5–7 in Figure 8, and points 5 and 6 in Figure 9), and sometimes it is slightly lower than that in stage Ⅱ (Figure 8 and Figure 9). This low moganite content may be due to alteration or recrystallization after the initial precipitation of the microcrystalline silica grains, which results in their jigsaw-like micro-textures with irregularly shaped boundaries, particularly along the direction of silica growth (Figure 8a and Figure 9a).
Compared with the Raman spectroscopic results, the XRD analysis indicated much lower moganite contents (~10 wt%) for the Zhanguohong agates (Figure 6, Figure 8, Figure 9, and Figure 10). This difference can be explained by the occurrence of nano-sized moganite, which makes a limited contribution to the Bragg reflection [3]. In addition, the mixture of macro-quartz grains and wall rock in XRD analysis further reduces the moganite content (Figure 2 and Figure 6).
It has been suggested that moganite crystallization is favored by the alkaline fluid combined with high activities of ferric iron [2,4,5]. The positive correlation between the moganite content and the intensity of ~1316 cm−1 peak (Figure 11) provides evidence that ferric iron probably plays an important role in moganite crystallization.
The statistics for the moganite contents of microcrystalline silica samples (i.e., agate, chalcedony, chert, and flint) determined using XRD and Raman spectroscopy in the literature [2,10,16,23,30,31,68,69,75,76] and in this study (Figure 13) reveal that the proportion of moganite increases as the volcanic wall rocks become younger, that is, from Devonian to Neogene, based on the change in the maximum moganite content for each period. This is consistent with the findings of Moxon and his coworkers [10,16,75]. It should be noted that the ages of the Phanerozoic rocks are approximate ages. For example, if the volcanic wall rocks formed in the Cretaceous (145.5–65.5 Ma), the median value (105.5 Ma) was taken as the approximate age. It has been suggested that moganite is thermodynamically less stable [15] and recrystallizes readily to α-quartz over millions of years [2] or in the presence of water (e.g., hydrothermal activity and weathering) [16,17,20]. The decay rate (~0.218 wt%/Ma) of moganite could be evaluated. We suppose that the wide variation in the moganite contents of the Zhanguohong agates is more likely due to the initial difference rather than to heterogeneous recrystallization or alteration after its precipitation.

5.2. Coloration Mechanism

Yellow, red, and orange bands or zones are common in the Zhanguohong agates. These colored zones are rich in red and/or yellow, relatively coarse (μm-scale) inclusions with short prismatic (Figure 5a), spherical (Figure 5b), and granular (Figure 5c) shapes, or contain extremely fine colored grains. The Raman spectroscopic analysis reveals that these inclusions are mixtures of Fe compounds (i.e., hematite and goethite) and silica phases (Figure 12), which suggests that these Fe-bearing minerals and silica phases simultaneously precipitated from the solution. In general, the red and yellow zones consist largely of hematite- and goethite-bearing particles (i.e., coarse inclusions and fine grains), respectively. To some extent, when they mix together, the color will turn orange (Figure 12). In other words, as the hematite content increases and the goethite content decreases, the color of the agate changes from yellow, to orange, to red.
Fe compounds were also detected by the XRD analysis (Figure 6). The absence of goethite in the XRD patterns may be ascribed to its low content, which was below the detection limit. Low as their contents are, hematite and goethite have high tinting strengths [77], which results in the abundance of colored zones in the Zhanguohong agates.
Some of the goethite- and hematite-bearing inclusions comprise several colored (yellow, orange, and red) bands parallel to the sandwich-like interlayers composed of microcrystalline silica with different micro-textures (Figure 5a,c), which could result from the self-purification process during silica crystallization [4,6,7]. The presence of spherical inclusions (Figure 5b) indicates that the fluids were locally gelatinous. It has been suggested that the Fe compounds in agates may originate from the weathering products of primary Fe-bearing phases [6,78]. Some of the Fe-bearing particles in the Zhanguohong agates are large and irregular (Figure 4c and Figure 5d), which imply an allogenic origin. Overlain by the Yixian Formation, the Archean crystalline basement rocks are rich of iron deposits. It is reasonable to infer that these rocks act as the provenance of the Fe compounds in the agates. However, to ascertain the origin of these Fe compounds, further more detailed research (e.g., trace element and isotope geochemistry studies) needs to be conducted on the Fe-bearing minerals hosted in both the Archean crystalline basement rocks and the agates.

5.3. Origin of the Zhanguohong Agates

The formation temperature of agates hosted in volcanic rocks is still controversial [9,78]. A temperature range of 50–200 °C (probably >150 °C) was reported based on fluid inclusion and oxygen isotope studies [7,78,79]. With a high moganite content, agates are thought to be formed at a relatively high temperature (100–200 °C) ([72] and references therein). Considering their high moganite contents (17–54 wt%) (Figure 11), Zhanguohong agates in the Beipiao district are more likely to have been precipitated from ore-forming fluids at temperatures of 100–200 °C.
It was suggested that ferruginous layered silicates (i.e., nontronite and lembergite) prefer to crystallize from Si- and Fe-bearing solutions with a negative Eh [80,81,82]. The absence of ferruginous layered silicates in the Zhanguohong agates indicates that the ore-forming fluids were oxidizing. Furthermore, the extensive occurrence of ferric minerals (hematite and goethite) in the agates confirms this oxidizing condition.
Experimental studies on synthetic Fe-bearing minerals reveal that the formation of hematite and goethite is strongly pH dependent in the temperature range of 100–200 °C at low pressures [83]. Hematite, goethite, and their mixtures can be precipitated in acidic, alkaline, and alkaline-neutral conditions, respectively [83,84]. With hematite, goethite and their mixtures respectively, the red, yellow, and orange layers in banded agates imply pH fluctuations between acidic and alkaline during the formation of the agates.
The agates in Beipiao generally exhibit concentric and rhythmic bands, and sometimes these bands are cut by microcrystalline silica veins (Figure 4a,c), which indicates multiple periods of fluid activity during the formation of the agates. This is also confirmed by the existence of interlayered macro-quartz bands at hand specimen and microscopic scales (Figure 2e and Figure 4e), which are thought to have been formed during the final stage of silica precipitation in each period. Field investigations reveal that intense episodic volcanic activity occurred in Beipiao during the Early Cretaceous lithospheric extension in eastern China. The corresponding magmatic fluids probably greatly contributed to the multiperiod precipitation of the agates. During the intermittent crevasse eruptions of these volcanoes in the Cretaceous rift basins near Beipiao, a series of intermediate–felsic volcanic breccias were formed, which contained plenty of irregular cavities and syn-kinematic fractures. These cavities and fractures provided sufficient space for the migration of the fluids and the precipitation of the agates.
The Si-rich fluids derived from the syn- or post- magmatic activity migrated upward from a deep level and may have extracted Fe-bearing minerals from the Archean crystalline basement wall rocks. When the fluids flowed into the intermediate–felsic volcanic breccias in the Yixian Formation, which were at or near the Earth’s surface, the confining pressure dropped significantly and the temperature decreased to lower than 200 °C. Consequently, the ore-forming fluids became highly supersaturated with respect to silica [1], and microcrystalline silica precipitated rapidly on the walls of the cavities and fractures. With progressive precipitation, the degree of silica supersaturation, the crystallization rate of silica, and the density of the defects in the silica matrix decreased, which resulted in the decreasing moganite content and the increasing size of the quartz grains, from microcrystalline (micro-granular, fibrous, and/or jigsaw quartz) to macrocrystalline in the banded agates (Figure 14). However, local oscillations in silica supersaturation [73,74] induced fluctuations in the moganite content (Figure 14a). In addition, Fe-bearing inclusions were precipitated along some bands parallel to the sandwich-like interlayers composed of microcrystalline silica grains with different textures under sustained oxidizing conditions, which resulted from the self-purification process during silica crystallization [4,6,7] (Figure 14b). As the pH conditions of the fluids fluctuated between acidic and alkaline, the distinct red, yellow, and white bands in the Zhanguohong agates were formed (Figure 14).

6. Conclusions

We conclude that the Zhanguohong agates occurring in the intermediate–felsic volcanic breccias of the Early Cretaceous Yixian Formation in the Beipiao district exhibit banded and massive structures. Featuring red, yellow and/or white colors, they are predominantly composed of α-quartz and moganite, with minor hematite and goethite.
The moganite content (17–54 wt%) of the silica matrix fluctuated and decreased with varying degrees during the progressive precipitation of silica. The crystal defects and ferric iron in the microcrystalline silica grains probably contributed to the formation of moganite.
The ferruginous inclusions are mixtures of hematite, goethite, and silica phases. The red, yellow, and orange zones are rich in hematite, goethite, and their mixtures, respectively.
Also considering the results of previous studies, we infer that the Zhanguohong agates probably precipitated under sustained oxidizing conditions at temperatures of 100–200 °C and that the pH condition of the ore-forming fluids fluctuated between acidic and alkaline. The multiperiod precipitation of the agates probably resulted from the episodic volcanic activity during the intense Early Cretaceous lithospheric extension in eastern China.

Author Contributions

Investigation, X.Z.; Writing—original draft preparation, X.Z. and L.J.; Writing—review and editing, X.Z., L.J. and X.H.; Supervision, X.H.; Project administration, X.H. All authors have read and agreed to the published version of the manuscript.

Funding

This research was funded by the project of “Geology of mineral resources in China” from China Geological Survey (Grant No. DD20160346, DD20190379) and the project of “Beihong agate” from China National standardizing committee (Grant No. 20161367-T-334).

Acknowledgments

The authors are indebted to T. Moxon (visiting researcher from Cambridge University) and Wang Shiqi (Peking University) for their helpful discussions and suggestions. We also thank Xie Tianqi (Western University) for her assistance with the XRD analysis, Yuan Ye (China University of Geosciences, Beijing) for his help with the Raman spectroscopic analysis, and Hou Ce (Fourth Bureau of Geology and Mineral Resources of Liaoning province) for his help with the fieldwork. We are grateful to the anonymous Reviewers for their constructive and helpful comments, which significantly improved the manuscript.

Conflicts of Interest

The authors declare no conflict of interest.

References

  1. Flörke, O.W.; Köhler-Herbertz, B.; Langer, K.; Tönges, I. Water in microcrystalline quartz of volcanic origin: Agates. Contrib. Mineral. Petrol. 1982, 80, 324–333. [Google Scholar] [CrossRef]
  2. Heaney, P.J. Moganite as an indicator for vanished evaporites: A testament reborn? J. Sediment. Res. 1995, A65, 633–638. [Google Scholar]
  3. Götze, J.; Nasdala, L.; Kleeberg, R.; Wenzel, M. Occurrence and distribution of “moganite” in agate/chalcedony: A combined micro-Raman, Rietveld, and cathodoluminescence study. Contrib. Mineral. Petrol. 1998, 133, 96–105. [Google Scholar] [CrossRef]
  4. Dumańska-Słowik, M.; Natkaniec-Nowak, L.; Wesełucha-Birczyńska, A.; Gaweł, A.; Lankosz, M.; Wróbel, P. Agates from Sidi Rahal, in the Atlas Mountains of Morocco: Gemological characteristics and proposed origin. Gems Gemol. 2013, 49, 148–159. [Google Scholar] [CrossRef]
  5. Dumańska-Słowik, M.; Powolny, T.; Sikorska-Jaworowska, M.; Gaweł, A.; Kogut, L.; Poloński, K. Characteristics and origin of agates from Płóczki Górne (Lower Silesia, Poland): A combined microscopic, micro-Raman, and cathodoluminescence study. Spectrochim. Acta, Part A 2018, 192, 6–15. [Google Scholar] [CrossRef] [PubMed]
  6. Powolny, T.; Dumańska-Słowik, M.; Sikorska-Jaworowska, M.; Wójcik-Bania, M. Agate mineralization in spilitized Permian volcanics from “Borówno” quarry (Lower Silesia, Poland)—microtextural, mineralogical, and geochemical constraints. Ore Geol. Rev. 2019, 114, 103130. [Google Scholar] [CrossRef]
  7. Götze, J.; Möckel, R.; Kempe, U.; Kapitonov, I.; Vennemann, T. Characteristics and origin of agates in sedimentary rocks from the Dryhead area, Montana, USA. Mineral. Mag. 2009, 73, 673–690. [Google Scholar] [CrossRef]
  8. Heaney, P.J. A proposed mechanism for the growth of chalcedony. Contrib. Mineral. Petrol. 1993, 115, 66–74. [Google Scholar] [CrossRef]
  9. Moxon, T. Agate: A study of ageing. Eur. J. Mineral. 2002, 14, 1109–1118. [Google Scholar] [CrossRef]
  10. Moxon, T.; Nelson, D.R.; Zhang, M. Agate recrystallisation: Evidence from samples found in Archaean and Proterozoic host rocks, western Australia. Aust. J. Earth Sci. 2006, 53, 235–248. [Google Scholar] [CrossRef]
  11. Götze, J.; Schrön, W.; Möckel, R.; Heide, K. The role of fluids in the formation of agates. Geochemistry 2012, 72, 283–286. [Google Scholar] [CrossRef]
  12. Saunders, J.A. Silica and gold textures in bonanza ores of the Sleeper deposit, Humboldt county, Nevada: Evidence for colloids and implications for epithermal ore-forming processes. Econ. Geol. 1994, 89, 628–638. [Google Scholar] [CrossRef]
  13. Miehe, G.; Graetsch, H.; Flörke, O.W. Crystal structure and growth fabric of length-fast chalcedony. Phys. Chem. Miner. 1984, 10, 197–199. [Google Scholar] [CrossRef]
  14. Miehe, G.; Graetsch, H. Crystal structure of moganite: A new structure type for silica. Eur. J. Mineral. 1992, 4, 693–706. [Google Scholar] [CrossRef] [Green Version]
  15. Gíslason, S.R.; Heaney, P.J.; Oelkers, E.H.; Schott, J. Kinetic and thermodynamic properties of moganite, a novel silica polymorph. Geochim. Cosmochim. Acta 1997, 61, 1193–1204. [Google Scholar] [CrossRef]
  16. Moxon, T.; Ríos, S. Moganite and water content as a function of age in agate: An XRD and thermogravimetric study. Eur. J. Mineral. 2004, 16, 269–278. [Google Scholar] [CrossRef]
  17. Rodgers, K.A.; Cressey, G. The occurrence, detection and significance of moganite (SiO2) among some silica sinters. Mineral. Mag. 2001, 65, 157–167. [Google Scholar] [CrossRef]
  18. Rodgers, K.A.; Browne, P.R.L.; Buddle, T.F.; Cook, K.L.; Greatrex, R.A.; Hampton, W.A.; Herdianita, N.R.; Holland, G.R.; Lynne, B.Y.; Martin, R.; et al. Silica phases in sinters and residues from geothermal fields of New Zealand. Earth-Sci. Rev. 2004, 66, 1–61. [Google Scholar] [CrossRef]
  19. Bourli, N.; Kokkaliari, M.; Iliopoulos, I.; Pe-Piper, G.; Piper, D.J.W.; Maravelis, A.G.; Zelilidis, A. Mineralogy of siliceous concretions, Cretaceous of Ionian zone, western Greece: Implication for diagenesis and porosity. Mar. Petrol. Geol. 2019, 105, 45–63. [Google Scholar] [CrossRef]
  20. Heaney, P.J.; Post, J.E. The widespread distribution of a novel silica polymorph in microcrystalline quartz varieties. Science 1992, 255, 441–443. [Google Scholar] [CrossRef]
  21. Heaney, P.J.; McKeown, D.A.; Post, J.E. Anomalous behavior at the I2/a to Imab phase transition in SiO2-moganite: An analysis using hard-mode Raman spectroscopy. Am. Mineral. 2007, 92, 631–639. [Google Scholar] [CrossRef]
  22. Saminpanya, S.; Sutherland, F.L. Silica phase-transformations during diagenesis within petrified woods found in fluvial deposits from Thailand–Myanmar. Sediment. Geol. 2013, 290, 15–26. [Google Scholar] [CrossRef]
  23. Schmidt, P.; Bellot-Gurlet, L.; Leá, V.; Sciau, P. Moganite detection in silica rocks using Raman and infrared spectroscopy. Eur. J. Mineral. 2014, 25, 797–805. [Google Scholar] [CrossRef] [Green Version]
  24. Kayama, M.; Tomioka, N.; Ohtani, E.; Seto, Y.; Nagaoka, H.; Götze, J.; Miyake, A.; Ozawa, S.; Sekine, T.; Miyahara, M.; et al. Discovery of moganite in a lunar meteorite as a trace of H2O ice in the Moon’s regolith. Sci. Adv. 2018, 4, eaar4378. [Google Scholar] [CrossRef] [Green Version]
  25. Chen, Q.L.; Yuan, X.Q.; Jia, L. Study on the vibrational spectra characters of Taiwan blue chalcedony. Spectrosc. Spect. Anal. 2011, 31, 1549–1551, (In Chinese with English abstract). [Google Scholar]
  26. Meng, G.Q.; Chen, M.H.; Jiang, J.L.; Chen, S. Structural characteristic and cause of colour of “Zhanguohong” agate from Xuanhua, Hebei province. J. Gems Gemmol. 2016, 18, 28–34, (In Chinese with English abstract). [Google Scholar]
  27. Xu, W.H.; Xu, X.C.; Yang, L.L.; Wu, H.Y. Ore-geology and metallogenesis of “Zhanguohong” agate from Xuanhua, Hebei province. J. Gems Gemmol. 2017, 19, 1–11, (In Chinese with English abstract). [Google Scholar]
  28. Gao, Y.Q. Geological features and metallogenetic conditions of agate deposits in Cunzhuyingzi village. Jilin Agric. 2011, 12, 265. (In Chinese) [Google Scholar]
  29. Wang, Y.L.; Zhong, M.S.; Jia, C.; Yan, N.; Wang, Z.L.; Wang, J.; Zhou, C.S. Metallogeneic regularity and prospecting direction of agate in volcanic rocks of Fuxin area, western Liaoning. Geol. China 2011, 38, 1179–1187, (In Chinese with English abstract). [Google Scholar]
  30. Zhou, D.Y.; Chen, H.; Lu, T.J.; Ke, J.; He, M.Y. Study on the relationship between the relative content of moganite and the crystallinity of quartzite jade by Raman scattering spectroscopy, infrared absorption spectroscopy and X-ray diffraction techniques. Rock Miner. Anal. 2015, 34, 652–658, (In Chinese with English abstract). [Google Scholar]
  31. Lu, Z.Y.; He, X.M.; Lin, C.L.; Jin, X.Y.; Pan, Y.M. Identification of Beihong agate and Nanhong agate from China based on chromaticity and Raman spectra. Spectrosc. Spect. Anal. 2019, 39, 2153–2159, (In Chinese with English abstract). [Google Scholar]
  32. Xu, C.; Liang, R.; Yang, H.X.; Zhao, J. Prospecting of agate deposit in Zhangjiakou, Hebei province. J. Gems Gemmol. 2017, 19, 17–24, (In Chinese with English abstract). [Google Scholar]
  33. Qi, J.Y. Metallogenic characteristics and prospecting orientation of the agate deposits in western Liaoning, China. Geol. Resour. 2014, 23, 135–137, (In Chinese with English abstract). [Google Scholar]
  34. Fourth Bureau of Geology and Mineral Resources of the Liaoning Province (FBGMRLP). Prospecting Report of Agate Deposits Near Cunzhuyingzi Village, Beipiao, Liaoning Province, 2011; unpublished report in Chinese.
  35. Bureau of Geology and Mineral Resources of the Liaoning Province (BGMRLP). Regional Geology of Liaoning Province; Geological Publishing House: Beijing, China, 1989; pp. 1–856, (In Chinese with English summary). [Google Scholar]
  36. Yang, X.D.; Li, X.Y. Stratigraphy of Liaoning Province; China University of Geosciences Press: Wuhan, China, 1997; pp. 1–247. (In Chinese) [Google Scholar]
  37. Mi, J.R.; Xu, K.Z.; Zhang, C.B.; Chang, J.P.; Yao, P.Y. Mosozic strata in Beipiao, Liaoning province. J. Jilin Univ. Earth Sci. Ed. 1980, 4, 18–37. (In Chinese) [Google Scholar]
  38. Wong, W.H. Geological structures in Beipiao, Jehol. Bull. Geol. Surv. China 1928, 11, 1–23. (In Chinese) [Google Scholar]
  39. Wong, W.H. Crustal movement in eastern China. Proccedings of the 3th Pan-Pacific Scientific Congress, Tokyo, Japan, 30 October–11 November 1926. [Google Scholar]
  40. Zhao, Y.; Zhang, S.H.; Xu, G.; Yang, Z.Y.; Hu, J.M. The Jurassic major tectonic events of the Yanshanian intraplate deformation belt. Geol. Bull. China 2004, 23, 854–863, (In Chinese with English abstract). [Google Scholar]
  41. Zhang, C.H.; Li, C.M.; Deng, H.L.; Liu, Y.; Liu, L.; Wei, B.; Li, H.B.; Liu, Z. Mesozoic contraction deformation in the Yanshan and northern Taihang mountains and its implications to the destruction of the North China Craton. Sci. China Earth Sci. 2011, 54, 798–822. [Google Scholar] [CrossRef]
  42. Davis, G.A.; Zheng, Y.D.; Wang, C.; Darby, B.J.; Zhang, C.H.; Gehrels, G. Mesozoic tectonic evolution of the Yanshan fold and thrust belt, with emphasis on Hebei and Liaoning provinces, northern China. In Paleozoic and Mesozoic Tectonic Evolution of Central Asia: From Continental Assembly to Intracontinental Deformation; Hendrix, M.S., Davis, G.A., Eds.; Geological Society of America Memoir: Boulder, CO, USA, 2001; Volume 194, pp. 171–197. [Google Scholar]
  43. Liu, S.F.; Su, S.; Zhang, G.W. Early Mesozoic basin development in north China: Indications of cratonic deformation. J. Asian Earth Sci. 2013, 62, 221–236. [Google Scholar] [CrossRef]
  44. Meng, Q.R.; Wei, H.H.; Wu, G.L.; Duan, L. Early Mesozoic tectonic settings of the northern North China Craton. Tectonophysics 2014, 611, 155–166. [Google Scholar] [CrossRef]
  45. Grabau, A.W. Stratigraphy of China, Part II: Mesozoic; Geological Survey of China: Beijing, China, 1928; pp. 1–774.
  46. Chen, P.J.; Jin, F. The Jehol Biota; Press of University of Science and Technology of China: Hefei, China, 1999; pp. 1–342, (In Chinese with English summary). [Google Scholar]
  47. Zhou, Z.H.; Barrett, P.M.; Hilton, J. An exceptionally preserved Lower Cretaceous ecosystem. Nature 2003, 421, 807–814. [Google Scholar] [CrossRef]
  48. Chen, J.S.; Li, B.; Yao, Y.L.; Liu, M.; Yang, F.; Xing, D.H.; Li, W.; Wang, Y. Comparison between Mesozoic volcanic rock strata in northeast of Liaoning–South of Jilin and Yixian Formation in west of Liaoning. Acta Geol. Sin. 2016, 90, 2733–2746, (In Chinese with English abstract). [Google Scholar]
  49. Xu, D.B.; Li, B.F.; Chang, Z.L.; Zhang, J.B.; Cai, H. A study of the U-Pb isotope age and the sequence of the Cretaceous volcanics and coal-searching in Fuxin-Zhangwu-Heishan area, west Liaoning province. Earth Sci. Front. 2012, 19, 155–166, (In Chinese with English abstract). [Google Scholar]
  50. Zhang, H.; Liu, X.M.; Zhang, Y.Q.; Yuan, H.L.; Hu, Z.C. Zircon U-Pb ages of bottom and top parts of the Zhangjiakou Formation in Lingyuan area (west Liaoning province) and Luanping area (north Hebei province) and their significance. J. China Univ. Geosci. 2005, 16, 115–129. [Google Scholar]
  51. Fan, W.M.; Zhang, H.F.; Baker, J.; Jarvis, K.E.; Mason, P.R.D.; Menzies, M.A. On and off the North China Craton: Where is the Archaean keel? J. Petrol. 2000, 41, 933–950. [Google Scholar] [CrossRef]
  52. Gao, S.; Rudnick, R.L.; Yuan, H.L.; Liu, X.M.; Liu, Y.S.; Xu, W.L.; Ling, W.L.; Ayers, J.; Wang, X.C.; Wang, Q.H. Recycling lower continental crust in the North China Craton. Nature 2004, 432, 892–897. [Google Scholar] [CrossRef] [PubMed]
  53. Gao, S.; Zhang, J.F.; Xu, W.L.; Liu, Y.S. Delamination and destruction of the North China Craton. Chin. Sci. Bull. 2009, 54, 3367–3378. [Google Scholar] [CrossRef] [Green Version]
  54. Griffin, W.L.; Andi, Z.; O’Reilly, S.Y.; Ryan, C.G. Phanerozoic evolution of the lithosphere beneath the Sino-Korean Craton. In Mantle Dynamics and Plate Interactions in East Asia; Flower, M.F.J., Chung, S.L., Lo, C.H., Lee, T.Y., Eds.; American Geophysical Union: Washington, DC, USA, 1998; Volume 27, pp. 107–126. [Google Scholar]
  55. Liu, J.L.; Davis, G.A.; Ji, M.; Guan, H.M.; Bai, X.D. Crustal detachment and destruction of the keel of North China Craton: Constraints from Late Mesozoic extensional structures. Earth Sci. Front. 2008, 15, 72–81. [Google Scholar] [CrossRef]
  56. Menzies, M.A.; Fan, W.M.; Zhang, M. Palaeozoic and Cenozoic lithoprobes and the loss of > 120 km of Archaean lithosphere, Sino-Korean Craton, China. Geol. Soc. Lond. Spec. Publ. 1993, 76, 71–81. [Google Scholar] [CrossRef]
  57. Menzies, M.A.; Xu, Y.G. Geodynamics of the North China Craton. In Mantle Dynamics and Plate Interactions in East Asia; Flower, M.F.J., Chung, S.L., Lo, C.H., Lee, T.Y., Eds.; American Geophysical Union: Washington, DC, USA, 1998; Volume 27, pp. 155–165. [Google Scholar]
  58. Lin, J.Q.; Tan, D.J.; Chi, X.G.; Bi, L.J.; Xie, C.F.; Xu, W.L. Mesozoic Granites in Jiao–Liao Peninsula; Science Press: Beijing, China, 1992; pp. 1–208. (In Chinese) [Google Scholar]
  59. Sun, J.F.; Yang, J.H. Early Cretaceous A-type granites in the eastern North China Block with relation to destruction of the craton. J. China Univ. Geosci. Chin. Ed. 2009, 34, 137–147, (In Chinese with English abstract). [Google Scholar]
  60. Wu, F.Y.; Lin, J.Q.; Wilde, S.A.; Zhang, X.O.; Yang, J.H. Nature and significance of the Early Cretaceous giant igneous event in eastern China. Earth Planet. Sci. Lett. 2005, 233, 103–119. [Google Scholar] [CrossRef]
  61. Cooper, J.B. Chemometric analysis of Raman spectroscopic data for process control applications. Chemometr. Intell. Lab. 1999, 46, 231–247. [Google Scholar] [CrossRef]
  62. Kingma, K.J.; Hemley, R.J. Raman spectroscopic study of microcrystalline silica. Am. Mineral. 1994, 79, 269–273. [Google Scholar]
  63. Ilieva, A.; Mihailova, B.; Tsintsov, Z.; Petrov, O. Structural state of microcrystalline opals: A Raman spectroscopic study. Am. Mineral. 2007, 92, 1325–1333. [Google Scholar] [CrossRef]
  64. Ciobotă, V.; Salama, W.; Jentzsch, P.V.; Tarcea, N.; Rösch, P.; El Kammar, A.; Morsy, R.S.; Popp, J. Raman investigations of Upper Cretaceous phosphorite and black shale from Safaga district, Red Sea, Egypt. Spectrochim. Acta Part A 2014, 118, 42–47. [Google Scholar] [CrossRef]
  65. De Faria, D.L.A.; Venâncio Silva, S.; De Oliveira, M.T. Raman microspectroscopy of some iron oxides and oxyhydroxides. J. Raman Spectrosc. 1997, 28, 873–878. [Google Scholar] [CrossRef]
  66. Oh, S.J.; Cook, D.C.; Townsend, H.E. Characterization of iron oxides commonly formed as corrosion products on steel. Hyperfine Interact. 1998, 112, 59–66. [Google Scholar] [CrossRef]
  67. Legodi, M.A.; de Waal, D. The preparation of magnetite, goethite, hematite and maghemite of pigment quality from mill scale iron waste. Dyes Pigments 2007, 74, 161–168. [Google Scholar] [CrossRef]
  68. Natkaniec-Nowak, L.; Dumańska-Słowik, M.; Pršek, J.; Lankosz, M.; Wróbel, P.; Gaweł, A.; Kowalczyk, J.; Kocemba, J. Agates from Kerrouchen (the Atlas mountains, Morocco): Textural types and their gemmological characteristics. Minerals 2016, 6, 77. [Google Scholar] [CrossRef]
  69. Pop, D.; Constantina, C.; Tătar, D.; Kiefer, W. Raman spectroscopy on gem-quality microcrystalline and amorphous silica varieties from Romania. Stud. UBB Geol. 2004, 49, 41–52. [Google Scholar] [CrossRef] [Green Version]
  70. French, M.W.; Worden, R.H.; Lee, D.R. Electron backscatter diffraction investigation of length-fast chalcedony in agate: Implications for agate genesis and growth mechanisms. Geofluids 2013, 13, 32–44. [Google Scholar] [CrossRef]
  71. Götze, J.; Plötze, M.; Fuchs, H.; Habermann, D. Defect structure and luminescence behaviour of agate—Results of electron paramagnetic resonance (EPR) and cathodoluminescence (CL) studies. Mineral. Mag. 1999, 63, 149–163. [Google Scholar] [CrossRef]
  72. Hatipoğlu, M.; Ajò, D.; Kırıkoğlu, M.S. Cathodoluminescence (CL) features of the Anatolian agates, hydrothermally deposited in different volcanic hosts from Turkey. J. Lumin. 2011, 131, 1131–1139. [Google Scholar] [CrossRef]
  73. Frondel, C. Systematic compositional zoning in the quartz fibers of agates. Am. Mineral. 1985, 70, 975–979. [Google Scholar]
  74. Heaney, P.J.; Davis, A.M. Observation and origin of self-organized textures in agates. Science 1995, 269, 1562–1565. [Google Scholar] [CrossRef] [PubMed]
  75. Moxon, T.; Carpenter, M.A. Crystallite growth kinetics in nanocrystalline quartz (agate and chalcedony). Mineral. Mag. 2009, 73, 551–568. [Google Scholar] [CrossRef]
  76. Zhang, M.; Moxon, T. Infrared absorption spectroscopy of SiO2-moganite. Am. Mineral. 2014, 99, 671–680. [Google Scholar] [CrossRef]
  77. Cornell, R.M.; Schwertmann, U. The Iron Oxides: Structure, Properties, Reactions, Occurences and Uses, 2nd ed.; Wiley-VCH Verlag GmbH & Co. KGaA: Weinheim, German, 2003; pp. 1–663. [Google Scholar]
  78. Götze, J.; Plötze, M.; Tichomirowa, M.; Fuchs, H.; Pilot, J. Aluminium in quartz as an indicator of the temperature of formation of agate. Mineral. Mag. 2001, 65, 407–413. [Google Scholar] [CrossRef]
  79. Götze, J.; Möckel, R.; Vennemann, T.; Müller, A. Origin and geochemistry of agates in Permian volcanic rocks of the Sub-Erzgebirge basin, Saxony (Germany). Chem. Geol. 2016, 428, 77–91. [Google Scholar] [CrossRef]
  80. Harder, H.; Flehmig, W. Quarzsynthese bei tiefen temperaturen. Geochim. Cosmochim. Acta 1970, 34, 295–305, (In German with English abstract). [Google Scholar] [CrossRef]
  81. Harder, H. Nontronite synthesis at low temperatures. Chem. Geol. 1976, 18, 169–180. [Google Scholar] [CrossRef]
  82. Dekov, V.M.; Kamenov, G.D.; Stummeyer, J.; Thiry, M.; Savelli, C.; Shanks, W.C.; Fortin, D.; Kuzmann, E.; Vértes, A. Hydrothermal nontronite formation at Eolo Seamount (Aeolian volcanic arc, Tyrrhenian Sea). Chem. Geol. 2007, 245, 103–119. [Google Scholar] [CrossRef]
  83. Christensen, A.N. Hydrothermal preparation of goethite and haematite from amorphous iron (III) hydroxide. Acta Chem. Scand. 1968, 22, 1487–1490. [Google Scholar] [CrossRef]
  84. Das, S.; Hendry, M.J.; Essilfie-Dughan, J. Transformation of Two-Line Ferrihydrite to Goethite and Hematite as a Function of pH and Temperature. Environ. Sci. Technol. 2011, 45, 268–275. [Google Scholar] [CrossRef] [PubMed]
Figure 1. (a) Schematic tectonic map showing the distribution of the major faults in Liaoning, China (modified after [35,36]); (b) geological map of the Cunzhuyingzi agate deposit and its adjacent areas (modified after [35,36]). 1 Quaternary sediments; 2–5 Cretaceous sedimentary–volcanic rocks (2 Sunjiawan Fm; 3 Fuxin Fm; 4 Jiufotang Fm; 5 Yixian Fm); 6–9 Jurassic sedimentary–volcanic rocks (6 Tuchengzi Fm; 7 Lanqi Fm; 8 Haifanggou Fm; 9 Beipiao Fm); 10 Archean basement rocks; 11 Permian–Jurassic intrusive rocks; 12–14 Cretaceous intrusive rocks (12 granitoid rocks; 13 diorite porphyrite; 14 syenite porphyry); 15 fault; 16 conformity and unconformity; 17 toponym; 18 sample location. ① Lingyuan–Beipiao–Shahe fault; ② Chaoyang–Yaowangmiao fault. Fm: Formation.
Minerals 10 00401 g001
Figure 2. Outcrop photographs of the Zhanguohong agate. (a) Mining pit near Cunzhuyingzi village; (b,c) vein type agates; (df) irregularly-shaped agates with banded (d,e) and massive (f) structures.
Minerals 10 00401 g002
Figure 3. Photograph showing the characteristics of the Zhanguohong agate samples collected from the Cunzhuyingzi deposit.
Minerals 10 00401 g003
Figure 4. Microscopic characteristics of banded (ag) and massive (h) Zhanguohong agates. (a,b) Multi-stage (S-Ⅰ to S-Ⅲ) precipitation of silica polymorphs; (c,d) complex changes in grain sizes and shapes of the multiple silica phases precipitated in two stages (S-Ⅰ and S-Ⅱ) and diffusion of the Fe compounds. Note that a typical sandwich-like banded agate comprising gQ, jQ, and f-Ch interlayers is shown in photograph d. The blue arrows indicate the diffusive direction of the Fe compounds; (e) a Qtz interlayer in the sandwich-like banded agate; (f,g) radiated and spherical structures outlined by dotted red lines; (h) massive agate virtually impregnated with Fe compounds. Photograph a, the upper right part of photograph c, and the upper part of photograph d are under plane-polarized light (PPL), while the other parts and photographs are under cross-polarized light (CPL). gQ: micro-granular quartz; jQ: jigsaw quartz; f-Ch: fibrous chalcedony; Qtz: macro-quartz; RS: radiated structure; SS: spherical structure; Vein: microcrystalline silica vein.
Minerals 10 00401 g004
Figure 5. (ac) Characteristics of the Fe-bearing zones consisting mainly of short prismatic (a), spherical (b), and granular (c) ferruginous inclusions, and (d) migration of Fe compounds. Photographs a and d, and the lower right parts of photographs b and c are under PPL, while the other parts and photographs are under CPL.
Minerals 10 00401 g005
Figure 6. (a) XRD patterns of samples Z–4 and Z–9; (b) enlarged detail of part of the XRD patterns, with pdf cards of Q and Mo at the bottom [14]. Q: α-quartz; Mo: moganite; Ab: albite; He: hematite.
Minerals 10 00401 g006
Figure 7. Representative Raman spectra of the silica matrix of the agates. The peaks of He and Gt are indicated by purple and blue dashed vertical lines, respectively. Note that the Lorentzian fit for the 465 cm−1 (Q) and 502 cm−1 (Mo) bands of the curve Z–4–11 is shown in the upper right corner. Gt: goethite. The other abbreviations are the same as in Figure 6.
Minerals 10 00401 g007
Figure 8. Spatial distribution of moganite in banded agate (sample Z–4) with multi-stage (S-Ⅰ to S-Ⅲ) silica precipitation revealed by Raman spectroscopic analysis. (a,c) Microstructures and distribution of the analysis points (red dots with white numbers); (b) 3D spectra between 400 and 600 cm−1 for each analysis point; (d) moganite content and intensity of the peak at ~1316 cm−1. The upper part of photograph c is under PPL, while Photograph a and the lower and middle parts of photograph c are under CPL.
Minerals 10 00401 g008
Figure 9. Spatial distribution of moganite in banded agate (sample Z–6) with two-stage (S-Ⅰ and S-Ⅱ) silica precipitation revealed by Raman spectroscopic analysis. (a,b) Microstructures and distribution of the analysis points (red dots with white numbers); (c) moganite content and intensity of the peak at ~1316 cm−1. The upper part of photograph a is under PPL, while photograph b and the lower and middle parts of photograph a are under CPL.
Minerals 10 00401 g009
Figure 10. Spatial distribution of moganite in different samples (Z–2, –8, and –12). (ac) Microstructures and distribution of the analysis points (red dots with white numbers); (a) Massive agate (PPL); (b) banded agate with spherical structure (CPL). The inset photograph shows the general microstructural characteristics under PPL; (c) Agate with two periods of silica precipitation (CPL); (d) moganite content and intensity of the peak at ~1316 cm−1.
Minerals 10 00401 g010
Figure 11. Moganite content (M) versus intensity of the Raman band at ~1316 cm−1 (I) for the silica matrix. Note that the grey line shows the positive correction between M and I. The analysis points with and without the superimposition of ferruginous inclusions (FI) are marked with open and solid circles, respectively.
Minerals 10 00401 g011
Figure 12. (ad) Microphotographs (PPL) and (e) Raman spectra of the ferruginous particles. The peaks of He, Gt, Q and Mo are indicated by purple, blue, black, and grey dashed vertical lines, respectively. Note that the Lorentzian fit for curve 4 in the 270–430 cm−1 range is shown in the upper right corner. The abbreviations are the same as in Figure 6 and Figure 7.
Minerals 10 00401 g012
Figure 13. Summary of the moganite contents of the microcrystalline silica samples and the ages of their volcanic wall rocks. The inset picture provides detailed information on the moganite content and the ages of the Phanerozoic rocks. Note that the ages of the Phanerozoic rocks are approximate ages.
Minerals 10 00401 g013
Figure 14. Model of the formation process of the banded Zhanguohong agates. (a,b) Rapid precipitation of gQ and f-Ch. The enlarged pictures in the lower parts of photographs a and b show the fluctuations in the moganite content and the zonations of the Fe-bearing particles, respectively; (c) growth of defect-free quartz crystals (Qtz) without moganite. The abbreviations are the same as in Figure 4.
Minerals 10 00401 g014
Table 1. Raman frequencies of hematite, goethite, moganite, and α-quartz.
Hematite [64,65,66]Goethite [65,66]Moganite [62]α-Quartz [62]
ν1 (cm−1)ν1 (cm−1)ν1 (cm−1)ν1 (cm−1)Mode Symmetry
129128E(LO+TO)
141
227 220206A1
246243
265265E(LO+TO)
293299
317
355A1
370
377
394398394E(TO)
411418 401E(LO)
432
449450E(TO)
483463464A1
498 501
511E(LO)
550
610
685693696E(LO+TO)
792
796E(TO)
808E(LO)
833
950
993978
1058
1069E(TO)
10841085A1
11711162E(LO+TO)
1177
1230E(LO)
1320

