Article

Effect of Mineralogy on the Beneficiation of REE from Heavy Mineral Sands: The Case of Nea Peramos, Kavala, Northern Greece

by
Christina Stouraiti
1,*,
Vassiliki Angelatou
2,
Sofia Petushok
1,
Konstantinos Soukis
1 and
Demetrios Eliopoulos
2
1
Faculty of Geology and Geoenvironment, National and Kapodistrian University of Athens, 15784 Athens, Greece
2
Department of Mineral Processing, Institute of Geology and Mineral Exploration, 13677 Acharnes, Greece
*
Author to whom correspondence should be addressed.
Minerals 2020, 10(5), 387; https://doi.org/10.3390/min10050387
Submission received: 24 February 2020 / Revised: 21 April 2020 / Accepted: 22 April 2020 / Published: 26 April 2020

Abstract

:
Beneficiation of a rare earth element (REE) ore from heavy mineral (HM) sands by particle size classification in conjunction with high-intensity magnetic separation (HIMS) was investigated. The HM sands of Nea Peramos, Kavala, Northern Greece, contain high concentrations of REE accommodated mainly in silicate minerals, such as allanite. However, the potential of the Northern Greek placer for REE exploitation has not been fully evaluated due to limited on-shore and off-shore exploration drilling data. Characterization of the magnetic separation fractions using XRD and bulk ICP-MS chemical analysis showed that the magnetic products at high intensities were strongly enriched in the light REE (LREE), relative to the non-magnetic fraction. Allanite and titanite are the major host mineral for REE in the magnetic products but mainly allanite controls the REE budget due its high concentration in LREE. SEM/EDS and ICP-MS analysis of the different particle size fractions showed LREE enrichment in the fractions −0.425 + 0.212 mm, and a maximum enrichment in the −0.425 + 0.300 mm. The maximum enrichment is achieved after magnetic separation of the particle size fractions. Mass balance calculations showed that the maximum REE recovery is achieved after magnetic separation of each particle size fraction separately, i.e., 92 wt.% La, 91 wt.% Ce, and 87 wt.% Nd. This new information can contribute to the optimization of beneficiation process to be applied for REE recovery from HM black sands.

Graphical Abstract

1. Introduction

Heavy mineral sands (or black sands) are coastal deposits of resistant dense minerals that locally form economic concentrations of the heavy minerals. They serve as a major source of titanium worldwide with main minerals rutile and ilmenite and, in some cases, show high accumulation in rare earth elements (REE) and Th [1]. The rare earth elements (REE) are a group of 17 chemically similar elements, the lanthanides, scandium (Sc), and yttrium (Y) which behave similarly in most environments in the Earth’s crust. REE are considered as “critical metals” for the European Union economy due to the vast application in a variety of sectors, a complicated production process as well as political issues associated with the monopoly in supply from China, especially the supply of heavy rare earths [2,3,4]. According to the recent EU Joint Research Center (JRC) report among the REE, six are identified as more critical, because their combined importance for strategic sectors of the economy such as high-efficiency electronics and energy technologies with risks of supply shortage. These are Dy, Eu, Tb, Y, Pr, and Nd [5].
Currently REE are not exploited in Europe, however, due to the current situation several exploration projects have been assessed in the course of the recently ended EURARE and ASTER European projects, which showed that some of them are in an advanced stage of exploration and development [6,7]. The most promising cases are the alkaline igneous rock-hosted deposits in South Greenland, the Norra Kärr deposit in Sweden and Fen Complex in Norway (Goodenough et al. [6]) and the alkaline volcanic-derived placers of Aksu Diamas in Turkey [8]. In Greece, the most significant REE concentrations are associated with heavy mineral sands on the coast of Nea Peramos and Strymonikos Gulf. Moreover, the EURARE project highlighted the significance of the secondary REE deposits, such as the bauxite residue (red mud) from the processing of Greek bauxites [4,6,9].
Mudd and Jowitt [1] stretched the economic potential of heavy mineral sands as an important underestimated REE resource especially for monazite and xenotime minerals. HM sands remain excluded from mineral resource considerations mostly due to the environmental problems that are associated with the radioactivity of tailings and the reagents used. However, there has been limited research work on the quantification of these impacts [3].
Geological prospecting by the Institute of Geology and Mineral Exploration (I.G.M.E.) of Greece on the black sands in the broader area of Strymon bay started in 1980’s and focused primarily on the natural enrichment in actinides (U-Th) and associated radioactivity in the on-shore and offshore zones of Loutra Eleftheron to Nea Peramos regions [10,11,12,13] (Figure 1). In the last decade, there is an increasing number of geochemical and mineralogical studies that have been carried out on the coastal areas of Kavala [14,15,16,17,18,19], Sithonia Peninsula of Chalkidiki [20], Touzla Cape [21], and the area of Maronia, Samothrace [22]. Most of these studies focused on the characterization of the placers and their natural radioactivity ([23] and references therein). Previous studies have demonstrated that the heavy minerals, monazite, allanite, titanite, uraninite, zircon, and apatite, are traced in the Kavala black sands, derive from the Symvolon/Kavala pluton, a deformed granodioritic complex of Miocene age (Table 1) [6,9,14,24]. Despite the low grade of the Greek placers at Nea Peramos, as emphasized in the EURARE project, there is a good potential of beneficiation due to the coarse particle size and the liberation of REE minerals. The Northern Greece heavy mineral sands potential was not feasible to be fully evaluated as a potential REE resource in the course of EURARE project due to limited exploration data.
Worldwide, the commonly exploited rare earth-bearing minerals in industrial scale are bastnäsite, monazite, and xenotime [25]. Other REE-bearing minerals such as eudialyte, synchysite, samarskite, allanite, zircon, steenstrupine, cheralite, rhabdophane, apatite, florencite, fergusonite, loparite, perovskite, cerianite, and pyrochlore are rarely found in deposits of economic significance [26]. However, there are new deposits being under development containing many new REE minerals that seek further understanding, such as zircon, allanite, and fergusonite [27].
Beneficiation of the three commercially extracted heavy minerals, bastnäsite, monazite, and xenotime involves gravity, magnetic, electrostatic, and flotation separation methods with froth flotation being the most commonly applied REE mineral separation operation ([27,28,29] and references therein). There are numerous research articles on REE mineralogy and hydrometallurgical processing but there is still a lack of comprehensive descriptions of the beneficiation methods necessary to concentrate REE minerals. A main reason for this lack is the fact that concentrates of monazite and xenotime worldwide are produced from heavy mineral sands, therefore, comminution is scarcely required [26].
This paper presents results of an ongoing beneficiation study of REE-rich HM sands form the Nea Peramos, Kavala (Northern Greece) at laboratory scale. Two process schemes were applied and tested at laboratory scale in this stage in order to improve understanding of mineral separation by different physical processes including, particle size classification through wet sieving as a preconcentration process followed by high-intensity magnetic separation (HIMS) [26,27]. Scanning electron microscopy (SEM), X-ray diffraction analysis, and inductively coupled plasma–mass spectrometry (ICP-MS) were used in combination, for the characterization of feed material as well as beneficiation products.

Geological Setting

The studied area is situated in Northern Greece, in the internal domain of the Aegean arc (Figure 1). It is part of the Rhodope massif, a polymetamorphosed nappe stack, which comprises high-grade Pre-Alpine felsic to intermediate orthogneisses (mostly Variscan age), schists, and marble interlayered or tectonically overlain by basic to ultrabasic rocks, that were exhumed in the Cenozoic [31,32,33,34,35,36,37,38]. The lowermost Pangaion-Pirin or Lower Unit is exposed in several domes in the Rhodope area and as the footwall to the top to SW Strymon detachment [37,39]. The Pangaion-Pirin Unit comprises a thick marble sequence alternating with schists, both underlain by Variscan orthogneiss and schists [37,40,41]. The Pangaion-Pirin Unit is intruded by several Oligocene to early Miocene granitoids [37,42]. The syn-tectonic early Miocene Symvolon (or Kavala) granodiorite, which occupies a large part of the studied area, has intruded and deformed along the southeastern end of the Strymon detachment [39,41]. Marine deposits of Pliocene age, mainly sandstones and marls, are observed along the coast, covering the granodiorite.

2. Samples and Methods
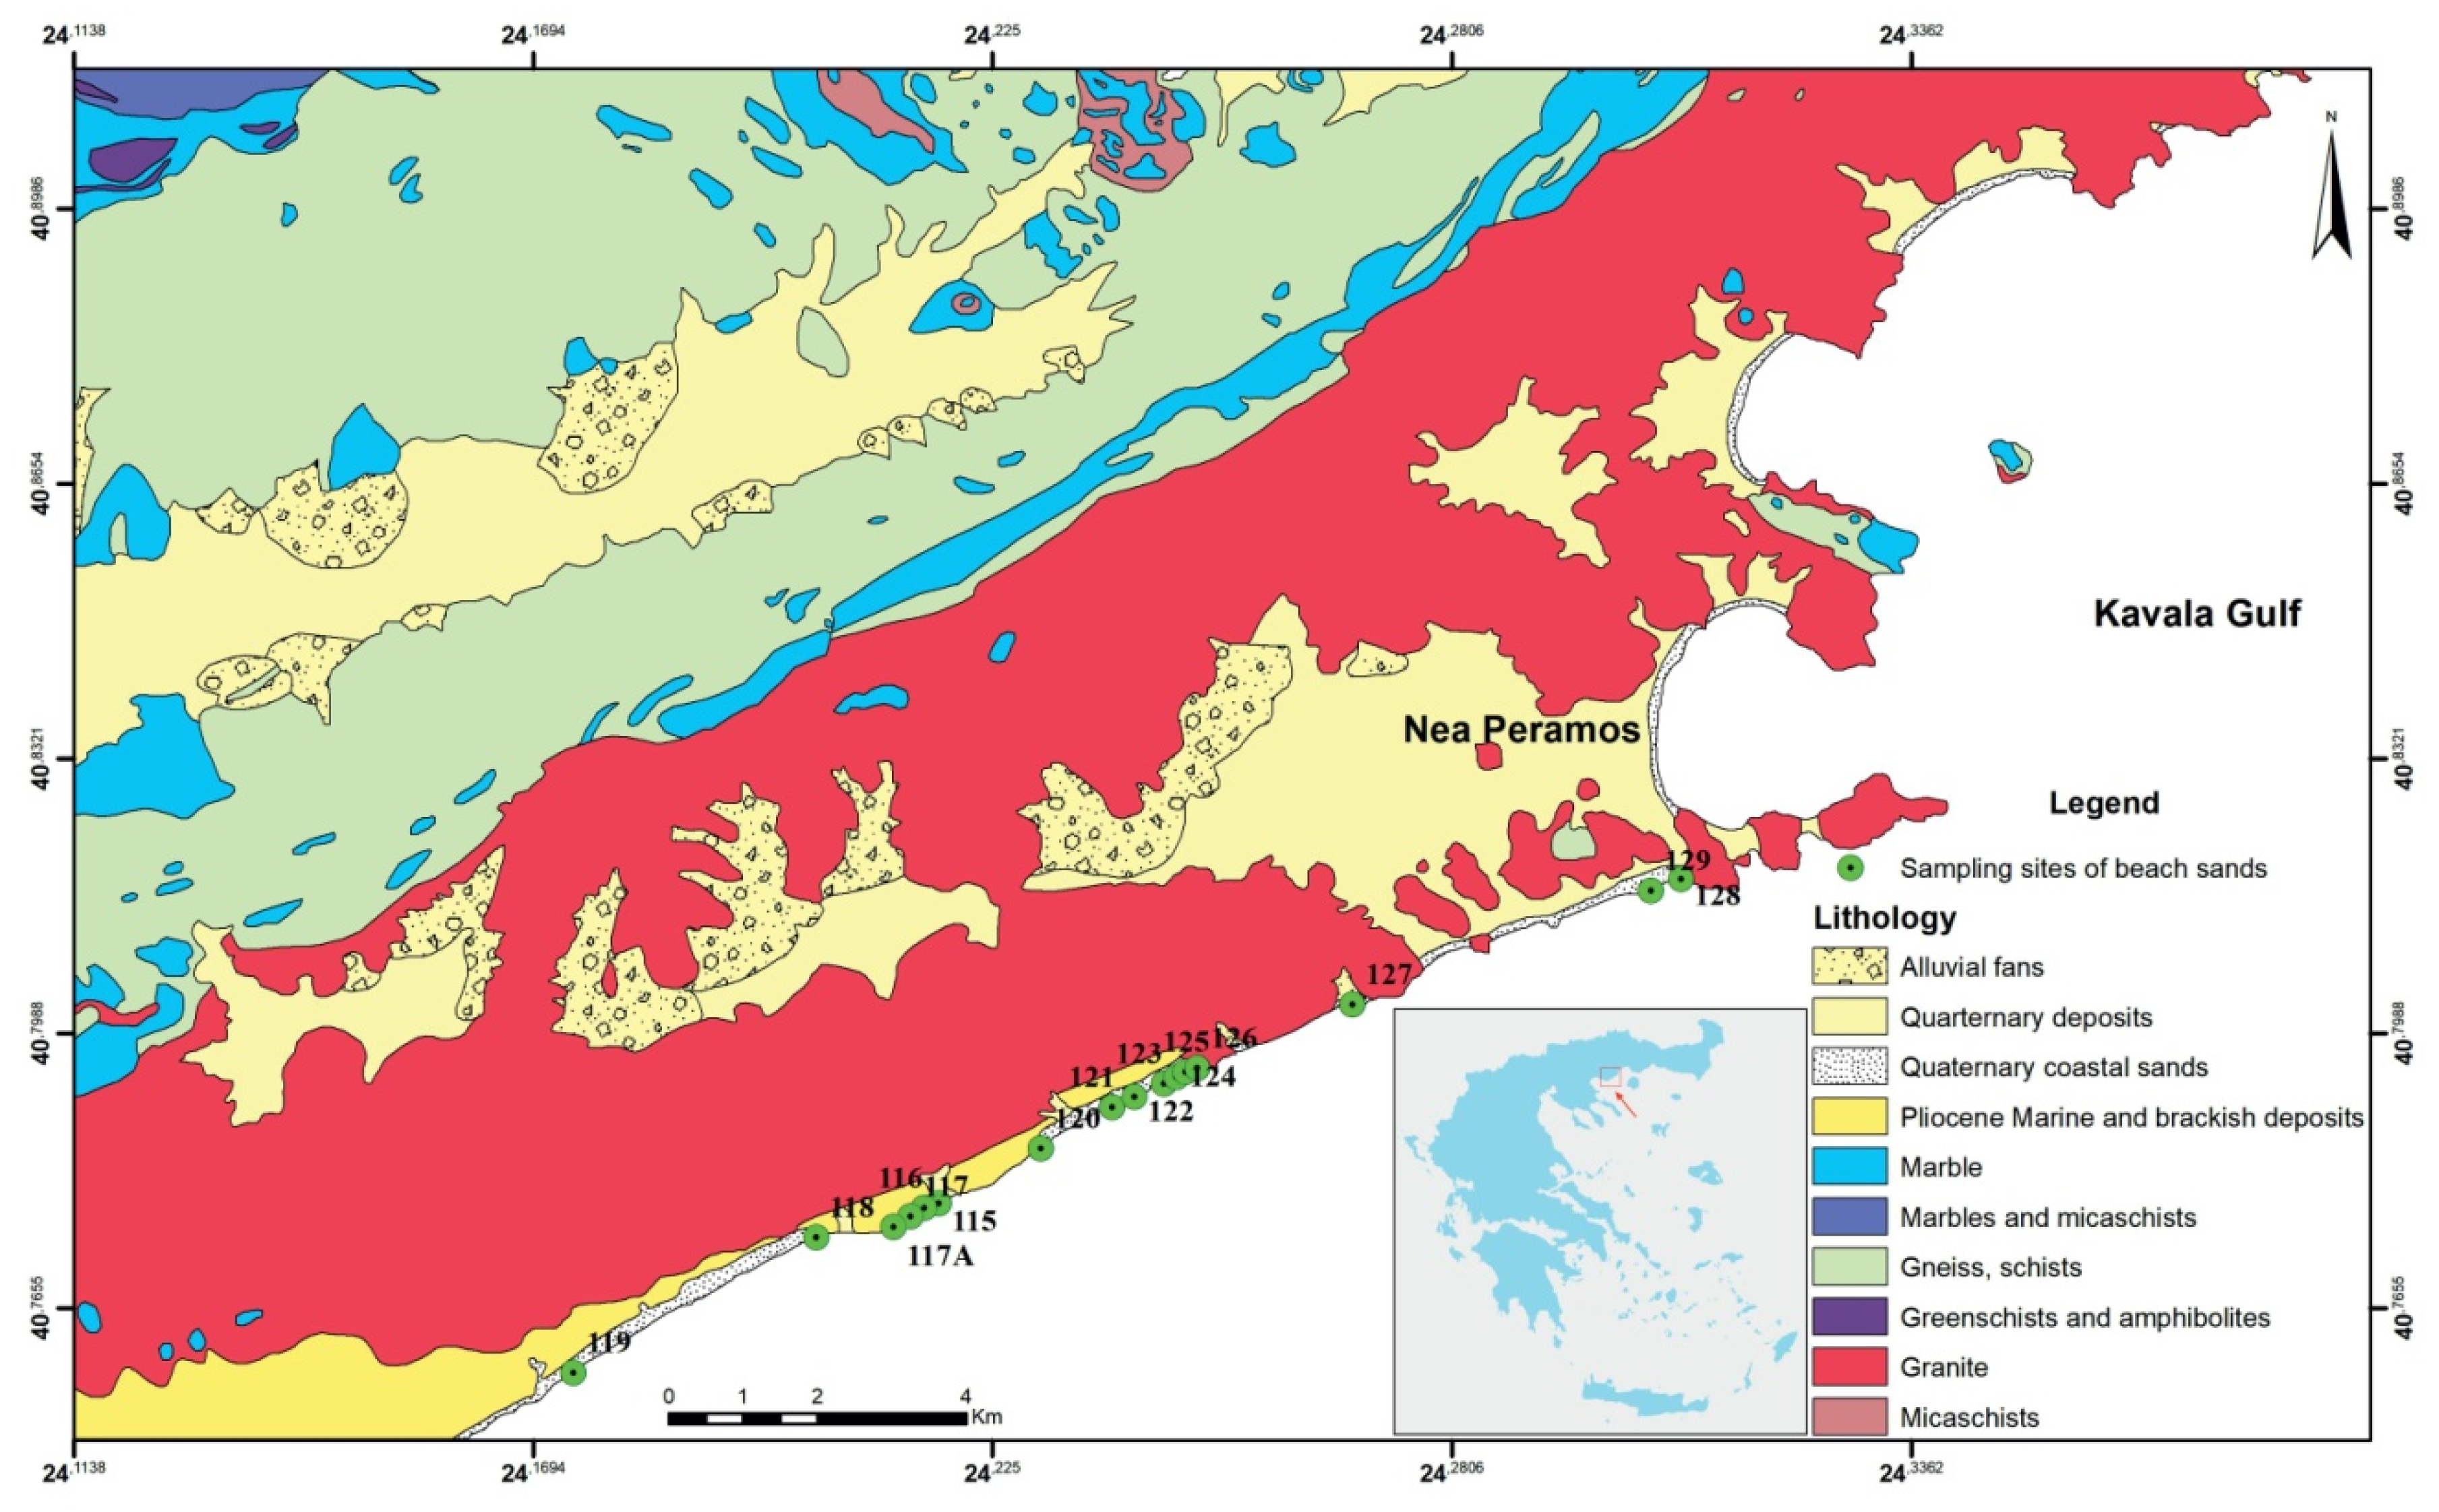
2.1. Sampling

Fifteen samples of coastal sands were collected alongside a coastal line of 10 km from Loutra Eleftheron to Nea Peramos areas, Kavala region, Northern Greece (Figure 1). Sample campaign was carried out in the course of EURARE project during the period of 2013–2015. The sampling technique involved opening holes of 40 cm deep. According to field observations, locally, there were black sand concentrations in layers of few cm thick in alternation with typical light-colored sands. Due to sample inhomogeneity a large amount of ~15 kg of bulk sand from each sampling location was taken for securing a representative sample. A 20 kg sample of placer sand with an initial top size of 1.7 mm was prepared by mixing equal weights of individual collected samples (composite A-mixed sample) and divided by splitting into samples of 2.5 kg.

2.2. Sample Characterization

2.2.1. XRD Analysis

The major mineralogy was determined by powder X-ray diffraction using a Siemens D-5005 diffractometer with Cu K radiation, at the Geology Department of NKUA. Intensities were recorded at 0.02° 2θ step intervals from 3° to 70°, with a 2 s counting time per step. The resultant diffraction patterns were processed using EVA software by Bruker AXS Inc (Madison, WI, USA), in order first to identify peaks and then relate them to selected mineral phases that are present in the Kavala black sands samples (Figure 2). Detection limits are of the order of 1 wt.% approximately, but this is mineral and sample dependent.
The magnetic and non-magnetic fractions and all the particle size fractions were finely ground in the appropriate size, placed in a sample holder, and smeared uniformly onto a glass slide, assuring a flat upper surface.
Semiquantitative analysis was performed using the Reference Intensity Ratio method (RIR) of I/Ic [43]. For the semiquantitative analysis, the Diffract Plus software by Bruker-AXS was used. The minerals that did not have I/Ic ratios, the ratios from similar minerals of the same mineral group were used. For allanite, intensity ratio of epidote (0.9) was used, and for magnesiohornblende, an average ratio of hornblende (0.6) was used.

2.2.2. SEM/EDS Analysis

Sand particles were mounted within a plug of epoxy resin and then polished particle-mount sections were prepared. Before SEM analysis, the thin section was covered with a thin veneer of carbon using a vacuum carbon coater. Textural analysis and semiquantitative elemental analysis of heavy minerals was undertaken using a JEOL JSM-5600 Scanning Electron Microscope (SEM) coupled to an energy dispersive X-ray spectrometer (EDS) of OXFORD LINK ISIS 300 (OXFORD INTRUMENTS), with the use of software for ZAF correction, at the Faculty of Geology and Geoenvironment, NKUA, using secondary electron (SE) and backscatter electron (BSE) modes.

2.2.3. Bulk Chemical Analysis

REE ore sample preparation included initial digestion with Aqua Regia and HF (in order to solve dissolution issues in silicate samples) in Teflon® containers. Subsequently, the residue was chemically attacked with HCl and H2O2. Finally, the samples are preserved in 5% concentrated HCl. REE were analyzed by inductively coupled plasma-mass spectrometry (ICP-MS) at I.G.M.E. (Supplementary Table S1). External calibration solutions with matrix correction were used to measure the instrumental sensitivity of ICP-MS.

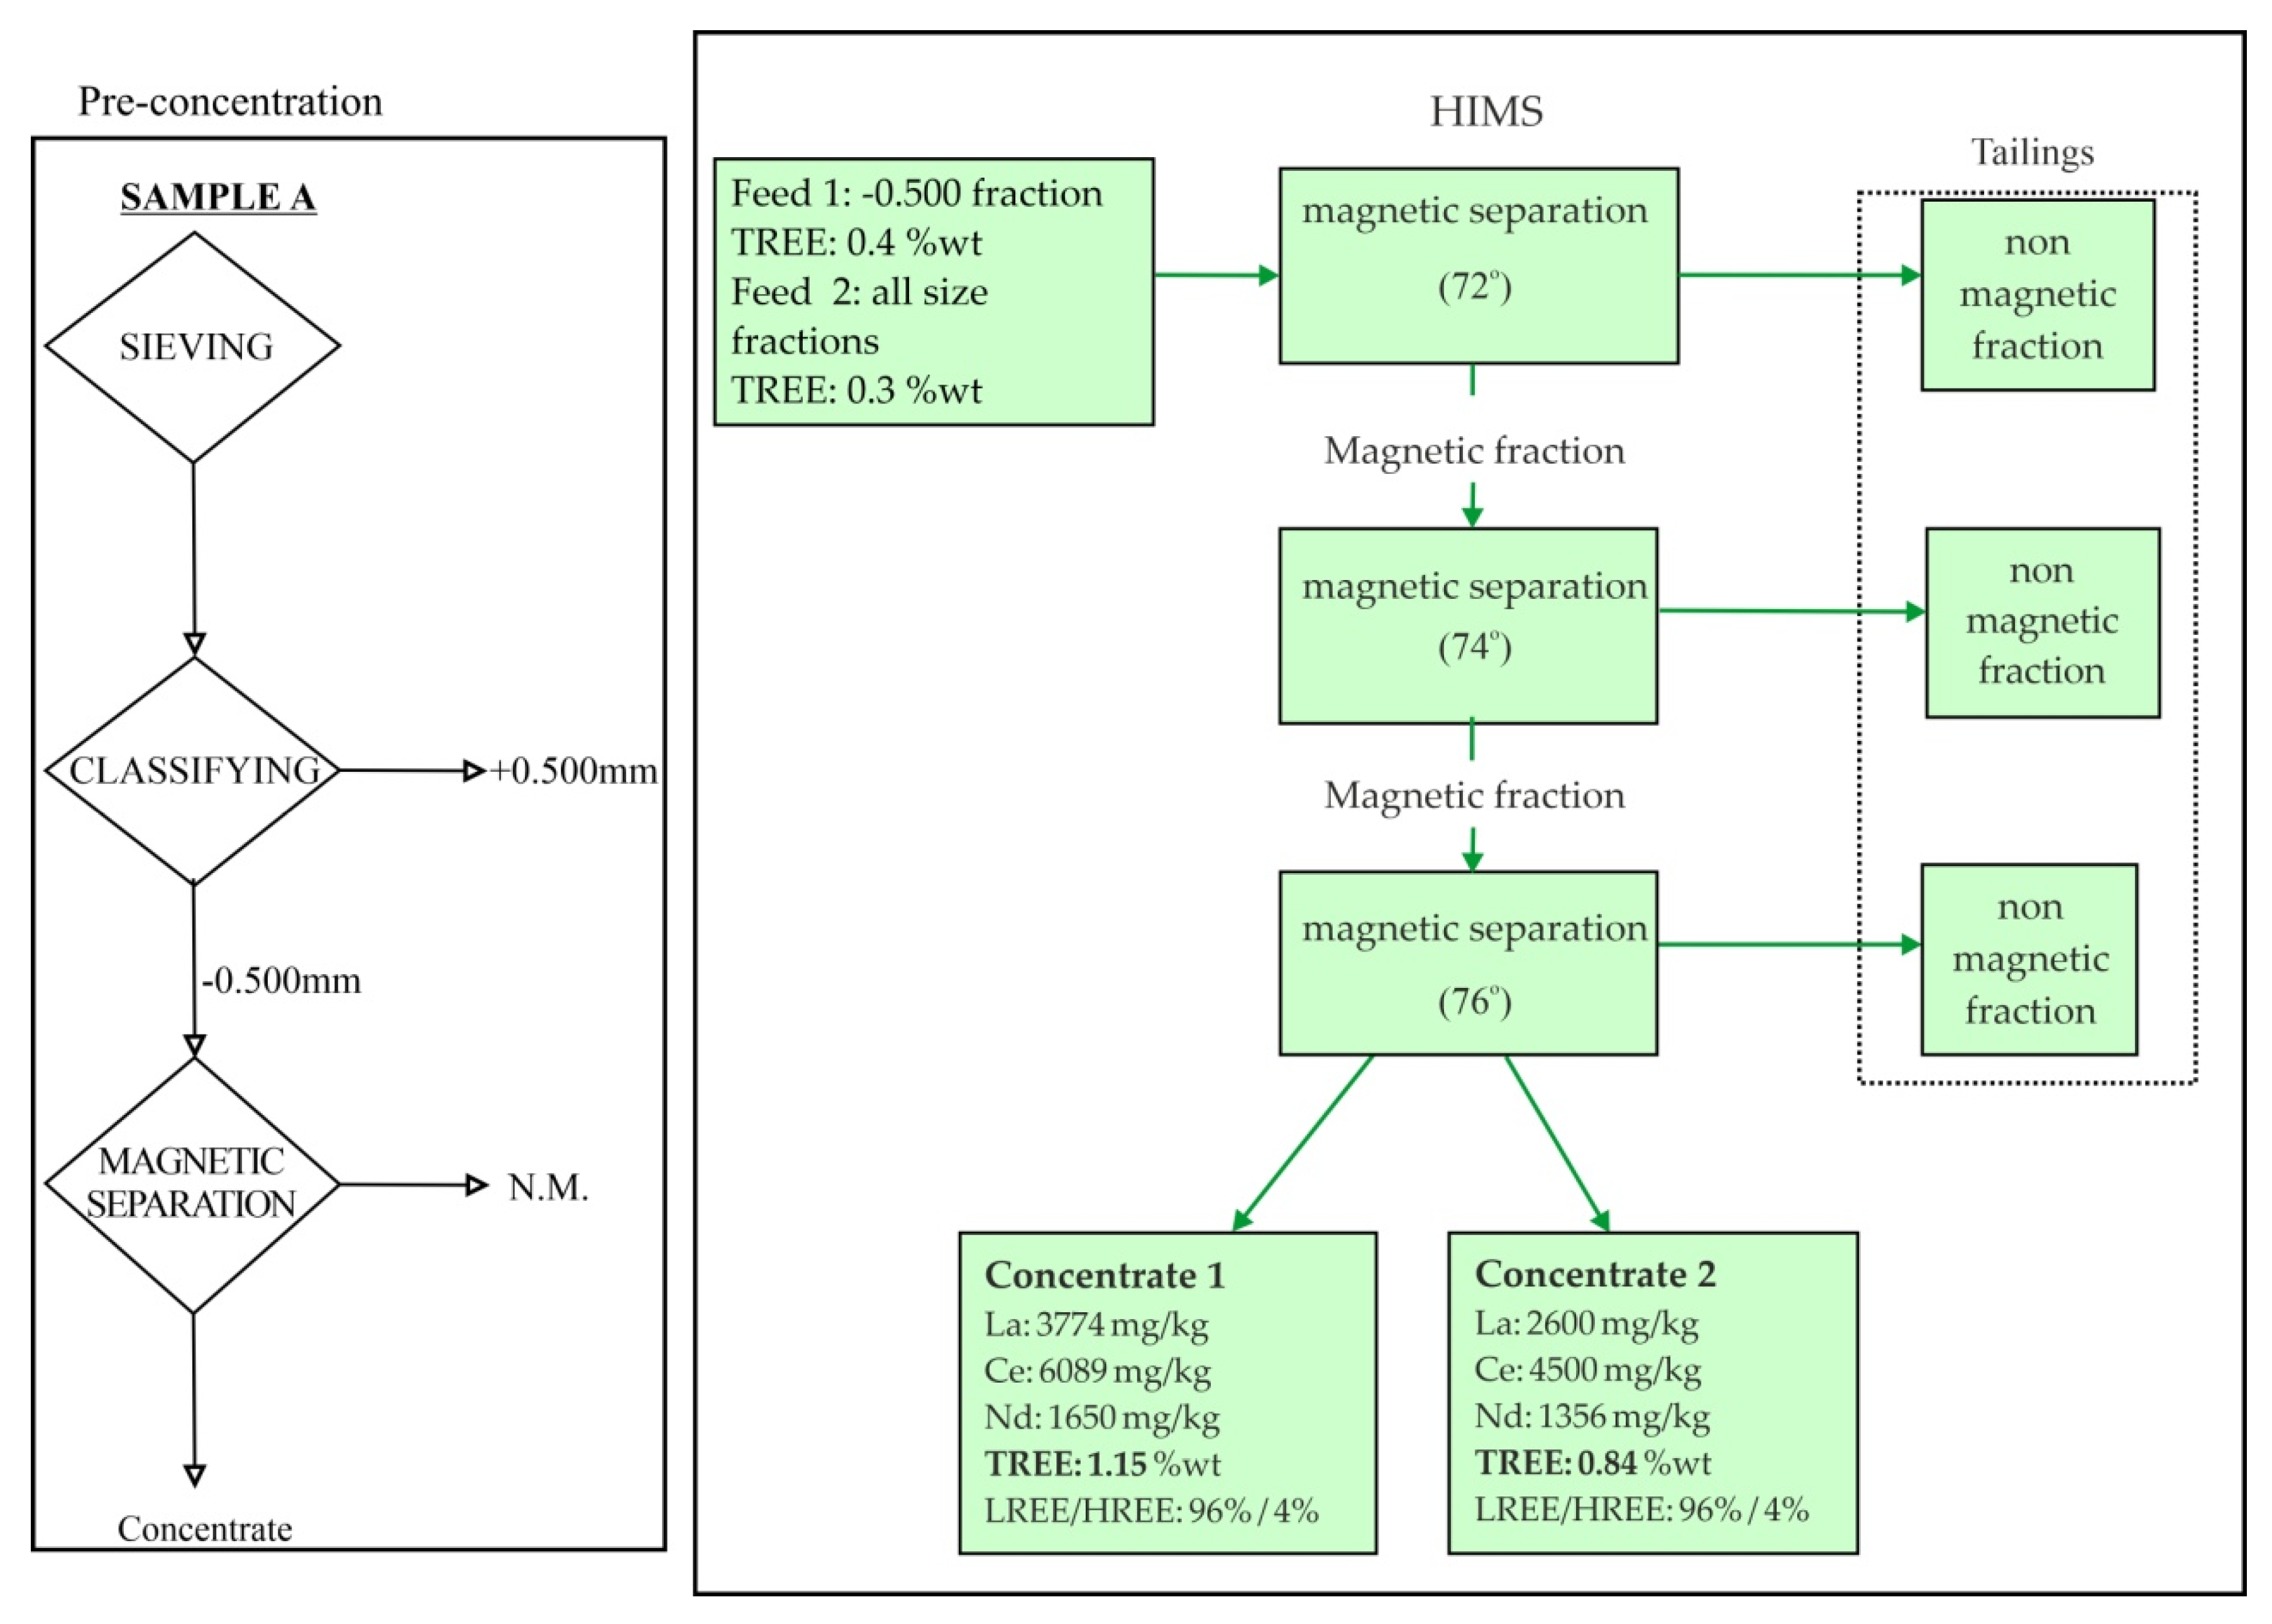
2.3. Beneficiation Tests

The beneficiation tests were conducted at the Laboratory of Beneficiation and Metallurgy, I.G.M.E.

2.3.1. Particle Size Analysis

From the composite sample A-mixed, a representative sample (of 2327 g initial weight) was prepared properly in order to be submitted to particle size analysis. Samples were submitted to wet sieving in order to provide data on particle size distribution, using sieves with aperture of 1.70, 0.850, 0.500, 0.425, 0.355, 0.300, 0.212, and 0.150 mm. All the samples were placed in a dryer for 24 h at 90 °C.
The information acquired by particle size distribution contributes to the study of the effects of particle size, mineral liberation, and association characteristics aiming at the selection of appropriate process schemes to be tested and used. In the course of wet sieving process, a change in the color was observed as we moved onto smaller particle size fractions.
Preconcentration step helps in rejecting early gangue materials thus achieving benefits such as higher feed grades, lower waste stream production in further processes, and finally, low operating costs.

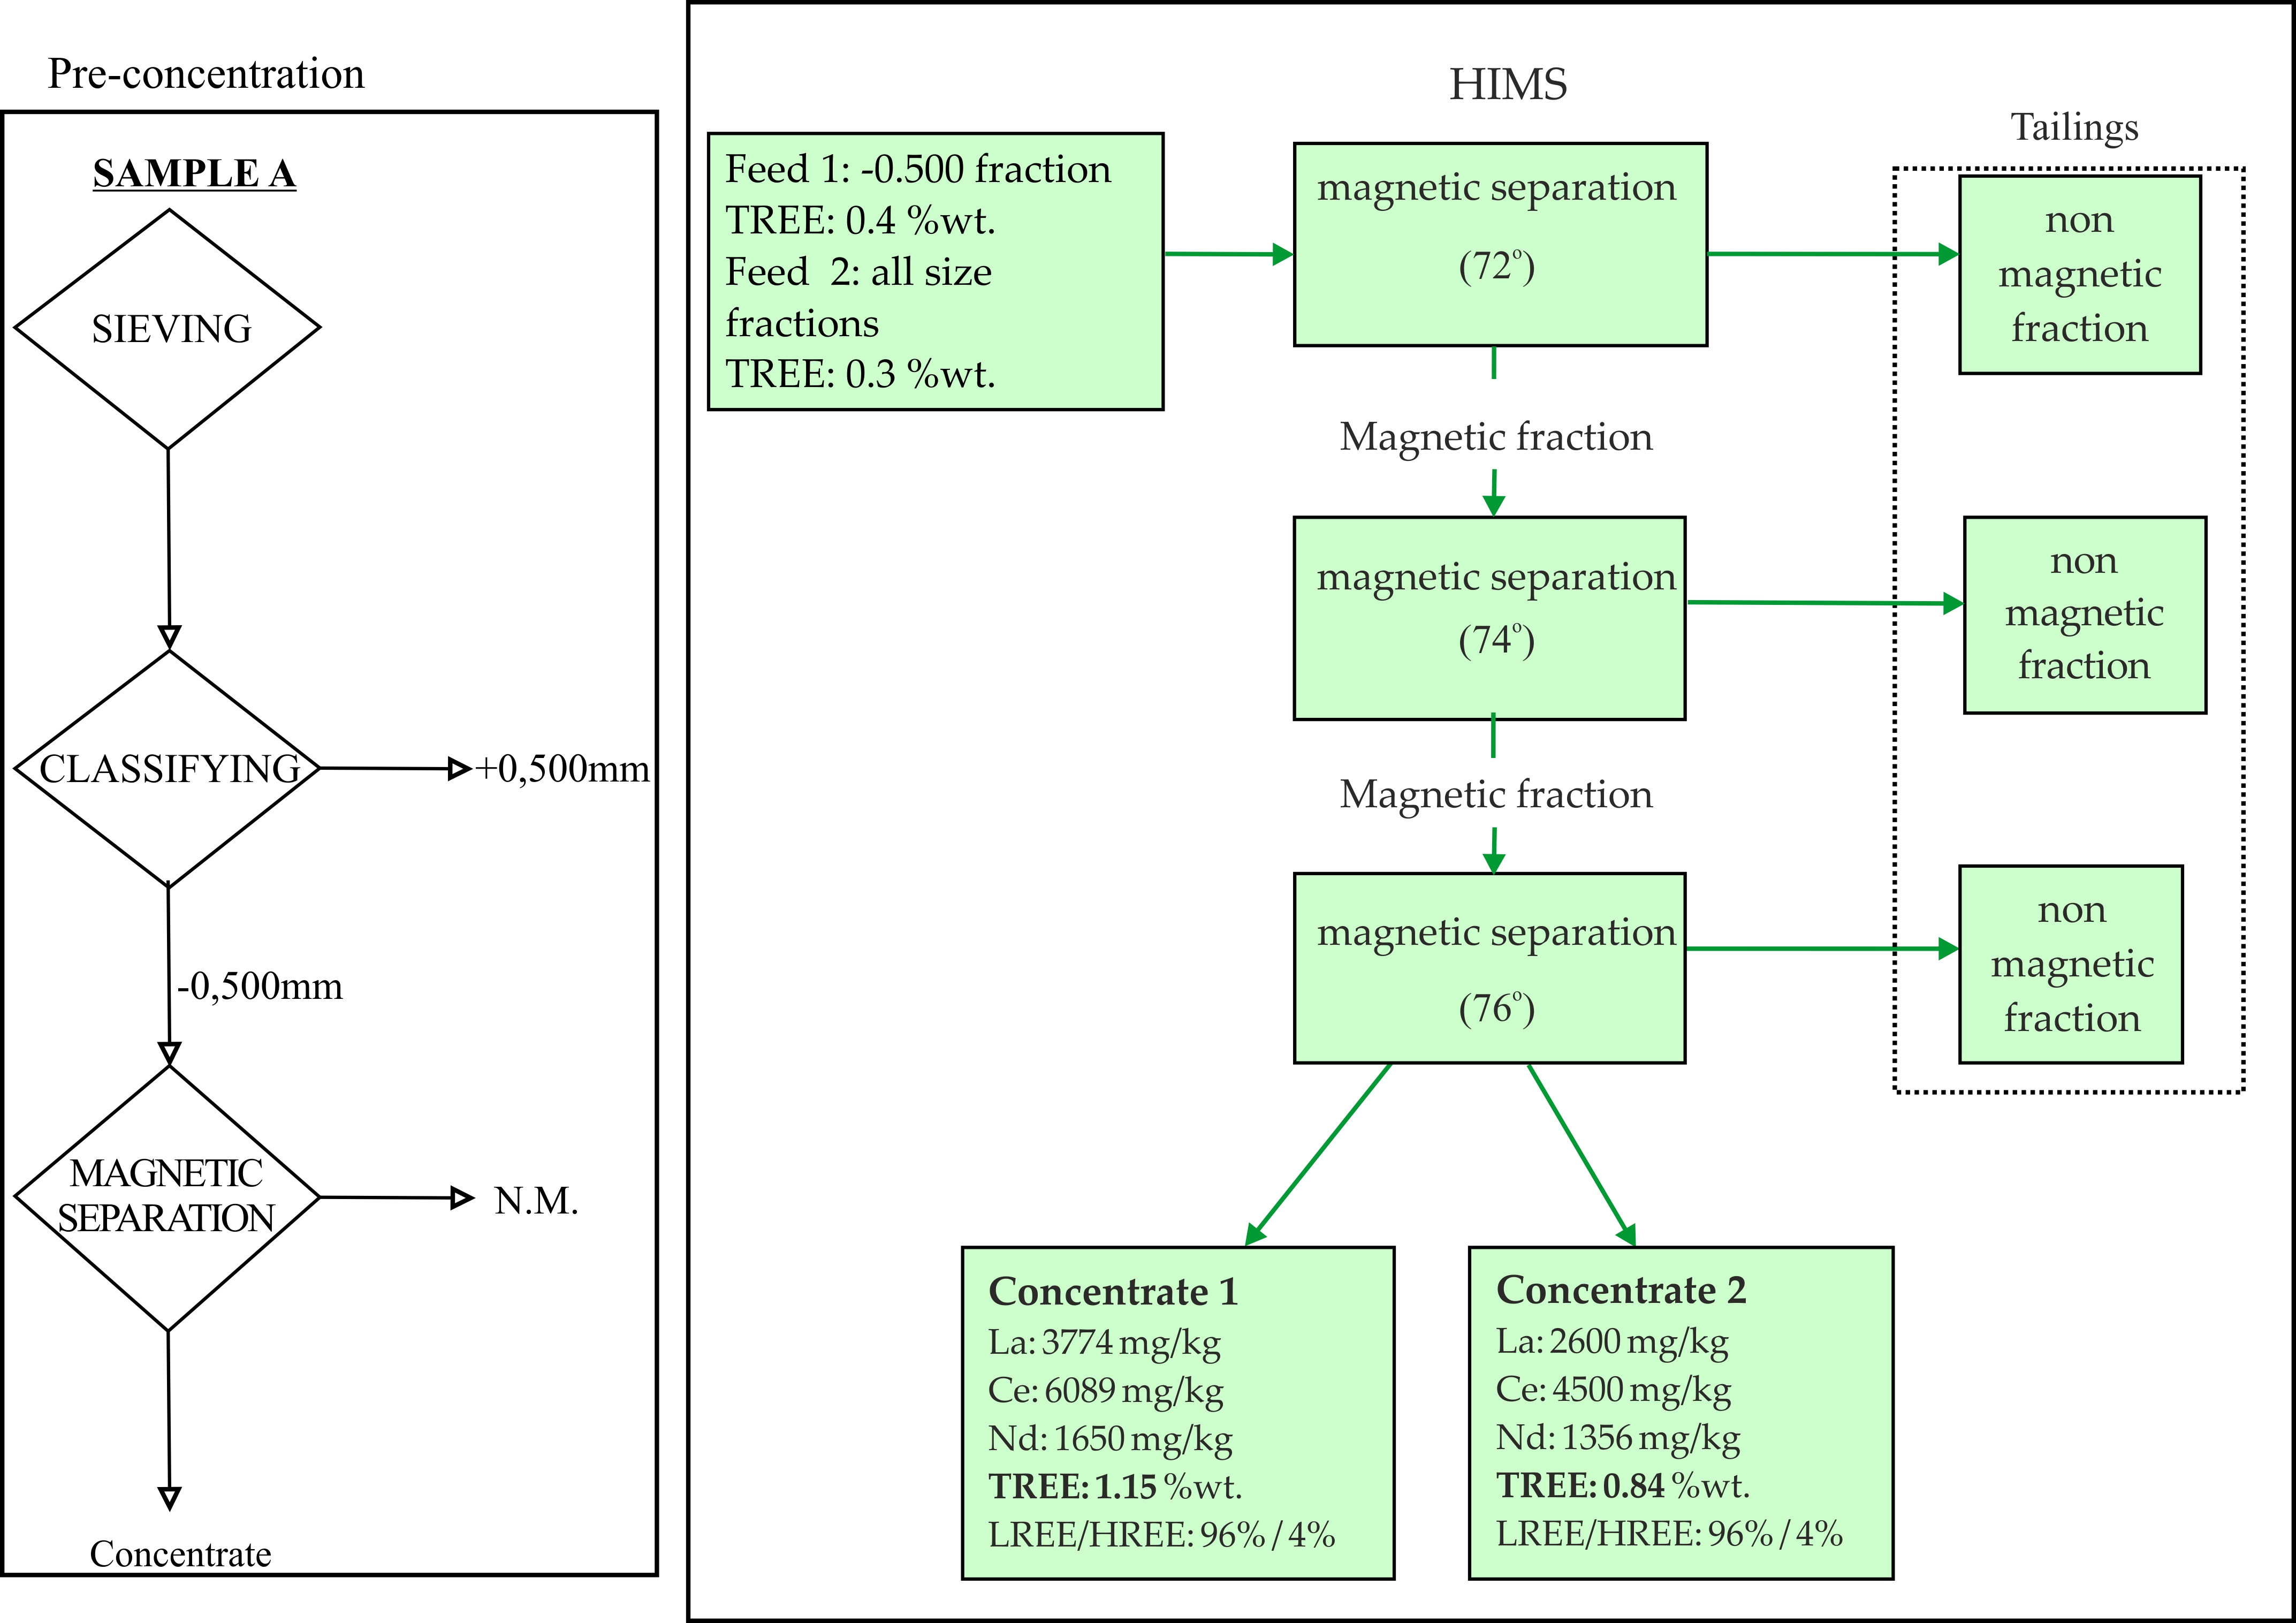
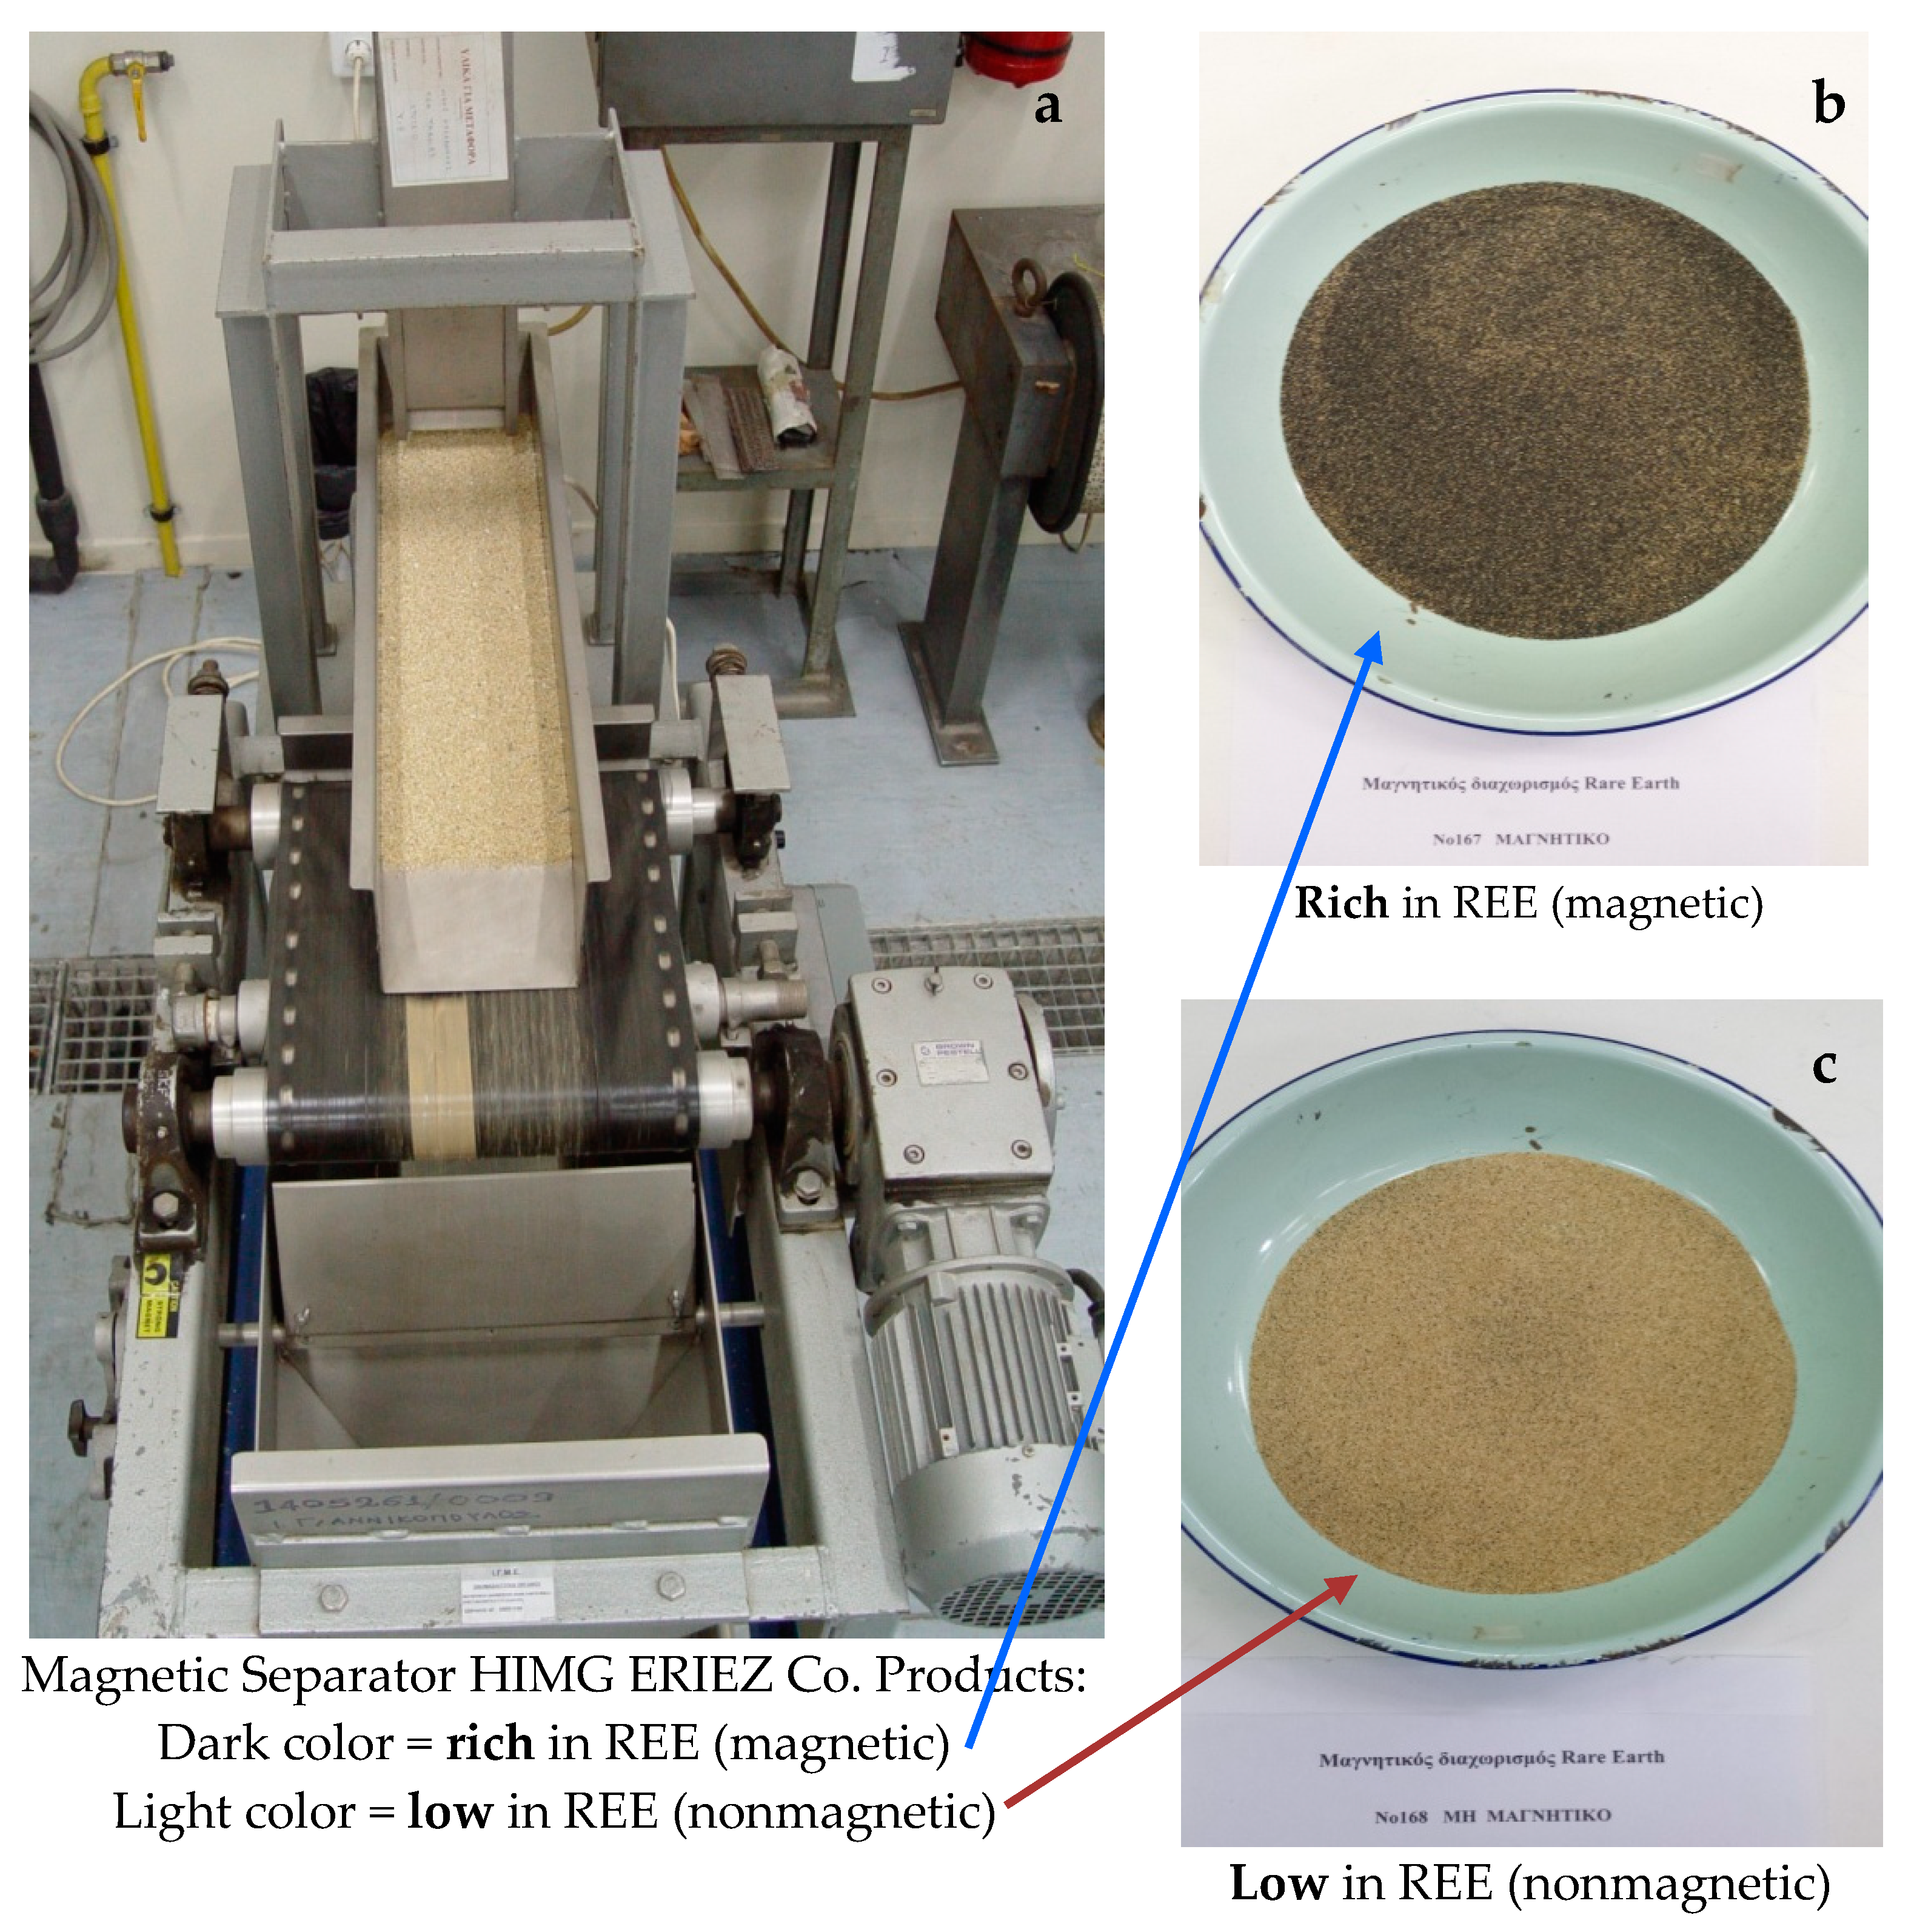
2.3.2. Magnetic Separation

Magnetic separation was selected as a possible concentration technique as the gangue minerals are known to have lower magnetic susceptibility than value minerals which contain rare earth elements. Based on strong or weak magnetic properties, iron-bearing minerals are characterized as ferromagnetic or paramagnetic, respectively. Ferromagnetic refers to minerals strongly attracted to a magnet, like a piece of iron. Magnetite, maghemite, and pyrrhotite are the most common ferromagnetic minerals [20].
A laboratory-scale High Intensity Magnetic Separator (HIMS; Model 10/1, ERIEZ EUROPE, Caerphilly, UK) with standard intensity was used to recover REE-bearing minerals (Figure 2). More than 20 tests were carried out during magnetic separation process, applying different conditions and parameters (vibration, inclination, and speed). Two process routes were followed:
(i)
The whole sample passing through −0.500 mm was driven to magnetic separation.
(ii)
Each size fraction separately (down to +0.212 mm) was tested for magnetic separation.
The sample was fed by a vibrating feeder. The moving velocity of the feed carrying conveyor was about 40 str/s, tilt was set initially to 72°. The applied magnetic intensity was 2 T. After recovering magnetic products at 72°, the magnetic sample was fed again to the magnetic separator adjusted to a 74° and repeated to 76° inclination.
Wet high-intensity magnetic separation (WHIMS) was also conducted on the composite A-mixed using an ERIEZ separator by applying different voltages, i.e., at 30 V (0.48 T) and 150 V (2.4 T). The potential difference was selected to correspond to extreme conditions of lower and higher magnetic field strength in order to check the effect of the intensity of the magnetic field on the efficiency of the magnetic separation process. The results after magnetic separation were evaluated on the basis of semiquantitative mineralogical analysis using the Reference Intensity Ratio method (RIR) of I/Ic.

2.4. Evaluation of Beneficiation Tests

All the separated fractions from the beneficiation tests were tested for mineralogical and chemical composition, except for the fraction +1.7 mm due to its low quantity and low content in REE. The SEM/EDS analysis of the particle size fractions and the magnetic separates provided a rough evaluation of the test performance. The degree of liberation of the REE-bearing minerals from the gangue at various particle sizes was also established by SEM/EDS analysis. The fractions from particle size analysis and the final magnetic separation of the undersize 0.500 mm fractions were evaluated on the basis of mass balance calculations.

3. Results

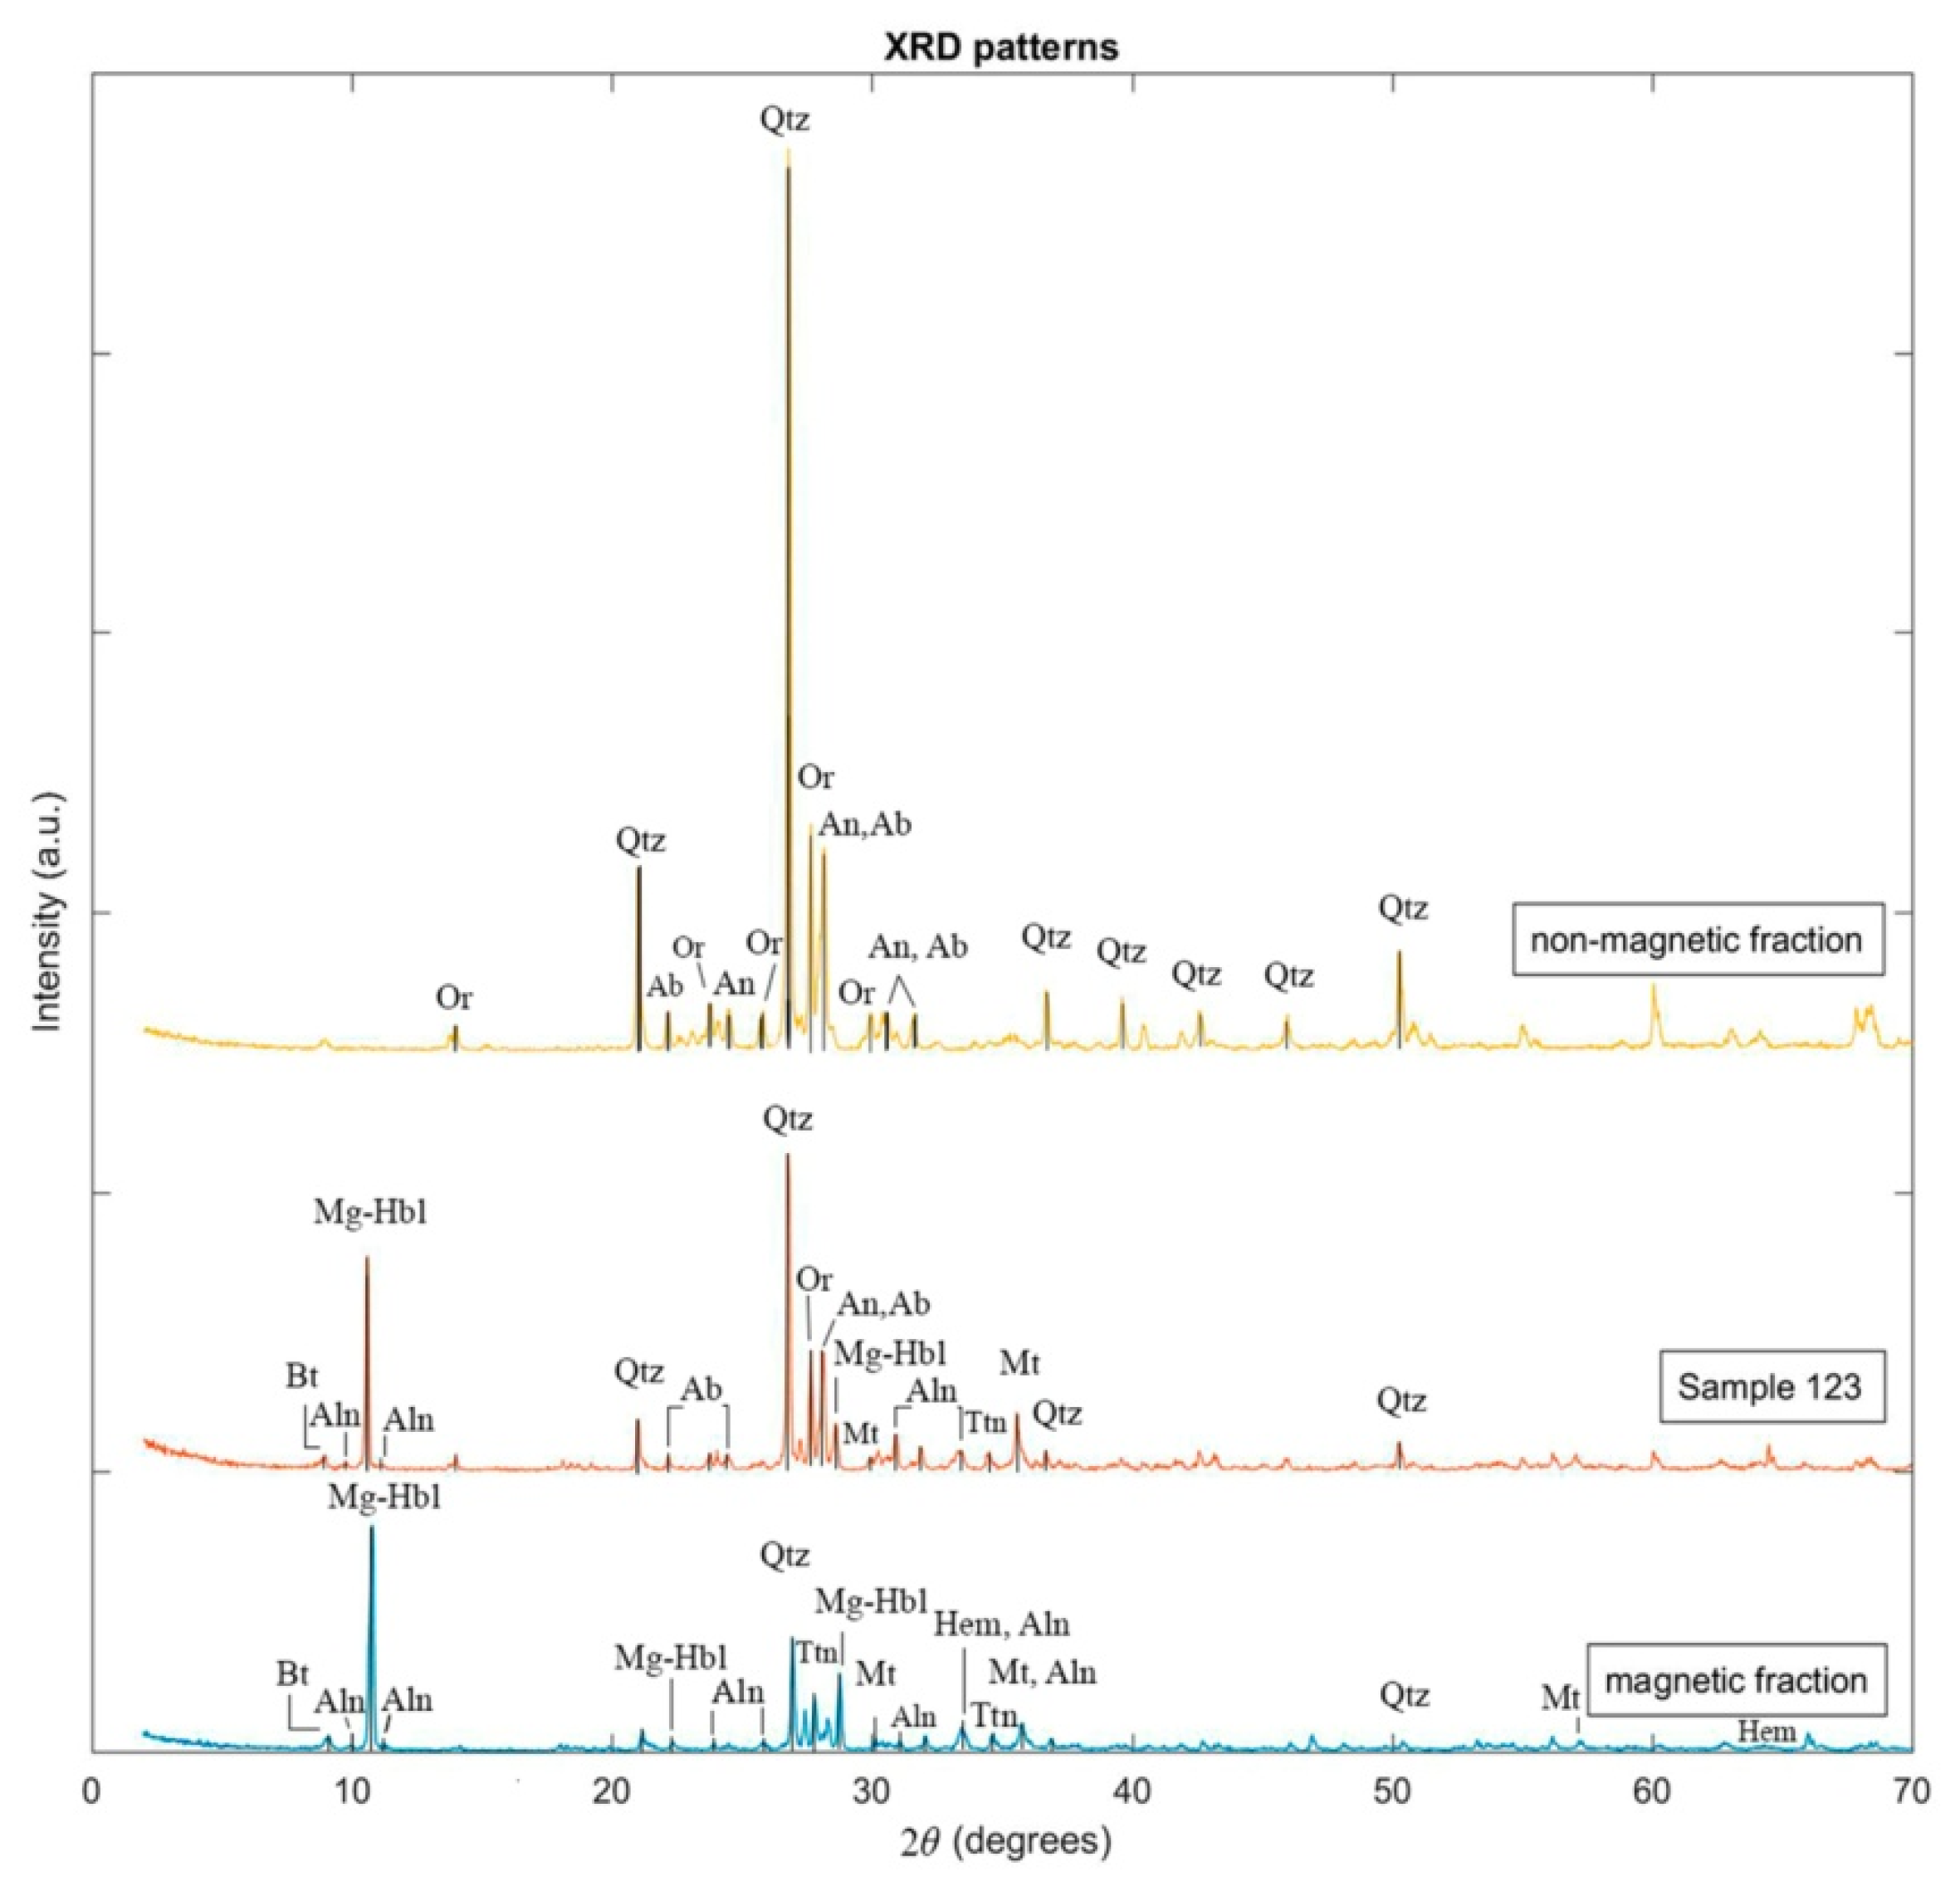
3.1. Mineralogy of the Sands

Table 2 and Figure S1 shows the results of mineral identification and semiquantitative modal composition of the composite sample “A-mixed” obtained by XRD analysis and RIR method. The studied HM sands consist mainly of silicate minerals, Fe-oxides (magnetite, hematite), titanite and minor amounts (<3%) of Ti oxides (ilmenite and rutile), and phosphate phases (apatite, monazite, and xenotime) (Table 2). The major heavy minerals contained in the studied sands are amphibole (Mg-hornblende and pargasite), magnetite, titanite, allanite-epidote, and hematite (Table 2). Zircon, monazite, cheralite, ilmenite, rutile, thorite, apatite, xenotime, baryte, and sulfides were identified as minor constituents by SEM/EDS analysis. Allanite is the major host mineral of REE in relative abundance of 3% in the composite sample (Table 2). Based on SEM/EDS analysis and published EPMS data, the studied monazite is classified as a cerian type (monazite-Ce). However, due to the low abundance of the mineral as well as overlapping of monazite peak intensities with those of magnesiohornblende and allanite, this mineral was not clearly identified by the XRD spectra (Figure S1).

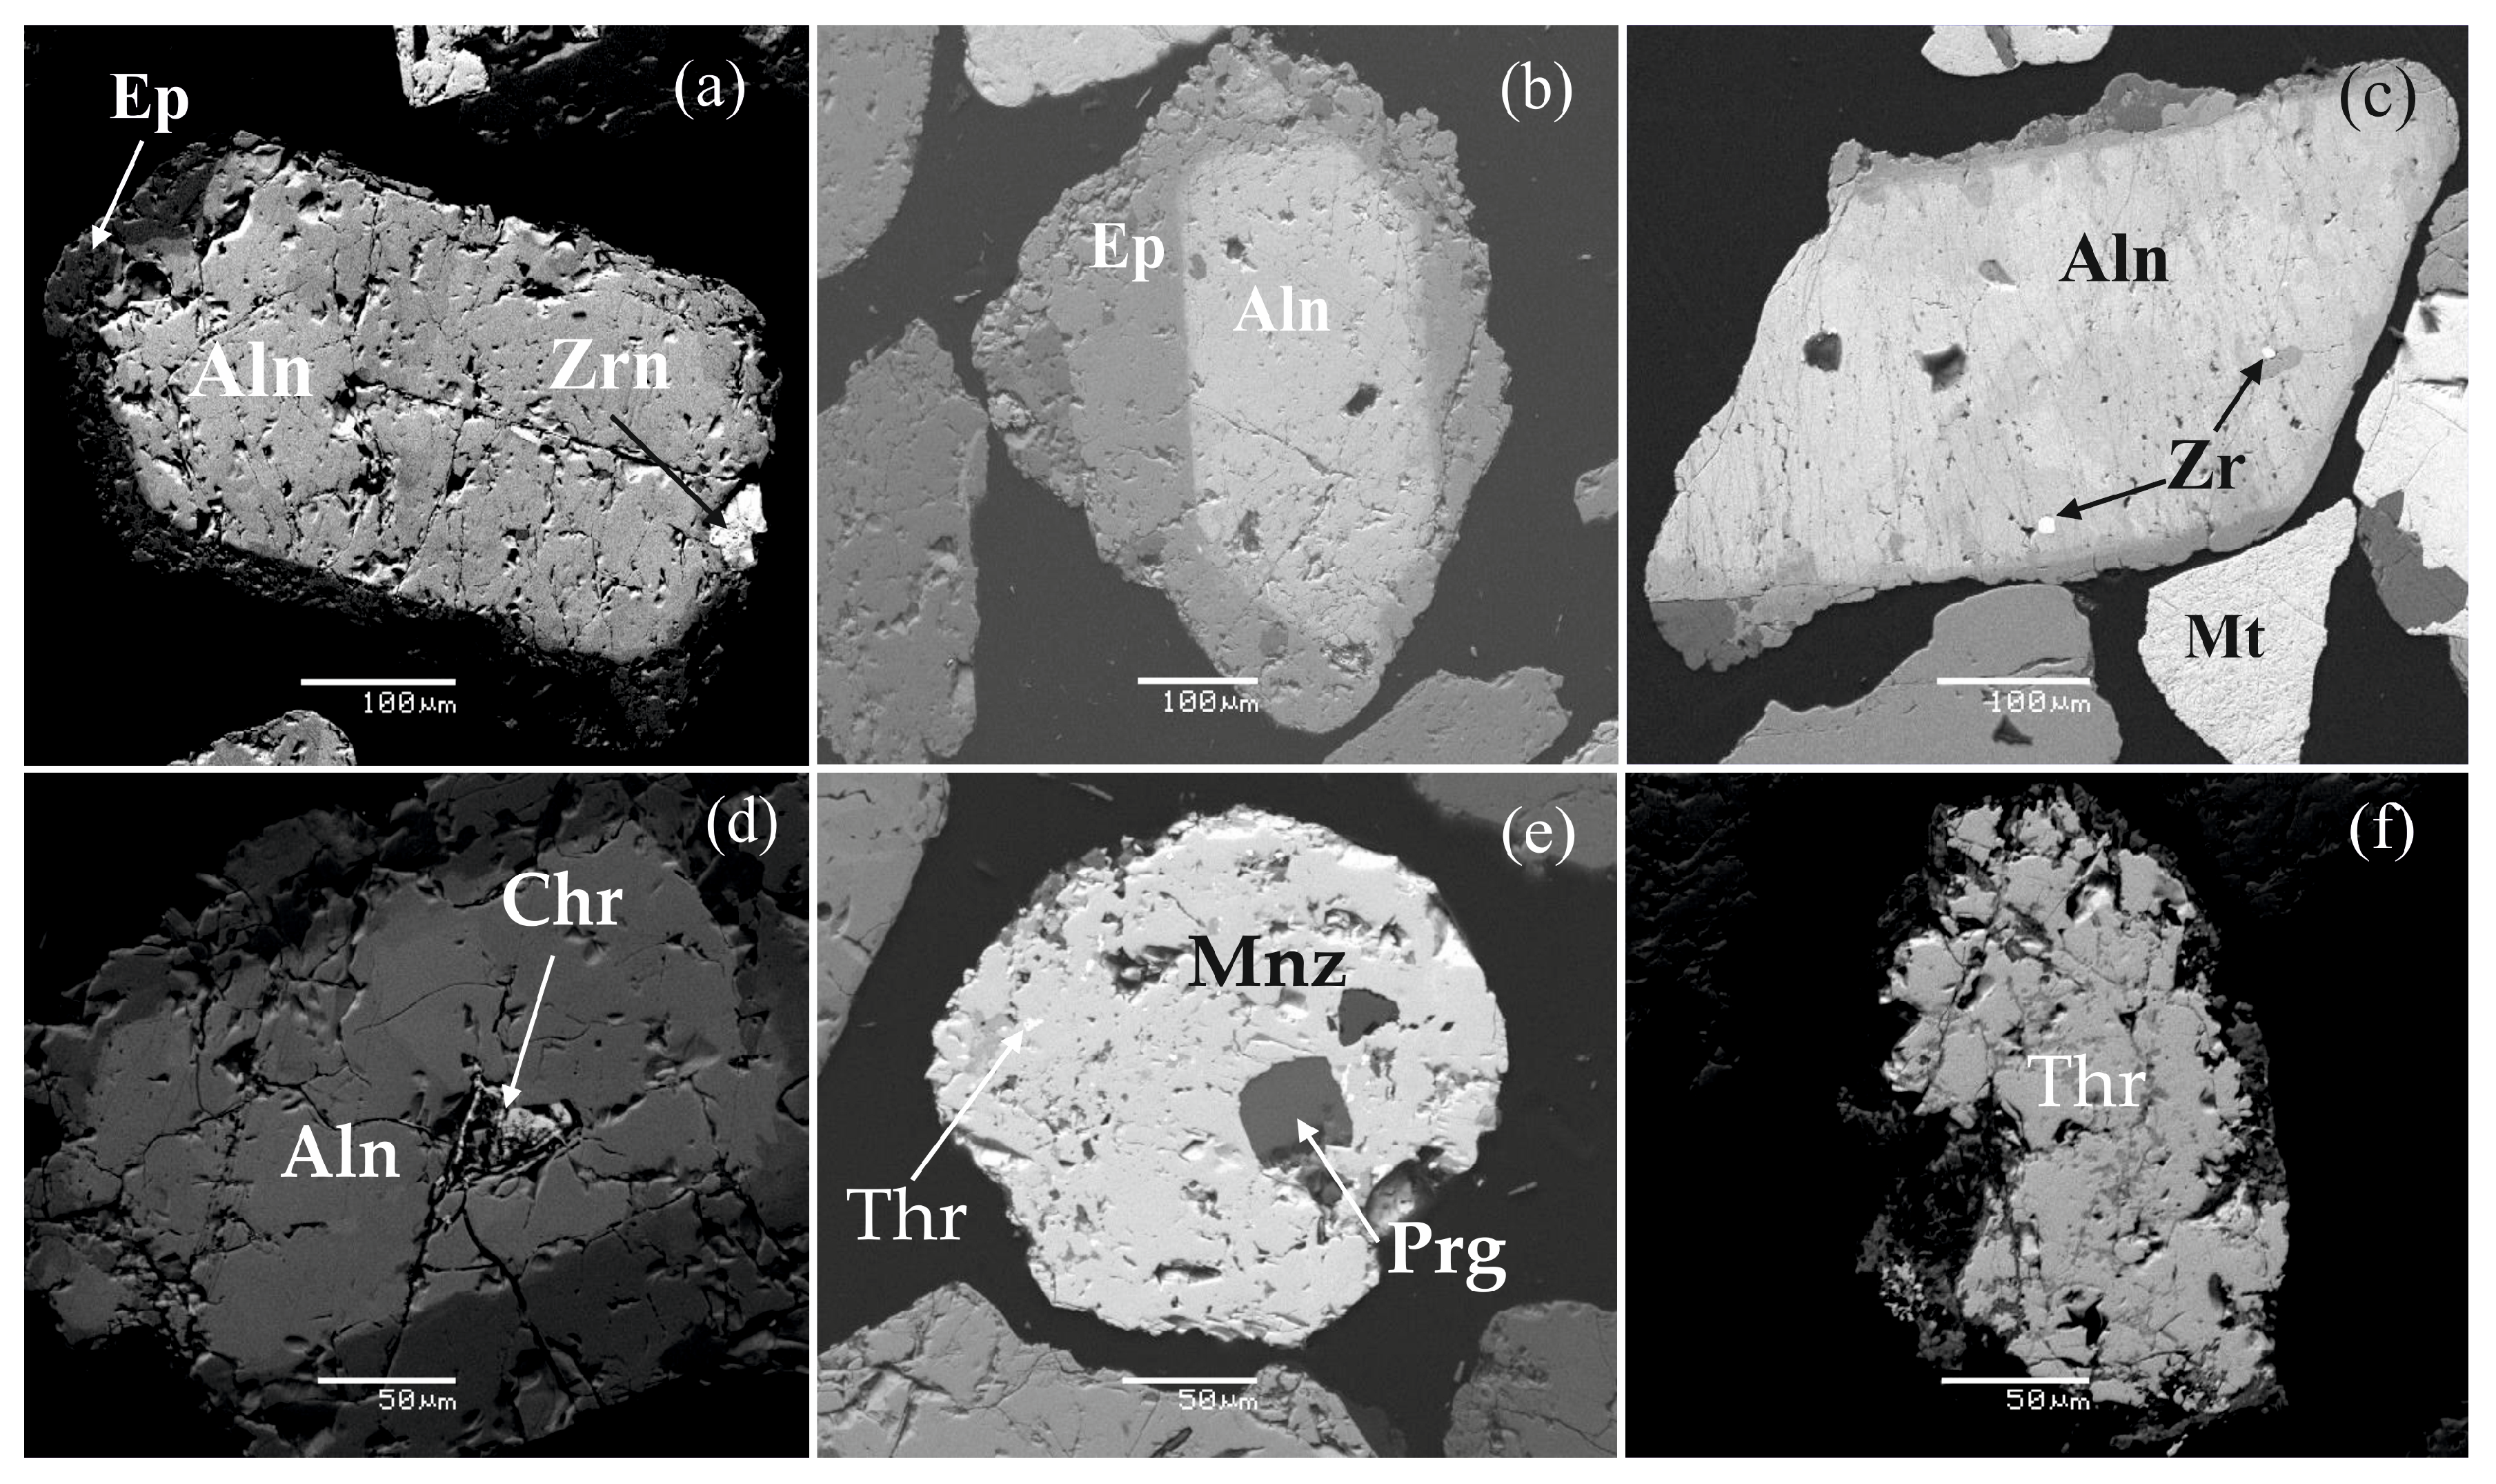
SEM Analysis of REE Minerals

(a) Allanite-(Ce)
SEM/EDS semiquantitative analysis of allanite indicated that total concentration of REE oxides (TREO) range ca. from 10.7 to 16.8 wt.%, which is in agreement with the published data [18]. The stoichiometry of allanite indicates that Ce-allanite is the dominant type (Supplementary Table S2). The backscattered election (BSE) images suggest that allanite is liberated in the particle size −0.500 mm. The surface of the allanite is weathered with several cracks. Backscattered electron images showed that most allanite exhibits pronounced zoning toward the marginal areas of the grain (Figure 3a,b,d). The chemical composition of the peripheral zones indicates replacement of the allanite with epidote. Zoned allanite contains significant Th in the central part of the grain, ca. up to 2.5 wt.%, and they show metamict texture. This is documented by the abundant radiation lines in the structure of the grain displayed by this type of allanite, which results from the destructive effects of its own radiation on the crystal lattice (Figure 3).
(b) Monazite (-Ce)
Monazite occurs as very fine grains, i.e., <10–20 μm in diameter, disseminated in allanite, and only rare liberated grains up to 200 μm are found (Figure 3b,e). In most of the cases, monazite is a replacement phase of allanite. Monazite shows higher content in Ce than Nd or La, which agrees for a cerian-type monazite and is consistent with reported data from the same area [18] (Supplementary Table S2). ThO2 content of the monazite is generally high, i.e., 17 wt.%. The low totals reported in the analyses are probably related to undetected MREE and HREE by SEM/EDS.
(c) Titanite
Titanite is more abundant than allanite (>5%). SEM/EDS analysis of titanites from this study showed that the REE content is below the detection limit of the method (<0.1–0.2 wt.%). The results are consistent with published EPMA analysis for titanites from the same area, which showed that La, Ce, or Nd content is ≤1000 mg/kg [18].
(d) Other Heavy REE Minerals
Zircon is another REE-hosting phase, with relatively higher concentration in heavy REE (HREE) (253–890 mg/kg) relative to light REE (LREE) (8–44 mg/kg) [18,23]. Apatite is a common fine-grained accessory phase disseminated in silicate minerals. Neither apatite nor zircon or thorite was feasible to be analyzed by SEM/EDS for REE due to the low REE content and/or the small particle size of the minerals for this method (see Supplementary Table S2).

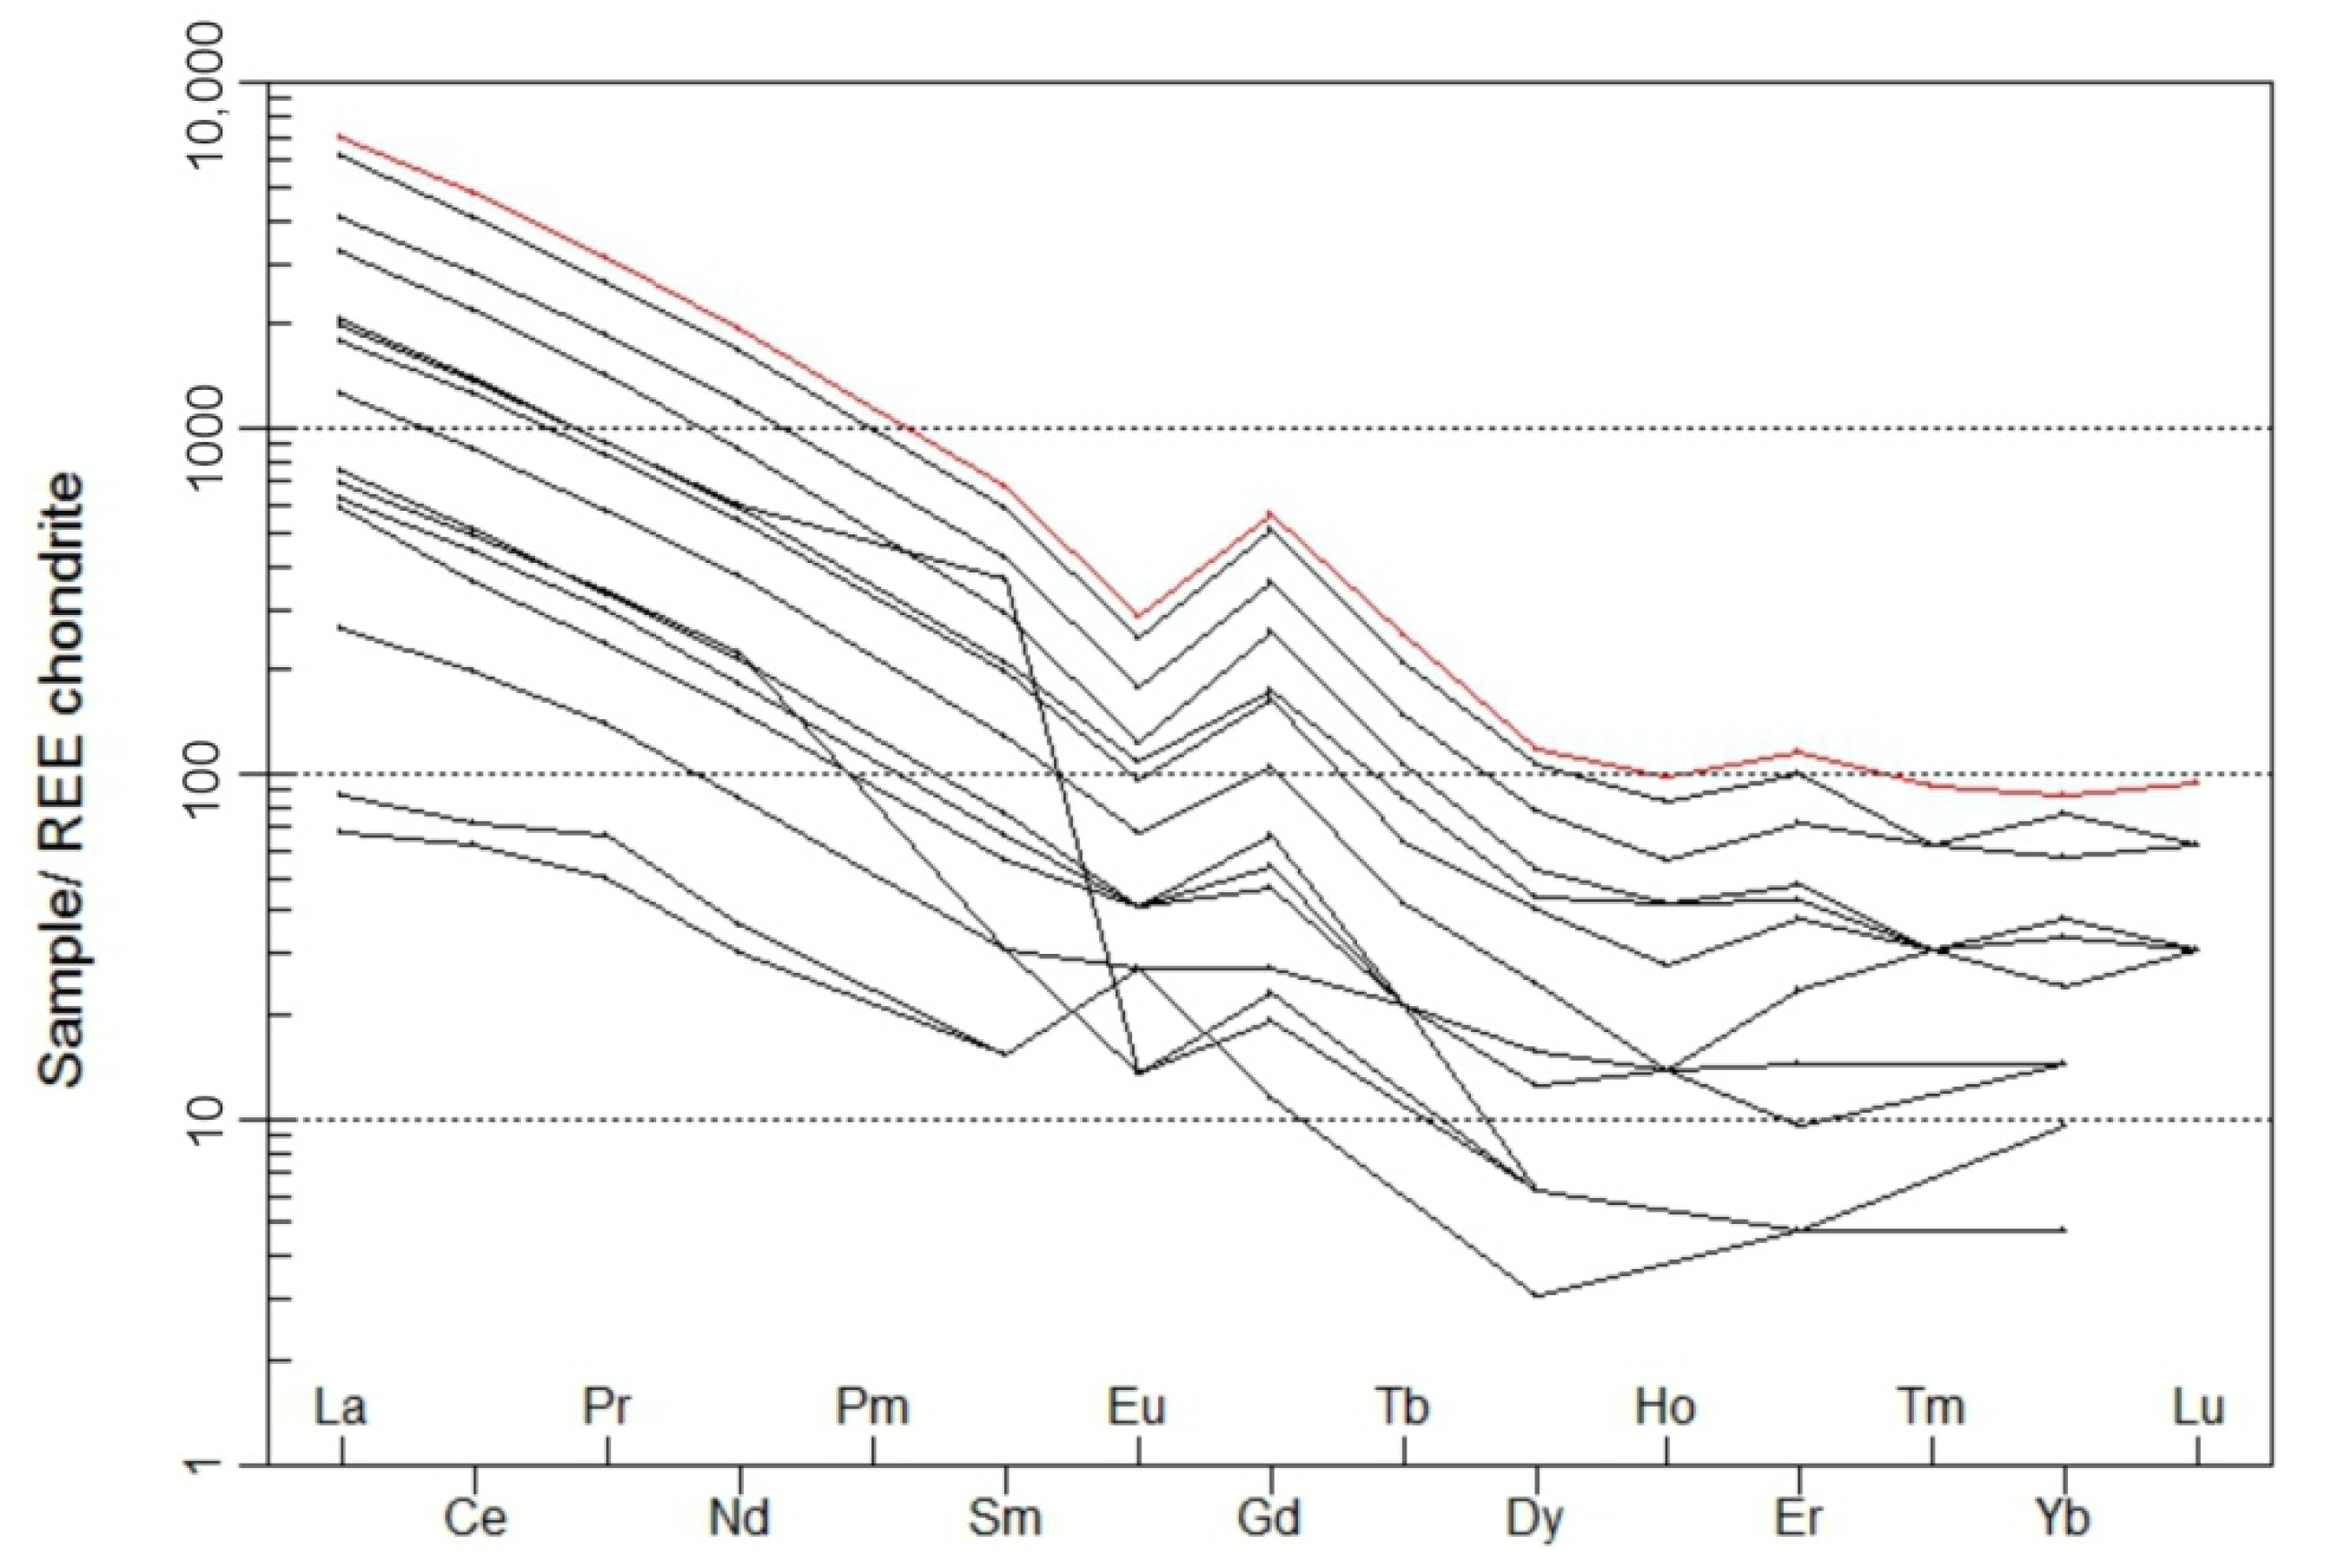
3.2. REE Geochemistry

The chondrite-normalized REE contents of the Nea Peramos HM sand samples display similar patterns but a large compositional range (Figure 4). The total REE (TREE) abundances are generally higher than that of the average upper continental crust, i.e., 183 mg/kg [47], except for one sample (#NP120) (Table 3; detailed data in Supplementary Table S1). A comparison of average REE concentrations of the HM sands of Greece based on reported analysis [23] and HM sands from this study shows that the Nea Peramos samples display the highest total REE enrichment. The chondrite-normalized REE patterns of the studied samples show a pronounced enrichment of light REE, e.g., ranging from 70 to 7000 times chondrite values, and flat heavy REE (HREE) with a small negative Eu anomaly (Figure 4). Allanite controls the LREE budget of the studied sands but the flat HREE characteristic is controlled by another major REE mineral, possibly titanite and/or epidote. This characteristic is typically shown by titanite which is the major heavy mineral phase that holds HREE (see Discussion). These observations are in agreement with previous mineralogical studies of the studied sands [18,23]. The average content of Sc is 7.5 mg/kg, which is lower compared to the respective value in upper continental crust, i.e., 14 mg/kg [47]. Average Y concentration in the studied samples is 67 mg/kg and is enriched by a factor of 3 relatively to the upper continental crust, i.e., 21 mg/kg [47]. Yttrium enrichment is associated with xenotime abundance.
Our samples present a large compositional variation in total REE (Figure 4). On the other hand, all samples show a systematic enrichment in light REE. Therefore, the preliminary beneficiation tests were performed on a composite sample (A-mixed) produced by mixing of all the samples.

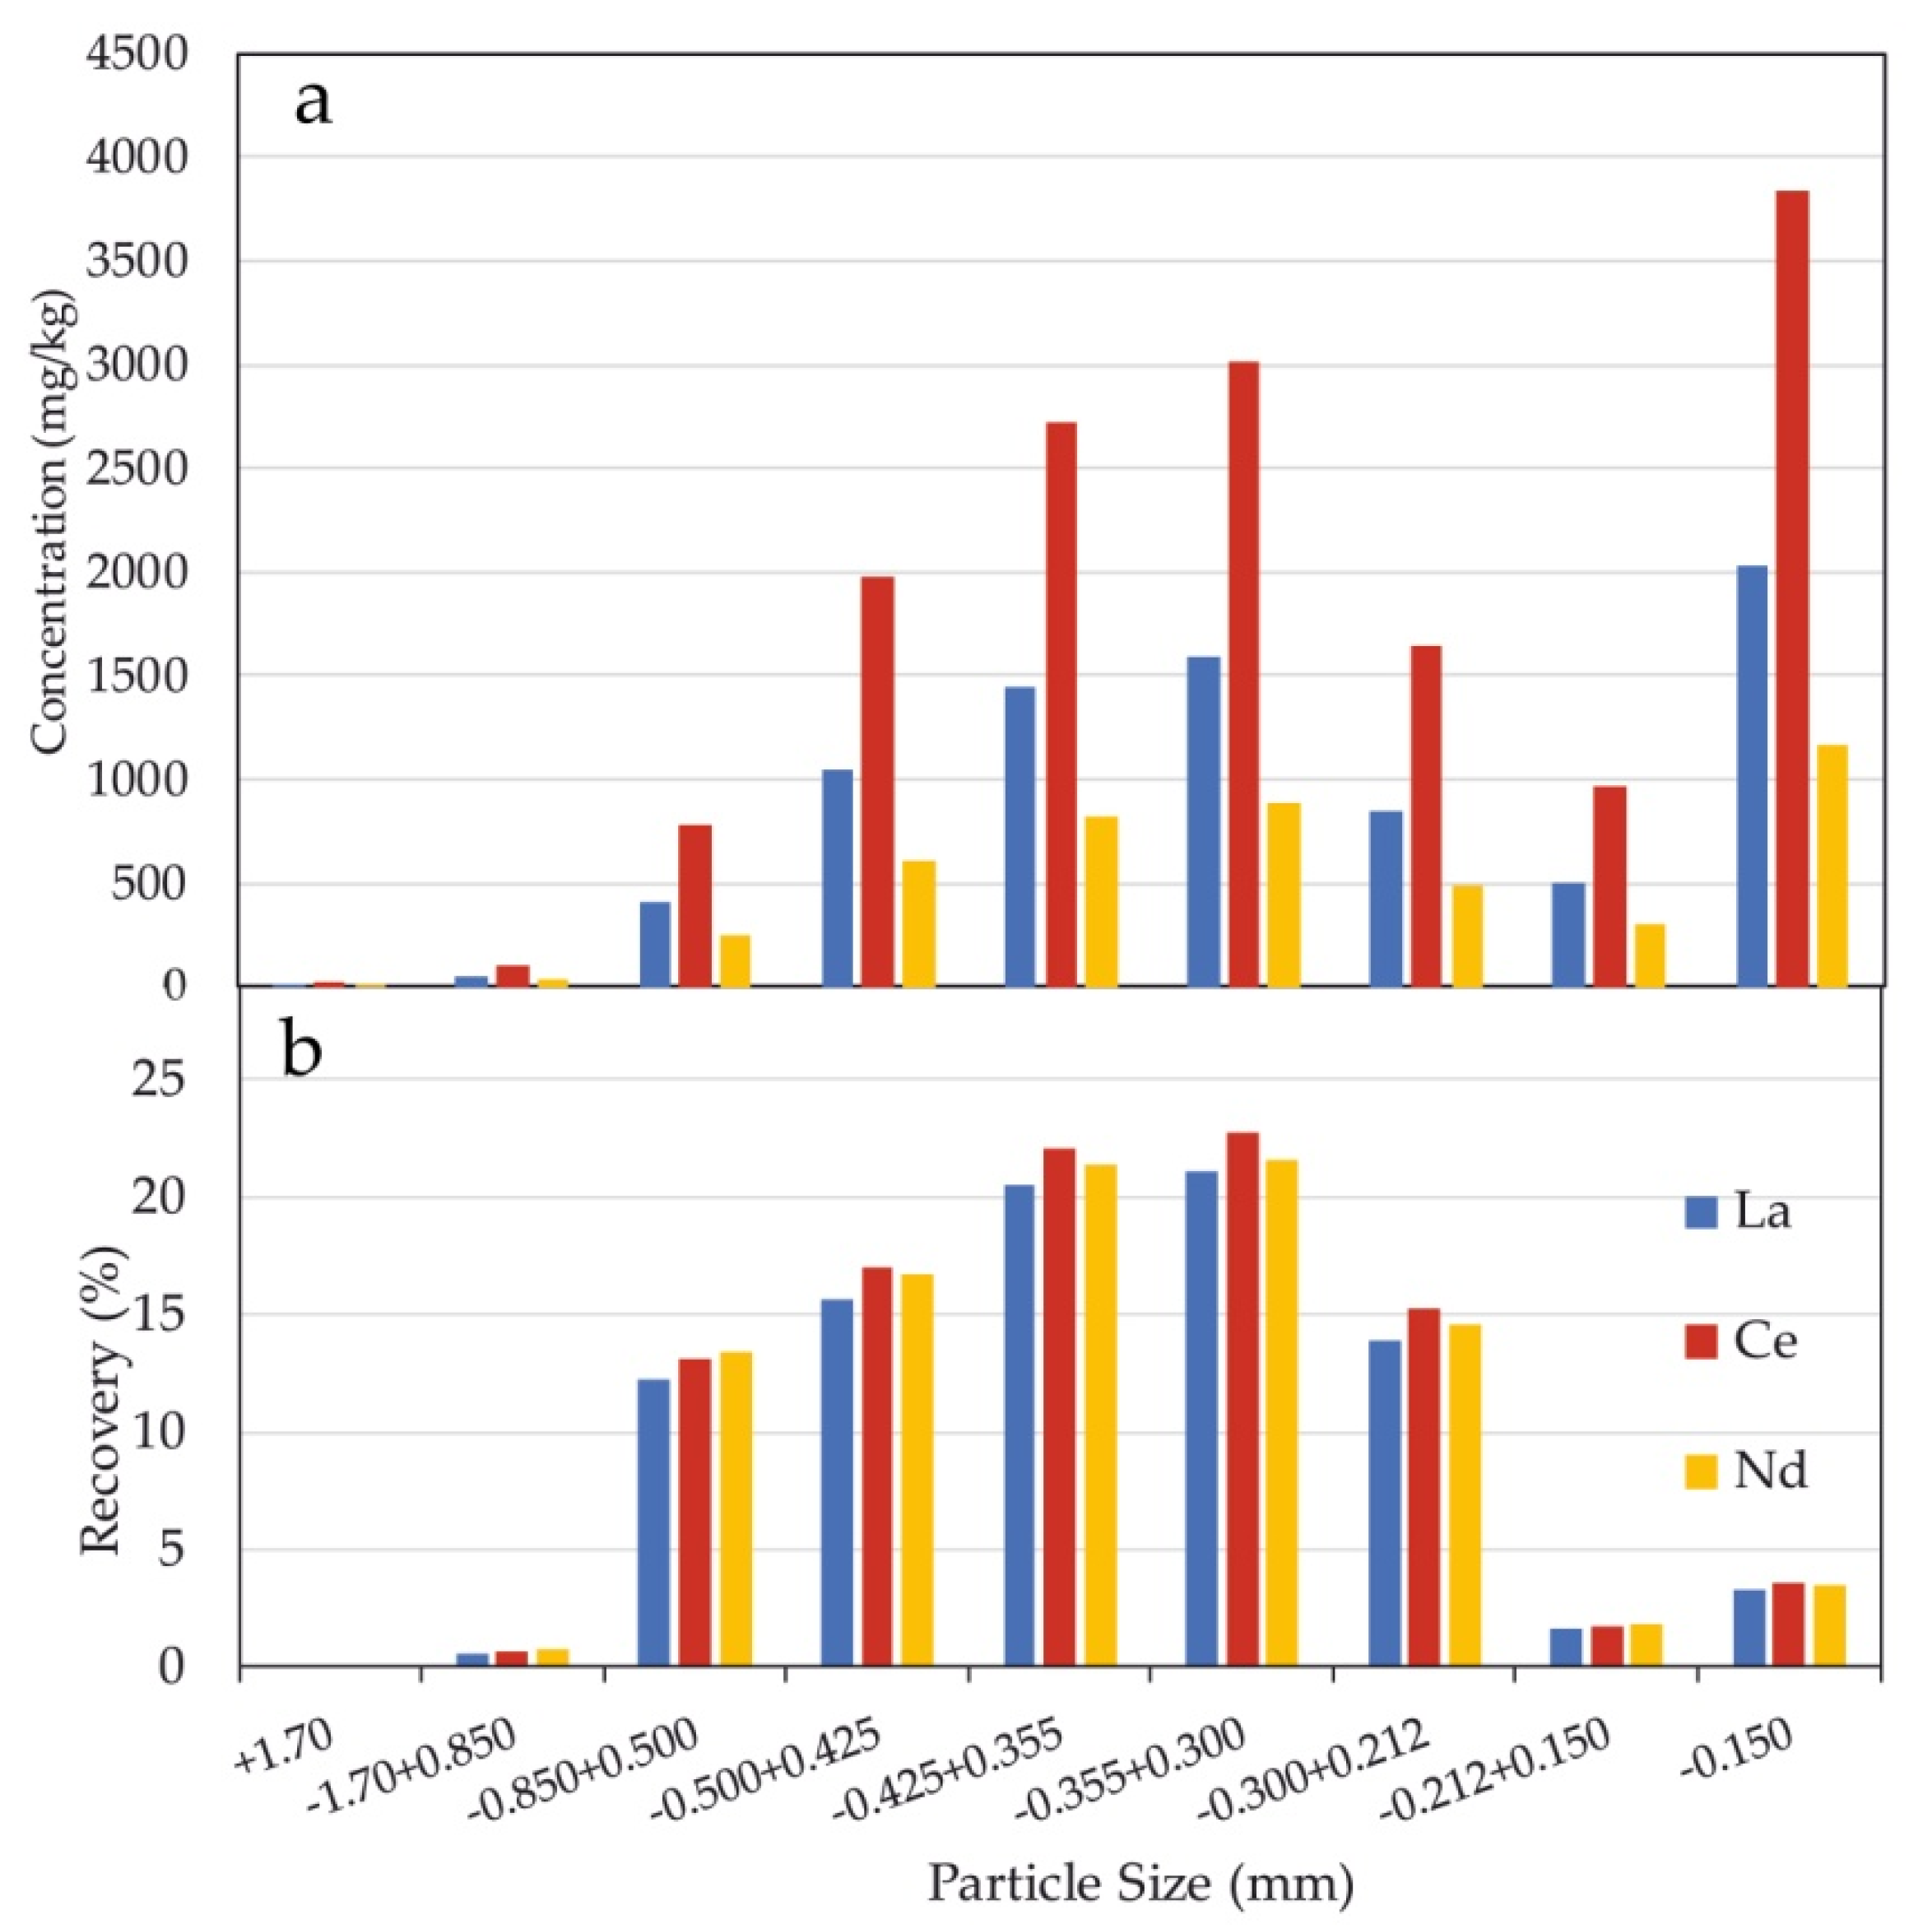
3.3. Particle Size Analysis and REE Distribution

The distribution of REE and Th in the particle size fractions of the composite sample A-mixed is determined by chemical assays (Table 3).
A combination of SEM/EDS and ICP-MS chemical analysis of the different particle size fractions showed a LREE enrichment in the fractions −0.500 to +0.212 mm and under 0.150 mm (Figure 5a). In Table 4, mass balance calculations show that the −0.150 mm fraction, despite its composition, is insignificant in terms of beneficiation due to its very low mass, i.e., 1.5 wt.% Moreover, the oversize +1.70 mm particle size fraction has a very low REE content and hence is also considered as insignificant for further beneficiation (Figure 5b).
The maximum effective recovery is achieved in the fractions −0.425 + 0.300 mm; this size range corresponds to the “liberation” size of allanite. A similar trend of enrichment is observed in the sample #123 [17]. Thorium follows the enrichment trend of LREE and its concentration in the undersize 0.500 mm ranges from 240 to 945 mg/kg. Thorium concentration is associated with the abundance of allanite and monazite in the HM sands, which contain 2.3 and 17–35 wt.% ThO2, respectively, according to EDS/SEM analysis (Supplementary Table S2).

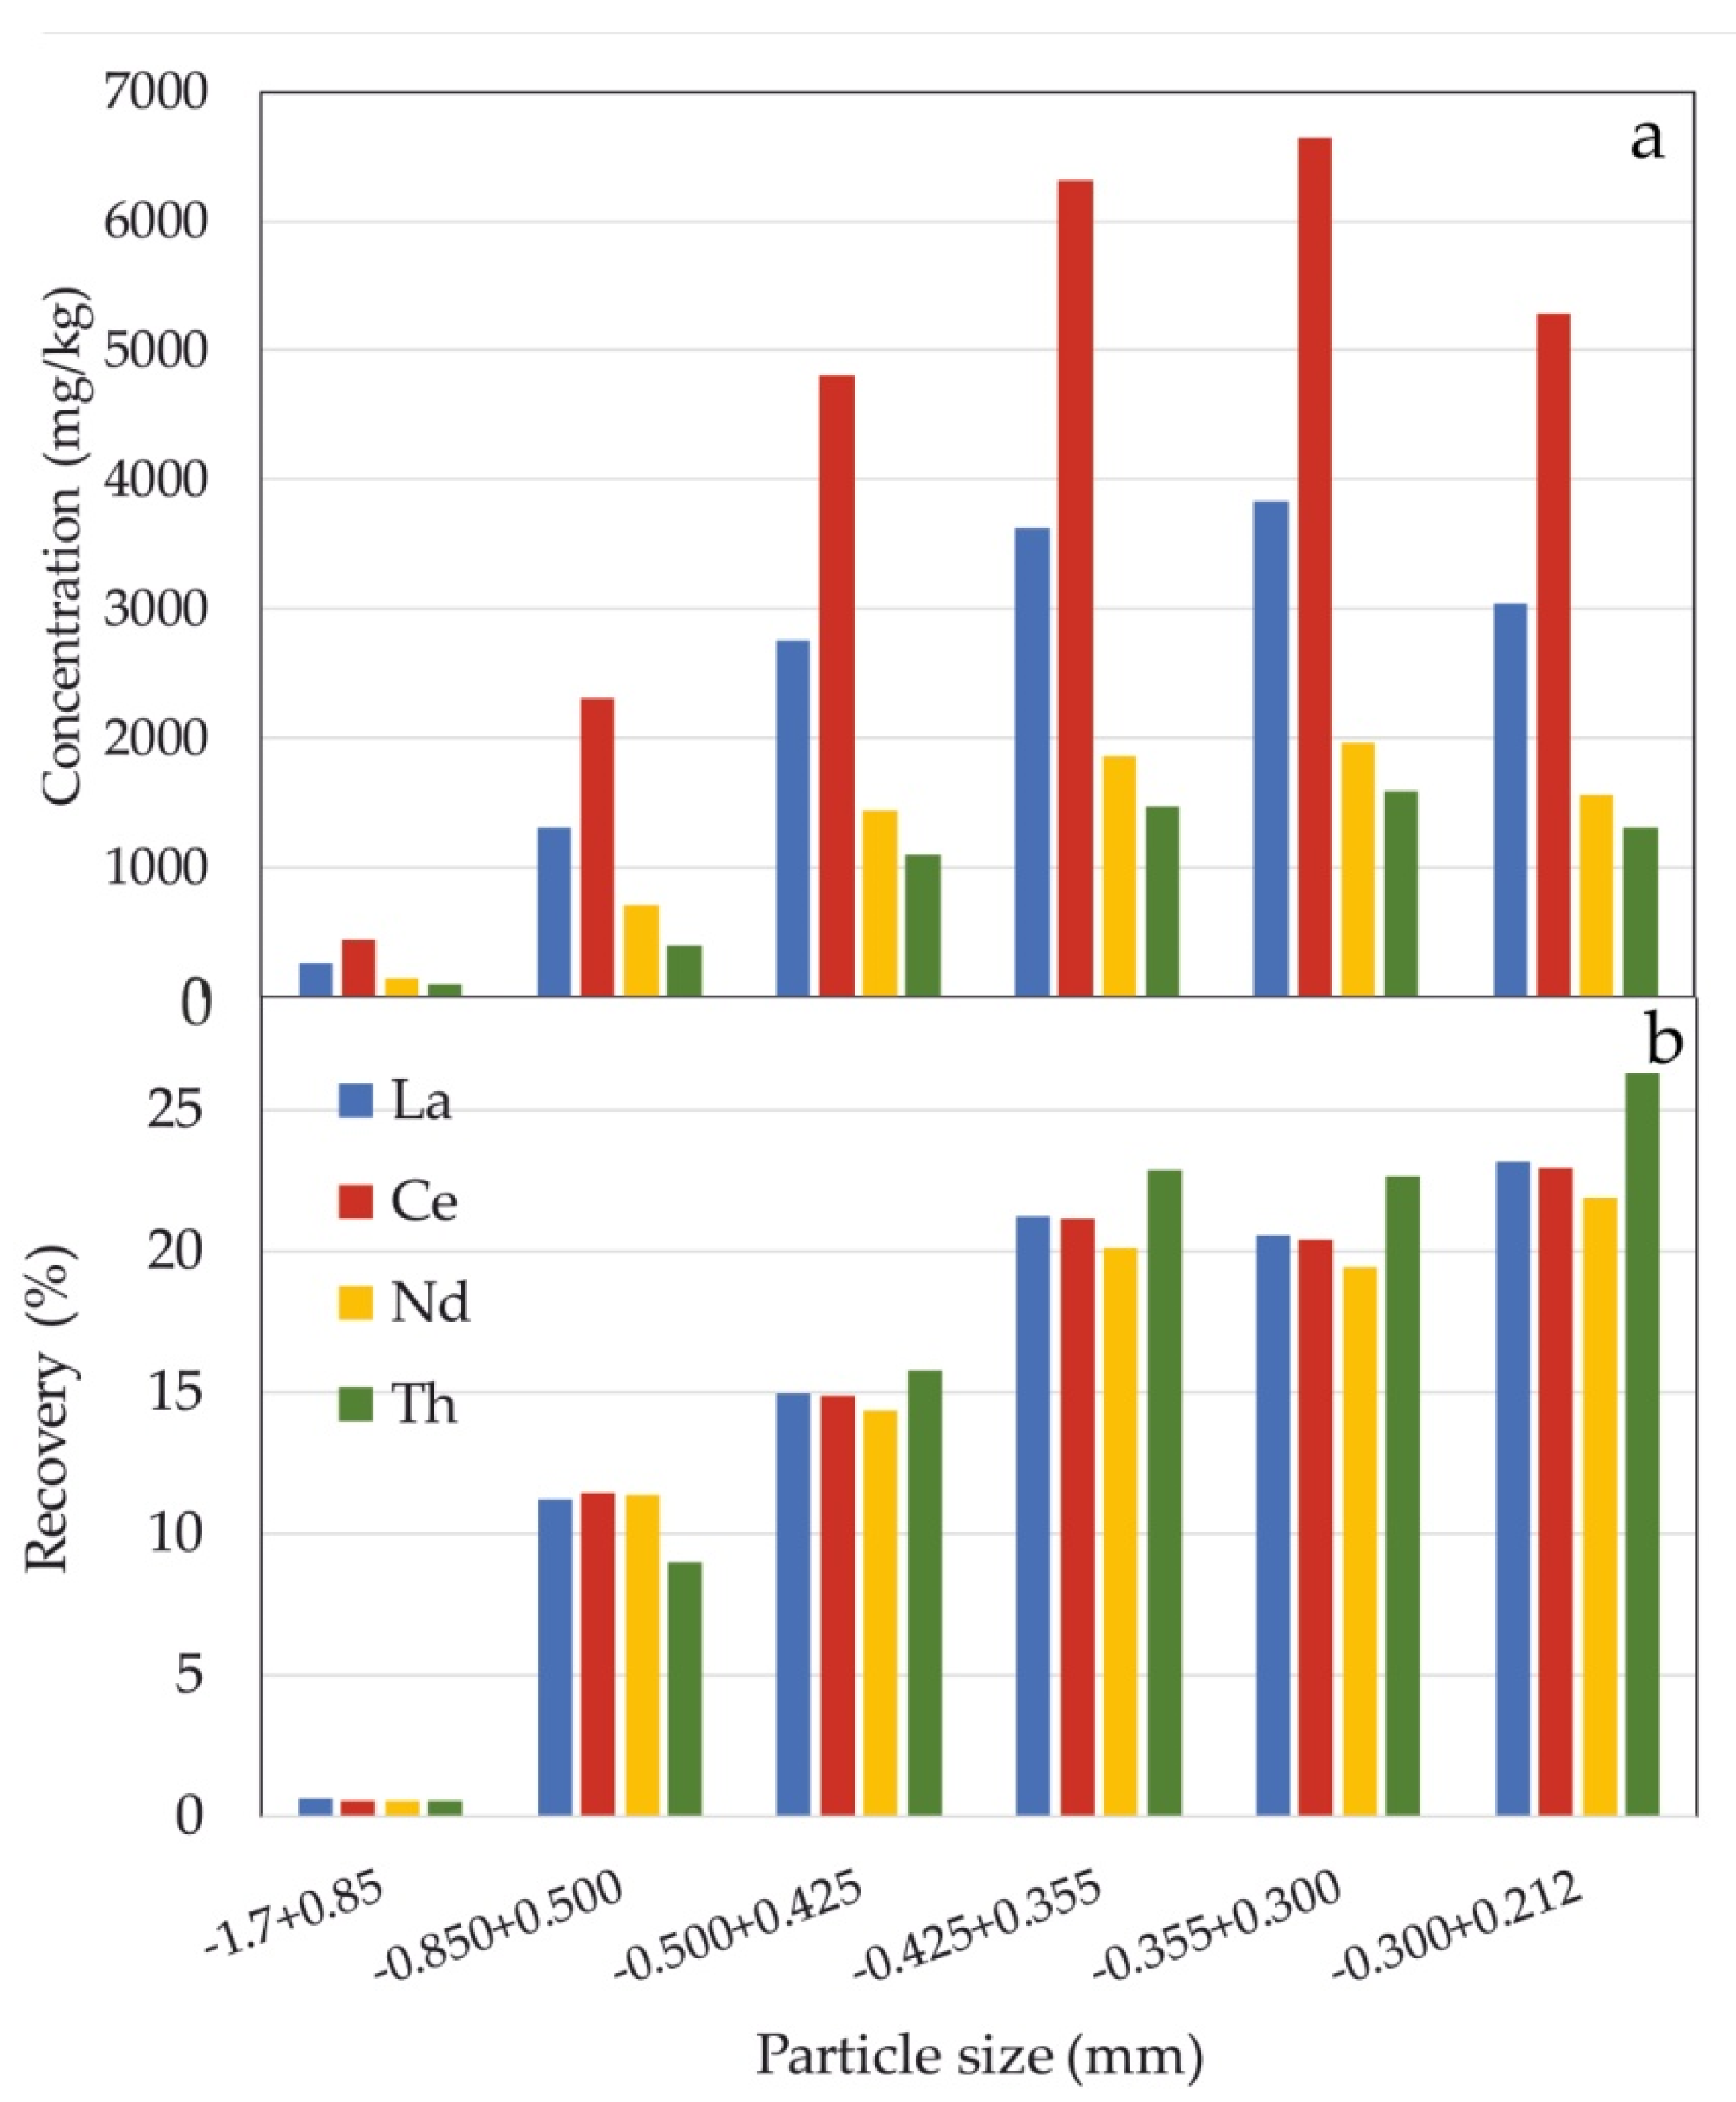
3.4. REE Distribution in the Magnetic Fractions

High-intensity magnetic separation (HIMS) is a common separation step in REE containing beach sands in order to concentrate the targeted paramagnetic REE-bearing part and is usually applied for monazite or xenotime [26,27]. The LREE tend to concentrate in the magnetic fraction because of their magnetic properties. Dry HIMS was applied initially in the most REE-enriched sample #123. Mineralogical evaluation based on XRD spectra shows that from the paramagnetic minerals allanite, titanite and magnesiohornblende tend to concentrate in the magnetic fraction under high intensities. Qualitative evaluation of the mineralogy of magnetic and nonmagnetic separates by XRD spectra is shown in Figure 6. The peak intensities of allanite can be clearly distinguished in the magnetic separate of the sample #123 but are absent in the nonmagnetic part. Following that observation, magnetic separation of particle size fractions from the composite A-mixed sample was carried out. The chemical assays of the magnetic fractions are shown in Table 5 and Figure 7.
The same REE-enrichment trend, as shown in the particle size analysis, is also recorded in the HIMS test (Figure 7). The maximum LREE concentration was achieved in the particle size: −0.355 + 0.212 and a second concentration maximum in the −0.425 + 0.355 mm fraction. Two test of HIMS were conducted: in the first test, all particle sizes (Feed 1 in Figure 8) were processed by magnetic separation, whereas in the second test, only the undersize 0.500 mm were tested after removing the REE-poor +0.500 mm fraction from the initial composite sample A-mixed (preconcentration stage) (Table 5). The results of mass balance calculations and REE distribution in every product are presented in Table 5. Similar recoveries were achieved in the two feeds, i.e., from 92% to 87.6% and 95.9% to 78.87% for the particle size fractions and the undersize 0.500 mm feed, respectively. The maximum LREE enrichment is attained in the magnetic products of the different particle sizes. It is clearly shown in the mass balance calculations in Table 5 that magnetic separation for each particle size separately improves the recovery of REE and reaches recoveries of 75–90% in just the 22% of feed material (fractions −0.500 to +0.212 mm).
Notably, Th enrichment follows the LREE enrichment trend, and its recovery is high in the either tested feed. The steps of magnetic separation process and the REE grade of concentrates are summarized in the flowsheet of Figure 8.
Further testing on the magnetic susceptibility of the paramagnetic minerals in the composite sample was conducted under extreme conditions of the magnetic field, i.e., low (0.48 T) and high (2.4 T) strength, by wet HIMS. The results are evaluated by semiquantitative analysis of the XRD spectra of the magnetic and nonmagnetic products. The maximum content of allanite, i.e., 8 wt.%, is achieved in the magnetic fraction at magnetic field strength of 0.48 T (30 V) and remains constant at 2.4 T (150 V) (Supplementary Table S3).

4. Discussion

The beneficiation of REE ores is challenging from the technological point of view due to complexity in the raw material processing [49,50,51,52]. Such processing involves three main stages: an initial beneficiation step, where REE minerals are concentrated from the ore; a second step, where rare earth oxides are extracted from their host minerals producing a mixed rare earth concentrate; and final step, where individual rare earth metals are obtained through metallurgical separation [6].
Mineral characterization is essential for potential process development impacts. Setting the criteria for initial target grind sizes to liberate the economic minerals and determining the possible mineral associations among REE minerals and various gangue phases are both strongly depended on the mineral characterization study [53]. Therefore, the information obtained herein can be used, apart from the prediction of the concentrate quality, in the associated concentration of deleterious elements.
X-ray diffraction (XRD) analysis allows the identification of minerals. However, when mineral modal abundance is less than ~1 wt.% considerable uncertainty and error can be introduced. It is noteworthy that the ore grade in most REE placer deposits is commonly below 0.1% for the REE-host mineral, e.g., monazite [54]. The evaluation of WHIMS magnetic separation products by XRD analysis agrees with the enrichment of allanite in the final cumulative magnetic concentrate where the content of allanite is increased by a factor of 2.5, i.e., from 3 wt.% in the initial composite feed to final 8 wt.% in the magnetic concentrate (Supplementary Table S3). Correspondingly, REE contents of the final magnetic concentrates increased by a factor of 2.8 compared to the initial feed (Table 4, Figure 8). This case study revealed a close association of REE-silicate minerals of allanite with monazite inclusions, as well as a high Th content in the magnetic separate associated with the REE-host minerals, e.g., allanite-monazite/cheralite and thorite. Therefore, the information obtained herein can be used, apart from the prediction of the concentrate quality, in the associated concentration of deleterious elements. One of the most serious issues associated with REE processing is the radioactive wastes produced as by-product of the extraction stage.
The results from the present beneficiation tests of Nea Peramos HM sands in the course of EURARE project also showed the high content of radionuclides, specifically Th. Thorium distribution follows the enrichment trend of LREE in the concentrates and this poses limitations in the concentration process (e.g., [10,11,23]). There are still many questions and knowledge gaps regarding the beneficiation processes of the REE-bearing minerals which require a great deal of investigation [26,28]. Previous research papers described a series of physical separation processes applied to preconcentrated rare earth minerals (REM) and discard iron oxide minerals from the magnetic fractions. These include, gravity, magnetic, electrostatic, and flotation separation techniques ([52] and references therein).

Effects of Mineral Magnetic Susceptibility on the HIMS Treatment

Magnetic separation process of minerals is based on different behavior (magnetic susceptibility) of mineral particles when exposed to an applied magnetic field. The magnetization of a material is a measure of the density of magnetic dipoles induced in the material [44].
The magnetic susceptibility of minerals is mainly controlled by chemical composition. REE minerals such as allanite, monazite, bastnäsite, and xenotime exhibit moderate paramagnetic property [44,48]. Previous studies on the beneficiation applicable for silicate REE minerals, including allanite and cerite from complex ores, have shown that wet high-intensity or high-gradient magnetic separation is more effective than flotation [29,55]. Yang et al. (2015) and Jordens et al. (2014) [55,56] showed that allanite have normally poor floatability using conventional reagents.
The main host mineral for LREE in Nea Peramos HM sands is allanite-(Ce), commonly containing inclusions of other REE-bearing phases such as thorite, zircon, monazite, and cheralite. Therefore, REE concentration in the magnetic fraction is attributed largely to allanite which was efficiently concentrated in the magnetic fraction under high-intensity magnetic field at 0.48 T. The results of magnetic separation from this study are contradictory to a recent study [18]. In the previous study, allanite was recorded to be rather separated in the nonmagnetic part but the results are not comparable since the conditions of the applied magnetic separation test are not described by the authors.
Dry HIMS (DHIMS), applied to each particle size separately, improved significantly the recovery of REE with achieved recoveries of 92–88% (Table 5). Similar REE recoveries were achieved by processing the undersize 0.500 mm, i.e., 96–79%. REE grade of the magnetic concentrate starting from the undersize 0.500 mm is better than the magnetic product of the particle size fractions. In general, the actual TREE concentration in the magnetic products was 2.8 times higher compared to the initial feed contents, in the two feeds tested. The optimum magnetic separation was effected after repetitive passages of the magnetic fraction at increasing belt inclination from 72° to 76°. Moreover, the preliminary results of WHIMS corroborated for an effective recovery of allanite in the magnetic fraction, and the enrichment achieved was in the order of 2.5 times in the magnetic product (Supplementary Table S3).
Additional laboratory tests for REE dissolution and extraction from concentrate was tried by acid treatment, either leaching or acid baking followed by water leaching conducted by I.G.M.E. during EURARE project [57]. The acids used were HCl, H2SO4, or both. The results showed that rather low recoveries were achieved. In direct acid leaching, decreasing pulp density leads to increasing rare earth recovery, while the opposite is observed in the recovery procedure with acid baking; an increasing pulp density at acid baking step at about 15% leads to an increasing recovery tendency of about 15–20% (unpublished data, Angelatou pers. comm.). The duration of acid baking test seems to have no effect on the recovery of rare earth elements.

5. Conclusions

HM sands from the shoreline of Nea Peramos, Kavala, Northern Greece was studied in order to be able to determine the best process to concentrate the ore by testing simple screening as a prebenefication method and high-intensity magnetic separation as the main beneficiation method. The results of the test work lead to the following conclusions:
  • Allanite-(Ce) is the major host mineral for light REE (LREE), whereas monazite, zircon, and thorite constitute trace amounts. Titanite displays low concentration in LREE <0.1–0.2%. Metamict allanite is common and is thorium-enriched relative to the nonmetamict allanite.
  • A simple screening can achieve a satisfactory prebenefication.
  • A stepwise magnetic separation improves the recovery of REE.
  • Magnetic separation for each particle size fraction separately improves the recovery of REE and reaches recoveries of 75–90% in just the 20% of feed material.
  • The grades of magnetic concentrate for the two processes (all particle size fractions and undersize 0.500 mm) were 0.84% and 1.15% TREE, respectively, at the recoveries of 87–92% and 79–96%.
  • The increase in REE content is associated with the increase of thorium content in concentrates regarding placer sands from Nea Peramos, Greece.
  • The use of gravimetric methods (such as Wilfley shaking table) did not contribute much to the beneficiation of the ores.
  • Radioactive wastes from a potential REE processing operation of Nea Peramos HM sands should be carefully encountered for the risk to the environment and humans.

Supplementary Materials

The following are available online at https://www.mdpi.com/2075-163X/10/5/387/s1, Table S1: REE contents of the Nea Peramos HM sands (in mg/kg), Table S2: SEM/EDS spot analysis of REE-bearing minerals, and Table S3: Semiquantitative mineralogical composition of the wet HIMS-treated samples and the composition of the initial A-mixed composite sample for comparison. Applied voltage values of 30 and 150 V correspond to 0.48 and 150 T magnetic field strength, respectively, Figure S1: X-ray diffraction patterns of composite A-mixed and sample #123, in the range of 20–43° showing in magnification the identified heavy minerals. Quartz appears as the stronger peak. The major peaks of intensities for the heavy minerals only are marked. Monazite (-Ce) peaks shown are indicative (database for RRUFF™ Project [43]). Ttn = titanite, Mz = monazite, Mg-Hbl = magnesiohornblende, Prg = pargasite, Aln = allanite, Mt = magnetite, Hem = hematite).

Author Contributions

V.A. and D.E. collected the samples and provided the field information; V.A. conceived and designed the experiments undertaken by I.G.M.E. in the framework of EURARE project; V.A. and S.P. performed the experiments; C.S. supervised the mineralogical analysis; and C.S., S.P., V.A. and K.S. wrote the paper. All authors have read and agreed to the published version of the manuscript.

Funding

Part of this research was supported by EURARE research project, funded from the European Community’s Seventh Framework Programme ([FP7/2007–2013]) under grant agreement no 309373. Project web site: www.eurare.eu.

Acknowledgments

The authors would like to thank N. Xirokostas for elaborating the chemical analysis of REE ore at the ICP-MS facility of I.G.M.E., V. Skounakis for assistance in performing the SEM/EDS analysis at NKUA, Geology and Geoenvironment, Athens, and I. Marantos from I.G.M.E. for assistance in the quantitative evaluation of the XRD patterns by RIR method. This publication reflects only the authors’ view, exempting the Community from any liability.

Conflicts of Interest

The authors declare no conflict of interest.

References

  1. Mudd, G.M.; Jowitt, S.M. Rare earth elements from heavy mineral sands: Assessing the potential of a forgotten resource. Appl. Earth Sci. (Trans. Inst. Min. Metall. B) 2016, 125, 107–113. [Google Scholar] [CrossRef]
  2. EU Commission. Study on the Review of the List of Critical Raw Materials; European Commission: Brussels, Belgium, 2017. [Google Scholar]
  3. McLennan, B.; Gorder, G.D.; Ali, S.H. Sustainability of rare earths—An overview of the state of knowledge. Minerals 2013, 3, 304–317. [Google Scholar] [CrossRef]
  4. Balomenos, E.; Davris, P.; Deady, E.; Yang, J.; Panias, D.; Friedrich, B.; Binnemans, K.; Seisenbaeva, G.; Dittrich, C.; Kalvig, P.; et al. The EURARE Project: Development of a sustainable exploitation scheme for Europe’s Rare Earth Ore deposits. Johns. Matthey Technol. Rev. 2017, 61, 142–153. [Google Scholar] [CrossRef] [Green Version]
  5. Moss, R.; Tzimas, E.; Willis, P.; Arendorf, J.; Thompson, P.; Chapman, A.; Morley, N.; Sims, E.; Bryson, R.; Peason, J.; et al. Critical metals in the path towards the decarbonization of the EU energy sector. In Assessing Rare Metals as Supply-Chain Bottlenecks in Low-Carbon Energy Technologies; JRC Report EUR 25994 EN; Publications Office of the European Union: Brussels, Belgium, 2013; p. 242. [Google Scholar]
  6. Goodenough, K.; Schilling, J.; Jonsson, E.; Kalvig, P.; Charles, N.; Tuduri, J.; Deady, E.A.; Sadeghi, M.; Schiellerup, H.; Muller, A.; et al. Europe’s rare earth element resource potential: An overview of REE metallogenetic provinces and their geodynamic setting. Ore Geol. Rev. 2016, 72 Pt 1, 838–856. [Google Scholar] [CrossRef]
  7. Guyonnet, D.; Planchon, M.; Rollat, A.; Escalon, V.; Vaxelaire, S.; Tuduri, J. Primary and secondary sources of rare earths in the EU-28: Results of the ASTER project. In Proceedings of the ERES 2014—1st Conference on European Rare Earth Resources, Milos, Greece, 4–7 September 2014; pp. 66–72. [Google Scholar]
  8. Deady, E.; Lacinska, A.; Goodenough, K.M.; Shaw, R.A.; Roberts, N.M.W. Volcanic-Derived Placers as a Potential Resource of Rare Earth Elements: The Aksu Diamas Case Study, Turkey. Minerals 2019, 9, 208. [Google Scholar] [CrossRef] [Green Version]
  9. Deady, É.; Mouchos, E.; Goodenough, K.; Williamson, B.; Wall, F. A review of the potential for rare-earth element resources from European red muds: Examples from Seydişehir, Turkey and Parnassus-Giona, Greece. Mineral. Mag. 2016, 80, 43–61. [Google Scholar] [CrossRef] [Green Version]
  10. Pergamalis, F.; Karageorgiou, D.E.; Koukoulis, A. The location of Tl, REE, Th, U, Au deposits in the seafront zones of Nea Peramos-Loutra Eleftheron area, Kavala (N. Greece) using γ radiation. Bull. Geol. Soc. Greece 2001, 34, 1023–1029. [Google Scholar]
  11. Pergamalis, F.; Karageorgiou, D.E.; Koukoulis, A.; Katsikis, I. Mineralogical and chemical composition of sand ore deposits in the seashore zone N. Peramos-L. Eleftheron (N. Greece). Bull. Geol. Soc. Greece 2001, 34, 845–850. [Google Scholar] [CrossRef] [Green Version]
  12. Institute of Geological and Mineral Exploration (IGME). Geological Map of Greece, Nikisiani-Loutra Eleftheron Sheet, 1:50000; Kronberg, P., Schenk, P.F., Eds.; IGME: Madrid, Spain, 1974. [Google Scholar]
  13. Institute of Geological and Mineral Exploration (IGME). Geological Map of Greece, Kavala Sheet, 1:50000; Kronberg, P., Ed.; IGME: Madrid, Spain, 1974. [Google Scholar]
  14. Eliopoulos, D.; Economou, G.; Tzifas, I.; Papatrechas, C. The potential of Rare Earth elements in Greece. In Proceedings of the ERES2014: First European Rare Earth Resources Conference, Milos, Greece, 4–7 September 2014; pp. 308–316. [Google Scholar]
  15. Papadopoulos, A.; Koroneos, A.; Christofides, G.; Stoulos, S. Natural radioactivity distribution and gamma radiation exposure of beach sands close to Kavala pluton, Greece. Open Geosci. 2015, 7, 64. [Google Scholar] [CrossRef] [Green Version]
  16. Papadopoulos, A.; Koroneos, A.; Christofides, G.; Papadopoulou, L. Geochemistry of beach sands from Kavala, Northern Greece. Ital. J. Geosci. 2016, 135, 526–539. [Google Scholar] [CrossRef]
  17. Angelatou, V.; Papamanoli, S.; Stouraiti, C.; Papavasiliou, K. REE distribution in the Black Sands in the Area of Loutra Eleftheron, Kavala, Northern Greece: Mineralogical and Geochemical Characterization of Fractions from Grain Size and Magnetic Separation Analysis (doi:10.3390/IECMS2018-05455). Available online: https://sciforum.net/paper/view/conference/5455 (accessed on 25 April 2020).
  18. Tzifas, I.; Papadopoulos, A.; Misaelides, P.; Godelitsas, A.; Göttlicher, J.; Tsikos, H.; Gamaletsos, P.N.; Luvizotto, G.; Karydas, A.G.; Petrelli, M.; et al. New insights into mineralogy and geochemistry of allanite-bearing Mediterranean coastal sands from Northern Greece. Geochemistry 2019, 79, 247–267. [Google Scholar] [CrossRef]
  19. Papadopoulos, A.; Christofides, G.; Koroneos, A.; Stoulos, S. Natural radioactivity distribution and gamma radiation exposure of beach sands from Sithonia Peninsula. Cent. Eur. J. Geosci. 2014, 6, 229–242. [Google Scholar] [CrossRef]
  20. Papadopoulos, A.; Christofides, G.; Koroneos, A.; Hauzenberger, C. U Th and REE content of heavy minerals from beach sand samples of Sithonia Peninsula (northern Greece). J. Mineral. Geochem. 2015, 192, 107–116. [Google Scholar] [CrossRef]
  21. Filippidis, A.; Misaelides, P.; Clouvas, A.; Godelitsas, A.; Barbayiannis, N.; Anousis, I. Mineral, chemical and radiological investigation of a black sand at Touzla Cape, near Thessaloniki, Greece. Environ. Geochem. Health 1997, 19, 83–88. [Google Scholar] [CrossRef]
  22. Papadopoulos, A.; Koroneos, A.; Christofides, G.; Stoulos, S. Natural Radioactivity Distribution and Gamma Radiation exposure of Beach sands close to Maronia and Samothraki Plutons, NE Greece. Geol. Balc. 2015, 43, 1–3. [Google Scholar]
  23. Papadopoulos, A.; Tzifas, I.; Tsikos, H. The Potential for REE and Associated Critical Metals in Coastal Sand (Placer) Deposits of Greece: A Review. Minerals 2019, 9, 469. [Google Scholar] [CrossRef] [Green Version]
  24. Eliopoulos, D.; Aggelatou, V.; Oikonomou, G.; Tzifas, I. REE in black sands: The case of Nea Peramos and Strymonikos gulf. In Proceedings of the ERES, Santorini, Greece, 28–31 May 2017; pp. 49–50. [Google Scholar]
  25. Sengupta, D.; Van Gosen, B.S. Placer-type rare earth element deposits. Rev. Econ. Geol. 2016, 18, 81–100. [Google Scholar]
  26. Jordens, A.; Cheng, Y.P.; Waters, K.E. A review of the beneficiation of rare earth element bearing minerals. Miner. Eng. 2013, 41, 97–114. [Google Scholar] [CrossRef]
  27. Jordens, A.; Sheridan, R.S.; Rowson, N.A.; Waters, K.E. Processing a rare earth mineral deposit using gravity and magnetic separation. Miner. Eng. 2014, 62, 9–18. [Google Scholar] [CrossRef]
  28. Jordens, A.; Marion, C.; Langlois, R.; Grammatikopoulos, T.; Sheridan, R.; Teng, C.; Demers, H.; Gauvin, R.; Rowson, N.; Waters, N. Beneficiation of the Nechalacho rare-earth deposit. Part 2: Characterization of products from gravity and magnetic separation. Miner. Eng. 2016. [Google Scholar] [CrossRef] [Green Version]
  29. Yang, X.; Makkonen, H.T.; Pakkanen, L. Rare Earth Occurrences in Streams of Processing a Phosphate Ore. Minerals 2019, 9, 262. [Google Scholar] [CrossRef] [Green Version]
  30. Caster, S.B.; Hendrick, J.B. Rare Earth Elements. In Industrial Minerals and Rocks: Commodities, Markets, and Uses, 7th ed.; Kogel, J.E., Trivedi, N.C., Barker, J.M., Krudowski, S.T., Eds.; SME: Dearborn, MI, USA, 2006; p. 1568. [Google Scholar]
  31. Burg, J.-P.; Ricou, L.-E.; Ivanov, Z.; Godfriaux, I.; Dimov, D.; Klain, L. Syn-metamorphic nappe complex in the Rhodope Massif. Structure and kinematics. Terra Nova 1996, 8, 6–15. [Google Scholar] [CrossRef]
  32. Ricou, L.-E.; Burg, J.-P.; Godfriaux, I.; Ivanov, Z. Rhodope and Vardar: The metamorphic and the olistostromic paired belts related to the Cretaceous subduction under Europe. Geodin. Acta 1998, 11, 285–309. [Google Scholar] [CrossRef]
  33. Mposkos, E.; Kostopoulos, D. Diamond, former coesite and supersilicic garnet in metasedimentary rocks from the Greek Rhodope: A new ultrahigh-pressure metamorphic province established. Earth Planet. Sci. Lett. 2001, 192, 497–506. [Google Scholar] [CrossRef]
  34. Perraki, M.; Proyer, A.; Mposkos, E.; Kaindl, R.; Hoinkes, G. Raman micro-spectroscopy on diamond, graphite and other carbon polymorphs from the ultrahigh-pressure metamorphic Kimi Complex of the Rhodope Metamorphic Province, NE Greece. Earth Planet. Sci. Lett. 2006, 241, 672–685. [Google Scholar] [CrossRef]
  35. Brun, J.P.; Sokoutis, D. Kinematics of the Southern Rhodope Core Complex (North Greece). Int. J. Earth Sci. 2007, 96, 1079–1099. [Google Scholar] [CrossRef]
  36. Liati, A.; Gebauer, D.; Fanning, C.M. Geochronology of the Alpine UHP Rhodope Zone: A review of isotopic ages and constraints on the geodynamic evolution. In Ultrahigh–Pressure Metamorphism: 25 Years after the Discovery of Coesite and Diamond; Dobrzhinetskaya, L., Faryad, S.W., Wallis, S., Cuthbert, S., Eds.; Elsevier: Amsterdam, The Netherlands, 2011; pp. 295–324. [Google Scholar]
  37. Burg, J.P. Rhodope: From Mesozoic convergence to Cenozoic extension. Review of petro-structural data in the geochronological frame. J. Virtual Explor. 2012, 42, 1–44. [Google Scholar] [CrossRef]
  38. Tranos, M.D. Slip preference analysis of faulting driven by strike-slip Andersonian stress regimes: An alternative explanation of the Rhodope metamorphic core complex (northern Greece). J. Geol. Soc. 2017, 174, 129–141. [Google Scholar] [CrossRef]
  39. Dinter, D.A.; Royden, L. Late Cenozoic extension in northeastern Greece: Strymon Valley detachment system and Rhodope metamorphic core complex. Geology 1993, 21, 45–48. [Google Scholar] [CrossRef]
  40. Papanikolaou, D.; Panagopoulos, A. On the structural style of southern Rhodope, Greece. Geol. Balc. 1981, 11, 13–22. [Google Scholar]
  41. Dinter, D.A.; MacFarlane, A.; Hames, W.; Isachsen, C.; Bowring, S.; Royden, L. U-Pb and 40Ar/39Ar geochronology of the Symvolon granodiorite: Implications for the thermal and structural evolution of the Rhodope metamorphic core complex, northeastern Greece. Tectonics 1995, 14, 886–908. [Google Scholar] [CrossRef]
  42. Pe-Piper, G.; Piper, D.J.; Lentz, D.R. The Igneous Rocks of Greece: The Anatomy of an Orogeny; Gebruder Borntraeger: Berlin, Germany, 2002; 573p. [Google Scholar]
  43. Hubbard, C.; Snyder, R. RIR—Measurement and Use in Quantitative XRD. Powder Diffr. 1988, 3, 74–77. [Google Scholar] [CrossRef] [Green Version]
  44. Anthony, J.W.; Bideaux, R.A.; Bladh, K.W.; Nichols, M.C. Handbook of mineralogy. In Mineralogical Society of America; Mineral Data Publishing: Chantilly, VA, USA, 2001. [Google Scholar]
  45. Rosenblum, S.; Brownfield, I.K. Magnetic Susceptibilities of Minerals—Report for US Geological Survey; U.S. Geological Survey: Reston, VA, USA, 1999; pp. 1–33.
  46. Gupta, C.K.; Krishnamurthy, N. Extractive Metallurgy of Rare Earths; CRC Press: Boca Raton, FL, USA, 2005; p. 484. [Google Scholar]
  47. Rudnick, R.L.; Gao, S. Composition of the continental crust. Crust 2003, 3, 1–64. [Google Scholar]
  48. McDonough, W.F.; Sun, S.S. The Composition of the Earth. Chem. Geol. 1995, 120, 223–253. [Google Scholar] [CrossRef]
  49. Reisman, D.; Weber, R.; McKernan, J.; Northeim, C. Rare Earth Elements: A Review of Production, Processing, Recycling, and Associated Environmental Issues; EPA Report EPA/600/R-12/572; U.S. Environmental Protection Agency (EPA): Washington, DC, USA, 2013. Available online: https://nepis.epa.gov/Adobe/PDF/P100EUBC.pdf (accessed on 30 August 2019).
  50. Weng, Z.H.; Jowitt, S.M.; Mudd, G.M.; Haque, N. Assessing rare earth element mineral deposit types and links to environmental impacts. Appl. Earth Sci. 2013, 122, 83–96. [Google Scholar] [CrossRef]
  51. Dutta, T.; Kim, K.-H.; Uchimiya, M.; Kwonc, E.E.; Jeon, B.-H.; Deep, A.; Yun, S.-T. Global demand for rare-earth resources and strategies for green mining. Environ. Res. 2016, 150, 182–190. [Google Scholar] [CrossRef]
  52. Wall, F.; Rollat, A.; Pell, R.S. Responsible sourcing of critical metals. Elements 2017, 13, 313–318. [Google Scholar] [CrossRef] [Green Version]
  53. Grammatikopoulos, T.; Mercer, W.; Gunning, C. Mineralogical characterisation using QEMSCAN of the Nechalacho heavy rare earth metal deposit, Northwest Territories, Canada. Can. Metall. Q. 2013, 52, 265–277. [Google Scholar] [CrossRef]
  54. British Geological Survey. Rare Earth elements profile. In Mineral Profile Series; BGS NERC: Keyworth, UK, 2011; p. 53. [Google Scholar]
  55. Yang, X.; Satur, J.V.; Sanematsu, K.; Laukkanen, J.; Saastamoinen, T. Beneficiation studies of a complex REE ore. Miner. Eng. 2015, 71, 55–64. [Google Scholar] [CrossRef]
  56. Jordens, A.; Marion, C.; Kuzmina, O.; Waters, K.E. Physicochemical aspects of allanite flotation. J. Rare Earths 2014, 32, 476–486. [Google Scholar] [CrossRef]
  57. Angelatou, V.; Drossos, E. Beneficiation of green black sands for REE recovery. In Proceedings of the ERES, Santorini, Greece, 28 June–1 July 2017; pp. 49–50. [Google Scholar]
Figure 1. Geological map of the sampling area of Nea Peramos Loutra Eleftheron coast, Kavala region [12,13]. The large igneous body behind the coastline is Symvolon granite.
Minerals 10 00387 g001
Figure 2. (a) Magnetic Separator HIMG ERIEZ Co. and products of separation, (b) dark colored magnetic product and, (c) non-magnetic product.
Minerals 10 00387 g002
Figure 3. Backscattered electron images from SEM of various rare earth element (REE) minerals and other heavy minerals of different particle size fractions. (a,b) zoned allanite–(Ce) showing metamict structure and epidote peripheral zone (−0.425 mm to +0.212 mm), (c) allanite containing zircon inclusions from the magnetic fraction, (d) zoned allanite with weathering features and cracks containing inclusion of Ca-rich monazite (cheralite) (e) monazite containing pargasite and thorite inclusions, from the magnetic fraction, (f) thorite-weathered grain, darker zones are U depleted); abbreviations: Aln—allanite, Ep—epidote, Zr-zircon, Mnz—monazite, Thr—thorite, Mt—magnetite, Prg—pargasite, and Chr—cheralite.
Minerals 10 00387 g003
Figure 4. REE patterns of Nea Peramos heavy mineral (HM) sands. Red-colored line highlights the most REE-enriched sample #123. Normalization values of chondrite from [48].
Minerals 10 00387 g004
Figure 5. (a) Particle size analysis and light rare earth element (LREE) distribution (mg/kg) in sample A-mixed and (b) metal recovery in each particle size fraction, based on mass balance calculations (see text).
Minerals 10 00387 g005
Figure 6. Comparison of XRD patterns of magnetic and nonmagnetic separates after high-intensity magnetic separation (HIMS) from sample #123. Note that the clear peaks of allanite are absent in the nonmagnetic fraction.
Minerals 10 00387 g006
Figure 7. (a) LREE and Th distribution in the magnetic products of the particle size fractions and (b) metal recovery in each particle size fraction, based on mass balance calculations.
Minerals 10 00387 g007
Figure 8. Flowsheet of HIMS tests. Preconcentration step involves sieving and removing of +0.500 mm (Feed 1). Feed 2 corresponds to all the particle size fractions (−1.70 to +0.212 mm) of the initial composite (sample A-mixed).
Minerals 10 00387 g008
Table 1. Common silicate, phosphate, and carbonate rare earth element (REE) bearing minerals in heavy mineral (HM) sands (bold, this study) and bauxite residues in Greece [6,9,14,24]. Data for mineral properties from [26] (and references therein) and apatite data from [30].
REE-MineralChemical FormulaDensity (g/cm3)Magnetic PropertiesWeight % REOThO2UO2
Silicates
Allanite (Ce)(Ce,Ca,Y)2(Al,Fe2+,Fe3+)3(SiO4)3(OH)3.50–4.20paramagnetic3–510–3-
Allanite (Y)(Y,Ce,Ca)2(Al,Fe3+)3(SiO4)3(OH)n/aparamagnetic3–510–3-
Cheralite (Ce)(Ca,Ce,Th)(P,Si)O45.28n/a-<30-
Sphene (titanite)(Ca,REE)TiSiO53.48–3.60paramagnetic<3--
Thorite(Th,U)SiO46.63–7.20paramagnetic<370–8010–16
Zircon(Zr,REE)SiO44.60–4.70diamagnetic-0.1–0.8-
Phosphates
ApatiteCa5(PO4)3(F,Cl,OH)3.17n/a~19--
Fluorapatite(Ca,Ce)5(PO4)3.10–3.25n/a---
Monazite (Ce)(Ce,La,Nd,Th)PO44.98–5.43paramagnetic35–710–200–16
Monazite (La)(La,Ce,Nd,Th)PO45.17–5.27paramagnetic35–710–200–16
Monazite (Nd)(Nd,Ce,La,Th)PO45.43paramagnetic35–710–200–16
Rhabdophane (Ce)(Ce,La)PO4.H2O3.77–4.01n/a---
Xenotime (Y)YPO44.40–5.10paramagnetic52–67-0–5
Carbonates
Bastnäsite (Ce)(Ce,La)(CO3)F4.9–5.2paramagnetic70–740–0.30.09
Bastnäsite (La)(La,Ce)(CO3)Fn/aparamagnetic70–740–0.30.09
Bastnäsite (Y)Y(CO3)F3.90–4.00paramagnetic70–740–0.30.09
Synchysite (Nd)Ca(Nd,La)(CO3)2F4.11 (calc)n/a---
n/a: not available; (-): this information is not known.
Table 2. Semiquantitative mineral contents of the composite sample (A-mixed), based on Reference Intensity Ratio (RIR) method. Specific gravity and magnetic property data from [44,45,46].
MineralWeight %Nominal Specific GravityMagnetic Property
Albite392.68Diamagnetic
Quartz312.63Diamagnetic
K-feldspar112.57Diamagnetic
Titanite83.4–3.6Paramagnetic
Mg-hornblende63.24Paramagnetic
Allanite33.75Paramagnetic
Hematite25.30Ferromagnetic
Magnetite15.20Ferromagnetic
Trace minerals<0.5--
Total100
(-): not applicable.
Table 3. REE (Lanthanides, Sc, Y) contents of the Nea Peramos (NP) HM sands (in mg/kg). Light rare earth elements (LREE) group includes the elements from La to Sm, while heavy rare earth elements (HREE) group includes the elements from Eu to Lu; Y and Sc are included in total REE content, according to European Union (EU) definition [2].
SampleNP 115NP 116NP 117NP 117ANP 118NP 119NP 120NP 121NP 122NP 123NP 124NP 125NP 126NP 127NP 128
LREE6008261407315707350411820242225764566464552982297787
HREE476198275120418147160465409295157647
TREE65489415093447623716143218123938124706848571162381842
Table 4. Particle size analysis and REE distribution in each particle size fraction.
Particle Size
(mm)
MassWeightLaCeNdThLaCeNdTh
(g)(%)Concentration (mg/kg)Mass (mg)
+1.7055.62.4216251070.891.390.560.39
−1.70 + 0.850230.710.0254106382512.4624.458.775.77
−0.850 + 0.500640.4827.82416777247190266.44497.65158.20121.69
−0.500 + 0.425324.6214.1010441983607455338.90643.72197.04147.70
−0.425 + 0.355307.3213.3514452719821641444.08835.60252.31196.99
−0.355 + 0.300286.2612.4315983018891723457.44863.93255.06206.97
−0.300 + 0.212353.0215.338521643487390300.77580.01171.92137.68
−0.212 + 0.15069.123.0050796830524035.0466.9121.0816.59
−0.15035.051.5220313840116294571.19134.5940.7333.12
Total2302.17 1927.213648.271105.66866.90
Table 5. REE distribution and recovery of REE and Th in the magnetic products of each particle size of the A-mixed sample and the undersize 0.500 mm.
Feed: Sample A (All Fractions)LaCeNdThLaCeNdTh
Mass (g)Concentration (mg/kg)Mass (g)
199594216475123651.873.291.0210.728
Particle size magnetic fractions (mg/kg)Mass (g)
−1.70 + 0.85042.55261447137930.01110.01900.00580.0040
−0.850 + 0.500162.23130123097173920.21110.37460.11630.0636
−0.500 + 0.425101.6527644802144410990.28100.48810.14680.1117
−0.425 + 0.355109.8136276321186514720.39830.69410.20480.1616
−0.355 + 0.300100.638386649196815950.38610.66890.19800.1605
−0.300 + 0.212142.8330445280156313020.43480.75410.22320.1860
Total659.67 1.72232.99890.89500.6873
Recovery (wt.%) 92.191.187.694.4
Feed: −0.500 mmLaCeNdThLaCeNdTh
Mass (g)Concentration (mg/kg)Mass (g)
530126022236704601.92783.40121.02510.7038
Magnetic fraction49037746089165013001.84932.98360.8085
Recovery (wt.%) 95.989.778.8790.5

