Review

Hydrometallurgical Recovery and Process Optimization of Rare Earth Fluorides from Recycled Magnets

Metallurgical and Materials Engineering, Montana Tech, 1300 West Park Street, Butte, MT 59701, USA
*
Authors to whom correspondence should be addressed.
Minerals 2020, 10(4), 340; https://doi.org/10.3390/min10040340
Submission received: 28 February 2020 / Revised: 2 April 2020 / Accepted: 4 April 2020 / Published: 10 April 2020
(This article belongs to the Special Issue Leaching of Rare Earth Elements from Various Sources)

Abstract

:
Magnets containing substantial quantities of rare earth elements are currently one of the most sought-after commodities because of their strategic importance. Recycling these rare earth magnets after their life span has been identified to be a unique approach for mitigating environmental issues that originate from mining and also for sustaining natural resources. The approach is hydrometallurgical, with leaching and precipitation followed by separation and recovery of neodymium (Nd), praseodymium (Pr) and dysprosium (Dy) in the form of rare earth fluorides (REF) as the final product. The methodology is specifically comprised of sulfuric acid (H2SO4) leaching and ammonium hydroxide (NH4OH) precipitation followed by reacting the filtrate with ammonium bifluoride (NH4F·HF) to yield the REF. Additional filtering also produces ammonium sulfate ((NH4)2SO4) as a byproduct fertilizer. Quantitative and qualitative evaluations by means of XRD, ICP and TGA-DSC to determine decomposition of ammonium jarosite, which is an impurity in the recovery process were performed. Additionally, conditional and response variables were used in a surface-response model to optimize REF production from end-of-life magnets. A REF recovery of 56.2% with a REF purity of 62.4% was found to be optimal.

1. Introduction

Disquiet around the sustainability of rare-earth elements (REE) provisions has stimulated determination not only to recycle but also to improve the proficiency of the materials they are used to make [1]. With respect to the amount of REEs produced, neodymium (Nd) usage in the production of neodymium-Iron-Boron (NdFeB) magnets from mine output is about 13%. Out of that, 34% of the magnets produced are used in the manufacturing of actuator hard disk drives [1,2,3]. With their life span centered on their application, rare earth materials in hard disk drives are also applied in parts such as printed circuit boards (PCB), spindles, and so on [4].
In the production of these magnets, specific additions of elements are also used to adjust their properties [5,6]. For example, cobalt (Co) is used to substitute REE and iron (Fe) materials (up to over 5%) to increase the Curie temperature [7,8]. Dysprosium (Dy) addition increases the temperature characteristics such that the compound has a better stability against demagnetization. It also decreases the residual induction of the magnet, which leads to lower magnetic field properties [6,9]. To lower the production costs, Pr is now used as a substitute of Nd (up to 20–25%) in the production of magnets. Additionally, the magnet material is coated with a protective layer, such as copper (Cu), aluminum (Al), or nickel (Ni), as well as polymeric material to hold the magnet on the steel plate [4]. Although this shows that recycling of end-of-life magnets can help reduce the criticality of these REE in the near future, commercial recycling of REE is low, at less than 1%. This is mainly due to inefficient collection, technological difficulties, and high cost of processing [10,11,12,13,14,15].
Separation stage(s) have always been an important step in recycling. For rare earth magnets, since the element of interest is found with two or more others, they may require different extraction technology. Hydrometallurgical approaches have been shown to be a very efficient way to separate the REEs in which chemical separation by leaching is performed [16,17]. For REE leaching, lixiviants are directly added with or without heat treatment to dissolve the solid materials. Once the materials are in solution, various processes such as precipitation, solvent extraction, and ion exchange can be used to economically produce individual REE in the required form.
As a part of the impurities encountered in REE recovery, some of the leached Fe is also recovered as ammonium jarosite in the final REF product. To remove this impurity, the final product form is subjected to high temperature (250–500 °C) to decompose the ammonium jarosite [18,19,20,21]
For solvent extraction and ion exchange, different cationic, anionic and solvating extractants such as di (2-ethyl-hexyl) phosphoric acid (D2EHPA), dialkyl phosphonic acid (Cyanex 272), 2-ethyl-hexyl phosphonic acid mono-2-ethyl-hexyl ester (PC 88A), neodecanoic acid (Versatic 10), tributyl phosphate (TBP), and tricaprylylmethylammonium chloride (Aliquat 336) have been reported for the separation of REEs from solution with D2EHPA being more commonly used with nitrate, sulfate, chloride and perchlorate solutions, PC 88A with chloride solutions, and TBP with nitrate solutions [22,23,24,25,26,27,28,29,30,31,32,33,34,35]. Interestingly, many of the same chemical types used as solvent extractants are also used in solid form as ion-exchange resins from the same type of leaching solutions [23,24,28,32]. For both solvent extraction and ion exchange, the REE-loaded material must then be selectively stripped. The resulting solutions are then predominantly processed to precipitate the individual REEs, often as REOs, but not always [36,37,38,39].
This paper presents the recycling Nd magnet scrap using a novel hydrometallurgical process involving H2SO4 leach, NH4OH precipitation, and NH4F·HF reaction. The latter step transforms the precipitate into rare earth fluorides (REF) which should be appropriate feedstock for subsequent pyrometallurgical processing into metal in molten fluoride electrolysis [39]. The application of hydrofluoric acid (HF) was completely avoided and the process was optimized through statistical analysis and modelling.

2. Experimental

2.1. Materials

Samples of scrap magnets were obtained from end-of-life computer hard drives from the IT Department of Montana Tech. Ammonium hydroxide (NH4OH) dissolved in water at 28–30% concentration was obtained from VWR International LLC. Sulfuric acid (98% H2SO4) from Pharmco Products Inc. and ammonium bifluoride (98.8% NH4F·HF) manufactured by J.T. Baker were the other reagents used in the work.

2.2. Sample Preparation

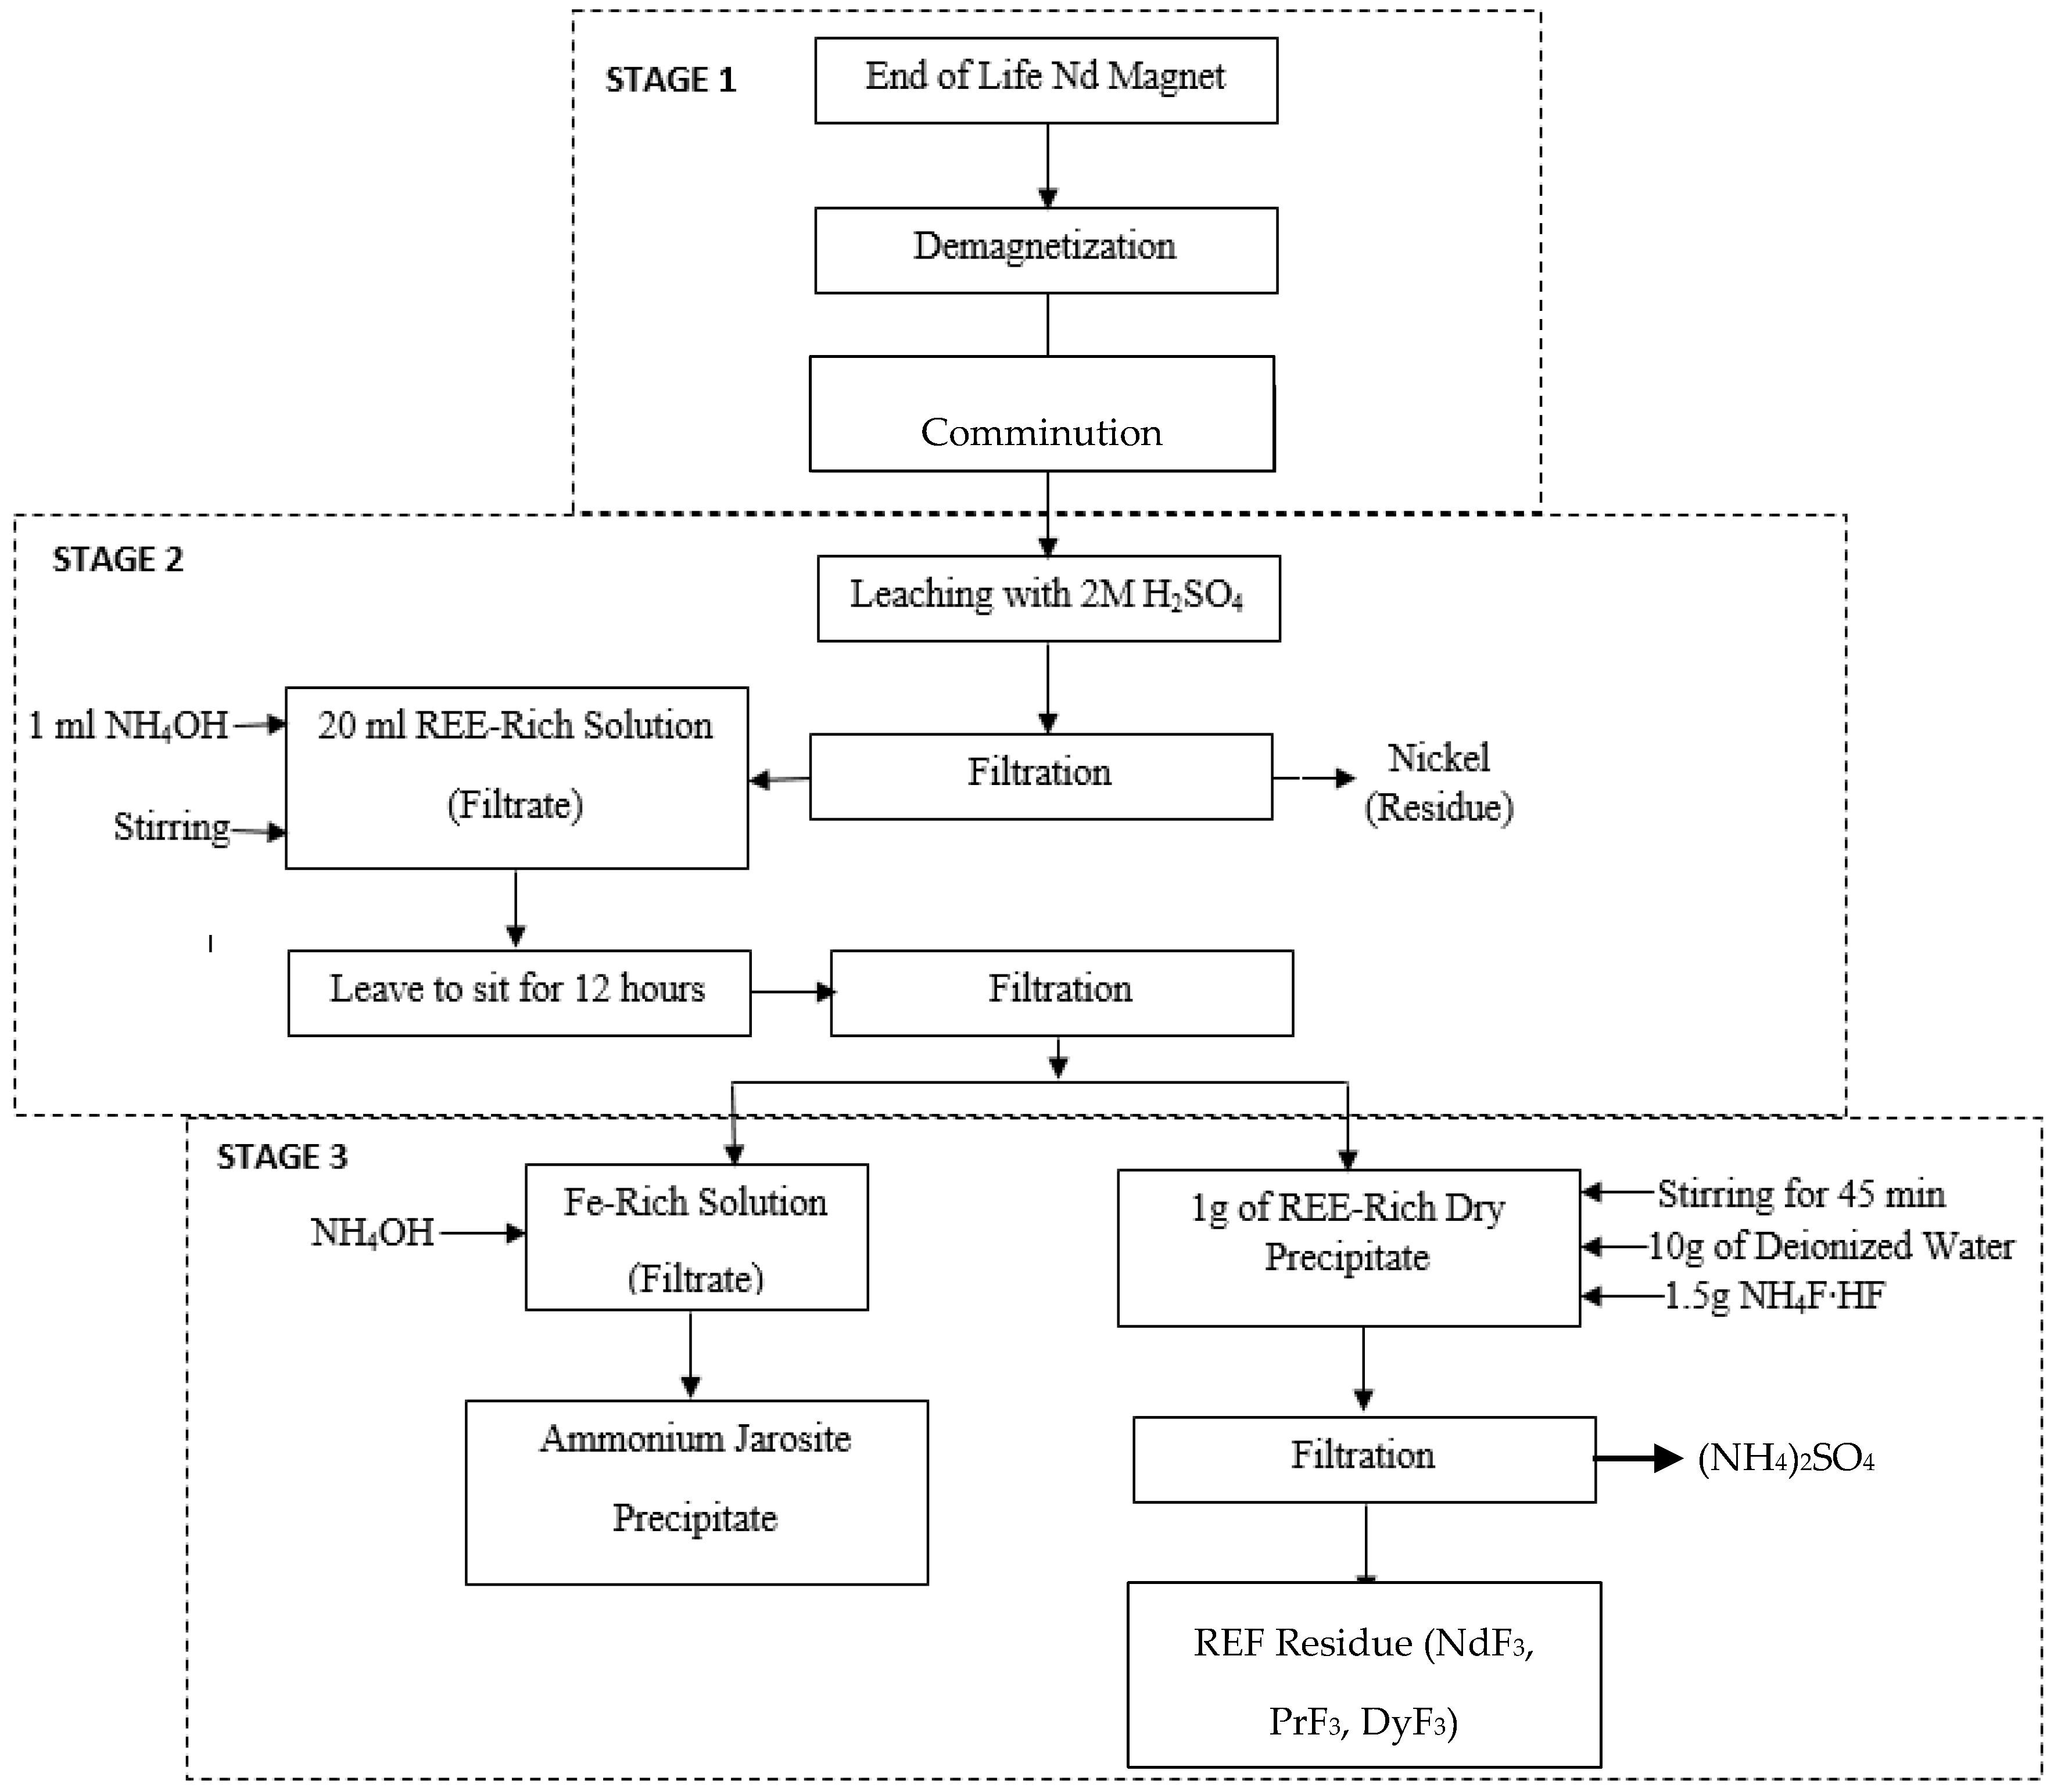
2.2.1. Demagnetization

Nd magnets were obtained by disassembling the actuators in various hard drives. After loading in a ThermoScientific Lindberg/Blue M box furnace, the furnace was programmed to heat up to 500 °C at 5 °C per minute under ambient air. This was done in order to cause demagnetization and weaken the adhesive used to hold the magnet on the steel plate. The temperature was held at 500 °C for 60 min. Afterwards, the demagnetized magnets were air-cooled and sorted from the steel plates.

2.2.2. Comminution

Comminution was done to liberate the NdFeB part of the demagnetized sample so that ground mass could be easily leached with the lixiviant in view of the increased surface area of the material. Using a disc pulverizer from Bico Inc. (Burbank, CA, USA), the samples were initially comminuted with a set of 3.1 mm. That product was further comminuted with a set of 0.3 mm. A sieve analysis was performed to determine the size distribution of the comminuted material and is discussed later.

2.3. Hydrometallurgical Processing

REEs were leached from the comminuted sample in a 2M H2SO4 acid solution with sample to solution ratio of 1g:10mL [4]. This process was done under a fume hood for 2 h with the acid solution being added in small amounts because of the aggressiveness of the reaction as shown in Equation (1).
Nd2Fe14B + 45H+ + 3H2O → 2Nd3+ + 14Fe3+ + BO33− + 25.5H2
Filtration was performed after leaching to separate the REE-acidic pregnant solution from the residue. NH4OH was then added to the filtrate in a ratio of 1 mL NH4OH to 20 mL rare earth rich pregnant solution to adjust the pH to 1.2, as shown in Equation (2).
NH4OH + Nd3+ + 2SO42− + H+ + 2H2O → (NH4)Nd(SO4)2(H2O)3
Upon addition, the solution was stirred at 90 rpm to completely dissolve back into solution anything that formed when the NH4OH was added. After that, the solution was allowed to sit for 12 h so the REE-rich precipitate could fully form and settle. Finally, filtration was performed so that the REE-rich residue could be collected and allowed to air dry. The dry REE-rich precipitate is then added into a mixture of NH4F∙HF and deionized water in a ratio of 1g:1.5g:10g and stirred for 45 min to enhance the formation of REF. The residue obtained after filtration was air dried and analyzed for REF content. The process flow sheet is shown in Figure 1. Various stages are also identified in the figure to facilitate further discussion later in this paper.
Recovery of Fe in the form of ammonium jarosite, as shown in Equation (3), can also be done by the addition of more NH4OH into the Fe-rich solution (as shown in Stage 3). With Equation (3) representing the reaction, the pH of the solution increased until a pH of 2 where maximum ammonium jarosite precipitated [17].
NH4OH + 3Fe3+ + 2SO42− + 5H2O → (NH4)Fe3(OH)6(SO4)2 + 5H+

2.4. Modelling of REF Recovery

Stage 1 and Stage 2 of the flow sheet in Figure 1 were identified as less critical compared to Stage 3 of the process. Hence, it was decided to optimize Stage 3 in the present work. To optimize the REF recovery, Response Surface Methodology (RSM) was pragmatic in the analysis of the experiments. RSM is a mathematical and statistical technique that employs empirical models to fit the experimental data with reference to the Design of Experiments (DOE). With the process responses not following a linear model, the Box-Behnken design was employed for designing the experimental matrix to delineate the response surfaces generated by the condition variables [39,40,41,42,43,44]. This design selects points in the experimental domain for a three-level factorial arrangement in such a way that permits proficient approximation of the first and second order coefficients for the mathematical model [42]. The user identifies a high level and a low level of each condition variable and the mid-point is automatically identified for the point selection. Several experiments (usually 3 or 5) are conducted at the mid-point of all variables to estimate the inherent variability associated with the experimental technique.
In this work, the objectives were to maximize the amount of REF recovered from the precipitate along with their purity. This RSM was used at the point in the experiment where the REE-rich precipitate is added to NH4F·HF to produce the REF in Stage 3. The experiments were performed as per the RSM design of experiments developed using the statistical software Design Expert 9 procured from Stat-Ease Inc., Minneapolis, MN, USA [43]. During the scoping tests, several condition variables were identified that affected the amount of REF recovered from the precipitate as well as its purity. To limit the number of experiments, the most important three condition variables were chosen, namely, the amount of deionized water (mL), amount of NH4F·HF (g) and degree of stirring (min). Of course, the identified responses were the amount of REF recovered from the precipitate and the purity of the REF. The selected points in the experimental domain and the responses obtained are discussed later, along with the response surfaces, model equations, optimization and the interaction of the condition variables.

2.5. Material Characterization

After demagnification, the feed materials as well as intermediate and final products from this study were characterized using Scanning Electron Microscopy with Energy Dispersive X-ray (SEM-EDX), X-ray Diffractometry (XRD), Inductively Coupled Plasma–Optical Emission Spectrometry (ICP-OES), and a thermal analyzer with thermogravimetric (TG) and differential scanning calorimetry (DSC) capabilities.

2.5.1. SEM/EDX

The SEM-EDX analyzer was employed to determine the chemical compositions of all phases in the demagnetized material. The SEM-EDX system uses a TESCAN TIMA with a tungsten filament and an EDAX Z2 analyzer (TESCAN ORSAY HOLDING, a.s., Kohoutovice, Czech Republic). Cross-sectioned sides of a representative sample were hand-separated and cold-mounted in epoxy using molds approximately 25 mm in diameter and 10 mm in thickness. Resulting mounts were ground and polished to a smooth finish and then conductively coated with carbon to obtain SEM images by backscattered electron (BSE) detection. EDX analyses helped determine the chemical compositions of all products.

2.5.2. XRD

X-ray diffraction was carried out with a Rigaku Ultima IV X-ray Diffractometer (XRD) (RIGAKU AMERICAS CORPORATION, Woodland, TX, USA) using Cu-Kα radiation at 40 kV and 40 mA. This was used for quantitative analysis and also to determine the various phases of the precipitates and the products obtain after NH4·HF addition.

2.5.3. ICP-OES

A ratio of 3:1 v/v HCl to HNO3 was used to digest a representative sample of the final product obtained at the end of each experiment and resulting solutions were analyzed by ICP-OES to determine the elemental content of the sample (Thermo Electron Duo View iCAP 6500, Waltham, MA, USA).

2.5.4. TGA-DSC

Thermal decomposition of the ammonium jarosite, obtained in the final stage, was carried out in a TA Instruments SDT Q650 simultaneous thermal analyzer with thermogravimetric (TG) and differential scanning calorimetry (DSC) capabilities (TA Instruments, New Castle, DE, USA). Analyses were performed using 10 mg sample with a heating rate of 10 °C/min to 400 °C under argon atmosphere. The furnace temperature was regulated precisely to provide a uniform rate of decomposition.

3. Results and Discussions
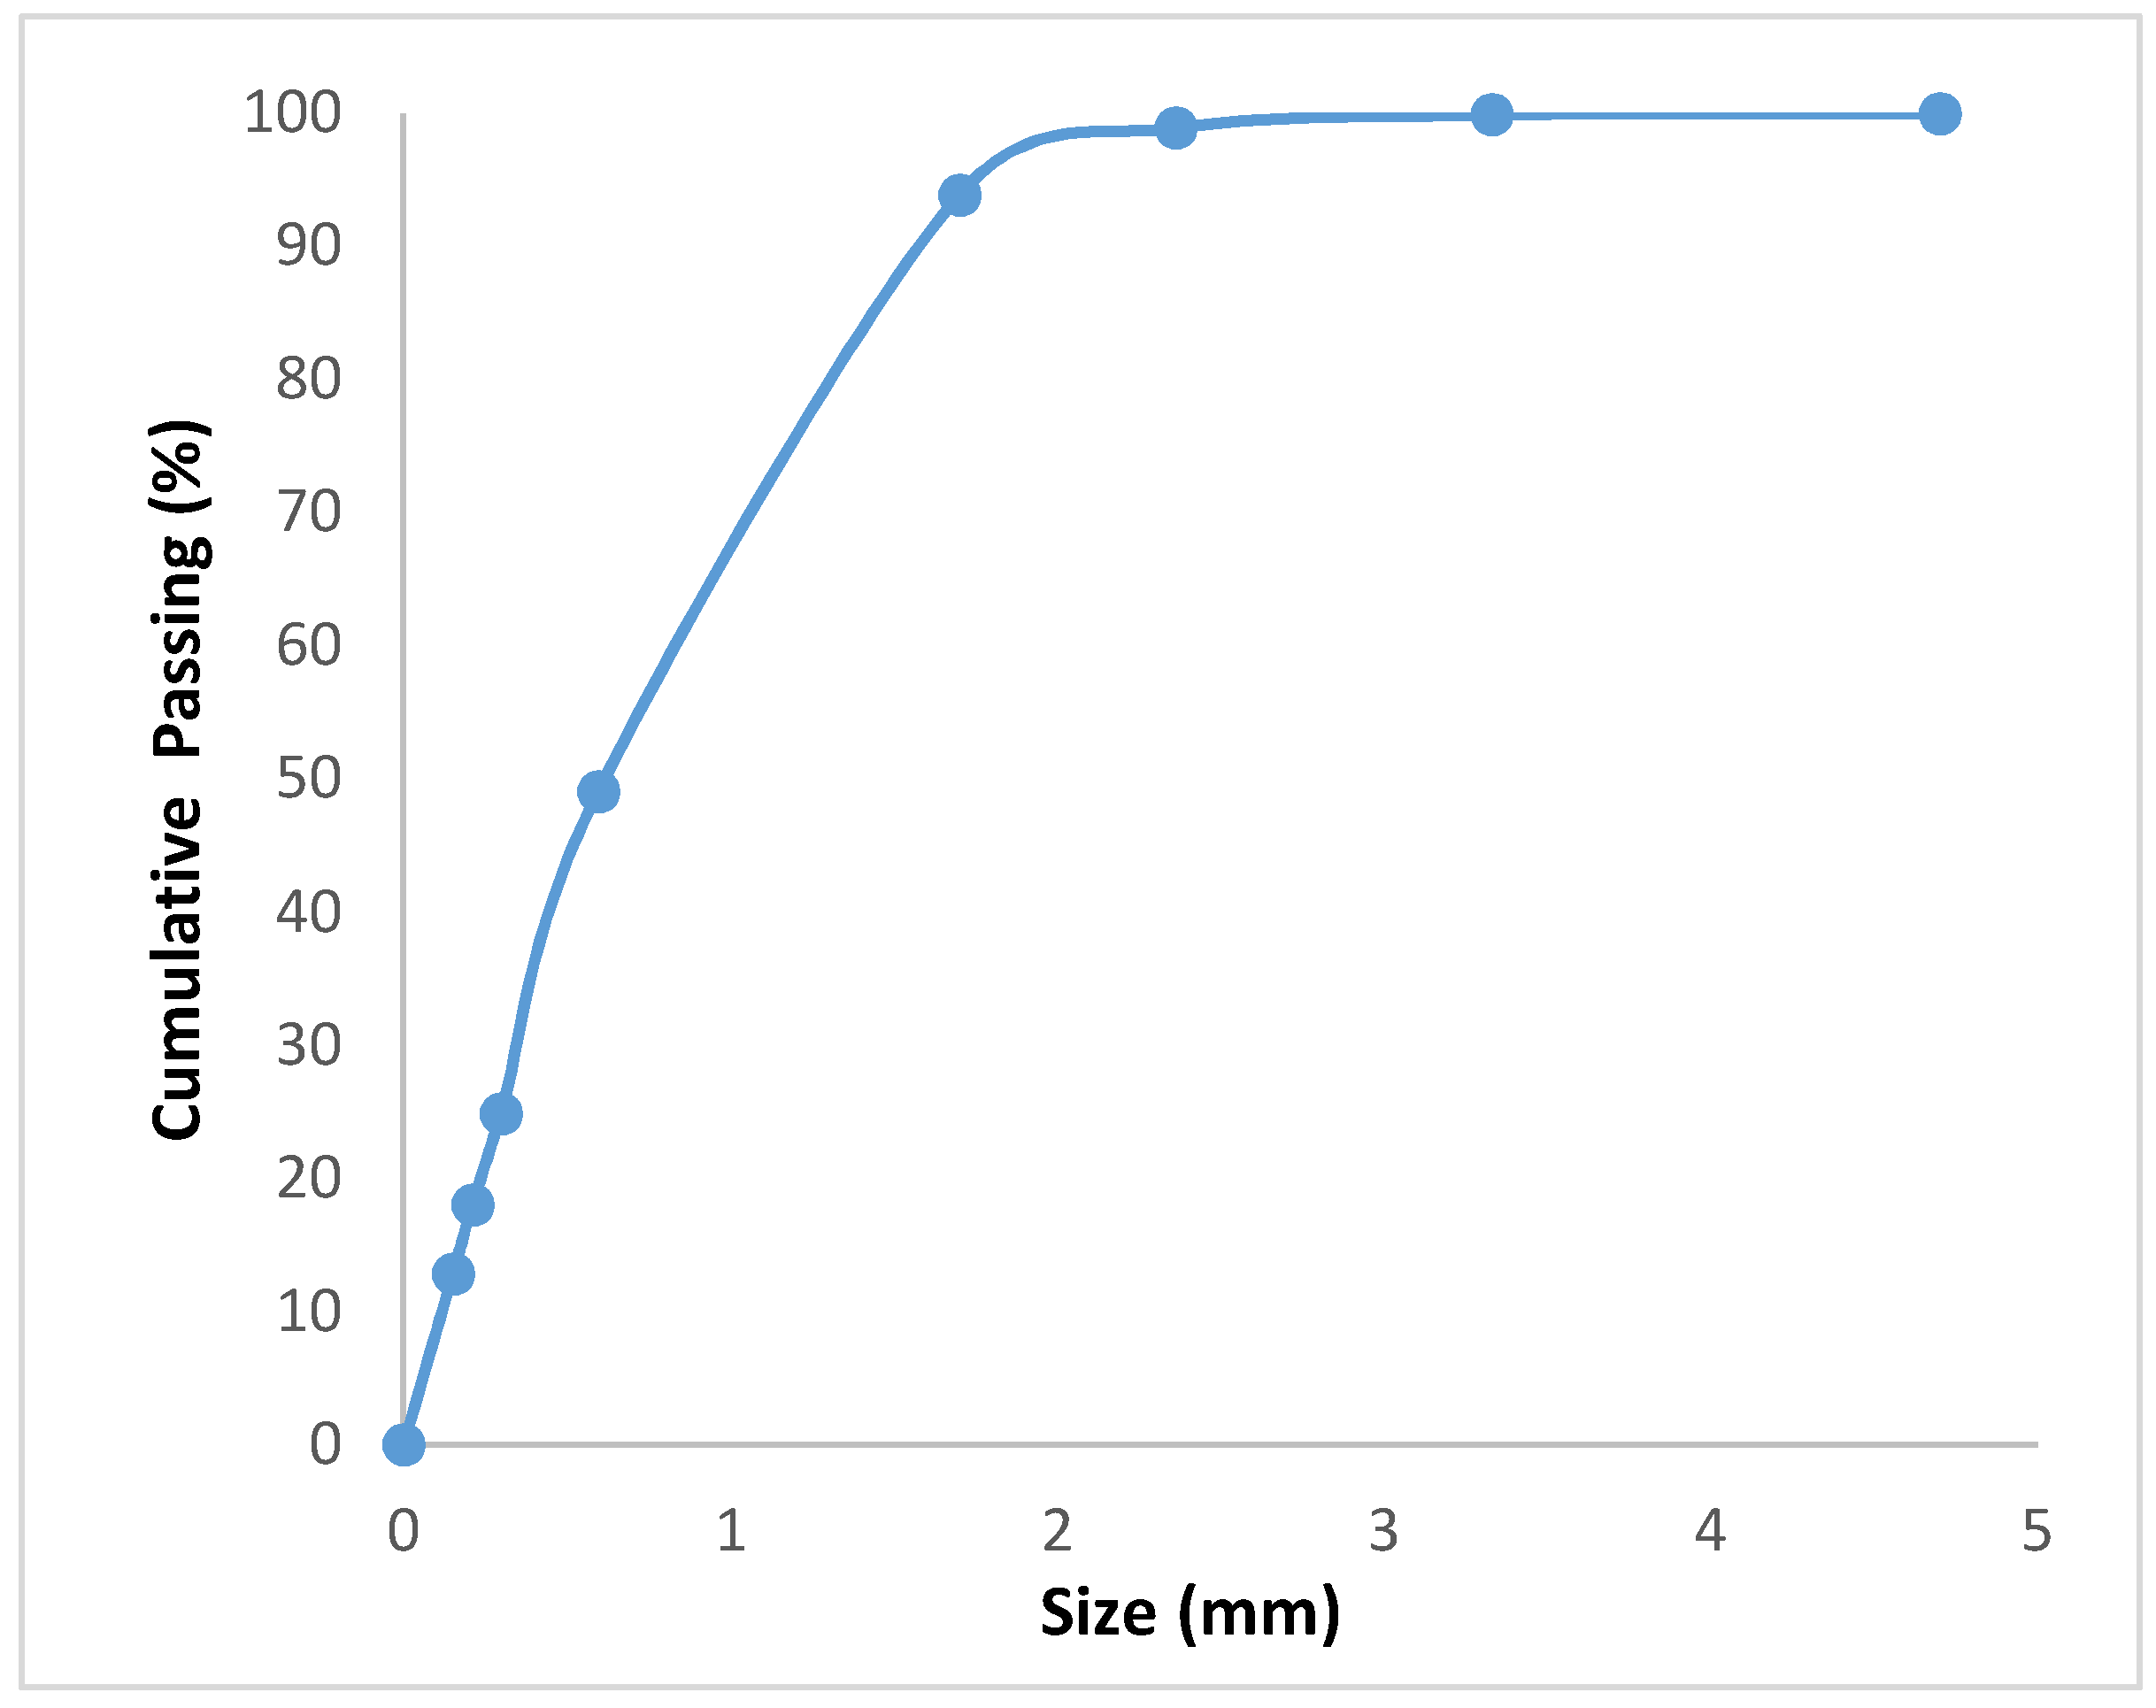
3.1. Granulometry

Regarding Stage 1 of Figure 1 and using sieves ranging in aperture size from 0.149 to 4.699 mm, the size distribution of the comminuted sample is shown in Figure 2. It can be seen from this figure that nearly 50% of the material passed through the 0.6 mm sieve size. The 80% passing size (d80) of the comminuted mass is about 1.7 mm.

3.2. SEM-EDX Analysis
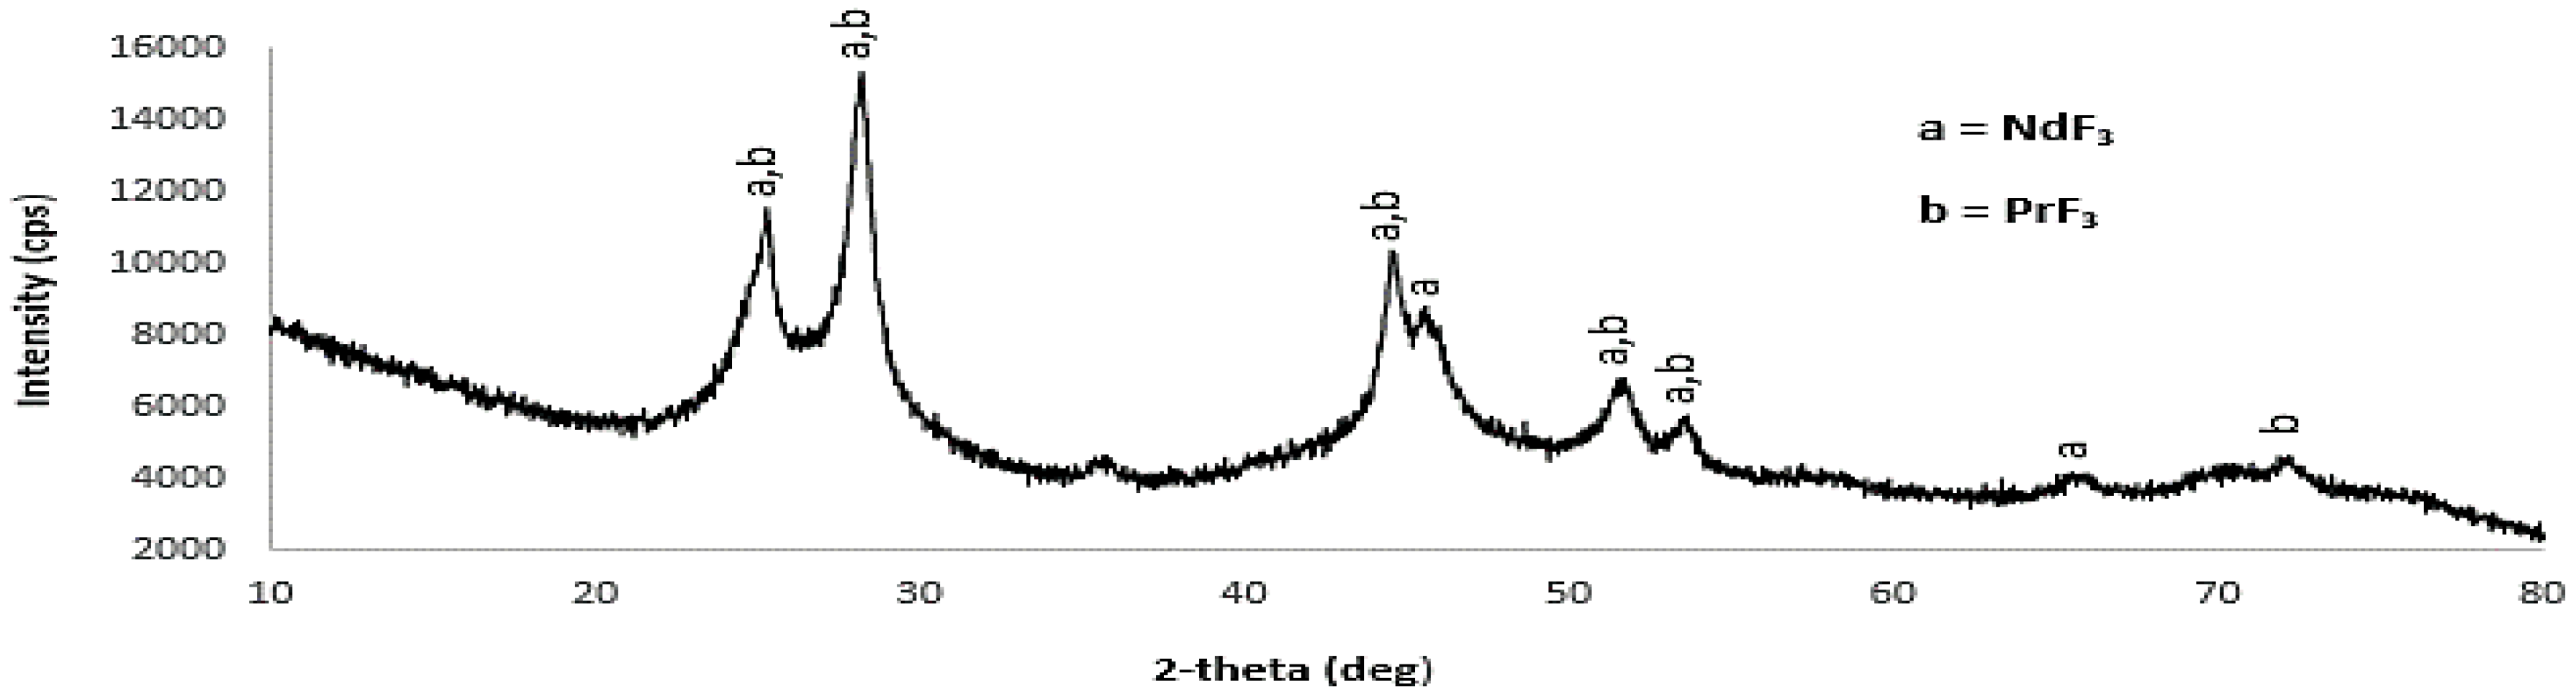
Image from the Backscatter Electron (BSE) detector on the SEM-EDX demonstrate some dissimilar phases in the demagnetized and comminuted sample (see Stage 1 of Figure 1). “Three Dots” analysis was performed using the EDX. Of the three indicated points shown in Figure 3, each has a distinctive chemistry: point (a) appears to be Ni, which is the outer layer; point (b) is a combination of Pr, Nd and Fe, where Pr is used to substitute Nd (up to 20–25%) to lower production costs; and point (c) shows a mixture of Nd and Fe. It is noted that boron (B) was not detected due to its low intensity, resulting from it being a light element (i.e., element #5 on the periodic table), as well as from the inherent disability of the BSE detector that was used [45].

3.3. XRD Results

Figure 4 and Figure 5 show the phase compositions of the precipitates (Stage 2 feed to Stage 3 rich, dry precipitate, as per Figure 1) and the final product (Stage 3 REF residue, as per Figure 1), respectively. From Figure 4, it can be said that most of the Fe remains in solution and that the dry precipitate is made up of mainly (NH4)Nd(SO4)2(H2O)3. This compound is an ammonium neodymium sulfate double salt and is noted to be similar to ammonium jarosite [17] with Nd substituting for Fe. Figure 5 also shows the phases of the product made after adding and stirring the dry precipitate in NH4F·HF for 45 min, which is then heated under argon atmosphere to 400 °C and allowed to cool. Equation (4) depicts a possible mechanism for REF formation with the REE being Nd assuming ammonium (NH4+) is in excess:
2(NH4)Nd(SO4)2(H2O)3 + 3NH4F·HF + 3NH4+ → 2NdF3 + 4(NH4)2SO4 + 6H2O + 3H+
The product is clearly a REF containing REEs of Nd, Dy and Pr. It can therefore be concluded that REF can be produced by this process and the resulting fluorides can be used later as feedstock for pyrometallurgical metal production [39].

3.4. ICP Results

Table 1 shows the chemical composition of REEs in the final REF product indicating Dy and Fe are present, apparently in amounts below the XRD detection limit. Together, the total REE amount sums to 63.25%. Based on stoichiometry and assuming the REEs exist as REF (i.e., NdF3, PrF3 and DyF3), the F-content would be 24.94%. This leaves a balance of 10.59%, which is expected to be ammonium sulfate [(NH4)2SO4] and ammonium jarosite [(NH4)Fe3(SO4)2(OH)6], as per Equation (4). Furthermore, based on the stoichiometry of the jarosite, the Fe content would equate to 3.44% of these other components, suggesting there is 7.15% ammonium sulfate. Both ammonium sulfate and ammonium jarosite can be monohydrated [46] which will thermally decompose at low temperature. In this regard, a TGA-DSC study was undertaken on the final REF residue from Stage 3. Because the product was heated to 400 °C under argon, a subsequent TGA-DSC scan did not exceed 400 °C. It is important to note that this REF residue, as discussed above, is not pure, and therefore contains some ammonium sulfate and ammonium jarosite.

3.5. TGA-DSC Results

The TGA-DSC graphs of the REF residue are shown in Figure 6. The plot shows that mass loss occurs in five steps which agrees with the literature [46,47,48,49]. In this regard, the first two steps equate simply to crystalline water loss of the ammonium sulfate (Equation (5)) and ammonium jarosite (Equation (7)), respectively:
25–50 °C
(NH4)2SO4·H2O → (NH4)2SO4 + H2O
75–125 °C
(NH4)Fe3(SO4)2(OH)6·H2O → (NH4)Fe3(SO4)2(OH)6 + H2O
The third step corresponds to the decomposition of dehydrated ammonium sulfate to ammonium bisulfate:
140–210 °C
(NH4)2SO4 → NH4HSO4 + NH3
The fourth step is likely caused by complete thermal decomposition of the ammonium bisulfate:
220–250 °C
NH4HSO4 → 1/3NH3 + 1/3N2 + SO2 + 2H2O
Finally, the fifth step appears to be the dehydroxylation of the dehydrated ammonium jarosite, thereby accounting for the continued loss in weight as the temperature increased to 380 °C:
>260 °C
(NH4)Fe3(SO4)2(OH)6 → (NH4)(FeO)3(SO4)2 + 3H2O
If the temperature had been increased to 600 °C, three additional steps involving the sequential reactions of the dehydroxylated ammonium jarosite would be observed such that all of the Fe ultimately becomes hematite [46,47,48,49]:
>385 °C
2(NH4)(FeO)3(SO4)2 → 2NH3 + H2O + 2Fe3O2.5(SO4)2
>510 °C
2Fe3O2.5(SO4)2 → 2Fe2O3 + Fe2(SO4)3 + SO3
>540 °C
Fe2(SO4)3 → Fe2O3 + 3SO3
where Fe3O2.5(SO4)2 is essentially equivalent to a solid solution of 2/3 Fe2(SO4)3 and 5/6 Fe2O3.

4. Model Development and Process Optimization Using RSM

Table 2 shows the Design of Experiments (DOE) along with the condition variables and responses for Stage 3 processing. In all, 17 experiments were performed, each using 2 g of REE-rich dry precipitate from Stage 2. The following ranges of the condition variables were employed: deionized water volume was 10–30 mL; 2–4 g of NH4F·HF was added; the degree of stirring was 15–45 min. Responses were REE recovery and REF purity where recovery refers to the amount of REE from Stage 2 being converted to REF residue and purity refers to the quality of the REF residue based on ICP analysis.
Furthermore, five experiments were completed with all condition variables being at their midpoints. The results were analyzed to develop a statistically significant model for the responses of the REE recovery and REF purity as shown in Equations (13) and (14):
REE Recovery (%) = 50.14 − 3.87A + 0.087B + 0.84C − 2.70AB − 0.53AC + 2.68A2 + 4.15C2 + 4.04A2B + 1.41A2C
REF Purity (%) = 54.75 + 4.20A + 1.65B − 1.06C − 1.59AB + 4.37AC + 0.18 A2 − 1.40B2 − 2.08C2 − 1.17A2B + 2.89A2C
where A denotes the volume of deionized water used, B denotes the amount of NH4F·HF added, and C denotes the degree of stirring. In both cases, a cubic model represented the data best and the R2 values were 0.94 and 0.93 for recovery and purity, respectively.
Using Equations (13) and (14), 3-D surface plots in Figure 7 and Figure 8 were generated to illustrate the effects of the condition variables on the responses. From Figure 7a,b, it can be said that NH4F·HF addition appears to have more prominent effect on the process efficiency. The impact of deionized water addition is more prominent at higher stirring rates and higher NH4F·HF additions. With respect to stirring, it can be observed from Figure 7a that the amount of REF recovery increases with stirring time for both 10 and 30 mL of water used. However, recovery is higher for lower volumes of water than for higher ones, and this same pattern is observed with respect to NH4F·HF addition as illustrated in Figure 7b when using Equation (13).
Figure 8a,b were generated from Equation (14) and illustrates the response surfaces for REF purity in relations to the process variables. From these plots, it is observed that the amount of deionized water again did influence purity of REF recovery to a significant extent at all NH4F·HF additions and also at higher stirring degrees. The degree of stirring, as observed in Figure 8a, seems to affect the REF insignificantly at low water additions. However, REF purity increased sharply with stirring time at a high volume of water addition. Figure 8b shows that NH4F·HF addition has less impact on the purity of REF. Sharp increase in the purity of the REF is seen with increase in the volume of water.
It may also be noted that, in Equations (13) and (14), the process variables are all in terms of the coded values and differ in the range +1 to −1, with the mid-point having a value of zero. Thus, for B, the maximum amount of NH4F·HF used (4 g) corresponds to +1 and the lowest (2 g) corresponds to –1, whereas the midpoint of 3 g corresponds to 0. To use these statistically significant equations, the actual variable value needs to be converted to the coded form lying between +1 and −1. Using the above model equations optimization was carried out to find the conditions that maximized both REF recovery and REF purity. The identified conditions and their maximum corresponding responses are as follows:
Amount of Deionized Water Used: 30 mLREF Recovery: 56.23%
NH4F·HF Added: 4 g
Degree of Stirring: 45 minREF Purity: 62.42%

5. Conclusions

From this study, it is established REF can be produced from end-of-life Nd magnet from hard disk drive by hydrometallurgical techniques using NH4F·HF. The final product (REF) can also be used as part of the salt bath for molten salt electrolysis using fluoride salt [39]. This process is preferred over those reported in the literature because the use of hazardous HF was avoided. Employing statistical design of experiments (DOE), process parameters such as volume of deionized water, amount of NH4F·HF and degree of stirring were defined in detail, and a conducive process regime for the recovery of the REFs was identified. It was established that at higher volumes of water, NH4F·HF addition, and degree of stirring, optimum REF recovery with reasonably high purity can be achieved.

Author Contributions

Conceptualization, P.S., C.Y., and A.D.; methodology, P.S., T.F., and A.D.; software, P.S.; validation, P.S., A.D., and C.Y.; formal analysis, P.S., and T.F.; investigation, T.F.; resources, P.S.; data curation, P.S., and T.F.; writing—original draft preparation, P.S. and T.F.; writing—review and editing, P.S., A.D., and C.Y.; visualization, P.S., and T.F.; supervision, C.Y., and A.D..; project administration, C.Y.; funding acquisition, C.Y. All authors have read and agreed to the published version of the manuscript.

Funding

Research was sponsored by the Army Research Laboratory and was accomplished under Cooperative Agreement Number W911NF-15-2-0020.

Acknowledgments

The views and conclusions contained in this document are those of the authors and should not be interpreted as representing the official policies, either expressed or implied, of the Army Research Laboratory or the U.S. Government. The U.S. Government is authorized to reproduce and distribute reprints for Government purposes notwithstanding any copyright notation herein. The authors acknowledge Grant Wallace and Jan Chorney for their support.

Conflicts of Interest

The authors declare no conflict of interest.

References

  1. Yang, Y.; Walton, A.; Sheridan, R.; Güth, K.; Gauß, R.; Gutfleisch, O.; Buchert, M.; Binnemans, K. REE recovery from end-of-life NdFeB permanent magnet scrap: A critical review. J. Sustain. Metall. 2017, 3, 122–149. [Google Scholar] [CrossRef]
  2. Walters, A.; Lusty, P. Rare Earth Elements; British Geological Survey: Nottingham, UK, 2010. [Google Scholar]
  3. Ueberschaar, M.; Rotter, V.S. Enabling the recycling of rare earth elements through product design and trend analyses of hard disk drives. J. Mater. Cycles Waste Manag. 2015, 17, 266–281. [Google Scholar] [CrossRef]
  4. Önal, M.A.R.; Borra, C.R.; Guo, M.; Blanpain, B.; Van, G.T. Hydrometallurgical recycling of NdFeB magnets: Complete leaching, iron removal and electrolysis. J. Rare Earths 2017, 35, 574–584. [Google Scholar] [CrossRef]
  5. Rademaker, J.H.; Kleijn, R.; Yang, Y. Recycling as a strategy against rare earth element criticality: A systemic evaluation of the potential yield of NdFeB magnet recycling. Environ. Sci. Technol. 2013, 47, 10129–10136. [Google Scholar] [CrossRef]
  6. Zepf, V. Rare Earth Elements: A New Approach to the Nexus of Supply, Demand and Use: Exemplified along the Use of Neodymium in Permanent Magnets; Springer: Heidelberg, Germany, 2013. [Google Scholar]
  7. Goldman, A. Handbook of Modern Ferromagnetic Materials; Kluwer Academic Publishers: Dordrecht, The Netherlands, 1999; p. 649. [Google Scholar]
  8. Rotter, V.S.; Chancerel, P.; Ueberschaar, M. Recycling-oriented product characterization for electric and electronic equipment as a tool to enable recycling of critical metals. In Rewas; Springer: Berlin, Germany, 2013. [Google Scholar]
  9. Nguyen, R.T.; Diaz, L.A.; Imholte, D.D.; Lister, T.E. Economic assessment for recycling critical metals from hard disk drives using a comprehensive recovery process. JOM 2017, 69, 1546–1552. [Google Scholar] [CrossRef]
  10. Meyer, L.; Bras, B. Rare earth metal recycling, sustainable systems and technology. In Proceedings of the IEEE International Symposium, Dana Point, CA, USA, 16–18 May 2011. [Google Scholar]
  11. Tanaka, M.; Oki, T.; Koyama, K.; Narita, H.; Oishi, T. Recycling of rare earths from scrap. In Handbook on the Physics and Chemistry of Rare Earths; Bunzli, J.C.G., Pecharsky, V.K., Eds.; Elsevier: Amsterdam, The Netherlands, 2013; Volume 43, pp. 159–211. [Google Scholar]
  12. Anderson, C.D.; Anderson, C.G.; Taylor, P.R. A survey of recycled rare earths metallurgical processing. In Proceedings of the 51st Annual Conference of Metallurgists of CIM, Niagara Falls, ON, Canada, 30 Septembere–3 October 2012; pp. 411–422. [Google Scholar]
  13. Graedel, T.E.; Allwood, J.; Birat, J.P.; Reck, B.K.; Sibley, S.F.; Sonnemann, G.; Buchert, M.; Hagelüken, C. Recycling Rates of Metals—A Status Report; United Nations Environment Programme: Nairobi, Kenya, 2011. [Google Scholar]
  14. Reck, B.K.; Graedel, T.E. Challenges in metal recycling. Science 2012, 337, 690–695. [Google Scholar] [CrossRef]
  15. Eggert, R.; Wadia, C.; Anderson, C.; Bauer, D.; Fields, F.; Meinert, L.; Taylor, P. Rare earths: Market disruption, innovation, and global supply chains. Annu. Rev. Environ. Resour. 2016, 41, 199–222. [Google Scholar] [CrossRef]
  16. Goonan, T.G. Rare Earth Elements—End Use and Recyclability; US Geological Survey: Reston, VA, USA, 2011.
  17. Lyman, J.W.; Palmer, G.R. Recycling of Neodymium Iron Boron Magnet Scrap; University of Michigan Library: Ann Arbor, MI, USA, 1993. [Google Scholar]
  18. Weber, R.J.; Reisman, D.J. Rare Earth Elements: A Review of Production, Processing, Recycling, and Associated Environmental Issues; US EPA Region: Washington, DC, USA, 2012.
  19. Majzlan, J.; Stevens, R.; Boerio-Goates, J.; Woodfield, B.F.; Navrotsky, A.; Burns, P.C.; Crawford, M.K.; Amos, T.G. Thermodynamic properties, low-temperature heat-capacity anomalies, and single-crystal X-ray refinement of hydronium jarosite,(H3O)Fe3(SO4)2(OH)6. Phys. Chem. Miner. 2004, 31, 518–531. [Google Scholar] [CrossRef]
  20. Alonso, M.; López-Delgado, A.; López, F.A. A kinetic study of the thermal decomposition of ammoniojarosite. J. Mater. Sci. 1998, 33, 5821–5825. [Google Scholar] [CrossRef]
  21. Dutrizac, J.E. Converting jarosite residues into compact hematite products. JOM 1990, 42, 36–39. [Google Scholar] [CrossRef]
  22. Thakur, N.V.; Jayawant, D.V.; Iyer, N.S.; Koppiker, K.S. Separation of neodymium from lighter rare earths using alkyl phosphonic acid, PC 88A. Hydrometallurgy 1993, 34, 99–108. [Google Scholar] [CrossRef]
  23. Preston, J.S. The Recovery of Rare Earth Oxides from A Phosphoric Acid Byproduct. Part 4. The Preparation of Magnet-Grade Neodymium Oxide from The Light Rare Earth Fraction; Mintek: Randburg, South Africa, 1996. [Google Scholar]
  24. Lu, D.; Horng, J.S.; Hoh, Y.C. The separation of neodymium by quaternary amine from didymium nitrate solution. J. Less Common Met. 1989, 149, 219–224. [Google Scholar] [CrossRef]
  25. Morais, C.A.; Ciminelli, V.S.T. Process development for the recovery of high-grade lanthanum by solvent extraction. Hydrometallurgy 2004, 73, 237–244. [Google Scholar] [CrossRef]
  26. Radhika, S.; Nagaphani, K.B.; Lakshmi, K.M.; Ramachandra, R.B. Solvent extraction and separation of rare earths from phosphoric acid solutions with TOPS 99. Hydrometallurgy 2001, 110, 50–55. [Google Scholar] [CrossRef]
  27. Panda, N.; Devi, N.; Mishra, S. Solvent extraction of neodymium (III) from acidic nitrate medium using Cyanex 921 in kerosene. J. Rare Earths 2012, 30, 794–797. [Google Scholar] [CrossRef]
  28. El-Hefny, N.E. Kinetics and mechanism of extraction and stripping of neodymium using a Lewis cell. Chem. Eng. Process. Process. Intensif. 2007, 46, 623–629. [Google Scholar] [CrossRef]
  29. Lee, M.-S.; Lee, J.-Y.; Kim, J.-S.; Lee, G.-S. Solvent extraction of neodymium ions from hydrochloric acid solution using PC88A and saponified PC88A. Sep. Purif. Technol. 2006, 46, 72. [Google Scholar] [CrossRef]
  30. Banda, R.; Jeon, H.; Lee, M. Solvent extraction separation of Pr and Nd from chloride solution containing La using Cyanex 272 and its mixture with other extractants. Sep. Purif. Technol. 2012, 98, 481–487. [Google Scholar] [CrossRef]
  31. Guo, C.; Zhi, Y. Effective solvent extraction of La, Ce and Pr from hydrochloric acid with a novel extractant N, N-dihexyloxamic acid. J. Chem. Technol. Biotechnol. 2016, 92, 1596–1600. [Google Scholar] [CrossRef]
  32. Chen, J.; Guo, L.; Deng, Y.; Li, D. Application of [A336][P507]/[P204] on High Selective Extraction and Separation of Rare Earths (III) from Mechanism to Techniques. In Proceedings of the 52nd Conference of Metallurgists (COM), Montreal, QC, Canada, 27–31 October 2013; pp. 367–374. [Google Scholar]
  33. Rout, A.; Kotlarska, J.; Dehaen, W.; Binnemans, K. Liquid–liquid extraction of neodymium(iii) by dialkylphosphate ionic liquids from acidic medium: The importance of the ionic liquid cation. Electronic supplementary information (ESI) available: NMR spectra of the ionic liquids. Phys. Chem. Chem. Phys. 2013, 15, 16533–16541. [Google Scholar] [CrossRef] [Green Version]
  34. Esmaeil, J.; Malek, S. The production of rare earth elements group via tributyl phosphate extraction and precipitation stripping using oxalic acid. Arab. J. Chem. 2016, 9, S1532–S1539. [Google Scholar]
  35. Belova, V.V.; Voshkin, A.A.; Kholkin, A.I.; Payrtman, A.K. Solvent extraction of some lanthanides from chloride and nitrate solutions by binary extractants. Hydrometallurgy 2009, 97, 198–203. [Google Scholar] [CrossRef]
  36. London, I.M.; Goode, J.R.; Moldoveanu, G.; Rayat, M.S. Rare Earth Elements Symposium. In Proceedings of the 52nd Conference of Metallurgists (COM), Montreal, QC, Canada, 27–31 October 2013. [Google Scholar]
  37. Yan, C.; Liao, C.; Jia, J.; Wang, M.; Li, B. Comparison of economical and technical indices on rare earth separation processes of bastnasite by solvent extraction. J. Rare Earths 1999, 17, 58–63. [Google Scholar]
  38. Krishnamurthy, N.; Gupta, C.K. Extractive Metallurgy of Rare Earths; CRC Press: Boca Raton, FL, USA, 2015; p. 869. [Google Scholar]
  39. Sarfo, P. Recovery of Rare Eearth Elements by Advanced Processing Technologies. Ph.D. Thesis, Montana Tech, Butte, MT, USA, October 2019. [Google Scholar]
  40. Sarfo, P.; Wyss, G.; Ma, G.; Das, A.; Young, C. Carbothermal reduction of copper smelter slag for recycling into pig iron and glass. Miner. Eng. 2017, 107, 8–19. [Google Scholar] [CrossRef]
  41. Sarfo, P.; Das, A.; Wyss, G.; Young, C. Recovery of metal values from copper slag and reuse of residual secondary slag. Waste Manag. 2017, 70, 272–281. [Google Scholar] [CrossRef]
  42. Box, G.E.P.; Behnken, D.W. Some new three level designs for the study of quantitative variables. Technometrics 1960, 2, 455–475. [Google Scholar] [CrossRef]
  43. Bezerra, M.A.; Santelli, R.E.; Oliveira, E.P.; Villar, L.S.; Escaleira, L.A. Response surface methodology (RSM) as a tool for optimization in analytical chemistry. Talanta 2008, 76, 965–977. [Google Scholar] [CrossRef]
  44. Stat-Ease, Inc. Stat-Ease® DOE Software. 2003. Available online: https://www.hearne.software/Resources/Design-Ease/softoverview.aspx (accessed on 10 October 2018).
  45. Ingemarsson, L.; Halvarsson, M. Sem/edx Analysis of Boron; High Temperature Corrosion Centre-Chalmer University of Technology: Gothenburg, Sweden, 2011. [Google Scholar]
  46. Das, G.K.; Anand, S.; Acharya, S.; Das, R.P. Preparation and decomposition of ammoniojarosite at elevated temperatures in H2O–(NH4)2SO4–H2SO4 media. Hydrometallurgy 1995, 38, 263–276. [Google Scholar] [CrossRef]
  47. Frost, R.L.; Wills, R.-A.; Kloprogge, J.T.; Martens, W. Thermal decomposition of ammonium jarosite (NH4)Fe3(SO4)2(OH)6. J. Therm. Anal. Calorim. 2006, 84, 489–496. [Google Scholar] [CrossRef] [Green Version]
  48. Kunda, W.; Veltman, H. Decomposition of jarosite. Metall. Trans. B 1979, 10, 439–446. [Google Scholar] [CrossRef]
  49. Spratt, H.; Rintoul, L.; Avdeev, M.; Martens, W. The thermal decomposition of hydronium jarosite and ammoniojarosite. J. Therm. Anal. Calorim. 2014, 15, 101–109. [Google Scholar] [CrossRef] [Green Version]
Figure 1. Flow sheet of Nd magnet recycling to produce REF.
Minerals 10 00340 g001
Figure 2. Cumulative particle size distribution of the demagnetized and comminuted sample.
Minerals 10 00340 g002
Figure 3. SEM image and EDX composition of the demagnetized and comminuted sample (see text for details). (a) Ni; (b) Pr, Nd, Fe; (c) Nd, Fe.
Minerals 10 00340 g003
Figure 4. Crystal phases in the REE rich precipitate after adding NH4OH.
Minerals 10 00340 g004
Figure 5. Crystal phases in the REF filtrate after 45 min in NH4F·HF and heated to 400 °C.
Minerals 10 00340 g005
Figure 6. TGA-DSC curve for REF residue from Stage 3.
Minerals 10 00340 g006
Figure 7. 3D plots of REF recovery with respect to process variables at (a) 4 g of NH4F·HF and (b) 43 min for degree of stirring.
Minerals 10 00340 g007
Figure 8. 3D plots of REF purity with respect to process variables at (a) 4 g of NH4F·HF and (b) 44 min for degree of stirring.
Minerals 10 00340 g008
Table 1. The chemical composition of the final product.
Sample CompositionDyFeNdPrOthers
Weight (%)2.891.2252.957.4135.53
Table 2. DOE conditions and their responses.
StandardRunVolume of Deionized Water (mL)Amount of NH4·HF (g)Degree of Stirring (mins)REE Recovery (%)Purity of REF Residue (%)
213023046.7660.59
823034555.5863.26
1032041553.1554.01
741034563.0346.12
453043049.6358.38
1762033047.1656.93
371043064.0949.66
181023050.4445.52
1292044555.4151.84
16102033049.6753.08
5111031557.4851.19
11122024554.6548.59
15132033050.0954.94
14142033052.7451.39
6153031552.1350.85
9162021553.5650.65
13172033051.3857.42

