Article

Effects of Sand/Fly Ash and the Water/Solid Ratio on the Mechanical Properties of Engineered Geopolymer Composite and Mix Design Optimization

1
Department of Civil and Environmental Engineering, University Technology Petronas, Seri Iskandar 32610, Malaysia
2
Department of Civil Engineering, NFC Institute of Engineering and Technology Multan, Multan 60000, Pakistan
*
Authors to whom correspondence should be addressed.
Minerals 2020, 10(4), 333; https://doi.org/10.3390/min10040333
Submission received: 11 March 2020 / Revised: 5 April 2020 / Accepted: 7 April 2020 / Published: 8 April 2020
(This article belongs to the Special Issue Geopolymers, Volume II)

Abstract

:
This paper presents the results of an experimental study that investigated the effects of two parameters: sand/fly ash (S/FA) ratio and water to geopolymer-solid (W/GS) ratio on the engineered geopolymer composite. The trial mix designs were optimized using the response surface method. These parameters influence the properties of the fresh and hardened geopolymer matrix, such as slump flow, compressive strength, flexural strength, elastic modulus, flexural toughness, ductility index and drying shrinkage. The optimizing process was conducted by developing statistical models using the response surface methodology (RSM) technique. The developed models were statistically validated and could be used to determine the desired response of engineered geopolymer composite (EGC) with a significance level of more than 95%. In this study, the optimized values of the S/FA ratio and W/GS ratio were obtained as 0.341701 and 0.225184, respectively. To validate the optimized S/FA ratio and W/GS ratio, an experimental study was performed, and a difference of less than 5% was found between predicted and experimental results.

1. Introduction

The growing demand for ordinary portland cement (OPC) due to the extensive use of concrete by the global construction industry has created many concerns regarding sustainability and the environment. Currently, concrete is the world’s most extensive consumable material after water. In contrast, cement production contributes approximately 10% to the global CO2 emissions and consumes about 15% of the total industrial energy produced, which is causing a significant burden on environmental and sustainability measures [1]. In the last few years, researchers have been making efforts to develop sustainable and environmentally-friendly solutions for producing an extensive amount of concrete for the global construction industry. In such efforts, geopolymer binders are being investigated as an innovative as well as a green alternative to traditional concrete [2]. Geopolymer binders are formed when a precursor (a powder which contains a high content of alumina and silica) interacts with an alkaline solution in the presence of heat; then, the system undergoes a chain reaction [3]. Many types of industrial byproducts, which have faced criticism regarding their safe disposal, are being used as a precursor to geopolymer binders [4]. Among the various types of industrial byproducts, fly ash is the most commonly used precursor, which is a readily available byproduct produced in coal-fired power plants. Fly ash is usually an amorphous powder that is rich in alumina and silica content, which can meet the requirements of sustainability and a green environment [5]. Many existing research studies have reported that the fly-ash-based geopolymer concrete has shown superior mechanical properties, high durability, and refined microstructures as compared to traditional cement concrete [6].
The superior compressive strength achievements of geopolymer binders create an opportunity for their application in the construction industry [7]. However, the brittleness, low tensile strength, small ultimate strain, and susceptibility to cracking of geopolymer binders are considered significant weaknesses which hinder their application in complex construction products [8]. In an effort to overcome the reported weaknesses, short and randomly oriented fibers were mixed in the matrix as an intrinsic reinforcement [9]. The short fibers in the cementing matrix can bridge the cracks, which restricts the crack propagation by enhancing the tensile strength, ductility index, and post-crack performance [10]. Many studies focused on the development of fiber-reinforced concrete (FRC) have used a different type of microfibers, such as steel [11], glass [12], basalt [13] and polyvinyl alcohol (PVA) [14]. All such types of fibers have shown various advantages and disadvantages as an intrinsic reinforcement cement matrix. For example, steel fibers (SF) improve the tensile strength and freeze–thaw resistance of concrete [15]. However, concerns around durability [16], cost and effects on workability [17] have been identified as the disadvantages of steel fibers. Research findings have shown that glass fibers were not stable in the alkaline environment [18]. Basalt fibers as an intrinsic reinforcement caused a softening behavior after the first crack appeared [19]. Based on various research studies, it has been found that PVA fibers are the most favorable type of fibers for achieving a high performance of FRC because of their stability in the alkaline environment, possessing high tensile strength, and because they have a significant value of elastic modulus compared to other types of fibers [20]. In some studies, researchers observed an enhancement in the mechanical properties and post-crack performance of concrete using PVA fibers [21,22].
It has been observed that in a conventional fiber reinforced concrete (FRC), the load-carrying capacity decreases after the initiation of the first crack [23]. However, advancements made in the field of FRC have resulted in the development of an engineered cementitious composite (ECC) [23]. This is classified as a high-performance FRC which is capable of achieving multiple cracking patterns with an increase in the applied load after the first crack appears [24]. Multiple cracking patterns indicate high ductility, energy absorption capacity, crack growth resistance, and toughness of ECC under flexural and tensile stresses [25]. A range of achievements in the mechanical and post-crack properties of ECC, such as compressive strength (20–95 MPa), flexural strength (10–30 MPa), and ultimate strain (1%–8%), make it a promising material for retrofitting and structural repair jobs [26].
So far, many efforts have been dedicated to improving the mechanical properties of conventional fiber-reinforced geopolymer concrete (FRGC) exhibiting softening behavior. The authors of [27] improved the flexural strength of geopolymer by adding micro steel fibers, while the authors of [28] enhanced compressive strength using basalt fiber in geopolymer. The authors of [29] observed improvements in split tensile strength and flexural strengths by adding glass fibers in geopolymer concrete. However, there is not much research work reported in the literature regarding the development of high-performance fiber-reinforced geopolymer concrete or known as engineered geopolymer composite (EGC). The mechanical and post-crack properties of EGC are considered similar, as discussed in the literature for engineered cementitious composites (ECC) [30].
Similar to that of ECC, the performance of EGC depends on multiple factors, such as slump flow of fresh mixture, compressive and flexural strength requirements, elastic modulus, flexural toughness, ductility index and drying shrinkage [30], therefore, it is a challenging task for a concrete expert to develop an appropriate mix design for achieving an optimized performance of EGC. The optimization is referred to as a systematic way of improving the reliability of the products. The Taguchi method [31], Plackett–Burman [32] and RSM [33] are reported as the most commonly-used optimization techniques. However, RSM is considered an advanced technique for systematically designing experiments, obtaining statistically significant models, and achieving optimum conditions for several desirable responses simultaneously [34,35]. The RSM technique is a widely accepted modeling and optimizing tool in the concrete industry for achieving the highest responses by acquiring an optimized mixture composition. Ghafari et al. (2014) [36] developed RSM-based statistical models for predicting the influence of hybrid fibers on the performance of self-compacting and ultra-high performance concrete. Similarly, another research reported the optimized effects of fiber volume fraction in steel fiber-reinforced concrete for achieving maximum ductility [37]. In contrast, Al-Alaily (2016) [38] applied the RSM technique to optimize the chloride permeability and mechanical properties of metakaolin-based concrete. The available literature shows that the RSM technique is successfully applied for the optimization of OPC-based concrete mixes. However, limited literature is available on its application in the field of geopolymer technology. An experimental study discussed the optimized mixture components of a lightweight geopolymer composite by minimizing the curing temperature, binder content, and curing time for achieving maximum compressive strength [39]. The EGC properties are primarily influenced by several parameters, such as NaOH molarity, Na2SiO3/NaOH ratio, curing temperature, sand to fly ash ratio, and water to geopolymer solids ratio; therefore, it is essential to determine the optimum level of dosages of the mix ingredients for achieving the most desired performance of the matrix [30].
In a previous experimental program, Zahid et al. (2018) [20] applied RSM to optimize the effect of the primary polymeric variables (NaOH molarity, Na2SiO3/NaOH and curing temperature) to maximize the mechanical and post-crack performance of EGC. For a further improvement in achieving the optimum mix design of EGC, the principal aim of this study was to apply the RSM technique to optimize the effects of the sand/fly ash ratio and water/geopolymer-solid ratio on the EGC properties. The effects were investigated on the slump flow, compressive strength, flexural strength, flexural toughness, ductility index, elastic modulus, and drying shrinkage. In the final phase, an experimental program was designed for validating the optimum parameters as determined from the RSM application.

Research Significance

Conventional concrete made of Portland cement is facing much criticism due to it using a massive amount of natural resources and contributing to a substantial amount in global greenhouse gas (GHG) emissions. Therefore, for the last few years, concrete researchers have been working on alternative solutions that should be environmentally friendly and sustainable. In such efforts, geopolymer binders are becoming a favorite research topic. However, there are many concerns and issues to be resolved before they take a significant share in concrete application. This paper is significant in that it is focused on the optimization of engineered geopolymer mixture design for achieving the desired structural responses.

2. Experimental Program

2.1. Material Properties

For this experimental program, fly ash (FA) was obtained from the Manjung coal-fired power station located in Perak, Malaysia [40]. The supplied fly ash was tested to verify the specified characteristics; the morphological study was performed using a field emission scanning electron microscope (FESEM). Figure 1a shows that the provided fly ash complied with the specified morphology. Table 1 shows the elemental composition and surface area of FA samples as obtained using the X-ray fluorescence (XRF) and Brunauer Emmet Taller (BET) techniques. Based on the characterization test results, the supplied fly ash is classified as high-calcium as per ASTM 618-10 (CaO > 10%; SiO2 + Al2O3 + Fe2O3 > 70%). Table 2 shows the gradation of microsilica sand that was supplied by a local supplier in the state of Perak, Malaysia. Previous research suggested that the sodium-based alkaline solution performs better in achieving compressive strength, flexural strength, and deflective capacity of EGC [41]; 99% pure sodium hydroxide (NaOH) in combination with water glass, also called sodium silicate (Na2SiO3), was used for the synthesis of EGC. Its chemical characteristics are given in Table 3. The Kurary group, Japan, provided polyvinyl alcohol (PVA) fibers; their mechanical and physical properties are given in Table 4, and the FESEM image is shown in Figure 1b.

2.2. Response Surface Method (RSM) Application for Experiment Design

The trial and error method has conventionally been practiced to find out the influence on the responses by changing the value of one variable at a time. This process is time-consuming, especially for multivariable systems. Therefore, it is needed to utilize a robust technique for solving multiobjective optimization problems. The response surface method (RSM) is a robust approach for optimizing complex problems through the development of statistical interaction between factors (independent variables) and responses (dependent variables). The process of optimization through RSM is initiated with the systematic designing of experiments and through the collections of responses by performing experimental programs. Finally, statistical models are developed for the prediction of each response, and optimization is performed for the desired targets [36]. The most practically adopted method for experimental design, statistical modeling, and optimization is the central composite design (CCD) of RSM [42]. The process of selection of data points through CCD using RSM is illustrated in Figure 2. The experiments are designed so that the space of independent variables must include corner points (+1 and −1), a center point, and extreme points ( + α and α ) [43]. Quadratic models that are used to estimate each response are developed using the 2nd-degree polynomial Equation (1) [36].
y = β o +   β i X i +   β i i X i 2 +   β i j X i X j
where the predicted response (slump flow, compressive strength, flexural strength, elastic modulus, flexural toughness, and ductility index of EGC) is represented by “ y ”.
Moreover, β o , β i , β i i , and β i j are the constant coefficient, linear coefficient, the quadratic coefficient, and interaction coefficient, respectively. Furthermore, the independent variables in Equation (1) are denoted by X i and X j . Table 5 shows the defined independent variables (factors) and their corresponding code and levels.
An experimental program was designed using commercially available Design-Expert® software version 10 (Table 6). The ranges of sand to fly ash and water to geopolymer solids were selected as 0 to 0.8 and 0.22 to 0.26, respectively, while other factors such as NaOH molarity, Na2SiO3/NaOH, and curing temperature were kept constant at 8 M and 2.5 and 60 °C, respectively [30].

2.3. Mixing and Casting of Samples

To optimize the water to geopolymer solid (W/GS) ratio and the sand to fly ash ratio (S/FA), nine EGC mixes, as shown in Table 6, were prepared. A total of 320 g of NaOH pellets were dissolved in the tap water for making one litter of 8 M NaOH solution. Since it is an exothermic reaction, the NaOH solution was placed in the laboratory until it cooled down. To achieve a homogeneous paste, mixing activity was done for a total of five minutes using the Hobart mixture. In the beginning, fly ash and sand samples were dry-mixed for thirty seconds in slow mode, then the alkaline solution was gradually added. After adding the alkaline solution, the PVA fibers were mixed in the mixture and the mixing operation was carried out for four minutes in the fast mode. After completing the mixing process, the matrix was poured into the standard molds (e.g., 50 mm cubes for compressive strength test) and left in the molds until the samples hardened. Upon hardening, the samples were demolded and wrapped in three folds of thin plastic wrap to avoid excessive loss of water during heat curing. All samples were placed in an oven at 60 °C for 24 h. After completion of the curing time, samples were placed in the lab at a constant temperature of 23 °C. Testing was carried out on the 28th day of the casting.

2.4. Experimental and Test Procedures

The workability of the fresh EGC mix was evaluated via a flow table test complying with the requirements of ASTM C1437 [44]. A truncated cone (70 × 100 × 60 mm) was placed in the middle of the flow table, subsequently filled with EGC paste and lifted to allow the paste to flow. After removing the cone, the paste was subjected to 25 jerks in 15 s using mechanical rising and dropping of the flow table. The slump flow is expressed as a percentage change in the flow diameter of the paste and the original base diameter. The same procedure was used to assess the workability of ECC mixes [45].
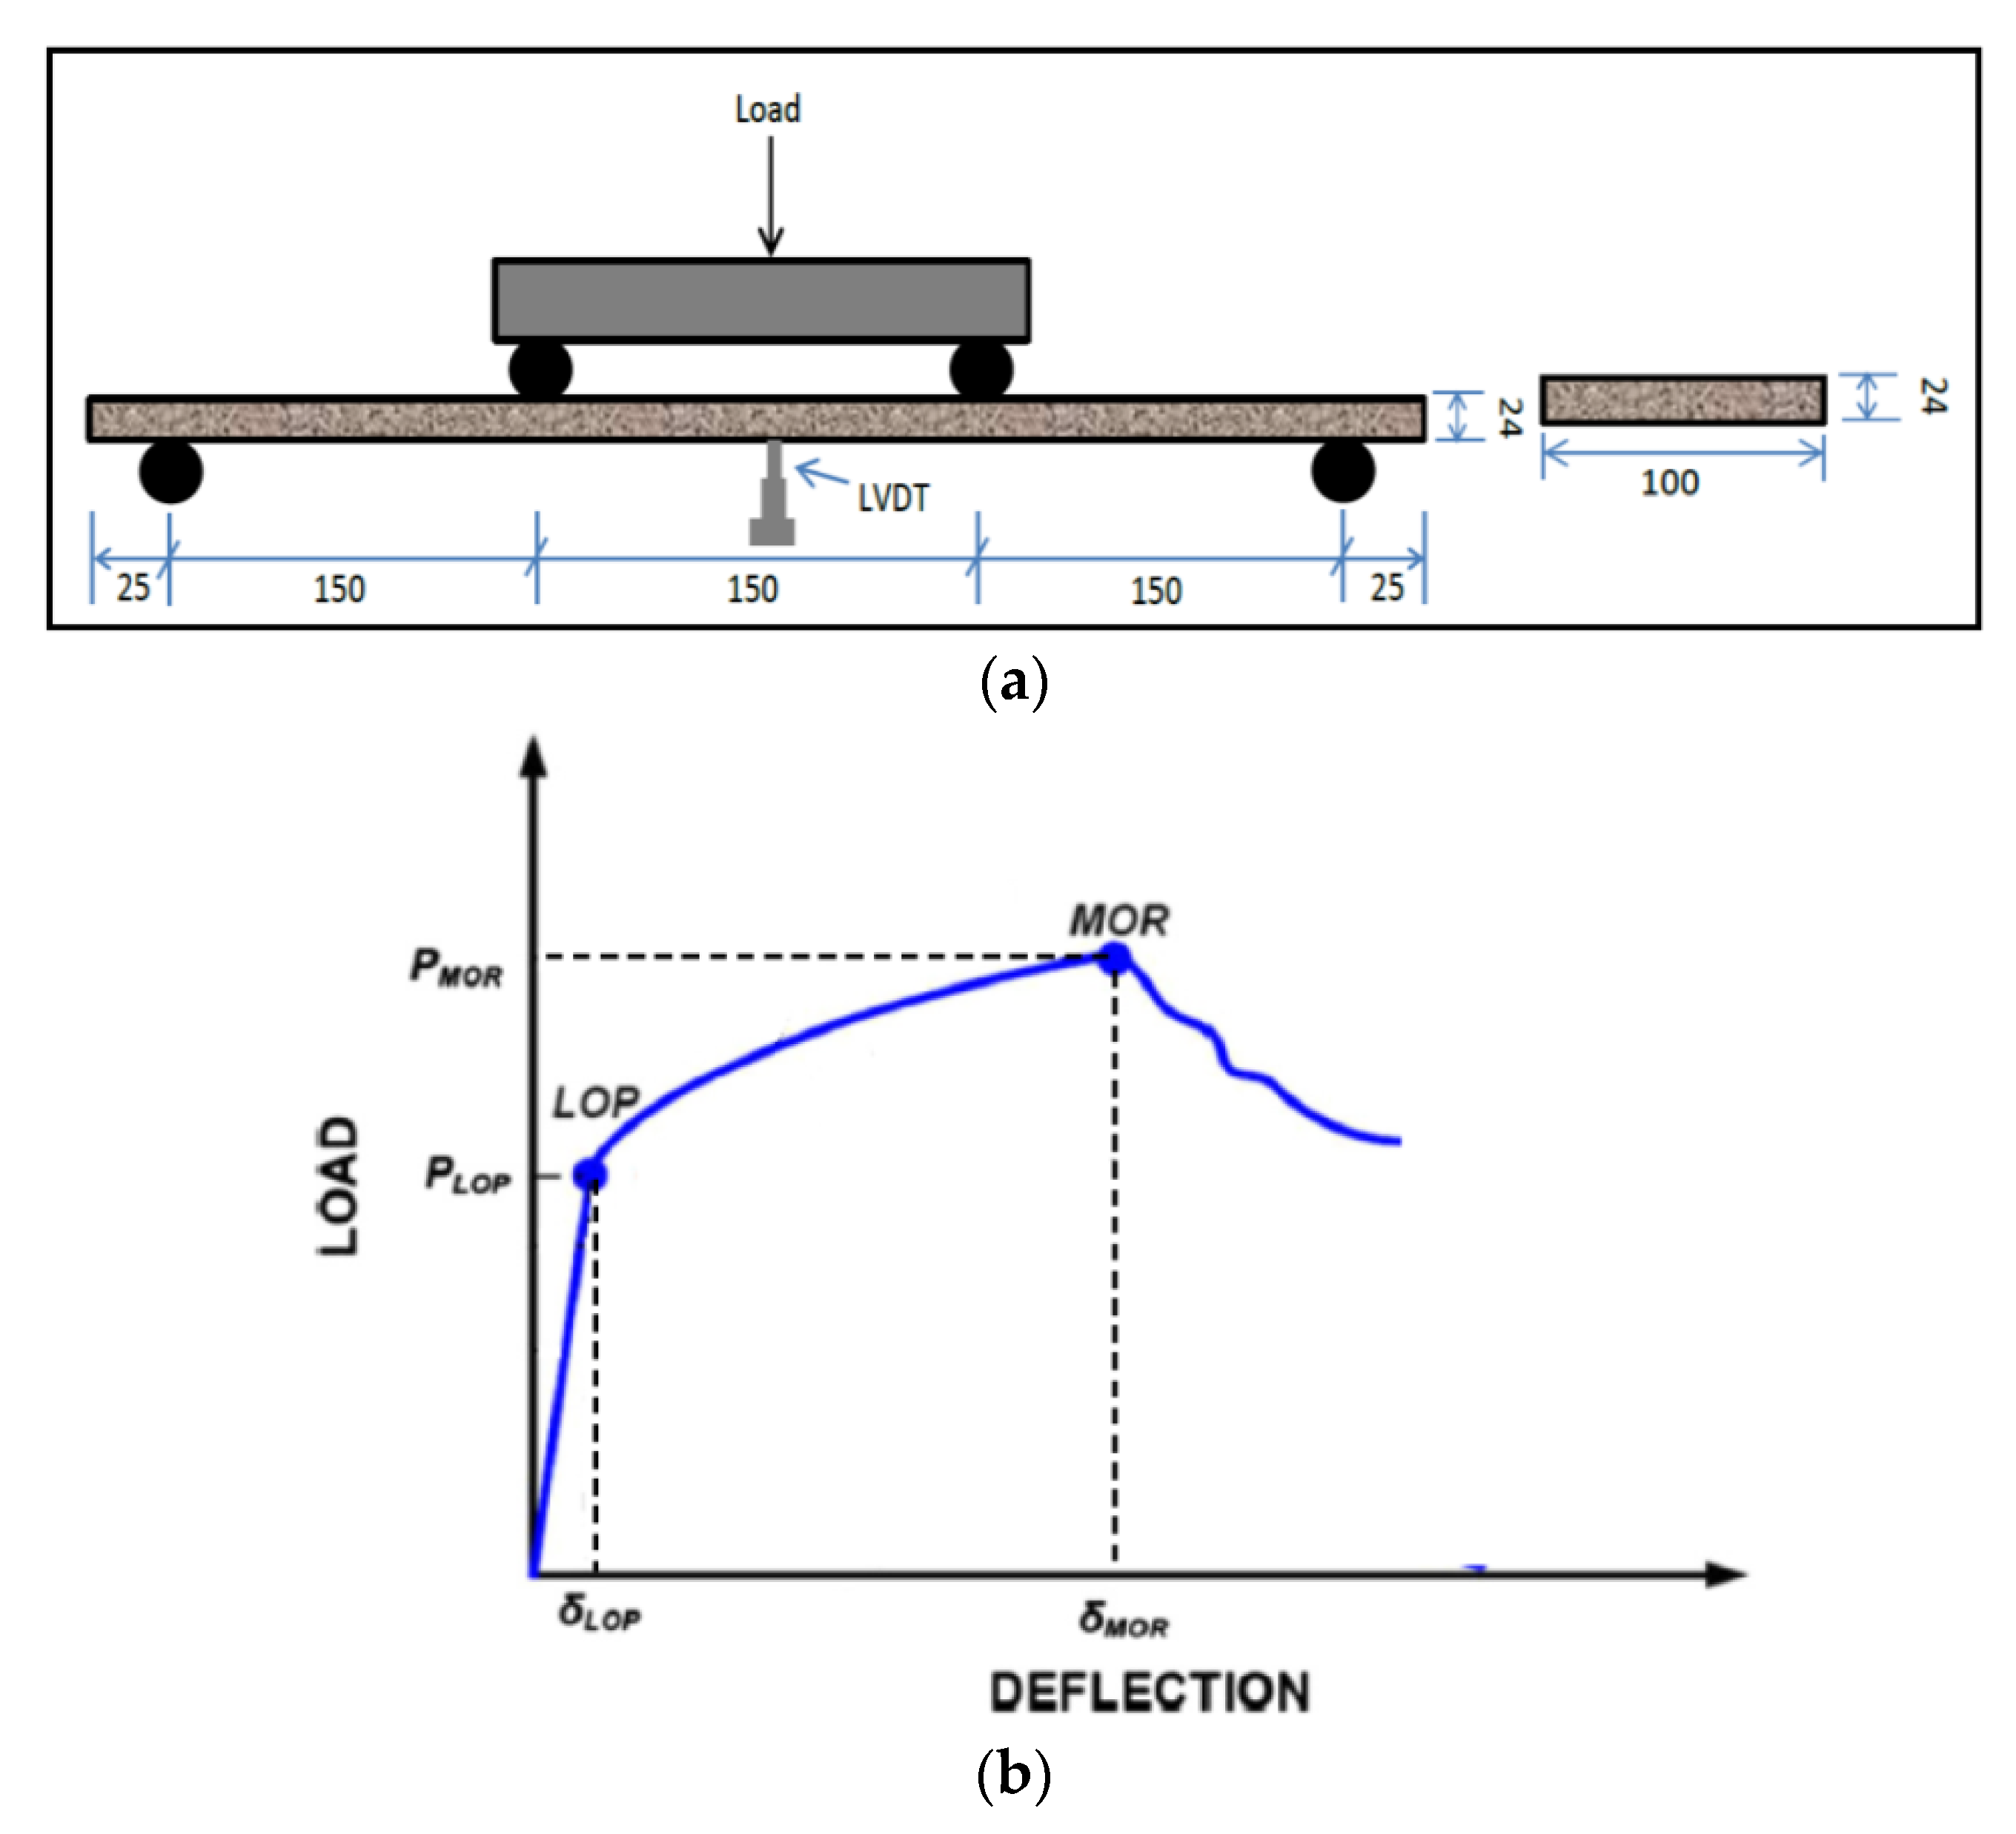
A total of three samples from all mix designs were tested against each property. A compressive strength test was performed applying the ASTM C109 standard test procedure. The samples were subjected to a gradually applied load; the load was increased at a rate of 3.0 kN/s until complete failure. An elastic modulus test was carried out on cylindrical samples (150 × 300 mm) as per the requirements given in ASTM C 469-14. Flexural strength, flexural toughness, and ductility index were estimated by conducting a three-point loading test on the prismatic samples; the experimental arrangement and sample details are given in Figure 3a, while Figure 3b shows the typical load–deflection curve of a ductile material. The load was applied under deflection control mode; the deflection was increased at a rate of 0.15 mm/s using a universal testing machine (UTM) with a 100 kN capacity. A linear variable differential transformer (LVDT) was attached to the sample for measuring the midspan deflection. Flexural strength is the ability of a material to resist bending failure and is evaluated according to the procedure described in ASTM C1609 [46]. Flexural toughness is calculated by estimating the area under the load–deflection curve (Figure 3b), according to ASTM C1609, [46]. The ductility index is the measure of the ductility of a given material. It is defined as the ratio between deflection at peak load to the deflection at which the first crack appears on the surface of the sample. The ductility index was calculated according to the procedure proposed by Nematollahi et al. (2014) [38], using Equation (2):
Ductility   index   =   δ M O R δ L O P
where δ M O R and δ L O P represent deflection at peak load and deflection at the first crack (Figure 3b). The drying shrinkage test was performed according to the procedure given in ASTM C157-17.

3. Results and Discussion

The experimental test results for the EGC properties (slump flow, compressive strength, elastic modulus, flexural strength, flexural toughness, ductility index, and drying shrinkage) of all mixtures are given in Table 7. The obtained results were analyzed for the effect of sand to fly ash (S/FA) and water to geopolymer (W/GP) solids on each EGC property using Design-Expert® software by developing three-dimensional response surface diagrams, contour diagrams, and statistical models as given in subsections. Finally, model validation and optimization of S/FA and W/GS were performed.

3.1. Effect of S/FA and W/GP Solids on the Slump-Flow (Workability) of EGC

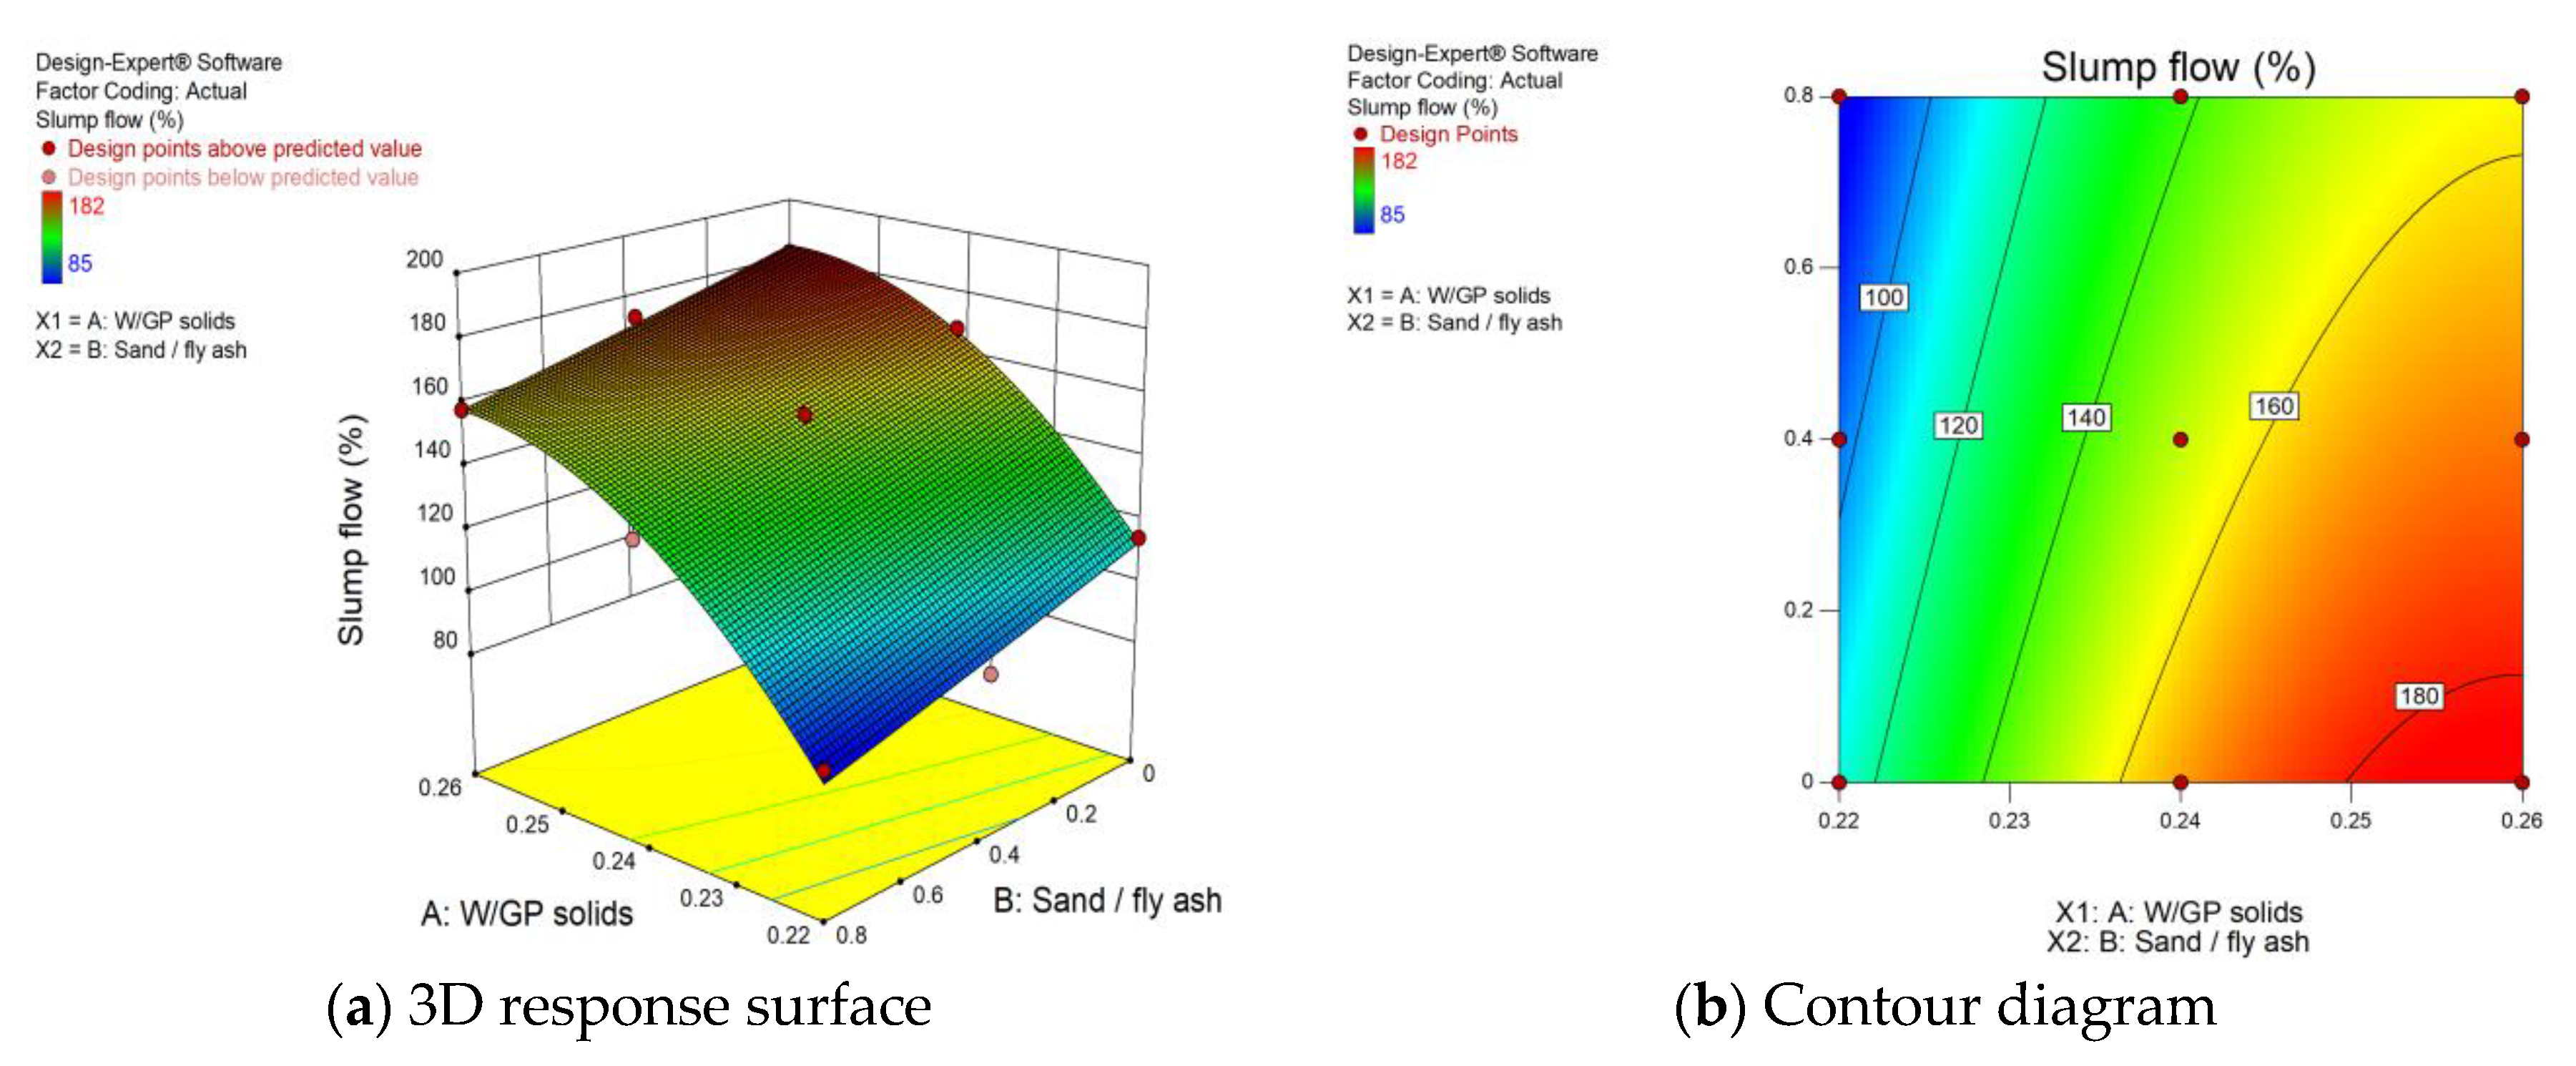
Workability is a measure of how easy or difficult it is for a mixture to place and handle, usually expressed as the slump flow. The effect of W/GP solids and S/FA on the slump flow of EGC is illustrated with the help of a 3D response surface diagram, while the intervals of compressive strength are shown in the contour diagram as given in Figure 4. A gradual increase in composite flow was observed with the increment in W/GP solids. However, a contrary behavior was observed for S/FA which might have been because higher water content tends to reduce the internal particle friction. The spherical particle shape of the fly ash also induces the roller effect and encourages the flow of the composite. In this study, a maximum slump flow of 182% was observed when EGC synthesizes with W/GP solids and S/FA of 0.26, 0, respectively.
Furthermore, the lowest level of slump flow (85%) was observed in W/GP solids of 0.22 and S/FA of 0.8. Intervals of composite flow are given in the contour diagram, which can be used to predict the values of W/GP solids and S/FA for the desired value of composite flow. Second-order models developed by the RSM technique can be accurately utilized for the prediction and optimization of responses over first-order models [47]. In a study, Mohammed et al. (2012) [48] developed a second-order RSM model for concrete with paper mill residuals. They concluded that the developed model could accurately predict the slump flow of the concrete for two variable systems, i.e., water to cement ratio and the residual content of the paper mill. Therefore, the second-order RSM model representing slump flow was developed to correlate between W/GP solids and S/FA (Equation (3)):
Slump   flow   ( % ) = 2928 + 23995.8 x 1 76.25 x 2 + 156.25   x 1   x 2 46250 x 1 2 + 3.125 x 2 2
where x 1 and x 2 represents W/GP solids and S/FA, respectively.

3.2. Effect of W/GP Solids and S/FA on the Compressive Strength of EGC

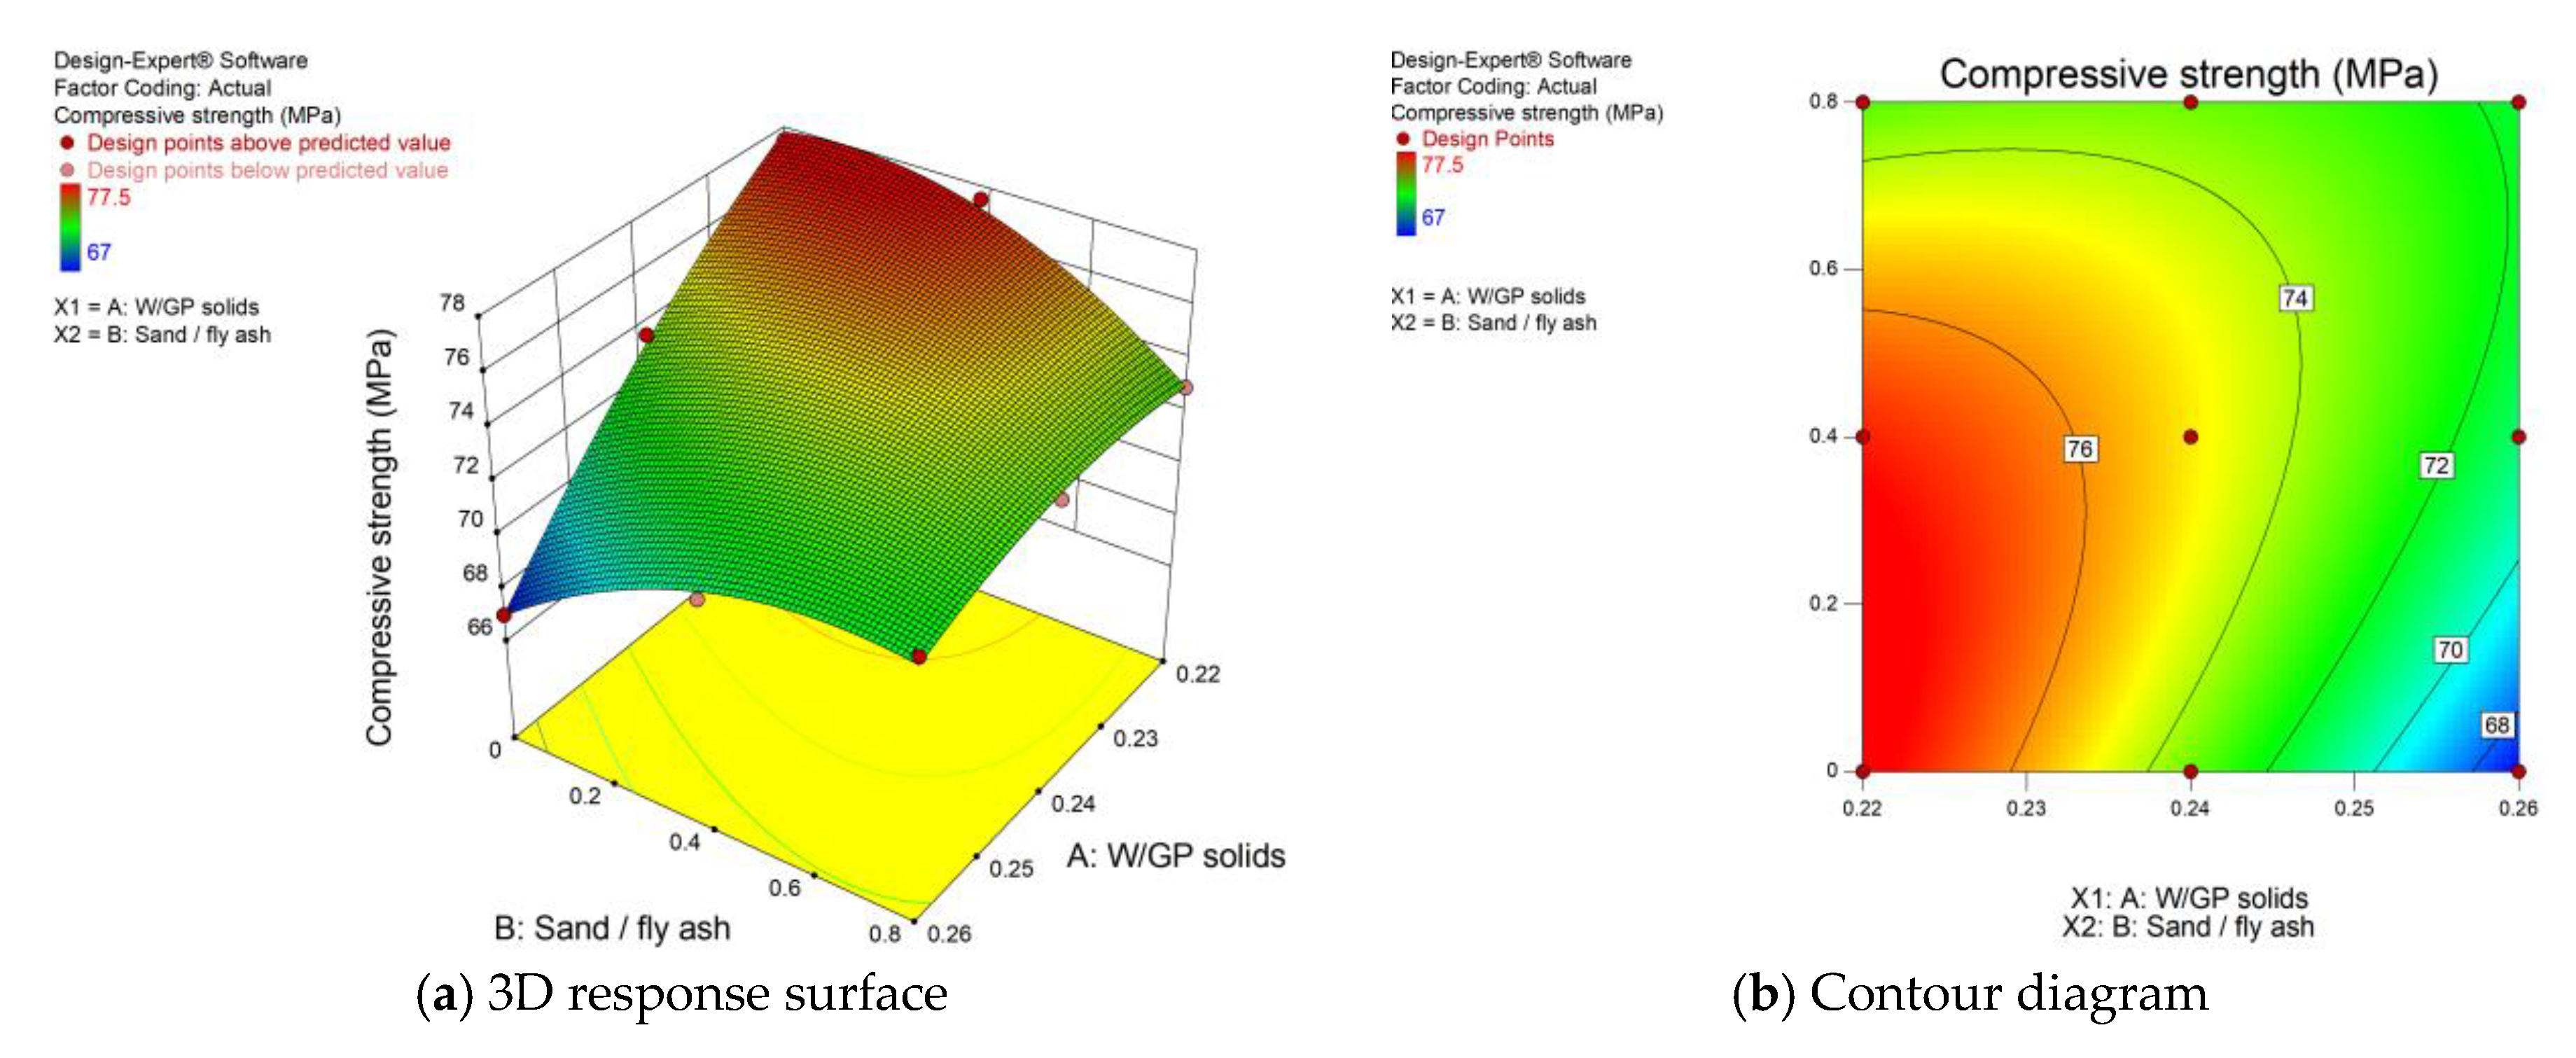
Compressive strength is a primary mechanical property because it provides useful information for the structural design of the concrete members. From the 3D response surface diagram (Figure 5), the gradual improvement in compressive strength was observed with the reduction in W/GP solids from 0.26 to 0.244. This could have happened due to the low porosity obtained using a smaller water content in the mix [49]. In another study, Chung et al. (2017) [50] observed a similar behavior of compressive strength at a lower water to binder ratio in ECC. However, further reduction in W/GP solids (e.g., 0.22) was responsible for the sudden drop in workability, leaving macropores in EGC, and therefore, the compressive strength was abruptly decreased for the said scenario.
Additionally, an increase in S/FA caused improvements in compressive strength; a similar trend is mentioned in the available EGC literature [30]. Moreover, the optimum level of compressive strength (77.5 MPa) was observed in W/GP solids and S/FA ash of 0.22 and 0.4, respectively. Another study reported the optimized effect of fly ash and metakaolin in the concrete mixture using the RSM technique [51]. They concluded that ANOVA models developed by RSM could be accurately utilized to predict the compressive strength of concrete; therefore, in this study, the prediction model for compressive strength of EGC is developed and given in Equation (4):
Compressive   strength   ( MPa ) = + 8.60000 + 809.58333 x 1 62.54167 x 2 + 296.87500   x 1     x 2 2250.00000 x 1 2 10.93750 x 2 2
where x 1 and x 2 represent W/GP solids and S/FA, respectively.

3.3. Effect of W/GP Solids and Sand/fly Ash on the Modulus of Elasticity of EGC

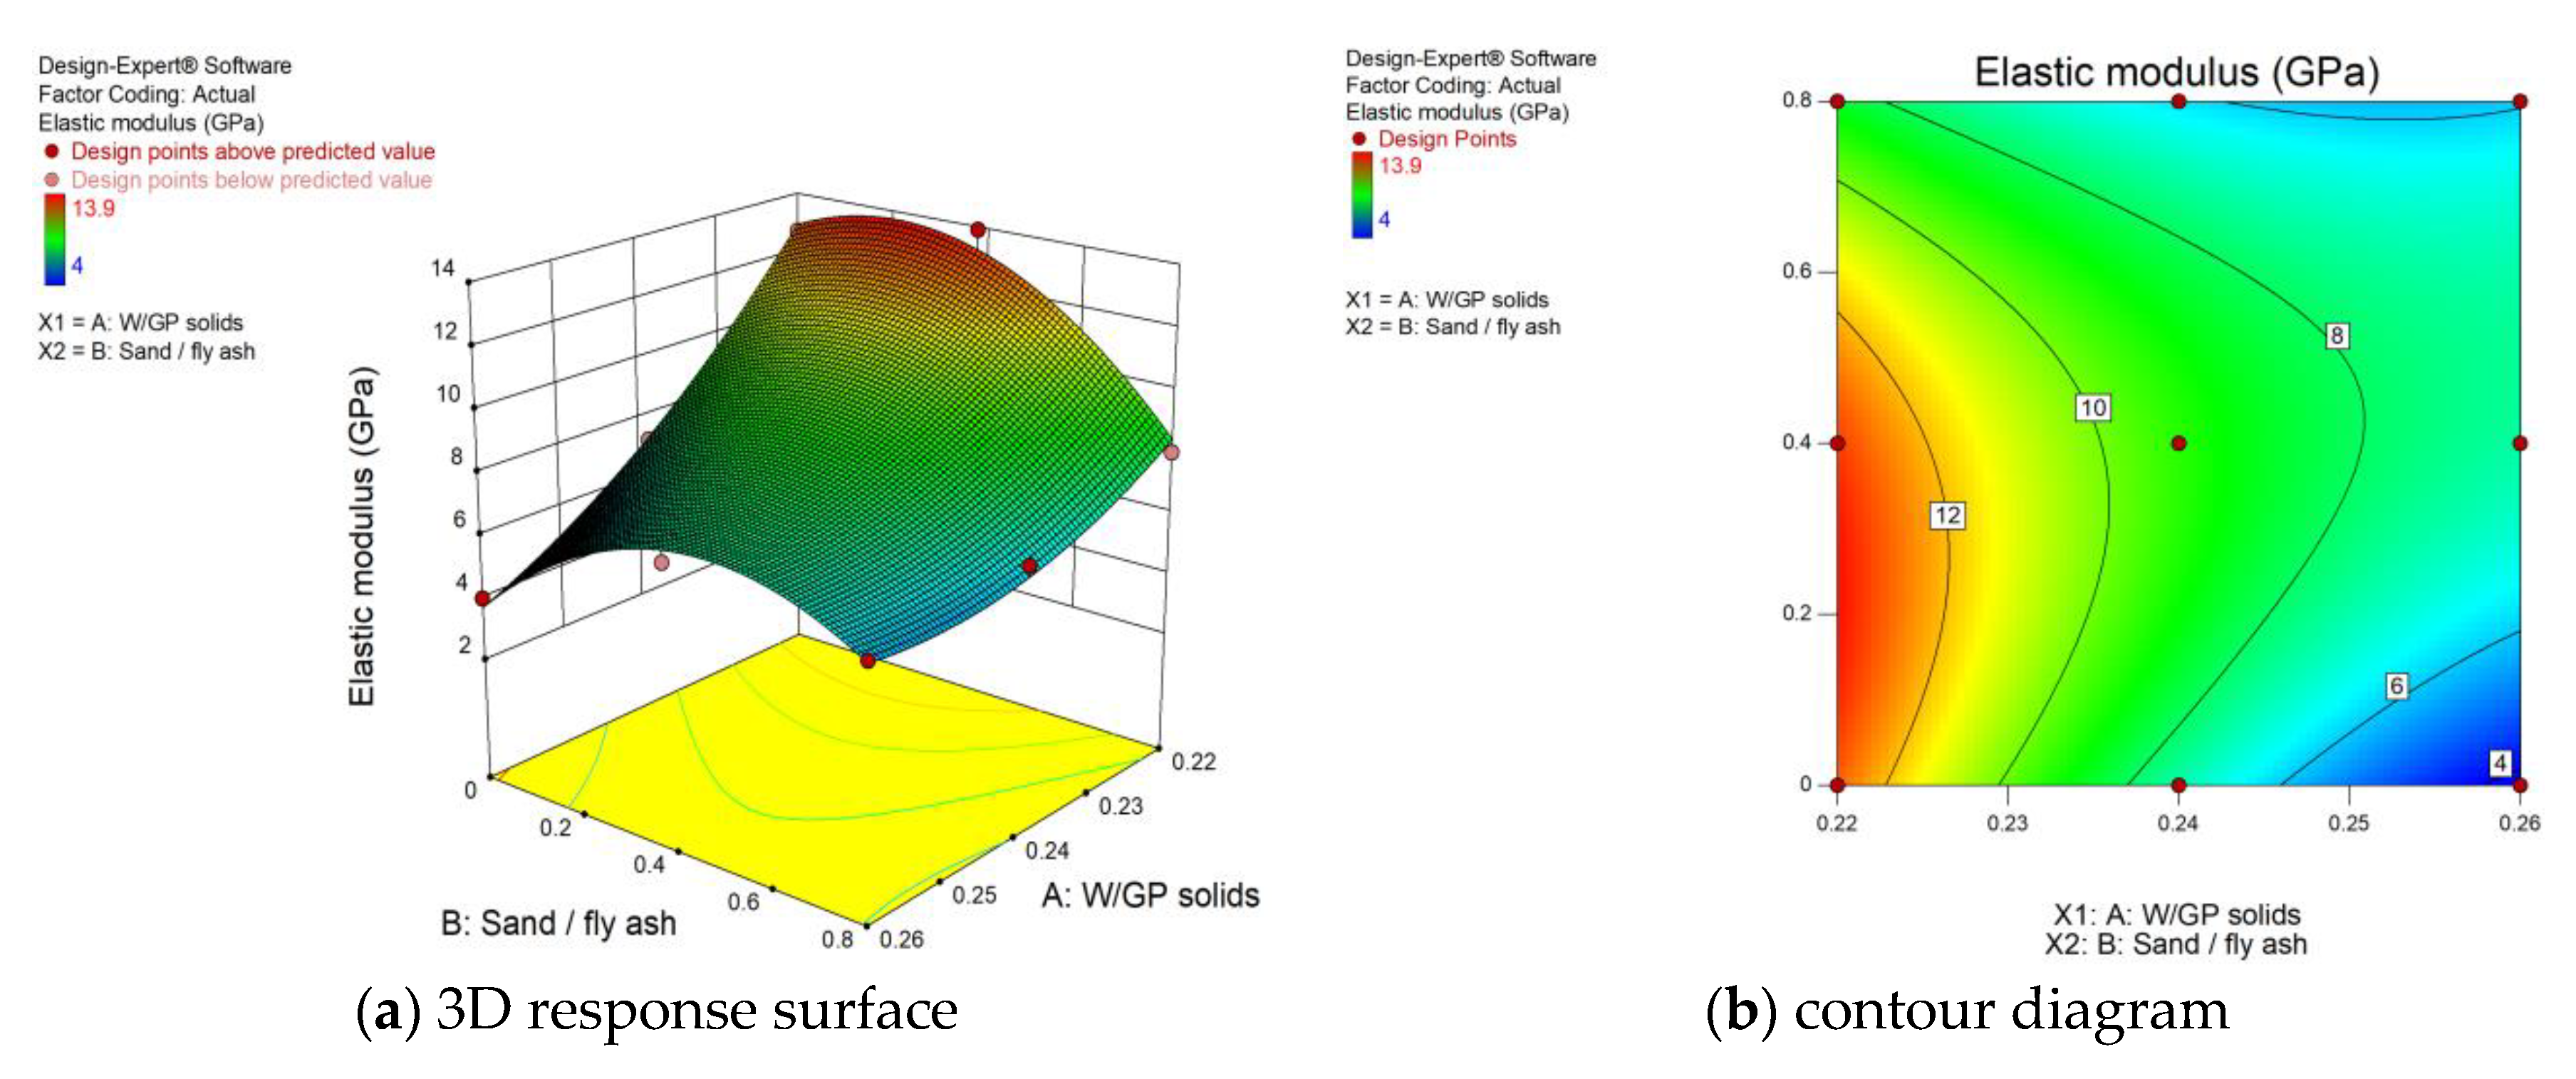
The modulus of elasticity is an important mechanical property that describes the tendency of a material to deform elastically [52]. Figure 6 depicts the response surface and the contour for elastic modulus versus W/GP solids and S/FA. A reduction in composite elastic modulus was observed with the increment in W/GP solids; this was also reported in the literature [30]. Furthermore, the increase in S/FA tends to improve the composite elastic modulus; a similar trend with the addition of sand content was observed in conventional ECC [53]. Similarly, another research study presented an RSM prediction model for the elastic modulus of rubbercrete having crumb rubber content and water to cement ratio (W/C) as two variables of the system [54]. However, the elastic modulus of EGC can be predicted using Equation (5):
Elastic   modulus   ( GPa ) = + 211.37778 1470.41667 x 1 38.83333   x 2 + 209.3750   x 1   x 2 + 2583.3333   x 1 2 16.04167 x 2 2
where x 1 and x 2 represents W/GP solids and S/FA, respectively.

3.4. Flexural Properties

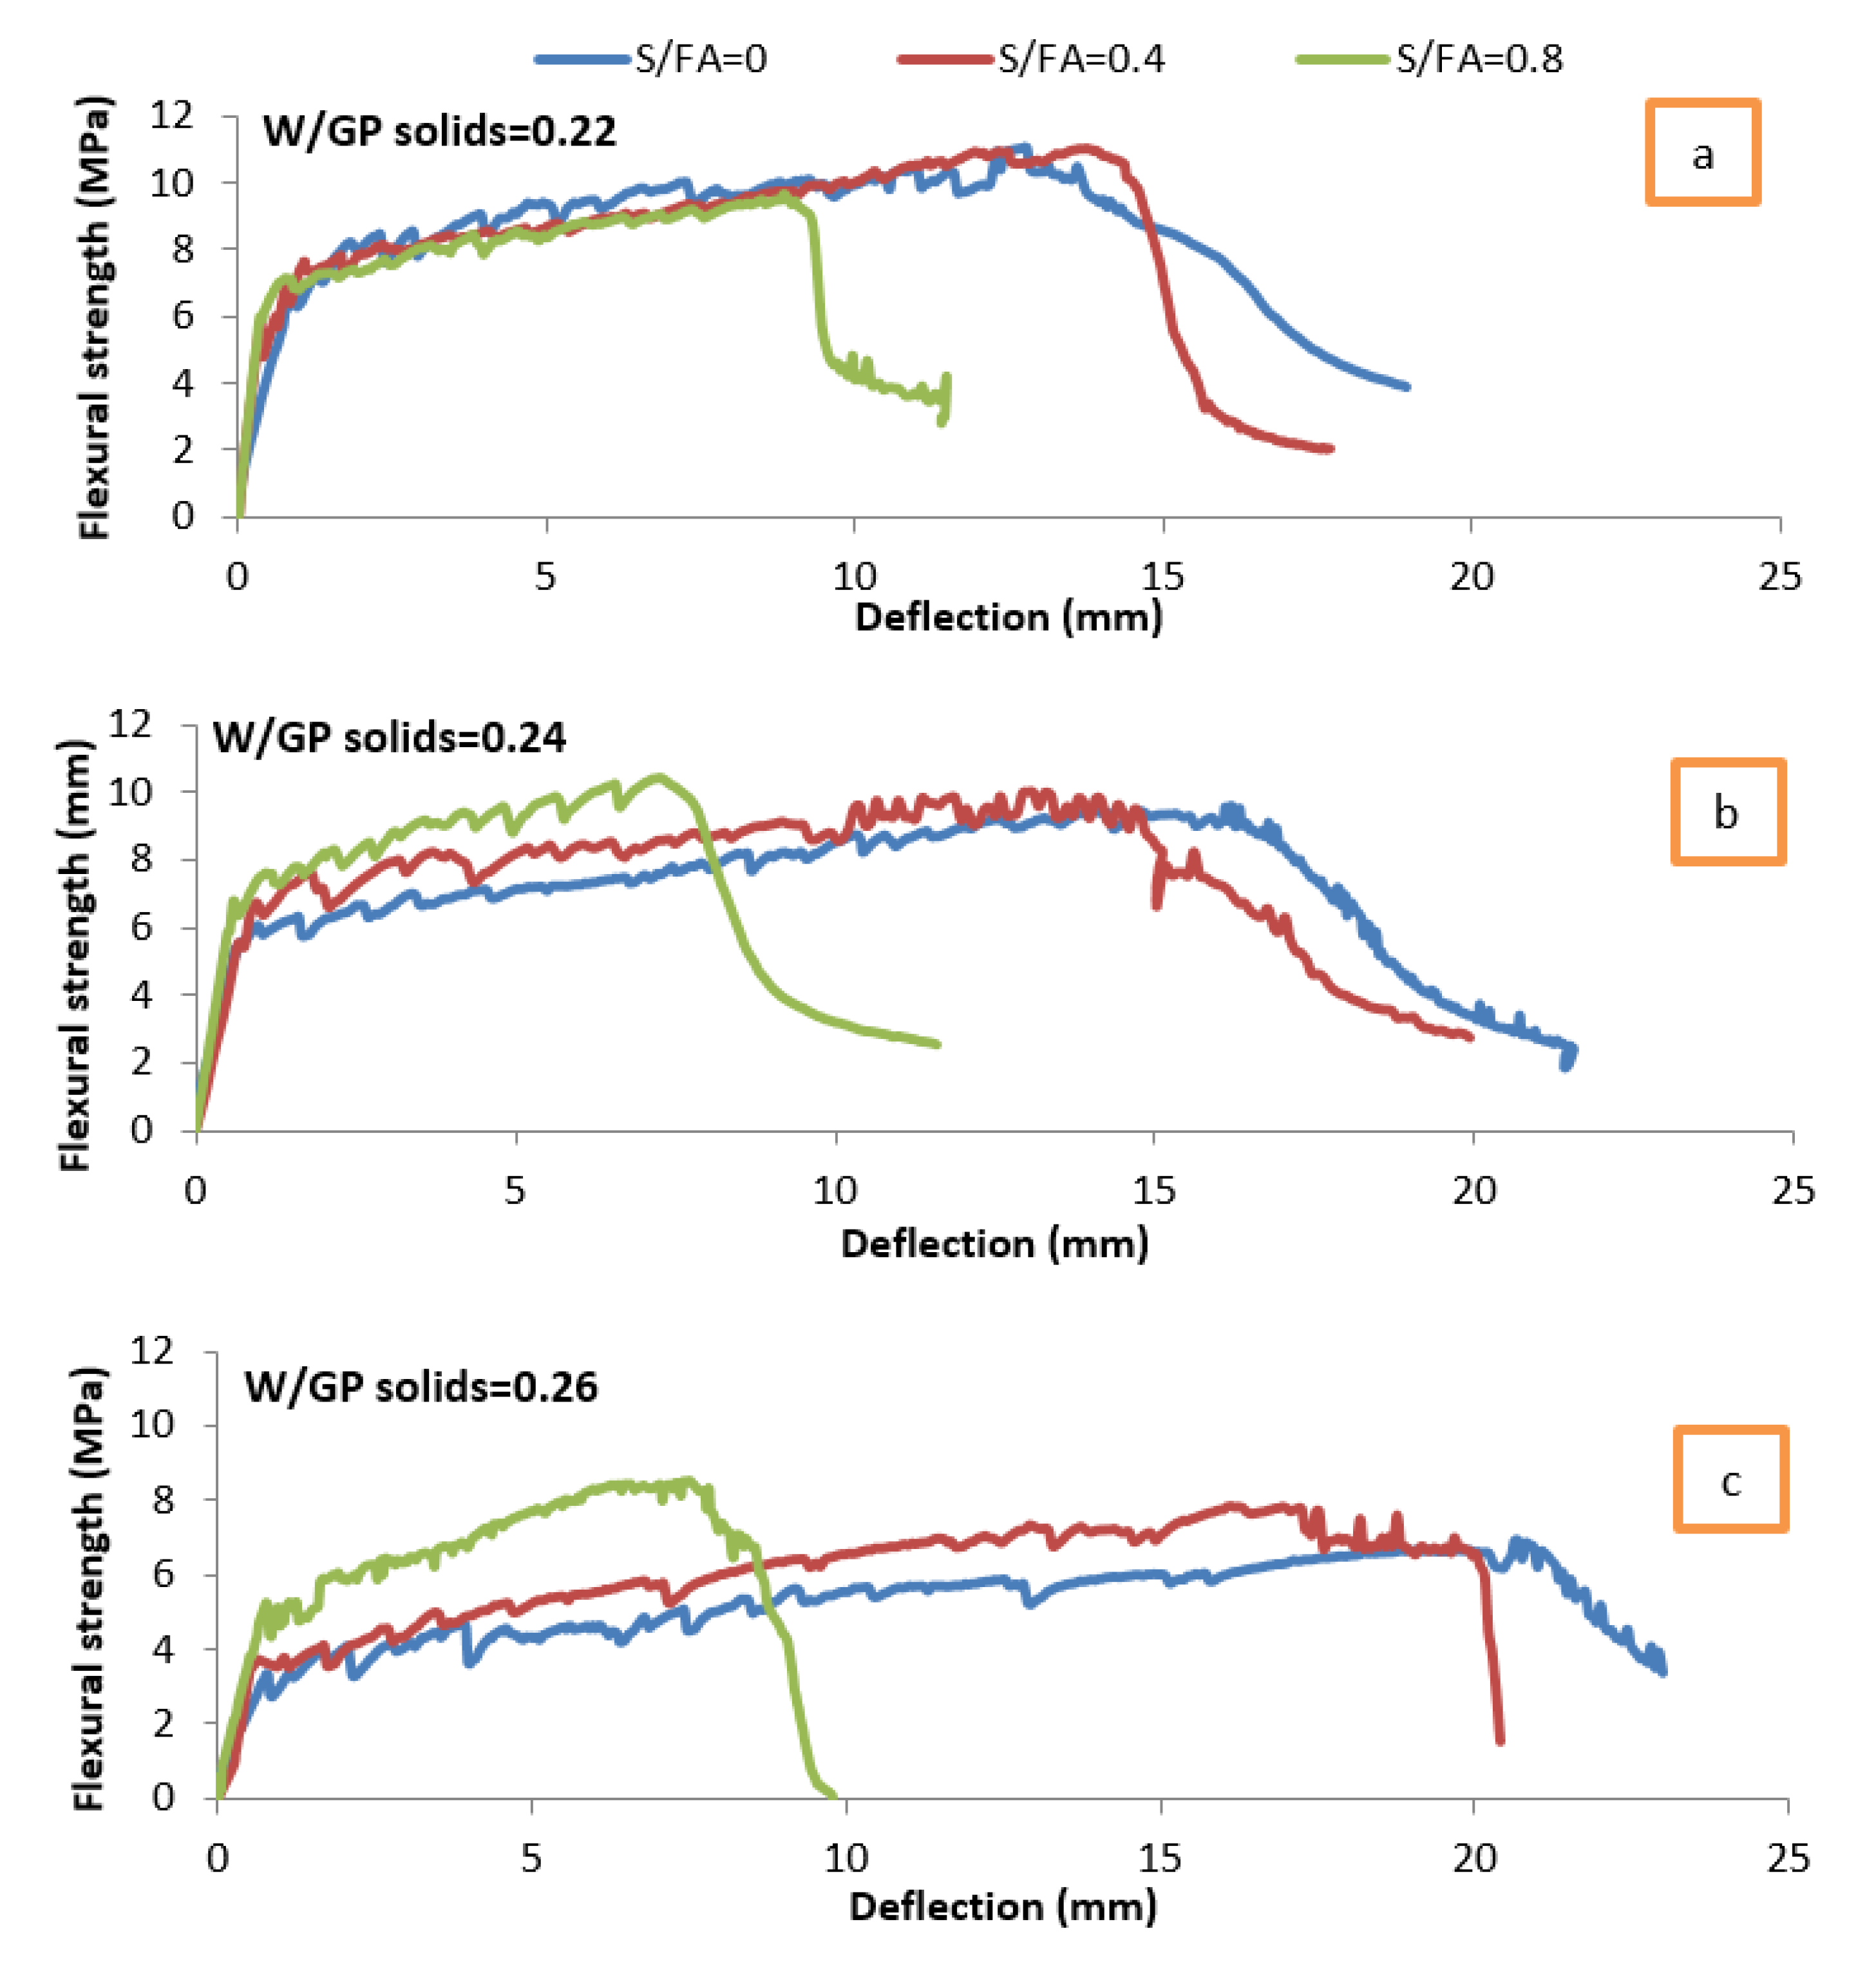
It is a well-understood fact that the flexural performance of the conventional ECC member reflects its tensile ductility; additionally, there is a good correlation between tensile strain capacity and flexural deflection capacity [55,56]. Hence, it is essential to understand the flexural characteristics of EGC for the evaluation of its performance. The deflection-hardening property is a result of the unique interaction between the fiber and EGC matrix. Furthermore, during the application of load, a crack is initiated from the defected or weak part of the beam sample. The fiber-bridging phenomenon resists the opening of this initial crack. Hence, the load is distributed to the nearest weak area of the crack, which results in another crack formation. The whole process ends with the formation of multiple microcracks at the moment zone of the beam sample, which allow it to undergo a plastic deformation with a deflection-hardening behavior [55]. As matrix-related parameters influence flexural properties, subsections focus on the effect of W/GP solids and S/FA on the flexural properties of EGC. Flexural strength versus midspan deflection curves for all mix designs is given in Figure 7. All the mixes have exhibited deflection-hardening behavior.

3.4.1. Effect of W/GP Solids and S/FA on Flexural Strength of EGC

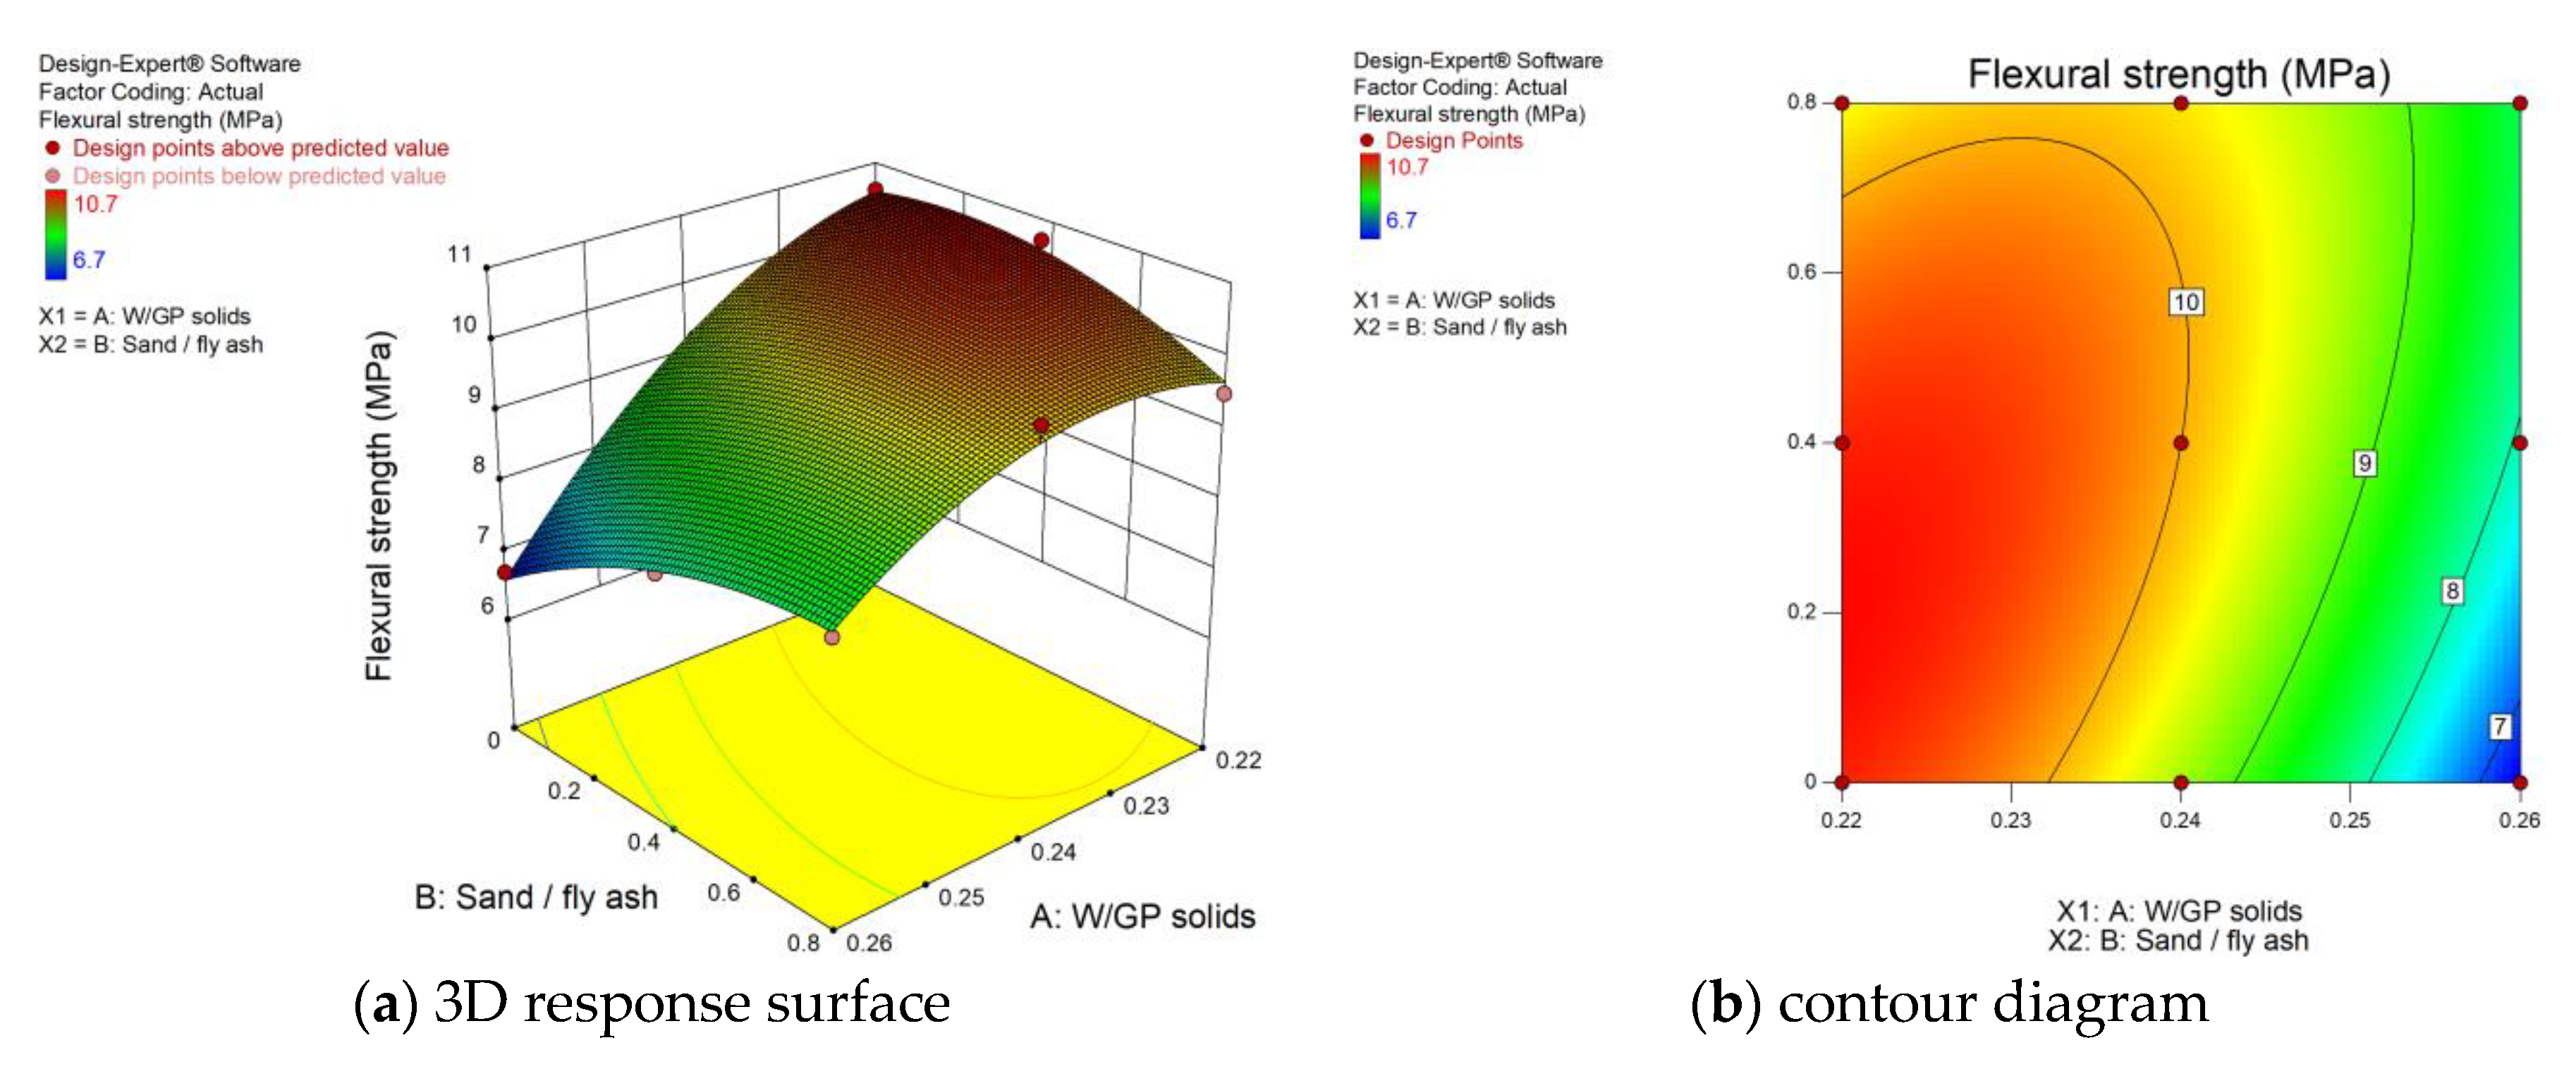
Fibre–matrix interaction strongly influenced the flexural strength of fiber-reinforced composites [54]. It has been observed in previous research that increase in water content is responsible for weak fiber–matrix interaction [21]. Hence, a reduction in flexural strength was noticed with the rise in W/GP solids (Figure 8). This finding is based on the behavior observed for the water to binder ratio of ECC [57].
Furthermore, contrary to the effect of W/GP solids, improvement in flexural strength was observed with the increment in S/FA. The same behavior of sand dosage on ultimate strength properties was observed in previous studies of fiber-reinforced geopolymer concrete [30]. However, flexural strength can be predicted using the statistical model (Equation (6)) given below.
Flexural   Strength   ( MPa ) = 74.76667 + 800.41667 x 1 17.45833 x 2 + 84.3750 x 1 x 2 1875 x 1 2 2.8125 x 2 2
where x 1 and x 2 represent W/GP solids and S/FA, respectively.

3.4.2. Effect of W/GP Solids and S/FA on Flexural Toughness of EGC

Flexural toughness (FT) is an indication of energy absorption capacity to be studied for the evaluation of the structural performance of EGC under hazardous dynamic loading conditions, such as earthquakes or blast. Therefore, flexural toughness provides useful information for the structural designs of such applications. As given in Figure 9, improvement in FT was observed with the initial increment in S/FA; however, a further increase in S/FA resulted in lower FT. This could have happened because of an alteration in the fiber–matrix bond at different S/FA levels. Previous studies have revealed the same findings for the sand to binder ratio of ECC [58].
Furthermore, the increase in the water to binder ratio caused a weak fiber–matrix interfacial transition zone [59] and loosened the frictional bond strength [60]. Therefore, FT was reduced with an increment in the W/GS ratio. Additionally, the optimum level of flexural toughness was observed when EGC synthesizes with W/GP solids and S/FA of 0.22 and 0.4, respectively. However, flexural toughness can be estimated for any value of W/GP solids and sand/fly ash using Equation (7):
Flexural   toughness   ( N · mm ) = 170.433 + 1746.666 x 1 10.083 x 2 + 112.5   x 1   x 2 4000   x 1 2 31.875   x 2 2
where x 1 and x 2 represent W/GP solids and S/FA, respectively.

3.4.3. Effect of W/GP Solids and S/FA on Ductility Index of EGC

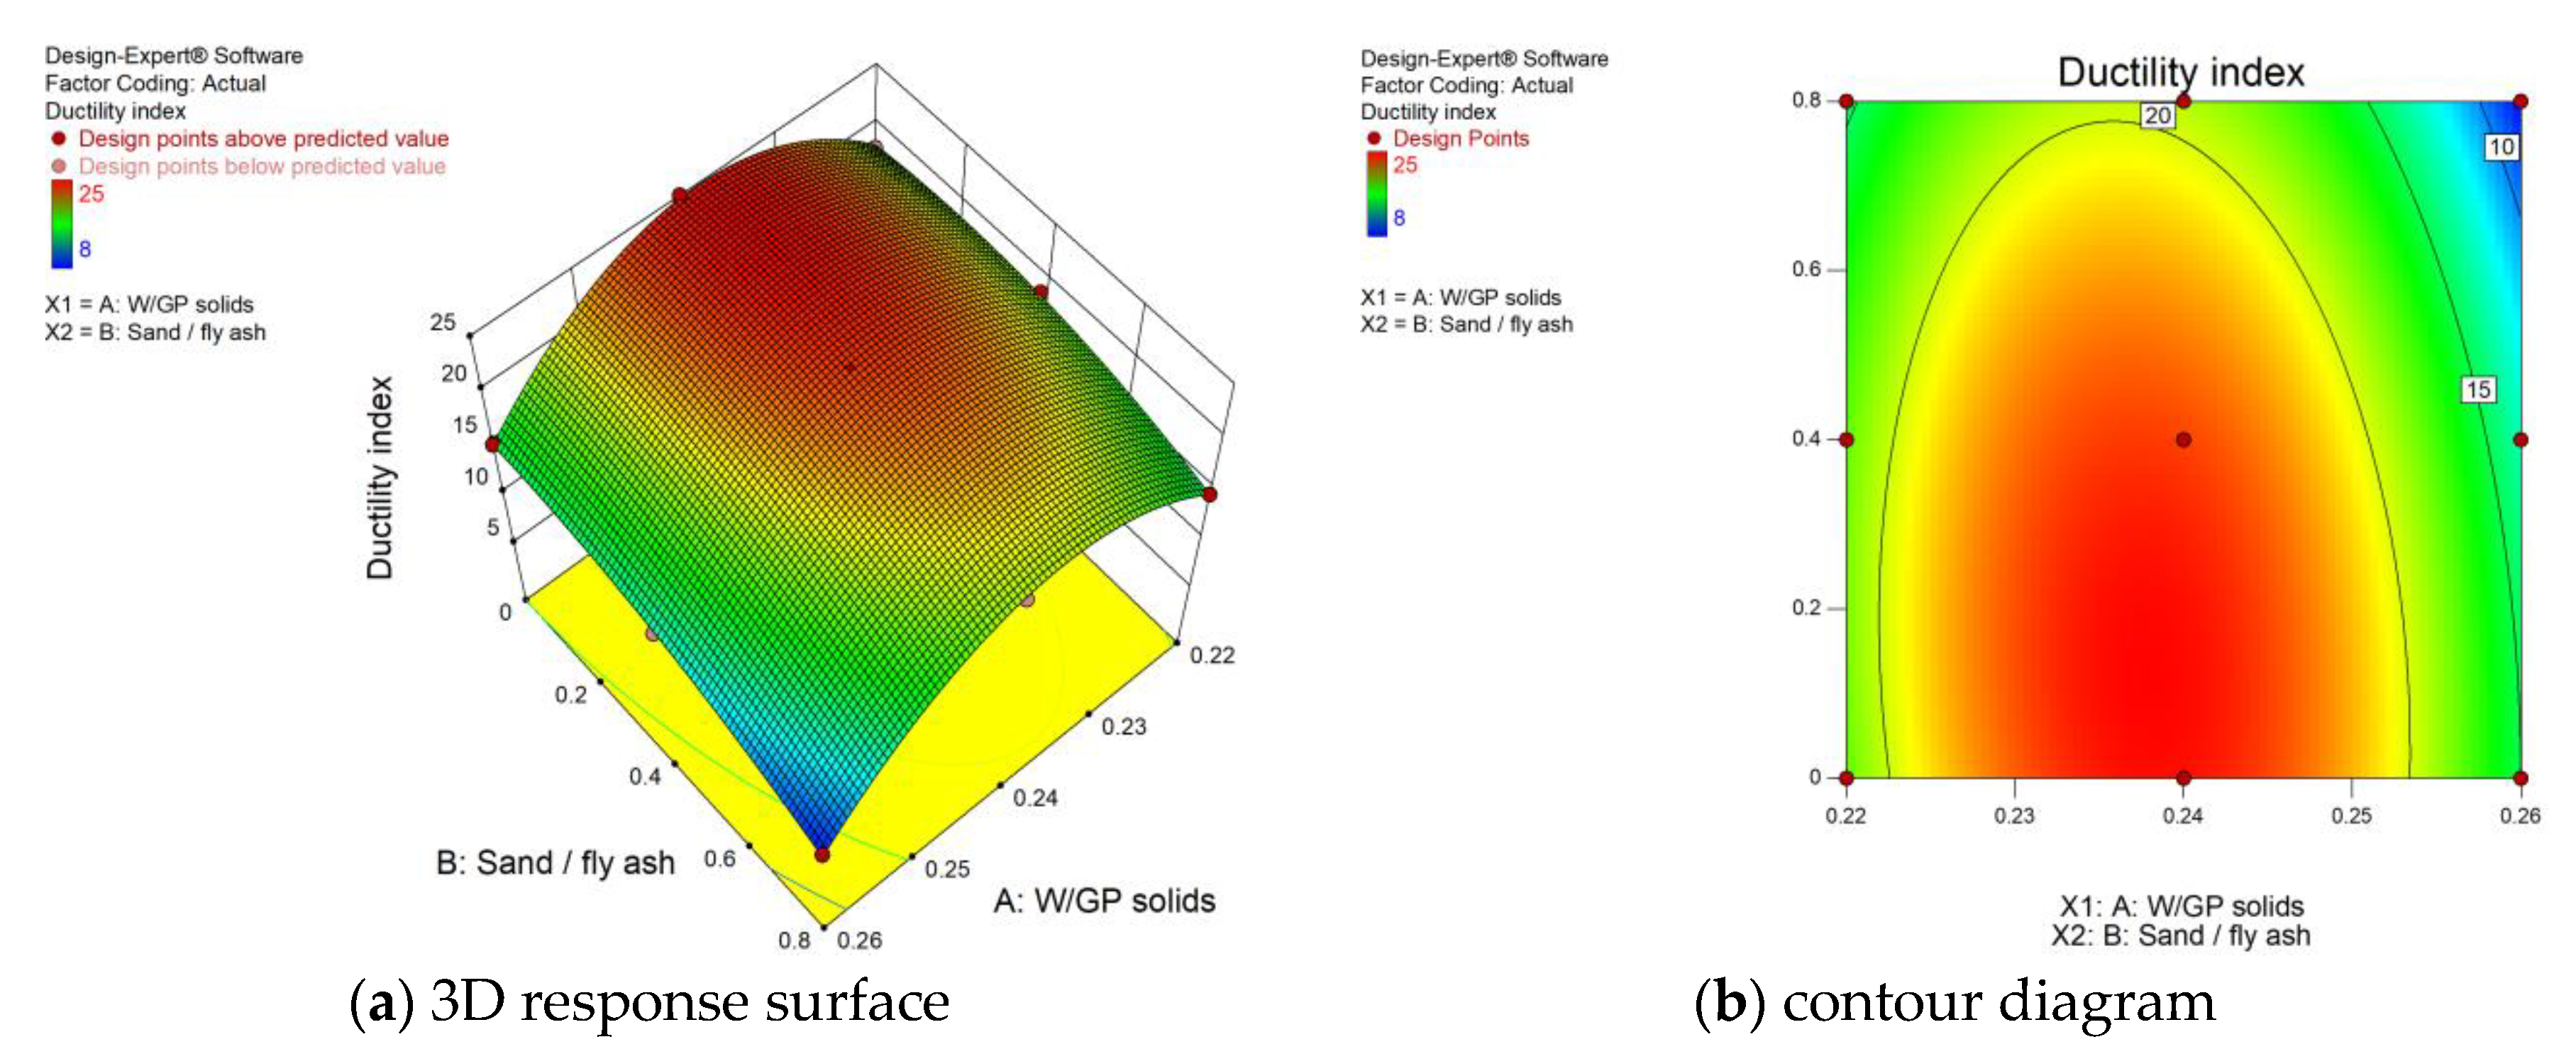
The ductility index (DI) is a quantitative measure of the ductile nature of any material. It is a ratio of deflection at peak load ( δ P P ) and deflection at first crack load ( δ L o p ) [58]. Figure 10 depicts the ductility index value with the variation of W/GP solids and S/FA. A slight improvement in DI was observed with the rise in W/GP solids up to a certain level. However, the maximum value of DI was observed at W/GP of 0.24, which is a moderate level. Furthermore, a decrease in DI was found with the increase in S/FA because the higher dosage of sand tends to increase matrix fracture toughness (Km), which causes the reduction of ductility of a material [61]. However, the DI can be predicted using Equation (8):
Ductility   index = 1125.41 + 9666.33 x 1 29.28 x 2 112.50 x 1   x 2 20308.33 x 1 2 11.39   x 2 2
where x 1 and x 2 represent W/GP solids and S/FA, respectively.

3.4.4. Effect of W/GP solids and S/FA on drying shrinkage of EGC

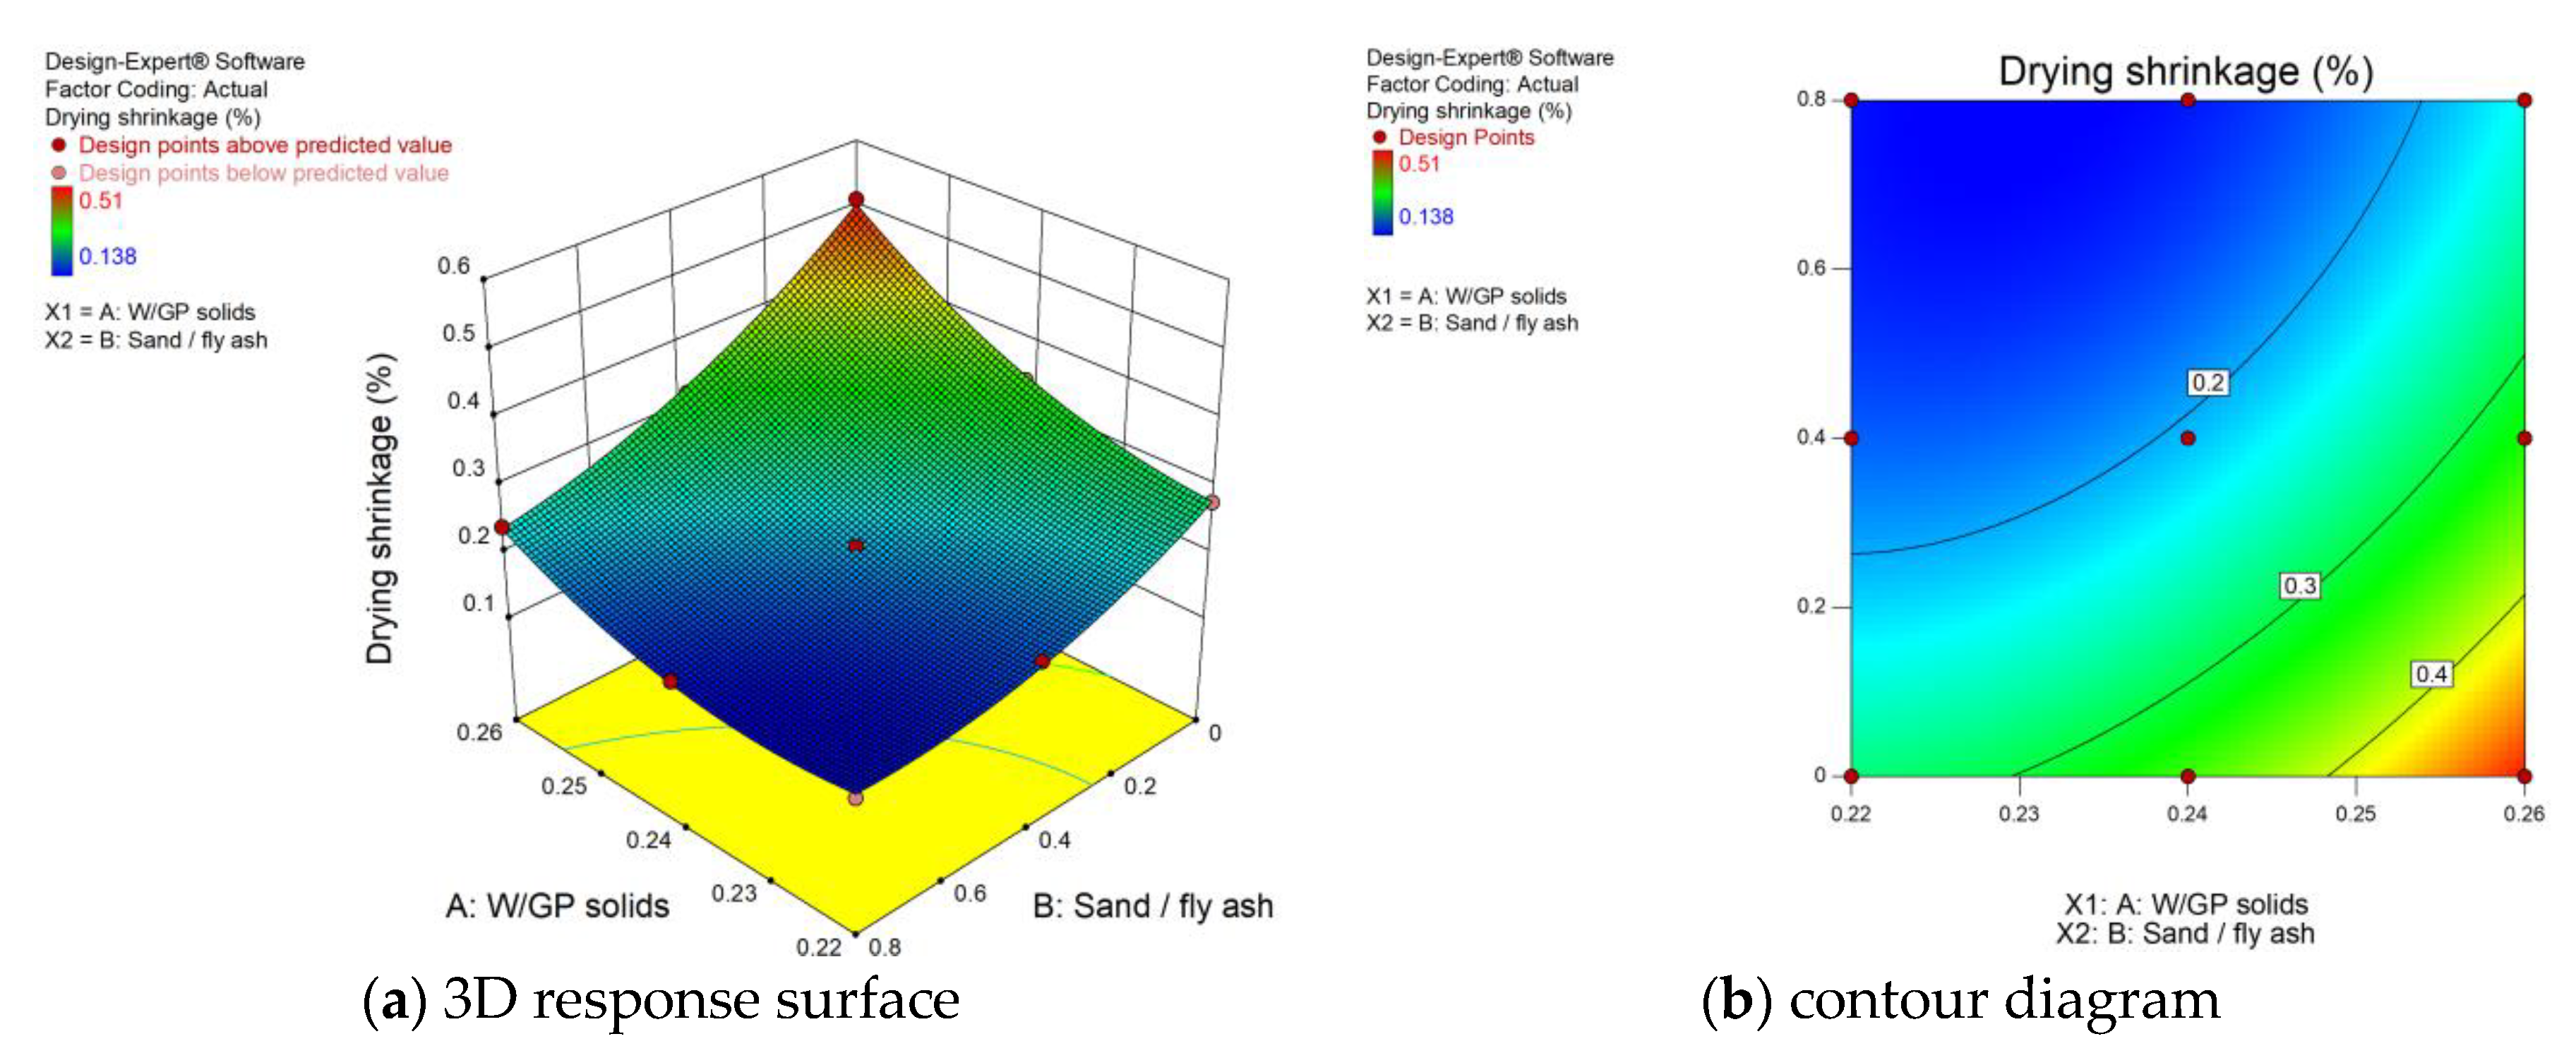
Reduction in length of the mortar caused by the loss of water during the drying process is known as drying shrinkage [62]. ECC does not utilize coarse aggregates; therefore, shrinkage is a significant concern [63]. The same is valid for EGC. The effect of W/GP solids and S/FA on the 28 days drying shrinkage of fiber-reinforced geopolymer is shown in Figure 11. Drying shrinkage was increased with the increment in W/GP solids. The same phenomenon for drying shrinkage was observed with the use of a high amount of water content in ECC [64].
Furthermore, the dosage of sand reduced the value of drying shrinkage. These results followed the same pattern as that observed in ECC [65]. The ANOVA prediction model for drying shrinkage is given in Equation (9):
Drying   shrinkage   ( % ) = + 5.39 47.62 x 1 + 0.52   x 2 4.06   x 1 x 2 + 110.83 x 1 2 + 0.24   x 2 2
where x 1 and x 2 represent W/GP solids and S/FA, respectively.

3.5. Validation of ANOVA Models

Analysis of variance (ANOVA) results of developed RSM models have been analyzed and statistically validated for their practical usage in the future. As given in Table 8, the relative change in adjusted R2 and predicted R2 of less than 0.2, a higher value of adequate precision (>4), and the low standard deviation of each response are the indicators of model acceptance [3]. Furthermore, the ANOVA result for all prediction models is shown in Table 9. Prob > F is less than 0.05, and the higher level of F-value is the indicator of the statistically significant model with a 95% confidence level [66]. Therefore, all models were statistically significant and could be used to estimate the response value for any given value of factors.
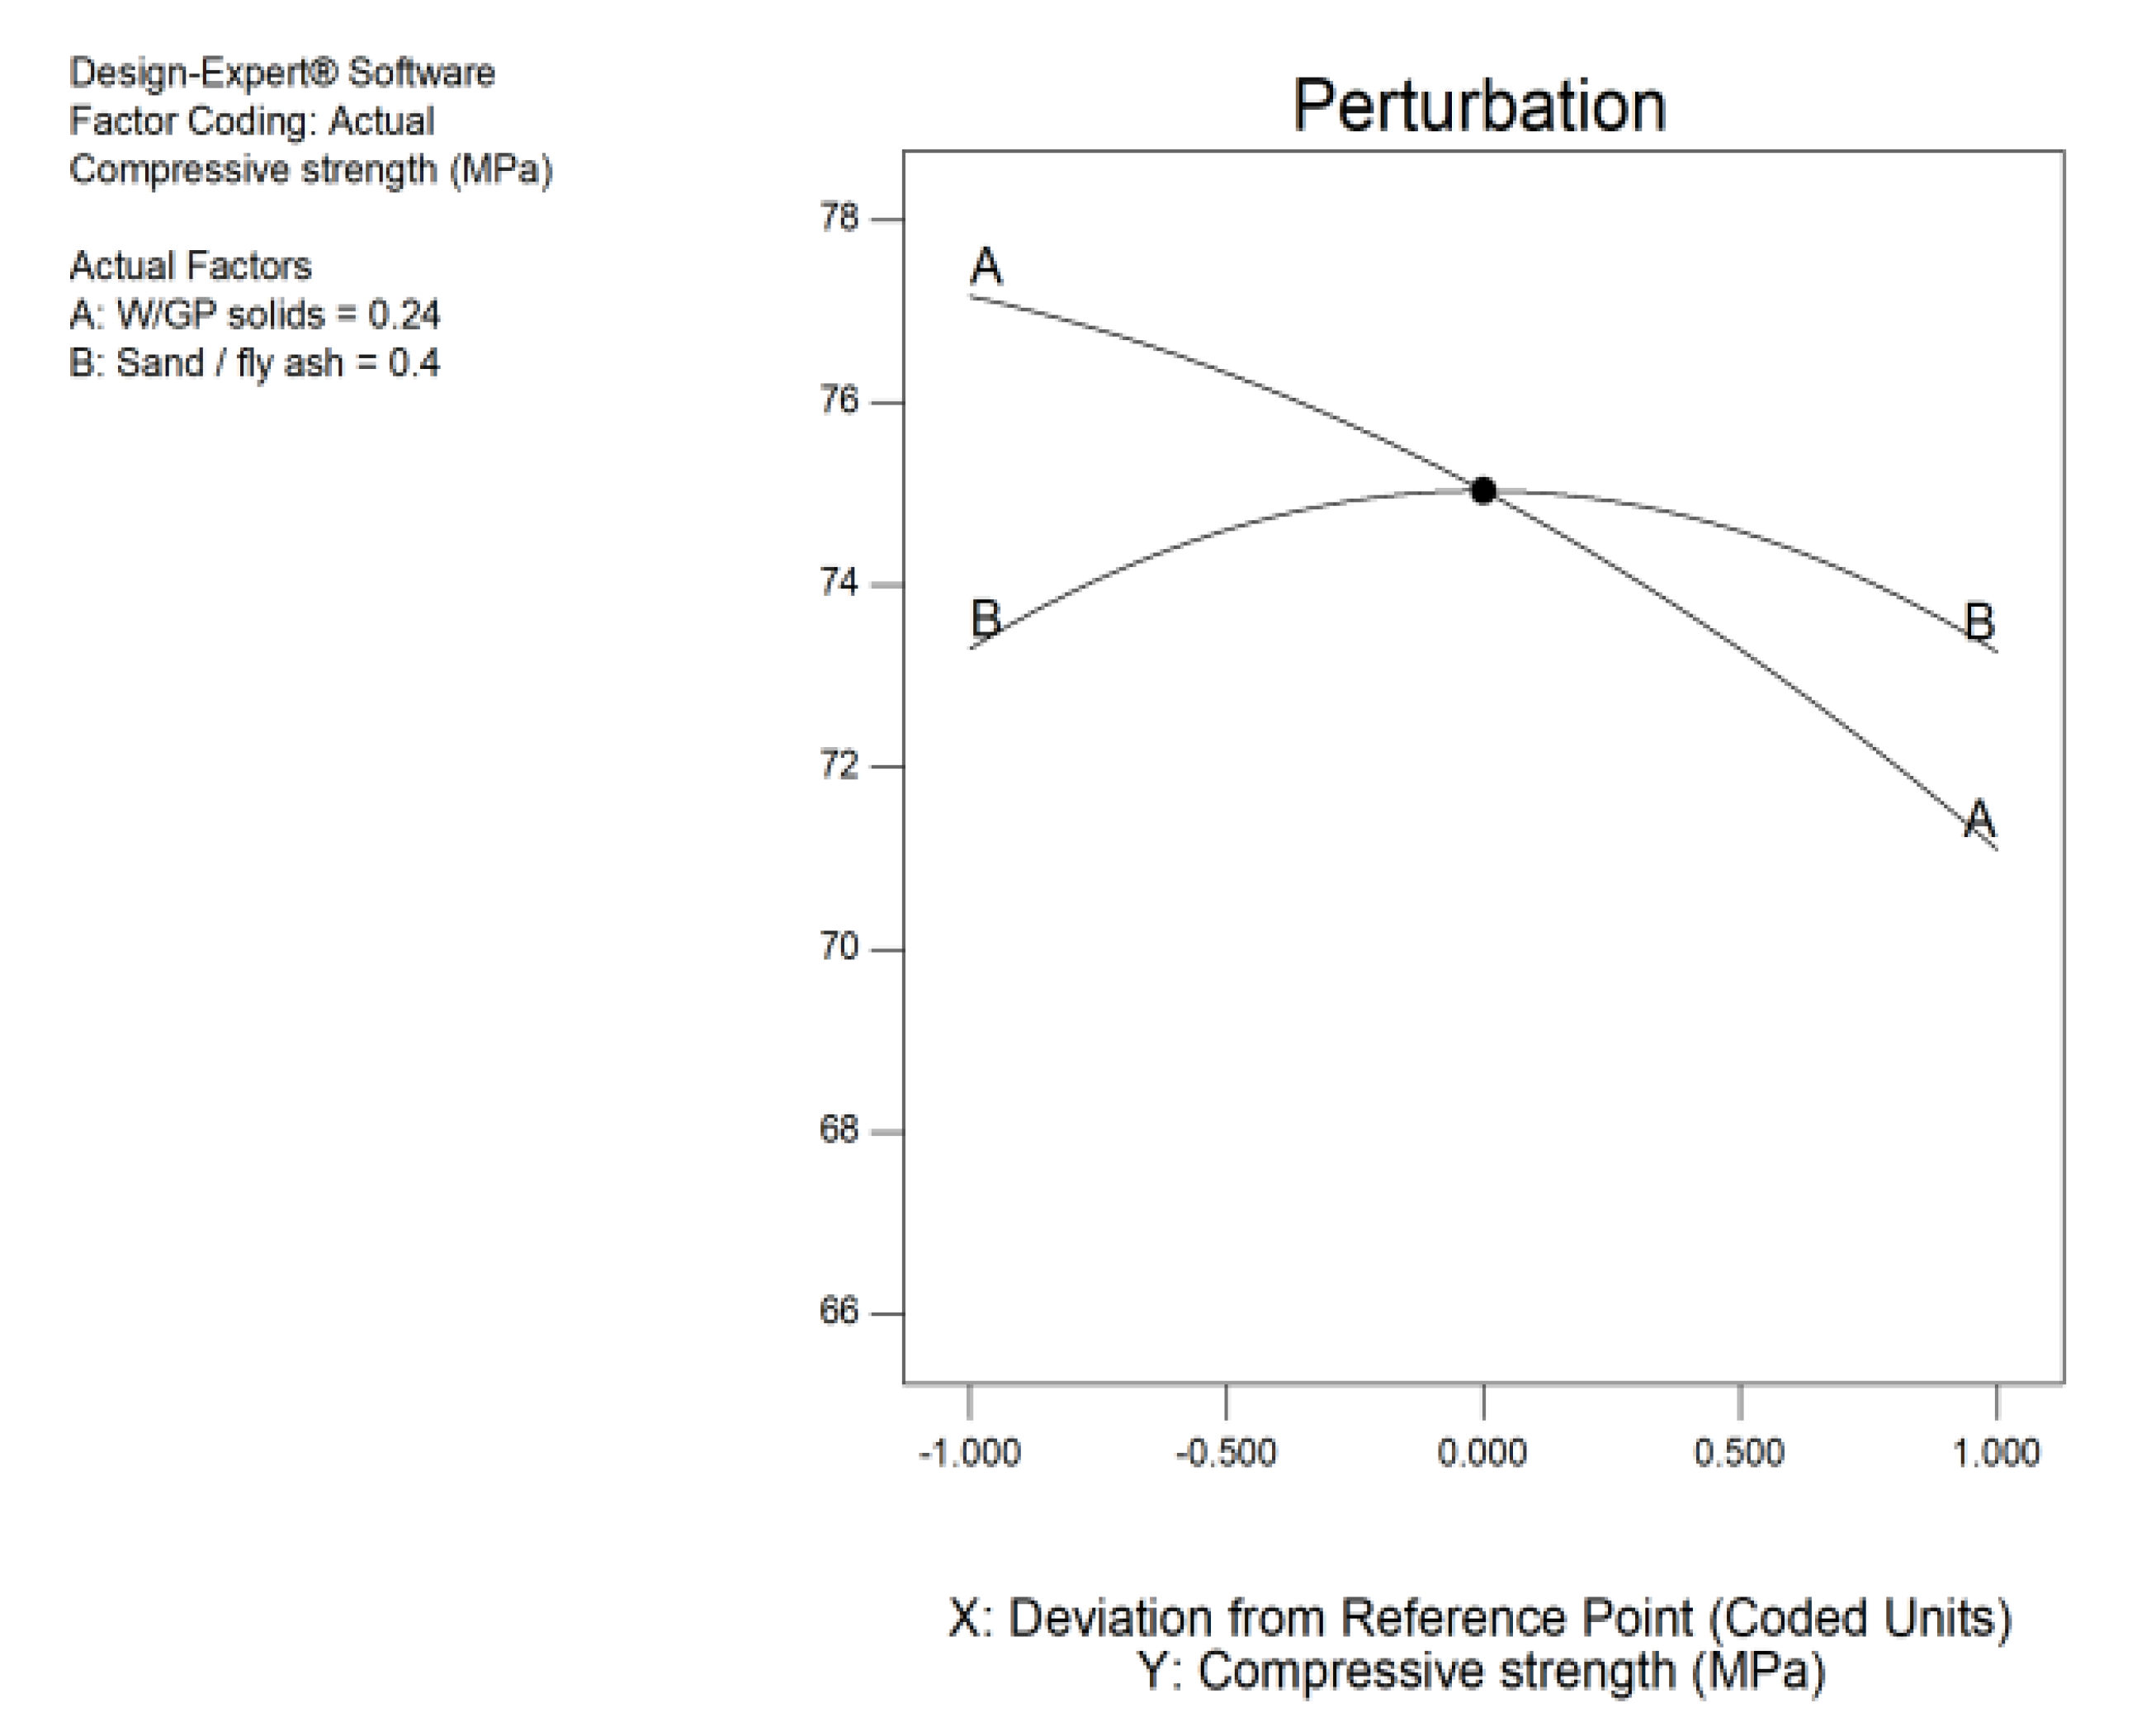
To avoid repetition, plots such as predicted versus actual, normal probability, and perturbation were drawn for only one response (compressive strength). Predicted and actual values are close enough and have a good agreement with the plot, almost coinciding with a 45-degree straight line (Figure 12). The straight-line coincident with data points of responses indicates normal distribution, as shown in Figure 13. To better understand the effect of independent variables (S/FA and W/GP solids) on compressive strength at a particular point, the perturbation plot is given in Figure 14. Steep slope and curvature indicate that the compressive strength is sensitive to both factors (W/GP solids and S/FA).

3.6. Optimization

Usually, the optimum solution of individual responses is located in a different area, and it is tough to find an optimal condition that fulfills the targeted goals of all responses concurrently. Therefore, a multiobjective optimization is utilized in this study to seek dosages of water/geopolymer solids (W/GP solids) and sand/fly ash (S/FA) satisfying the desired conditions of all responses at the same time. The RSM optimization was performed using the global desirability function, as given in Equation (10) [67].
D = ( d 1 r 1 × d 2 r 2 × d 3 r 3 × . × d n r n ) 1   r i = [ i = 1 n d i r i ] 1   r i
Desirability (D) of the optimal solution is the geometric average of the desirability of all independent as well as dependent variables, where n is the number of factors and responses involved in the optimization process. In this study, two factors, namely, W/GP solids and S/FA, in addition to seven responses named slump flow, compressive strength, flexural strength, elastic modulus, flexural toughness, drying shrinkage, and ductility index, were optimized simultaneously, where d i represents individual desirability function and ranges from 0 to 1 (0 for non-desired and 1 for desired). Furthermore, the importance of each factor or response is given as r i , which ranges from 1 to 5, where 1 stands for the least important, and 5 represents the most important.
A desirability value close to zero indicates a potential undesirable response and desirability close to one shows that the optimal solution is supposed to achieve the desired goal or target. A goal for responses (dependent variables) can be one of the given choices, i.e., “none”, “maximize”, “minimize”, “target” or “in range”; however, the desired goal for factor includes “equal to” instead of the “none” choice.
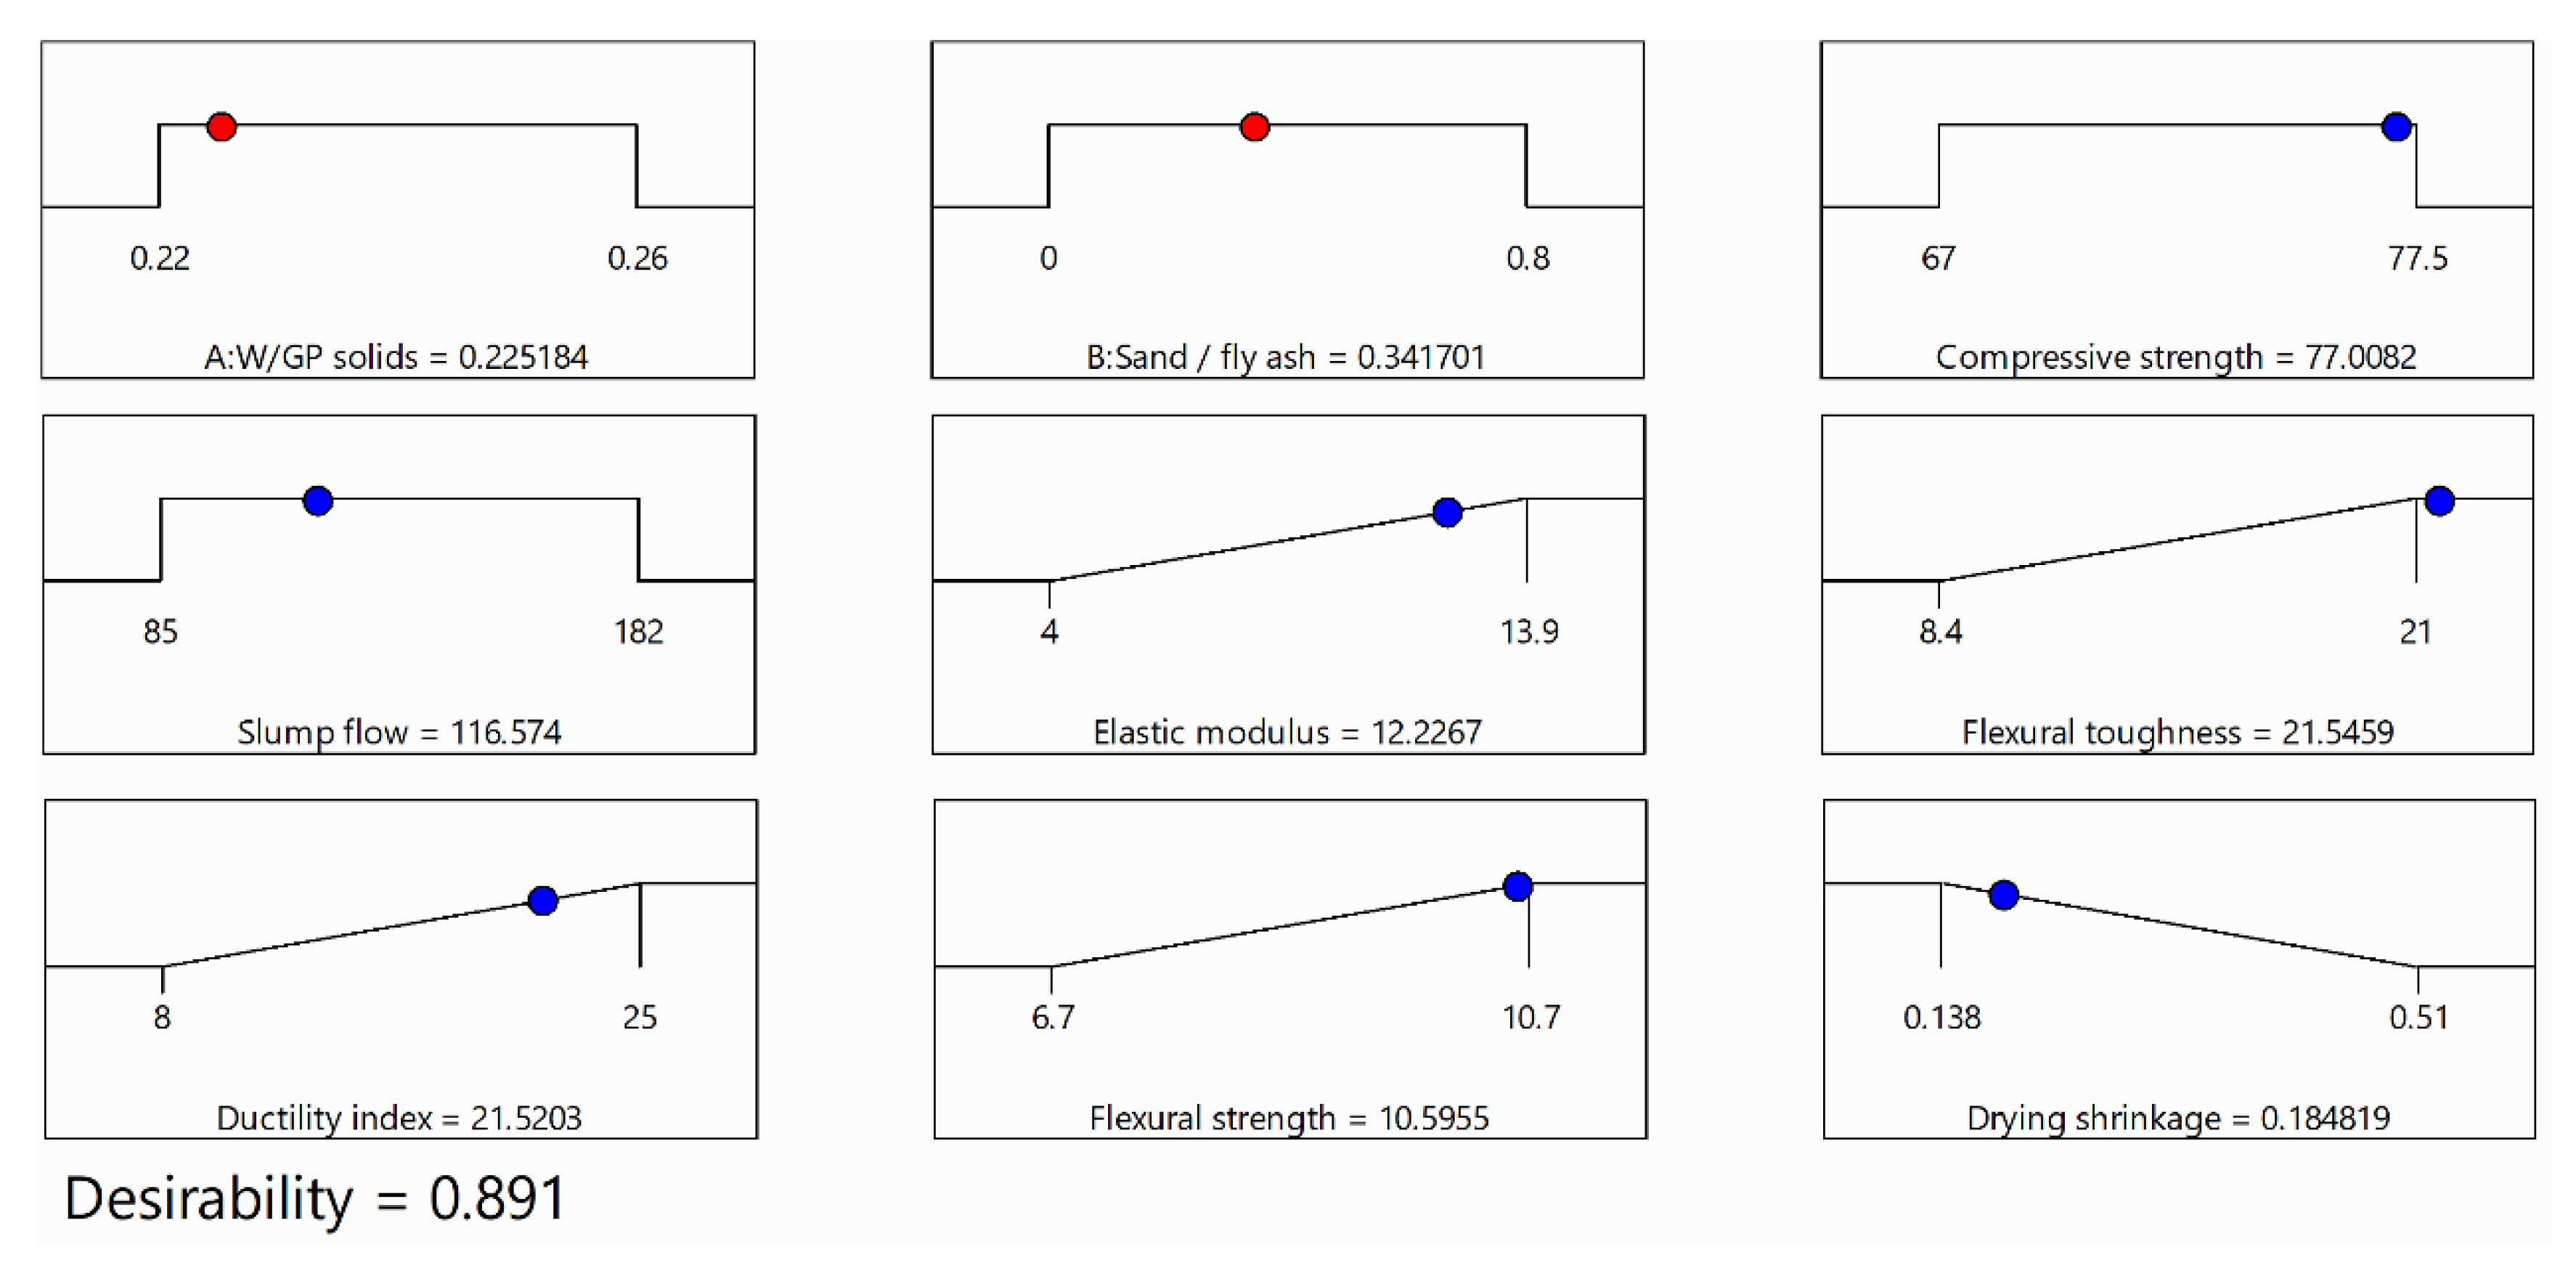
A multiobjective optimization technique of response surface methodology was applied to get an optimum solution that could satisfy the desired goals of all responses concurrently. Definitions of factors and responses in multiobjective optimization problem are given in Table 10. The primary aim of this research was to maximize the responses, which include compressive strength, elastic modulus, flexural strength, flexural toughness, and ductility index, while at the same time, drying shrinkage was kept the minimum. A single solution was obtained, which satisfied the specified criteria (Table 11). Ramps of the optimized EGC mix and related optimal responses are shown in Figure 15. After selecting an optimal solution, a validation study was carried out to find the variation in results obtained by performing experiments.

Experimental Validation Study

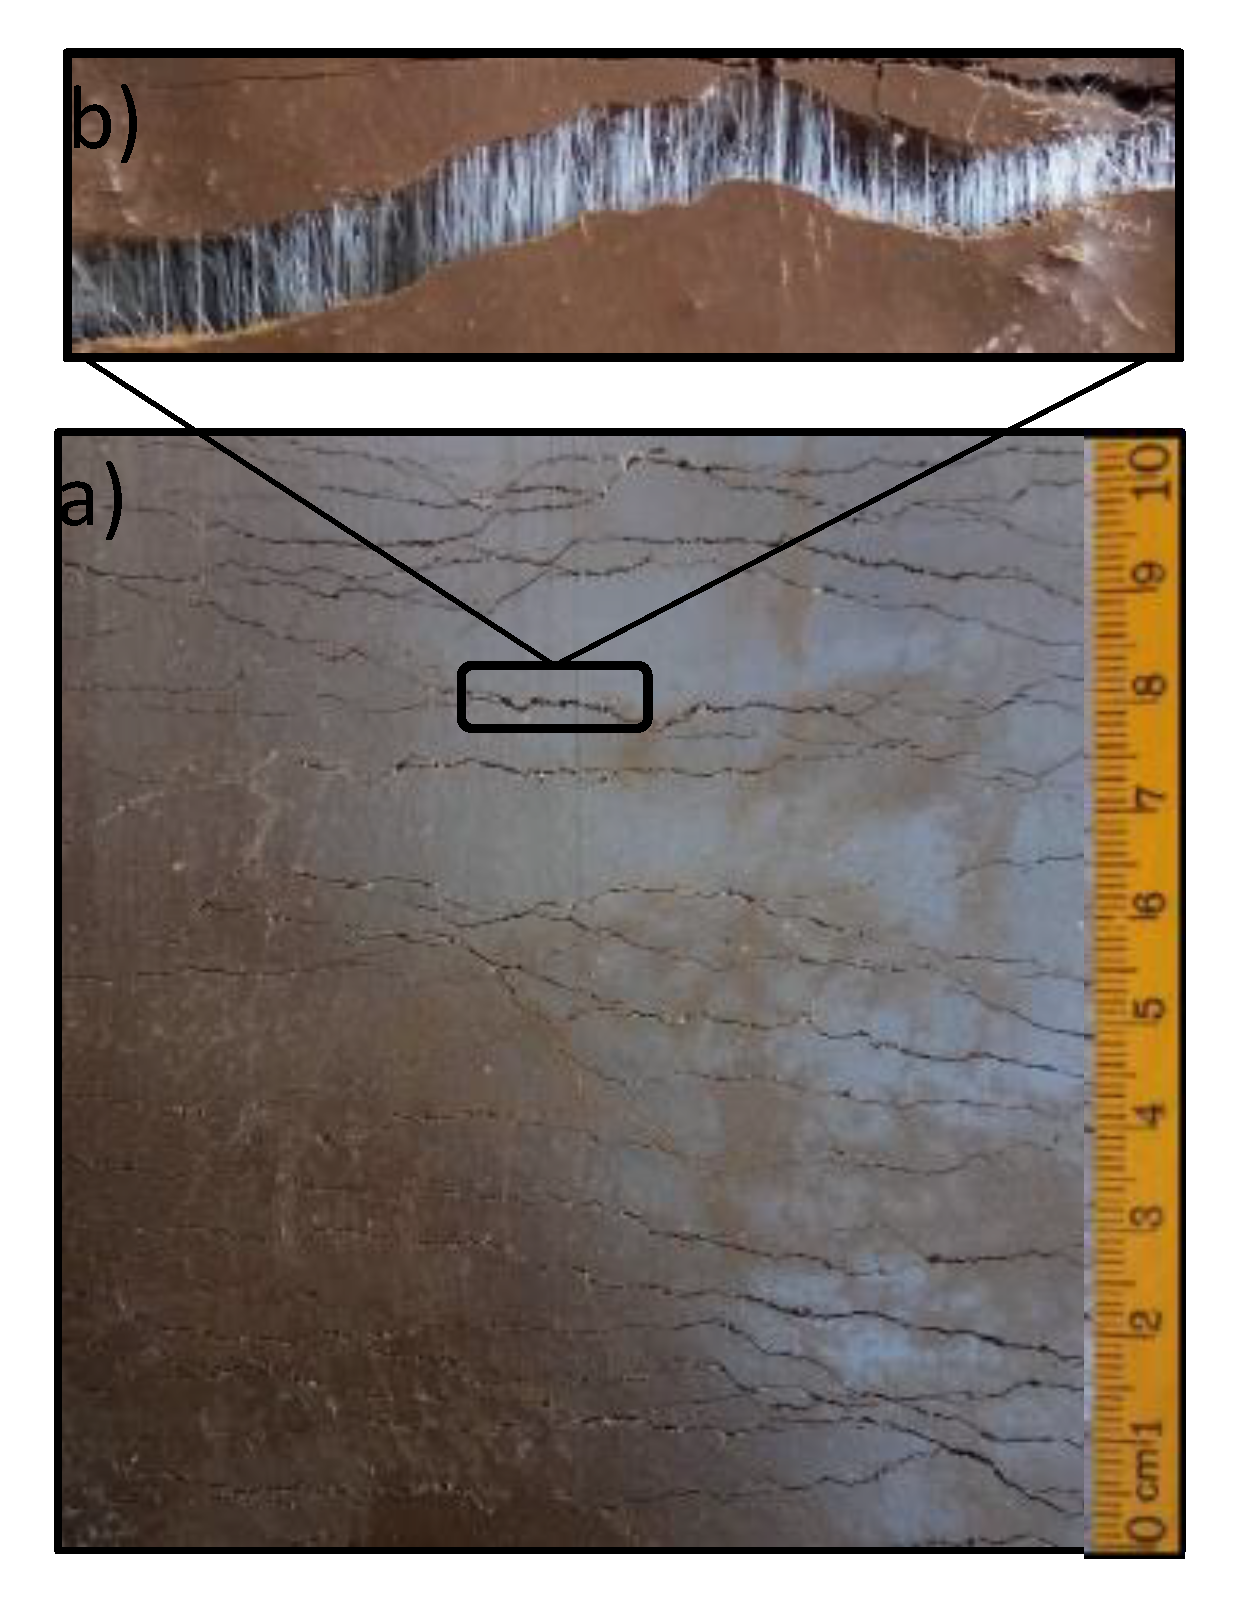
An experimental program was designed to determine the precision of the RSM models and the consistency of the optimized condition. Mixing, casting, curing, and testing of the samples followed the same procedure as that given in Section 2.3 and Section 2.4. Experimental results were found to be in close agreement with the predicted values of the responses, and the difference between them was less than 5% (Table 12). Figure 16 and Figure 17 are added as the evidence of the ultraductile nature of optimized EGC with multiple-crack formation. By contrast, Figure 18 shows the flexural strength versus the midspan deflection curve of the optimized mix.

4. Conclusions

In this study, optimal dosages of water/geopolymer (W/GP) solids and sand/fly ash (S/FA) in EGC were determined by performing and analyzing the experiments through response surface methodology (RSM). Based on the findings of the investigations reported in this paper, significant conclusions are drawn as follows.
The influence of factors (W/GP solids and S/FA) on responses (slump flow, compressive strength, elastic modulus, flexural strength, flexural toughness, ductility index, and drying shrinkage) has been effectively observed with 3D response surface diagrams.
Contour diagrams can effectively be used to predict the ranges of factors for the desired EGC property (response). Moreover, ANOVA equations have been developed and statistically validated. These ANOVA equations can be used to predict desired responses for any target value of factors accurately.
The optimum dosages of S/FA and W/GP solids in EGC obtained using the multiobjective optimization technique of RSM are 0.341701 and 0.225184, respectively.
The RSM optimization technique reduces the design time and efficiently analyzes the experimental data as well as improves the performance and reliability of the existing process and product.

Author Contributions

M.Z. performed the experimental investigation, carried out data analysis, and prepared the manuscript draft. N.S. supervised the overall research program, reviewed the results, and edited the manuscript. All authors have read and agreed to the published version of the manuscript.

Funding

No external funding was received for this research.

Acknowledgments

The authors would like to extend the acknowledgments to the Universiti Teknologi PETRONAS, Malaysia, for providing facilities and required supports for this research work.

Conflicts of Interest

The authors declare no conflict of interest.

References

  1. Wang, J.; Wang, Y.; Sun, Y.; Tingley, D.D.; Zhang, Y. Life cycle sustainability assessment of fly ash concrete structures. Renew. Sustain. Energy Rev. 2017, 80, 1162–1174. [Google Scholar] [CrossRef]
  2. McLellan, B.C.; Williams, R.P.; Lay, J.; Van Riessen, A.; Corder, G.D. Costs and carbon emissions for geopolymer pastes in comparison to ordinary portland cement. J. Clean. Prod. 2011, 19, 1080–1090. [Google Scholar] [CrossRef] [Green Version]
  3. Zahid, M.; Shafiq, N.; Jalal, A. Investigating the effects of solarcure curing method on the compressive strength, microstructure and polymeric reaction of fly ash based geopolymer. Constr. Build. Mater. 2018, 181, 227–237. [Google Scholar] [CrossRef]
  4. Yu, X.; Chen, L.; Komarneni, S.; Hui, C. Fly ash-based geopolymer: Clean production in, properties and applications. J. Clean. Prod. 2016, 125, 253–267. [Google Scholar] [CrossRef]
  5. Zahid, M.; Shafiq, N.; Nuruddin, M.F.; Nikbakht, E.; Jalal, A. Effect of Partial Replacement of Fly Ash by Metakaolin on Strength Development of Fly Ash Based Geopolymer Mortar; Key Engineering Materials; Trans Tech Publications: Kapellweg, Switzerland, 2017; pp. 131–135. [Google Scholar] [CrossRef]
  6. Davidovits, J. Geopolymers: Inorganic polymeric new materials. J. Therm. Anal. 1991, 37, 1633–1656. [Google Scholar] [CrossRef]
  7. Tasdemir, C.; Tasdemir, M.A.; Lydon, F.D.; Barr, B.I.G. Effects of silica fume and aggregate size on the brittleness of concrete. Cem. Concr. Res. 1996, 26, 63–68. [Google Scholar] [CrossRef]
  8. Nematollahi, B.; Qiu, J.; Yang, E.H.; Sanjayan, J. Micromechanics constitutive modeling and optimization of strain hardening geopolymer composite. Ceram. Int. 2017, 43, 5999–6007. [Google Scholar] [CrossRef]
  9. Jalal, A.; Shafiq, N.; Nikbakht, E.; Kumar, R.; Zahid, M. Mechanical Properties of Hybrid Basalt-Polyvinyl Alcohol (PVA) Fiber Reinforced Concrete. Key Eng. Mater. 2017, 744, 3–7. [Google Scholar] [CrossRef]
  10. Aslani, F.; Kelin, J. Assessment and development of high-performance fiber-reinforced lightweight self-compacting concrete, including recycled crumb rubber aggregates exposed to elevated temperatures. J. Clean. Prod. 2018, 200, 1009–1025. [Google Scholar] [CrossRef]
  11. Abbass, W.; Khan, M.I.; Mourad, S. Evaluation of mechanical properties of steel fiber reinforced concrete with different strengths of concrete. Constr. Build. Mater. 2018, 168, 556–569. [Google Scholar] [CrossRef]
  12. Kasagani, H.; Rao, C.B.K. Effect of graded fibers on stress-strain behavior of Glass Fiber Reinforced Concrete in tension. Constr. Build. Mater. 2018, 183, 592–604. [Google Scholar] [CrossRef]
  13. Branston, J.; Das, S.; Kenno, S.Y.; Taylor, C. Mechanical behavior of basalt fiber reinforced concrete. Constr. Build. Mater. 2016, 124, 878–886. [Google Scholar] [CrossRef]
  14. Noushini, A.; Samali, B.; Vessalas, K. Flexural toughness and ductility characteristics of polyvinyl-alcohol fiber reinforced concrete (PVA-FRC). In Proceedings of the 8th International Conference on Fracture Mechanics of Concrete and Concrete Structure, Toledo, Spain, 10–14 March 2013; pp. 1110–1121. [Google Scholar]
  15. Atiş, C.D.; Karahan, O. Properties of steel fiber reinforced fly ash concrete. Constr. Build. Mater. 2009, 23, 392–399. [Google Scholar] [CrossRef]
  16. Marcos-Meson, V.; Michel, A.; Solgaard, A.; Fischer, G.; Edvardsen, C.; Skovhus, T.L. Corrosion resistance of steel fiber reinforced concrete-A literature review. Cem. Concr. Res. 2018, 103, 1–20. [Google Scholar] [CrossRef] [Green Version]
  17. Hughes, B.P.; Fattuhi, N.I. The workability of steel-fiber-reinforced concrete. Mag. Concr. Res. 1976, 28, 157–161. [Google Scholar] [CrossRef]
  18. Horikoshi, T.; Ogawa, A.; Saito, T.; Hoshiro, H. Properties of Polyvinylalcohol fiber as reinforcing materials for cementitious composites. Int. Work. HPFRCC Struct. 2005, 2, 1–8. [Google Scholar]
  19. Choi, J.I.; Lee, B.Y. Bonding properties of basalt fiber and strength reduction according to fiber orientation. Materials 2015, 8, 6719–6727. [Google Scholar] [CrossRef] [Green Version]
  20. Zahid, M.; Shafiq, N.; Isa, M.H. Statistical modeling and mix design optimization of fly ash based engineered geopolymer composite using response surface methodology. Clean. Prod. 2018, 194. [Google Scholar] [CrossRef]
  21. Atahan, H.N.; Pekmezci, B.Y.; Tuncel, Y. Behavior of PVA Fiber Reinforced Cementitious Composites under Static and Impact Flexural Effects. J. Mater. Civ. Eng. 2012, 120922005613009. [Google Scholar] [CrossRef]
  22. Salih, A.F.M.; Shafiq, N.; Nuruddin, M.F.; Elheber, A.; Memon, F.A. Comparison of the effects of different fibers on the properties of self-compacting concrete. Res. J. Appl. Sci. Eng. Technol. 2014, 7, 3332–3341. [Google Scholar] [CrossRef]
  23. Fischer, G.; Li, V.C. Effect of fiber reinforcement on the response of structural members. Eng. Fract. Mech. 2007, 74, 258–272. [Google Scholar] [CrossRef] [Green Version]
  24. Pan, J.L.; Yuan, F.; Luo, M.; Leung, K.Y. Effect of composition on flexural behavior of engineered cementitious composites. Sci. China Technol. Sci. 2012, 55, 3425–3433. [Google Scholar] [CrossRef]
  25. Committee, J.-D. DFRCC Terminology and Application Concepts. J. Adv. Concr. Technol. 2003, 1, 335–340. [Google Scholar] [CrossRef] [Green Version]
  26. Li, V.C. Engineered Cementitious Composites (ECC)–Material, Structural, and Durability Performance in Concrete Construction Engineering; University of Michigan: Ann Arbor, MI, USA, 2007; pp. 373–381. [Google Scholar] [CrossRef] [Green Version]
  27. Ranjbar, N.; Mehrali, M.; Mehrali, M.; Alengaram, U.J.; Jumaat, M.Z. High tensile strength fly ash based geopolymer composite using copper coated micro steel fiber. Constr. Build. Mater. 2016, 112, 629–638. [Google Scholar] [CrossRef] [Green Version]
  28. Timakul, P.; Rattanaprasit, W.; Aungkavattana, P. Improving compressive strength of fly ash-based geopolymer composites by basalt fibers addition. Ceram. Int. 2016, 42, 6288–6295. [Google Scholar] [CrossRef]
  29. Vijai, K.; Kumutha, R.; Vishnuram, B.G. Properties of Glass Fibre Reinforced Geopolymer Concrete Composites. Asian J. Civ. Eng. Building Hous. 2012, 13, 511–520. [Google Scholar]
  30. Nematollahi, B.; Sanjayan, J.; Shaikh, F.U.A. Matrix design of strain hardening fiber reinforced engineered geopolymer composite. Compos. Part B Eng. 2015, 27, 253–265. [Google Scholar] [CrossRef]
  31. Ferdosian, I.; Camões, A. Eco-efficient ultra-high performance concrete development using response surface methodology. Cem. Concr. Compos. 2017, 84, 146–156. [Google Scholar] [CrossRef]
  32. Ekpenyong, M.G.; Antai, S.P.; Asitok, D.; Ekpo, B.O. Plackett-Burman Design and Response Surface Optimization of Medium Trace Nutrients for Glycolipopeptide Biosurfactant Production. Iran. Biomed. J. 2017, 21, 249–260. [Google Scholar] [CrossRef] [Green Version]
  33. Mohajeri, L.; Aziz, H.A.; Isa, M.H.; Zahed, M.A. A statistical experiment design approach for optimizing biodegradation of weathered crude oil in coastal sediments. Bioresour. Technol. 2010, 101, 893–900. [Google Scholar] [CrossRef]
  34. Eriksson, L.; Johansson, E.; Wikström, C. Mixture design-Design generation, PLS analysis, and model usage. Chemom. Intell. Lab. Syst. 1998, 43, 1–24. [Google Scholar] [CrossRef]
  35. Khotbehsara, M.M.; Mohseni, E.; Yazdi, M.A.; Sarker, P.; Ranjbar, M.M. Effect of nano-CuO and fly ash on the properties of self-compacting mortar. Constr. Build. Mater. 2015, 94, 758–766. [Google Scholar] [CrossRef]
  36. Ghafari, E.; Costa, H.; Júlio, E. RSM-based model to predict the performance of self-compacting UHPC reinforced with hybrid steel micro-fiber. Constr. Build Mater. 2014, 66, 375–383. [Google Scholar] [CrossRef]
  37. Bayramov, F.; Taşdemir, C.; Taşdemir, M.A. Optimization of steel fiber reinforced concretes employing statistical response surface method. Cem. Concr. Compos. 2004, 26, 665–675. [Google Scholar] [CrossRef]
  38. Al-Alaily, H.S.; Hassan, A.A.A. Refined statistical modeling for chloride permeability and strength of concrete containing metakaolin. Constr. Build. Mater. 2016, 114, 564–579. [Google Scholar] [CrossRef]
  39. Mermerdaş, K.; Algın, Z.; Oleiwi, S.M.; Nassani, D.E. Optimization of lightweight GGBFS and FA geopolymer mortars by response surface method. Constr. Build. Mater. 2017, 139, 159–171. [Google Scholar] [CrossRef]
  40. Shafiq, N.; Nuruddin, M.N.; Kamaruddin, I. Comparison of engineering and durability properties of fly ash blended cement concrete made in UK and Malaysia. Adv. Appl. Ceram. 2007, 106, 314–318. [Google Scholar] [CrossRef]
  41. Nematollahi, B.; Sanjayan, J.; Shaikh, F.U.A. Comparative deflection hardening behavior of short fiber reinforced geopolymer composites. Constr. Build. Mater. 2014, 70, 54–64. [Google Scholar] [CrossRef]
  42. Del Coz Diaz, J.J.; Garcia-Nieto, P.J.; Alvarez-Rabanall, F.P.; Alonso-Martínez, M.; Dominguez-Hernandez, J.; Perez-Bella, J.M. The use of response surface methodology to improve the thermal transmittance of lightweight concrete hollow bricks by FEM. Constr. Build. Mater. 2014, 52, 331–344. [Google Scholar] [CrossRef]
  43. Mohajeri, S.; Aziz, H.A.; Isa, M.H.; Zahed, M.A.; Adlan, M.N. Statistical optimization of process parameters for landfill leachate treatment using electro-Fenton technique. J. Hazard. Mater. 2010, 176, 749–758. [Google Scholar] [CrossRef]
  44. ASTM C1437. Standard Test Method for Flow of Hydraulic Cement Mortar. ASTM Int. 2016, 1–2. [Google Scholar] [CrossRef]
  45. Li, M.; Li, V.C. Rheology, fiber dispersion, and robust properties of Engineered Cementitious Composites. Mater. Struct. 2013, 46, 405–420. [Google Scholar] [CrossRef] [Green Version]
  46. ASTM C1609. Standard Test Method for Flexural Performance of Fiber-Reinforced Concrete (Using Beam With Third-Point Loading). ASTM 2012, 1–8. [CrossRef]
  47. Gao, Y.; Xu, J.; Luo, X.; Zhu, J.; Nie, L. Experiment research on mix design and early mechanical performance of alkali-activated slag using response surface methodology (RSM). Ceram. Int. 2016, 42, 11666–11673. [Google Scholar] [CrossRef]
  48. Mohammed, B.S.; Fang, O.C.; Anwar Hossain, K.M.; Lachemi, M. Mix proportioning of concrete containing paper mill residuals using response surface methodology. Constr. Build. Mater. 2012, 35, 63–68. [Google Scholar] [CrossRef]
  49. Chen, X.; Wu, S. Influence of water-to-cement ratio and curing period on pore structure of cement mortar. Constr. Build. Mater. 2013, 38, 804–812. [Google Scholar] [CrossRef]
  50. Chung, K.L.; Ghannam, M.; Zhang, C. Effect of Specimen Shapes on Compressive Strength of Engineered Cementitious Composites (ECCs) with Different Values of Water-to-Binder Ratio and PVA Fiber. Arab. J. Sci. Eng. 2018, 43, 1825–1837. [Google Scholar] [CrossRef]
  51. Güneyisi, E.; Gesoǧlu, M.; Algin, Z.; Mermerdaş, K. Optimization of concrete mixture with hybrid blends of metakaolin and fly ash using response surface method. Compos. Part B Eng. 2014, 60, 707–715. [Google Scholar] [CrossRef]
  52. Silva, R.V.; De Brito, J.; Dhir, R.K. Establishing a relationship between modulus of elasticity and compressive strength of recycled aggregate concrete. J. Clean. Prod. 2016, 112, 2171–2186. [Google Scholar] [CrossRef]
  53. Li, V.C.; Leung, C.K. Steady-state and multiple cracking of short random fiber composites. J. Eng. Mech. 1992, 118, 2246–2264. [Google Scholar] [CrossRef] [Green Version]
  54. Mohammed, B.S.; Achara, B.E.; Nuruddin, M.F.; Yaw, M.; Zulkefli, M.Z. Properties of nano-silica-modified self-compacting engineered cementitious composites. J. Clean. Prod. 2017, 162, 1225–1238. [Google Scholar] [CrossRef]
  55. Altwair, N.M.; Megat Johari, M.A.; Saiyid Hashim, S.F. Flexural performance of green engineered cementitious composites containing high volume of palm oil fuel ash. Constr. Build. Mater. 2012, 37, 518–525. [Google Scholar] [CrossRef]
  56. Maalej, M.; Li, V.C. Flexural/Tensile-Strength Ratio in Engineered Cementitious Composites. J. Mater. Civ. Eng. 1994, 6, 513–528. [Google Scholar] [CrossRef] [Green Version]
  57. Altwair, N.M.; Megat Johari, M.A.; Saiyid Hashim, S.F. Strength Activity Index and Microstructural Characteristics of Treated Palm Oil Fuel Ash. Int. J. Civ. Environ. Eng. 2011, 11, 100–107. [Google Scholar]
  58. Shaikh, F.U.A. Deflection hardening behavior of short fiber reinforced fly ash based geopolymer composites. Mater. Des. 2013, 50, 674–682. [Google Scholar] [CrossRef] [Green Version]
  59. Yang, Y.; Gao, X.; Deng, H.; Yu, P.; Yao, Y. Effects of water/binder ratio on the properties of engineered cementitious composites. J. Wuhan Univ. Technol. Mater. Sci. Ed. 2010, 25, 298–302. [Google Scholar] [CrossRef]
  60. Kanda, T.; Li, V.C. Interface Property and Apparent Strength of High-Strength Hydropidlic Fiber in Cement Matrix. J. Mater. Civ. Eng. 1998, 10, 5–13. [Google Scholar] [CrossRef] [Green Version]
  61. Li, V.C.; Wu, C.; Wang, S.; Ogawa, A.; Saito, T. Interface tailoring for strain-hardening polyvinyl alcohol-engineered cementitious composite (PVA-ECC). ACI Mater. J. 2002, 99, 463–472. [Google Scholar] [CrossRef]
  62. Wallah, S.E.; Rangan, B. Low-Calcium Fly Ash-Based Geopolymer Concrete: Long-Term Properties; Research Report; Curtin University: Perth, Australia, 2006. [Google Scholar]
  63. Minoru, K.; Keitetsu, R. Recent Progress on HPFRCC in Japan Required Performance and Applications. J. Adv. Concr. Technol. 2006, 4, 19–33. [Google Scholar] [CrossRef] [Green Version]
  64. Altwair, N.M.; Johari, M.A.M.; Hashim, S.F.S. Shrinkage Characteristics of Green Engineered Cementitious Composites with Varying Palm Oil Fuel Ash Contents and Water-Binder Ratios. Adv. Mater. Res. 2012, 626, 245–249. [Google Scholar] [CrossRef]
  65. Zhang, J.; Gong, C.; Guo, Z.; Zhang, M. Engineered cementitious composite with characteristic of low drying shrinkage. Cem. Concr. Res. 2009, 39, 303–312. [Google Scholar] [CrossRef]
  66. Subasi, A.; Sahin, B.; Kaymaz, I. Multi-objective optimization of a honeycomb heat sink using the Response Surface Method. Int. J. Heat Mass Transf. 2016, 101, 295–302. [Google Scholar] [CrossRef]
  67. Sivaraos Milkey, K.R.; Samsudin, A.R.; Dubey, A.K.; Kidd, P. Comparison between the Taguchi method and response surface methodology (RSM) modelingng CO2 laser machining. Jordan J. Mech. Ind. Eng. 2014, 8, 35–42. [Google Scholar] [CrossRef]
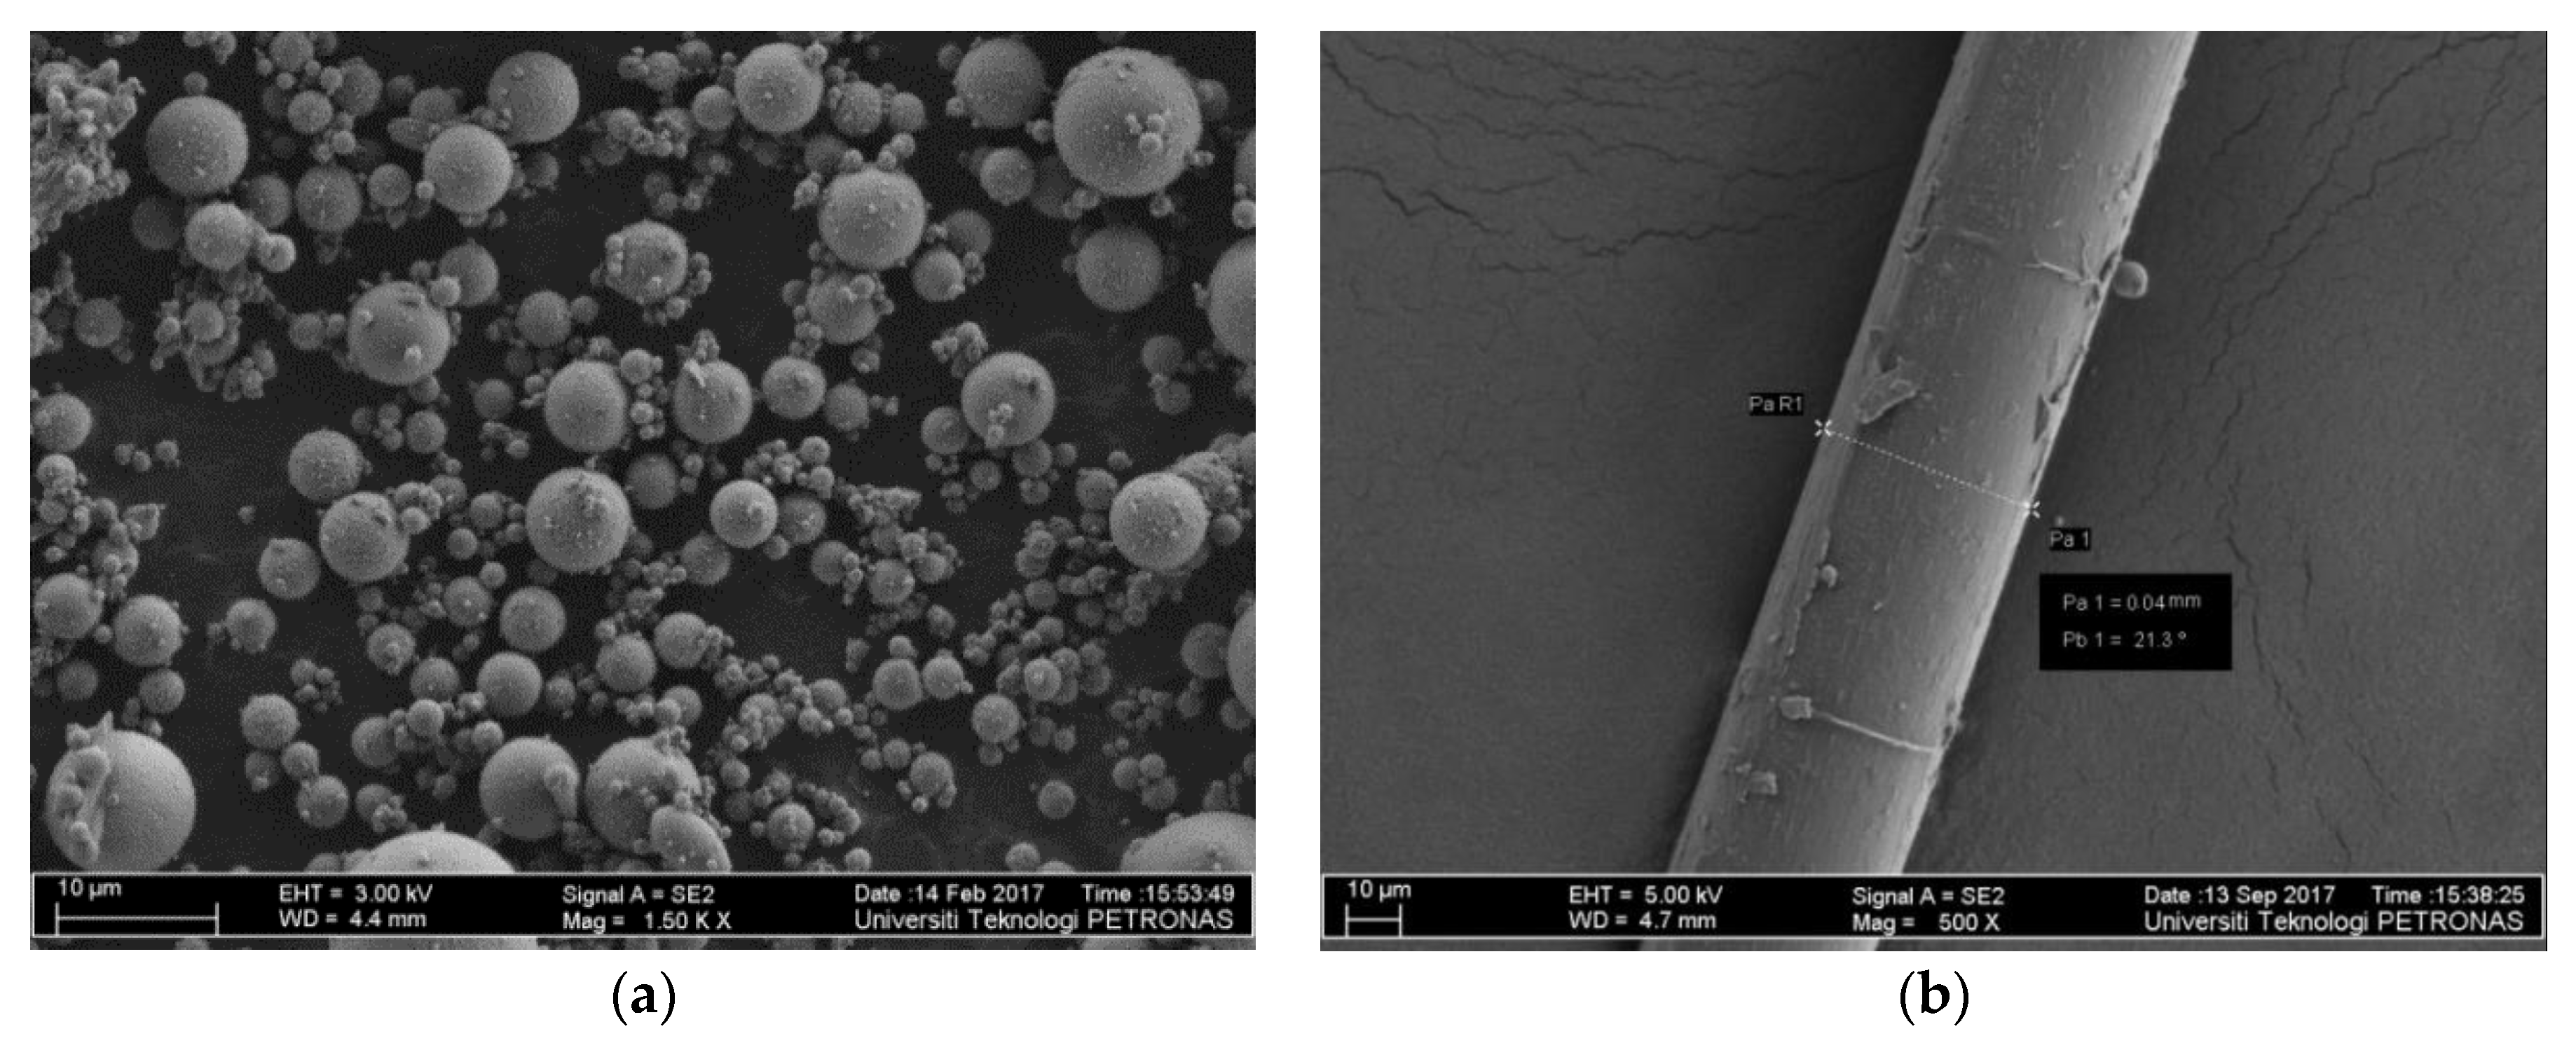
Figure 1. Field emission SEM (FESEM) micrographs: (a) Fly ash (spherical particles); (b) polyvinyl alcohol (PVA) fiber (diameter of 0.04 mm).
Minerals 10 00333 g001
Figure 2. Central composite design (CCD) module (face-centered). (a) Corner points, (b) middle, and central point (c) CCD design.
Minerals 10 00333 g002
Figure 3. (a) Sample details and loading arrangement for the flexural strength test (measurements are in “mm”). (b) Load versus deflection curve (Typical).
Minerals 10 00333 g003
Figure 4. Slump flow versus W/GP solids and sand/fly ash. (a) 3D response surface, (b) contour diagram.
Minerals 10 00333 g004
Figure 5. Compressive strength versus W/GP solids and sand/fly ash. (a) 3D response surface, (b) contour diagram.
Minerals 10 00333 g005
Figure 6. Elastic modulus versus W/GP solids and sand/fly ash. (a) 3D response surface, (b) contour diagram.
Minerals 10 00333 g006
Figure 7. Flexural strength versus midspan deflection curve: (a) W/GP solids = 0.22, (b) W/GP solids = 0.24, and (c) W/GP solids = 0.26.
Minerals 10 00333 g007
Figure 8. Flexural strength versus W/GP solids and sand/fly ash. (a) 3D response surface, (b) contour diagram.
Minerals 10 00333 g008
Figure 9. Flexural toughness versus W/GP solids and sand/fly ash. (a) 3D response surface, (b) contour diagram.
Minerals 10 00333 g009
Figure 10. Ductility index versus W/GP solids and sand/fly ash. (a) 3D response surface, (b) contour diagram.
Minerals 10 00333 g010
Figure 11. Drying shrinkage versus W/GP solids and sand/fly ash. (a) 3D response surface, (b) contour diagram.
Minerals 10 00333 g011
Figure 12. Predicted vs. Actual compressive strength of EGC.
Minerals 10 00333 g012
Figure 13. The normal plot of residual compressive strength of EGC.
Minerals 10 00333 g013
Figure 14. Perturbation curves for compressive strength of EGC.
Minerals 10 00333 g014
Figure 15. Ramps for multiobjective optimization of EGC.
Minerals 10 00333 g015
Figure 16. Deflection of EGC with multiple cracking behaviors.
Minerals 10 00333 g016
Figure 17. (a) Multiple cracking pattern; (b) fibers bridging crack opening.
Minerals 10 00333 g017
Figure 18. Flexural strength versus midspan deflection curve of the optimized mixture.
Minerals 10 00333 g018
Table 1. Elemental composition, loss on ignition (LOI), and surface area of fly ash.
The Chemical Composition of Fly Ash (%)
SiO2Al2O3Fe2O3CaOMgOK2OSO3TiO2P2O5LOIBET (m2/g)
34.511.823.619.02.272.081.491.461.272.60.9985
LOI is a loss on ignition, and BET represents the average Brunauer Emmet Taller (BET) surface area.
Table 2. Gradation of silica sand.
Sieve Size (µm)710600300150
Passing (%)99.878.1216.141.23
Table 3. The chemical composition of the alkaline solution (% by mass).
Na2SiO3 Solution (%)8M NaOH Solution (%)
Na2O14.7NaOH26
SiO229.75H2O74
H2O55.52
Table 4. Properties of micro-PVA fiber.
BrandProduct CodeLength
(mm)
Diameter
(mm)
Fiber Strength (MPa)Young’s Modulus (GPa)Elongation (%)Density (g/cm3)
KurarayRECS 1580.0416004161.3
Note: The type of PVA fiber is chosen from the available literature [30].
Table 5. Boundaries of factors in response surface methodology (RSM).
FactorCodeLevels
α 0 + α
Water/GP solidsX10.220.240.26
sand/fly ashX200.40.8
Table 6. Mix designs of engineered geopolymer composite (EGC).
FactorsAlkaline Solution aExtra Water aNa2SiO3/NaOHNaOH Molarity (M)PVA Fiber bCuring Temperature (°C)
MixW/GP SolidsSand/Fly Ash
M10.2200.360.0352.58M0.0260
M20.220.40.360.0352.58M0.0260
M30.220.80.360.0352.58M0.0260
M40.2400.360.0582.58M0.0260
M50.240.40.360.0582.58M0.0260
M60.240.80.360.0582.58M0.0260
M70.2600.360.082.58M0.0260
M80.260.40.360.082.58M0.0260
M90.260.80.360.082.58M0.0260
Note: Water to geopolymer (W/GP) solids and sand/fly ash were selected according to the central composite design configurations for two factors using Design expert® software. Geopolymer solids (solids in NaOH and Na2SiO3 solution plus fly ash), PVA fibers, NaOH molarity, and Na2SiO3/NaOH and curing temperature were selected from the available literature on EGC [30]. The dosage of the alkaline solution was selected from the literature [20]. Extra water was added to maintain desired W/GP solids. a Quantity in a mass ratio of fly ash. b Quantity in the volume fraction of the total volume of material.
Table 7. Experimental results.
Responses (Average EGC Properties; Standard Deviation)
MixCompressive Strength
(MPa)
Slump Flow
(%)
Elastic Modulus
(GPa)
Flexural Toughness
(N·m)
Ductility IndexFlexural Strength
(MPa)
Drying Shrinkage
(%)
M177.5; 2.1114; 3.612.7; 0.620.1; 0.818.0; 0.310.6; 0.40.28; 0.008
M277.5; 3.091; 3.5013.9; 0.421.0; 0.718.5; 0.410.7; 0.40.18; 0.009
M373.0; 3.585; 4.608.00; 0.211.7; 0.614.6; 0.69.50; 0.30.14; 0.007
M473.6; 1.1168; 3.67.20; 0.218.6; 0.925.0; 0.69.20; 0.20.34; 0.006
M575.0; 2.1155; 2.69.00; 0.220.1; 0.923.8; 0.89.90; 0.40.21; 0.008
M673.0; 2.4134; 2.66.50; 0.111.2; 0.519.0; 0.310.0; 0.30.15; 0.003
M767.0; 1.8182; 3.64.00; 0.113.2; 0.715.0;0.76.70; 0.20.51; 0.006
M870.8; 1.9173; 6.17.00; 0.115.8; 0.612.9; 0.17.90; 0.30.32; 0.004
M972.0; 3.5158; 4.46.00; 0.28.40; 0.48.00; 0.38.30; 0.40.24; 0.005
Table 8. Model validation for responses.
ResponseStandard DeviationMeanR2Predicted R2Adjusted R2Adequate Precision
Slump flow2.36136.560.99880.98590.996963.873
Compressive strength0.4373.270.99370.92310.983131.105
Elastic modulus0.618.260.98630.84270.963419.166
Flexural strength0.229.200.98980.88360.972922.255
Flexural toughness0.2715.570.99870.98410.996556.884
Ductility index0.3817.210.99810.97690.994955.144
Drying shrinkage0.0110.260.99690.96320.991841.383
Table 9. ANOVA results for the full regression model of each response.
ResponseSum of SquaresMean SquareF-ValueP-Value Prob > FRemarks
Slump flow14,431.442886.29516.090.0001Significant
Compressive strength85.5217.1094.290.0017Significant
Elastic modulus80.0916.0243.090.0054Significant
Flexural strength14.042.8158.420.0034Significant
Flexural toughness170.6334.13451.680.0002Significant
Ductility index225.2045.04315.080.0003Significant
Drying shrinkage0.110.022193.650.0006Significant
Table 10. Definitions of factors and responses in the multiobjective optimization problem.
Name of Factors and ResponseGoalLower LimitUpper Limit
W/GP solidsIn range0.220.26
S/FAIn range00.8
Slump flowIn range85182
Compressive strengthMaximize6777.5
Elastic modulusMaximize413.9
Flexural strengthMaximize6.710.7
Flexural toughnessMaximize8.421
Ductility indexMaximize825
Drying shrinkageMinimize0.1380.51
Table 11. Optimized solutions with desirability.
Factors (Variables)Responses (EGC Properties)
W/GP SolidsS/FASlump Flow
(%)
Compressive Strength
(MPa)
Elastic Modulus
(GPa)
Flexural Toughness
(N·m)
Ductility IndexFlexural Strength
(MPa)
Drying Shrinkage
(%)
Desirability
0.2251840.341701116.57477.00812.22621.54621.52010.5950.1850.891
Table 12. Experimental validation of the optimized Mixture.
ResponseSlump Flow
(%)
Compressive Strength
(Mpa)
Elastic Modulus
(Gpa)
Flexural Toughness
(N·m)
Ductility IndexFlexural Strength
(Mpa)
Drying Shrinkage
(%)
Predicted116.57477.00812.22621.54621.52010.5950.185
Experimental121.380.411.822.6120.6511.130.176
Error (%)4.054.43.484.944.044.984.86