Article

Structure and Phase Changes of Nickel Slag in Oxidation Treatment

School of Metallurgical Engineering, Xi’an University of Architecture and Technology; Xi’an 710055, China
*
Author to whom correspondence should be addressed.
Minerals 2020, 10(4), 313; https://doi.org/10.3390/min10040313
Submission received: 26 February 2020 / Revised: 18 March 2020 / Accepted: 28 March 2020 / Published: 31 March 2020

Abstract

:
To overcome the difficulty in the direct reduction of Fe2SiO4 in nickel slag, the isothermal oxidation of the nickel slag was conducted between 300 and 1000 °C. Its morphology and phase composition after oxidation at 300–1000 °C for 5–30 min are analyzed by means of Scanning electron microscopy, X-ray diffraction, and thermodynamic calculation. The results show that oxidation can effectively promote the transformation of Fe2+ into Fe3+ in nickel slag. At 900 °C, the oxidation rate of element Fe reaches 95%. Fe2+ in Fe2SiO4 is oxidized to generate Fe2O3, and the unit cell volume decreases from 301.75 Å3 to 297.72 Å3 with the increase in temperature. At the same time, a large number of pores appear in the particle, which reduces the mass transfer resistance of gas in the particle during the reduction process, accelerates the reduction speed, and is conducive to strengthening the reduction. Therefore, the oxidation treatment of nickel slag can improve its phase composition, thus benefiting the subsequent reduction.

1. Introduction

The nickel slag discharged from the smelting process of nickel sulphide flash furnaces contains valuable metals such as iron, chromium and nickel, and is characterized by high iron grade, making itself an important secondary iron-containing resource [1,2]. However, at present, a considerable amount of nickel slag is piled up, occupying land and polluting the environment. Therefore, it is of economic value and environmental protection significance to utilize smelting slag as a resource. In the hope of extracting and utilizing metals in nickel slag, research has been carried out on leaching valuable metals using hydrometallurgical methods [3], extracting iron using smelting reduction [4,5] and preparing concentrate powder or ferroalloy using direct reduction plus magnetic separation [6,7]. Because of its simple technology, the direct reduction plus magnetic separation technology has been widely recognized by researchers in the realization of efficient separation of valuable elements in complex secondary iron-containing resources. Judging from the resource content, the extraction of iron from nickel slag is of most economic benefit. Nonetheless, iron in nickel slag exists in the form of Fe2SiO4, which is difficult to reduce. Therefore, it has become essential to investigate the additive enhanced reduction [8,9], mechanical activation enhanced reduction, and oxidation enhanced reduction of nickel slag.
Oxidation will enhance reducibility of the slag. In terms of the effect of oxidation on ore, scholars have actively researched, for example, with respect to the oxidation mechanism of ilmenite, the phase micro-transformation and the change in crystal structure behavior in the process of oxidation [10]. Moreover, some have explored the phase composition and morphology change when titania/ferrous oxide solution changed from Fe3O4-Fe2TiO4, titanomagnetite to a-Fe2O3-FeTiO3, titanohematite and pseudobrookite in the process of oxidation [11]. Meanwhile, others studied the effect of oxidation on the reduction behavior of special ilmenite in Panzhihua, and found that the new phases such as pseudorutile and Fe2O3 formed in the oxidation process of ilmenite destroyed the original mineral structure and improved the reduction efficiency [12]. A large number of studies have shown that oxidation can change the structure and phase composition of minerals, which is an effective way to strengthen reduction. Its actual effect depends on the type of minerals, original porosity, chemical composition, morphology of reduction products, properties of reducing agents and other factors [13,14,15]. However, regarding the study of oxidation of nickel slag, there has been a lack of detailed description of phase changes and crystal structure changes during the oxidation of nickel slag, let alone the thorough exploration of mechanism of oxidation. On the other hand, the study of nickel slag oxidation mechanism is of major significance for the comprehensive utilization of nickel slag.
This paper reports on a systematic study of the crystal structure behavior and phase transitions in nickel slag after treatment under different oxidation temperatures and intervals, to clarify the oxidation mechanism of nickel slag and provide a theoretical basis for the direct reduction and magnetic separation of nickel slag after oxidation to recover high-grade ferroalloy products.

2. Materials and Methods

2.1. Experimental Materials

Provided by a nickel smelter in Jinchuan, China, the original nickel slag was blocky. Its main components are listed in Table 1, and TFe refers to the total of iron. The nickel slag was mainly composed of iron, silicon, magnesium and calcium oxides. Fe in the slag was mainly in the form of Fe2SiO4, and there were also a small number of Ni, Cu, and other metal elements, thereby making nickel slag having recycling value.
The X-ray diffraction (XRD, DMAX-RB12kW, Rigaku, Tokyo, Japan) analysis of the nickel slag was shown in Figure 1. Scanning electron microscopy (SEM, Nova400Nano, FEI, New York, NY, USA) image and element map were shown in Figure 2. X-ray diffraction inversion refinement method was used for quantitative phase analysis of various phases in nickel slag. It can be obtained that nickel slag mainly contains 59.9% Fe2SiO4, 38.4% (Fe,Mg)2SiO4, and 1.7% SiO2. As seen in Figure 2, the nickel slag particles were dense in structure, and mainly consisted of elements Fe, O, and Si in large quantities, and elements S, Mg, and Al in small quantities. These particles were mainly composed of Fe2SiO4 formed by Fe, O, and Si and (Fe,Mg)2SiO4 formed by Mg, Fe, O, and Si. SiO2 formed by O and Si was uniformly distributed in the slag. S existed in the slag in the form of small particles, indicating that the sulfide and silicate did not form a solid solution.
Particle size distribution of milled nickel slag and the equipment for nickel slag oxidation are shown in Figure 3 and Figure 4, respectively.

2.2. Phase Structure Characterization

After being oxidated under different conditions, the samples were cut along the radial axis. Half of them remained in the state of block, with their microstructure change to be observed by a scanning electron microscope (Nova400Nano, FEI, New York, NY, USA) and an energy dispersive spectrometer using an acceleration voltage of 15 kV. The mineral composition of the other half was analyzed by a rotating anode diffractometer (DMAX-RB12kW, Rigaku, Tokyo, Japan). The major measurement parameters were: Cu-Kα radiation λ = 1.54050, 42 kV, 100 mA, and step size 0.026°. The contents of Fe3+ and TFe in the samples were analyzed by composition analysis chemically.
α = Fe 3 + TFe   ×   100 %
In Formula (1), α was the oxidation degree of Fe, %; Fe3+ and TFe were the relative contents of Fe3+ and total iron in the oxidized nickel slag, respectively, %, where Fe3+ = TFe − Fe2+.

3. Results

3.1. Change in Fe Oxidation Rate in Oxidation

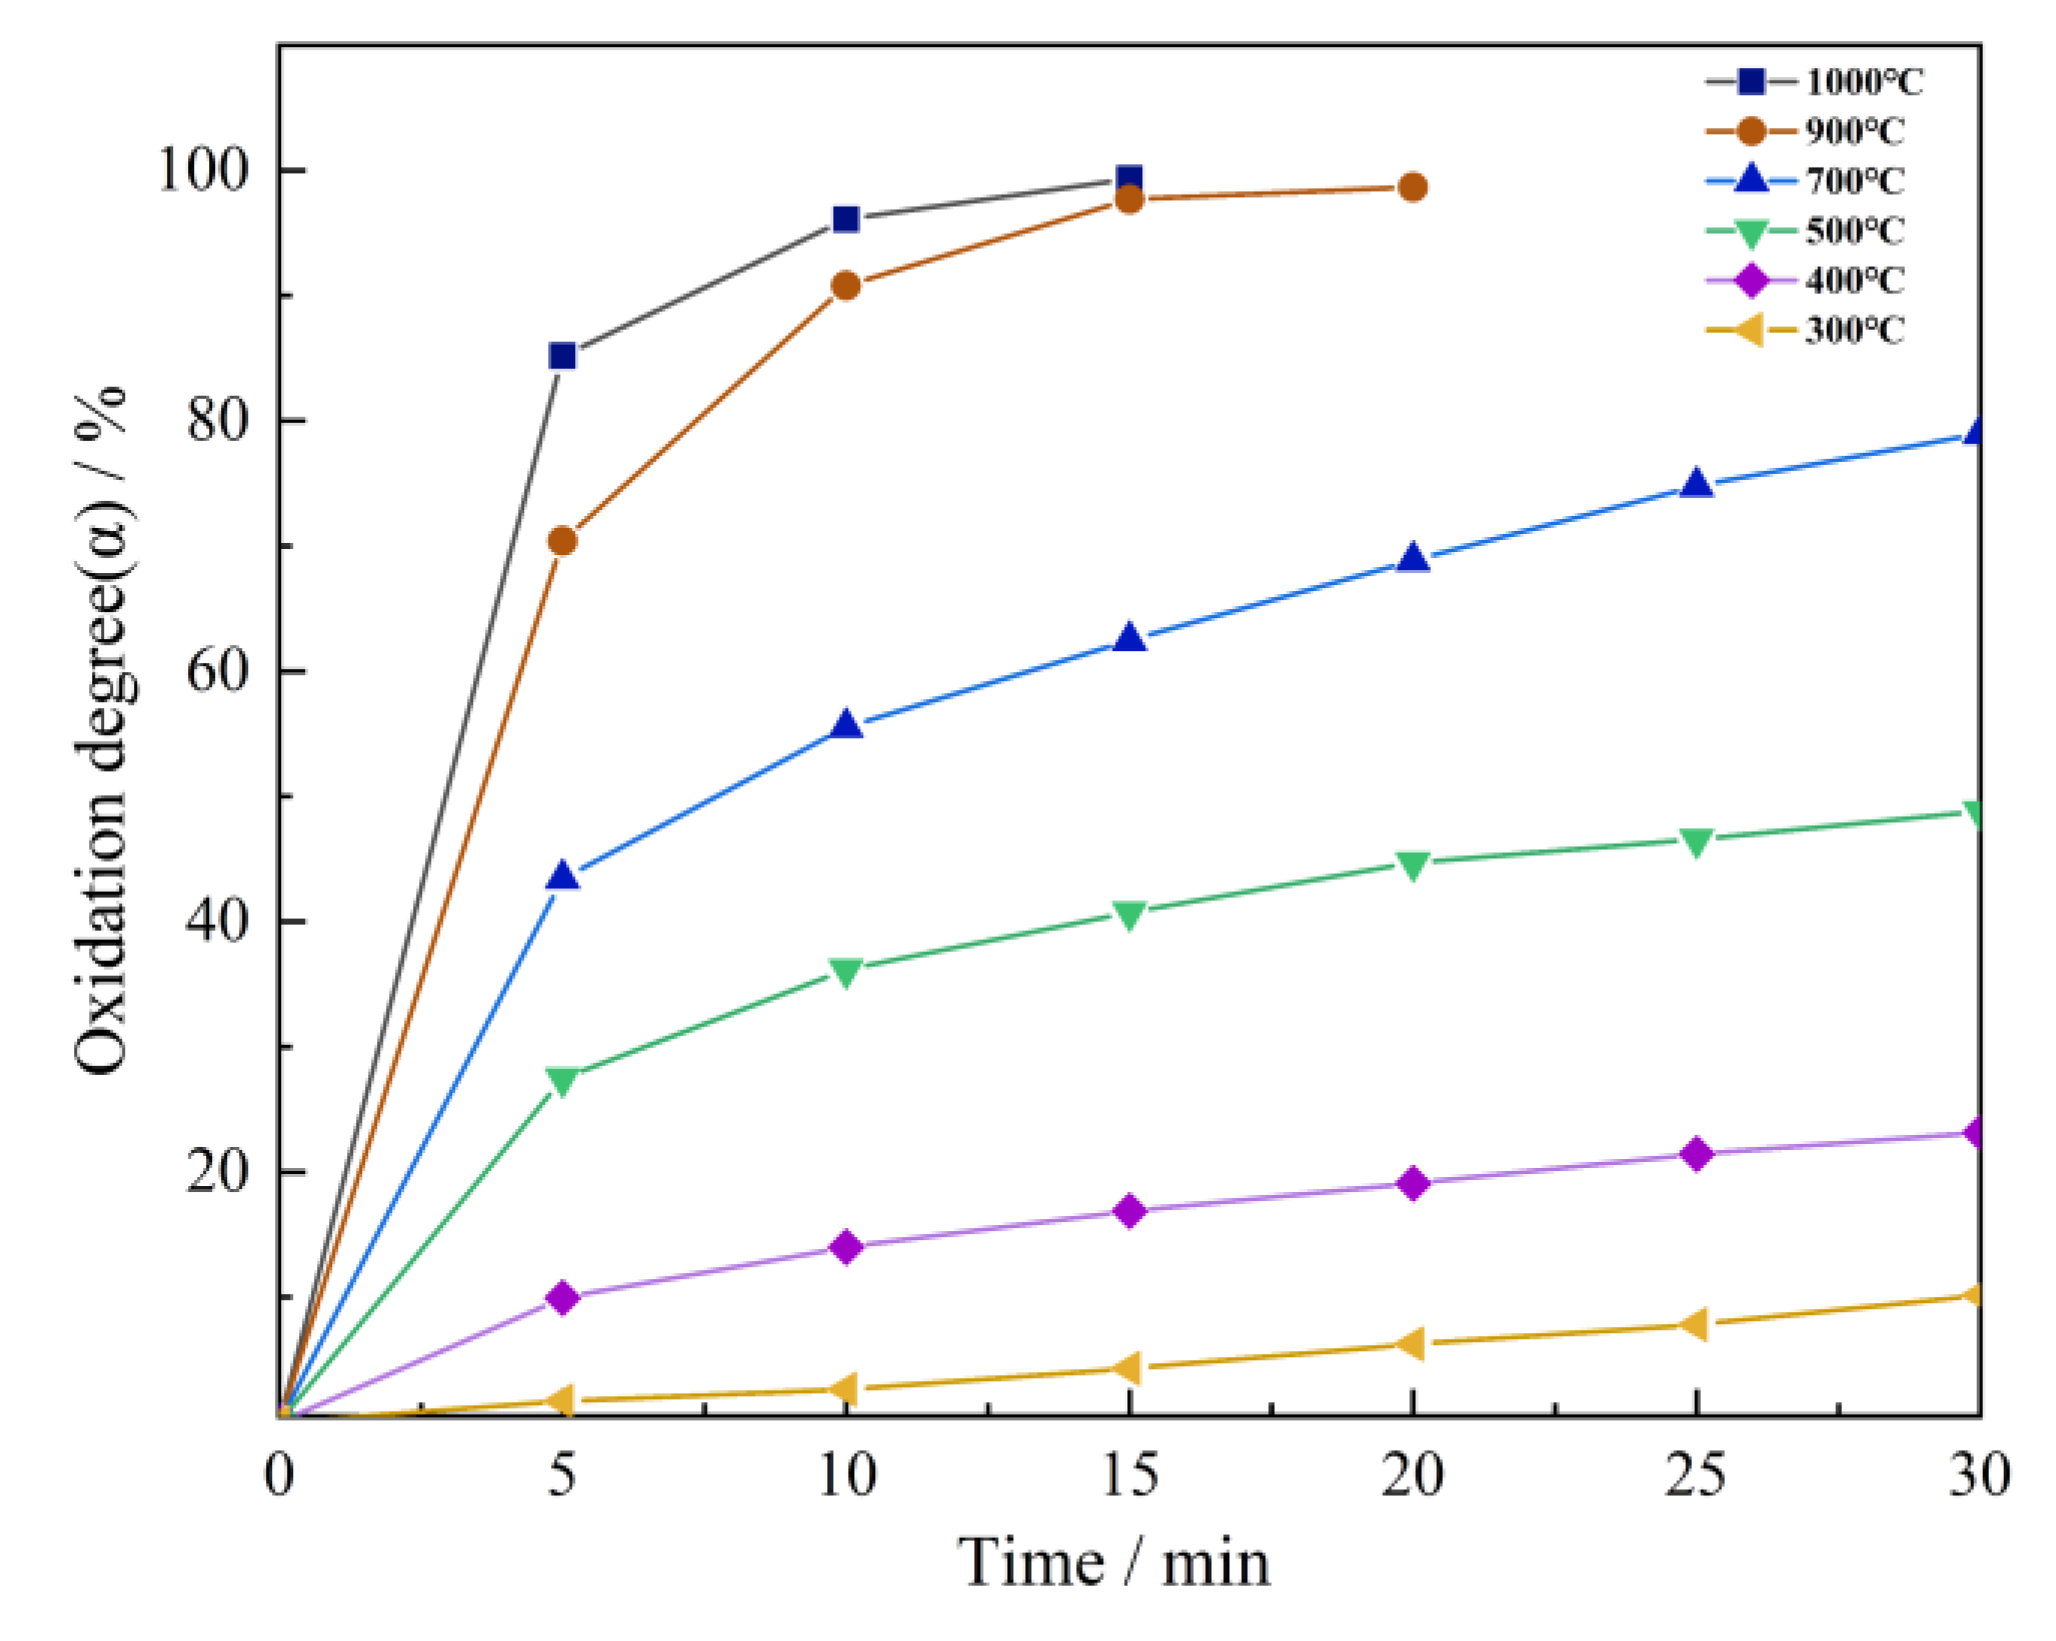
Nickel slag samples were oxidized for 5–30 min at different temperatures, with their oxidation degree shown in Figure 5. The oxidation degree changed greatly with the increase in time and temperature. At a high temperature, the oxidation degree increased significantly in the first 5 min. When the oxidation temperature reached 300 °C, 400 °C, and 500 °C, respectively, the oxidation degree increased slightly with the increase in oxidation time. When the reaction proceeded for 30 min, the oxidation degree of nickel slag samples was in a slow rising tendency, namely less than 50%. With the increase in oxidation temperature, the oxidation degree rose. When the temperature was 700 °C, the oxidation degree varied considerably with time, and the oxidation degree was close to 70% after 30 min of reaction. The oxidation temperature increased to 900–1000 °C, and the oxidation degree increased significantly, especially in the first 5 min. The degree of oxidation tended to stabilize after 15 min of oxidation, reaching more than 95%. This was due to the accelerating rate of molecular diffusion at high temperatures helping reach a high degree of oxidation in a short time.

3.2. Phase Change in Oxidation

Figure 6 exhibited the XRD analysis results of the phase composition of nickel slag samples after oxidation for 30 min at 300 °C, 400 °C, 500 °C, 700 °C, 900 °C, and 1000 °C, respectively. At 300 °C, the degree of oxidation was low and the phase composition of samples remained basically unchanged. There only appeared a small number of characteristic peaks of Fe2O3 and characteristic diffraction peaks of Fe3O4. When the temperature increased to 500 °C, the characteristic peaks of Fe3O4 increased slightly, while the characteristic diffraction peaks of Fe2SiO4 and (Fe,Mg)2SiO4 decreased significantly. When the oxidation temperature reached 700 °C, the characteristic diffraction peak intensity of Fe3O4 and Fe2O3 found in the oxidized products increased further, while the characteristic peaks of Fe2SiO4 and Fe2SiO4 were not observed. The solid solution quantity of MgO in Fe2SiO4 dropped, and Mg mainly existed in the slag in the form of Mg2SiO4. As the oxidation temperature continued to go up to 900 °C, no new phase was noticed in the oxidized products, and the characteristic peak intensity of high-valence iron oxides increased notably. At 1000 °C, the characteristic peak of each phase barely differed from that at 900 °C. Therefore, the oxidation at 900 °C was preferred from the perspective of energy saving.
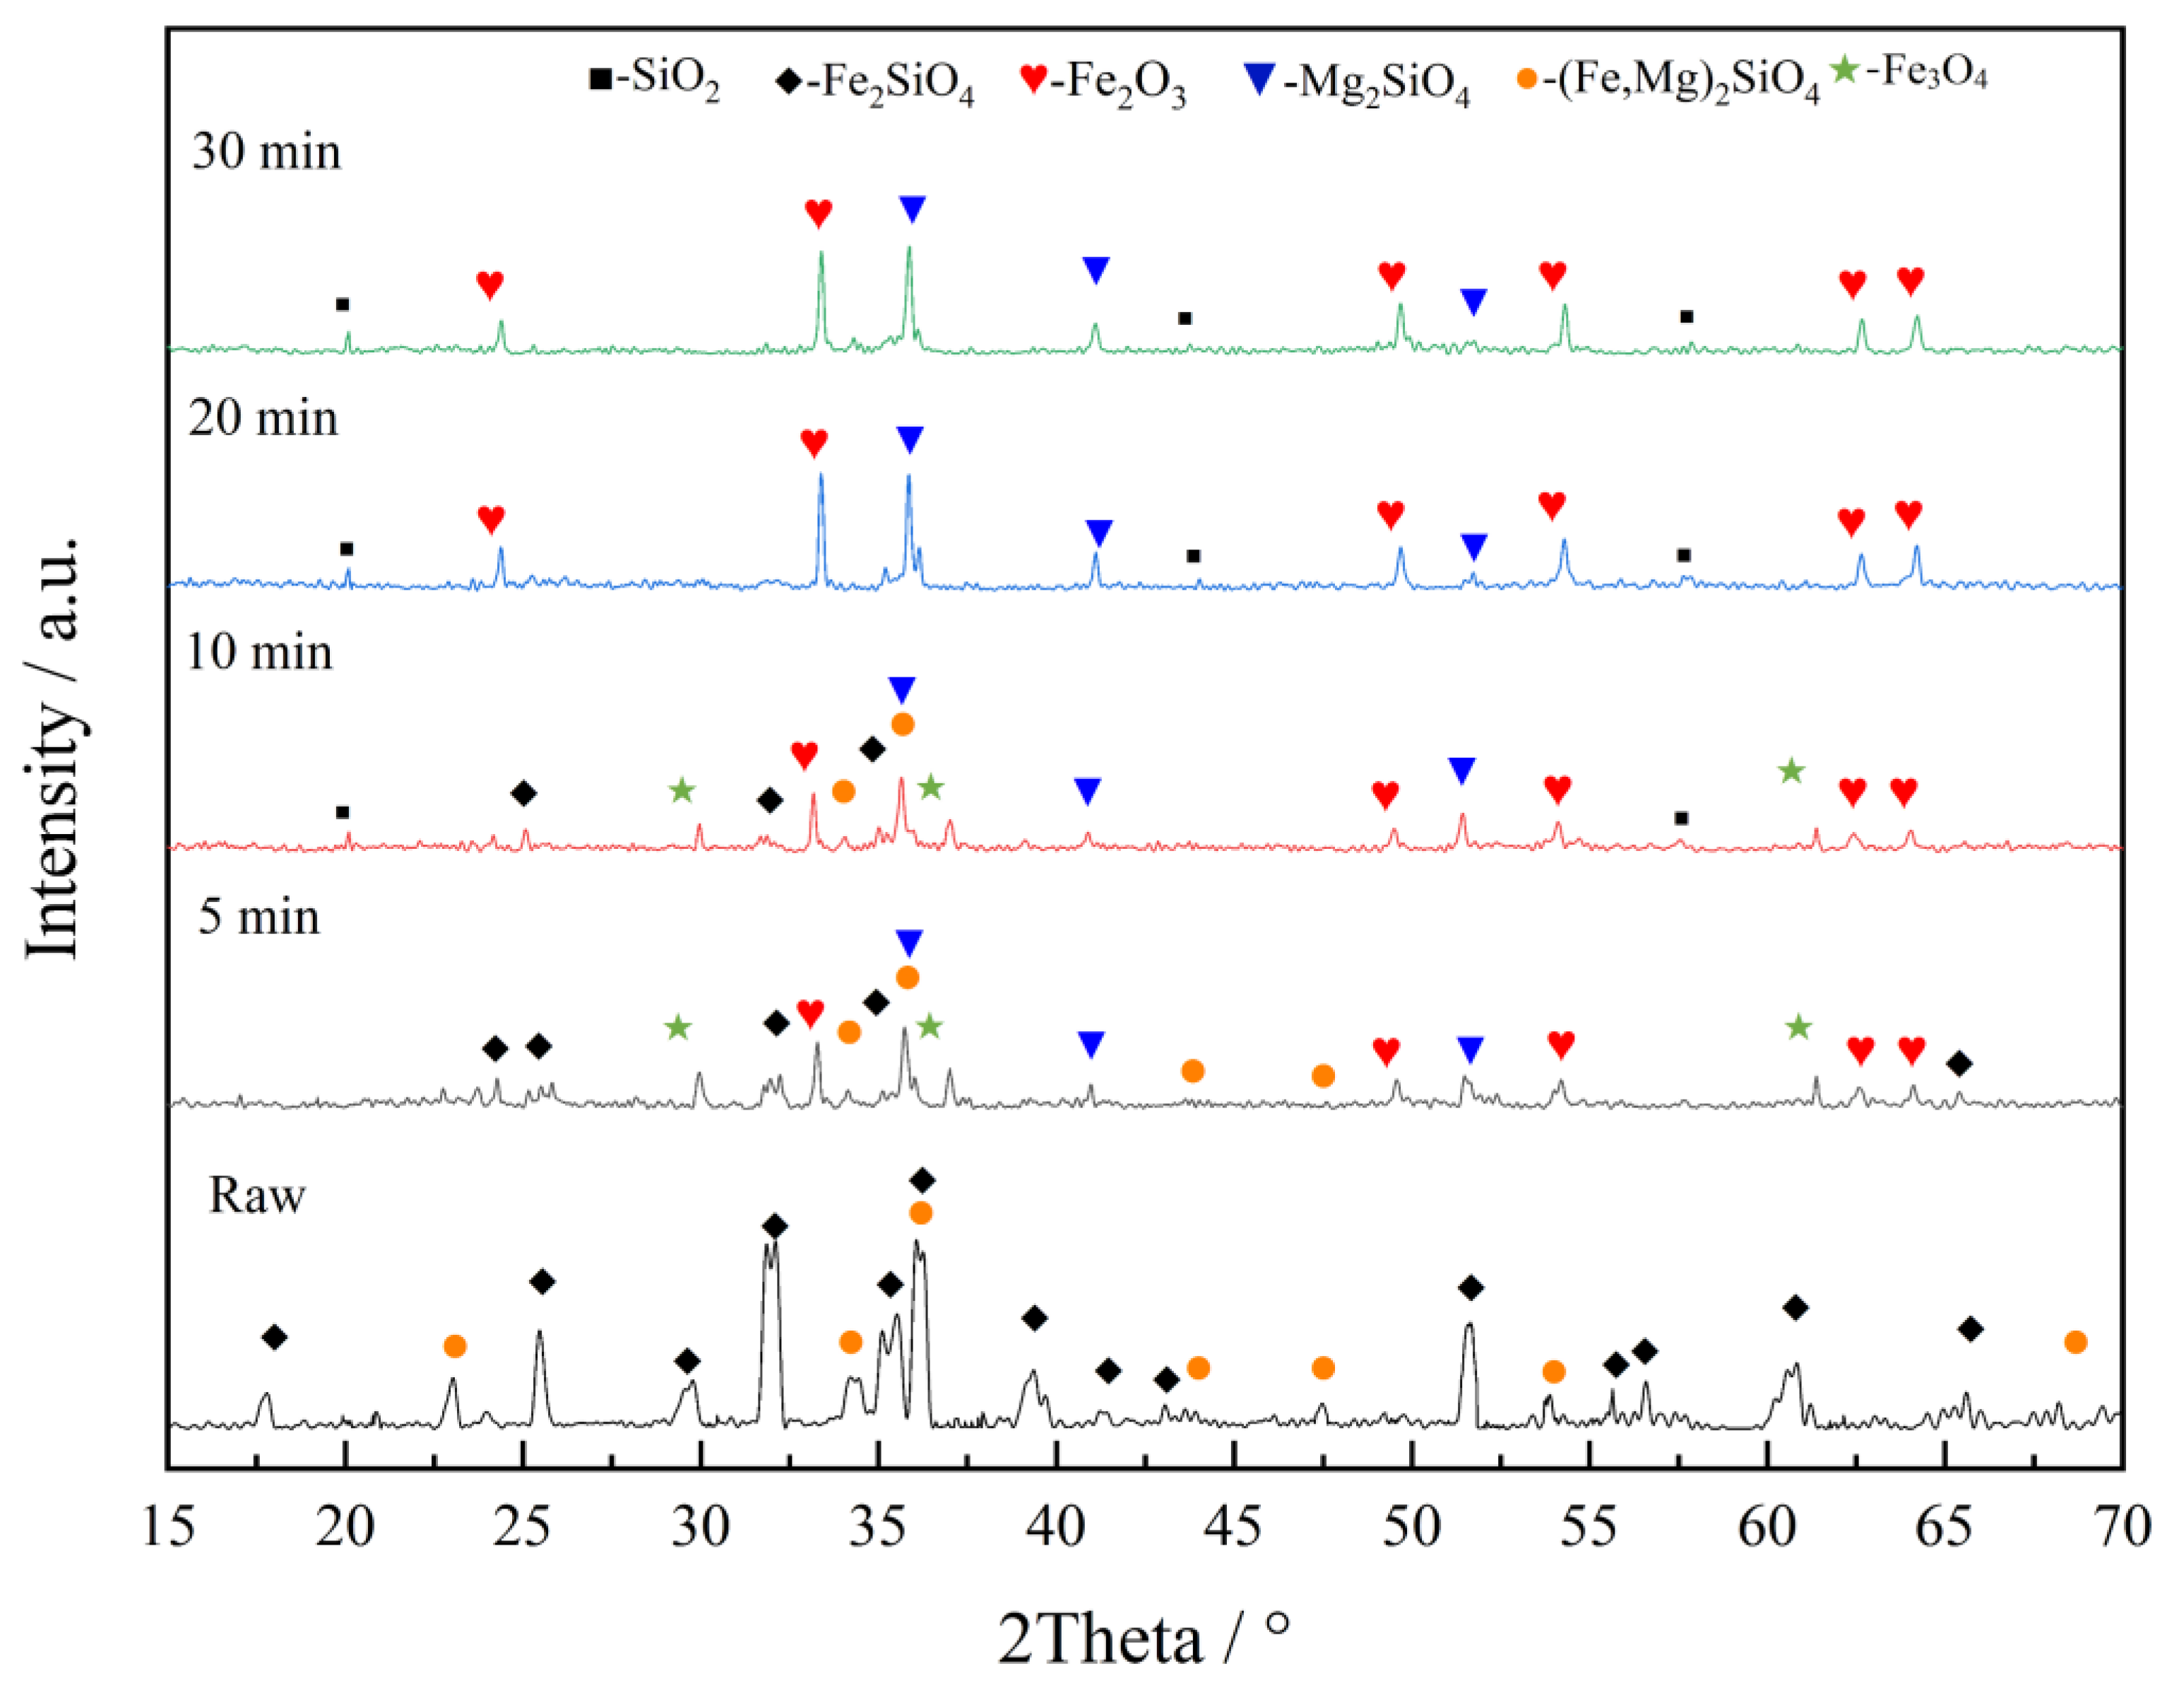
Figure 7 presented the XRD patterns of nickel slag samples after oxidation at 900 °C in different intervals. When oxidized at 900 °C for 5 min, the samples consisted of a large amount of Fe3O4 and a small amount of Fe2O3. The rest of iron was mainly in the form of (Fe,Mg)2SiO4 and Fe2SiO4. When the oxidation time increased from 5 min to 10 min, the characteristic diffraction peaks of (Fe,Mg)2SiO4 and Fe3O4 decreased slightly, while those of Fe2O3 seldom changed. When the oxidation time increased to 20 min, the characteristic peaks of Fe3O4, Fe2SiO4 and (Fe,Mg)2SiO4 were not observed, while the intensity of the characteristic diffraction peaks of Fe2O3 increased significantly. With the increase in oxidation time, no new phase appeared. Therefore, it could be inferred that, after the oxidation of nickel slag at 900 °C for 20 min, Fe2+ in the samples was completely oxidized to Fe3+.

3.3. Microstructure Change in Nickel Slag in Oxidation

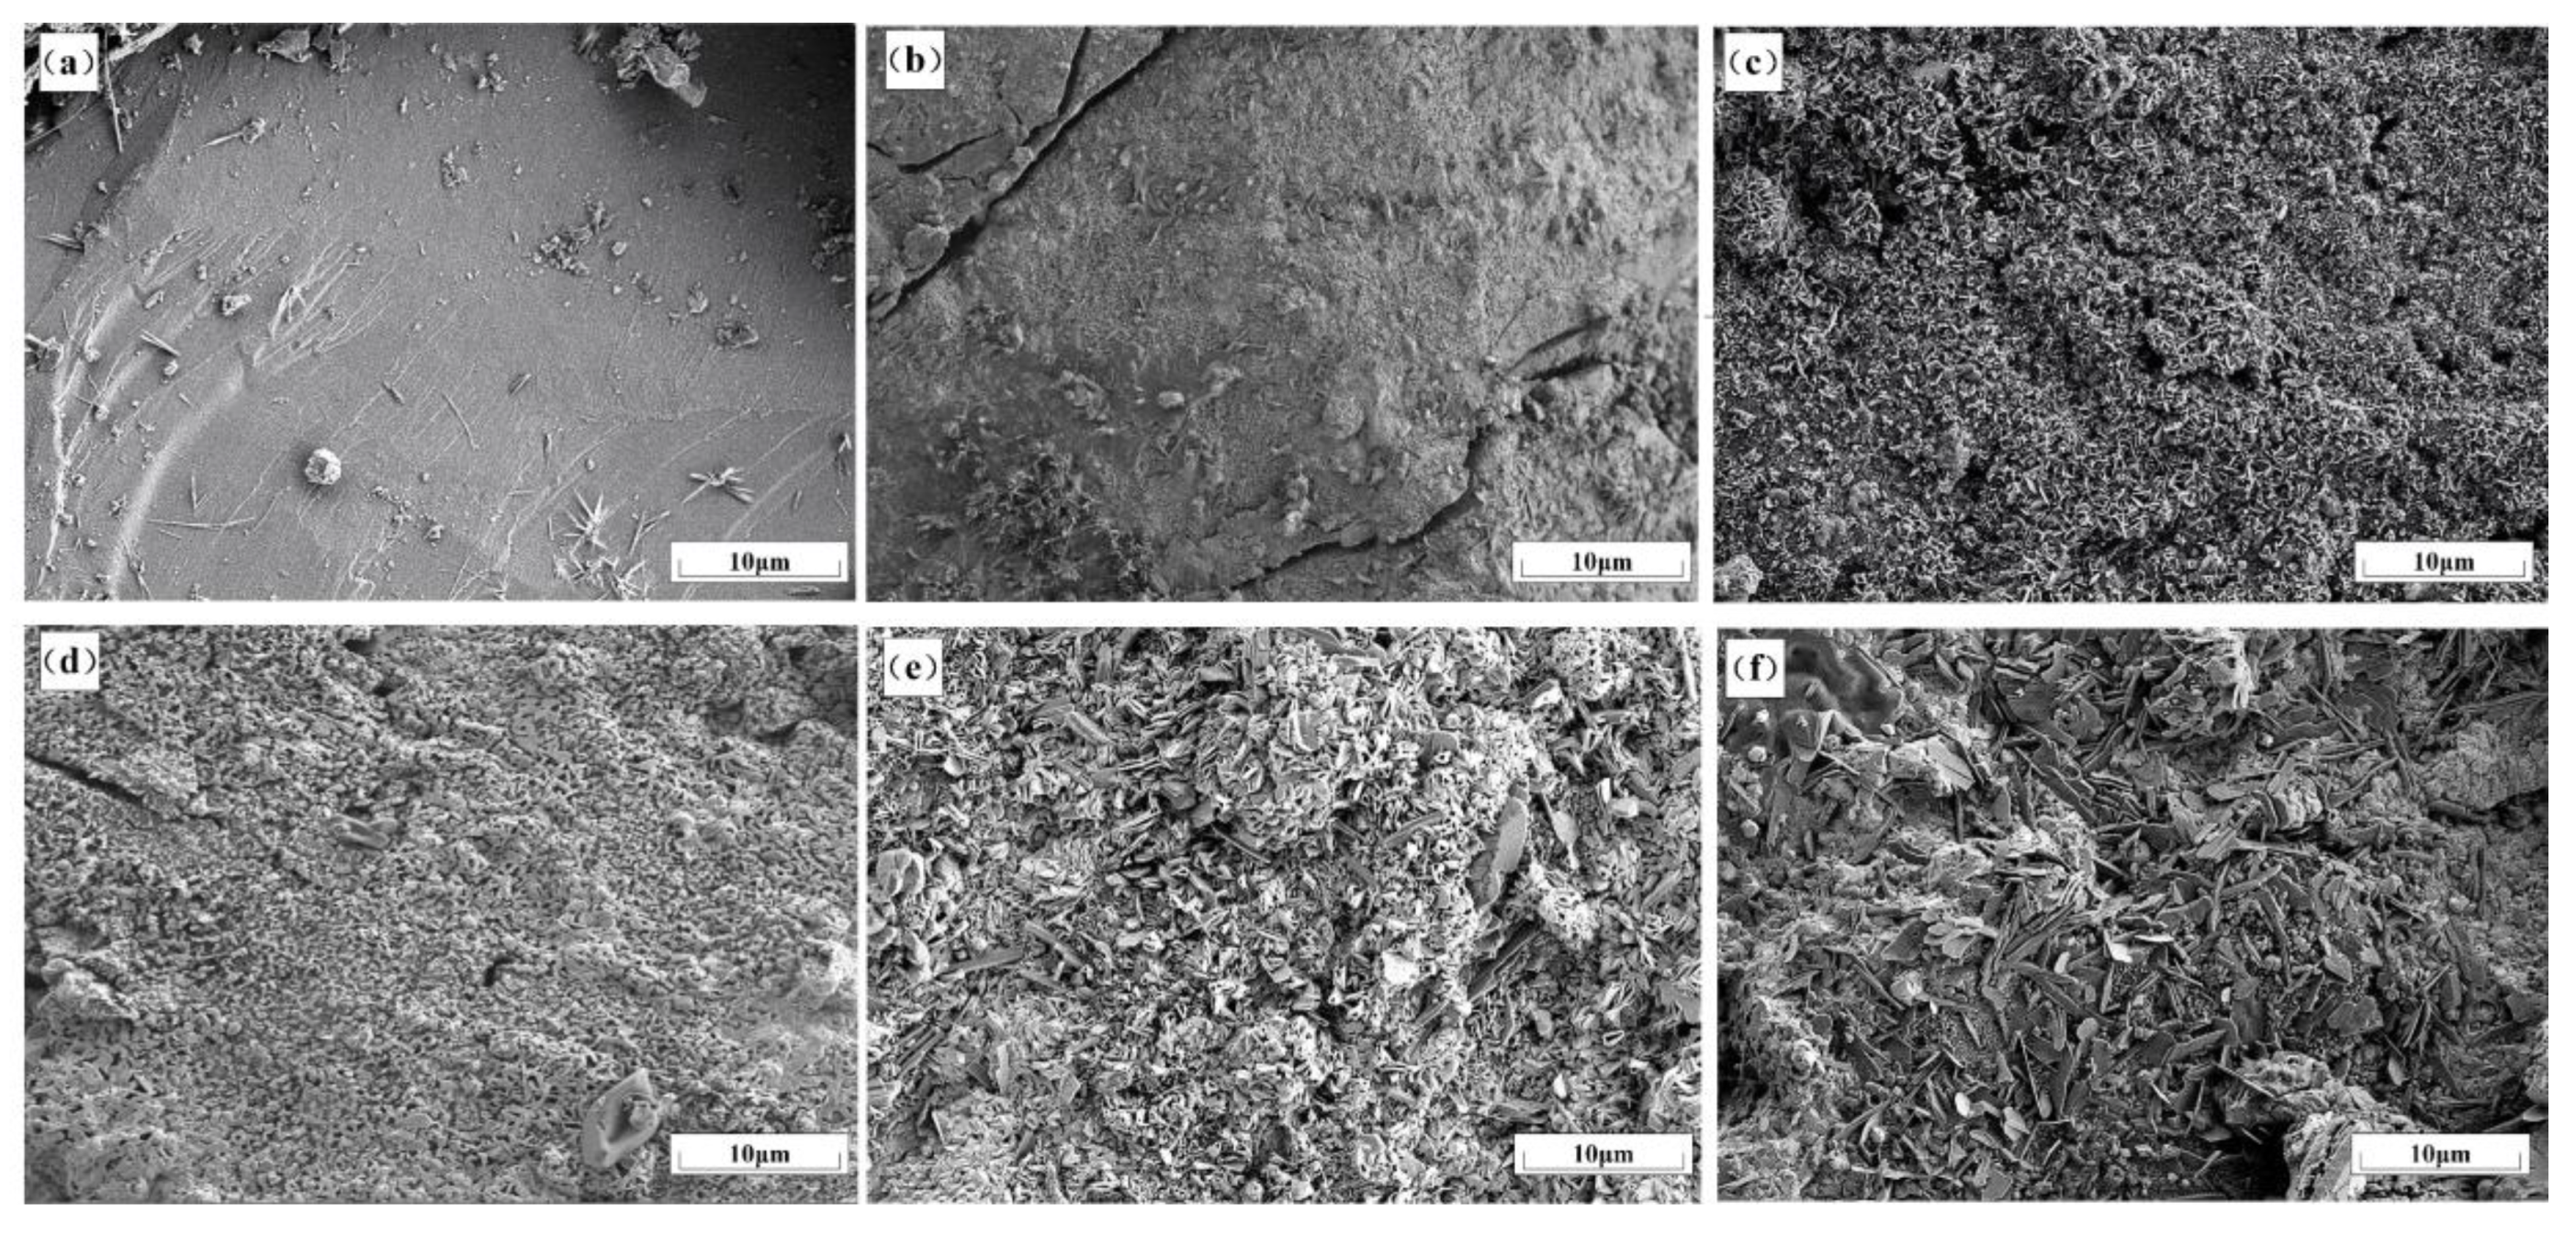
Nickel slag formed a new phase during oxidation, which would lead to the destruction of the original mineral structure. In order to confirm this hypothesis, the microstructure of oxidized samples was studied. Figure 8 showed the microstructure of nickel slag samples after oxidation for 20 min at 300 °C, 400 °C, 500 °C, 700 °C, 900 °C, and 1000 °C respectively. To be specific, at an oxidation temperature of 300 °C, the sample structure barely changed, and the surface was relatively flat. It could be seen that a small number of white fine-grained iron oxides appeared on the surface of the nickel slag. When the oxidation temperature reached 400 °C, the morphology of samples varied significantly, and the surface became rough gradually. When the oxidation temperature continued to rise to 500 °C, a large number of pores could be observed on the surface of samples, and the pore size was ≤2 μm generally. When the oxidation temperature was 700 °C, the pores began to extend to the interior, the samples became increasingly irregular in terms of structure and were finally concentrated in a network structure, and the pores gradually become larger. When the oxidation temperature rose to 900 °C, the microstructure of the sample changed greatly. Porosity increases significantly, forming a large amount of hematite. However, when the oxidation temperature increased to 1000 °C, the surface of samples showed a flaky structure and the pores declined.
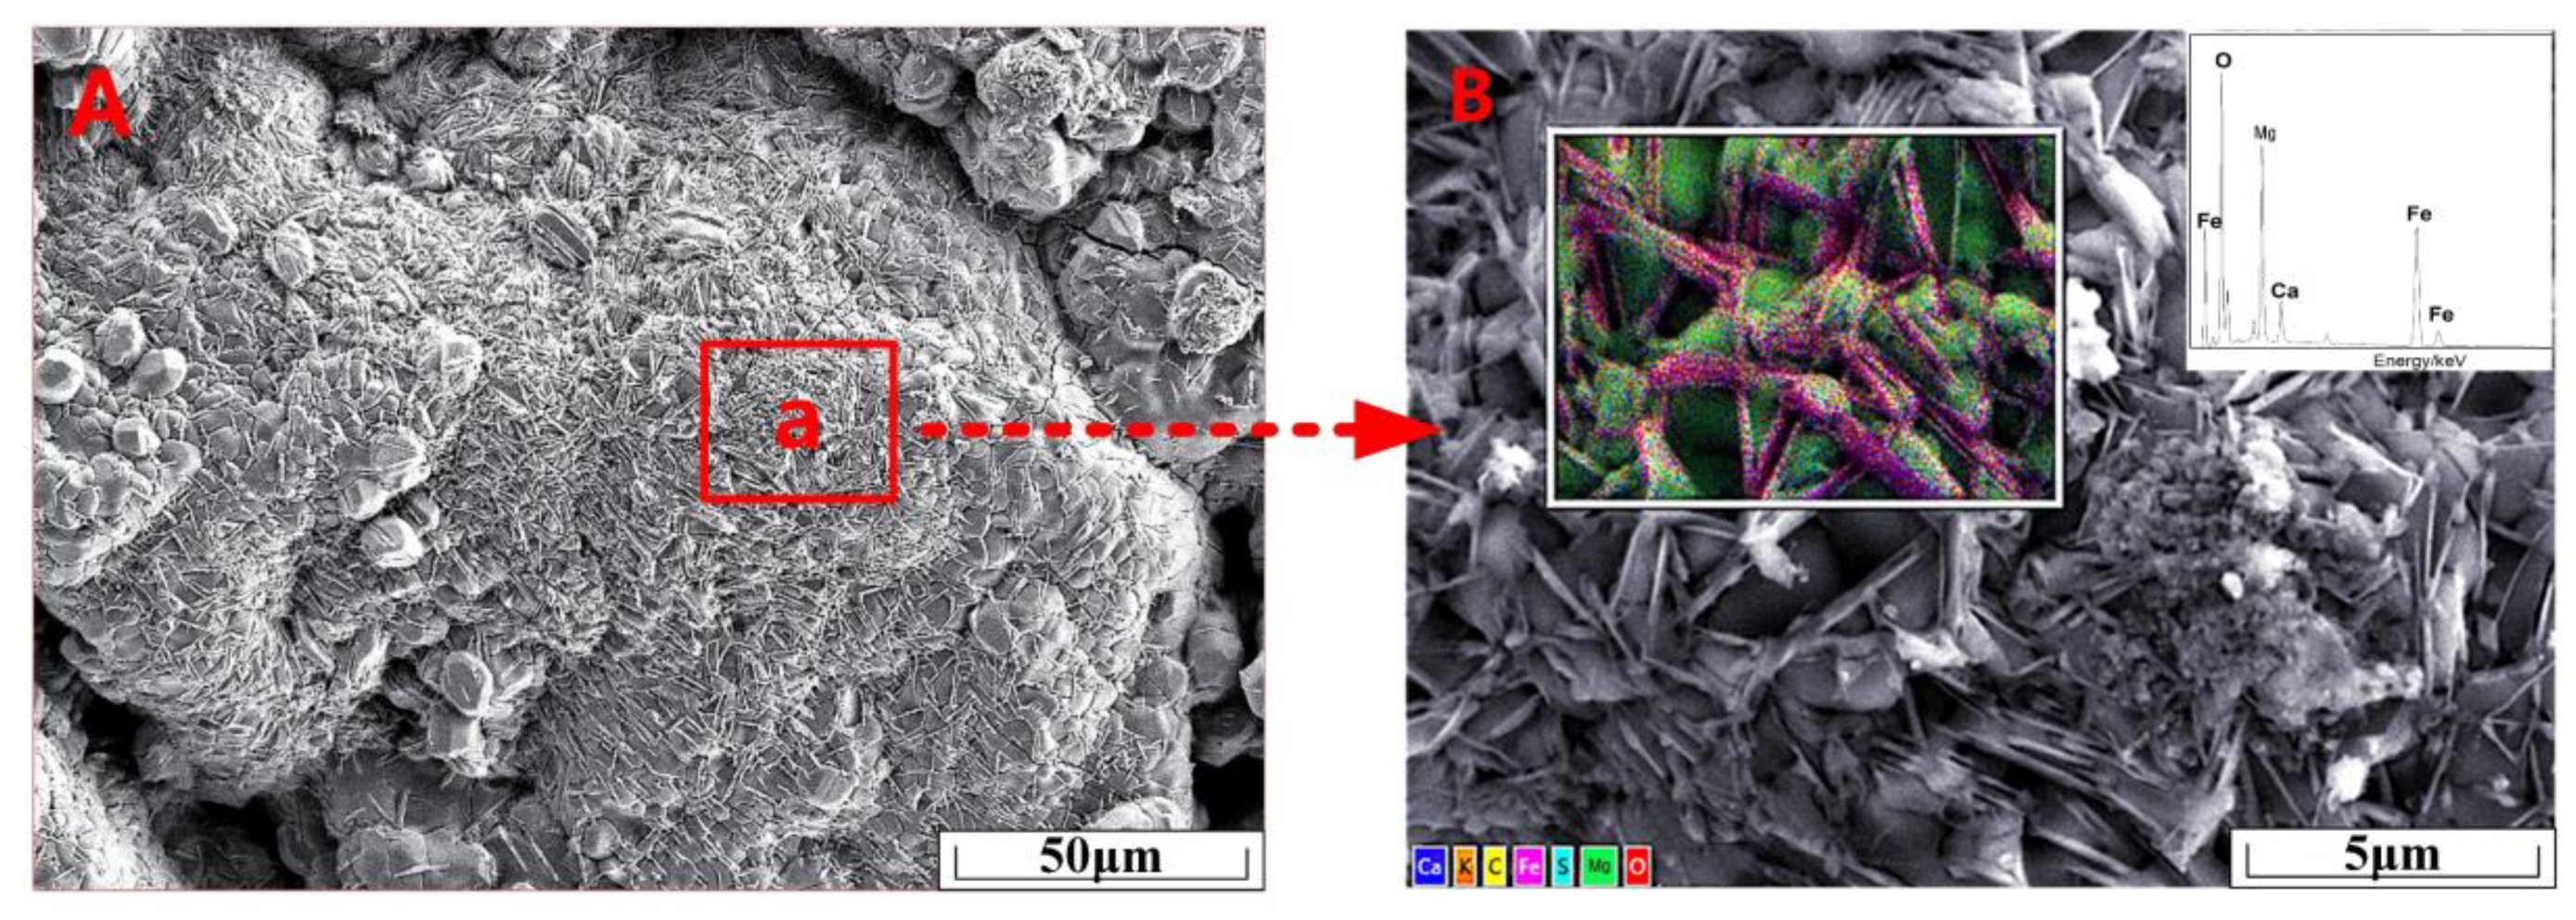
The SEM photos and analysis results of nickel slag samples after oxidation at 900 °C for 30 min were shown in Figure 9. Region a in Figure 9A was studied based on the energy spectrum analysis, results implied in Figure 9B. It was clear from the SEM image that flaky crystallites were formed. After oxidation, there were O, Fe, Mg, S, and other elements in the nickel slag, whose distribution was indicated by the results of surface scanning in the rectangular area. It could be clearly seen that Fe and O elements overlapped frequently, and that Fe in the nickel slag after oxidation mainly existed in the form of iron oxide. At the same time, Mg elements were distributed around Fe2O3 in the form of Mg2SiO4.

3.4. Crystal Structure Behavior during Oxidation in Nickel Slag

The XRD analysis results of nickel slag samples after oxidation for 30 min at 400 °C and 900 °C respectively are shown in Figure 10. The microstructure of iron-containing phase in the nickel slag changed with the oxidation. Compared with 400 °C, unstable β-Fe2O3 in the oxidized samples changed into stable α-Fe2O3 when the oxidation temperature was 900 °C; the decrease in unit cell volume of Fe2O3 was caused by the crystal transformation from cubic lattice into hexahedral lattice.
In order to obtain accurate crystallographic parameter data, the nickel slag samples were scanned slowly. Through the XRD data, the unit cell dimension and volume (V) with the computational tolerances were determined, as observed in Table 2, Table 3 and Table 4.
According to Table 2, the unit cell volume of Fe2O3 decreased with the increase in oxidation temperature, and was gradually close to the ideal unit cell size of Fe2O3 (V = 297.52 Å3). When the oxidation temperature increased from 400 °C to 1000 °C, the unit cell parameters a and c of Fe2O3 decreased from 5.0342 Å and 13.7483 Å to 5.0142 Å and 13.6733 Å, respectively, and the unit cell volume decreased from 301.75 Å3 to 297.72 Å3. Therefore, the deeper the oxidation degree of nickel slag samples was, the greater the lattice shrinkage along the a-axis and c-axis became, and the more the oxygen entering the lattice, the smaller the unit cell parameters a value and volume became; and vice versa. Based on Table 3, the unit cell parameters of Fe2SiO4 in the samples without oxidation were close to the ideal size (V = 301.70 Å3), indicating that element Fe in the samples was stable in the form of Fe2SiO4 at this time. When the oxidation temperature ranged between 300–500 °C, the unit cell parameters of Fe2SiO4 increased gradually, with a, b and c increasing from 5.7012 Å, 10.3312 Å and 4.7628 Å to 6.1147 Å, 10.4716 Å and 4.8265 Å respectively; the unit cell volume increased from 302.59 Å3 to 309.03 Å3, and deviated from the ideal value. With the increase in Fe2SiO4 unit cell volume, the stability of its structure was destroyed. More Fe elements in nickel slag existed in the form of iron oxide. According to Table 4, at an oxidation temperature of 700–1000 °C, the unit cell volume of Mg2SiO4 declined slightly, with a, b and c decreasing from 5.6972 Å, 11.5185 Å and 8.2440 Å to 5.6816 Å, 11.4031 Å and 8.2068 Å respectively; the unit cell volume decreased from 540.99 Å3 to 538.72 Å3, and was close to the ideal value (V = 537.65 Å3). At this point, Fe2+ in the fayalite was oxidized to Fe3+, which caused the destruction of the structure of the fayalite, thus forming Fe2O3 and Mg2SiO4. As the oxidation temperature increased, the degree of oxidation increased, which meant that the increase in temperature was conducive to improving oxidation.

3.5. Mechanism Analysis

According to the XRD analysis of different oxidation temperatures, the following reactions occurred during the isothermal oxidation of nickel slag:
3 Fe 2 SiO 4 + O 2 = 2 Fe 3 O 4 + 3 SiO 2
2 Fe 2 SiO 4 + O 2 = 2 Fe 2 O 3 + 2 SiO 2
4 Fe 3 O 4 + O 2 = 6 Fe 2 O 3
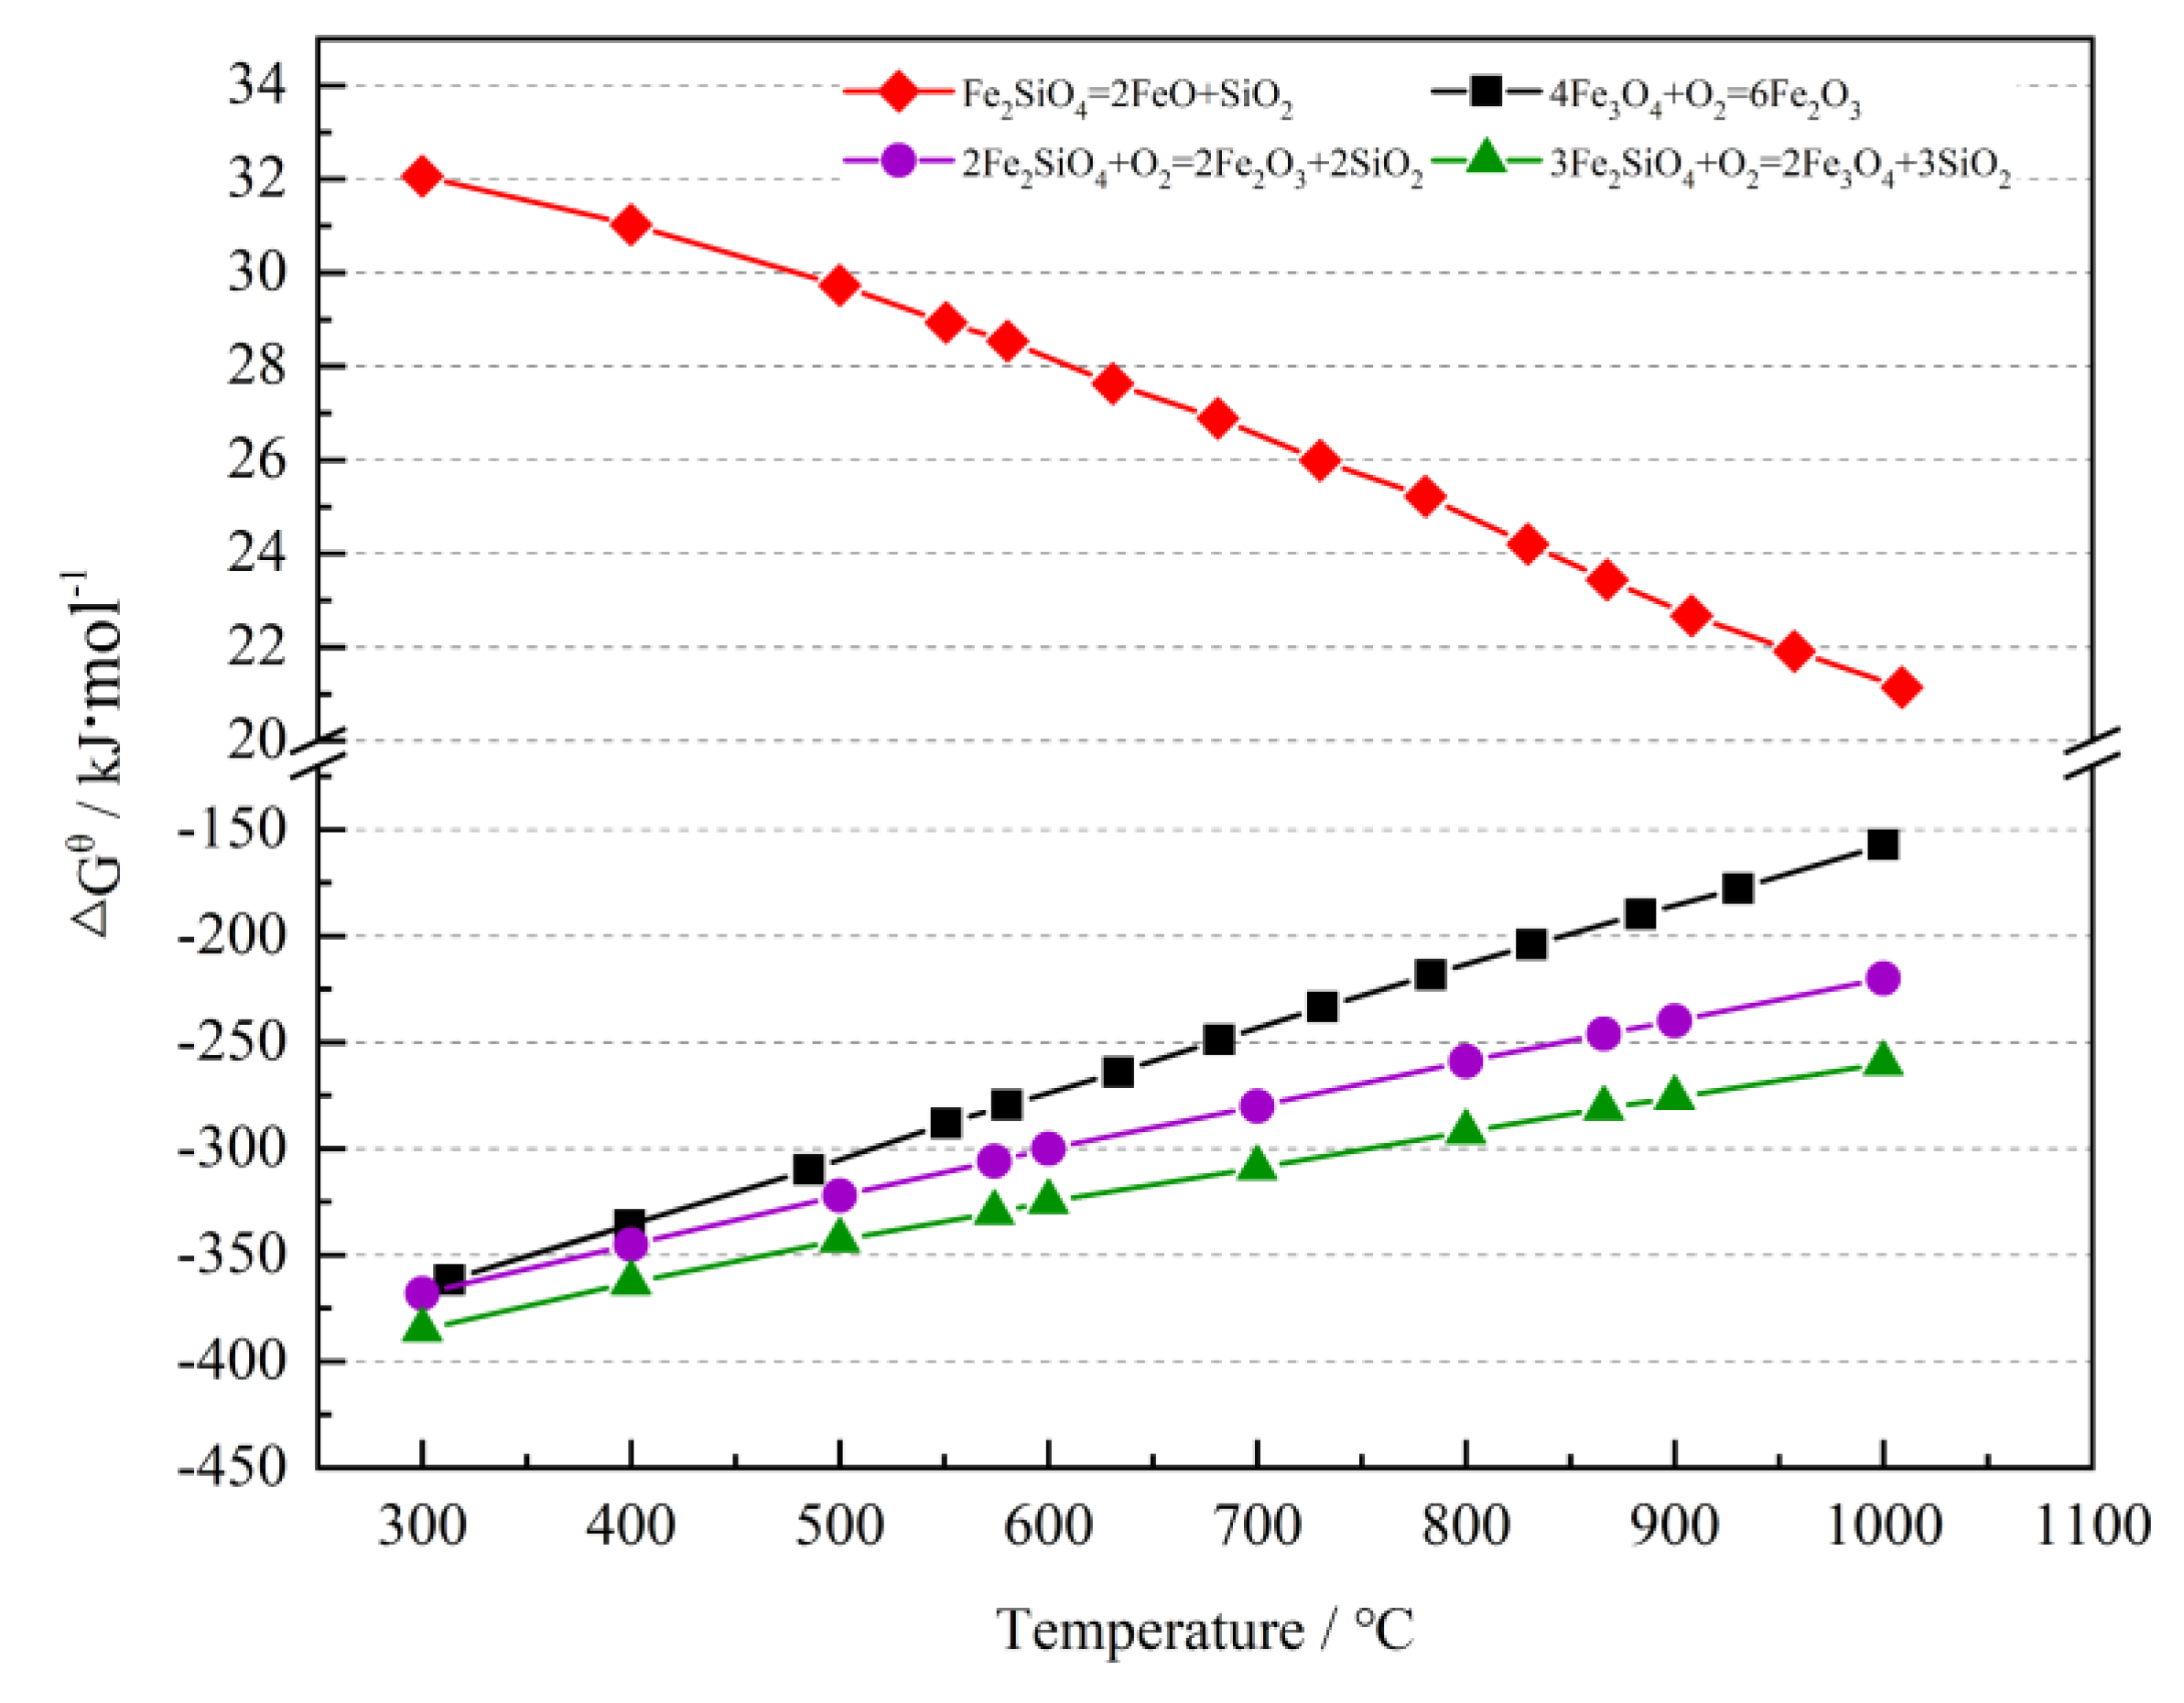
To better explore the oxidation process of Fe2+ in nickel slag, the “Reaction” module in FactSage 7.0 (Thermfact, Montreal, QC, Canada; GTT-Technologies, Ahern, Germany) was used to calculate the thermodynamic analysis of Fe2SiO4 oxidation. The results are shown in Figure 11.
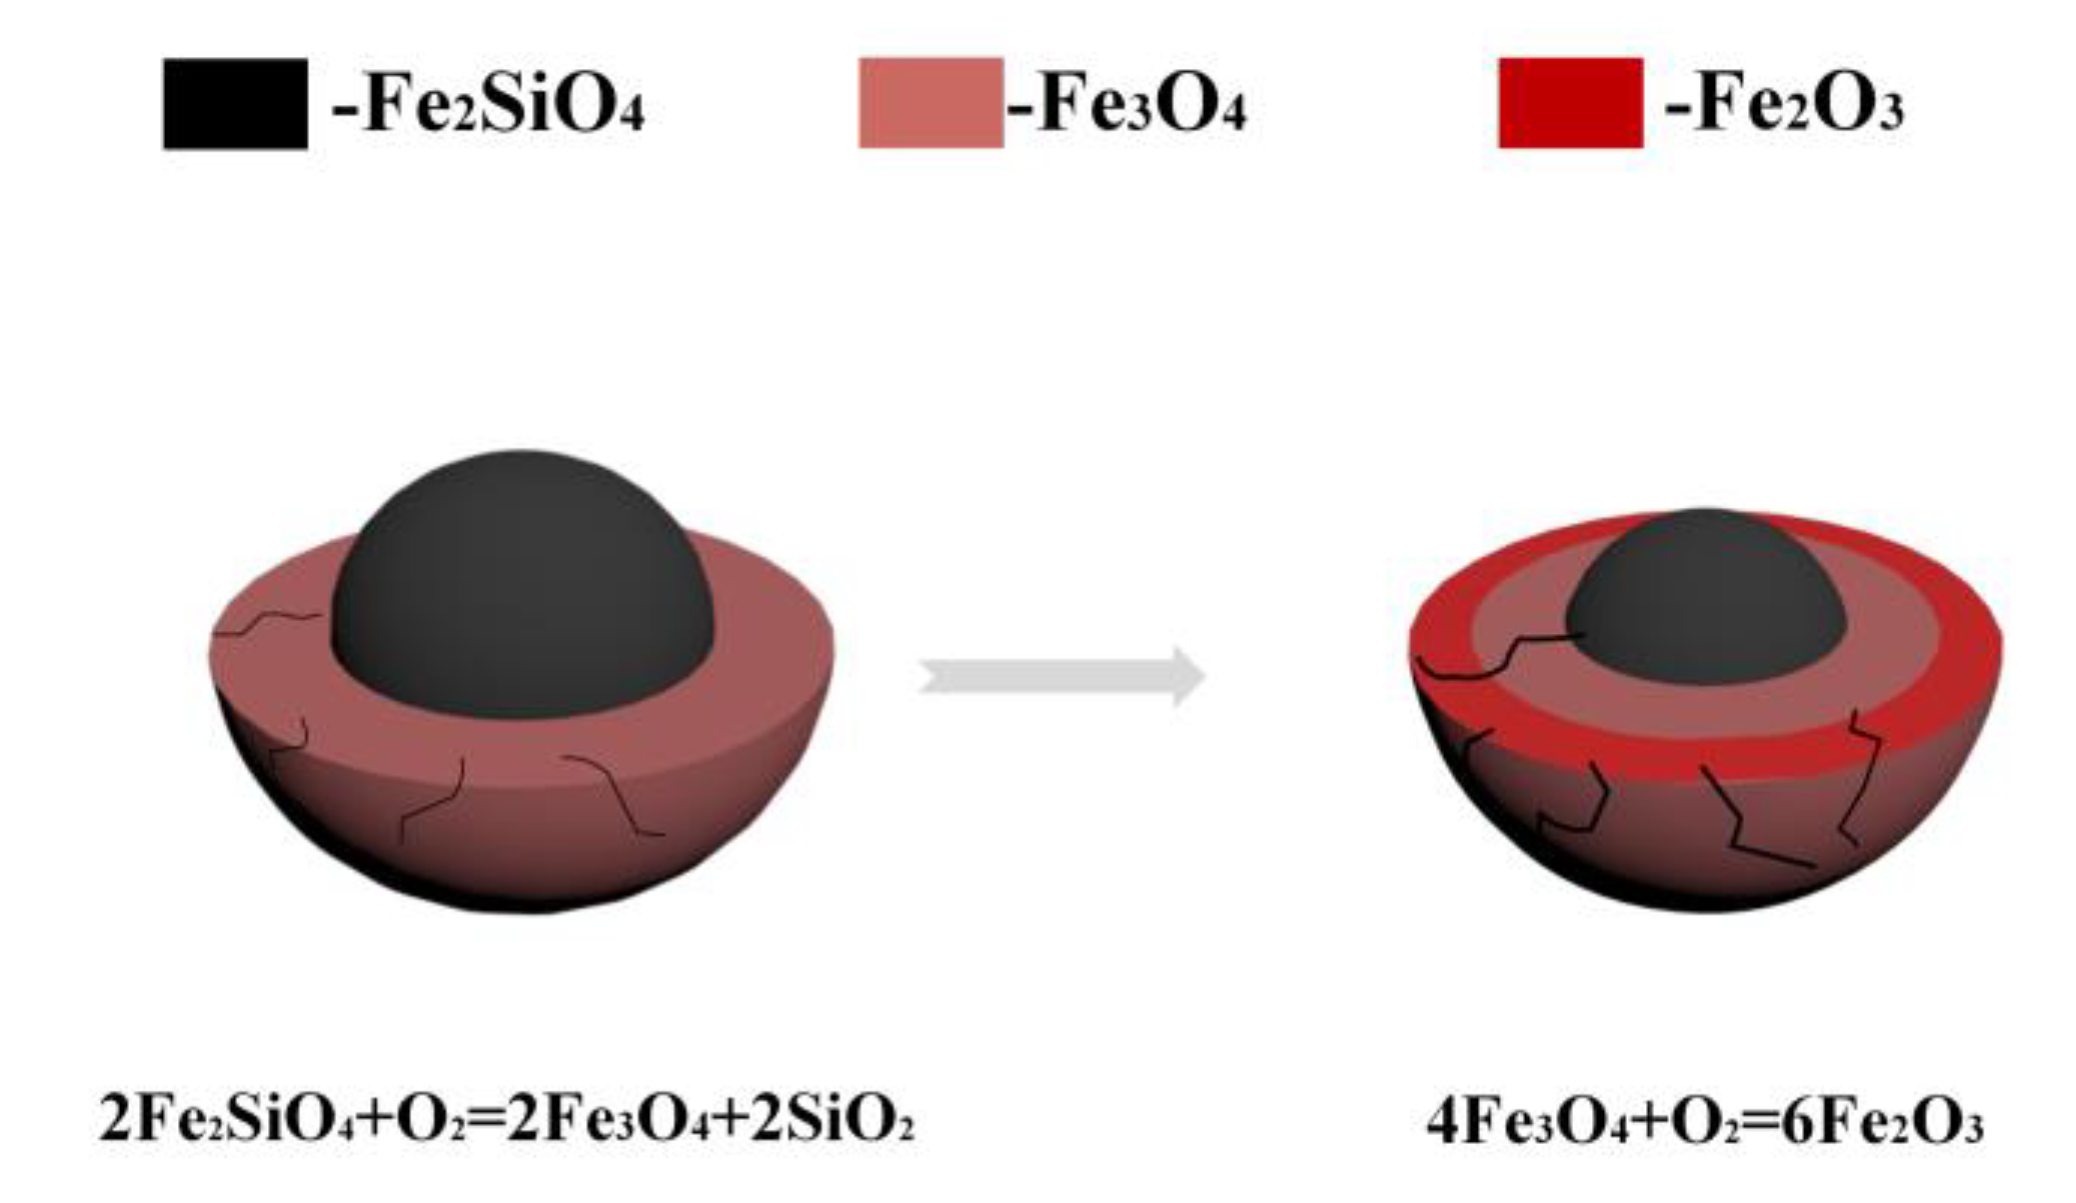
Figure 11 implies the relationship between the standard free energy (ΔGθ) of Fe2SiO4 oxidation and temperature. It could be seen from Figure 11 that the ΔGθ resulting from the decomposition of Fe2SiO4 decreased with the increase in temperature. When the temperature was 1000 °C, the ΔGθ was larger than 0, indicating that Fe2SiO4 was highly stable at high temperature and that it was difficult to dissociate free FeO. This was mainly due to the complex structure of SixOyz in water quenched nickel slag, which made Fe2SiO4 hard to decompose. Fe2+ in the nickel slag was oxidized to Fe3O4 by reaction Formula (2), thereby realizing the selective enrichment from iron to magnetite Fe3O4. Besides, the ΔGθ of Fe3O4 generated by direct reaction of Fe2SiO4 was smaller than that of Fe2O3 generated by Fe3O4, which indicated that the formation and decomposition of iron oxides should follow the principle of gradual transformation: Fe 2 SiO 4 Fe 3 O 4 Fe 2 O 3 . The reaction mechanism is shown in Figure 12.
The final reaction products and structure of oxidation varied with the change in reaction temperature. After oxidation, phase transformation occurred, and the structure changed greatly, forming a large number of cracks which significantly increased the effective surface area of nickel slag, and further suggesting different controlling factors in the oxidation process. To go into detail, Fe2SiO4 produced fewer iron oxides at lower oxidation temperatures, at which point there were fewer cracks in the slag and lower porosity. When the oxidation temperature increased, a certain amount of oxide layer was produced in the slag and the surface roughness increased. At this time, the porosity increased, which was more conducive to the oxidation reaction.

4. Conclusions

(1) Oxidation can effectively promote the transformation of Fe2+ into Fe3+ in nickel slag. When the oxidation temperature is 900 °C, the oxidation degree of the sample is improved. The extent of oxidation reaches 95% within 20 min.
(2) New phases are formed in the oxidation process, and the iron in the sample experiences the phase transformation Fe2SiO4 → Fe3O4 → Fe2O3. The increase in oxidation temperature is beneficial to the stability of Fe2O3, and the unit cell volume of Fe2O3 decreases from 301.75 Å3 to 297.72 Å3. However, after oxidation, the stability of Fe2SiO4 structure is destroyed, and the unit cell volume increases from 302.59 Å3 to 309.03 Å3. The amount of Fe2SiO4 decreases as iron is oxidized from Fe2+ to Fe3+.
(3) After oxidation, the structure of the sample changes significantly. The formation of a new phase destroys the original structure and forms a large number of pores inside the particles, increasing the specific surface area of particles and improving the gas diffusion conditions in the reduction process.

Author Contributions

Conceptualization, X.L. and X.Z. (Xinyi Zhang); methodology, X.L. and X.X.; software, X.Z. (Xinyi Zhang) and X.Z. (Xuyuan Zang); formal analysis, X.L. and X.Z. (Xinyi Zhang); investigation, X.Z. (Xinyi Zhang); resources, X.L.; data curation, X.X. and X.Z. (Xinyi Zhang); writing—original draft preparation, X.Z. (Xinyi Zhang) and X.Z. (Xuyuan Zang); writing—review and editing, X.Z. (Xinyi Zhang) and X.X.; supervision, X.L.; project administration, X.L.; funding acquisition, X.L. and X.X. All authors have read and agreed to the published version of the manuscript.

Funding

The work was supported by the Natural Science Foundation of China (No. 51774224).

Acknowledgments

The authors are grateful to JINCHUAN GROUP CO., LTD for providing the experimental materials.

Conflicts of Interest

The authors declare no conflict of interest.

References

  1. Li, X.M.; Shen, M.; Wang, C.; Cui, Y.R.; Zhao, J.X. Current Situation and Development of Comprehensive Utilization of Nickel Slag. Int. Mater. Rev. 2017, 31, 100–105. [Google Scholar] [CrossRef]
  2. Piatak, N.M.; Parsons, M.B.; Seal, R.R. Characteristics and environmental aspects of slag: A review. Appl. Geochem. 2015, 57, 236–266. [Google Scholar] [CrossRef]
  3. Wang, Y.F. Industrial Study and Application on Recycling Valuable Metals in Nickel Leaching Slag. Copp. Eng. 2010, 2, 44–47. [Google Scholar]
  4. Guo, Y.G.; Zhu, R.; Wang, Y. The fundamental research to extract iron from the nickel slag by smelting reduction process. Ind. Heat. 2015, 44, 40–43. (In Chinese) [Google Scholar]
  5. Ni, W.; Ma, M.S.; Wang, Y.L. Thermodynamic and Kinetic in Recovery of Iron from Nickel Residue. J. Univ. Sci. Technol. Beijing 2009, 31, 163–168. [Google Scholar] [CrossRef]
  6. Li, X.M.; Li, Y.; Zhang, X.Y.; Wen, Z.Y.; Xing, X.D. Growth characteristics of metallic iron particles in the direct reduction of nickel slag. MMTB 2020. [Google Scholar] [CrossRef]
  7. Pan, J.; Zheng, G.L.; Zhu, D.Q.; Zhou, X.L. Utilization of nickel slag using selective reduction followed by magnetic separation. Trans. Nonferrous Met. Soc. China 2013, 23, 3421–3427. [Google Scholar] [CrossRef]
  8. Li, X.M.; Wen, Z.Y.; Li, Y.; Wang, W.A.; Xing, X.D. Catalytic effect of sodium carbonate on the carbothermic reduction of nickel slag. Chin. J. Process Eng. 2020, 20, 182–188. (In Chinese) [Google Scholar] [CrossRef]
  9. Li, X.M.; Wen, Z.Y.; Li, Y.; Yang, H.B.; Xing, X.D. Improvement of carbothermic reduction of nickel slag by addition of CaCO3. Trans. Nonferrous Met. Soc. China 2019, 29, 2658–2666. [Google Scholar] [CrossRef]
  10. Wang, Z.Y.; Zhang, J.L.; Xing, X.D.; Liu, Z.J.; Zhang, Y.P.; Liu, X.L.; Liu, Y.R. Phase Transitions and Atomic-Scale Migration during the Oxidation of a Titania/Ferrous Oxide Solution. JOM 2015, 68, 656–667. [Google Scholar] [CrossRef]
  11. Park, E.; Ostrovski, O. Effects of Oxidation of Titania Ferrous Ore on the Ore Structure and Reduction Behavior. ISIJ Int. 2004, 44, 74–81. [Google Scholar] [CrossRef] [Green Version]
  12. Guo, Y.F.; Lv, Y.N.; Jiang, T.; Qiu, G.Z. Effect of pre-oxidation on Panzhihua ilmenite in solid state reduction process. J. Univ. Sci. Technol. Beijing 2010, 32, 413–419. [Google Scholar] [CrossRef]
  13. Liu, S.S.; Guo, Y.F.; Qiu, G.Z.; Jiang, T.; Chen, F. Solid-state reduction kinetics and mechanism of pre-oxidized vanadium-titanium magnetite concentrate. Trans. Nonferrous Met. Soc. China 2014, 24, 3372–3377. [Google Scholar] [CrossRef]
  14. Xing, X.D.; Pang, Z.G.; Mo, C.; Wang, S.; Ju, J.T. Effect of MgO and BaO on viscosity and structure of blast furnace slag. J. Non-Cryst. Solids 2020, 530, 119801. [Google Scholar] [CrossRef]
  15. Gou, H.P.; Zhang, G.H.; Chou, K.C. Influence of Pre-oxidation on Carbothermic Reduction Process of Ilmenite Concentrate. ISIJ Int. 2015, 55, 928–933. [Google Scholar] [CrossRef] [Green Version]
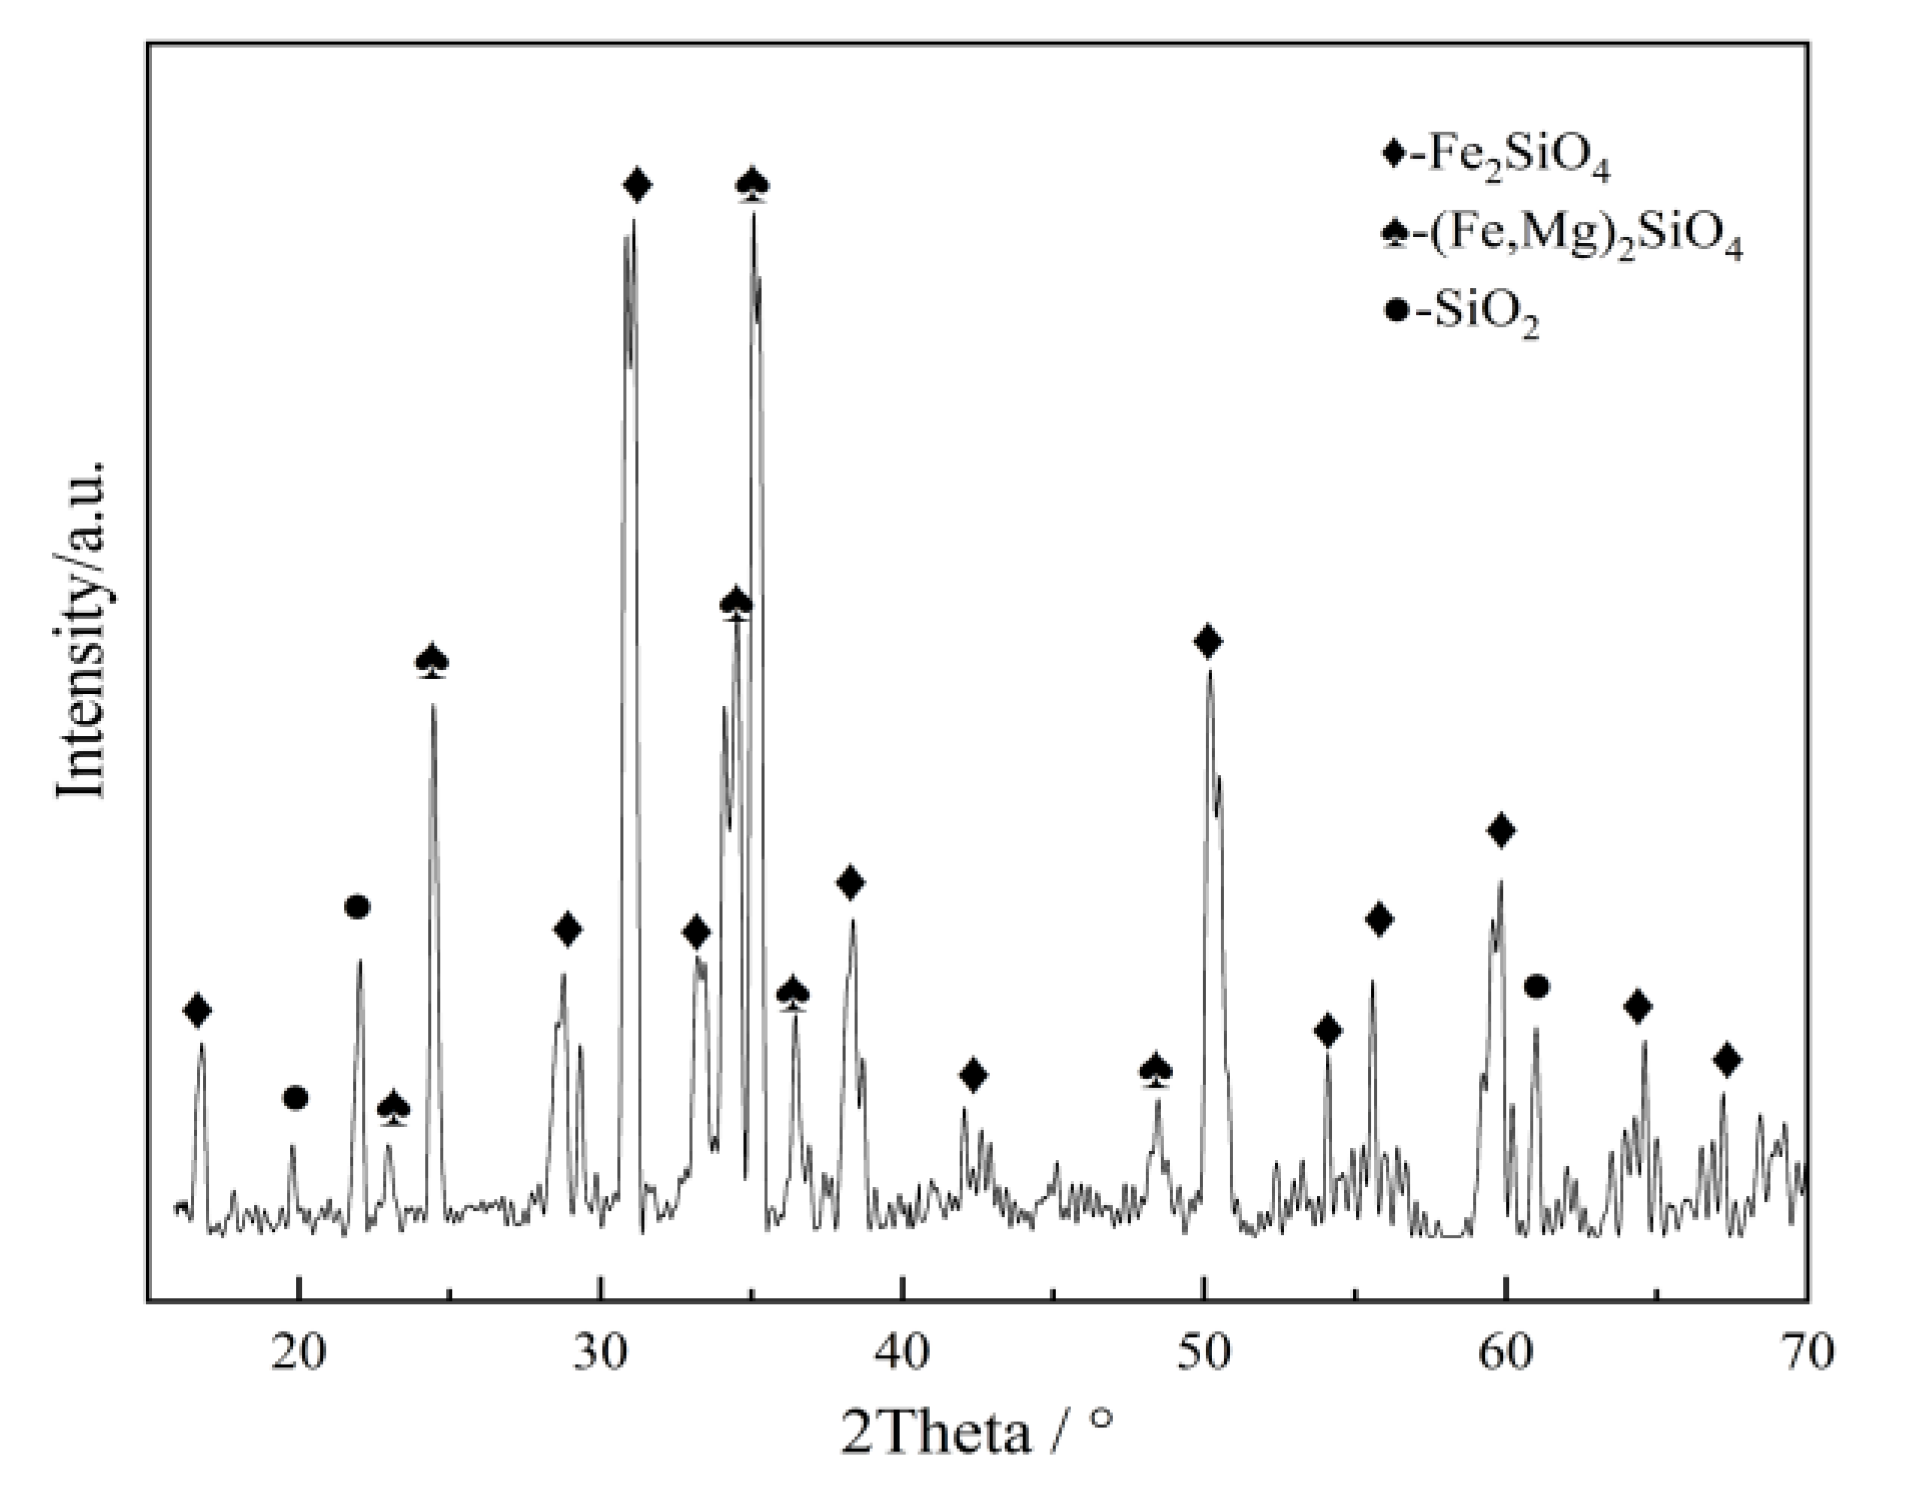
Figure 1. X-ray diffraction patterns of nickel slag sample.
Minerals 10 00313 g001
Figure 2. Scanning electron microscopy (SEM) image and elemental map of nickel slag samples.
Minerals 10 00313 g002
Figure 3. Particle size distribution of milled nickel slag.
Minerals 10 00313 g003
Figure 4. Equipment for nickel slag oxidation.
Minerals 10 00313 g004
Figure 5. Fe oxidation rates of nickel slag samples after oxidation at different temperatures in different intervals.
Minerals 10 00313 g005
Figure 6. XRD patterns of nickel slag samples after oxidation for 30 min at different temperatures.
Minerals 10 00313 g006
Figure 7. XRD patterns of nickel slag samples after oxidation at 900 °C in different intervals.
Minerals 10 00313 g007
Figure 8. SEM morphology of nickel slag samples after oxidation for 20 min at different temperatures (a) 300 °C; (b) 400 °C; (c) 500 °C; (d) 700 °C; (e) 900 °C; (f) 1000 °C.
Minerals 10 00313 g008
Figure 9. SEM and EDS analysis of nickel slag samples after oxidation at 900 °C for 30 min. (A) SEM image of nickel slag samples; (B) energy-dispersive spectrum of region a.
Minerals 10 00313 g009
Figure 10. XRD patterns of nickel slag samples after oxidation for 30 min at 400 °C and 900 °C respectively.
Minerals 10 00313 g010
Figure 11. Decomposition of Fe2SiO4 in nickel slag and its standard Gibbs free energy change curve under oxidation atmosphere.
Minerals 10 00313 g011
Figure 12. Oxidation mechanism of nickel slag.
Minerals 10 00313 g012
Table 1. Chemical components of nickel slag (mass fraction, %).
ComponentsTFeFeOSiO2MgOAl2O3CaONiCuCoS
wt. %39.4049.6832.509.702.301.200.4550.3380.1440.868
Table 2. Unit cell parameters of Fe2O3 in nickel slag samples after oxidation at 400–1000 °C.
TemperatureaError/±bError/±cError/±Volume/Å3
400 °C5.03420.00555.03420.003613.74830.0012301.75
500 °C5.03300.00465.03300.005613.73960.0034301.41
700 °C5.02060.00825.02060.006213.71960.0011299.49
900 °C5.00650.00435.00650.002613.64110.0026296.11
1000 °C5.01420.00855.01420.002413.67330.0016297.72
ideal unit cell size5.0160-5.0160-13.6520-297.52
Table 3. Unit cell parameters of Fe2SiO4 in nickel slag material and products after oxidation at 300–500 °C.
TemperatureaError/±bError/±cError/±Volume/Å3
Raw5.70120.003010.33120.00284.76280.0046302.59
300 °C6.07970.001810.46010.00284.81520.0011306.23
400 °C6.08300.001210.45830.00184.81620.0007306.40
500 °C6.11470.004710.47160.00554.82650.0025309.03
ideal unit cell size5.7060-10.3120-4.7620-301.70
Table 4. Unit cell parameters of Mg2SiO4 in nickel slag samples after oxidation at 700–1000 °C.
TemperatureaError/±bError/±cError/±Volume/Å3
700 °C5.69720.004211.51850.00828.24400.0084540.99
900 °C5.69390.003211.41980.02688.29730.0142539.53
1000 °C5.68160.005611.40310.01988.20680.0204538.72
ideal unit cell size5.6960-11.4440-8.2481-537.65