Article

Potentially Toxic Elements (PTEs) in Cultivated Soils from Lombardy (Northern Italy): Spatial Distribution, Origin, and Management Implications

1
Department of Earth and Environmental Sciences, University of Pavia, 27100 Pavia, Italy
2
ERSAF, Regional Agency for Agriculture and Forests of Lombardy, 20124 Milano, Italy
*
Author to whom correspondence should be addressed.
Minerals 2020, 10(4), 298; https://doi.org/10.3390/min10040298
Submission received: 31 January 2020 / Revised: 20 March 2020 / Accepted: 23 March 2020 / Published: 27 March 2020
(This article belongs to the Special Issue Elemental and Isotope Geochemistry of the Earth’s Critical Zone)

Abstract

:
This work aims to quantify the contribution of agricultural practices to diffuse pollution in cultivated soils. Two samples (the first from the top layer and the second from a depth of about 100 cm) were retrieved from about 1000 soil profiles and analyzed for their potentially toxic elements (PTEs) content (Cd, Cu, Ni, Pb, Zn, Mn). In addition, we collected dedicated soil profiles for three specific types of land use and agronomic practice, namely vine-, cereal- and rice-growing areas. Baseline concentrations and distribution maps were produced. Statistical data treatment, coupled with the results of the dedicated soil profiles, enabled the identification of precise pollution sources and processes. In cultivated soils, PTEs contents prove to be generally well below the Italian regulatory limits, with the exception of Cu in vineyard soils, due to the long-lasting use of Cu-based pesticides. South of Milan and in other urban areas, we attribute the top soil enrichment in Cd, Cu, Pb, and Zn to industrial activities and urban settlement. Ni sporadically exceeds regulatory standards, but its association with Mn and its depth distribution point to a natural origin, mostly due to the occurrence of serpentine. The project demonstrates that although agriculture, especially in the form of vineyards and of intensive cultivation, certainly contributes to pollution, such contribution is exceeded by that deriving from industry and road traffic.

1. Introduction

Soils are critical environments where rock, air, and water interface. Potentially toxic elements (PTEs) in soils are always present at a background level of non-anthropogenic origin, and their input to soils is related to the weathering of parent rocks and to pedogenesis [1,2]. In recent decades, natural soil content has been increased by human input [3]. The major anthropogenic sources for PTEs in soils are metalliferous mining and smelting, agricultural materials, sewage sludge, fossil fuel combustion, and industries. PTEs from both point and nonpoint sources still represent one of the major soil threats in Europe [4].
Studies on soil PTEs contents are generally conducted by means of two differing approaches and two differing scales. Regional surveys (e.g., [5,6,7]) investigate large areas and mostly evaluate topsoil samples. Such studies focus on the best way to interpolate PTEs concentration data and hence to improve the predictive accuracy of the maps produced. Source identification entails the use of GIS software to compare these topsoil-oriented maps with those generated from other informative layers. Since similarity of spatial distribution is a somewhat arbitrary basis for correlations between parameters, these studies are generally unable to unambiguously identify sources and input processes. Other investigations focus on the retention, migration, and transfer of PTEs to other environmental compartments (e.g., [8,9]). Studies of this sort generally assess PTEs movement on the bases of depth, speciation analyses, mineralogical determinations, SEM observations, etc. (e.g., [10]). Although scientifically very sound, these studies refer to specific soil types, or even to specific soil parcels, and it is difficult to extrapolate results to other situations or neighboring areas.
Facchinelli et al. [11] first proposed a multivariate statistical and GIS-based approach to identify PTEs sources in soils. The method was applied to the results from 50 locations in the Piedmont region. We tested this approach on a neighboring area, the Lombardy plain, to verify its capability of identifying agriculturally-generated PTEs contamination in cultivated soils. To this end, the study combines a regional investigation, which covers the entire area of interest, with three site-specific investigations, and thus provides a sound scientific basis for the conclusions obtained.
The present study is based on the use of PTEs aqua regia extractable content, also referred to as pseudo-total content [3], which generally amounts to 80–90% of total PTEs content. The use of this analytical technique is questioned by some, especially in the case of agricultural soil, on the basis that the key issue should not be PTEs accumulation in soils as such, but rather the accumulation of risks to human health and/or ecosystems. Accordingly, research should in theory concentrate more on PTEs bioavailable fraction values and on transfer to other environmental compartments [12]. Unfortunately, science currently lacks a universally accepted methodology to estimate the PTEs bioavailable content in soils [13], so that many of the relationships between soil and human health are still unclear and require further research [14]. Further controversy surrounds the question of whether a focus on short-term risk and on current land uses is sufficiently preventive. Proponents of the insufficient school argue that risk assessments should be sufficiently knowledge-based and detailed to account for long-term future land uses and potential impacts, and hence to guarantee sustainability [15].
A comprehensive source of information on PTEs contents in European soils is represented by the FOREGS Geochemical Atlas, with a sampling density of 1 site/5000 km2 [16]. More recently, the European Community has supported the LUCAS Topsoil Survey, which represents the first effort to build a consistent spatial database of soil properties for environmental assessments on all major land use types across Europe [17], with a sampling density of 1 site/200 km2. In the survey, soil PTEs content is assessed against element-specific thresholds of contamination and remediation needs [7], without addressing aspects like the bioavailability of elements or the potential differentiated impact of elemental speciation to ecological conditions or human health. The results of this assessment highlight the need for spatially intensified and thematically broadened monitoring of soil resources in the European Union. Our study contributes to the ongoing debate by providing additional information, and thus aims to serve as a basis for the correct management of agricultural soils and for the preservation of their multifunctional character for future generations.

Study Area

The Po valley, located in northern Italy, covers an area of approximately 46,000 km2, and is bound to the North by the Alps, to the South by the Apennines, and to the East by the Adriatic Sea (Figure 1a). The plain originated during Quaternary by the progressive infilling of the Po river basin with sediments derived by erosion of the Alpine and Apennine ranges. The Plain of Lombardy is located in the central part of the Po Plain (Figure 1a). Here, Alpine sediments, deposited north of the Po river, are mainly constituted by quartz and feldspars in the western area and by limestone in the eastern part. In contrast, sediments derived from the Apennines, mainly deposited south of the Po river, are rich in clay and marls, and may contain fragments of ultramafic rocks.
The Plain of Lombardy is subject both to intensive agriculture and to strong anthropic pressure as exerted by industrial and urban settlements (Figure 1b). This results in a large production of both animal waste and sewage sludge, which often contain high concentrations of PTEs [18], and require correct disposal procedures [19]. The re-use of these products in agriculture is therefore strongly encouraged at both the institutional and the commercial levels.
Between 1998 and 2004, several thousand soil profiles were collected by ERSAF in order to produce a pedological map of Lombardy (1:50,000). Soil samples were collected, analyzed for the main physicochemical parameters (grain size, pH, cation exchange capacity (CEC), organic carbon content (OC), carbonate content (Carb), and percent base saturation (%BS)), and stored in the ERSAF collection for further reference.
A detailed discussion on the soil types and the regional patterns of the soil physicochemical parameters is provided in [20]. The particle size of soils in the Lombardy Po plain decreases as the distance from the sediment source increases southward and eastward. The soil carbonate content strongly influences pH, which turns from subacidic to alkaline. OC distribution as well as CEC and %BS follow the same pattern: lower in the western plain and higher in the central and eastern parts. In contrast, the soil characteristics of mountain landscapes, both in the Apennines and in the Alps, are mainly influenced by parent materials (geology) and morphology. Additional information is reported in the Soil Atlas of Europe [21] and in [22].

2. Materials and Methods

We selected approximately 1000 soil profiles from the ERSAF collection, covering the plain and the foothill areas of Lombardy (approximately 13,700 km2) in their entirety. Two samples per soil profile, respectively representative of surface soil (the A or Ap horizon, 1449 samples) and of soil at an approximate depth of 100 cm (generally belonging to a B or C horizon, 981 samples), were analyzed for their PTEs (Cd, Cu, Ni, Pb, Zn, Mn) content. Because identification of soil profiles was occasionally ambiguous, it was only possible to analyze 810 locations with certainty that the topsoil and the deep soil samples matched each other.
Accordingly, the regional dataset we used consisted of:
  • 1449 top soil samples,
  • 981 deep soil samples, and
  • 810 profiles in which the top soil matched the deep soil samples.
The distribution of the top soil samples is shown in Figure 1b. The density is of about 1 site/10–14 km2.
To further clarify the extent to which intensive agriculture contributes to PTEs levels, and hence to validate the conclusions obtained in the regional investigation, we selected three areas that correspond to the main agricultural land uses of Lombardy, namely Oltrepò (grape-vine), the Cremona plain (maize and wheat), and Lomellina (rice) (Figure 1b).
In each area, we excavated from two to four soil profiles that we described and classified [23,24]. Soil was sampled at regular intervals of 20 cm; soil parameters and PTEs concentrations were determined by means of the same analytical techniques as those used in the regional investigation.
Soil samples were air-dried, crushed, sieved at 2mm, and analyzed for the determination of the main physicochemical parameters (particle size, pH, CEC, OC, Carb, and %BS). Methods conformed to officially approved national procedures [25] and to ISO protocols.
PTEs analyses (Cd, Cu, Ni, Pb, Zn, and Mn) were conducted by aqua regia digestion on 3–5 g of sieved soil, crushed to 0.5 mm, in keeping with the official procedure [25]. Solutions were analyzed by Atomic Absorption Spectrometry with a Varian SpectrAA 400, Varian SpectrAA 250 or a Perkin Elmer AAnalyst 400. Accuracy and precision were tested with repeated analyses of certified reference materials (CMR7001-CMR7004) within a 10% error range. Unfortunately, Cd levels in a large number of samples proved to be below the detection limit (DL= 0.2 mg·kg−1 for the older Varian instruments, 0.016 mg·kg−1 for the more recent Perkin Elmer). Although below-DL data complicate statistical analysis, they cannot be eliminated from the dataset since they constitute 26.9% of the top soil and 17.7% of the deep layer samples. When possible, we report the results of the statistical data treatment from both the Cd datasets (i.e., respectively including and excluding data below the DL).
Statistical data treatment (descriptive statistics, analysis of correlations, and principal component analysis (PCA)) was performed using the software SPSS® 16.0. The normality of the PTEs results was checked using graphical methods such as frequency histograms and probability plots, as recommended in the literature for large datasets [26]. In the PCA, the number of components extracted was selected to ensure an adequate representation of the dataset (variance explained >60%; extraction communalities >0.5; eigenvalues ≈ 1 or higher) [27]. A Varimax rotation was performed to reduce the overlap of the original variables over each principal component [28]. ESRI® ArcGIS 9.0 was used to produce dot maps and interpolation maps, the latter by means of the geostatistical tool (method: ordinary kriging; model: spherical) that is included in the software.
Sand aggregates discovered in rice-cultivated soils were investigated by X-ray powder diffraction (XRPD) and scanning electron microscopy (SEM). XRPD used the following instruments and settings: PW1800/10 Philips X-ray Diffractometer and X’Pert High Score, (PANalytical B.V.) software (Version 4.6a), Cu Kα radiation, graphite monochromator, automatic divergence slit, 45kV, 35mA, scan interval from 2° to 65° 2θ, and scan speed of 0.02° 2θ/sec. Diffraction patterns were compared to those of the ICDD (International Centre for Diffraction Data) database and to internal reference standards in order to qualitatively evaluate the mineralogical composition. Semiquantitative results were calculated according to [29,30]. For the examination of the topography and the elemental composition of sand aggregates, small sample bulks were dispersed on the sample stages, lightly graphite-coated, and analyzed using SEM (MIRA3 TESCAN,) with an Energy Dispersive X-ray Spectrometer (EDS) system. The EDAX Genesis software was used to acquire and process Energy Dispersive X-ray (EDX) spectra analysis.

3. Results

3.1. Regional Data

3.1.1. Univariate Statistical Analysis

Results for the descriptive statistics of the PTEs concentration values obtained in the top soil and deep soil layers are reported in Table 1.
Concentrations fall within the range reported for world agricultural soils [3,31]. Comparison of the mean Lombardy top soil PTEs concentrations with those of agricultural soils from the Piedmont region, which is located west of the investigated area and has similar geological and pedological characteristics, reveals some differences: Lombardy’s Pb concentration is almost double that of Piedmont, and exceeds common values reported in the literature, while Ni is about 50% less in Lombardy than it is in Piedmont [32]. Unfortunately, Mn data are not available for the Piedmont region, but Lombardy’s mean concentration is about 50% lower than that of the world average [31].
Frequency histograms of all PTEs concentrations (Figure S1 in the Supplementary Material) show a positive asymmetry that approaches a log-normal distribution, both in the top and in the deep layers. This is commonly observed for many geochemical variables, including minor elements in soils [33]. In addition, the top layer is often enriched in PTEs, as indicated by a shift in the mean and in the median values (Table 1). Cu and Zn show an almost double mean concentration in the top layer compared to that in the deep layer, and Pb is about three times more enriched.
The PTEs concentration ratio between the upper layer and the deep layer (top enrichment factor (TEF)) was calculated for the 810 soil profiles. Its mean value is lower than 2 for Ni, Cd, and Mn, rises to 2.17 for Cu, 2.23 for Zn, and reaches the very high mean value of 7.89 for Pb (median 2.37).
Geochemical baseline concentrations, statistically defined as 95% of the expected range of background concentrations [34,35,36], in the case of a log-normal distribution, correspond to the concentration interval as defined by the geometric mean multiplied by 2 times the geometric standard deviation. The results obtained for all PTEs and layers in our study are reported in Table 2.

3.1.2. Analysis of Correlations

The correlation matrices for all PTEs and soil parameters, both in the top and in the deep layers, are shown in Table S1. Given the large amount of data used, most correlation coefficients are significant (p < 0.001). In the top layer, Cu and Mn are correlated to particle size, pH, CEC, and %BS; Cd is correlated to pH, Carb, and %BS, while Pb does not correlate to any of the soil parameters. In the deep layer, all PTEs except Cd correlate to particle size and CEC, while Cd shows the same correlations as those observed in the top layer. In contrast, the OC content does not correlate with PTEs in any layer.

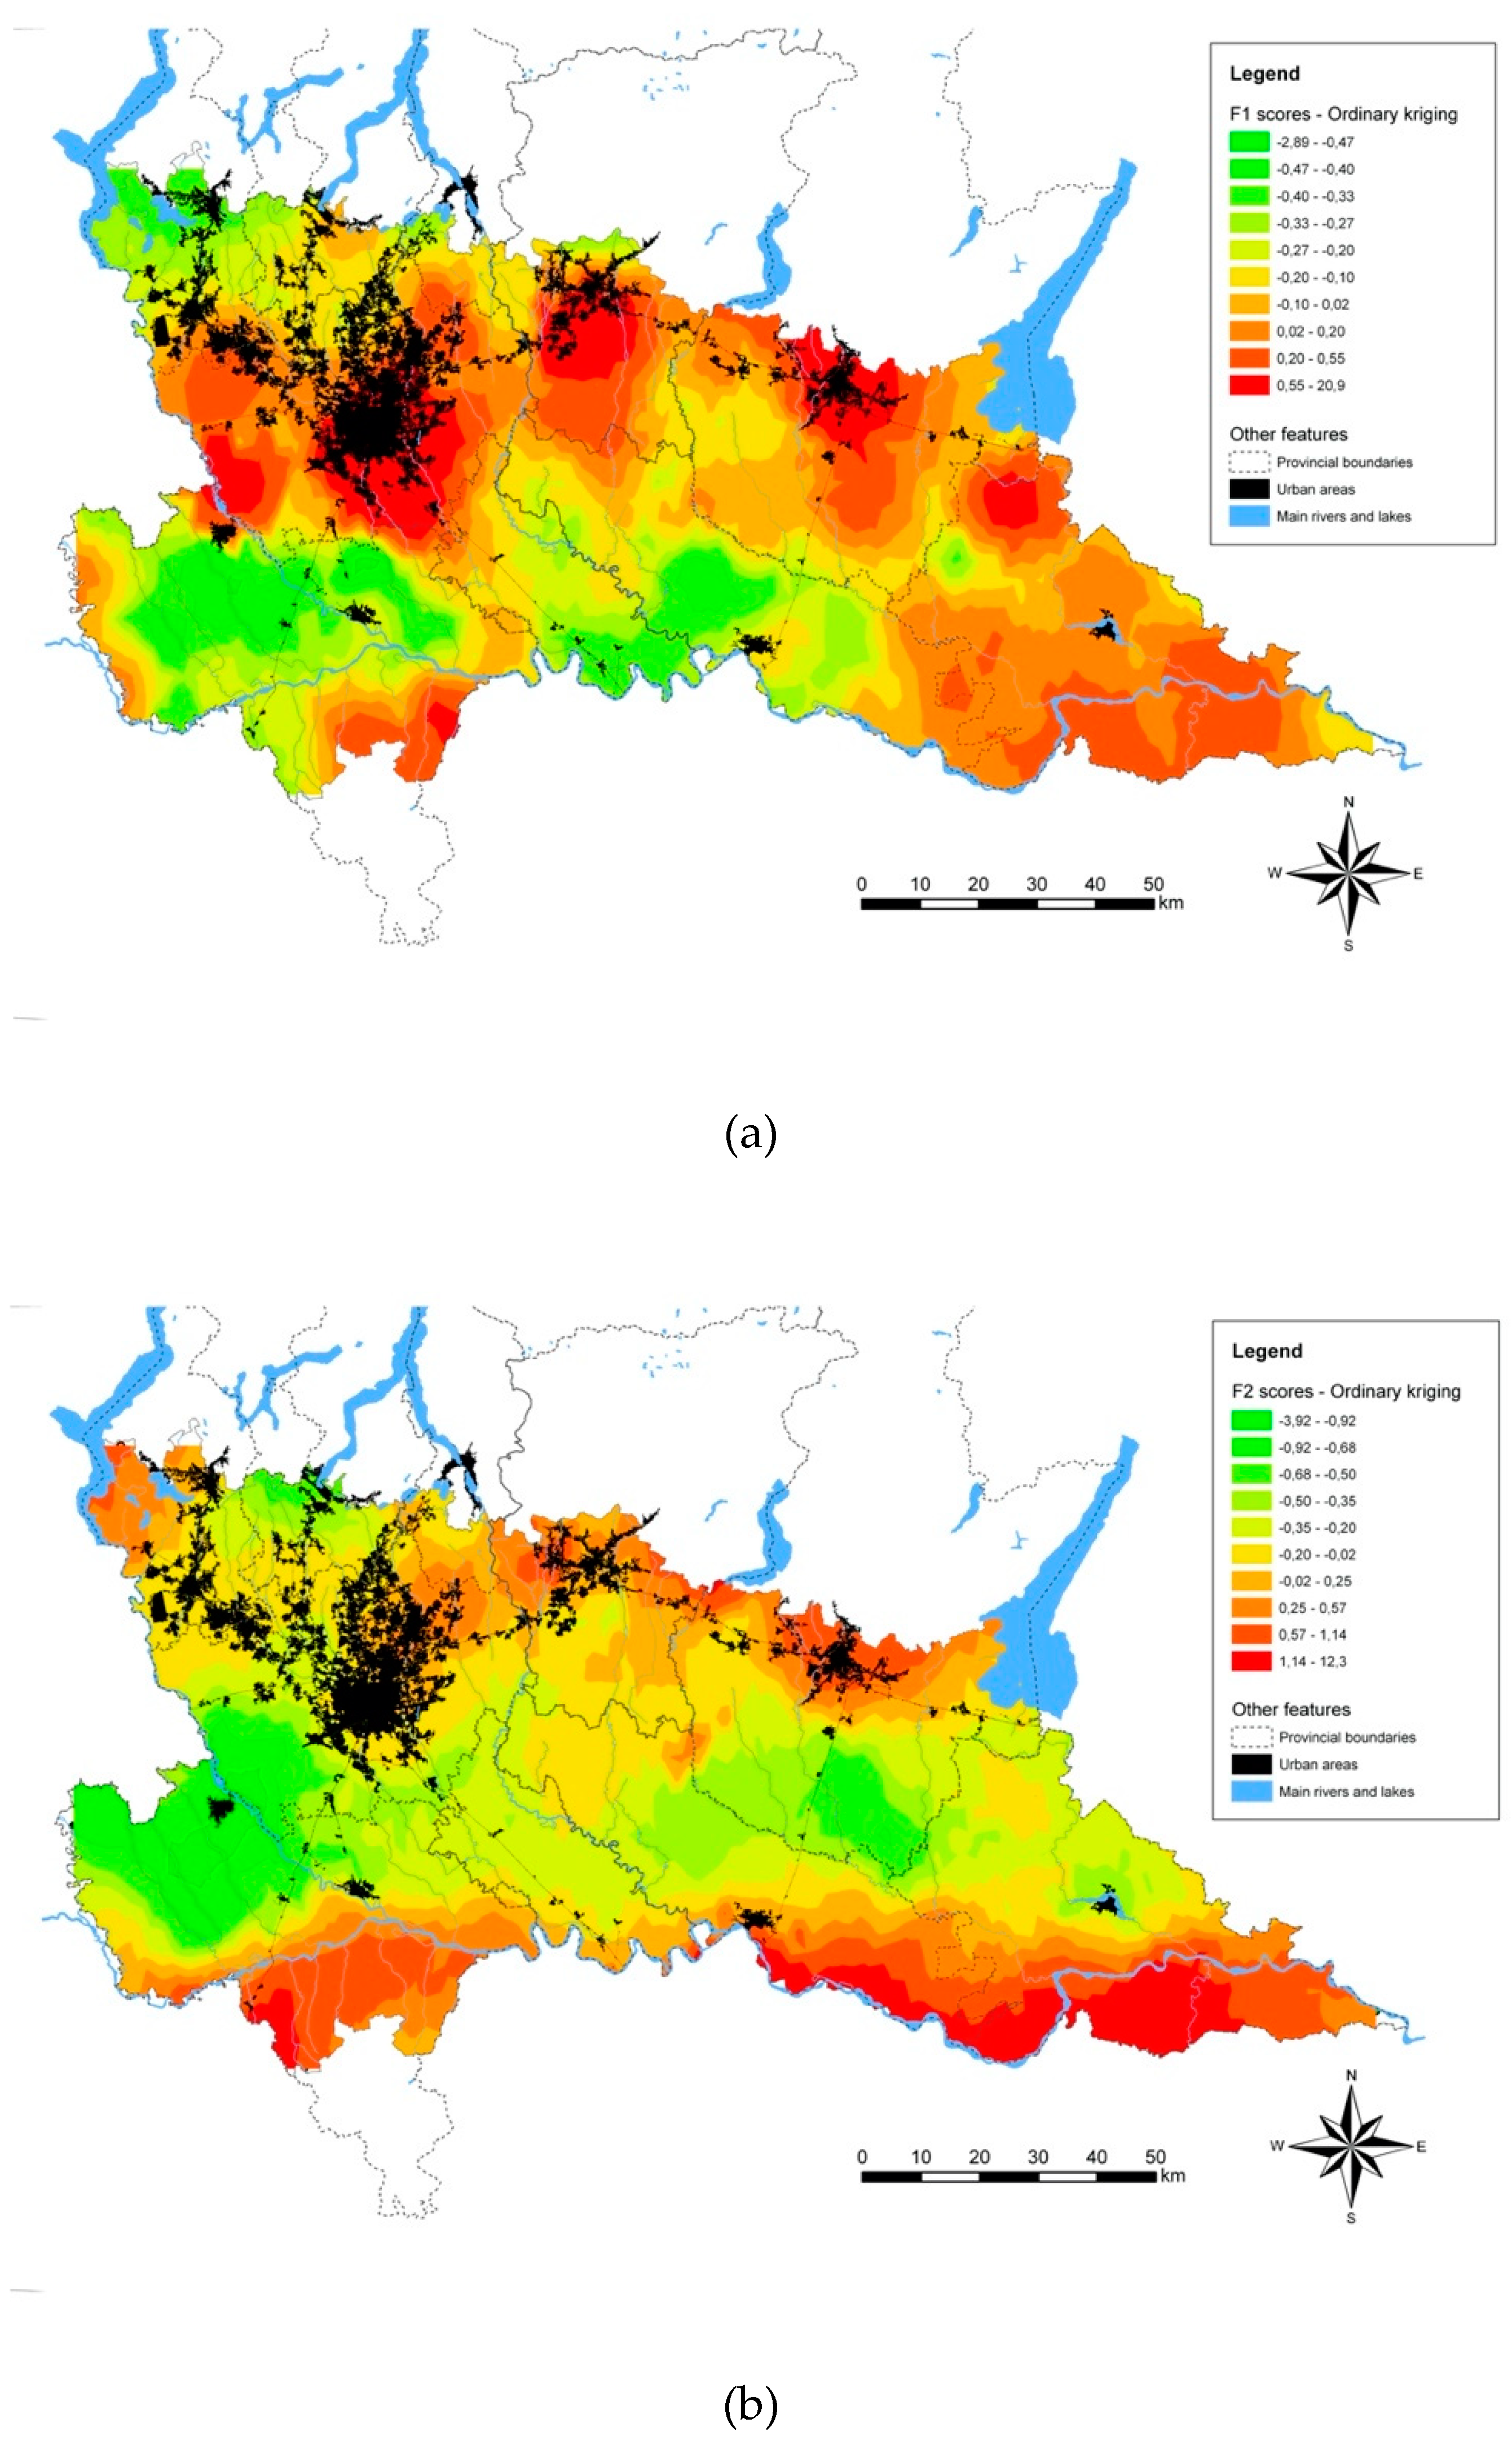
3.1.3. Principal Component Analysis (PCA)

This data reduction technique was applied in order to test all the possible correlations between PTEs and soil parameters.
With regard to the top layer (Table S2), six factors need to be extracted for adequate representation of the dataset (74.1% variance, communalities >0.514): F1 (particle size and partly CEC and Mn), F2 (Carb, pH, and %BS), F3 (Cd, Cu, and Zn), F4 (Ni and partly Mn), F5 (OC and partly CEC), and F6 (Pb). While soil parameters associate with differing factors, PTEs do not show any correlation with the soil parameters. Only Mn loadings are equally attributed to F4 and F1, and particularly to clay percentage.
For the deep layer (Table S3) too, six factors need to be extracted to ensure adequate representation of the dataset (77.0% variance, communalities >0.583): F1 (particle size, CEC, and partly Cu), F2 (Carb, pH, and %BS), F3 (Mn, Zn, and partly Cu), F4 (Cd inversely correlated with Ni), F5 (only OC), and F6 (only Pb). It is to be noted that the soil parameters are grouped together in the same factors as those extracted for the top layer. With regard to PTEs, PCA analysis leads to ambiguous, and hence not easily interpretable, results, possibly due to the non-homogeneous type of soil horizon (B or C) selected as the deep layer.
In light of these results, PCA was reperformed, this time with the soil parameters excluded from the dataset. In the top layer (Table S4), 64.2% of the variance is explicable by means of three factors (communalities >0.538): F1 (Cd, Cu, and Zn), F2 (Mn and Ni), and F3 (only Pb). The scores for each sample in the three factors were saved for subsequent data treatment. PCA on the deep layer (Table S5) again produced controversial results. If three factors are selected, Pb is not adequately represented (communality = 0.37); if four factors are extracted (communalities > 0.69), F1 associates Cu, Mn, and Zn, while the other factors represent one metal each.

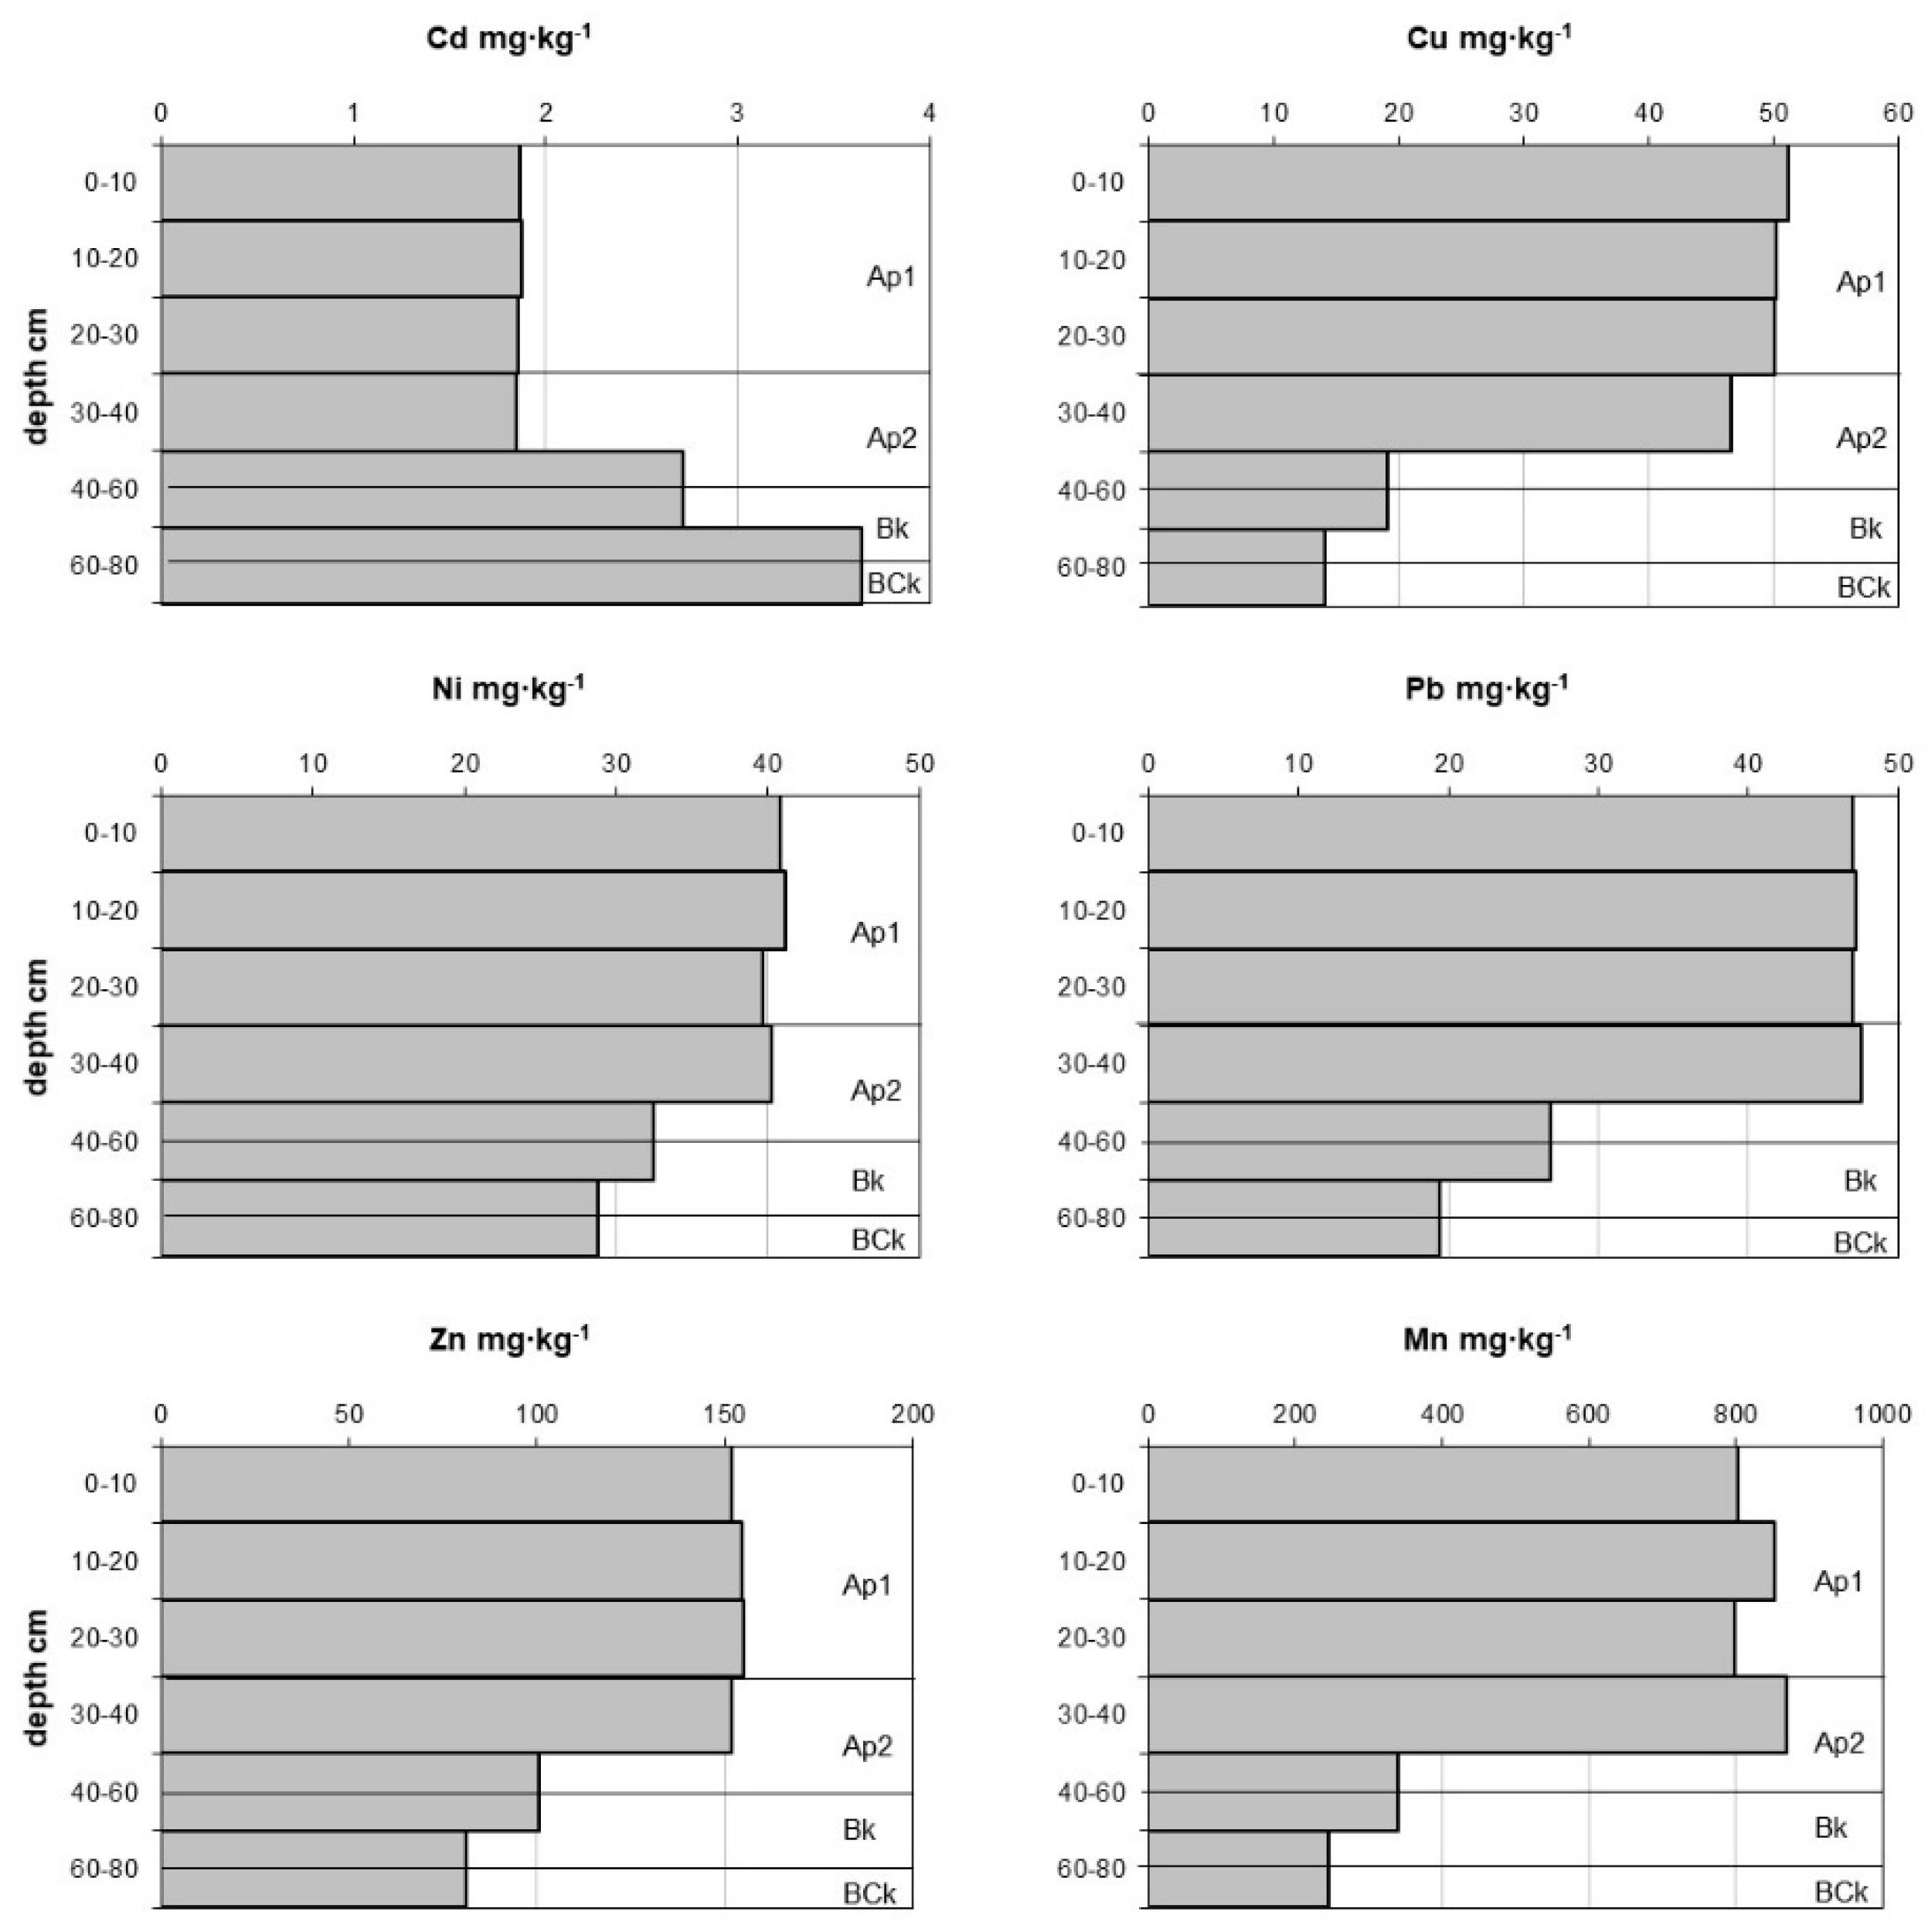
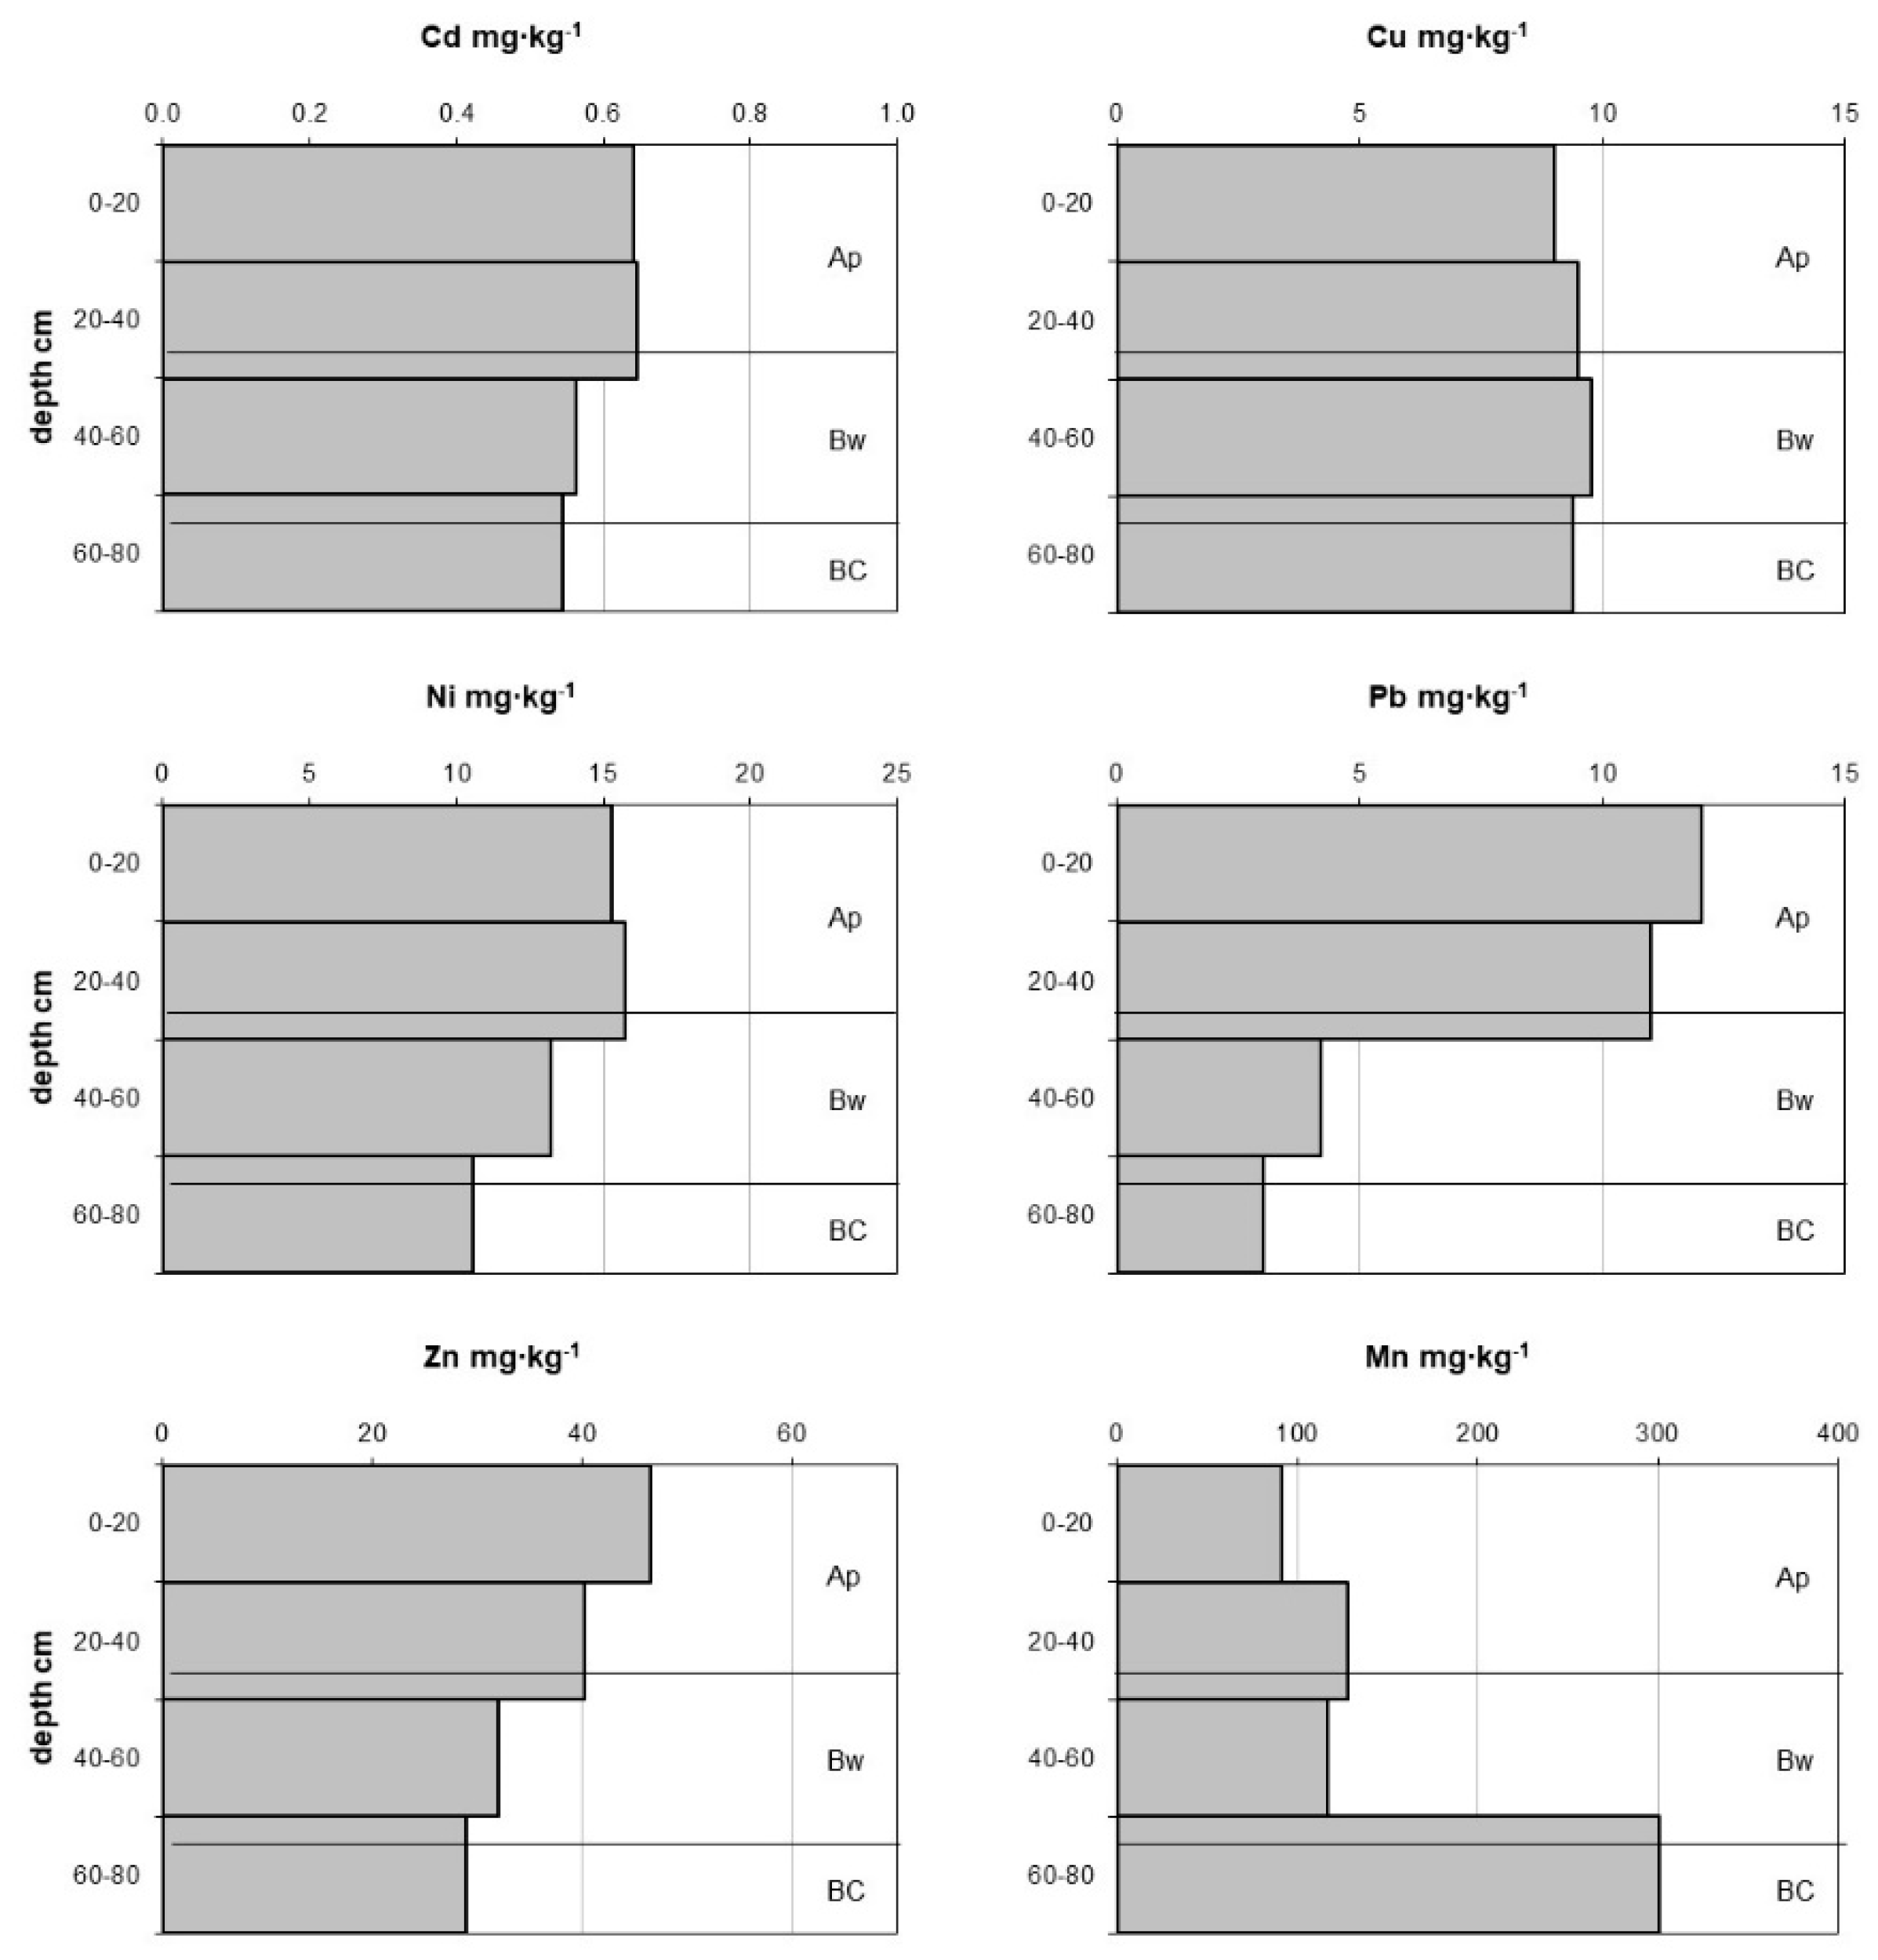
3.2. Dedicated Soil Profiles

The soil parameters and PTEs contents are reported in Table S6, and a detailed discussion of the results is reported by [37]. What follows here is a summary of the main findings, together with examples of PTEs soil profiles.
In the Oltrepò, which is a hilly area, soils are mainly Calcaric Cambisols. These deep soils, which occasionally show vertic features, are fine textured (>30% clay), with alkaline pH, Carb around 15–25%, medium-high CEC, and topsoil OC ranging from 0.5% to 1.1%. In this area, manure and sewage sludge re-use is uncommon, because of both acclivity and distance from the production area. PTEs depth profiles (Figure 2) evidence Cu strong enrichment in the top 40–60 cm, with values sometimes reaching exceptionally high levels (> 400 mg·kg−1) that substantially exceed Italian soil quality guidelines (SQGs) for residential land use (120 mg·kg−1) [38], and for agricultural land use [39]. The natural Cu concentration of these soils is lower than 40 mg·kg−1, as shown by layers at about 80 cm depth. Cu is associated with ubiquitous enrichment in Zn (up to 176 mg·kg−1 in top soil with a deep layer concentration of about 80 mg·kg−1) and in Pb (up to 30 mg·kg−1 in top soil compared with 5–10 mg·kg−1 in the deep layer); sometimes Cd too is enriched in the top layer (up to 2 mg·kg−1 with deep layer contents of about 1.2 mg·kg−1), as is Mn (although this metal displays high local variability in both layers).
In the province of Cremona, 80% of soil is dedicated to agriculture, mainly to the cultivation of cereals (maize and wheat). Soils in this area are mostly classified as Calcic Luvisols or Haplic Calcisols. They are deep, coarse, and/or fine silty soils, with pH from subalkaline to alkaline, Carb of 5%–10% in the topsoil and of 15–40% in the subsoil, high CEC (>20–25 meq/100 g), and topsoil OC from 0.9% to 1.2%. Animal waste was liberally applied to fields in the past and is presently regulated by the EU Nitrate Directive; since the 1980s, the agricultural re-use of sewage sludge has also been encouraged. Tillage to a depth of about 50 cm is performed every year. This reflects in PTEs distribution at depth (Figure 3), with content somewhat uniform throughout the top 50 cm. PTEs concentrations are below regulatory standards, except for Zn, which exceeds the limit of 150 mg·kg−1 set for residential land use [38]. Excluding Cd, PTEs are strongly enriched in the top layer, with TEF values of approximately 1.5 for Ni, 1.9 for Zn, 2.5 for Pb, 2.9 for Mn, and 3 for Cu. In contrast, Cd is enriched in the deepest layer, which generally corresponds to BC or Bk horizons. This suggests that retention of this metal is low in the topsoil and that concentration occurs in the deep layer, where carbonates precipitate [31].
The Lomellina plain has been dedicated to rice cultivation for several hundred years. Soils are Arenosols and Arenic Luvisols. These are coarse textured soils (sand >80%), with pH from subacidic to neutral, low CEC (<10 meq/100 g), and low OC (0.5–0.8% in the topsoil). Despite their low retention capacity, these fields are increasingly treated with sewage sludge. PTEs in soil profiles are generally very low (Figure 4); strong topsoil enrichment is observed for Pb alone (TEF > 2), while a little enrichment in observed for Cu, Zn, and sometimes Ni. In contrast, Mn is strongly depleted in the top layer, and remains so down to about 60 cm.

4. Discussion

The results of the regional investigation were compared with the SQGs specified by Italian legislation for residential and industrial land use [38] and for agricultural soils [39]. Values in excess of the threshold require the activation of a risk analysis procedure. We observe that less than 5% of all samples analyzed exceed the limits set for residential or for agricultural land use (Table S7), with the exception of Pb in the top soils and Ni in the deep soils. Very few soil samples presently fail to comply with legislation for an industrial land use. This indicates that agricultural soils in Lombardy are generally not heavily impacted by PTEs contamination. However, according to the Italian legislation [40], numerous limits are imposed on sewage sludge re-use on account of the high soil Ni and Cd content, both in the top and in the deep layers (Table S7).
Despite the overall low PTEs contamination of agricultural soils, an apportionment of natural and anthropic contributions is necessary, and the latter requires source discrimination for agricultural practices to be deemed sustainable in the long term.
Although the notion is questioned by some authors [41], especially in the case of remote areas, TEF values in soil profiles have been widely cited as proof that PTEs content is of anthropogenic origin. Natural pedogenetic enrichment is unlikely to produce TEF values in excess of 2, while higher values point to substantial anthropic input from the top [11]. In the present study, our TEF values strongly suggest that Cu, Zn, and Pb derive from significant anthropic contribution. In contrast, Mn and Ni display approximately the same content in the top and in the deep layers, which suggests that origination and distribution are mostly natural.
To compare the top and deep concentrations of PTEs in cultivated soils from the three main agricultural land uses of Lombardy, we extracted from the database the samples from fields devoted to maize and wheat (top = 1017; deep 669), rice (top = 182; deep 109), and vine (top = 31, deep = 17) cultivation (Figure 5). The SQGs indicated for residential and for agricultural land use are also reported.
Figure 5 clearly shows that:
  • Cu, Pb, and Zn are systematically enriched in the top layer with respect to the deep layer, whereas Cd, Ni, and Mn show different patterns according to the land use;
  • Maize and wheat cultivated soils display numerous samples identified as outliers, especially in the top layer. These outliers frequently exceed the SQGs for residential land use for most metals, and in particular for Cd, Cu, Ni, Pb, and Zn;
  • Rice fields too show some outlier values exceeding SQGs, especially for Ni; in addition, in these areas, Ni and Mn are more enriched in the deep than in the top layer;
  • Vine cultivated soils display less numerous samples classified as statistical outliers. Cu in the top layer is highly enriched with respect to the deep layer, and so are Pb and Zn, although to a minor extent. By contrast, Cd concentrations are higher in the deep layer.
It should be noted that the observed differences in concentrations between the top and the deep layers may also arise from the different properties of the PTEs. For example, Cu and Pb are known to be more retained by clay minerals than Cd, Zn, or Ni, and Mn is sensitive to redox, while the other considered metals are not [3,31]. Therefore, the topsoil enrichment may be related to both differences in sources and in mobility. Correlations of PTEs with soil parameters (Table S1) indicate that factors related to their presence are the abundance of silt and clay, higher CEC and, in top soils only, higher pH and %BS. All these parameters are well known to affect PTEs mobility by favoring adsorption processes [3,42]. These observations suggest that pH plays a role in PTEs retention in top soil, while in the deep layer, closer to the bedrock, particle size and CEC are determinant. On the other hand, Cd correlates to Carb in both layers. This could be due to the higher content of this element in carbonate rocks [3], which are abundant in the eastern part of the Alps and consequently in soils derived from those source areas.
Maps that spatially interpolate the concentration data are sometimes used to distinguish between natural and anthropogenic input. GIS software makes it possible to compare these maps with other features, such as land use, soil parameters (e.g., clay content or pH), and presence of human infrastructure (e.g., roads, industrial districts). Caveats are needed with regard to the predictive capacity of spatially interpolated single metal concentration data. Indeed soil contaminants, generally migrate downwards and not laterally; their occurrence is therefore strongly limited to the area where the contamination has occurred and cannot be extrapolated with confidence to adjacent areas. On the other hand, interpolation may evidence areas where anomalous values can more frequently be found. In addition, for diffuse contamination that derives from atmospheric deposition or peculiar land use districts, spatially interpolated data can provide information about the origin of the contamination as well as about the extension of potentially affected areas.
To cater for single metal spatial variability, we chose to interpolate the PCA results obtained from the top layer, i.e., the results regarding PTEs associations. The scores of each sample on F1 (which associates Cd, Cu, and Zn) and on F2 (which associates Mn and Ni) were interpolated. The resulting regional maps highlight positive and negative anomalies (Figure 6). Because of hot-spots, F1 and F2 are not spatially autocorrelated. Nevertheless, we retained this interpolation method because the maps it produced do not substantially differ from those created with an Inverse Distance Weighting interpolation method.
With regard to F1 (Figure 6a), areas of anomalous Cd, Cu, and Zn contents occur at the Alpine foothills, where the main cities of Milan, Bergamo, and Brescia (and their respective industrial districts) are located. Other hot spots are the Oltrepò area and the Mantua plain, both of which are mainly devoted to agriculture. Concerning F2 (Figure 6b), high scores are observed both at the Apennine foothills (especially along the Po river) and at the Alpine foothills, especially near the cities of Brescia, Bergamo, and Varese. In contrast, the Lomellina area is characterized by negative scores.
Since Pb is not associated to any other parameter or metal and the metal content is not autocorrelated, we produced a specific distribution map for this single metal (Figure 7). The Pb distribution map clearly shows that high concentrations are common in the northern part of the Lombardy plain and around the main cities.
Accordingly, the data collected and here discussed enable us to distinguish those PTEs whose topsoil content is mostly determined by their natural abundance from those mostly deriving from anthropic input.

4.1. Natural Origin

Mn and Ni concentrations and distribution are mostly determined by their natural abundance. This is testified to by their low mean TEF, their consistency between top and deep layers in terms of statistical parameters, their comparable distribution in the investigated area, and their top layer association with F2 under PCA.
Areas showing high contents in Mn and Ni lie in the southern part of the Plain of Lombardy and in fields close to the Po river (Figure 6 and Figure S2). This finding is already mentioned in [43] and in [44] and is related to the presence of serpentine, a common mineral from mafic and ultramafic rocks (serpentinites and peridotites), which are found in the Apennines [45,46]. The erosion and transport of these rocks originated the sediments presently forming the plain. The same anomaly is found in the Plain of Piedmont [11,47] and east of the investigated area [48]. Other authors [49,50] also documented the presence of serpentine in the solid transport of the Po river. The high Mn and Ni content of fields close to the river may therefore originate from the river itself.
Another area showing high F2 scores occurs in the Alpine foothills, especially around the cities of Bergamo and Brescia. No spatial correlation with the presence of mafic and ultramafic rocks can be posited for this area, since outcrops of such rocks are located far further north in the Alps, and the intermission of large lakes prevents sediments from reaching the plain. Similarly, no relationship could be found for Quaternary formations such as loess, moraines, and fluvial deposits. X-ray diffraction data have occasionally evidenced Nimite, a Ni-rich chlorite that derives from the physical weathering of mafic minerals. Elsewhere, high amorphous material contents have been found, corresponding to poorly crystalline Fe and Mn hydroxides, which in turn show a high sorption capacity [42]. We therefore conclude that in this area too, anomalous Mn and Ni contents originate naturally, although anthropic input for Ni cannot be excluded.
By contrast, results for the Lomellina area also show anomalously low concentrations of soil Mn. This Mn depletion may originate naturally, since these sandy soils are mostly constituted of quartz and feldspars [51]. In any case, the results of our dedicated soil profiles demonstrate low Mn and Fe in the topsoil of rice fields, together with the formation, at a depth greater than 80 cm, of Fe and Mn oxi-hydroxide coatings on sand aggregates (Figure 8).
Soil Fe-Mn precipitates and nodules are formed within the soil pore network as a result of seasonal changes in soil redox potential and in pH. Under reducing conditions, Fe and Mn oxides release Fe(II) and Mn(II) ions, respectively, to the soil solution. When the soil dries out, Fe(II) and Mn(II) oxidize and precipitate, and thus form new metal oxides [10]. Previous studies have highlighted the important role of Fe and Mn dynamics in trace metal mobilization in soils. The literature [42] reports a marked increase in the soil solution concentrations of metals like Cu, Zn, and Cd, and correlates such increases with Mn and Fe reduction and mobilization as an effect of lowered Eh in flooded soils. Further support to this interpretation is provided by the increase of Fe and Mn concentrations in groundwater during the cropping season [52]. In this area, therefore, Mn distribution is substantially determined by agricultural practices. The combination of unfavorable soil characteristics (high permeability, acidic pH, low CEC) and current irrigation practices rules out the re-use of PTEs-rich compounds, such as sewage sludge, on cultivated soils in this area. In addition, since Mn is an essential micronutrient [3], the severe Mn depletion observed in the Lomellina top soils may negatively affect crop quality [53,54].

4.2. Anthropogenic Origin

All the other PTEs considered in this study (Cd, Cu, Pb and Zn) reflect anthropogenic influences in their distribution. The most striking case is that of Pb, which occurs at high concentrations (greater than 100 mg·kg−1) in large numbers of topsoils, coincides with high TEF values, and is mainly concentrated in the Alpine foothills in the vicinity of the cities of Milan, Bergamo, and Brescia (Figure 7 and Figure S3). The literature states the atmospheric deposition of industrial emissions and road traffic as the main source of Pb in the environment. Northern Lombardy is indeed one of the most important Italian industrial districts, and houses numerous smelters and steel production plants [55]. In addition, the Torino–Venezia highway and the Milan ring road are the main regional traffic axes, and have supported exceedingly high road traffic volumes since the 1970s. Topsoil Pb enrichment of similar magnitude was previously demonstrated in the neighboring Piedmont region and around the city of Turin, and attributed to the same contamination sources [11,47,56]. The Alpine foothills also register anomalous contents of Cd, Cu, and Zn, which may reasonably be attributed to an industrial origin. The association of Cu, Pb, and Zn is indeed common in urban soils, and these elements have been identified as typical urban metals by several authors (e.g., [48,56,57,58,59]).
The regional distribution of the F1 factor, which associates Cd, Cu, and Zn, also indicates high F1 scores in the Oltrepò and the Mantua plains, both of which are mainly devoted to agriculture. The Oltrepò region is one of the most important vine-growing areas in Italy, and the Cu input is due to the long-lasting use of Cu-based pesticides. Cu is associated with Zn and Cd, which are present as impurities in these pesticides [3]. Dedicated profiles (e.g., Figure 2) also showed topsoil enrichment both in Pb, which is possibly related to this metal’s use as a stabilizer when pesticides are applied with helicopters, and in Mn, which is liberally added to control other pests. PTEs are strongly retained in the top layer, since soils are rich in clay and display an alkaline pH. During meteoric events, soil erosion is very active in the area [60], and Cu is transported to the rivers (concentrations in solid transport are of the same order of magnitude as those detected in the top soils) and eventually to groundwater (up to 0.8 mg/L) [37]. This association of this type of contamination to agricultural practices has already been evidenced, both in Lombardy [43] and in neighboring regions [11,32,47], and is a well-known problem in other European countries too (e.g., [61,62]. In the Mantua and Cremona plains, Cu and Zn enrichment can be attributed to the long lasting agricultural re-use of manure [63] and sewage sludge [64], an attribution that can also be indicated for our dedicated soil profile results (Figure 3). Although soils in this area do not generally exceed regulatory limits for this type of agronomical practice, it should be noted that deep tillage has spread contamination through the top layer to a depth of as much as 50 cm. A calculation of total deposited PTEs for each profile was performed and based on the assumptions that the affected layer was 40 cm thick, that a natural metal content was established in the deep layer (60–80 cm for most PTEs, data from the regional database for Cd), and that bulk density was 1.5 kg·dm−3. For the soil profile shown in Figure 3, this calculation produces the following figures in kg ha−1: Cd = 15; Cu = 213; Ni = 70; Pb =167; and Zn = 432. By comparing these values with those indicated by the European legislation [65], which stipulates a maximum yearly input of PTEs to agricultural soils on a decennial basis (Cd = 0.15; Cu = 12; Ni = 3; Pb =15; Zn = 30 kg·ha−1), and assuming that manure and sludge application lasted at least 20 years, Cd and Ni appear to exceed the maximum input level, and Cu and Zn are also approaching the limit, as already evidenced by [64]. Accordingly, in this area too, agricultural re-use of manure and sewage sludge should be permitted only after careful assessment both of the present topsoil concentration and of the thickness of the affected layer.

5. Conclusions and Management Recommendations

This study identifies agriculturally induced PTEs contamination in cultivated soils by combining a regional investigation, which covers the whole area of interest with high sampling density, and three site-specific investigations. In Lombardy’s cultivated soils, PTEs contents are generally well below the SQGs, with the exception of Cu in vineyard soils. Topsoil Cd, Cu, Pb, and Zn contents are highly enriched, especially south of Milan and other urban areas, and can be attributed to anthropic origin. In these areas, the contribution of industrial and vehicle emissions is dominant. On the other hand, the Ni content often exceeds regulatory standards, but its association with Mn and its distribution at depth point to a natural origin. The study demonstrates that, although agricultural activities certainly contribute to PTEs contamination, especially in vineyards and intensively cultivated areas, industry and road traffic contributes substantially more, both in terms of the extent of impacted areas and, frequently, of concentrations.
One main conclusion of the study is that, given the contribution of both parent rock and non-point-source contamination to the chemical properties of soils, background values, together with realistic mandatory guidelines, are impossible to fix without extensive data collection. In addition, it is necessary not only to have a thorough knowledge of the mean/median content and the variability of PTEs in soils, but also to apportion anthropogenic and lithogenic inputs; this is an important and difficult task in populated and industrial areas, where totally unpolluted soils are almost impossible to find. Therefore, correct geochemical interpretation of the data is a prerequisite to establish both reliable and realistic guidelines.
The methodological approach adopted in this study, namely that of using site-specific investigations to validate the interpretation provided by regional data, is suitable to discriminate sources on a sound scientific basis.
Although support exists for the continued re-use of animal manure and sewage sludge as fertilizers, producers should aim at reducing the PTEs contents of these substances, in line with the EU indications. Several critical areas have been identified where PTEs accumulation and/or PTEs leaching to groundwater can occur. In the first case (which regards the Plain of Lombardy, and especially the south-lying provinces of Cremona and Mantua), PTEs accumulation is favored by high soil pH and clay content. In the second case (which regards Lomellina), PTEs leaching is favored by acidic pH, coarse grain size, and intensive irrigation practices. In both areas, the use of these substances should be carefully evaluated on a site-specific basis.
Finally, in the third area (the Oltrepò), high Cu and Zn accumulation in vineyard soils stresses the urgent need to reduce the input of these PTEs by changing the composition of pesticides. In addition, cost effective approaches to remediation (e.g., phytoremediation) should be tested.

Supplementary Materials

The following are available online at https://www.mdpi.com/2075-163X/10/4/298/s1, Figure S1: Frequency histograms for PTEs concentration values in the top and in the deep soil samples, Figure S2: Distribution maps of the PTEs contents for both the top and the deep soil layers, Figure S3: Distribution maps of the PTEs TEF. Table S1: Correlation matrices for all PTEs and soil parameters, both in the top and in the deep layers, Table S2: Results of the PCA (Top layer, PTEs, and soil parameters), Table S3: Results of the PCA (Deep layer, PTEs, and soil parameters), Table S4: Results of the PCA of PTEs concentrations in the top layer (3 factors selected), Table S5: Results of the PCA of HM concentrations in the deep layer (4 factors selected), Table S6: Soil parameters and PTEs contents from the dedicated profiles, Table S7: Number of samples and percentage of samples exceeding the SQGs defined by the Italian legislation for residential/green and for industrial/commercial areas [38], for agricultural areas [39], and for sewage sludge re-use in agriculture [40].

Author Contributions

Conceptualization, E.S. and S.B.; Data curation, V.M.S.; Formal analysis, E.S. and S.F.G.; Funding acquisition, E.S. and S.B.; Investigation, S.F.G., A.L., V.M.S., and M.S.; Methodology, E.S., S.B., and A.L.; Project administration, E.S. and S.B.; Resources, S.B. and V.M.S.; Supervision, E.S. and S.B.; Visualization, E.S. and S.F.G.; Writing—original draft, E.S.; Writing—review and editing, S.B., V.M.S., and M.S. All authors have read and agreed to the published version of the manuscript.

Funding

This research was co-funded by the Regional Direction for Agriculture (Regione Lombardia) and by the Ministry of University and Research (PRIN 2004). The publication was finalized in the frame of the project CE4WE (Circular economy for water and energy) funded by Regione Lombardia.

Conflicts of Interest

The authors declare no conflict of interest. The funders had no role in the design of the study; in the collection, analyses, or interpretation of data; in the writing of the manuscript, or in the decision to publish the results.

References

  1. Pourret, O.; Hursthouse, A. It’s time to replace the term “heavy metals” with “potentially toxic elements” when reporting environmental research. Int. J. Environ. Res. Public Health 2019, 16, 4446. [Google Scholar] [CrossRef] [Green Version]
  2. Cabral Pinto, M.M.S.; Silva, M.M.V.G.; Ferreira da Silva, E.A.; Dinis, P.A.; Rocha, F. Transfer processes of potentially toxic elements (PTE) from rocks to soils and the origin of PTE in soils: A case study on the island of Santiago (Cape Verde). J. Geochem. Explor. 2017, 183, 140–151. [Google Scholar] [CrossRef]
  3. Alloway, B.J., III (Ed.) Heavy Metals in Soils; Springer: Dordrecht, The Netherlands, 2013; ISBN 978-94-007-4469-1. [Google Scholar]
  4. Stolte, J.; Tesfai, M.; Øygarden, L.; Kværnø, S.; Keizer, J.; Verheijen, F.; Panagos, P.; Ballabio, C.; Hessel, R. (Eds.) Soil threats in Europe; EUR 27607 EN; European Union: Luxembourg, 2016; ISBN 978-92-79-54018-9. [Google Scholar]
  5. Imrie, C.E.; Korre, A.; Munoz-Melendez, G.; Thornton, I.; Durucan, S. Application of factorial kriging analysis to the FOREGS European topsoil geochemistry database. Sci. Total Environ. 2008, 393, 96–110. [Google Scholar] [CrossRef] [PubMed]
  6. Lado, L.R.; Hengl, T.; Reuter, H.I. Heavy metals in European soils: A geostatistical analysis of the FOREGS Geochemical database. Geoderma 2008, 148, 189–199. [Google Scholar] [CrossRef]
  7. Tóth, G.; Hermann, T.; Da Silva, M.R.; Montanarella, L. Heavy metals in agricultural soils of the European Union with implications for food safety. Environ. Int. 2016, 88, 299–309. [Google Scholar] [CrossRef] [PubMed]
  8. Selim, H.; Kingery, W. (Eds.) Geochemical and Hydrological Reactivity of Heavy Metals in Soils; CRC Press: Boca Raton, FL, USA, 2003; ISBN 9781566706230. [Google Scholar]
  9. Violante, A.; Huang, P.M.; Gadd, G.M. (Eds.) Biophysico-Chemical Processes of Heavy Metals and Metalloids in Soil Environments; John Wiley and Sons: Hoboken, NJ, USA, 2008. [Google Scholar]
  10. Liu, F.; Colombo, C.; Adamo, P.; He, J.Z.; Violante, A. Trace elements in manganese-iron nodules from a chinese alfisol. Soil Sci. Soc. Am. J. 2002, 66, 661–670. [Google Scholar] [CrossRef]
  11. Facchinelli, A.; Sacchi, E.; Mallen, L. Multivariate statistical and GIS-based approach to identify heavy metal sources in soils. Environ. Pollut. 2001, 114, 313–324. [Google Scholar] [CrossRef]
  12. Science Communication Unit―University of the West of England. Science for Environment Policy In-depth Report: Soil Contamination: Impacts on Human Health; Science Communication Unit―University of the West of England: Bristol, UK, 2013. [Google Scholar]
  13. Peralta-Videa, J.R.; Lopez, M.L.; Narayan, M.; Saupe, G.; Gardea-Torresdey, J. The biochemistry of environmental heavy metal uptake by plants: Implications for the food chain. Int. J. Biochem. Cell Biol. 2009, 41, 1665–1677. [Google Scholar] [CrossRef]
  14. Jones, A.; Panagos, P.; Barcelo, S.; Bouraoui, F.; Bosco, C.; Dewitte, O.; Gardi, C.; Erhard, M.; Hervás, J.; Hiederer, R.; et al. The State of Soil in Europe―A Contribution of the JRC to the European Environment Agency’s State and Outlook Report―SOER 2010; Publications Office: Luxembourg, 2012.
  15. Van-Camp, L.; Bujarrabal, B.; Gentile, A.R.; Jones, R.J.A.; Montanarella, L.; Olazabal, C.; Selvaradjou, S.-K. Reports of the Technical Working Groups Established under the Thematic Strategy for Soil Protection; European Communities: Luxembourg, 2004. [Google Scholar]
  16. Salminen, R.; Batista, M.J.; Bidovec, M.; Demetriades, A.; De Vivo, B.; De Vos, W.; Duris, M.; Gilucis, A.; Gregorauskiene, V.; Halamic, J.; et al. Geochemical atlas of Europe. Part 1, Background Information, Methodology and Maps; Salminen, R., Ed.; Geological Survey of Finland: Espoo, Finland, 2005; ISBN 951-690-921-3.
  17. Tóth, G.; Jones, A.; Montanarella, L. LUCAS Topsoil Survey. Methodology, Data and Results; EUR 26102 EN; European Community, Publications Office of the European Union: Luxembourg, 2013.
  18. He, Z.L.; Yang, X.E.; Stoffella, P.J. Trace elements in agroecosystems and impacts on the environment. J. Trace Elem. Med. Biol. 2005, 19, 125–140. [Google Scholar] [CrossRef]
  19. Diacono, M.; Montemurro, F. Long-term effects of organic amendments on soil fertility. A review. Agron. Sustain. Dev. 2010, 30, 401–422. [Google Scholar] [CrossRef] [Green Version]
  20. Brenna, S.; D’Alessio, M.; Solaro, S. Carta dei suoli della Lombardia, Scala 1:250.000; S.E.L.C.A.: Firenze, Italy, 2004. [Google Scholar]
  21. Soil Atlas of Europe; EUR 21676 EN; European Soil Bureau Network, European Commission: Luxembourg, 2005; ISBN 92-894-8120-X.
  22. Costantini, E.A.; Dazzi, C. (Eds.) The Soils of Italy; Springer: Dordrecht, The Netherlands, 2013. [Google Scholar]
  23. ISSS; ISRIC; FAO. World Reference Base for Soil Resources; FAO: Rome, Italy, 1998; ISBN 92-5-104141-5. [Google Scholar]
  24. USDA Soil Survey Staff. Keys to Soil Taxonomy, 9th ed.; USDA NRCS: Washington, DC, USA, 2003.
  25. per le Politiche Agricole, M. Metodi ufficiali di analisi chimica del suolo. DM Del. 1999, 13, 1999. [Google Scholar]
  26. Zhang, C.; Manheim, F.T.; Hinde, J.; Grossman, J.N. Statistical characterization of a large geochemical database and effect of sample size. Appl. Geochem. 2005, 20, 1857–1874. [Google Scholar] [CrossRef]
  27. Zygmont, C.; Smith, M.R. Robust factor analysis in the presence of normality violations, missing data, and outliers: Empirical questions and possible solutions. Quant. Methods Psychol. 2014, 10, 40–55. [Google Scholar] [CrossRef] [Green Version]
  28. Kaiser, H.F. The varimax criterion for analytic rotation in factor analysis. Psychometrika 1958, 23, 187–200. [Google Scholar] [CrossRef]
  29. Biscaye, P.E. Mineralogy and sedimentation of recent deep-sea clay in the Atlantic Ocean and adjacent seas and oceans. Bull. Geol. Soc. Am. 1965, 76, 803–832. [Google Scholar] [CrossRef]
  30. Moore, D.M.; Reynolds, R.C. X-ray Diffraction and the Identification and Analysis of Clay Minerals; Oxford University Press: New York, NY, USA, 1989. [Google Scholar]
  31. Bradl, H.; Kim, C.; Kramar, U.; StÜben, D. Heavy Metals in the Environment: Origin, Interaction and Remediation; Interface; Elsevier B.V.: Amsterdam, The Netherlands, 2005; ISBN 9780120883813. [Google Scholar]
  32. ARPA Piemonte 5. Suolo. In Lo Stato dell’Ambiente in Piemonte 2012; ARPA Piemonte: Torino, Italy, 2012; p. 23. [Google Scholar]
  33. Sinclair, A.J. Statistical interpretation of soil geochemical data. In Exploration Geochemistry: Design and Interpretation of Soil Surveys; Robertson, J.M., Ed.; Reviews in Economic Geology 3, Society of Economic Geologists; Society of Economic Geologists: Littleton, CO, USA, 1986; pp. 97–115. [Google Scholar]
  34. Gough, L.P.; Severson, L.C.; Jackson, L.L. Baseline element concentration in soils and plants, Bull Island, Cape Romain, National Wildlife Refuge, South Carolina, USA. Water Air Soil Pollut. 1994, 74, 1–17. [Google Scholar] [CrossRef]
  35. Chen, M.; Ma, L.Q.; Harris, W.G. Baseline concentrations of 15 trace elements in Florida surface soils. J. Environ. Qual. 1999, 28, 1173–1181. [Google Scholar] [CrossRef] [Green Version]
  36. Reimann, C.; Garrett, R.G. Geochemical background―Concept and reality. Sci. Total Environ. 2005, 350, 12–27. [Google Scholar] [CrossRef]
  37. Sacchi, E.; Brenna, S.; Fornelli Genot, S.; Sale, V.M.; Azzolina, L.; Leoni, M.A. Analisi del Contenuto in Rame ed Altri Metalli nei Suoli Agricoli Lombardi; Regione Lombardia Quaderni della Ricerca n.61; Regione Lombardia: Milan, Italy, 2007. [Google Scholar]
  38. Lgs, D. 152/2006. Norme in materia ambientale. Gazz. Uff. Ser. Gen. 2006, 88, 1–425. [Google Scholar]
  39. Regolamento relativo agli interventi di bonifica, di ripristino ambientale e di messa in sicurezza, d’emergenza, operativa e permanente, delle aree destinate alla produzione agricola e all’allevamento, ai sensi dell’articolo 241 del decreto legislativo 3. Gazz. Uff. Ser. Gen. 2019, 132, 1–13.
  40. Lgs, D. 99/92. Attuazione della direttiva 86/278/CEE concernente la protezione dell’ambiente, in particolare del suolo, nell’utilizzazione dei fanghi di depurazione in agricoltura. Gazz. Uff. Ser. Gen. 1992, 38, 113–119. [Google Scholar]
  41. Reimann, C.; De Caritat, P. Distinguishing between natural and anthropogenic sources for elements in the environment: Regional geochemical surveys versus enrichment factors. Sci. Total Environ. 2005, 337, 91–107. [Google Scholar] [CrossRef] [PubMed]
  42. Sposito, G. The Chemistry of Soils, 2nd ed.; Oxford University Press: Oxford, UK, 2008; ISBN 978-0-19-531369-7. [Google Scholar]
  43. Sacchi, E.; Brenna, S.; Setti, M.; Leoni, M.A.; Garzetti, F.; Dallera, D. I metalli pesanti nei suoli agrari della Provincia di Pavia. Atti Ticinensi di Sci. della Terra 2007, 45, 83–97. [Google Scholar]
  44. Cenci, R.; Lodigiani, G.; Benedetti, A.; Beone, G.M.; Bouraoui, F.; Brangi, A.; Brenna, S.; Carlon, C.; Filippi, N.; Casale, M.; et al. Il Suolo della Provincia di Pavia (Valutazione della Concentrazione di Composti Organici e Inorganici Persistenti Attraverso lo Sviluppo di una Rete di Monitoraggio del Suolo); Cenci, R., Lodigiani, G., Eds.; Edizioni Torchio De’ Ricci: Certosa di Pavia, Italy, 2006; ISBN 92-894-8619-8. [Google Scholar]
  45. Lombini, A.; Dinelli, E.; Ferrari, C.; Simoni, A. Plant―soil relationships in the serpentinite screes of Mt. Prinzera (Northern Apennines, Italy). J. Geochem. Explor. 1998, 64, 19–33. [Google Scholar] [CrossRef]
  46. Apollaro, C.; Fuoco, I.; Brozzo, G.; Rosa, R. De Release and fate of Cr (VI) in the ophiolitic aquifers of Italy: The role of Fe (III) as a potential oxidant of Cr (III) supported by reaction path modelling Science of the Total Environment Release and fate of Cr (VI) in the ophiolitic aquifers. Sci. Total Environ. 2019, 660, 1459–1471. [Google Scholar] [CrossRef]
  47. ARPA Piemonte Stato dell’Ambiente in Piemonte. Relazione 2019. Available online: http://relazione.ambiente.piemonte.it/2019/it/territorio/stato/suolo-contaminazione (accessed on 24 March 2020).
  48. Gherardi, M.; Pontalti, F.; Vianello, G.; Antisari Vittori, L. Heavy metals in the soil-plant system: Monitoring urban and extra-urban parks in the Emilia Romagna Region (Italy). Agrochimica 2009, 53, 196–208. [Google Scholar]
  49. Tomadin, L.; Varani, L. Provenance and downstream mineralogical evolution of the muds transported by the Po River (Northern Italy). Mineral. Petrogr. Acta 1998, 41, 205–224. [Google Scholar]
  50. Pettine, M.; Camusso, M.; Martinotti, W.; Marchetti, R.; Passino, R.; Queirazza, G. Soluble and particulate metals in the Po River: Factors affecting concentrations and partitioning. Sci. Total Environ. 1994, 145, 243–265. [Google Scholar] [CrossRef]
  51. Caucia, F.P.; Maninoni, L.T. Composizione mineralogica dei terreni delle risaie del pavese e del novarese. MICRO Not. Mineral. 2004, 1, 13–24. [Google Scholar]
  52. Sacchi, E.; Acutis, M.; Bartoli, M.; Brenna, S.; Delconte, C.A.; Laini, A.; Pennisi, M. Origin and fate of nitrates in groundwater from the central Po plain: Insights from isotopic investigations. Appl. Geochem. 2013, 34, 164–180. [Google Scholar] [CrossRef]
  53. Martens, D.C.; Westermann, D.T. Fertilizer Applications for Correcting Micronutrient Deficiencies. In Micronutrients in Agriculture; Mortvedt, J.J., Ed.; SSSA Book Ser. 4; Soil Science Society of America: Madison, WI, USA, 1991; pp. 549–592. [Google Scholar]
  54. Pirzadeh, M.; Afyuni, M.; Khoshgoftarmanesh, A.; Schulin, R. Micronutrient status of calcareous paddy soils and rice products: Implication for human health. Biol. Fertil. Soils 2010, 46, 317–322. [Google Scholar] [CrossRef]
  55. ISTAT. I Distetti Industriali 2011―9° Censimento Dell’Industria e dei Servizi e Censimento Delle Istituzioni non Profit; ISTAT: Roma, Italy, 2015; ISBN 978-88-458-1859-2.
  56. Biasioli, M.; Barberis, R.; Ajmone-Marsan, F. The influence of a large city on some soil properties and metals content. Sci. Total Environ. 2006, 356, 154–164. [Google Scholar] [CrossRef] [PubMed]
  57. Manta, D.S.; Angelone, M.; Bellanca, A.; Neri, R.; Sprovieri, M. Heavy metals in urban soils: A case study from the city of Palermo (Sicily), Italy. Sci. Total Environ. 2002, 300, 229–243. [Google Scholar] [CrossRef]
  58. Amjadian, K.; Sacchi, E.; Rastegari Mehr, M. Heavy metals (HMs) and polycyclic aromatic hydrocarbons (PAHs) in soils of different land uses in Erbil metropolis, Kurdistan Region, Iraq. Environ. Monit. Assess. 2016, 188, 605. [Google Scholar] [CrossRef] [PubMed]
  59. Rastegari Mehr, M.; Keshavarzi, B.; Moore, F.; Sacchi, E.; Lahijanzadeh, A.R.; Eydivand, S.; Jaafarzadeh, N.; Naserian, S.; Setti, M.; Rostami, S. Contamination level and human health hazard assessment of heavy metals and polycyclic aromatic hydrocarbons (PAHs) in street dust deposited in Mahshahr, southwest of Iran. Hum. Ecol. Risk Assess. 2016, 22, 1726–1748. [Google Scholar] [CrossRef]
  60. Dazzi, C.; Lo Papa, G. Soil threats. In The soils of Italy; Costantini, E.A.C., Dazzi, C., Eds.; Springer: Dordrecht, The Netherlands, 2013; pp. 205–246. [Google Scholar]
  61. Chaignon, V.; Sanchez-Neira, I.; Herrmann, P.; Jaillard, B.; Hinsinger, P. Copper bioavailability and extractability as related to chemical properties of contaminated soils from a vine-growing area. Environ. Pollut. 2003, 123, 229–238. [Google Scholar] [CrossRef]
  62. Komárek, M.; Čadková, E.; Chrastný, V.; Bordas, F.; Bollinger, J.C. Contamination of vineyard soils with fungicides: A review of environmental and toxicological aspects. Environ. Int. 2010, 36, 138–151. [Google Scholar] [CrossRef]
  63. Mantovi, P.; Bonazzi, G.; Maestri, E.; Marmiroli, N. Accumulation of copper and zinc from liquid manure in agricultural soils and crop plants. Plant Soil 2003, 250, 249–257. [Google Scholar] [CrossRef]
  64. Moolenaar, S.W.; Beltrami, P. Heavy metal balances of an Italian soil as affected by sewage sludge and bordeaux mixture applications. J. Environ. Qual. 1998, 27, 828–835. [Google Scholar] [CrossRef]
  65. Directive, C. Council Directive 86/278/EEC of 12 June 1986 on the protection of the environment, and in particular of the soil, when sewage sludge is used in agriculture. Off. J. Eur. Communities 1986, 181, 6–12. [Google Scholar]
Figure 1. Study area: (a) Location in northern Italy; (b) Location of the top soil samples on the land use map. The main cities are MI = Milan, BG = Bergamo, BS = Brescia, CO = Como, CR = Cremona, LC = Lecco, LO = Lodi, MN = Mantova, PV = Pavia, and VA = Varese.
Minerals 10 00298 g001
Figure 2. Example of PTEs distribution with depth in a soil profile from the Oltrepò area, devoted to vine cultivation. Soil horizons are also indicated.
Minerals 10 00298 g002
Figure 3. Example of PTEs distribution with depth in a soil profile from the Cremona area, devoted to maize and wheat cultivation. Soil horizons are also indicated.
Minerals 10 00298 g003
Figure 4. Example of PTEs distribution with depth in a soil profile from the from the Lomellina area, devoted to rice cultivation. Soil horizons are also indicated.
Minerals 10 00298 g004
Figure 5. Boxplots for PTEs concentration values in top and deep soils, according to the dominant land use. Red line: soil quality guidelines (SQGs) for agricultural land use [39]; green line: SQGs for residential/public green areas [38].
Minerals 10 00298 g005
Figure 6. Spatial interpolation of the PCA results obtained for the top layer samples (scores): (a) F1, associating Cd, Cu, and Zn; (b) F2, associating Mn and Ni.
Minerals 10 00298 g006
Figure 7. Distribution of Pb concentration values determined in top soil samples.
Minerals 10 00298 g007
Figure 8. Characteristics of sand aggregates separated from the Lomellina soils: (a) X-ray powder diffraction pattern identifying the main mineral phases; (b) Electron microscope image showing the general aspect; (c,d) More detailed images with identification of the main minerals and the oxide coatings; (e) EDS spectra of the Mn and Fe coatings deposited on the silicates.
Minerals 10 00298 g008
Table 1. Descriptive statistics of the potentially toxic elements (PTEs) contents (mg kg−1) in the top and deep soil layers.
Top LayerCuNiPbZnCdMnCd > DL
Number of samples1449144914491449144914491057
Mean34.545.950.189.90.555550.75
Mode15.420.422.873.4≤DL4240.2
Standard deviation40.664.1181.1112.81.243361.40
Kurtosis102.11176.85707.15267.54550.4527.09455.97
Skewness8.1910.9125.0014.2919.203.0317.95
Minimum0.40.40.26.8≤DL20.02
Maximum67212225640272837.7493937.69
Percentiles 2517.820.022.459.6≤DL3280.20
      5024.428.931.677.40.205140.40
      7536.049.548.698.20.637120.98
      9060.299.473.6111.61.429361.70
      9588.8119.7103.6136.52.0010822.00
Deep layerCuNiPbZnCdMnCd > DL
Number of samples981981981981981981807
Mean19.348.217.457.20.555060.67
Mode8.6019.80.2023.0≤DL2340.20
Standard deviation11.450.916.164.40.843960.89
Kurtosis4.6041.6383.75311.6513.8012.5012.02
Skewness1.654.946.3115.643.232.813.04
Minimum2.42.00.23.6≤DL140.03
Maximum93.2686.0285.01477.07.0034557.00
Percentiles 2511.221.68.4332.90.10241.80.16
      5017.433.815.051.20.20418.00.37
      7525.054.021.471.50.66644.00.80
      9034.198.631.291.21.55905.91.61
      9541.0133.639.4103.82.0010802.16
Table 2. Baseline concentration ranges (mg kg−1) calculated for the investigated area.
Top LayerGeometric MeanGeometric SDBaseline Concentration Range
Cd (>DL)0.462.510.07–2.90
Cu26.711.907.40–96.4
Ni33.212.067.82–141
Pb32.942.167.06–154
Zn76.591.6029.9–196
Mn4661.89130–1665
Deep LayerGeometric MeanGeometric SDBaseline Concentration Range
Cd (>DL)0.372.910.04–3.14
Cu16.51.785.19–52.2
Ni35.02.187.36–166
Pb12.52.611.84–84.9
Zn47.41.8214.3–157
Mn4002.00100–1592

