Article

Microbial Diversity Responding to Changes in Depositional Conditions during the Last Glacial and Interglacial Period: NE Ulleung Basin, East Sea (Sea of Japan)

1
Department of Earth System Sciences, Yonsei University, Seoul 03722, Korea
2
East Sea Research Institute, Korea Institute of Ocean Science and Technology (KIOST), Uljin 36315, Korea
3
Department of Oceanography, Pusan National University, Busan 46241, Korea
4
Marine Active Fault Research Center, Korea Institute of Ocean Science and Technology (KIOST), Busan 49111, Korea
5
Department of Biological Science and Biotechnology, Hannam University, Daejeon 34054, Korea
6
Division of Polar Paleoenvironment, Korea Polar Research Institute (KOPRI), Incheon 21990, Korea
*
Author to whom correspondence should be addressed.
Minerals 2020, 10(3), 208; https://doi.org/10.3390/min10030208
Submission received: 30 December 2019 / Revised: 14 February 2020 / Accepted: 24 February 2020 / Published: 26 February 2020
(This article belongs to the Special Issue Clays and Micro-Organisms: From Nature to Industry)

Abstract

:
Microbial interaction with minerals are significantly linked with depositional conditions during glacial and interglacial periods, providing a unique redox condition in the sedimentary process. Abiotic geophysical and geochemical properties, including sedimentary facies, magnetic susceptibility, grain size, clay mineralogy, and distribution of elemental compositions in the sediments, have been widely used to understand paleo-depositional environments. In this study, microbial abundance and diversity in the core sediments (6.7 m long) from the northeastern slope of Dokdo Island were adapted to characterize the conventionally defined sedimentary depositional units and conditions in light of microbial habitats. The units of interglacial (Unit 1, <11.5 ka) and late glacial (Unit 2, 11.5–14.5 ka) periods in contrast to the glacial period (Unit 3, >14.5 ka) were distinctively identified in the core, showing a sharp boundary marked by the laminated Mn-carbonate (CaM) mud between bioturbated (Unit 1 and 2) and laminated mud (Unit 3). Based on the marker beds and the occurrence of sedimentary facies, core sediments were divided into three units, Unit 1 (<11.5 ka, interglacial), Unit 2 (11.5–14.5 ka, late glacial), and Unit 3 (>14.5 ka, glacial), in descending order. The sedimentation rate (0.073 cm/year), which was three times higher than the average value for the East Sea (Sea of Japan) was measured in the late glacial period (Unit 2), indicating the settlement of suspended sediments from volcanic clay in the East Sea (Sea of Japan), including Doldo Island. The Fe and Mg-rich smectite groups in Unit 2 can be transported from volcanic sediments, such as from the volcanic island in the East Sea or the east side of Korea, while the significant appearance of the Al-rich smectite group in Unit 1 was likely transported from East China by the Tsushima Warm Current (TWC). The appearance of CaM indicates a redox condition in the sedimentary process because the formation of CaM is associated with an oxidation of Mn2+ forming Mn-oxide in the ocean, and a subsequent reduction of Mn-oxide occurred, likely due to Mn-reducing bacteria resulting in the local supersaturation of Mn2+ and the precipitation of CaM. The low sea level (−120 m) in the glacial period (Unit 3) may restrict water circulation, causing anoxic conditions compared to the late glacial period (Unit 2), inducing favorable redox conditions for the formation of CaM in the boundary of the two units. Indeed, Planctomycetaceae, including anaerobic ammonium oxidation (ANAMMOX) bacteria capable of oxidizing ammonium coupled with Mn-reduction, was identified in the CaM layer by Next Generation Sequencing (NGS). Furthermore, the appearance of aerobic bacteria, such as Alphaproteobacteria, Gammaproteobacteria, and Methylophaga, tightly coupled with the abundance of phytoplankton was significantly identified in Unit 1, suggesting open marine condition in the interglacial period. Bacterial species for each unit displayed a unique grouping in the phylogenetic tree, indicating the different paleo-depositional environments favorable for the microbial habitats during the glacial and interglacial periods.

1. Introduction

The characteristics of lithostratigraphy in the sediments, accompanied by magnetic susceptibility, grain size distribution, clay composition, and chemical analyses of pore water, have been widely used to determine the paleo-depositional environments of seafloor sediments. Bioturbated and laminated mud, such as from two distinct sedimentary facies in the East Sea, represent a deposition of hemipelagic/pelagic sediments under oxic conditions (interglacial period) [1] and sediment inputs by turbidity current causing layered structures in anoxic conditions associated with water stratification [2]. In addition, distinctive marker beds, such as a tephra layer and specific-colored layer often found in the core sediments, are useful in determining sediment age [3]. Moreover, clay mineralogy is a potential indicator used to understand the provenance of sediment because the formation of clay minerals significantly reflects the source rock from which clay minerals are likely transported [4]. In warm climates, smectite is dominant due to chemical alteration, while illite prevails in cold climates due to physical weathering [5]. Nonetheless, analyzing clay minerals is complicated due to the mixture of numerous provenance and transport paths, and thus, further geochemical analyses are necessary [6]. As smectite has a specific composition depending on the provenances, measuring the elemental composition of smectite is a potential way to solve this problem [7]. Recently, analyses of the elemental composition of smectite at a nanoscale using transmission electron microscopy (TEM) energy-dispersive spectroscopy (EDS) were performed to elucidate the types of smectite, which are defined by various elemental compositions that could have different sources [8].
Recently, the interaction of microbes with clay minerals has been significantly linked with depositional conditions, providing a unique redox condition in the sedimentary process [9,10,11]. The interpretation of environments with microbial abundance, so-called ‘metagenomics’, are mostly used in the microbial ecology field to understand soil and marine environments [12]. For example, the smectite of clay minerals has a large surface area, a high cation exchange capacity (CEC), and variable elemental compositions that are sensitive to the redox reaction in the sedimentary process, reflecting the depositional condition [13]. Furthermore, microbe-clay mineral interactions strongly reflect the redox conditions and microbial habitats [14,15]. Microbial Mn/Fe oxidation was reported as an important process for the formation of Fe-Mn crust, indicating that local oxidation occurred in the reduction of dominant paleo-depositional conditions [16]. Nonetheless, there is a limited understanding of how characteristic lithostratigraphy is reflected by microbial diversity and interactions with minerals. In the present study, the microbial communities, with bubble chart and phylogenic tree [17], were used to characterize the depositional conditions of sedimentary facies.

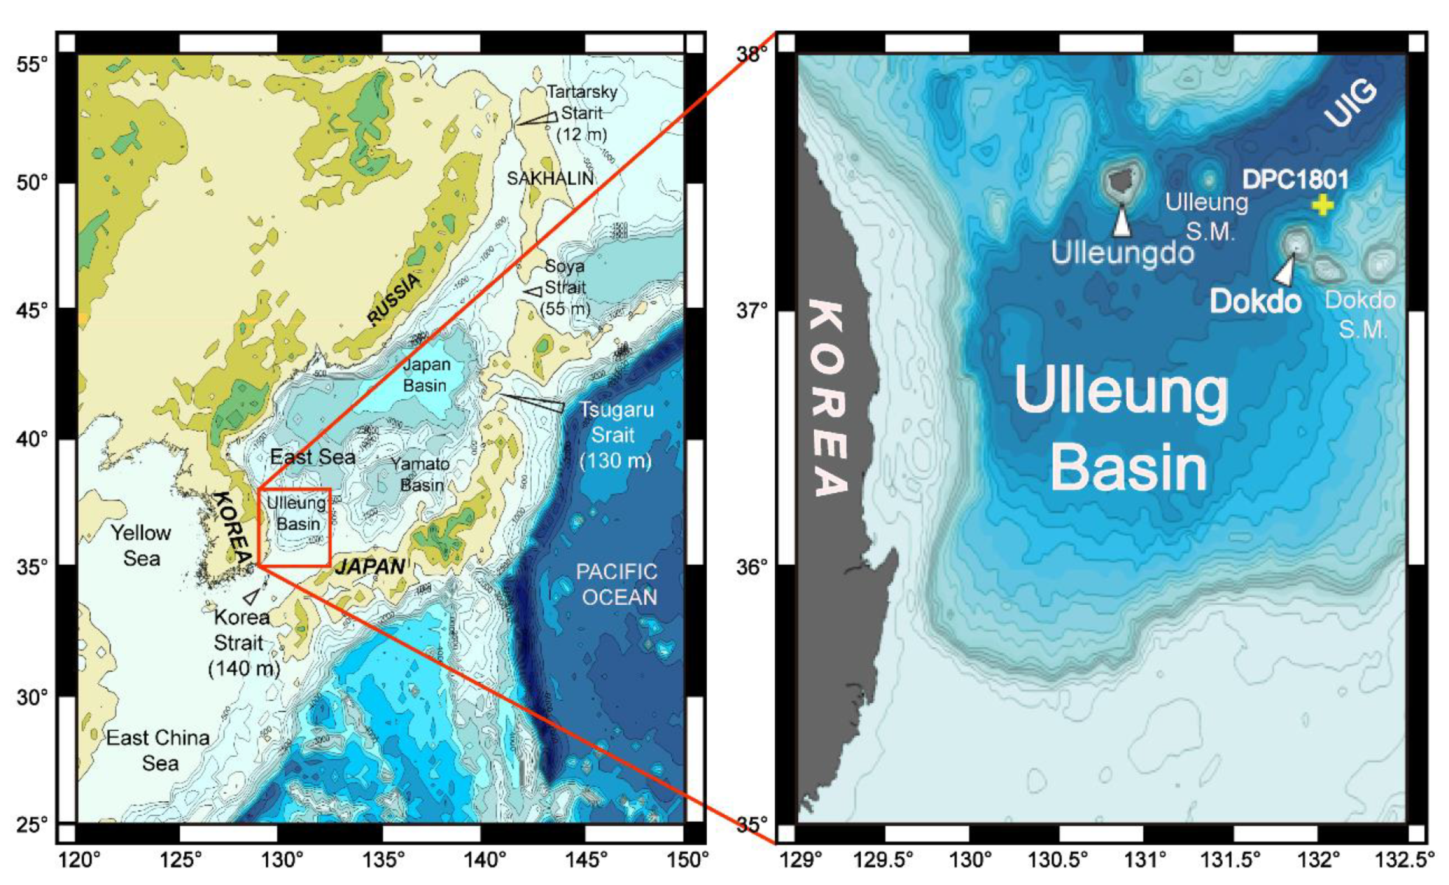
2. Geological Setting

The East Sea is a semi-enclosed marginal sea surrounded by the Korean Peninsula, Japan, and Russia (Figure 1). Back-arc spreading of the Eurasia plate, which is a consequence of the subduction of the Pacific plate, formed the East Sea during the early Oligocene to middle Miocene Periods [18]. There are three basins in the East Sea: the Japan Basin (average depth: 3500–3700 m), the Yamato Basin (2500–2700 m), and the Ulleung Basin (2000–2300 m) [19]. The Ulleung Basin (UB) is characterized by a bowl-shaped basin connected to the Japan Basin via the Ulleung Interplain Gap (UIG), a very deep (2500 m) and wide (~75 km) passage [20] (Figure 1). There are distinctive islands and seamounts in the UB: Ulleung Island, the Ulleung Seamount (Anyongbok Seamount), Dokdo Island (study area), and Dokdo Seamounts (Simheungtaek Seamount and Isabu Seamount) [21].
The East Sea is attached to the Pacific Ocean through four straits: the Korea (140 m deep), Tsugaru (130 m), Soya (55 m) and Tartarsky (12 m) straits [18]. The Tsushima Warm Current (TWC), a branch of the warm Kuroshio Current that originates from East China Sea or the Taiwan Warm Current [22,23], is the main current in UB. It flows through the Korea Strait (a depth of 140 m) and is discharged through the Tsugaru (130 m) and Soya (55 m) straits [18]. Due to the shallow depth of these four straits (from 12 m to 140 m), the falling sea level during the glacial period caused all straits to be exposed to land, causing the East Sea to become an isolated lake within the continent [24,25].

3. Materials and Methods

3.1. Core Acquisition and Sedimentary Facies

Core sediments (6.7 m long) were collected from the northeastern slope (132°03.62’, 37°20.10’) of Dokdo Island using a piston core in 2018 (Figure 1). After core splitting, macroscopic sedimentary features and sediment color were described based on core photographs using an Itrax core scanner. X-radiographs in 1-cm thick slabs were taken to further describe the sedimentary structures in detail. Grain size was analyzed using standard sieves for sand (>63 µm) and a Mastersizer 2000 for mud (<63 µm) at intervals ranging from 5 to 50 cm.

3.2. X-ray Fluorescence (XRF) and Magnetic Susceptibility (MS)

Elemental composition was measured by an XRF scanner (Itrax core scanner, OCEANTECH, Incheon, Korea) at 5.0-mm intervals. Magnetic susceptibility values were calculated by an automated MS-analysis system (MS2-C sensor and MAGTRAK software; Library of Marine Samples, South Sea Research Institute, Korea Institute of Ocean Science and Technology) at 4.0-cm intervals.

3.3. X-ray Diffractometer (XRD)

X-ray profiles were recorded with an X-ray diffractometer (Rigaku Miniflex II) at a 1.5º/min scan speed, 30 kV, and 15 mA via Cu-Kα radiation at Yonsei University, Seoul, Korea. The pretreatment samples were prepared for a random-oriented mount, oriented (air-dried) mount, and glycolation. The random-oriented mount was used to identify bulk mineral composition, ranging from 2θ at 2–70°. After the random-oriented mount measurement, the samples were size-fractionated (<2 µm) and air-dried for oriented-mount analysis to detect clay mineralogy, ranging from 2θ at 2–40°. The air-dried samples were then treated with glycolation under a vacuum desiccator for 24 h. The glycolated samples were profiled over ranges from 2θ at 2–10°. The relative proportions of clay minerals, such as smectite, illite, chlorite, and kaolinite, were evaluated by Biscaye’s (1965) semi-quantification method based on the glycolated XRD results using the Origin program [26].

3.4. Transmission Electron Microscope (TEM)

The targeting samples for the transmission electron microscope (TEM), representing each unit, were selected based on the semi-quantification results: 40 cm below the sea floor (cmbsf) in Unit 1 (U1) and 385 cmbsf in Unit 2 (U2). In addition, the rock powder samples from Dokdo Island were measured. Before measuring with the TEM, the clay particles from the samples were rehydrated and then impregnated with LR White resin to prevent dehydration, which could alter the clay structure during the TEM measurement. After the replacement of LR White resin, the TEM specimens were cut to place in a holey carbon TEM Cu-grid by ultramicrotome (ULTRACUT UCT, Leica, at Eulji University, Seongnam, Korea) with a thickness of 100 nm. The clay structures and elemental compositions were measured by a JEOL JEM-ARM 200F TEM with energy-dispersive X-ray spectroscopy (EDS) at Yonsei University, Incheon, Korea. The images of lattice fringe were used to classify smectite (12-13 Å, parallel to c*) from the other minerals with Digital Micrograph software (3.31.2360.0, Gatann Inc., Pleasanton, CA, USA). The elemental composition of each unit was calculated based on 20 oxygen atoms with 4 hydroxyl groups.

3.5. Extraction of DNA from Sediment Samples

Sediment samples (5 grams each for 16 samples) were centrifuged at 8000g for 5 min to remove the seawater. The total DNAs for the metagenomic analysis was prepared from 1g of sediment pellets using a DNeasy PowerSoil Pro Kit (QIAGEN 47014, Hilden, Germany) according to the manufacturer’s protocol. DNA was isolated several times to ensure NGS for 16S rRNA, and at least 20 ng of DNA was collected. The ethanol precipitation and sodium acetate protocol were used to concentrate the isolated DNAs [27]. All DNA samples for next generation sequencing were resuspended in a 10mM TE buffer (pH7.5) and stored at −20 °C. Quantity and quality of the DNA were confirmed with a Nanodrop Lite spectrophotometer (Thermo Fisher Scientific, Waltham, MA, USA). All collected biological samples have been treated based on the procedures of contaminant control [28]. Briefly, sterilized cutter knife was used to split the core and the subsamples were followed under the anaerobic conditions, and stored in the sterilized zipper bag in the freezer at −20 °C. The whole process of DNA extraction and NGS analysis was done using aseptic technique [29]. Additionally, to avoid possible contaminants, the surface of the samples were removed in clean room with sterilized spatula, and only center of the samples were used to analyze.

3.6. Next Generation Sequencing (NGS)

The bacterial communities in the sediments were analyzed based on the similarity of the sequences in the V3-V4 hypervariable regions of 16S rRNA genes [30]. The PCR amplification of V3-V4 regions for bacteria was performed using fusion primers 341F (5’-TCGTCGGCAGCGTCAGATGTGTATAAGAGACAGCCTACGGGNGGCWGCAG-3’) and 805R (GTCTCGTGGGCTCGGAGATGTGTATAAGAGACAGGACTACHVGGGTATCTAATCC). P5 (P7) graft binding, the i5 (i7) index, the Nextera consensus, the Sequencing adaptor, and the target region sequence were used to construct the fusion primers. PCR products were verified with a gel electrophoresis and were confirmed to have a size from 400bp and 600bp. The amplified products were purified with the CleanPCR (CleanNA Alphen aan den Rijn, Waddinxveen, The Netherlands). Quality and product size were evaluated using a Bio Analyzer 2100 (Palo Alto, CA, USA) with a DNA 7500 chip. Mixed amplicons were processed by cluster generation and sequencing at Chunlab Inc. (Seoul, Korea). The Illumina MiSeq Sequencing system (Illumina, San Diego, CA, USA) was used according to the manufacturer’s instructions. The sequencing data obtained during this study were deposited in the GenBank (https://www.ncbi.nlm.nih.gov/genbank/) under accession number SRR10987739–SRR10987754.

3.7. Bioinformatics Analysis

To remove the low-quality values (average quality score < Q30), the Skewer v.0.2.2 program was processed [31]. Quality controlled reads were assembled using the PANDAseq algorithm [32] and processed according to MiSeq SOP in Mothur [33]. The chimeric reads were removed by the UCHIME algorithm [34]. The Opticlust algorithm was used to cluster operational taxonomic units (OTU) into 3% dissimilarity [35]. High quality reads were taxonomically assigned using the classify.seqs command in Mothur with a 0.8 confidence threshold [36]. To measure dissimilarity, OTU was used to calculate the distance matrix based on Yue and Clayton’s method [37]. Furthermore, the interpretation of each OTU was used to calculate the weighted UniFrac distance [38]. The bioinformatic analysis of V3-V4, which is based on the 16S rRNA from the next generation sequencing (NGS) analysis, was supported by Omicspia (Daejeon, Korea).

4. Results

4.1. Sedimentary Facies

Based on grain size, composition and sedimentary structure, seven sedimentary facies were classified. This study followed earlier interpretations (sedimentary processes) of fine-grained (muddy) sediments in the Ulleung Basin by using the facies classification of Bahk et al. and Lee et al. [39,40,41] (Figure 2). Unique sedimentary processes were also observed in the distinctively defined sediment units. In particular, the appearance of marker beds, including U-Oki tephra (154–155.5 cm; 9.3 ka), the TL-1 layer (186–188 cm; 11.5 ka), and CaM (476–480 cm; 14.5 ka), reflecting the geological time scale in the East Sea strongly supports the characteristics of sedimentary facies for the interglacial and last glacial periods [42]. Unit 1 (interglacial period) ranged from 0 to 188 cm (TL-1), Unit 2 (late glacial period) from 188 to 480 cm (CaM), and Unit 3 (glacial period) from 480 to 670 cm.

4.1.1. Fine-Grained Turbidites

Fine-grained turbidites consist of laminated sand (facies LS), laminated mud (facies LM), and homogeneous mud (facies HM). Facies LS is characterized by distinct, horizontal, or cross-laminations of muddy sand or sandy silt (Figure 2c). The sand fractions sometimes include planktonic foraminifers. The lower boundary of facies LS, less than 1 cm in thickness, is sharp and erosive and is generally overlain by facies LM and HM with gradational contact (Figure 2c). Thus, facies LS can be interpreted as a Tc or a Td division of Bouma [43].
Facies LM is characterized by indistinct to distinct horizontal laminations of silt-clay couplets with less than 1 cm in thickness (Figure 2c). The silt laminae exhibit an upward decrease in thickness and frequency. It is commonly associated with facies LS and is overlain by facies HM (Figure 2c). Facies LM can be interpreted as the E1 division (laminated mud) of fine-grained turbidites [44].
Facies HM is characterized by structureless and bioturbation on X-radiographs (Figure 2c), but partly exhibits highly indistinct laminations. It varies in thickness, ranging from 1 to 8 cm. Facies HM is generally underlain by laminated mud (facies LM) with gradational contact (Figure 2c). It corresponds to the graded (E2) or ungraded (E3) division of fine-grained turbidites [45].

4.1.2. Hemi-Pelagic Sediments

Hemi-pelagic sediments comprise crudely laminated mud (facies CLM) and bioturbated mud (facies BM). Facies CLM show crudely defined laminations on X-radiographs, exhibiting no systematic vertical changes in their thickness or clarity (Figure 2b). For this facies, planktonic foraminifers are well-preserved as sand fractions with 2 to 15.4 cm in thickness, and dominant facies below laminated Mn-carbonated mud (facies CaM) at a core depth of 480 cm (Figure 2a). Facies CLM was most likely deposited by hemi-pelagic setting under anoxic bottom-water associated with the low sea level during the last glacial period in the East Sea [39,40].
Facies BM (11.7–269.2 cm) is characterized by indistinct to distinct burrows on X-radiographs and mostly is found above facies CaM (Figure 2a). Facies BM present hemi-pelagic sediments under oxygenated bottom-water conditions in the East Sea [39].

4.1.3. Bottom-Current Deposits

Bottom-current deposits are represented by indistinctly layered mud (facies ILM) (Figure 2b). Facies ILM exhibits an alternation of greenish gray mud and olive to light gray mud with indistinct irregular boundaries. The layers are light colored with higher X-ray transmissivity and are sometimes diffusely laminated (Figure 2b). Facies ILM is commonly less than 3.5 cm thick and is usually associated with facies BM. It occurs just above facies CaM (Figure 2b). This facies can be interpreted as contourites or bottom-current deposits [40,46].

4.1.4. Chemogenic Sediments

Laminated Mn-carbonate mud (facies CaM) is characterized by yellowish-brown mud with dark brown bands (Figure 2b). Facies CaM is directly overlain by facies ILM with a gradational boundary and is underlain by facies CLM with a sharp boundary (Figure 2b). Bahk (2001) revealed that facies CaM in the UIG consists of Mn-carbonated (or Ca-rhodochrosite) crystallites with an average composition of (Mn64Ca32Mg4)CO3 and that it represents chemogenic sediments formed under changing bottom-water conditions from anoxic to oxic [1].

4.2. Grain Size Distribution (GSD), Magnetic Susceptibility (MS) and Distribution of Elemental Composition (XRF)

The grain size distribution was evaluated to elucidate the grain size change by unit and was divided into four groups: gravel (>2 mm), sand (63 µm–2 mm), silt (2 µm–63 µm), and clay (<2 µm) (Figure 3b). Gravel-sized grain was not detected in any samples. Most grains were silt, with an average of 70.3% silt in Unit 1, 80.1% in Unit 2, and 66.7% in Unit 3; however, each unit showed a discrete difference in sand percentage at 17.7% in Unit 1, 10.3% in Unit 2, and 23.5% in Unit 3. In Unit 1 in particular, 104.5 cm and 154.5 cm showed high percentages of sand, which can be explained by visible sand-sized grain. There was a scarce difference in clay at 12.0% in Unit 1, 9.3% in Unit 2, and 9.7% in Unit 3.
The MS value indicates the degree of magnetization of a material, usually indicating the content of Fe-bearing minerals. There were two MS values in the core: low in Unit 1 and Unit 2 and high in Unit 3 (Figure 3c). Nonetheless, the high intensity at 104.5 cm and 154.5 cm in Unit 1 appeared to be due to the sand-sized grains in U-Oki.
The elemental compositions, such as Ca, Fe, K, Mn, S, Si and Ti, were measured with XRF to determine the geochemical properties. Generally, Unit 1 and Unit 2 showed similar patterns in contrast to Unit 3 with a CaM layer (476–480 cm) (Figure 3e). Low contents of Ca, Fe, K, S, Si, and Ti were found in Unit 1 and Unit 2, whereas the contents were high in Unit 3. There was a dramatic decrease in the contents of Ca and S in Unit 2, while Fe, K, Si, and Ti gradually decreased for all units. The high Mn with a high Ca was detected in the CaM layer. The U-Oki tephra, deposited at 154.5–155 cm, showed high K, Si, and Ti.

4.3. Mineralogy and Semi-Quantification of Clay Minerals
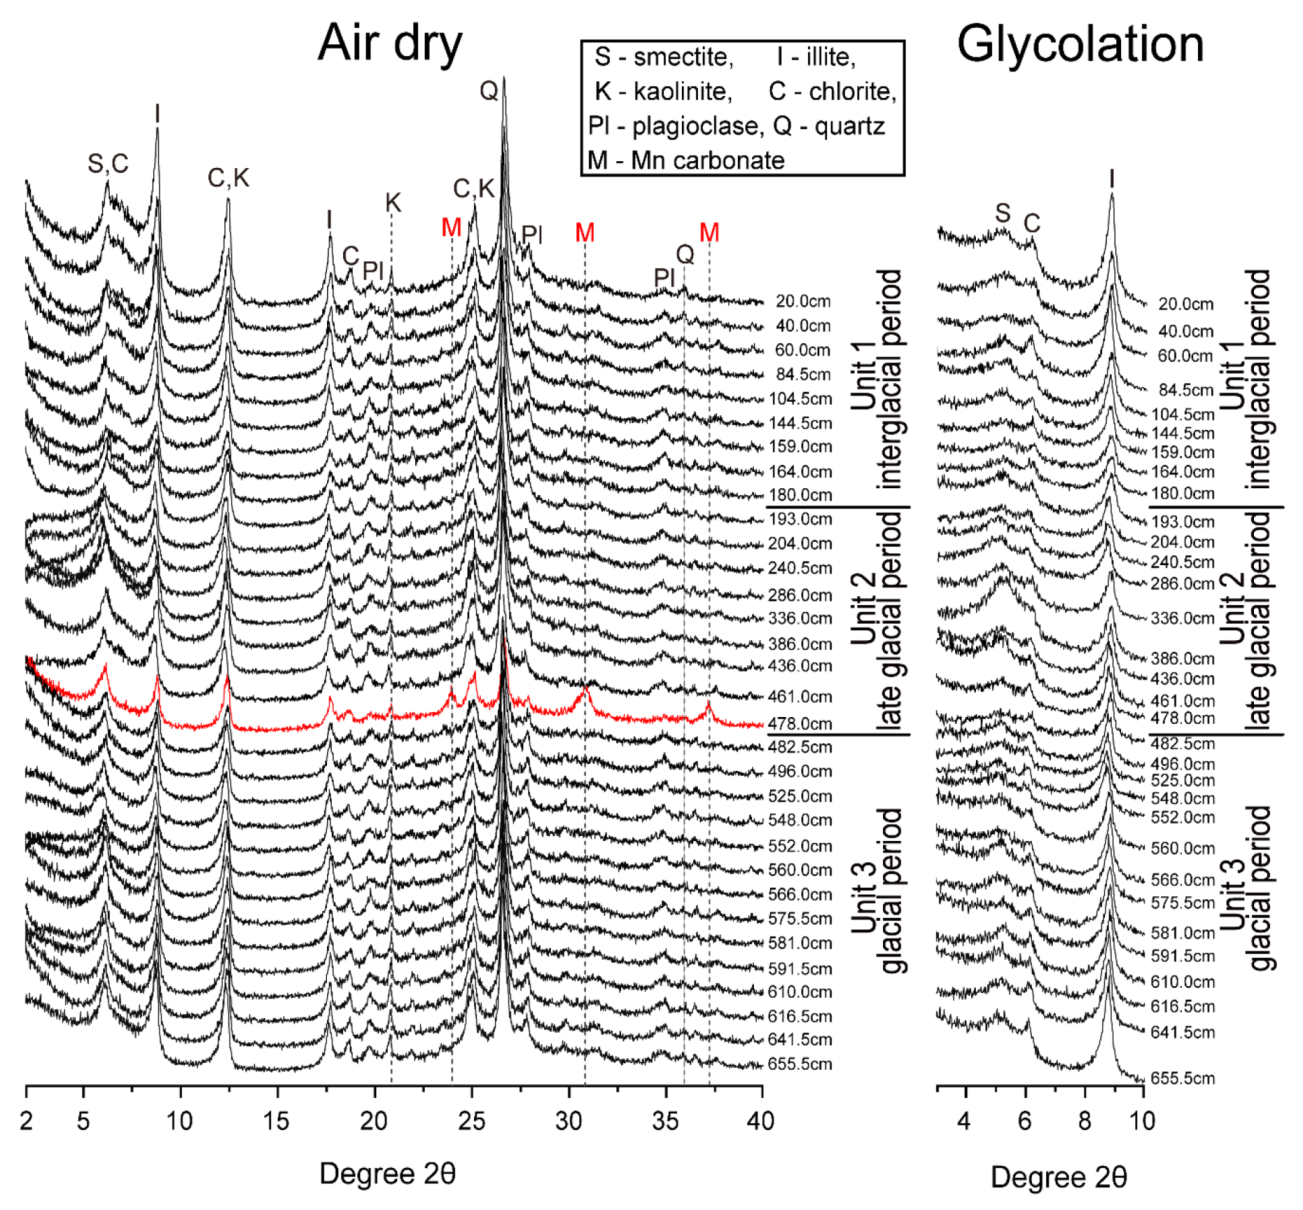
4.3.1. XRD Patterns

The random mounted XRD with depths identified the major mineral compositions (smectite, illite, chlorite, kaolinite, plagioclase, and quartz) (Supplementary Materials, Figure S1). Furthermore, distinctive CaM peaks were detected at 478.0 cm, corresponding to the CaM layer (Figure S1b). The oriented mount (size fraction < 2 μm) for air-dried and glycolated analysis showed four distinct clay compositions (smectite, illite, kaolinite and chlorite) for all core depths (Figure 4).

4.3.2. Semi-Quantification of Clay Minerals
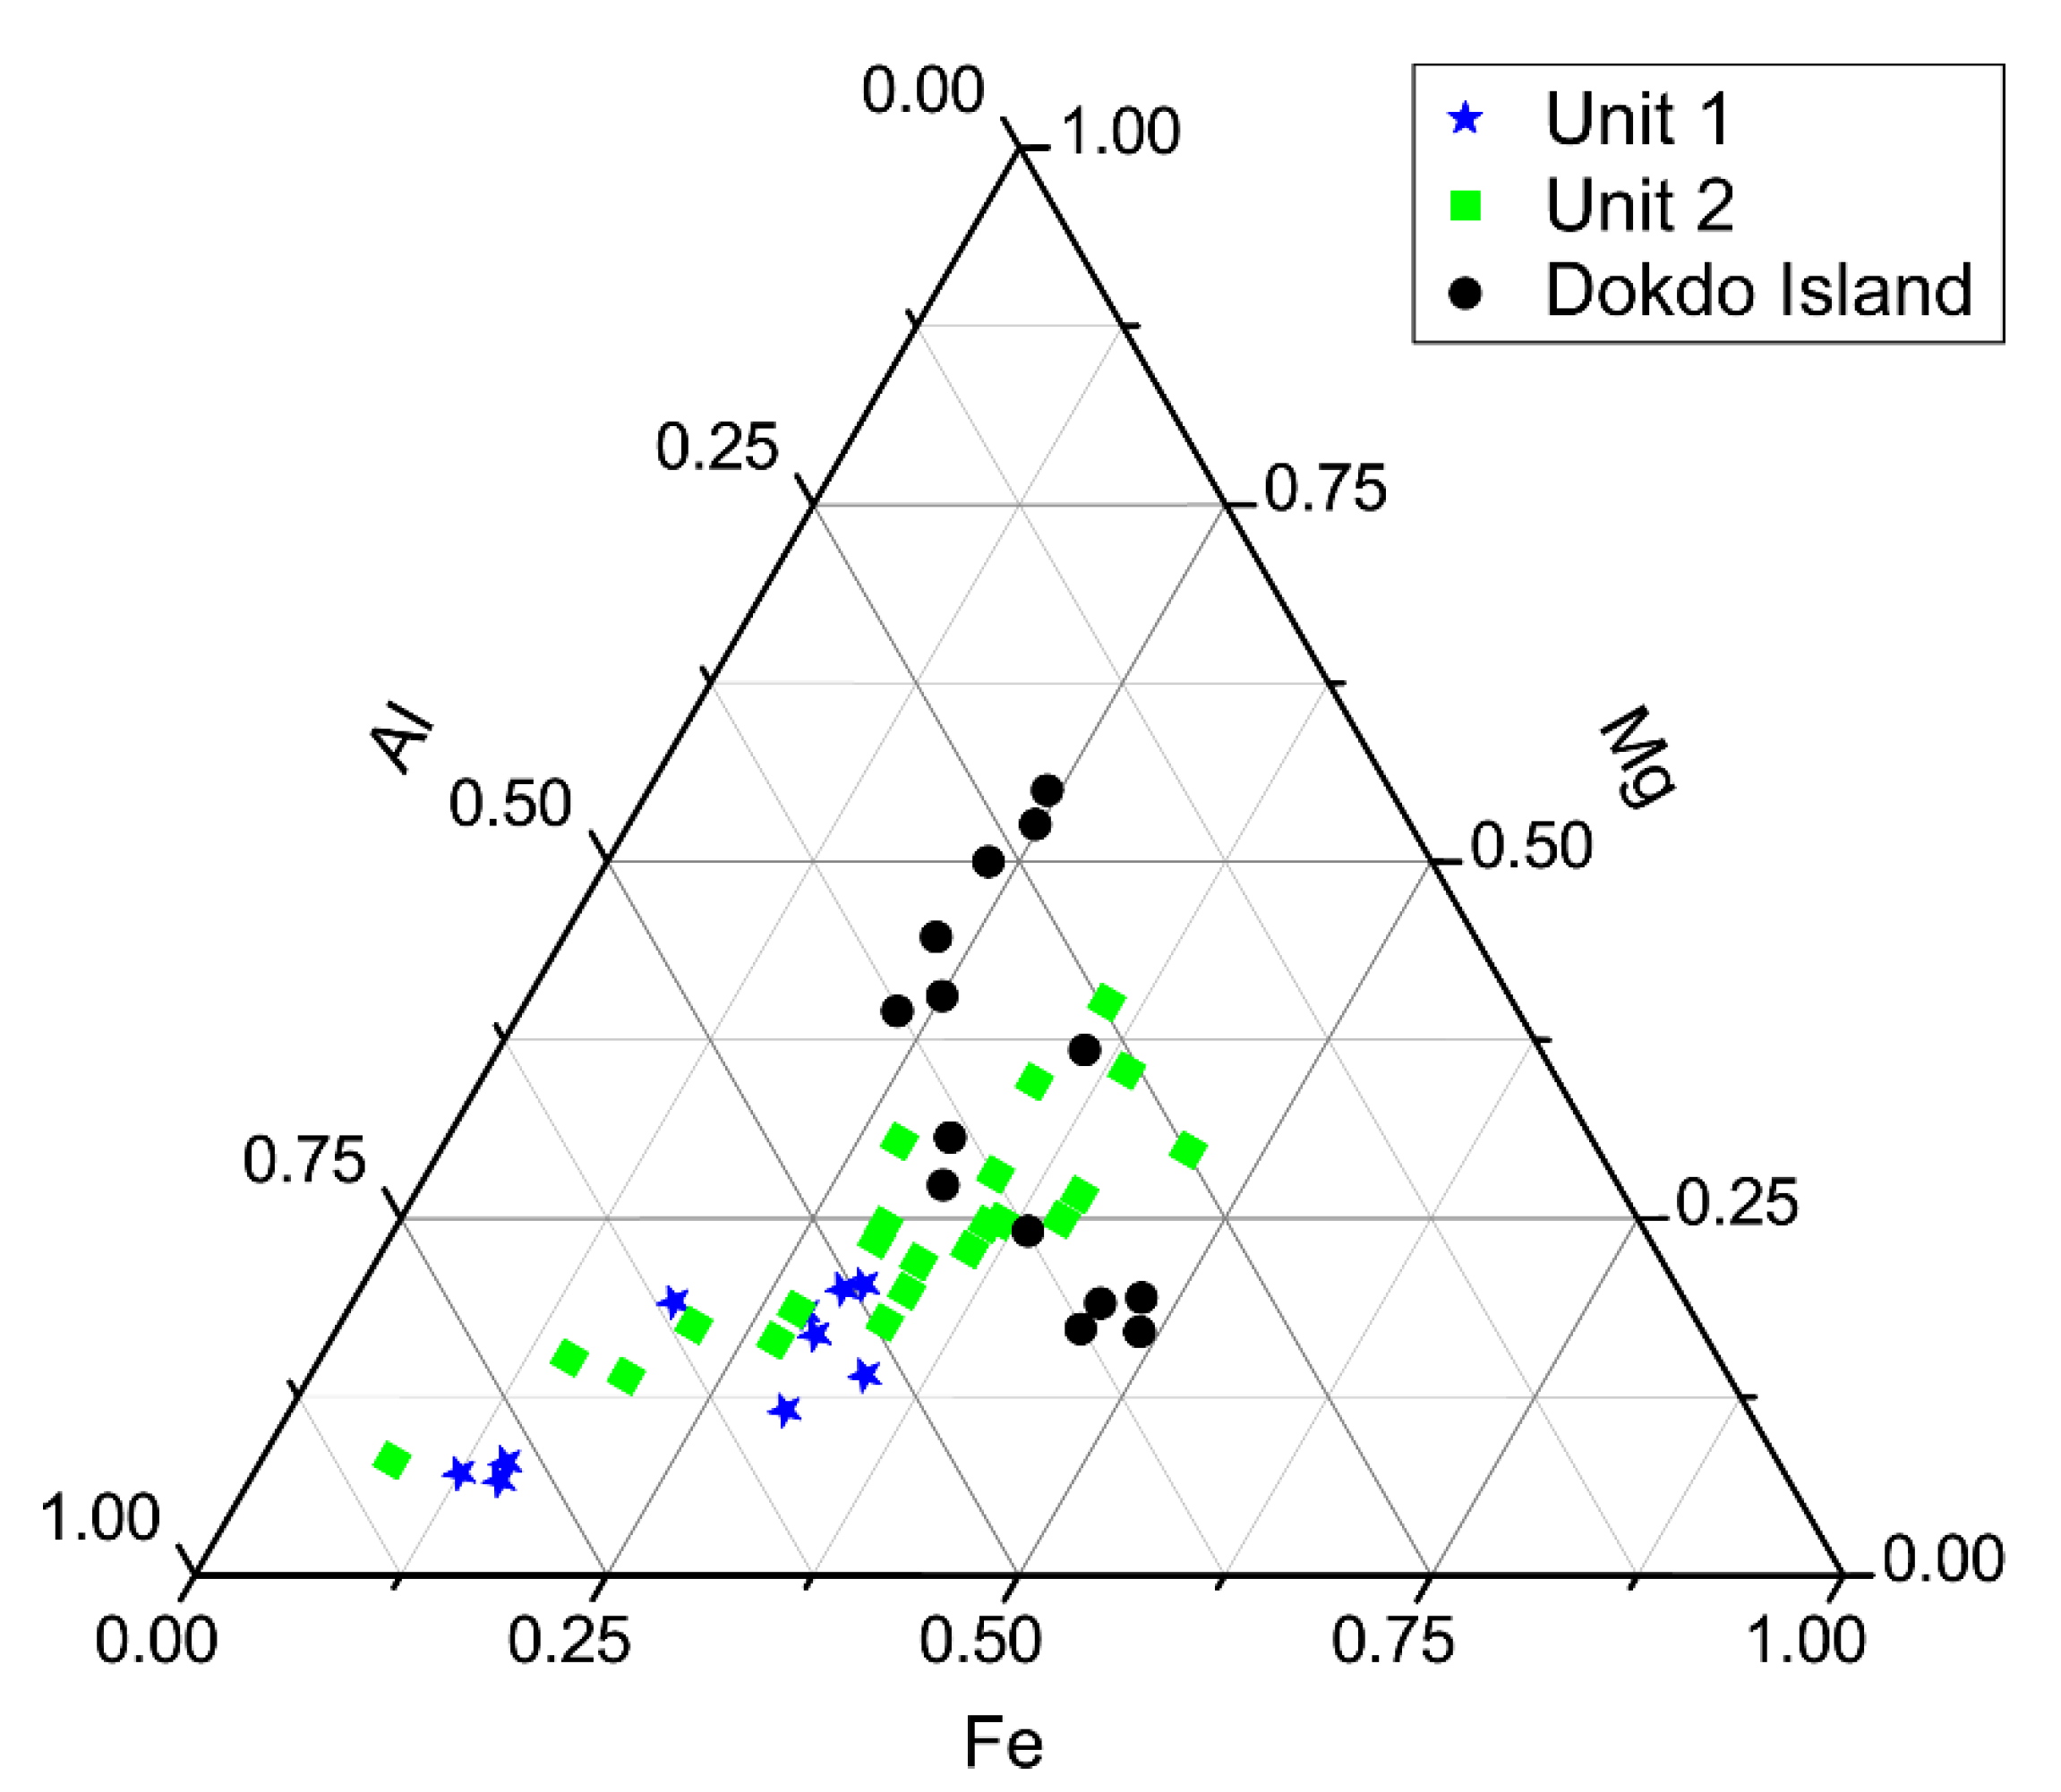
Based on the glycolated XRD analysis, semi-quantification was conducted for clays (smectite, illite, and chlorite) with Biscaye’s (1965) semi-quantification methods [26]. Specifically, the smectite/(illite + chlorite) ratio was used to highlight the clay downcore variation. The value of S/(I + Ch) was high in Unit 1 (0.25) and Unit 2 (0.33), compared to Unit 3 (0.17). Furthermore, the value showed an increasing trend in Unit 2 compared with Unit 3, whereas it was slightly decreased in Unit 1 compared to Unit 2 (Figure 3d).

4.4. TEM-EDS

Three samples for Unit 1 and Unit 2 and a terrestrial sample from Dokdo Island were measured by TEM to compare the composition of smectite. The smectite showed wavy lattice fringes typical of a smectite structure confirmed by the diffused selected area electron diffraction (SAED) patterns (d001 = 1.2 nm) with the elemental composition (Al, Si, Fe, Mg,) by EDS (Figure 5). The classifications of smectite based on octahedral site compositions were plotted on a ternary graph (Al-Fe-Mg), and each sample showed a distinctive grouping (Figure 6). Unit 1 showed an Al-rich smectite group (average Al: 61.6 %, Fe: 24.5 %, Mg: 13.9 %) compared to Dokdo Island (Al: 32.9%, Fe: 33.3%, Mg: 33.8%) and Unit 2 (Al: 45.5%, Fe: 30.9%, Mg: 23.6%).

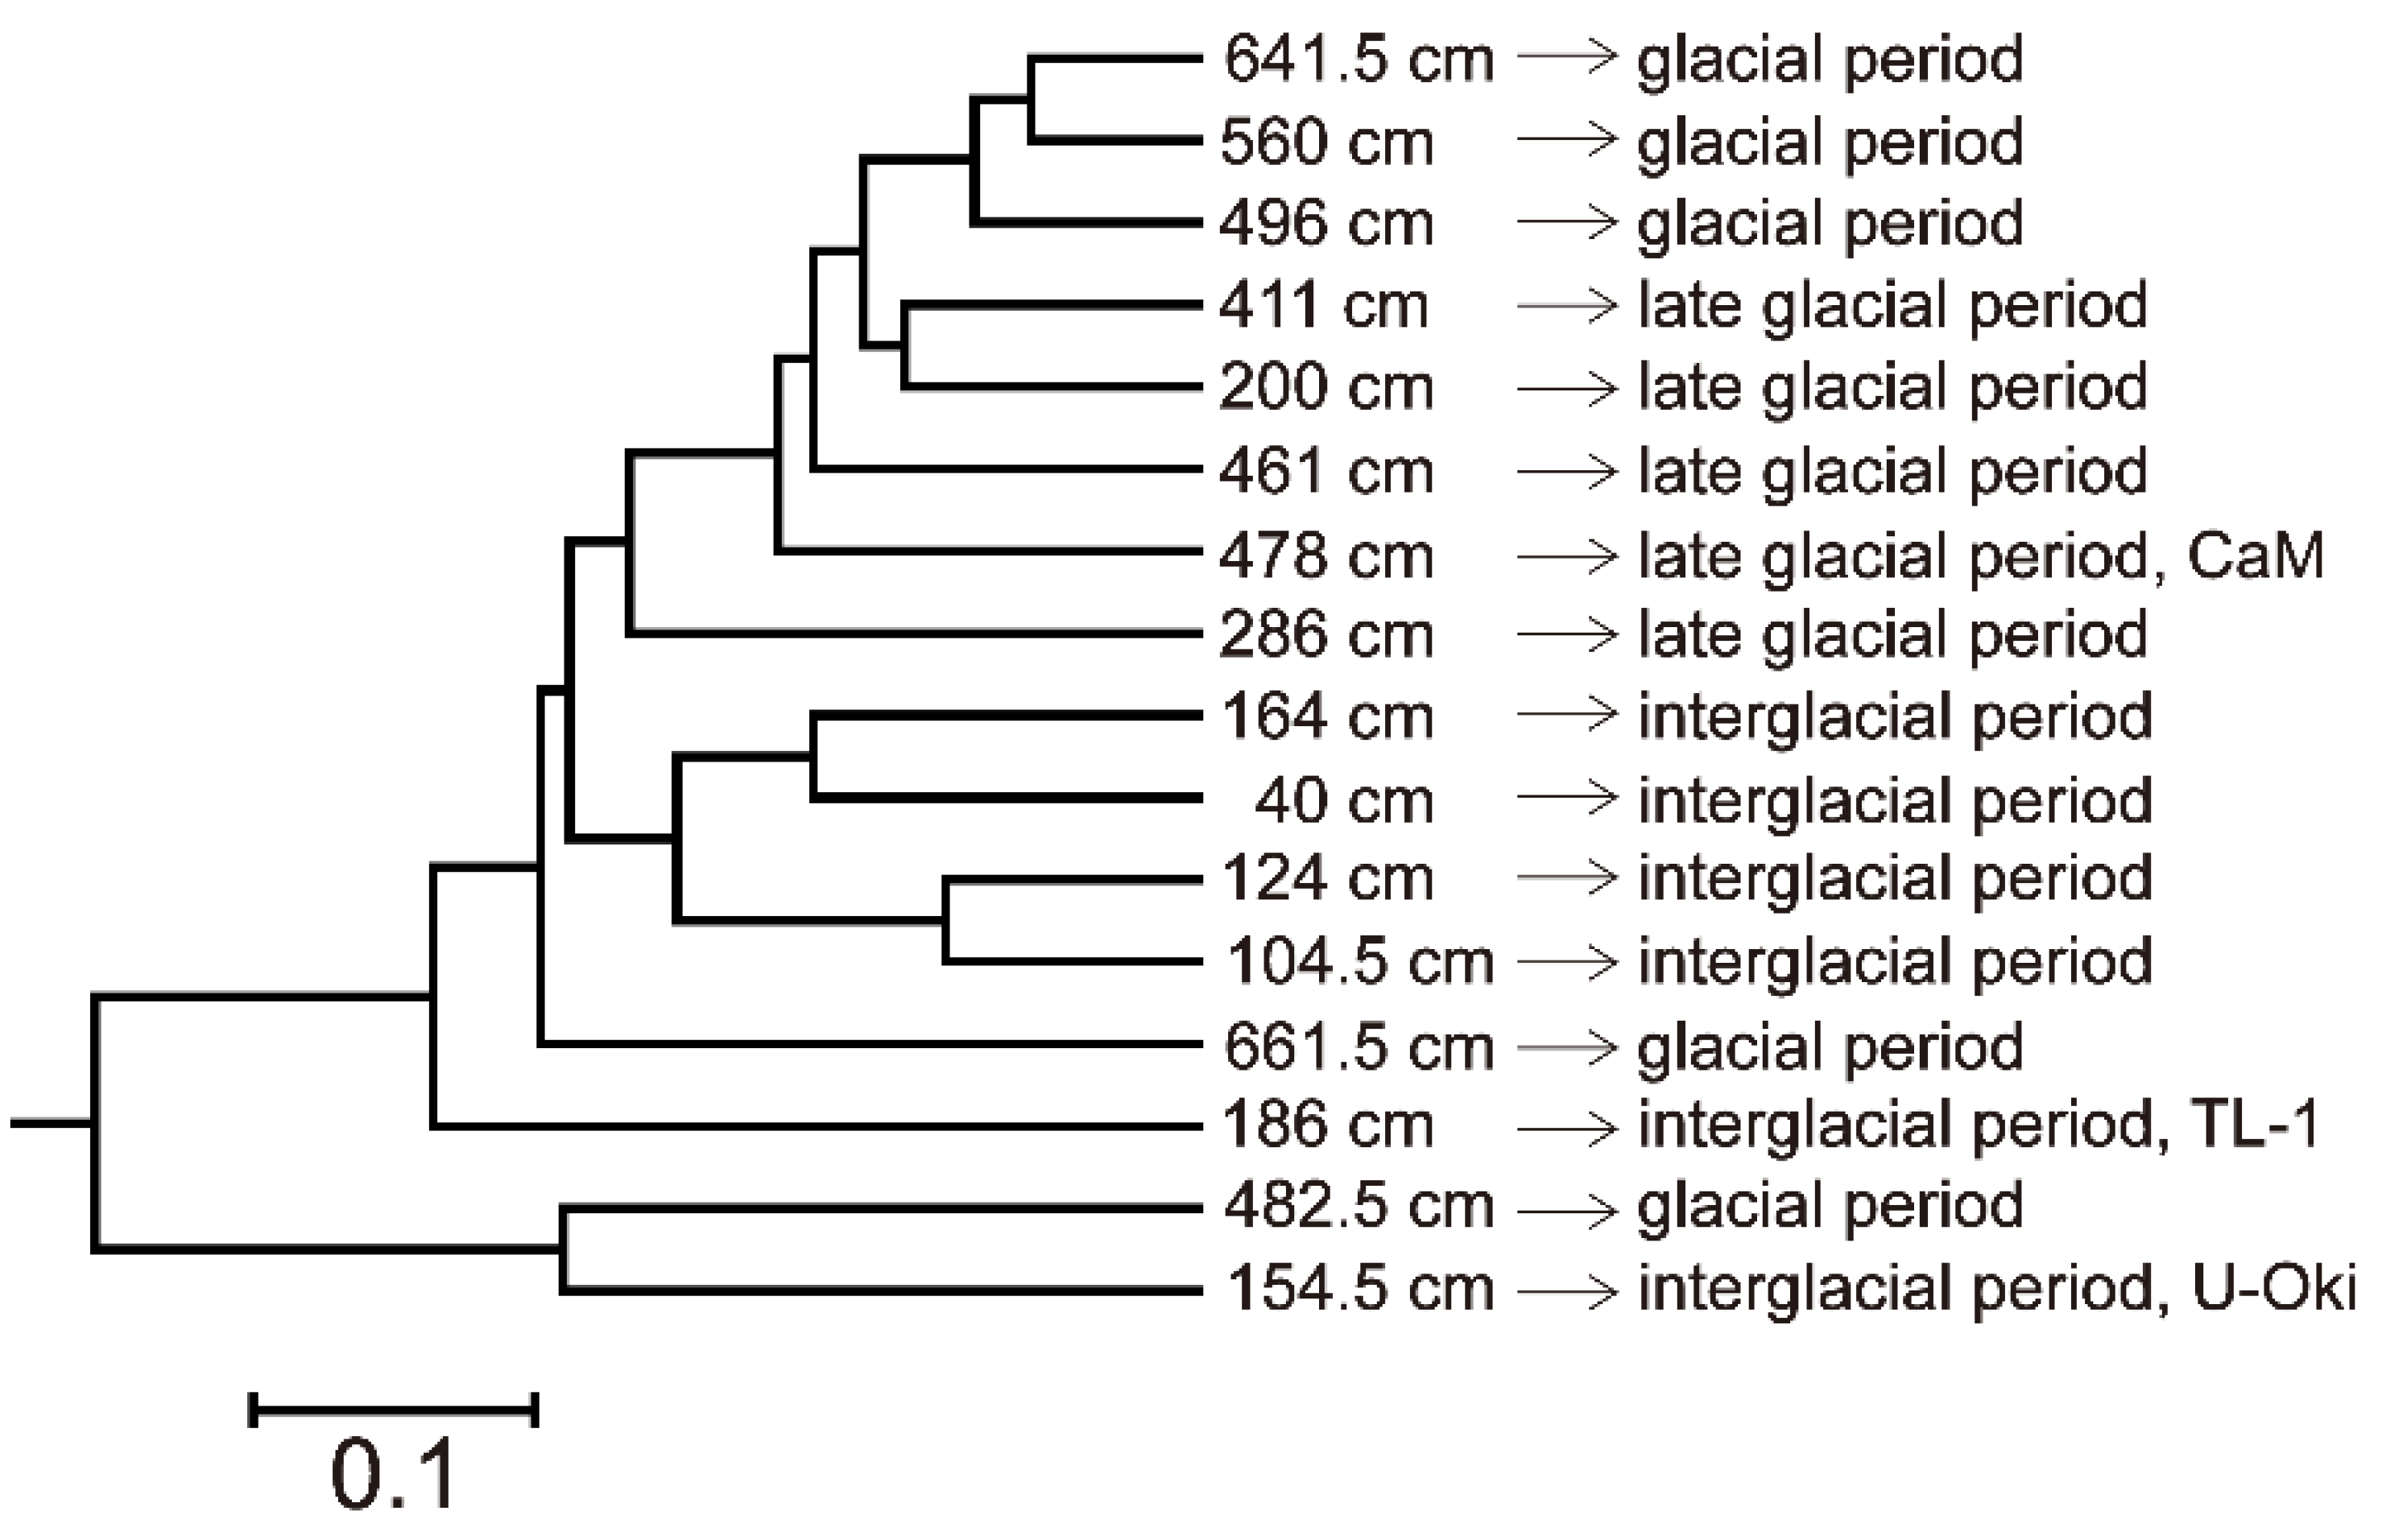
4.5. Microbial Diversity

Based on the results of 16S rRNA analysis, the microbial community pattern for the Dokdo sediments is displayed in the bubble chart (Figure 7). During this study, 45 bacterial families were identified, and the represented bubbles were listed for over 1% of the population for each sediment. Dehalococcoidaceae, AQYX (unclassified strain), and Hyphomicrobiaceae were widely distributed in most sediments (Figure S2a). The Gammaproteobacteria were broadly distributed in the sediment core (40 to 186 cm) for the interglacial period. The Vibrionaceae family was widely distributed in the sediments (40 cm, 104.5 cm and 124 cm) for 2.01% to 15.05% of the population. Thiomicrospira (52.01%) was identified as significant in U-Oki, and distributed 4.35% at 186 cm. Thiomicrospira, known as a chemolithoautotrophy [47], can reduce sulfur by receiving the electrons in aerobic conditions [48], while it uses organic acids in anaerobic environments [49]. Interestingly, Thiomicrospira showed a 95.33% distribution at 482.5 cm in contrast to 0.57% at 661.5 cm. In the late glacial period, a rapid decrease in the distribution of Class Gammaproteobacteria was observed at 200 cm, 286 cm, 411 cm, 461 cm, and 478 cm (−0.1%). The Family Coxiellaceae (Class Gammaproteobacteria) was distributed at about 3%.
In the CaM layer, the Family Planctomycetaceae was distributed significantly (4.43%) based on the analysis of the genus abundance (Figure S2b). Unclassified microbes, such as Family EU246070 (3.74%) and Family EU181510 (1.54%), were also measured. The Family Planctomycetaceae belongs to Phylum Planctomycetes, and some of the Family Planctomycetaceae are known as ammonium oxidation (ANAMMOX) microorganisms [50], which produce a nitrogen gas during the reduction of manganese oxide [51]. The z-score, statistically based on abundance, is shown in Figure S2.
For the layer at 482.5 cm, the lowest microbial diversity compared to other samples in the glacial period was detected. Interestingly, the distribution of the bacterial groups of EU290722 was analyzed to be 1.04% at 496 cm, 0.68% at 560 cm, 5.07% at 641.5 cm and 34.20% at 661.5 cm, respectively. The Family EU290722, which are still unclassified strains, increased in the glacial period but decreased in the interglacial and late glacial period.

5. Discussion

5.1. Paleo-Depositional Environments

The sedimentary facies showed the repetition of LS, LM, HM and CLM, related to intensive turbidite current deposits under water stratification during the glacial period (Unit 3) [52]. The proportion of sand from grain size distribution increased with MS, indicating an increase in the terrigenous supply [53] compared to the pelagic/hemipelagic sediments from the outer sea. Additionally, a low value of smectite/(illite + chlorite) (Figure 3d) represented the glacial period. An increase in the amount of Fe, Si, and Ti further supports the terrigenous origin of sediments with quartz and Fe-oxides, and an abundance of S, a redox sensitive element, indicates the anoxic environments in Unit 3 [54]. This anoxic environment condition results from the water stratification of the East Sea during the glacial period [25,55]. The water stratification in the East Sea occurred due to density differences between sea water and fresh water in the glacial period. In the glacial period, all straits in the East Sea were exposed to land due to the low sea level (−120 m) [56]. Under these circumstances, the East Sea became isolated from outer seas, and consequently, the input of water came over land through rivers rather than through outer seas, causing a salinity difference [55]. The salinity difference between freshwater from rivers (low salinity) and pre-existing sea water (high salinity) intensified the water stratification, acting as a barrier that prevents water circulation, creating hypoxic environments on the basin floor during the glacial period [25,57]. When the sea level rose in the late glacial period, the oxygenated-water circulated due to the collapse of water stratification.
In contrast to the Unit 3, the main sedimentary facies for Unit 2 was bioturbated mud, indicating oxygenated bottom-water conditions [39,58]. Moreover, the appearance of CaM under bioturbated mud represented a change in bottom-water conditions from anoxic to oxic [1]. A decrease in the contents of S may also indicate the transition of anoxic to oxic conditions in the late glacial period (Unit 2) [54]. Additionally, the decrease in sand-sized grains with MS reflected the late glacial period when the sea level rose. The rise in sea level caused a decrease in the exposed land area, resulting in a lower transportation rate of terrigenous sediments. Interestingly, high sedimentation rates (0.073 cm/year), three times higher than average of the East Sea (0.0261 cm/year), were calculated for Unit 2 [59], possibly suggesting the multi-sources of sediment. Indeed, there were two different groups of elemental compositions of smectite (Fe/Mg-rich and Al-rich smectite), suggesting two sedimentation provenances. Suspended clay from volcanic sediments may include Dokdo Island and implies transportation from East China with hemipelagic/pelagic sediments that were dominant sources of the interglacial period (Unit 1) [60].

5.2. Microbial Diversity in Paleo-Depositional Environments

The microbial diversity was schematized in a cladogram to illustrate distinctive grouping as periods (Figure 8). The cladogram showed similarities among samples based on weighted UniFrac distance. The 16 samples in Figure 8 are grouped as periods, suggesting each period has a unique environment that differs from the others.
The relationships between sedimentary facies, including paleo-depositional environments and bacterial abundance, are illustrated in Figure 9. In the interglacial period, defined as oxic conditions, Gammaproteobacteria (Vibrionaceae, Pseudomonadaceae, Halomonadaceae, Methylophaga, Pseudoalteromon, Marinobacter, Idiomarinaceae, Alteromonadaceae) and Alphaproteobacteria (Aurantimonadaceae) were detected. Some of Idiomarinaceae and some of Pseudompnadaceae are reported as anaerobic bacteria, however, based on 16S rRNA analysis, Idiomarina aquatica [61], Idiomarina baltica [62], and Idiomarina marina [63] detected in the present study are aerobic strains. Furthermore, Pseudomonas stutzeri [64], Pseudomonas xinjiangensis [65], Pseudomonas aestusnigri [66], Pseudomonas zhaodongensis [67], Pseudomonas litoralis [68], Pseudomonas pelagia [69] are aerobic strains. Nonetheless, the composition of sediment including pore water chemistry could significantly affect the diversity of the bacterial distribution. Methylophaga, a group of Gammaproteobacteria, were only detected in the interglacial period and are associated with the phytoplankton that usually blooms under open marine conditions today [70]. Planctomycetaceae, some of which are anaerobic ammonium oxidation (ANAMMOX) bacteria today, were observed in the CaM layer in the late glacial period. ANAMMOX bacteria oxidize ammonium by reducing Mn, and it is possible that Mn-reducing bacteria can precipitate CaM through microbial interactions with minerals [71,72]. The unclassified bacteria EU290722 was discovered in the glacial period, indicating that Unit 3 is a unique environment that EU290722 can live in. Although some bacteria were not classified or explained, the correlation between microbial diversity and paleo-depositional environments suggests that depositional conditions can be classified based on microbial activities. However, microbes shown for the present study mainly depend on location and geological time scale, but even so, it is unknown whether microorganisms in ancient locations still function today, are dead, or are both. Direct observation on the microbial cell is inevitable for the further study.

5.3. Formation of Mn-Carbonates

The formation of CaM is related to redox change under bottom-water conditions resulting from water circulation and water flow derived from a collapse of water stratification [73,74]. In the glacial period, Mn existed as dissolved Mn(II) in sea water, a reductive form of Mn under anoxic conditions (Figure 10a). Anoxic conditions were induced by water stratification that developed due to salinity difference between fresh water and isolated sea water [40]; however, as the sea level rose in the late glacial period, the sea water from the outer sea began to flow into the East Sea due to collapse of water stratification, causing water circulation to supply oxic inflow. The oxic inflow oxidized Mn(II) to Mn(IⅤ) and formed MnO2(s) (Mn-oxides), and the Mn-oxides’ particles settled in the anoxic basin (Figure 10b). In the anoxic basin, Mn-oxides microbially re-reduced to Mn(II), resulting in a massive accumulation of Mn(II) (Figure 10c) [75,76]. Specifically, Planctomycetaceae, detected using the NGS in this study, may reduce Mn-oxides to Mn(II) [77,78] and consequently, precipitate as CaM due to a supersaturation of Mn(II) at the basin floor. Furthermore, EU246070 and EU181510, were relatively abundant in CaM layer. Specific gene analysis, such as manganese reduction, has not been performed, but Planctomycetes are remarkable in CaM layer. Therefore, the precipitation of CaM predict that a change in redox conditions, microbes-mineral interactions in the deep sea, and paleo-depositional environments could be correlated with each other. However, more research on the functional genes has to be performed to understand how exactly the microbes have been involved in the biomineralization under a specific depositional condition.

6. Conclusions

The characteristics of sedimentary facies associated with changes in depositional conditions during the glacial and the interglacial periods are likely linked with microbial habitats. The microbial activity shown in the diverse groups can reflect unique redox conditions. Gammaproteobacteria and Alphaproteobacteria, were abundantly detected in the interglacial period, and this may indicate that the interglacial period had aerobic conditions, nonetheless some of those family have been reported as anaerobic. Moreover, Methylophaga, closely related with phytoplankton that flourish under open marine conditions at present, were only detected in the interglacial period. In contrast, nearly 0% of aerobic bacteria was detected in the laminated and homogeneous mud, though they prevailed in the glacial period. The formation of CaM may be an example of microbial activity that responds to environmental changes. Therefore, an investigation of microbial processes accompanying geochemical reactions could reveal the paleo-depositional environments. Future studies on the diversity of other domains, such as Archaea and Eukarya from the multiple core samples, are necessary for full understanding of microbial communities.

Supplementary Materials

The following are available online at https://www.mdpi.com/2075-163X/10/3/208/s1, Figure S1: Bulk XRD with depth as periods. (a) is upper part, (b) is lower part. The red line indicates Mn carbonate. Figure S2: The Boxplot shows Genus Relative Abundances in Family Level. Table S1: Mean and Standard Deviation of Gammaproteobacteria based on Genus Abundances.

Author Contributions

Conceptualization, data interpretation, and revision, J.K.; data interpretation and writing—original draft preparation, K.H.L.; collecting the core sediments, C.H.K. and C.H.P.; interpretation of sedimentary facies and depositional environments, S.H.L.; microbial analysis and interpretation, I.S.L., Y.J.K. and J.W.K.; interpretation of TEM data, K.Y.; data interpretation, J.J. All authors have read and agreed to the published version of the manuscript.

Funding

This study was supported by the National Research Foundation of Korea (NRF) grant (No. NRF-2018R1A2B6002036) and the Ministry of Oceans and Fisheries, Korea “A sustainable research and development of Dokdo (PG51010)” to J.K.

Acknowledgments

We thank the scientists and crew members of Onnuri R/V for collecting sediment samples. Additionally, we are grateful to Library of Marine Samples (LIMS) in Korea Institute of Ocean Science and Technology (KIOST) for preserving the core samples. S.H. Lee is supported by the Project of KIOST (PE99841).

Conflicts of Interest

The authors declare no conflict of interest.

References

  1. Bahk, J.; Chough, S.; Jeong, K.; Han, S. Sedimentary records of paleoenvironmental changes during the last deglaciation in the Ulleung Interplain Gap, East Sea (Sea of Japan). Glob. Planet. Chang. 2001, 28, 241–253. [Google Scholar] [CrossRef]
  2. Kemp, A.E. Laminated sediments as palaeo-indicators. Geol. Soc. Lond. Spec. Publ. 1996, 116, vii–xii. [Google Scholar] [CrossRef]
  3. Chun, J.-H.; Cheong, D.; Ikehara, K.; Han, S.-J. Age of the SKP-I and SKP-II tephras from the southern East Sea/Japan Sea: Implications for interstadial events recorded in sediment from marine isotope stages 3 and 4. Palaeogeogr. Palaeoclimatol. Palaeoecol. 2007, 247, 100–114. [Google Scholar] [CrossRef]
  4. Chamley, H. Clay Mineralogy; Springer: New York, NY, USA, 1989. [Google Scholar]
  5. Velde, B. Origin and Mineralogy of Clays: Clays and the Environment; Springer Science & Business Media: Berlin, Germany, 2013. [Google Scholar]
  6. Petschick, R.; Kuhn, G.; Gingele, F. Clay mineral distribution in surface sediments of the South Atlantic: Sources, transport, and relation to oceanography. Mar. Geol. 1996, 130, 203–229. [Google Scholar] [CrossRef] [Green Version]
  7. Weaver, C.; Pollard, L. The chemistry of clay minerals. Dev. Sedimentol. 1973, 15, 213. [Google Scholar]
  8. Park, Y.K.; Lee, J.I.; Jung, J.; Hillenbrand, C.-D.; Yoo, K.-C.; Kim, J. Elemental compositions of smectites reveal detailed sediment provenance changes during glacial and interglacial periods: The Southern Drake Passage and Bellingshausen Sea, Antarctica. Minerals 2019, 9, 322. [Google Scholar] [CrossRef] [Green Version]
  9. Kim, J.; Dong, H.; Seabaugh, J.; Newell, S.W.; Eberl, D.D. Role of microbes in the smectite-to-illite reaction. Science 2004, 303, 830–832. [Google Scholar] [CrossRef] [Green Version]
  10. Dong, H.; Jaisi, D.P.; Kim, J.; Zhang, G. Microbe-clay mineral interactions. Am. Mineral. 2009, 94, 1505–1519. [Google Scholar] [CrossRef]
  11. Jaisi, D.P.; Eberl, D.D.; Dong, H.; Kim, J. The formation of illite from nontronite by mesophilic and thermophilic bacterial reaction. Clays Clay Miner. 2011, 59, 21–33. [Google Scholar] [CrossRef]
  12. Simon, C.; Daniel, R. Metagenomic analyses: Past and future trends. Appl. Environ. Microbiol. 2011, 77, 1153–1161. [Google Scholar] [CrossRef] [Green Version]
  13. Cuadros, J.; Michalski, J.R.; Dekov, V.; Bishop, J.; Fiore, S.; Dyar, M.D. Crystal-chemistry of interstratified Mg/Fe-clay minerals from seafloor hydrothermal sites. Chem. Geol. 2013, 360, 142–158. [Google Scholar] [CrossRef] [Green Version]
  14. Kim, J.; Dong, H.; Yang, K.; Park, H.; Elliott, W.C.; Spivack, A.; Koo, T.-H.; Kim, G.; Morono, Y.; Henkel, S. Naturally occurring, microbially induced smectite-to-illite reaction. Geology 2019, 47, 535–539. [Google Scholar] [CrossRef] [Green Version]
  15. Vorhies, J.S.; Gaines, R.R. Microbial dissolution of clay minerals as a source of iron and silica in marine sediments. Nat. Geosci. 2009, 2, 221. [Google Scholar] [CrossRef]
  16. Yang, K.; Park, H.; Son, S.-K.; Baik, H.; Park, K.; Kim, J.; Yoon, J.; Park, C.H.; Kim, J. Electron microscopy study on the formation of ferromanganese crusts, western Pacific Magellan Seamounts. Mar. Geol. 2019, 410, 32–41. [Google Scholar] [CrossRef]
  17. Mande, S.S.; Mohammed, M.H.; Ghosh, T.S. Classification of metagenomic sequences: Methods and challenges. Brief. Bioinform. 2012, 13, 669–681. [Google Scholar] [CrossRef] [PubMed] [Green Version]
  18. Lee, S.H.; Bahk, J.J.; Kim, S.-P.; Park, J.-Y. Physiography and Late Quaternary Sedimentation. In Oceanography of the East Sea (Japan Sea); Springer: New York, NY, USA, 2016; pp. 389–414. [Google Scholar]
  19. Chough, S.K.; Lee, H.J.; Yoon, S.H. Marine Geology of Korean Seas; Elsevier: Amsterdam, The Netherlands, 2000. [Google Scholar]
  20. Lee, S.H.; Bahk, J.J.; Chough, S.K. Origin of deep-water sediment waves in the Ulleung Interplain Gap, East Sea. Geosci. J. 2003, 7, 65. [Google Scholar] [CrossRef]
  21. Kim, C.H.; Park, C.H.; Jeong, E.Y.; Hwang, J.S.; Ko, Y.T. Evolution of the Dok Do seamounts, Ulleung Basin, East Sea: Constraints based on the reconstruction of virtual geomagnetic poles using paleomagnetic data. GeoMar. Lett. 2009, 29, 161–169. [Google Scholar] [CrossRef]
  22. Nitani, H. Beginning of the Kuroshio. In Kuroshio, Physical Aspect of the Japan Current; University of Washington Press: Washington, DC, USA, 1972. [Google Scholar]
  23. Lie, H.J.; Cho, C.H.; Lee, J.H.; Niiler, P.; Hu, J.H. Separation of the Kuroshio water and its penetration onto the continental shelf west of Kyushu. J. Geophys. Res. Ocean. 1998, 103, 2963–2976. [Google Scholar] [CrossRef] [Green Version]
  24. Tada, R. Late Quaternary paleoceanography of the Japan Sea. Quat. Res. (Daiyonki-Kenkyu) 1999, 38, 216–222. [Google Scholar] [CrossRef] [Green Version]
  25. Keigwin, L.; Gorbarenko, S. Sea level, surface salinity of the Japan Sea, and the Younger Dryas event in the northwestern Pacific Ocean. Quat. Res. 1992, 37, 346–360. [Google Scholar] [CrossRef]
  26. Biscaye, P.E. Mineralogy and sedimentation of recent deep-sea clay in the Atlantic Ocean and adjacent seas and oceans. Geol. Soc. Am. Bull. 1965, 76, 803–832. [Google Scholar] [CrossRef]
  27. Sambrook, J.; Fritsch, E.F.; Maniatis, T. Molecular Cloning: A Laboratory Manual; Cold Spring Harbor Laboratory Press: Cold Spring Harbor, NY, USA, 1989. [Google Scholar]
  28. Morono, Y.; Inagaki, F. Analysis of low-biomass microbial communities in the deep biosphere. In Advances in Applied Microbiology; Elsevier: Amsterdam, The Netherlands, 2016; Volume 95, pp. 149–178. [Google Scholar]
  29. Bykowski, T.; Stevenson, B. Aseptic technique. In Current Protocols in Microbiology; Wiley: Hoboken, NJ, USA, 2008; Volume 11, pp. A.4D.1–A.4D.11. [Google Scholar]
  30. Fadrosh, D.W.; Ma, B.; Gajer, P.; Sengamalay, N.; Ott, S.; Brotman, R.M.; Ravel, J. An improved dual-indexing approach for multiplexed 16S rRNA gene sequencing on the Illumina MiSeq platform. Microbiome 2014, 2, 6. [Google Scholar] [CrossRef] [PubMed] [Green Version]
  31. Jiang, H.; Lei, R.; Ding, S.-W.; Zhu, S. Skewer: A fast and accurate adapter trimmer for next-generation sequencing paired-end reads. BMC Bioinform. 2014, 15, 182. [Google Scholar] [CrossRef]
  32. Masella, A.P.; Bartram, A.K.; Truszkowski, J.M.; Brown, D.G.; Neufeld, J.D. PANDAseq: Paired-end assembler for illumina sequences. BMC Bioinform. 2012, 13, 31. [Google Scholar] [CrossRef] [PubMed] [Green Version]
  33. Schloss, P.D.; Westcott, S.L.; Ryabin, T.; Hall, J.R.; Hartmann, M.; Hollister, E.B.; Lesniewski, R.A.; Oakley, B.B.; Parks, D.H.; Robinson, C.J. Introducing mothur: Open-source, platform-independent, community-supported software for describing and comparing microbial communities. Appl. Environ. Microbiol. 2009, 75, 7537–7541. [Google Scholar] [CrossRef] [PubMed] [Green Version]
  34. Edgar, R.C.; Haas, B.J.; Clemente, J.C.; Quince, C.; Knight, R. UCHIME improves sensitivity and speed of chimera detection. Bioinformatics 2011, 27, 2194–2200. [Google Scholar] [CrossRef] [Green Version]
  35. Westcott, S.L.; Schloss, P.D. OptiClust, an improved method for assigning amplicon-based sequence data to operational taxonomic units. MSphere 2017, 2, e00073-17. [Google Scholar] [CrossRef] [Green Version]
  36. Wang, Q.; Garrity, G.M.; Tiedje, J.M.; Cole, J.R. Naive Bayesian classifier for rapid assignment of rRNA sequences into the new bacterial taxonomy. Appl. Environ. Microbiol. 2007, 73, 5261–5267. [Google Scholar] [CrossRef] [Green Version]
  37. Yue, J.C.; Clayton, M.K. A similarity measure based on species proportions. Commun. Stat. Theory Methods 2005, 34, 2123–2131. [Google Scholar] [CrossRef] [Green Version]
  38. Lozupone, C.; Knight, R. UniFrac: A new phylogenetic method for comparing microbial communities. Appl. Environ. Microbiol. 2005, 71, 8228–8235. [Google Scholar] [CrossRef] [Green Version]
  39. Bahk, J.; Chough, S.; Han, S. Origins and paleoceanographic significance of laminated muds from the Ulleung Basin, East Sea (Sea of Japan). Mar. Geol. 2000, 162, 459–477. [Google Scholar] [CrossRef]
  40. Bahk, J.; Lee, S.; Yoo, H.; Back, G.; Chough, S. Late Quaternary sedimentary processes and variations in bottom-current activity in the Ulleung Interplain Gap, East Sea (Korea). Mar. Geol. 2005, 217, 119–142. [Google Scholar] [CrossRef]
  41. Lee, S.; Bahk, J.; Chough, S.; Back, G.; Yoo, H. Late Quaternary sedimentation in the Ulleung Interplain Gap, East Sea (Korea). Mar. Geol. 2004, 206, 225–248. [Google Scholar] [CrossRef]
  42. Lee, K.E. Surface water changes recorded in late quaternary marine sediments of the Ulleung Basin, East Sea (Japan Sea). Palaeogeogr. Palaeoclimatol. Palaeoecol. 2007, 247, 18–31. [Google Scholar] [CrossRef]
  43. Bouma, A.H. Sedimentology of Some Flysch Deposits: A Graphic Approach to Facies Interpretation; Elsevier: Amsterdam, The Netherlands, 1962; Volume 168. [Google Scholar]
  44. Chough, S.; Lee, G.; Park, B.; Kim, S. Fine structures of turbidite and associated muds in the Ulleung (Tsushima) Basin, East Sea (Sea of Japan). J. Sediment. Res. 1984, 54, 1212–1220. [Google Scholar]
  45. PIPER, D.W. Turbidite muds and silts on deepsea fans and abyssal plains. In Sedimentation in Submarine Canyons, Fans, and Trenches; Dowden, Hutchinson & Ross: Stroudsburg, PA, USA, 1978. [Google Scholar]
  46. Stow, D.A.; Faugères, J.-C.; Viana, A.; Gonthier, E. Fossil contourites: A critical review. Sediment. Geol. 1998, 115, 3–31. [Google Scholar] [CrossRef]
  47. Hansen, M.; Perner, M. A novel hydrogen oxidizer amidst the sulfur-oxidizing Thiomicrospira lineage. ISME J. 2015, 9, 696. [Google Scholar] [CrossRef]
  48. Brinkhoff, T.; Sievert, S.M.; Kuever, J.; Muyzer, G. Distribution and diversity of sulfur-oxidizingThiomicrospira spp. at a shallow-water hydrothermal vent in the Aegean Sea (Milos, Greece). Appl. Environ. Microbiol. 1999, 65, 3843–3849. [Google Scholar] [CrossRef] [Green Version]
  49. Kuenen, J.; Veldkamp, H. Thiomicrospira pelophila, gen. n., sp. n., a new obligately chemolithotrophic colourless sulfur bacterium. Antonie van Leeuwenhoek 1972, 38, 241–256. [Google Scholar] [CrossRef]
  50. Li, H.; Yang, X.; Zhang, Z.; Weng, B.; Huang, F.; Zhu, G.-B.; Zhu, Y.-G. Nitrogen loss by anaerobic oxidation of ammonium in rice rhizosphere. ISME J. 2015, 9, 2059–2067. [Google Scholar]
  51. Xu, J.-J.; Zhu, X.-L.; Zhang, Q.-Q.; Cheng, Y.-F.; Zhu, Y.-H.; Ji, Z.-Q.; Jin, R.-C. Roles of MnO2 on performance, sludge characteristics and microbial community in anammox system. Sci. Total Environ. 2018, 633, 848–856. [Google Scholar] [CrossRef] [PubMed]
  52. Kemp, A.E.; Kemp, A.E. Palaeoclimatology and Palaeoceanography from Laminated Sediments; Geological Society of London: London, UK, 1996. [Google Scholar]
  53. Da Silva, A.-C.; Whalen, M.T.; Hladil, J.; Koptikova, L.; Chen, D.; Spassov, S.; Boulvain, F.; Devleeschouwer, X. Application of magnetic susceptibility as a paleoclimatic proxy on Paleozoic sedimentary rocks and characterization of the magnetic signal–IGCP-580 projects and events. Episodes 2014, 37, 87–95. [Google Scholar] [CrossRef] [PubMed] [Green Version]
  54. Wang, J.; Chen, D.; Yan, D.; Wei, H.; Xiang, L. Evolution from an anoxic to oxic deep ocean during the Ediacaran–Cambrian transition and implications for bioradiation. Chem. Geol. 2012, 306, 129–138. [Google Scholar] [CrossRef]
  55. Oba, T.; Kato, M.; Kitazato, H.; Koizumi, I.; Omura, A.; Sakai, T.; Takayama, T. Paleoenvironmental changes in the Japan Sea during the last 85,000 years. Paleoceanography 1991, 6, 499–518. [Google Scholar] [CrossRef]
  56. Yoo, D.G.; Park, S.C. Late Quaternary lowstand wedges on the shelf margin and trough region of the Korea Strait. Sediment. Geol. 1997, 109, 121–133. [Google Scholar] [CrossRef]
  57. Gorbarenko, S.; Southon, J. Detailed Japan Sea paleoceanography during the last 25 kyr: Constraints from AMS dating and δ18O of planktonic foraminifera. Palaeogeogr. Palaeoclimatol. Palaeoecol. 2000, 156, 177–193. [Google Scholar] [CrossRef]
  58. Hyun, S.; Bahk, J.J.; Suk, B.-C.; Park, B.-K. Alternative modes of Quaternary pelagic biosiliceous and carbonate sedimentation: A perspective from the East Sea (Japan Sea). Palaeogeogr. Palaeoclimatol. Palaeoecol. 2007, 247, 88–99. [Google Scholar] [CrossRef]
  59. Chun, J.-H.; Han, S.-J.; Cheong, D.-K. Tephrostratigraphy in the Ulleung Basin, East Sea: Late Pleistocene to Holocene. Geosci. J. 1997, 1, 154–166. [Google Scholar] [CrossRef]
  60. Lim, D.; Xu, Z.; Choi, J.; Kim, S.; Kim, E.; Kang, S.; Jung, H. Paleoceanographic changes in the Ulleung Basin, East (Japan) Sea, during the last 20,000 years: Evidence from variations in element composition of core sediments. Prog. Oceanogr. 2011, 88, 101–115. [Google Scholar] [CrossRef]
  61. León, M.J.; Martínez-Checa, F.; Ventosa, A.; Sánchez-Porro, C. Idiomarina aquatica sp. nov, a moderately halophilic bacterium isolated from salterns. Int. J. Syst. Evol. Microbiol. 2015, 65, 4595–4600. [Google Scholar] [CrossRef]
  62. Brettar, I.; Christen, R.; Höfle, M.G. Idiomarina baltica sp. nov., a marine bacterium with a high optimum growth temperature isolated from surface water of the central Baltic Sea. Int. J. Syst. Evol. Microbiol. 2003, 53, 407–413. [Google Scholar] [CrossRef] [PubMed] [Green Version]
  63. Jean, W.D.; Leu, T.-Y.; Lee, C.-Y.; Chu, T.-J.; Lin, S.Y.; Shieh, W.Y. Pseudidiomarina marina sp. nov. and Pseudidiomarina tainanensis sp. nov. and reclassification of Idiomarina homiensis and Idiomarina salinarum as Pseudidiomarina homiensis comb. nov. and Pseudidiomarina salinarum comb. nov., respectively. Int. J. Syst. Evol. Microbiol. 2009, 59, 53–59. [Google Scholar] [CrossRef] [PubMed] [Green Version]
  64. Essén, S.A.; Johnsson, A.; Bylund, D.; Pedersen, K.; Lundström, U.S. Siderophore production by Pseudomonas stutzeri under aerobic and anaerobic conditions. Appl. Environ. Microbiol. 2007, 73, 5857–5864. [Google Scholar] [CrossRef] [PubMed] [Green Version]
  65. Liu, M.; Luo, X.; Zhang, L.; Dai, J.; Wang, Y.; Tang, Y.; Li, J.; Sun, T.; Fang, C. Pseudomonas xinjiangensis sp. nov., a moderately thermotolerant bacterium isolated from desert sand. Int. J. Syst. Evol. Microbiol. 2009, 59, 1286–1289. [Google Scholar] [CrossRef] [PubMed] [Green Version]
  66. Sánchez, D.; Mulet, M.; Rodríguez, A.C.; David, Z.; Lalucat, J.; García-Valdés, E. Pseudomonas aestusnigri sp. nov., isolated from crude oil-contaminated intertidal sand samples after the Prestige oil spill. Syst. Appl. Microbiol. 2014, 37, 89–94. [Google Scholar] [CrossRef] [PubMed]
  67. Zhang, L.; Pan, Y.; Wang, K.; Zhang, X.; Zhang, C.; Zhang, S.; Fu, X.; Jiang, J. Pseudomonas zhaodongensis sp. nov., isolated from saline and alkaline soils. Int. J. Syst. Evol. Microbiol. 2015, 65, 1022–1030. [Google Scholar] [CrossRef]
  68. Pascual, J.; Lucena, T.; Ruvira, M.A.; Giordano, A.; Gambacorta, A.; Garay, E.; Arahal, D.R.; Pujalte, M.J.; Macián, M.C. Pseudomonas litoralis sp. nov, isolated from Mediterranean seawater. Int. J. Syst. Evol. Microbiol. 2012, 62, 438–444. [Google Scholar] [CrossRef]
  69. Hwang, C.Y.; Zhang, G.I.; Kang, S.-H.; Kim, H.J.; Cho, B.C. Pseudomonas pelagia sp. nov., isolated from a culture of the Antarctic green alga Pyramimonas gelidicola. Int. J. Syst. Evol. Microbiol. 2009, 59, 3019–3024. [Google Scholar] [CrossRef]
  70. Neufeld, J.D.; Boden, R.; Moussard, H.; Schäfer, H.; Murrell, J.C. Substrate-specific clades of active marine methylotrophs associated with a phytoplankton bloom in a temperate coastal environment. Appl. Environ. Microbiol. 2008, 74, 7321–7328. [Google Scholar] [CrossRef] [Green Version]
  71. Jetten, M.S.; Wagner, M.; Fuerst, J.; Van Loosdrecht, M.; Kuenen, G.; Strous, M. Microbiology and application of the anaerobic ammonium oxidation (‘anammox’) process. Curr. Opin. Biotechnol. 2001, 12, 283–288. [Google Scholar] [CrossRef]
  72. Neumann, S.; Wessels, H.J.; Rijpstra, W.I.C.; Sinninghe Damsté, J.S.; Kartal, B.; Jetten, M.S.; Van Niftrik, L. Isolation and characterization of a prokaryotic cell organelle from the anammox bacterium K uenenia stuttgartiensis. Mol. Microbiol. 2014, 94, 794–802. [Google Scholar] [CrossRef] [PubMed]
  73. Sternbeck, J.; Sohlenius, G. Authigenic sulfide and carbonate mineral formation in Holocene sediments of the Baltic Sea. Chem. Geol. 1997, 135, 55–73. [Google Scholar] [CrossRef]
  74. Scholz, F.; McManus, J.; Sommer, S. The manganese and iron shuttle in a modern euxinic basin and implications for molybdenum cycling at euxinic ocean margins. Chem. Geol. 2013, 355, 56–68. [Google Scholar] [CrossRef]
  75. Tebo, B.M.; Bargar, J.R.; Clement, B.G.; Dick, G.J.; Murray, K.J.; Parker, D.; Verity, R.; Webb, S.M. Biogenic manganese oxides: Properties and mechanisms of formation. Annu. Rev. Earth Planet. Sci. 2004, 32, 287–328. [Google Scholar] [CrossRef] [Green Version]
  76. Hyun, J.-H.; Kim, S.-H.; Mok, J.-S.; Cho, H.; Lee, T.; Vandieken, V.; Thamdrup, B. Manganese and iron reduction dominate organic carbon oxidation in surface sediments of the deep Ulleung Basin, East Sea. Biogeosciences 2017, 14, 941–958. [Google Scholar] [CrossRef] [Green Version]
  77. Dubois, M.; Lopez, M.; Orberger, B.; Rodriguez, C.; Boussafir, M.; Dreux, G.; Rodrigues, S.; Pambo, F. The Mn-carbonate rich black shales of the Bangombe Plateau, Francevillian basin, Gabon. In Mineral Resources in a Sustainable World; Springer: New York, NY, USA, 2015; pp. 1905–1908. [Google Scholar]
  78. Strous, M.; Pelletier, E.; Mangenot, S.; Rattei, T.; Lehner, A.; Taylor, M.W.; Horn, M.; Daims, H.; Bartol-Mavel, D.; Wincker, P. Deciphering the evolution and metabolism of an anammox bacterium from a community genome. Nature 2006, 440, 790. [Google Scholar] [CrossRef]
Figure 1. Map of the East Sea. In the right figure, the yellow cross is the location of the core DPC1801, and the white triangles are islands. UIG = Ulleung Interplain Gap; S.M. = seamount.
Minerals 10 00208 g001
Figure 2. The Sedimentary Facies of DPC1801. Unit 1 is the interglacial period (0–188cm), Unit 2 is the late glacial period (188–480 cm), and Unit 3 is the glacial period (480–670 cm). From the left, (a) whole core sedimentary facies with a core photo and X-ray radiograph; (b) CaM mud (461–487.2 cm); (c) laminated mud (602–622.4 cm)
Minerals 10 00208 g002
Figure 3. The Core Analysis Data of DPC1801 as Periods. U: U-Oki tephra (9.3 ka), T: TL-1 (11.5 ka), M: Mn-carbonates (14.5 ka). From the left, (a) photo image, X-ray radiograph, sedimentary facies; (b) grain size distribution; (c) magnetic susceptibility; (d) the relative proportion of clay minerals-smectite/(illite+chlorite); (e) X-ray fluorescence.
Minerals 10 00208 g003
Figure 4. The XRD Patterns of Core Samples. Air dried and glycolation treatment for clay with depths. The red line indicates Mn carbonate. S = Smectite, I = Illite, K = Kaolinite, C = Chlorite, Pl = Plagioclase, Q = Quartz, and M = Mn carbonate.
Minerals 10 00208 g004
Figure 5. The Selected Smectites Samples with TEM Micrographs. (a) Unit 1 (interglacial period) samples with SAED patterns, (b) Unit 2 (late glacial period) samples with SAED patterns, and (c) Dokdo Island samples with SAED patterns.
Minerals 10 00208 g005
Figure 6. Ternary (Al-Fe-Mg) Diagram of the Octahedral Composition from Unit 1 (blue star), Unit 2 (green square), and Dokdo Island (black circle).
Minerals 10 00208 g006
Figure 7. Relative Bacterial Abundance at the Family Level. The vertical and horizontal axes represent the taxonomic family and the name of the samples, respectively. The colors of the circles in the chart represent the name of the taxonomic classes. The size of the circle shows the number of microorganisms in the Family and Class. The Family and the Class not marked with a scientific name represent unidentified organisms. The samples at 40, 104.5, 124, 154.5 (U-Oki), 164, and 186 cm (TL-1) represent the interglacial period, while at 200, 286, 411, 461, and 478 (CaM) cm, they represent the late glacial period. The sample at 482.5, 496, 560, 641.5, and 661.5 cm represent the glacial period.
Minerals 10 00208 g007
Figure 8. Cladogram of Samples Based on the Analytical Data of the Weighted UniFrac Distance. Tree was constructed from 16 samples. Below the scale bar indicates 0.1% sequence divergence.
Minerals 10 00208 g008
Figure 9. Bacterial Abundance Coupled with Sedimentary Facies from Core DPC1801. Dotted lines indicate the sampling location with depths. The red figures represent Gammaproteobacteria, while the black figures represent Alphaproteobacteria. The blue figures represent ANAMMOX bacteria, and the green figures represent EU290722.
Minerals 10 00208 g009
Figure 10. Formation of Microbially Induced Mn-Carbonates. The black arrow is a chemical reaction, while the red arrows show sea level changes. (a) represents anoxic conditions during the glacial period with a sea level fall. (b) represents the late glacial period with a sea level rise, and thus oxic water circulation. (c) is the redox reaction of Mn, and consequently the occurrence of Mn-carbonates, at the anoxic basin floor.
Minerals 10 00208 g010

