Article

Power Generation: Feedstock for High-Value Sulfate Minerals

1
Institute for Microbiology, Faculty of Biology, University of Warsaw, Miecznikowa 1, 02-096 Warsaw, Poland
2
Faculty of Geology, Geophysics and Environmental Protection, AGH University of Science and Technology, al. A. Mickiewicza 30, 30-059 Krakow, Poland
3
ISTerre, University Grenoble Alpes & CNRS, 38000 Grenoble, France
*
Author to whom correspondence should be addressed.
Minerals 2020, 10(2), 188; https://doi.org/10.3390/min10020188
Submission received: 30 November 2019 / Revised: 9 February 2020 / Accepted: 16 February 2020 / Published: 19 February 2020
(This article belongs to the Special Issue Barite)

Abstract

:
Coal-fired power facilities generate a polymetallic effluent (Flue Gas Desulfurization—FGD) rich in sulfate. FGD effluents may be considered an important secondary resource. This paper investigates the recovery of sulfate as barite (BaSO4), a mineral with high commercial value and a critical raw material. Using equimolar BaCl2, >99% desulfurization of an FGD effluent produced by a coal-fired power plant operating in central Poland was achieved, yielding up to 16.5 kg high purity barite m−3. The recovered barite was characterized by X-ray diffraction (XRD), Fourier-transform infrared spectroscopy (FTIR), thermogravimetric (TGA), scanning electron microscopy analysis (SEM), surface properties (PZC), density, and chemical stability (TCLP), and was compared with a commercial reference material. Barite recovery also led to the reduction in concentration of Al (86%), Cu (52%), K (69%), Mo (62%), Se (40%), Sr (91%), and U (75%) initially present in the FGD effluent. TCLP results indicate the entrapment and the stabilization of ~70% Se and ~90% Al in the barite structure. Based on this dataset, an in-depth characterization of the recovered barite is presented, and the removal mechanism of the elements is discussed. The study also provides a preliminary cost benefit analysis of the process. To our best knowledge, this is the first work showing barite recovery and metal removal from FGD effluents using a one-step process.

Graphical Abstract

1. Introduction

Coal combustion has an important share in the electrical power generated worldwide [1]. Although unevenly distributed by country and region, a quarter of the European Union’s (EU) power is produced by coal burning [2]. According to EU reports, coal is the most abundant fossil fuel in the EU and represents an important source of economic activity in the region [3]. Within EU, Poland [4] (with up to 80% of the energy mix) and Germany [5] (up to 40%) heavily rely on this fossil resource to fuel their economic growth. Modern coal-fired power stations have several pollution control devices aiming to alleviate the negative impact on the environment. Among these, Flue Gas Desulfurization (FGD) units aim at removing SO2 from the flue gas by transforming it into gypsum (CaSO4∙2H2O), a marketable product [6]. In addition to gypsum, FGD systems also generate a process water (i.e., FGD effluents) enriched in metals, metalloids, and sulfates [7].
FGD effluents include a complex mixture of anions (e.g., chloride, carbonate, nitrate, sulfate, selenate), major cations (e.g., Ca, Mg), and a wide spectrum of metals (e.g., Al, Cd, Cr, Hg, Ni, V, Zn) [8,9]. In this multicomponent effluent, selenium (Se) is of particular importance, as this metalloid has been documented to have adverse effects on industrial workers [10] and on aquatic life, leading to the virtual collapse of entire ecosystems as documented in Kesterson reservoir (California), San Francisco Bay, and Lake Belews (North Carolina) [11,12]. Soluble selenium oxyanions, selenite, SeO32−, and selenate, SeO42−, are bioavailable and are biomagnified (i.e., concentrated in the tissues of organisms at successively higher levels in a food chain) in fish and aquatic birds, having a major negative impact on the species present at the top of the food web [13,14]. FGD effluents are produced in large volumes by fossil-fuel power stations equipped with FGD units, and contain Se mainly as selenate [15], the most challenging Se oxyanion to remove by both physicochemical and biological treatment systems [16,17,18].
From a circular economy perspective, FGD effluents are considered a source of secondary resources [19,20]. As well, due to their high sulfate content, FGD are also a potential source of minerals. One such mineral, barite (BaSO4), is listed as a critical raw material (CRM) by EU reports [21], having multiple industrial utilizations including density agent for oil and gas drilling fluids, additive for radiation barrier cements, and filler in automotive, construction, and paint industries, etc. [22]. According to the 2017 CRM report, the EU has an 80% import reliance rate for barite and a 0.94 substitution index (i.e., index ranging from 0 to 1, with 1 the least substitutable), the main sources of supply being China (34%) and Morocco (30%) [21]. Therefore, the need to generate barite inside the EU is of major importance. However, this situation can occur in other regions as well, especially in those where oil extraction is a key industrial segment.
Based on our best knowledge, this is the first study showing precipitation and recovery of barite from real FGD effluents. The study is supported by an extensive characterization of the recovered material. Additionally, the paper presents and discusses the simultaneous clean-up (accompanying barite precipitation) and the removal of various toxic elements present in a real FGD solution. Finally, the dataset is complemented by a preliminary cost–benefit analysis of the barite recovery process.

2. Materials and Methods

2.1. Reagents and Industrial Effluent

BaCl2∙2H2O and BaSO4 (Reagent Plus 99%) were purchased from Sigma Aldrich. Purchased BaSO4 will further be referred to as “commercial barite”, whereas the barite recovered from FGD effluent will be referred to as “recovered barite”. Glacial acetic acid (anhydrous, 100%) was from Emsure. Unless otherwise stated, all reagents used were of analytical grade quality. All solutions, except for the FGD effluent, were prepared using deionized water. The FGD effluent was obtained from a coal-fired power facility located in central Poland. During the investigation, the FGD effluent was stored at 4 °C and allowed to equilibrate at room temperature (20 ± 1 °C) prior to each experiment. After temperature equilibration, the effluent was vacuum-filtered using sterile filters.

2.2. Barite Recovery

After measuring sulfate concentration in the FGD effluent using Ion Chromatography (IC), BaCl2 was added in equimolar amount to sulfate ion present in the effluent in order to form BaSO4. Following the reaction, a whitish colloidal system was readily formed and the reaction was allowed to proceed for 5 min under constant magnetic stirring. The reaction was monitored by pH and conductivity change until reaching constant values. Separation of colloidal BaSO4 suspension was achieved by gravitational filtration using Boeco 391 paper filters (2–3 µm cutoff) and the recovered material was dried in hot air oven at 60 °C for 48 h until reaching constant mass. The dried powder was ground using agate mortar and pestle for further characterization.

2.3. Point of Zero Charge (PZC)

PZC of commercial and recovered barite was determined as per [23]. In short, a solution of 0.1 M NaCl was prepared in deionized water. Then, 40 mL of this solution was pH adjusted to 3–10 using an automatic titrator (905 Titrando, Metrohm, Herisau, Switzerland) with 0.1 M HNO3 and 0.1 M NaOH. In the flask corresponding to each pH value, 0.2 g of barite were added and the flasks were shaken on a horizontal shaker (HS 501, IKA, Königswinter, Germany) at 130 rpm for 24 h at room temperature. After 24 h, the pH values were recorded again and the ∆pH was plotted against initial pH. PZC is the pH value where the slope intercepts the x axis.

2.4. Toxicity Characteristic Leaching Procedure (TCLP)

First, 0.5 g of barite (commercial and recovered) were immersed in 10 mL (1:20 ratio) 0.1 M acetic acid and spun for 24 h at 30 rpm using a rotator (SB3, Stuart, Staffordshire, United Kingdom) as per [24]. The pH of the solution was recorded before the addition of barite and after 24 h of mixing (equilibration time). The solution was centrifuged at 5000 rpm for 20 min and the supernatant was filtered (0.22 µm) prior to ICP analysis. The barite sediment was then dried at 60 °C for 48 h until reaching constant mass and used for acid digestion.

2.5. Density Determination of Barite

The density of commercial and recovered barite was determined using the volume displacement method. For this, 0.5 g of both materials were carefully added to a 10 mL graduated cylinder, followed by the addition of 5 mL of ultrapure water using the gravimetric method. The suspension was allowed to settle for 60 min and then the displaced volume was measured. Prior to the experiment, the volume of the cylinder was confirmed by the gravimetric method. Between experiments, the cylinder was carefully cleaned with ultrapure water and ethanol, allowing it to fully dry before the next experiment.

2.6. Analytics

Trace elemental analysis, including selenium (total soluble Se), was performed by ICP-MS (Elan DRC II, Perkin Elmer, Mundelein, IL, USA). All samples analyzed by ICP were previously filtered using Teknokroma PTFE 0.22 µm syringe-driven filters and acidified using ultrapure HNO3. The calibration was done using certified reference materials. The Limit of Detection (LOD) and Limit of Quantification (LOQ) for the measured elements are provided in Table S1. Inorganic anions present in the raw FGD effluent were determined using a Dionex ICS 1100 (Sunnyvale, CA, USA) equipped with a conductometric detector and a Dionex IonPac AS22 2-mm column. Anion separation was conducted in the following conditions: Eluent, 4.5 mM Na2CO3/1.4 mM NaHCO3; flow rate, 0.3 mL min−1; column temperature, 30 °C; injection volume, 10 μL. Inorganic cations were determined using an ICP-OES (iCAP 6500 Duo spectrometer, Thermo Fisher Scientific, Waltham, MA, USA). The phase characterization of the commercial and recovered barite was performed by X-ray powder diffraction (XRD). Mineralogy was obtained with a RIGAKU SmartLab X-ray diffractometer (Tokyo, Japan) using CuKα radiation, a step scan mode at a step size of 0.05°2θ, and a rate of 1 s per step. The size and morphology of barite were conducted using a TESCAN VEGA3 Scanning Electron Microscopy (SEM) (Fuveau, France). Fourier-transform infrared (FTIR) spectra were recorded with a Nicolet 7600 spectrometer (Waltham, MA, USA) in the mid infrared region (4000 to 400 cm−1). Samples were prepared by the standard KBr method. Simultaneous thermogravimetric (TG) measurements were taken using Netzsch STA 449F3 Jupiter (Netzsch, Chennai, India) apparatus. The air-dried sample was heated from 20 to 1000 °C in an alumina crucible, at 10 °C min−1 in flowing (40 mL·min−1) synthetic air. The chemical analysis of the barite samples was performed by using a JEOL Superprobe JXA-8230 electron microprobe in the Laboratory of Critical Elements AGH-KGHM, AGH-University of Science and Technology, Krakow, Poland. The Electron Probe Microanalysis (EPMA) was operated in the wavelength-dispersion mode at an accelerating voltage of 15 kV, a probe current of 20 nA, and focused beam with a diameter of 3 μm. Counting times of 20 s on peak and 10 s on both (+) and (–) backgrounds were used. Carbonate was determined by titration using a Metrohm 905 Titrando equipment. The Total Organic Carbon (TOC) was determined using a Vario TOC Cube analyzer. Conductivity and pH of FGD samples were measured using a multiparameter instrument (Prolab 4000, Schott, Jena, Germany). The results are presented as average values and standard deviation of three independent experiments (n = 3) unless otherwise stated. When the standard deviation values were smaller than 5%, the error bars were not represented.

3. Results

3.1. FGD Characterization

The FGD effluent collected from a coal-fired power plant operating in central Poland had circumneutral pH (~7.4) and a high electrical conductivity (~10 mS·cm−1), specific to this type of waste streams [18,25]. This high conductivity was generated by the ionic makeup of the system (Table 1). Of these, sulfate was present in high concentration (~7 g·L−1). Other anions such as nitrate, chloride, and bromide also contributed to the ionic strength of the effluent. As well, Ca2+ (~0.5 g·L−1) and Mg2+ (~1.8 g·L−1) were major cations present in the studied FGD. Of the microelements dominating the FGD stream (Table 2), of particular concern was Se (615 µg·L−1), an element known for its deleterious effect on aquatic life [11]. Other elements such as Al (341 µg·L−1), Cd (103 µg·L−1), Co (221 µg·L−1), Fe (720 µg·L−1), Ni (440 µg·L−1), and Zn (369 µg·L−1) warrant the classification of the wastewater as a polymetallic system. Several elements present in low and ultralow concentration are listed in Table S2. On the other hand, FGD effluents are often low in organic carbon content [26]. The Total Organic Carbon (TOC) of the studied effluent was ~52 mg·L−1.

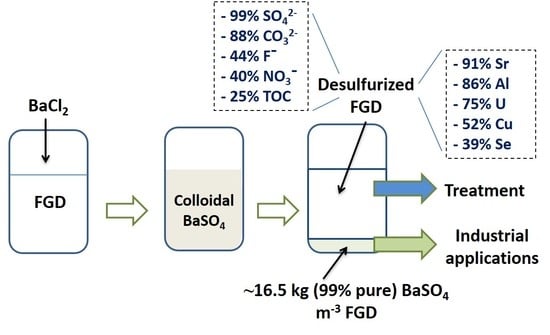
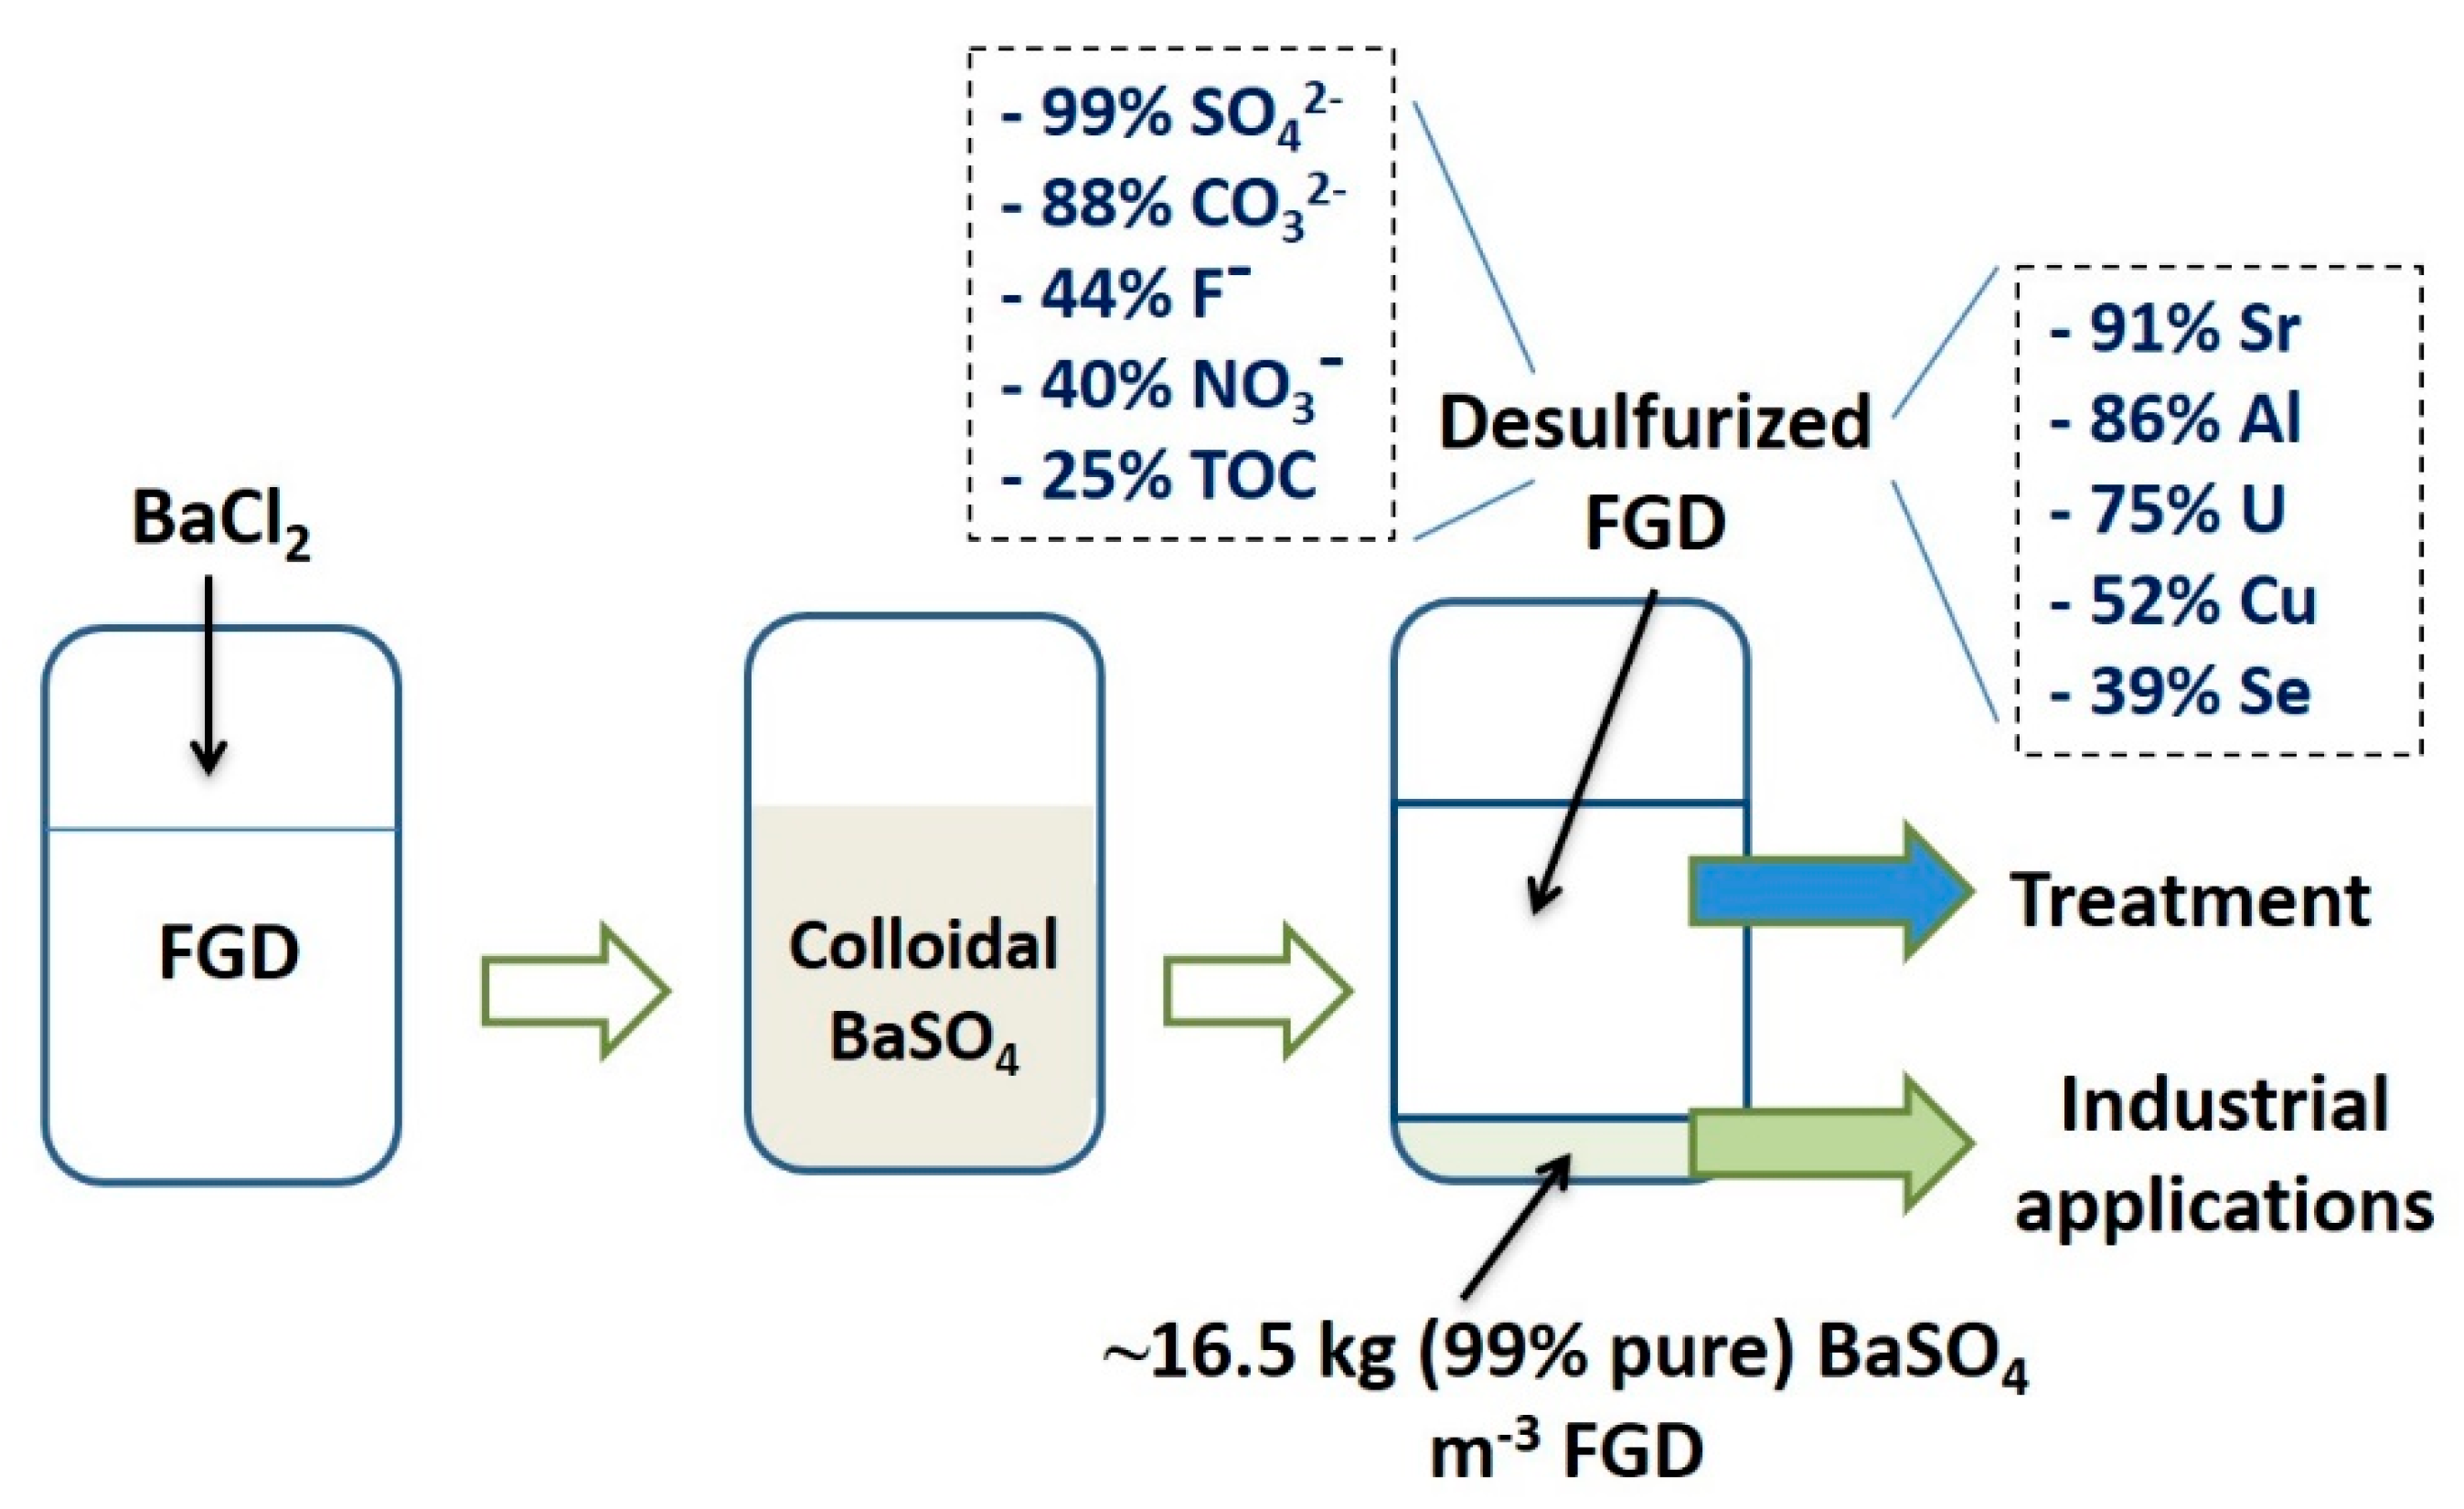
3.2. FGD Desulfurization and BaSO4 Formation

Using equimolar (73.8 mM) BaCl2, >99% of sulfate present in the effluent was removed from solution, yielding ~16.542 g barite per liter of desulfurized FGD (Figure S1). Effluent desulfurization led to an important change of the solution’s chemistry impacting most of the parameters and the chemical elements present (Table 1 and Table 2). The pH decreased by around 0.5 units (from 7.37 to 6.88), while the electrical conductivity showed a 50% increase from an initial 9.89 to 14.86 mS·cm−1.

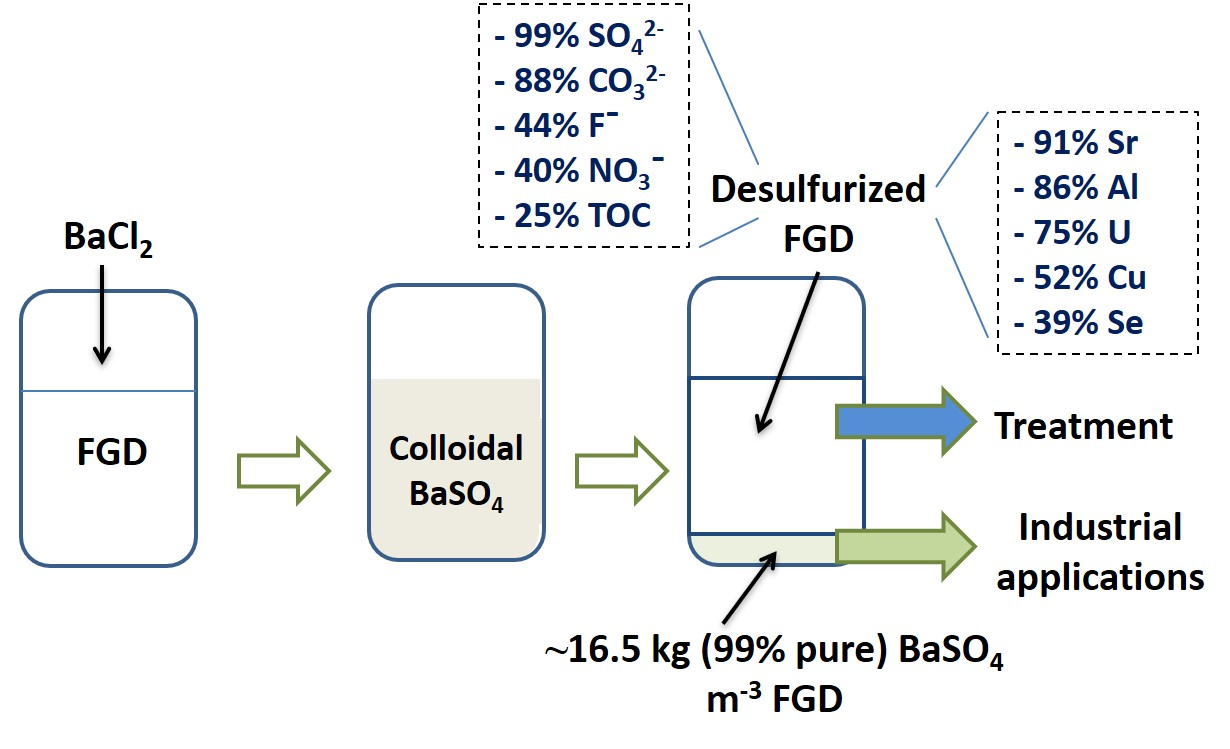
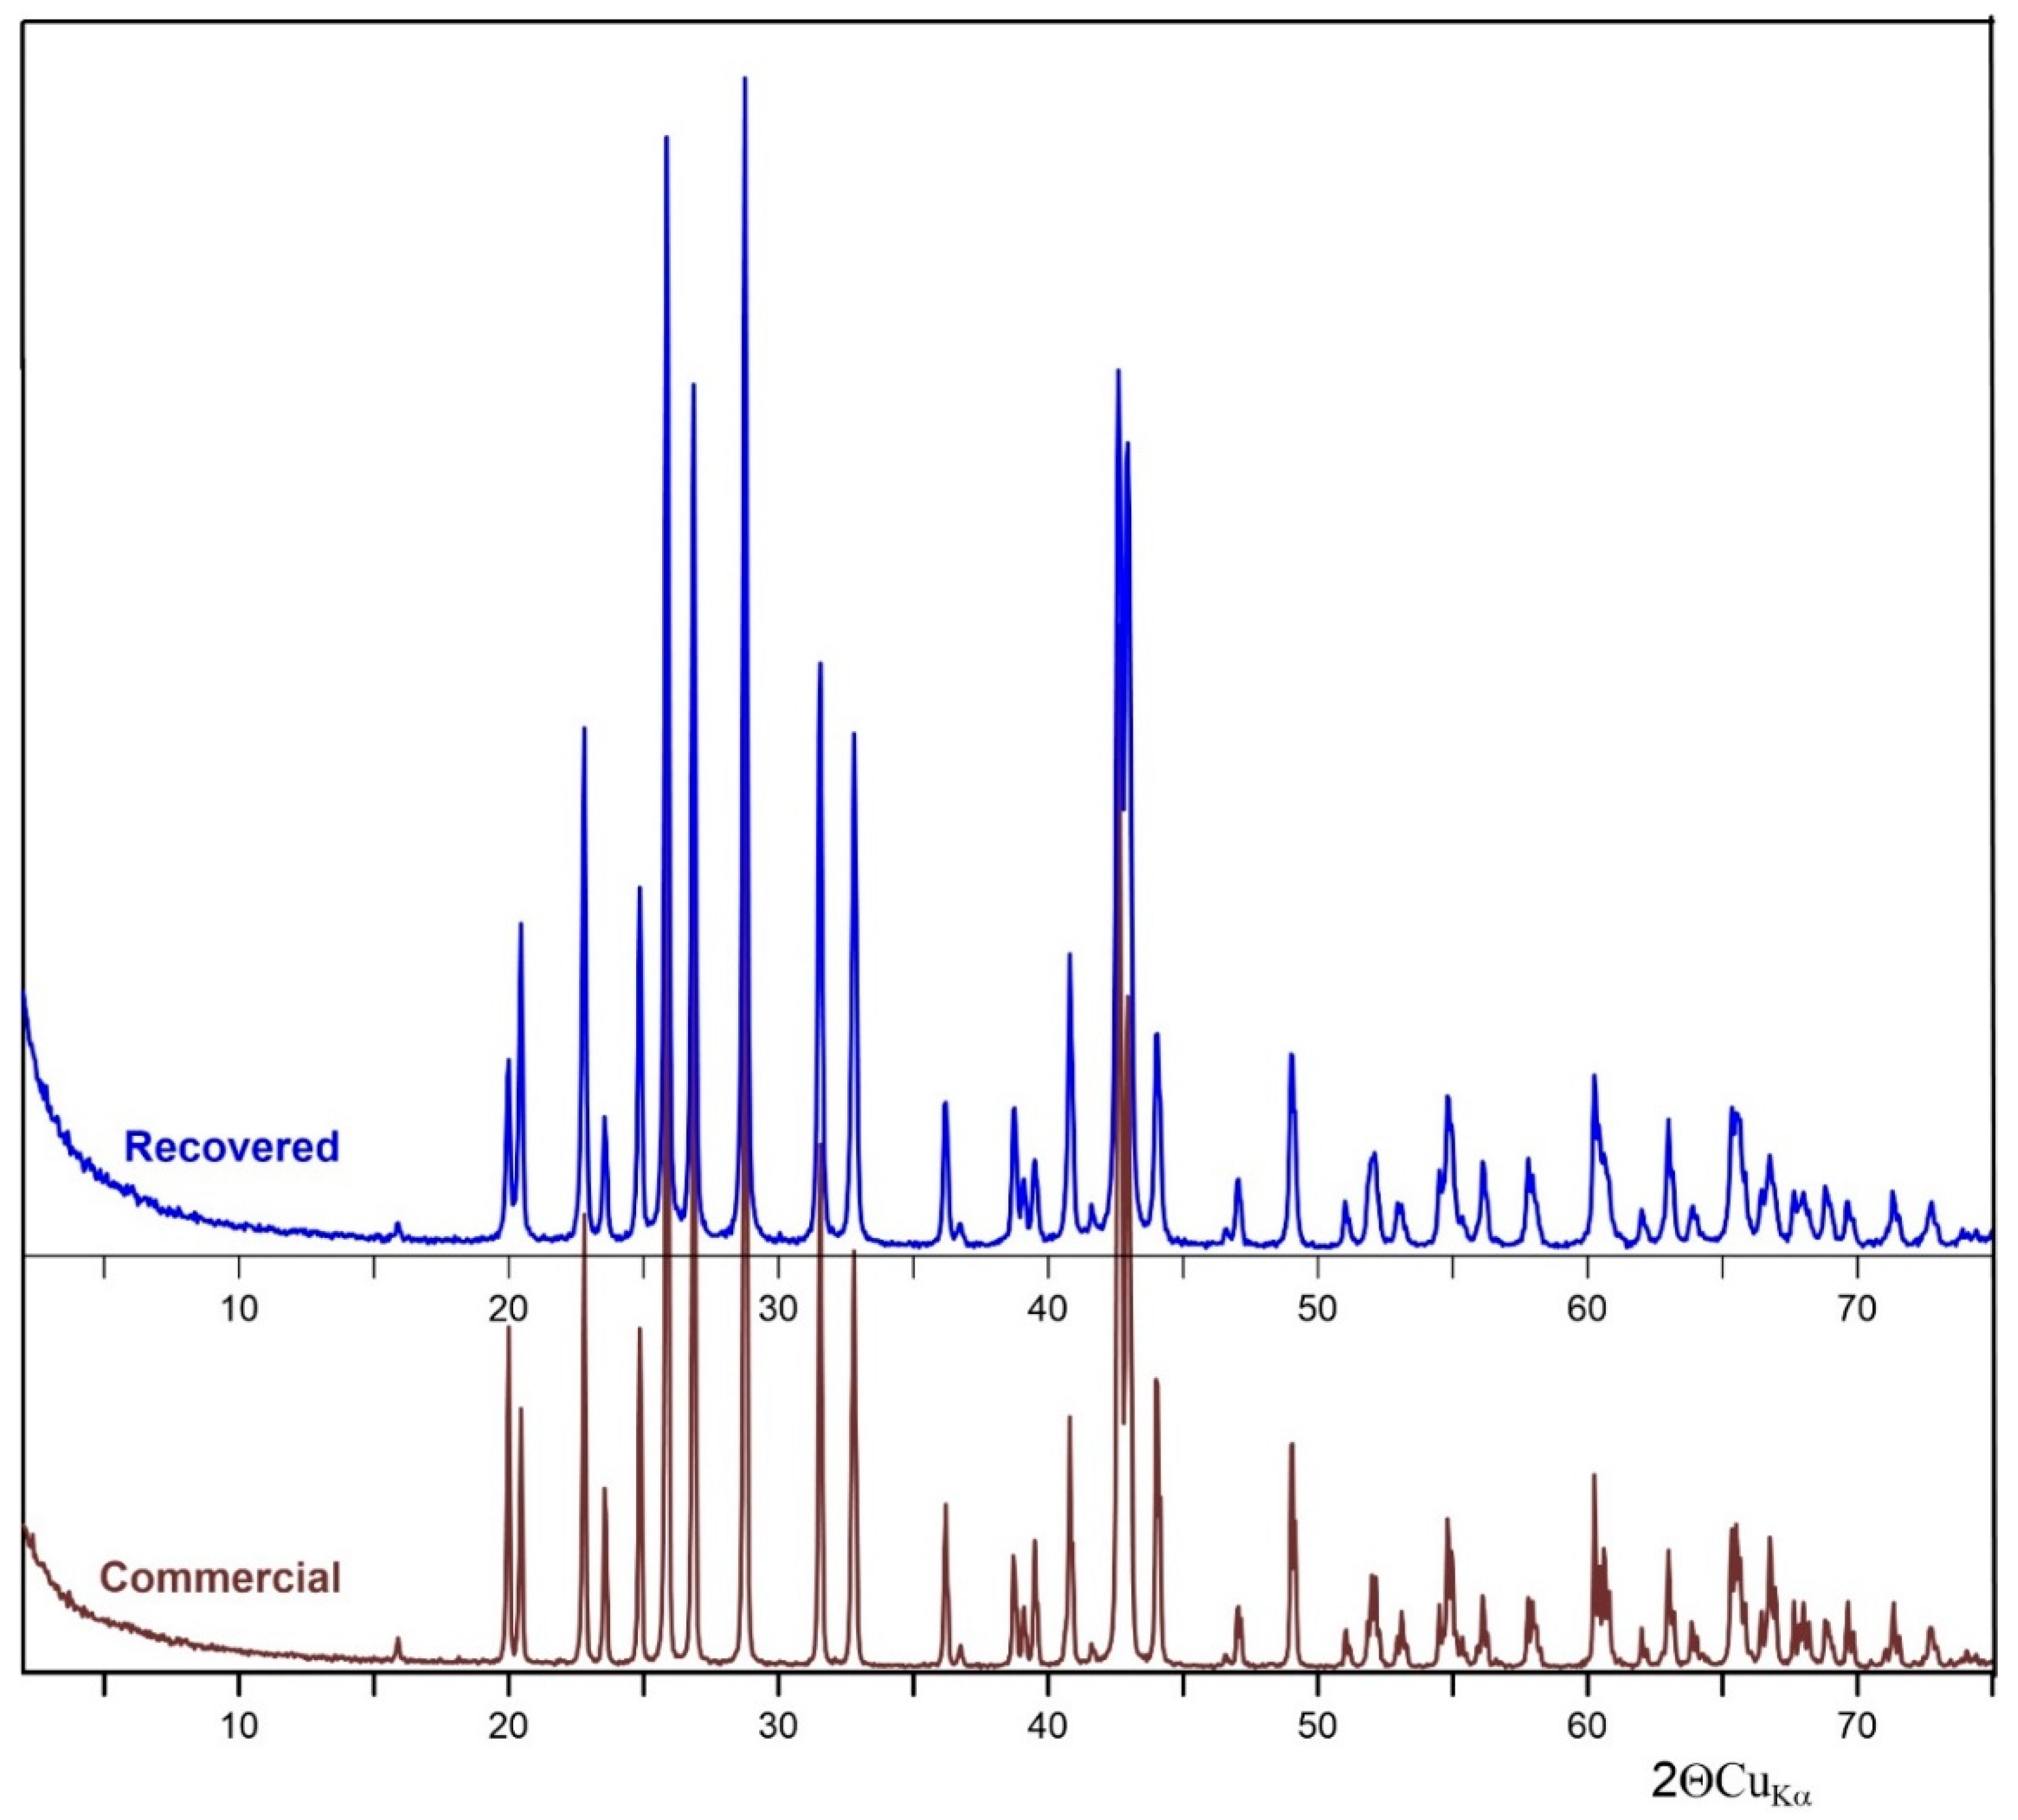
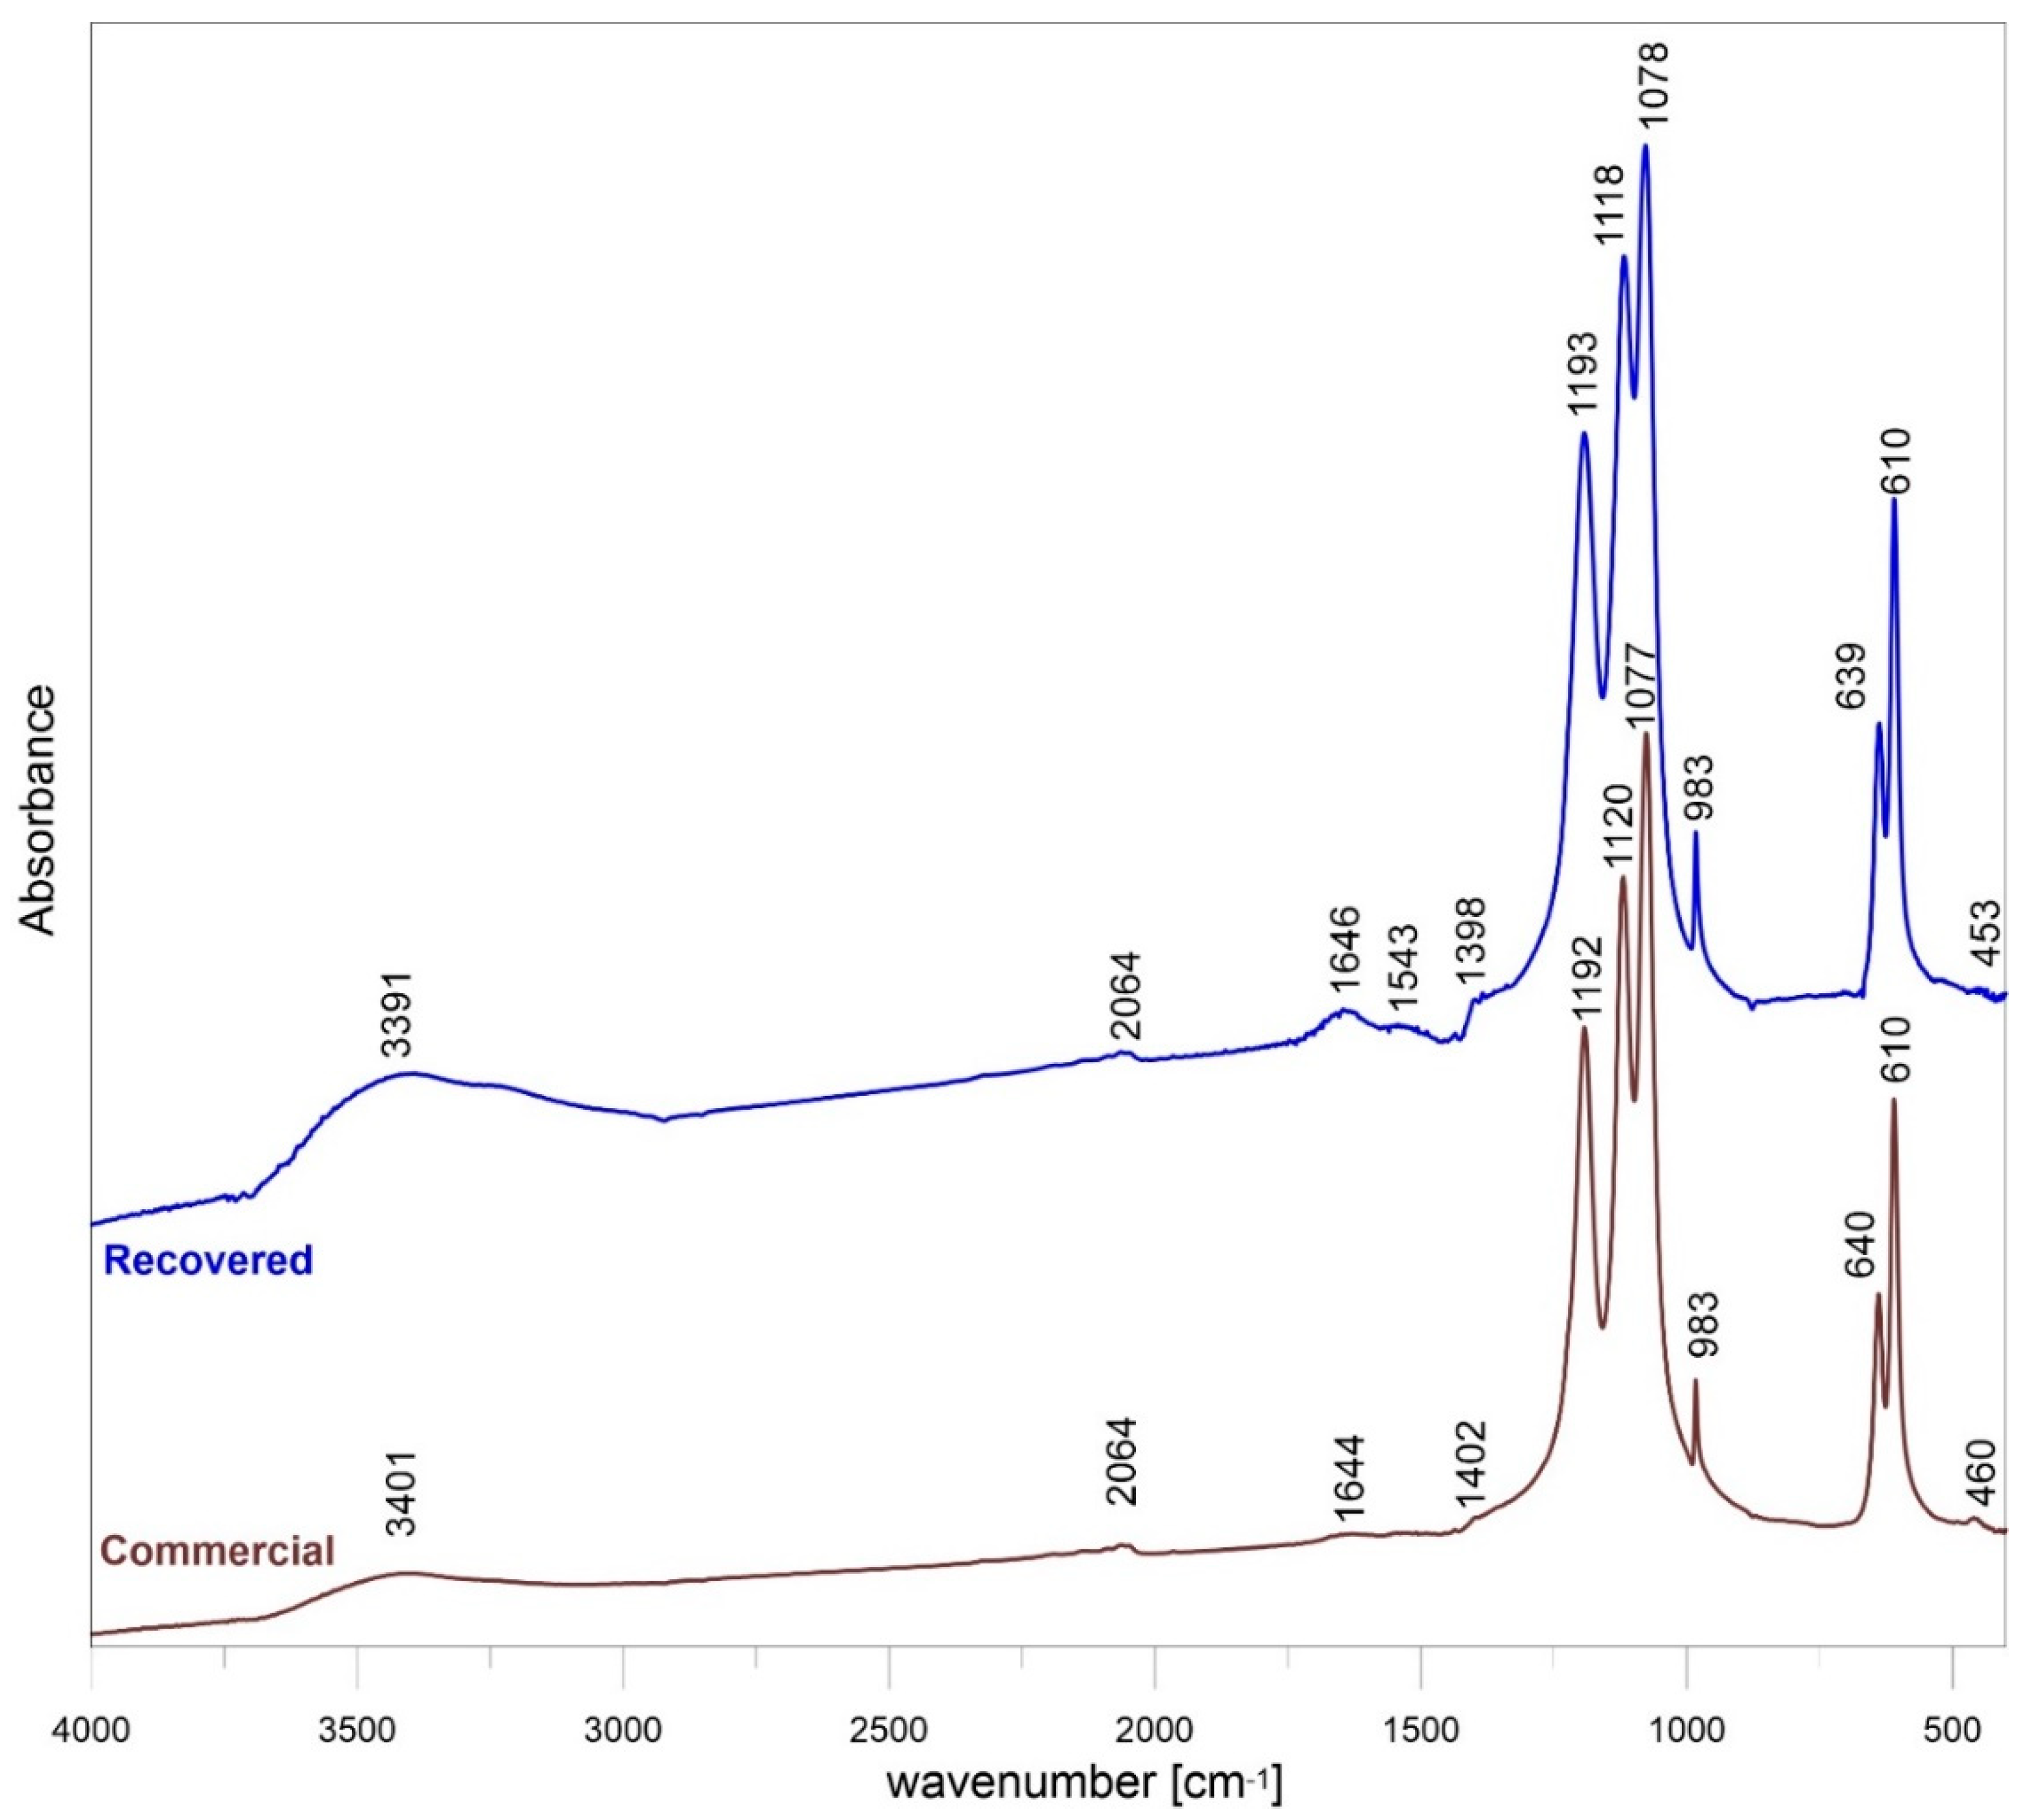
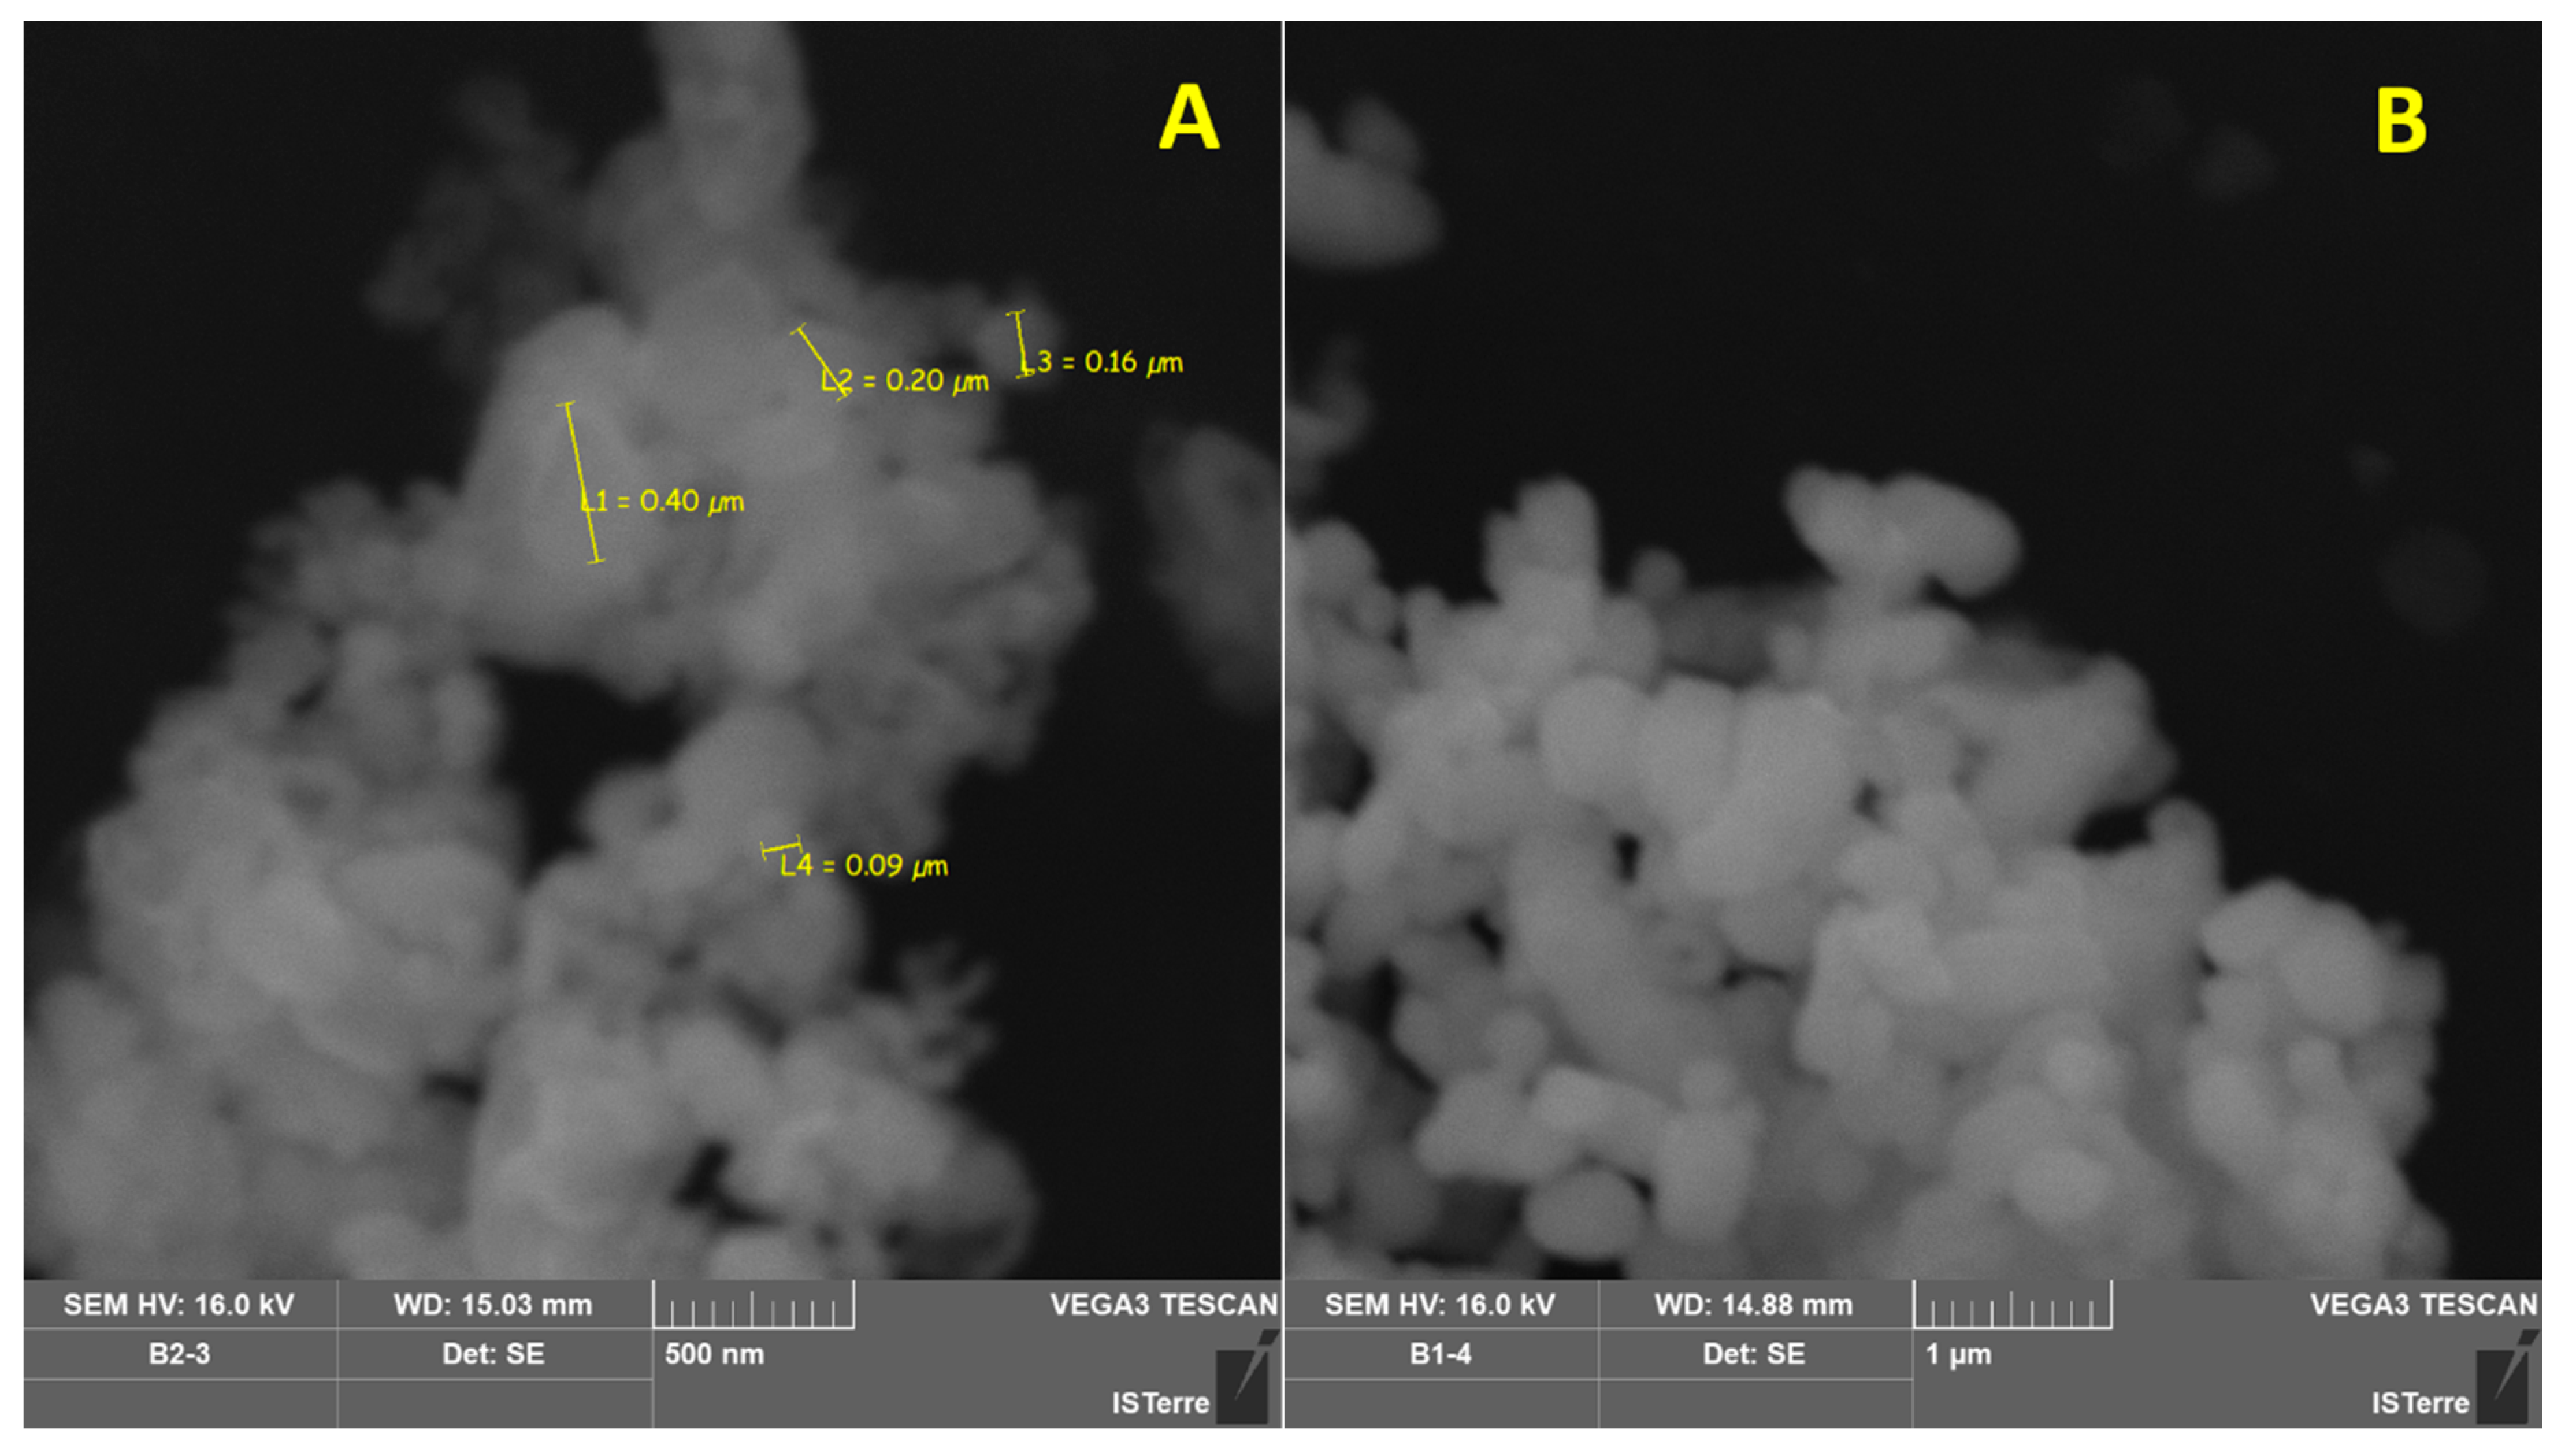
3.3. Characterization of BaSO4

The recovered barite was further investigated by means of XRD, FTIR, TGA, chemical analysis, SEM, PZC, density, and TCLP, and compared with a reference material (commercial barite). Several of its characteristics are summarized in Table 3.
Figure 1 shows the XRD pattern of commercial and recovered barite. All the diffraction peaks can be matched with the reference of the barite structure (JCPDS card no. 24-1035). The diffraction (h k l) peaks (101), (111), (021), (121), (002), and (212) were characteristic of orthorhombic BaSO4 crystals [27].
The FTIR spectrum of commercial and recovered samples of barite are shown in Figure 2. The sulfate group had four vibrational modes: One non-degenerate mode (ν1), one doubly degenerate mode (ν2), and two triply degenerate mode (ν3 and ν4) (Table S3). The sulfur-oxygen (S–O) stretching of inorganic sulfates was found in the region 1179–1083 cm−1. The bands centered at 1193 to 1077 cm−1 and the shoulder at 982 cm−1 was the symmetrical vibration of SO4. From this observation, the slight shift in the peak position may be attributed to the smaller particle size. The very small size of barite grains was confirmed by the results of the SEM analysis presented below. The peaks at 610 and 639–640 cm−1 were due to the out-of-plane bending vibration of the SO4. Generally, bending bands are shaper than the stretching bands, which is observed in the spectrum. The exception was ν2 bending vibrations observed at 453–460 cm−1. The absorption peaks at about 3390–3400 and 1634 cm−1 were due to the stretching and deformation of adsorbed water molecule. The peaks near 2064 and 1543, 1400 cm−1 were overtones and combination bands of the lower wavenumber of sulfur-oxygen stretching and bending vibrations and these peaks did not affect the identification of the substance involved in the experiment. The position bands of commercial and recovered samples varied slightly, up to 2 cm−1, and there was no trend in the shift peak-position of both samples.
The thermal gravimetrical analysis of commercial and recovered barite samples is presented in Figure 3. In the range 20–1000 °C, there was no change in mass loss of commercial barite. In contrast, in the case of recovered barite, a different behavior in mass loss was observed. The TGA curve for recovered barite showed three stages; the first stage started at 20 °C and ended at 125 °C, the second stage started at 125 °C and ended at 265 °C, while the third stage occurred at 285 °C and ended at 630 °C. Over 630 °C further regular mass loss of the sample was observed. The mass loss estimated for the three stages was 0.6%, 0.5%, and 1.8%, respectively. The mass loss in all these stages was caused by the loss of water, which occurred as molecules adsorbed on the recovered barite surface and potentially as water present inside the barite structure. Additionally, these results were confirmed by the FTIR analysis.
SEM analysis revealed commercial barite particles with a well-defined contour and size >400 nm (Figure 4A). In contrast, the particles of recovered barite were characterized by a diffuse contour and submicron 100–400 nm size (Figure 4B).
Based on the results of the chemical analysis, commercial and recovered barite showed very similar composition in terms of the major elements constituting this mineral, namely Ba and S (Table 4). Other elements were present in minor quantities (<0.5%) and displayed very close values for both materials. The recovered barite differed from the commercial material in that it contained more Ca, Mg, and Cl. Figure 5 presents the point of zero charge (PZC) of the two materials, the recovered, and the commercial barite.

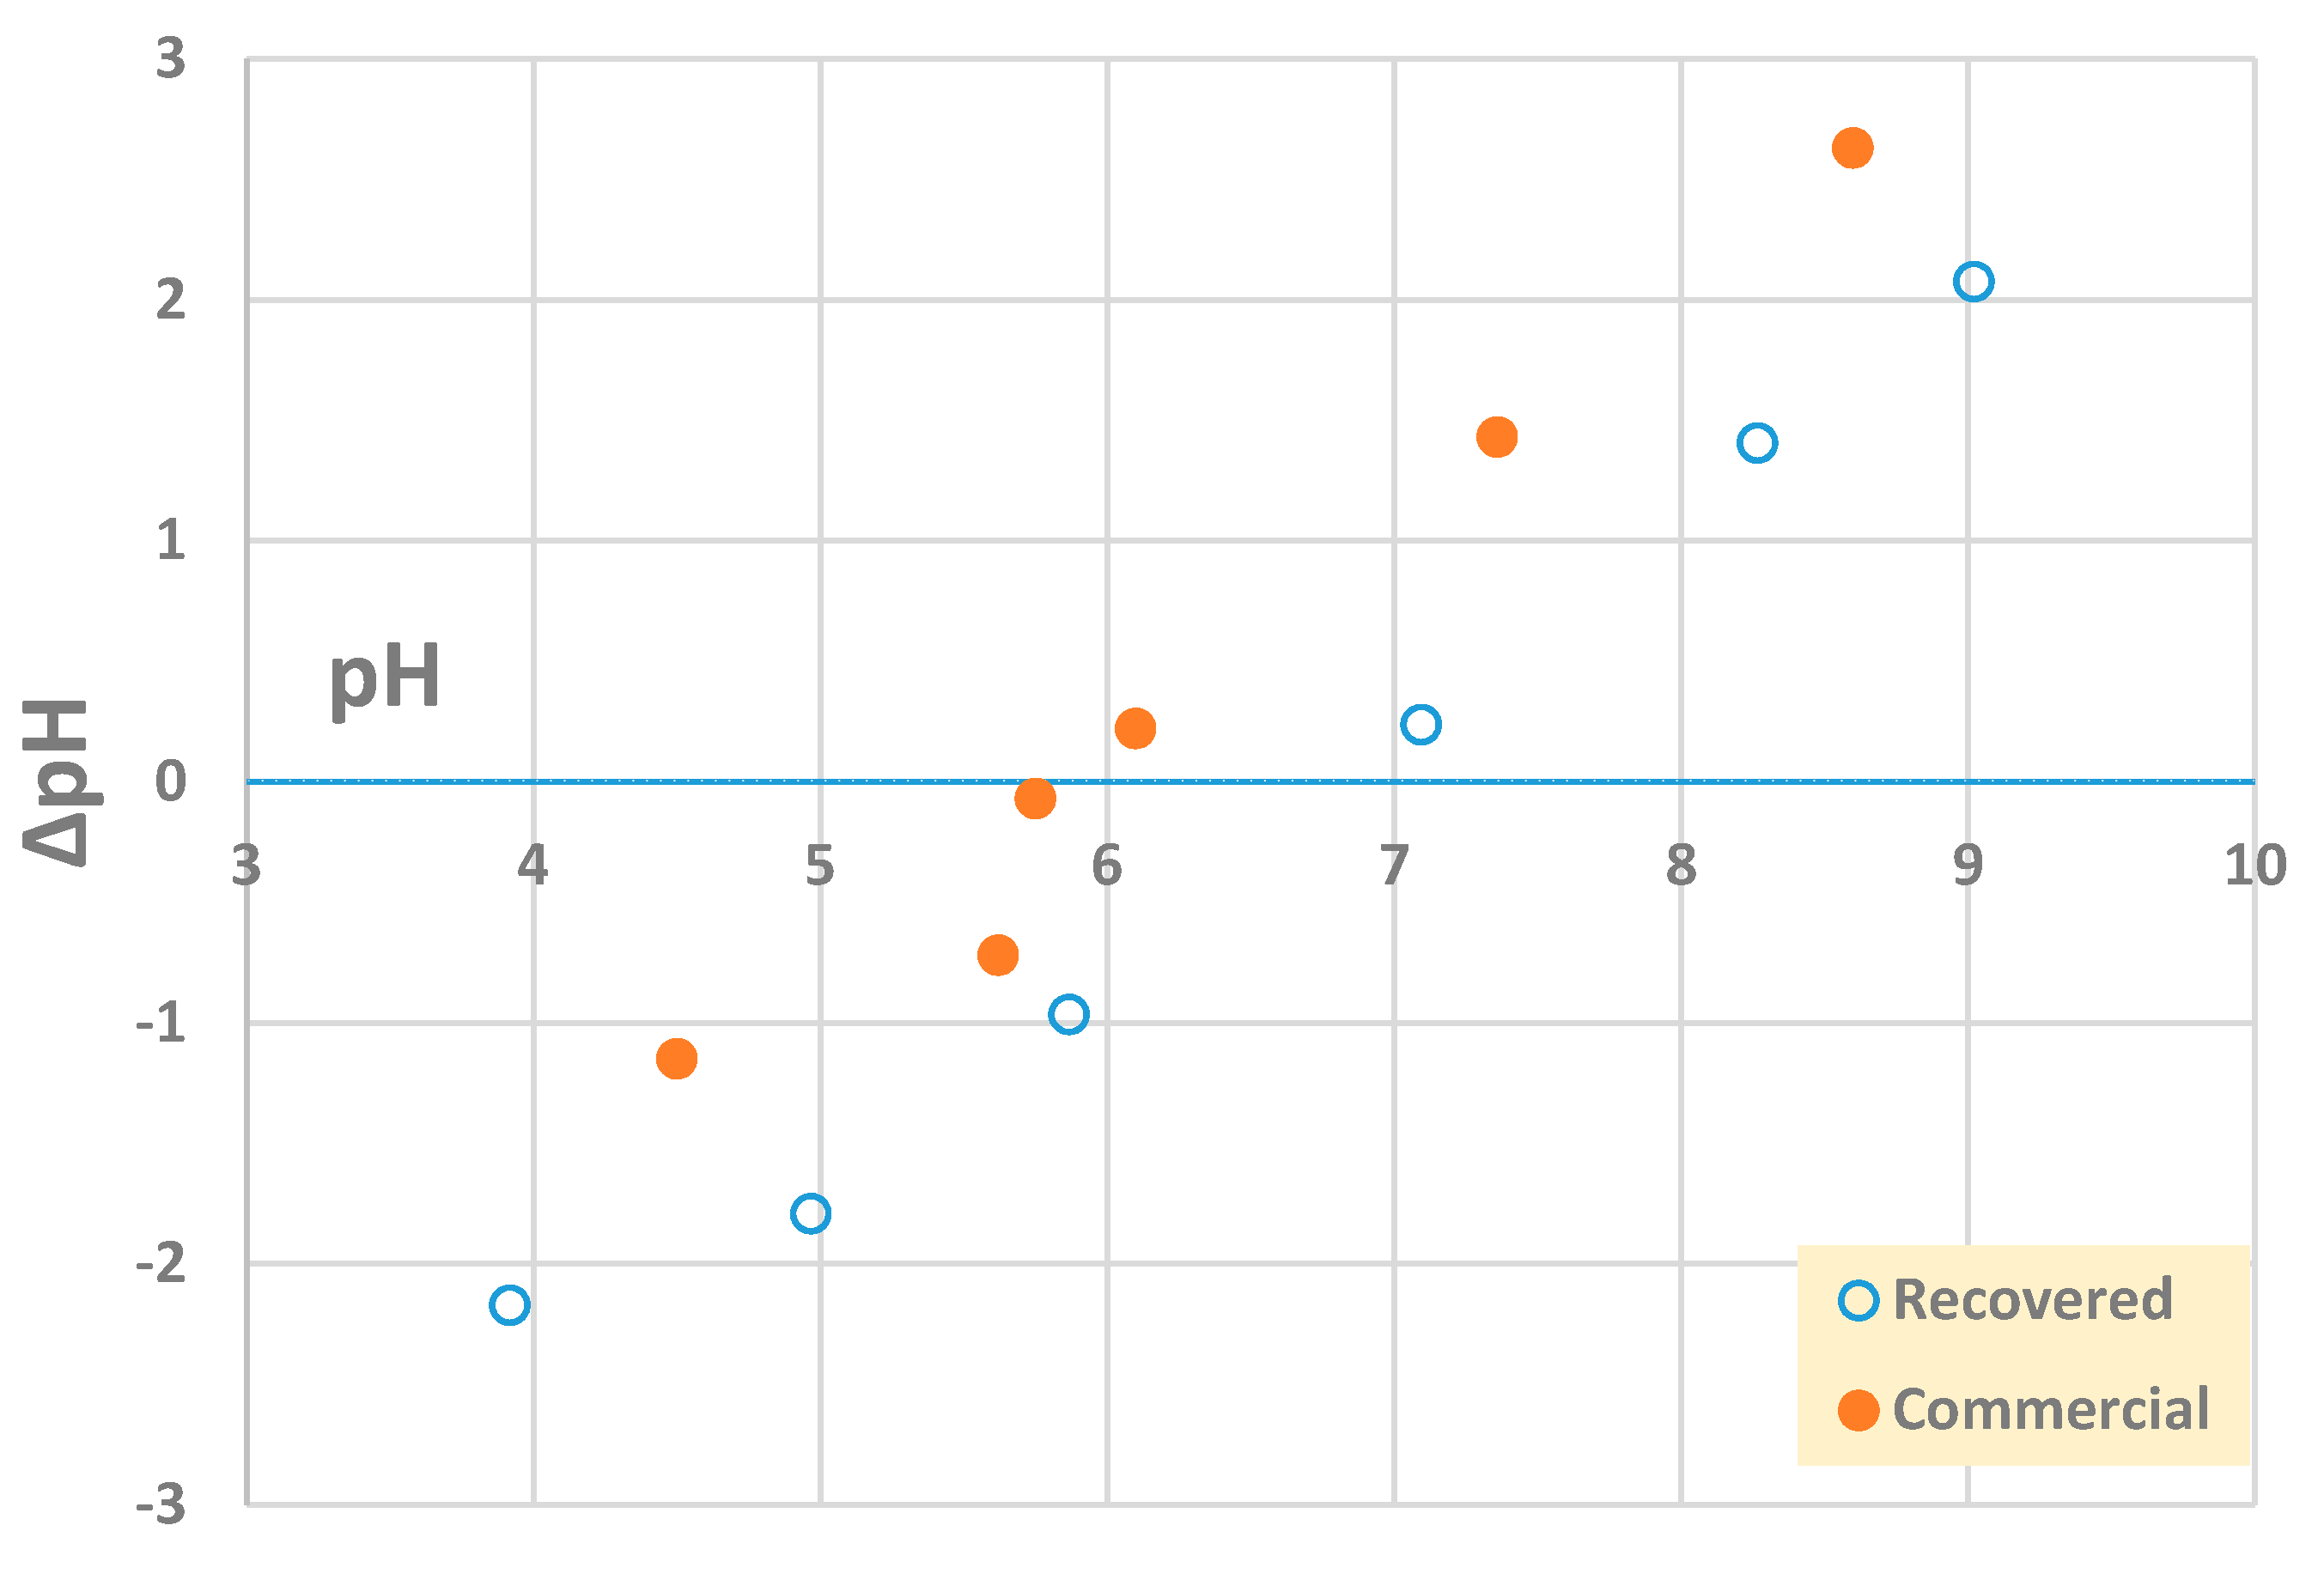
3.4. BaSO4 Stability

Toxicity Characteristic Leaching Procedure (TCLP) analysis was performed with the aim of understanding the stability of barite and the distribution of its constitutive the elements (on the surface vs. inside the structure) removed from the FGD solution. Table 5 presents the leaching results after 24 h of contact time. The ICP analysis of the leaching solution revealed interesting aspects regarding the distribution of the elements.
Barium leaching was extremely low (0.21%), confirming the low solubility of barite even in the standard TCLP conditions. Interestingly, around 33% (~79 µg·L−1) Se were released in the leaching solution, the rest being associated with the barite structure. Figure 6 presents the flow diagram of barite recovery and the removal of contaminants from FGD effluents as per the current study.

4. Discussion

4.1. Desulfurization of the FGD Effluent

Virtual complete (~99%) desulfurization of the FGD wastewater led to an important concentration decrease of certain anions: NO3, −40% (50 mg·L−1), F, −44% (15 mg·L−1), K+, −69% (24 mg·L−1), CO32−, −88% (183 mg·L−1), and Cl, +623% (~5 g·L−1). After FGD desulfurization, 50 mg·L−1 of sulfate (i.e., 0.7% of the original concentration) were left in solution (Table 1), meaning that part of the barium used could have reacted with other anions. However, anions (NO3, F, CO32−) that could thermodynamically react with Ba amounted to almost 250 mg·L−1. Based on the affinity between Ba and various anions, a competition between them could explain the much higher removal of carbonate. The solubility product constant of BaCO3, Ksp, was equal to 5.1 × 10⁻⁹, close to that of BaSO4 (1.08 × 10⁻¹⁰) [28]. The high removal of carbonate (~88%) from FGD indicated a potential competitive effect against sulfate in solutions containing higher CO32− concentrations. The side reaction between Ba and CO32− in high sulfate solutions was reported before for FGD effluents [29]. On the other hand, BaNO3 had a low Ksp (4.64 × 10⁻³) compared to BaSO4, potentially explaining the limited nitrate removal [28]. Fluoride also reacted with barium forming BaF2 (Ksp = 1.6 × 10⁻⁶) and removal of 44% (~15 mg·L−1) of F could be explained by this reaction.
The major result of this study is the removal of several chemical trace elements of environmental concern from FGD solution following desulfurization, such as Sr (91%), Al (86%), U (75%), Mo (62%), Cu (52%), and Se (39%). Strontium reacted with sulfate yielding strontium sulfate (SrSO4) or celestine, a mineral belonging to the barite group. Moreover, both Ba and Sr can be part of the same (Ba,Sr)SO4 solid phase [30,31]. From this point of view, the 91% (~1300 µg·L−1) removal of Sr with barite precipitation does not appear surprising. Another element removed in high amount was aluminum, ~86% (~294 µg·L−1). Around 174 minerals containing Ba and Al, in various proportions, are known to date [32]. The study attempted to identify the removal mechanism of Cu, Mo, Se, and U using XRD, but no mineral phase associated with these elements could be detected.
Because the limit of detection of IC is around 1 mg·L−1 and Se is present in the studied FGD at concentrations below this value, Se speciation could not be determined. However, it is widely established that SeO42− is the main (>90%) chemical species present in FGD streams [14]. The removal of Se through effluent desulfurization could be due to the formation of BaSeO4 (Ksp = 3.40 × 10⁻⁸). Tokunaga and Takahashi [33] investigated the coprecipitation capacity of barite for selenium oxyanion removal using synthetic solutions. The study reported a 39% selenate removal in a system containing sulfate (1 mM), Ca (6.3 mM), and Se (0.011 mM, equivalent to ~1 mg·L−1) at pH 10. In our case, sulfate concentration was ~74 mM and Se ~0.0078 mM, while the FGD matrix was significantly more complex than the synthetic solution.

4.2. Barite Characterization

Only BaSO4 peaks were observed in the XRD patterns, which indicates that both samples have high purity. Based on the XRD results, it can be concluded that the purity of the recovered barite is very high. In addition, the mid-infrared spectroscopy (MIR) spectrum of both commercial and recovered barite revealed bands typical for the vibrations of S–O bonds present in the [SO4] tetrahedron due to the symmetric stretching ν1 (983 cm−1), asymmetric stretching ν3 (the region 1193–1077 cm−1) modes, as well as the out-of-plane bending ν4 (639, 610 cm−1) and the ν2 (453–460 cm−1) modes. Generally, bending bands are sharper than the stretching bands, as can be seen in the spectrum. The absorption peaks observed at about 3391–3401 and 1644–1646 cm−1 are due to the stretching and deformation of adsorbed water molecule. According to Manam and Das [34], the peak near 2064 cm−1 is overtone and combination bands of the lower wave number of sulfur-oxygen stretching and bending vibrations, and these peaks do not affect the identification of the components of the system. The results are in general agreement with data reported for the natural and synthetic barite [35]. The difference in the band positions between commercial and recovered barite is between 1 and 2 cm−1 and this is insignificant in the context of changes in the structure of the recovered barite comparing with reference commercial sample.
TGA analysis informs on the water content during the heating between 20 and 1000 °C. The total mass loss of recovered barite was ~3.5%. However, the FTIR result indicates that the recovered sample also contained CO2. Above 620 °C, the mass loss should be connected to carbonate decomposition and CO2 emission. The water loss occurred between 20 and 620 °C, which gave a 2.9% mass loss (i.e., 16.02 g·L−1 vs. 16.5 g·L−1 uncorrected particle concentration).
Considering the density, both barite samples displayed comparable values, ~4.5 g·cm−3, thus having relevance for its use as an additive to drilling fluids (Table 3), currently the main barite user on a global scale [36]. The commercial material had a PZC of ~6.0, while the recovered BaSO4 had a higher PZC, ~6.8 (Figure 5). Barite was reported to have a PZC of 6.7, thus being closer to the value reported for the recovered material [37]. The difference in PZC could be explained by anionic species and TOC adsorption onto surface functional groups on recovered barite. The 25% decrease in TOC (~13 mg·L−1) following FGD desulfurization (Table 1) would in part be responsible for the observed PZC value, larger than that of pure commercial barite.
With regard to the distribution of the removed elements, the results show the high predisposition of certain elements (As, Se, Sr) to be trapped within the barite structure during the reaction of barium with high-sulfate FGD effluents (Table 5). Tokunaga and Takahashi [33] showed that once Se is incorporated into the barite structure, the strong crystal stability of Ba-SeO4-SO4 prohibits the leaching out of the element. Therefore, the removal of selenium from FGD and its incorporation into a valuable mineral constitutes a two-fold benefit. While EU legislation does not impose a selenium discharge limit for industrial effluents, in the United States, strict effluent guidelines for steam-generated power industry Se discharge are imposed: 12 µg·L−1 (monthly average) and a daily maximum limitation of 23 µg·L−1 [38]. In this study, barite formation was accompanied by a 39% Se removal (down to 374 µg·L−1), which is much above Se guidelines in the US. However, in view of the main objective of the current study (i.e., resource recovery), the Se removal should be regarded as an added value and, potentially, as a pre-treatment step in a multistage treatment platform. On the other hand, some elements released in higher amounts by leaching (e.g., Na, Mg) do not display a toxicological profile in aquatic ecosystems. In order to perform the mass balance analysis of the chemical elements following all stages (raw FGD-desulfurized FGD-barite-solubilized barite), the study attempted to digest barite samples (recovered and commercial) using microwave-assisted HNO3 digestion. Unfortunately, the digestion of barite samples was incomplete, and the initial concentration of these elements within the recovered barite could not be established by ICP analysis. Indeed, barite is known to be highly insoluble and a refractory material to digestion [39]. The fact that barite displays such a high chemical stability (i.e., limited solubility) could potentially be used to entrap contaminants in its structure [40,41].

4.3. Reuse of BaSO4 and Preliminary Cost-Benefit Analysis of the Process

Because of its high density, the recovered barite can be used in oil and gas industry. Finely grounded barite is added to the drilling fluid (up to 40% of fluid by weight) with the aim of increasing the density of the fluid column. Barite is used in drilling fluids for a number of reasons such as having high density, being water insoluble, non-toxic, non-corrosive, and non-abrasive [28]. The American Petroleum Institute (API) specifications for barite are a density superior to 4.2 g·cm−3 and a 90% size distribution inferior to 45 µm [42]. The 100–400 nm recovered barite will thus not need to be ground (additional cost advantage) and will also better mix with the drilling fluid. In aggregate, both the size and the density determined for recovered barite comply with the standards required by API for drilling fluids.
In the light of the growing demand for materials and the depletion of natural resources, the implementation of circular economy is gaining ground worldwide. This approach attempts to recover and reuse part of the materials and energy used in the production cycles. To this end, waste products are no longer regarded as undesirable, unusable wastes, but rather as secondary resources. Because of its high density (4.48 g·cm−3) and low water solubility, barite has numerous industrial applications including (i) density agent used for oil and gas industry drilling fluids, (ii) radiocontrast agent for X-ray imaging, (iii) component of white pigment for paints, (iv) paper brightener, (v) plastic high-density filler, and (vi) concrete radiation-blocking additive, etc. [28,31]. Although barite contains barium, a toxic metal, the extremely low solubility makes it significantly less problematic for the environment and human health than other Ba salts [28]. Using the studied FGD effluent, ~16.5 kg barite can be recovered per m3, thus confirming the theoretical calculations.
Barium chloride (1 kg, 99% assay) costs around US $38 [43], while barium sulfate (1 kg, 99% assay) costs around $236 [44], about six times more. This makes the use of BaCl2 for sulfate removal economically feasible. An extra benefit is the high purity, submicron-size, and ease of BaSO4 production from FGD aqueous solutions compared to conventional mining that involves ore processing, mineral grinding, and beneficiation (e.g., froth flotation, gravity separation). Furthermore, industry-grade barium chloride costs $1–10 kg−1 [45], when purchased in larger quantities, as it is the case for industrial level applications. Knowing the high affinity of barium for sulfate, industry-grade barium chloride might show comparable barite purity as the one produced in the current study.
Some potential examples of recovering BaSO4 at industrial scale might be relevant. For instance, Jaworzno III coal-fired power plant (S Poland, near Katowice) has an installed electrical generating capacity of 1345 MW and operates a wet lime FGD system [46]. The FGD unit generates ~32 m3 h−1 FGD effluent containing an average of 2000 mg·L−1 SO42− [46], thus yielding (if stoichiometric efficiency is achieved) ~64 kg of barite h−1 (~1.5 t day−1). 1 m3 of FGD could generate a maximum of 2 kg barium sulfate (from a 2 g·L−1 sulfate in the raw FGD, equivalent of 20.8 mM sulfate), needing an equimolar Ba input (~6.85 g·L−1 BaCl2∙2H2O). From a simplified financial perspective (barium chloride input vs. barium sulfate output), for every m3 of FGD, the power plant would need to invest $206 (input: 6.85 kg BaCl2.2H2O × $38) to generate $472 (output: 2 kg BaSO4 × $236), deriving a profit of $212. Another important aspect is the efficiency of barite recovery, which in practice is never 100%. For example, an 80% barite recovery would lower the profit to ~ $172 m−3 FGD.

5. Conclusions

This paper investigated the recovery of sulfate as barite (BaSO4), a critical raw material with numerous industrial applications, from real FGD industrial effluents. Despite the chemically complex, polymetallic system characteristic of this type of effluent, barium displayed high affinity for sulfate, yielding up to 16.5 kg high-purity (>99%) barite m−3 of FGD. When compared with a commercial material, the recovered barite showed very similar properties in terms of mineralogy, chemical composition, and density. After barite precipitation and recovery, the chemical analysis of the effluent indicated the removal of other constituents in various concentrations, with high values recorded for Sr (91%), Al (86%), and Se (40%). Leaching experiments of the recovered barite indicate the entrapment and stabilization of ~70% Se and ~90% Al in the barite structure, thus opening the possibility to use this process as a complementary treatment option. Based on a preliminary cost–benefit analysis, a profit of up to $200 could be derived for every m3 of FGD used for barite production. In light of the resource recovery strategy, FGD effluents may be considered an important secondary resource. Barite recovery seems to be economically feasible, however further investigation at pilot scale is needed to evaluate the potential to upscale the process.

Supplementary Materials

The following are available online at https://www.mdpi.com/2075-163X/10/2/188/s1, Figure S1: Barite recovered from FGD effluent, Table S1: Limit of Detection (LOD) and Limit of Quantification (LOQ) of the measured elements by ICP-MS, Table S2: Elements present in low and ultralow concentrations in the FGD effluent (determined by ICP-MS), Table S3: FTIR assignments of recovered and commercial BaSO4.

Author Contributions

L.C.S.: conceptual idea, experimental work, manuscript preparation. L.D.: experimental work, manuscript preparation. T.B.: analysis and manuscript preparation. L.C.: analysis and manuscript preparation. All authors have read and agreed to the published version of the manuscript.

Funding

This research was funded by National Science Centre, Poland, grant number 2017/26/D/NZ1/00408 and partially by a fellowship awarded to Lucian Staicu by the French Government (BGF) through Campus France. Laurent Charlet acknowledges partial support from EIT RawMaterials, via the SaferNano Design&Law project.

Acknowledgments

The authors acknowledge S. Bureau, D. Tisserand, N. Findling, and A. Fernandez Martinez, as well as the analytical geochemistry platform at ISTerre, Grenoble, and G. Kozub-Budzyn from the Laboratory of Critical Elements AGH-KGHM, Krakow.

Conflicts of Interest

The authors declare no conflict of interest.

References

  1. British Petroleum (BP) (2018) Statistical Review of World Energy. Available online: https://www.bp.com/content/dam/bp/business-sites/en/global/corporate/pdfs/energy-economics/statistical-review/bp-stats-review-2018-full-report.pdf (accessed on 15 September 2019).
  2. Eurocoal Statistics. Available online: https://euracoal.eu/info/euracoal-eu-statistics/ (accessed on 17 February 2020).
  3. Energy Topics. Available online: https://ec.europa.eu/energy/en/topics/oil-gas-and-coal/coal-and-other-solid-fuels (accessed on 10 October 2019).
  4. International Energy Agency. Available online: https://www.iea.org/countries/poland (accessed on 17 February 2020).
  5. Clean Energy Wire: Coal in Germany. Available online: https://www.cleanenergywire.org/factsheets/coal-germany (accessed on 10 October 2019).
  6. Cordoba, P. Partitioning and speciation of selenium in wet limestone flue gas desulphurisation (FGD) systems: A review. Fuel 2017, 202, 184–195. [Google Scholar] [CrossRef] [Green Version]
  7. Gingerich, D.B.; Grol, E.; Mauter, M.S. Fundamental challenges and engineering opportunities in flue gas desulfurization wastewater treatment at coal fired power plants. Environ. Sci. Water Res. Technol. 2018, 4, 909–925. [Google Scholar] [CrossRef]
  8. Heidel, B.; Rogge, T.; Scheffknecht, G. Controlled desorption of mercury in wet FGD waste water treatment. Appl. Energy 2016, 162, 1211–1217. [Google Scholar] [CrossRef]
  9. Staicu, L.C.; Morin-Crini, N.; Crini, G. Desulfurization: Critical step towards enhanced selenium removal from industrial effluents. Chemosphere 2017, 117, 111–119. [Google Scholar] [CrossRef] [PubMed]
  10. Vinceti, M.; Wei, E.T.; Malagoli, C.; Bergomi, M.; Vivoli, G. Adverse health effects of selenium in humans. Rev. Environ. Health 2001, 16, 233–251. [Google Scholar] [CrossRef] [PubMed]
  11. Chapman, P.M.; Adams, W.J.; Brooks, M.; Delos, C.G.; Luoma, S.N.; Maher, W.A.; Ohlendorf, H.M.; Presser, T.S.; Shaw, P. Ecological Assessment of Selenium in the Aquatic Environments; CRC Press: Boca Raton, FL, USA, 2010. [Google Scholar]
  12. Lemly, A.D. Symptoms and implications of selenium toxicity in fish: The Belews Lake case example. Aquat. Toxicol. 2002, 57, 39–49. [Google Scholar] [CrossRef]
  13. Presser, T.S. The Kesterson effect. Environ. Manag. 1994, 18, 437–454. [Google Scholar] [CrossRef]
  14. Barwick, M.; Maher, W. Biotransference and biomagnification of selenium copper, cadmium, zinc, arsenic and lead in a temperate seagrass ecosystem from Lake Macquarie Estuary, NSW, Australia. Mar. Environ. Res. 2003, 56, 471–502. [Google Scholar] [CrossRef]
  15. Akiho, H.; Ito, S.; Matsuda, H. Effect of oxidizing agents on selenate formation in a wet FGD. Fuel 2010, 89, 2490–2495. [Google Scholar] [CrossRef]
  16. Fernandez-Martinez, A.; Charlet, L. Selenium environmental cycling and bioavailability: A structural chemist point of view. Rev. Environ. Sci. Biotechnol. 2009, 8, 81–110. [Google Scholar] [CrossRef]
  17. Santos, S.; Ungureanu, G.; Boaventura, R.; Botelho, C. Selenium contaminated waters: An overview of analytical methods, treatment options and recent advances in sorption methods. Sci. Total Environ. 2015, 521C–522C, 246–260. [Google Scholar] [CrossRef] [PubMed]
  18. Staicu, L.C.; van Hullebusch, E.D.; Lens, P.N.L. Industrial Selenium Pollution. Wastewater and Physical-Chemical Treatment Technologies. In Bioremediation of Selenium Contaminated Wastewaters; van Hullebusch, E.D., Ed.; Springer: Berlin/Heidelberg, Germany, 2017; pp. 103–130. [Google Scholar]
  19. Cordoba, P.; Staicu, L.C. Flue Gas Desulfurization effluents: An unexploited selenium resource. Fuel 2018, 223, 268–276. [Google Scholar] [CrossRef]
  20. Kisser, J.; Wirth, M.; De Gusseme, B.; Van Eekert, M.; Zeeman, G.; Schoenborn, A.; Vinnerås, B.; Finger, D.C.; Kolbl Repinc, S.; Bulc, T.G.; et al. A review of nature-based solutions for resource recovery in cities. Blue Green Syst. 2020. [CrossRef] [Green Version]
  21. Critical Raw Materials. Available online: http://ec.europa.eu/growth/sectors/raw-materials/specific-interest/critical_en (accessed on 10 October 2019).
  22. Critical Raw Materials Alliance. Available online: http://criticalrawmaterials.org/barytes/ (accessed on 10 October 2019).
  23. Mustafa, S.; Dilara, B.; Nargis, K.; Naeem, A.; Shahida, P. Surface properties of the mixed oxides of iron and silica. Colloids Surf. A Physicochem. Eng. Asp. 2002, 205, 273–282. [Google Scholar] [CrossRef]
  24. Halim, C.E.; Amal, R.; Beydoun, D.; Scott, J.A.; Low, G. Evaluating the applicability of a modified toxicity characteristic leaching procedure (TCLP) for the classification of cementitious wastes containing lead and cadmium. J. Hazard. Mater. 2003, 192, 125–140. [Google Scholar] [CrossRef]
  25. Higgins, T.E.; Sandy, A.T.; Givens, S.W. Flue Gas Desulfurization Wastewater Treatment Primer. Power 2009. Available online: https://www.powermag.com/flue-gas-desulfurization-wastewater-treatment-primer/ (accessed on 5 October 2019).
  26. Staicu, L.C.; Barton, L.L. Microbial Metabolism of Selenium—For Survival or Profit. In Bioremediation of Selenium Contaminated Wastewaters; van Hullebusch, E.D., Ed.; Springer: Berlin/Heidelberg, Germany, 2017; pp. 1–31. ISBN 978-3-319-57830-9. [Google Scholar]
  27. Ramaswamy, V.; Vimalathithan, R.M.; Ponnusamy, V. Synthesis and characterization of BaSO4 nano particles using micro emulsion technique. Adv. Appl. Sci. Res. 2010, 1, 197–204. [Google Scholar]
  28. CRC. Handbook of Chemistry and Physics, 99th ed.; Rumble, J.R., Ed.; CRC Press: Boca Raton, FL, USA, 2018. [Google Scholar]
  29. Nishimura, T.; Hashimoto, H.; Nakayama, M. Removal of selenium (VI) from aqueous solution with polyamine-type weakly basic ion exchange resin. Sep. Sci. Technol. 2007, 42, 3155–3167. [Google Scholar] [CrossRef]
  30. Becker, U.; Fernandez-Gonzalez, A.; Prieto, M.; Harrison, R.; Putnis, A. Direct calculation of thermodynamic properties of the barite-celestite solid solution from molecular principles. Phys. Chem. Miner. 2000, 27, 291–300. [Google Scholar] [CrossRef]
  31. Hanor, J.S. Barite-celestine geochemistry and environments of formation. Rev. Mineral. Geochem. 2000, 40, 193–275. [Google Scholar] [CrossRef]
  32. Mindat. Available online: https://www.mindat.org/element/Barium (accessed on 1 September 2019).
  33. Tokunaga, K.; Takahashi, Y. Effective removal of selenite and selenate ions from aqueous solution by barite. Environ. Sci. Technol. 2017, 51, 9194–9201. [Google Scholar] [CrossRef]
  34. Manam, J.; Das, S. Thermally stimulated luminescence studies of undoped, Cu and Mn doped BaSO4 compounds. Indian J. Pure Appl. Phys. 2009, 47, 435–438. [Google Scholar]
  35. Prameena, B.; Anbalagan, G.; Sangeeth, V.; Gunasekaran, S.; Ramkumaar, G.R. Behaviour of Indian natural barite mineral. Int. J. ChemTech Res. 2013, 5, 220–231. [Google Scholar]
  36. British Geological Survey (BGS). Mineral Profiles: Barites. 2005. Available online: https://www.bgs.ac.uk/downloads/start.cfm?id=1406 (accessed on 5 October 2019).
  37. Han, K.N. Fundamentals of Aqueous Metallurgy. Society for Mining. In Metallurgy and Exploration; Society for Mining, Metallurgy, and Exploration: Englewood, CO, USA, 2002; p. 197. [Google Scholar]
  38. United States Environmental Protection Agency (USEPA). Effluent Limitations Guidelines and Standards for the Steam Electric Power Generating Point Source Category. Available online: https://www.epa.gov/eg/steam-electric-power-generating-effluent-guidelines-2015-final-rule (accessed on 3 November 2015).
  39. Ostergaard, L.F. Procedures for the Determination of Stable Elements in Construction Materials from the Nuclear Reactors at Risø National Laboratory. Riso-R-1548. Available online: https://core.ac.uk/download/pdf/13787186.pdf (accessed on 5 October 2019).
  40. Stack, A.G.; Raiteri, P.; Gale, J.D. Accurate rates of the complex mechanisms for growth and dissolution of minerals using a combination of rare-event theories. J. Am. Chem. Soc. 2011, 134, 11–14. [Google Scholar] [CrossRef] [PubMed]
  41. Prieto, M.; Astilleros, J.M.; Fernández-Díaz, L. Environmental remediation by crystallization of solid solutions. Elements 2013, 9, 195–201. [Google Scholar] [CrossRef]
  42. American Petroleum Institute (API). Specification 13A, 18th Edition. Specification for Drilling Fluids—Specifications and Testing. Available online: https://www.api.org/certification-programs/api-monogram-program-and-apiqr/~/media/Files/Certification/Monogram-APIQR/program-updates/13A-18th-Edition-Purch-Guidlines-R1-2011-12-06.pdf (accessed on 20 August 2019).
  43. Sigma Aldrich. Available online: https://www.sigmaaldrich.com/catalog/product/mm/101717?lang=pl&region=PL (accessed on 10 October 2019).
  44. Sigma Aldrich. Available online: https://www.sigmaaldrich.com/catalog/product/sigald/243353?lang=pl&region=PL (accessed on 10 October 2019).
  45. Distripark. Available online: https://distripark.com/chlorek-baru-dwuwodny (accessed on 10 October 2019).
  46. Rafako. Available online: https://www.rafako.com.pl/products/640/648/products/640/648/656/674 (accessed on 20 September 2019).
Figure 1. XRD of recovered and commercial BaSO4.
Minerals 10 00188 g001
Figure 2. FTIR of recovered and commercial BaSO4.
Minerals 10 00188 g002
Figure 3. TGA analysis of recovered and commercial BaSO4.
Minerals 10 00188 g003
Figure 4. Scanning electron micrograph analysis of (A) recovered and (B) commercial BaSO4.
Minerals 10 00188 g004
Figure 5. Point of zero charge (PZC) of recovered and commercial barite.
Minerals 10 00188 g005
Figure 6. Flow diagram of BaSO4 recovery and contaminant removal from FGD effluent.
Minerals 10 00188 g006
Table 1. Characteristics of Flue Gas Desulfurization (FGD) effluent, and ion composition before and after desulfurization.
Parameter Raw FGDDesulfurized FGDChange (%)
pH 7.37 (±0.5)6.88 (±0.5)−7
Conductivity (mS·cm−1)9.89 (±0.2)14.86 (±0.3)+50
TOC (mg·L−1)51.7 (±2.9)38.8 (±2.2)−25
Major anions (mg·L−1)
Br−116.6 (±0.6)15.4 (±0.6)−7
Cl−1823 (±1.9)5950 (±14.2)+623
F−134.6 (±1.1)19.5 (±0.6)−44
CO32−209.0 (±2.5)26.0 (±0.3)−88
NO3−1130.0 (±30)77.5 (±18.6)−40
SO42− 7090.0 (±920)52.6 (±6.8)−99
Major cations (mg·L−1)
Ca503.1 (±5.0)454 (±3.2)−10
K34.0 (±0.1)10.6 (±0.1)−69
Mg1828.1 (±33.4)1778.7 (±8.5)−3
Na258.7 (±12.3)240.7 (±10.4)−7
Mn107.9 (±1.28)105.3 (±0.32)−2
Notes: NO2 < 0.2 mg·L−1, PO43− < 2.5 mg·L−1.
Table 2. Metal and metalloid content of the FGD effluent before and after desulfurization.
Element
(µg·L−1)
Raw FGDDesulfurized FGDChange (%)
Al341.0 (±4.1)46.7 (±1.4)−86.3
B2009.0 (±1.0)2004.0 (±1.0)−0.3
Ba64.0 (±5.2)3326.0 (±53)+5097
Cd103.4 (±1.0)111.5 (±2.2)+7.8
Co221.2 (±3.6)224.3 (±1.3)+1.4
Cu41.7 (±0.14)20.0 (±0.32)−51.9
Fe720.6 (±43.2)923.0 (±24.9)+28.0
Li246.5 (±4.8)231.2 (±3.5)−6.2
Mo23.5 (±0.08)8.9 (±0.16)−62.2
Ni448.0 (±2.1)445.4 (±1.5)−0.6
Se615.0 (±3.8)374.0 (±6.3)−39.2
Si378.0 (±3.0)486.0 (±6.0)+28.5
Sr1446.0 (±3)131.0 (±5)−90.9
U31.2 (±0.75)7.8 (±0.09)−74.9
Zn478.0 (±3.0)503.0 (±2.0)+5.23
Table 3. Characteristics of recovered and commercial barite.
CharacteristicRecoveredCommercial
Size (nm)100–400>400
ColorOff-whiteWhite
Density (g·cm−3) 4.5 (±0.1)4.5 (±0.1)
PZC6.8 (±0.1)6.0 (±0.1)
MineralogyCrystallineCrystalline
Assay (%)>99>99
Table 4. Elemental analysis of recovered and commercial BaSO4 (Electron Probe Microanalysis (EPMA) analysis).
Recovered BaSO4Commercial BaSO4
Element Weight (%)Weight (%)
BaO64.58 (±0.43)64.99 (±0.37)
SO333.64 (±0.53)33.82 (±0.28)
SiO20.01 (±0.01)0.03 (±0.03)
Al2O3<0.010.01 (±0.01)
CaO0.78 (±0.07)0.17 (±0.02)
MgO0.14 (±0.14)<0.01
FeO0.01 (±0.01)0.01 (±0.01)
MnO0.01 (±0.01)0.01 (±0.01)
SrO0.02 (±0.01)0.26 (±0.04)
Na2O0.20 (±0.02)0.33 (±0.03)
Cl0.41 (±0.13)0.14 (±0.02)
Total99.7899.78
Table 5. Elements released by TCLP of recovered and commercial barite. Experimental conditions: 0.5 g commercial and recovered barite, 0.1 M acetic acid, V = 10 mL, pH0 = 2.82, 30 rpm, 24 h, room temperature (r.t.).
RecoveredCommercial
ElementAssociated * with Barite (µg·L−1)Leached (µg·L−1)% ReleasedAssociated with Barite (µg·L−1)Leached (µg·L−1)% Released
Al284.329.3 (±1.43)10.3n/d146.7 (±10.3)-
Ba294,200617.3 (±30.1)0.21n/d204.2 (±7.3)-
Mg49,40052,448 (±788) n/d10.7 (±2)-
Mo14.6315.8 (±0.11) n/d10.4 (±0.5)-
Na18,00015,703 (±220)87.2n/d4076 (±161)-
Ni2.824.3 (±1) n/dn/d-
Se24179.4 (±3.25)32.9n/dn/d-
Sr131524.3 (±0.27)1.85n/d1150 (±34.9)-
n/d, could not been determined. Standard deviation is provided in brackets. *, calculated based on the difference between raw and desulfurized FGD.

