Article

TLS and SfM Approach for Bulk Density Determination of Excavated Heterogeneous Raw Materials

Faculty of mining, ecology, process control and geotechnologies, Technical University of Košice, 04001 Košice, Slovakia
*
Author to whom correspondence should be addressed.
Minerals 2020, 10(2), 174; https://doi.org/10.3390/min10020174
Submission received: 20 January 2020 / Revised: 7 February 2020 / Accepted: 11 February 2020 / Published: 14 February 2020
(This article belongs to the Section Mineral Processing and Extractive Metallurgy)

Abstract

:
A frequently recurring problem in the extraction of mineral resources (especially heterogeneous mineral resources) is the rapid operative determination of the extracted quantity of raw material in a surface quarry. This paper deals with testing and analyzing the possibility of using unconventional methods such as digital close-range photogrammetry and terrestrial laser scanning in the process of determining the bulk density of raw material under in situ conditions. A model example of a heterogeneous deposit is the perlite deposit Lehôtka pod Brehmi (Slovakia). Classical laboratory methods for determining bulk density were used to verify the results of the in situ method of bulk density determination. Two large-scale samples (probes) with an approximate volume of 7 m3 and 9 m3 were realized in situ. 6 point samples (LITH) were taken for laboratory determination. By terrestrial laser scanning (TLS) measurement from 2 scanning stations, point clouds with approximately 163,000/143,000 points were obtained for each probe. For Structure-from-Motion (SfM) photogrammetry, 49/55 images were acquired for both probes, with final point clouds containing approximately 155,000/141,000 points. Subsequently, the bulk densities of the bulk samples were determined by the calculation from in situ measurements by TLS and SfM photogrammetry. Comparison of results of the field in situ measurements (1841 kg∙m−3) and laboratory measurements (1756 kg∙m−3) showed only a 4.5% difference in results between the two methods for determining the density of heterogeneous raw materials, confirming the accuracy of the used in situ methods. For the determination of the loosening coefficient, the material from both large-scale samples was transferred on a horizontal surface. Their volumes were determined by TLS. The loosening coefficient for the raw material of 1.38 was calculated from the resulting values.

1. Introduction

The extraction of mineral resources often requires the regular determination of the quantity (tonnage) of the extracted material. This process entails the geodetic determination of the volume of extracted material and laboratory determination of its density. Then we can determine the quantity of extracted stocks (tonnage) from these data. However, a frequent problem in the extraction of minerals (especially heterogeneous raw materials) is the rapid-operative determination of the extracted quantity of raw material reserves, mainly because the data necessary for this calculation must be obtained in-time, i.e., within a few hours. The main problem, in this case, is mainly the lengthy laboratory determination of bulk density and the fact that we are able to analyze only piece samples. This may not be representative especially in the case of a significantly heterogeneous raw material or heterogeneous part of the deposit.
New application methods to estimate the bulk density of the heterogeneous geological complex are possible to realize also by new non-contact surveying technologies. They are used relatively widely and economically. Commonly, they are used to estimate the bulk density of soil by Bauer et al. [1], where the authors tried to improve the standard methodology to determine volumetric changes and estimate the density of dry soil bulk. The usability of photogrammetry for the determination of the volume of small soil aggregates (1–8 mm) was demonstrated by Moret-Fernández et al. [2]. They also proved that it is sufficiently sensitive to detect changes in bulk density under different tillage treatments. A low-altitude unmanned aerial vehicle (UAV) and Structure-from_Motion Patch-based Multi-view Stereo (SfM-PMVS) processing of obtained images to measure the bulk volume of a coal pile was used by Chunsen and Qiyuan [3]. They proved that it could provide the accuracy that meets the actual production requirements. Additionally, Różański et al. highlighted the usability and advantage of terrestrial laser scanning (TLS) and digital photogrammetry (both terrestrial and UAV) to determine the volumetric and bulk densities of material in waste dumps produced by hard coal mines [4]. They state that they are simple and low-cost with high accuracy. Kociuba et al. in their works dealt with the issue of the volume of moved material of eroded banks in Svalbard and studied the bedload transport of material in a glacial river (see discussion) [5,6].
Generally, a lot of recently published papers concerned the use of modern non-contact surveying technology of digital photogrammetry (terrestrial or UAV) in this field. For example, Liu summarized the combination of terrestrial laser scanning, digital photogrammetry, and Global Navigation Satellite System (GNSS) measurements to obtain spatial data for rock mass characterization [7]. A photogrammetric method for earth scientists to obtain accurate measurements while minimizing the extra bulk and weight of the equipment was developed by Rieke-Zapp et al. [8]. The complete characterization of rock masses using advanced remote sensing technologies like LiDAR to detect the rock mass together with discontinuities was highlighted by Riquelme et al. [9]. Fais et al. utilized the SfM photogrammetry and TLS as non-invasive techniques to characterize various rock samples [10]. A comprehensive evaluation of the quality of digital elevation models (DEM) generated using UAV SfM photogrammetry was done by Blistan et al. [11]. Moreover, there are also other papers dealing with rock mass characterization using such technologies [12,13,14], and others.
Regarding terrestrial laser scanning (TLS), its use is even more widespread for such applications. TLS is a useful technology for rock mass characterization as a laser scanner produces a massive point cloud of a scanned area, such as an exposed rock surface in an underground mine, with millimeter precision. TLS can be used as a basement for the structural mapping process, allowing greater and more representative data regarding the structural information of the rock mass [15]. Shen et al. highlight that TLS offers high accuracy and high-speed data acquisition resulting in dense point clouds, thereby allowing documentation of natural or artificial objects and the detection of changes, in repeatedly scanned data [16].
Generally, in the field of geosciences and mining industry, many studies deal with the issue of surface modeling. For example, Blistan et al. successfully used UAV photogrammetry to model rock outcrops in the surface quarry also used in this research [17]; Gallay et al. used the combination of TLS technology and digital 3D modeling for surface reconstruction to derive geomorphic properties of underground cave spaces [18]; Hofierka et al. defined a workflow to process massive data from terrestrial and airborne laser scanning to derive accurate digital models representing surface and subsurface geomorphological features [19]; airborne laser scanning was also used to map and model slope deformations in a badly accessible terrain by Fraštia et al. [20]; digital terrain models derived from LiDAR and UAV data were successfully used for safety, remediation, and ecological problems by Moudrý et al. [21].
Additionally, there are also several papers dealing with the processing of data measured and obtained by TLS and digital photogrammetry (point clouds). For example, Rusnák et al. provided a template for the application of UAV in mapping river landscape as a research tool for this type of landscape [22]; the limits and advantages of photomodeling compared to structured light 3D scanning systems were demonstrated by Catalucci et al. [23]; Fraštia et al. provided a comprehensive and accurate macro-view of the morphology of inaccessible rock towers and blocks using LiDAR, which could not be obtained from field survey [24] and other studies.
For related industries, such as civil engineering and architecture, we recognize TLS applications in documenting the actual state of buildings and their deformations [25,26,27]; in mechanical engineering to document complex machinery [28,29]; or transport engineering [30].
The presented paper compares and analyses the laboratory and non-contact surveying methods in the field conditions, where it is necessary to verify the bulk density of extracted heterogeneous raw material. The resulting differences can be reflected in the price of transport, royalties and the total profit of the company. The proposed methodology is able to quickly and correctly verified and quantify the bulk density of raw materials in quarries, and surface and underground mines. These methods can also be used to permanent monitor spatial changes and determine the progress of work.

2. Material, Methods, and Instruments

2.1. Study Area

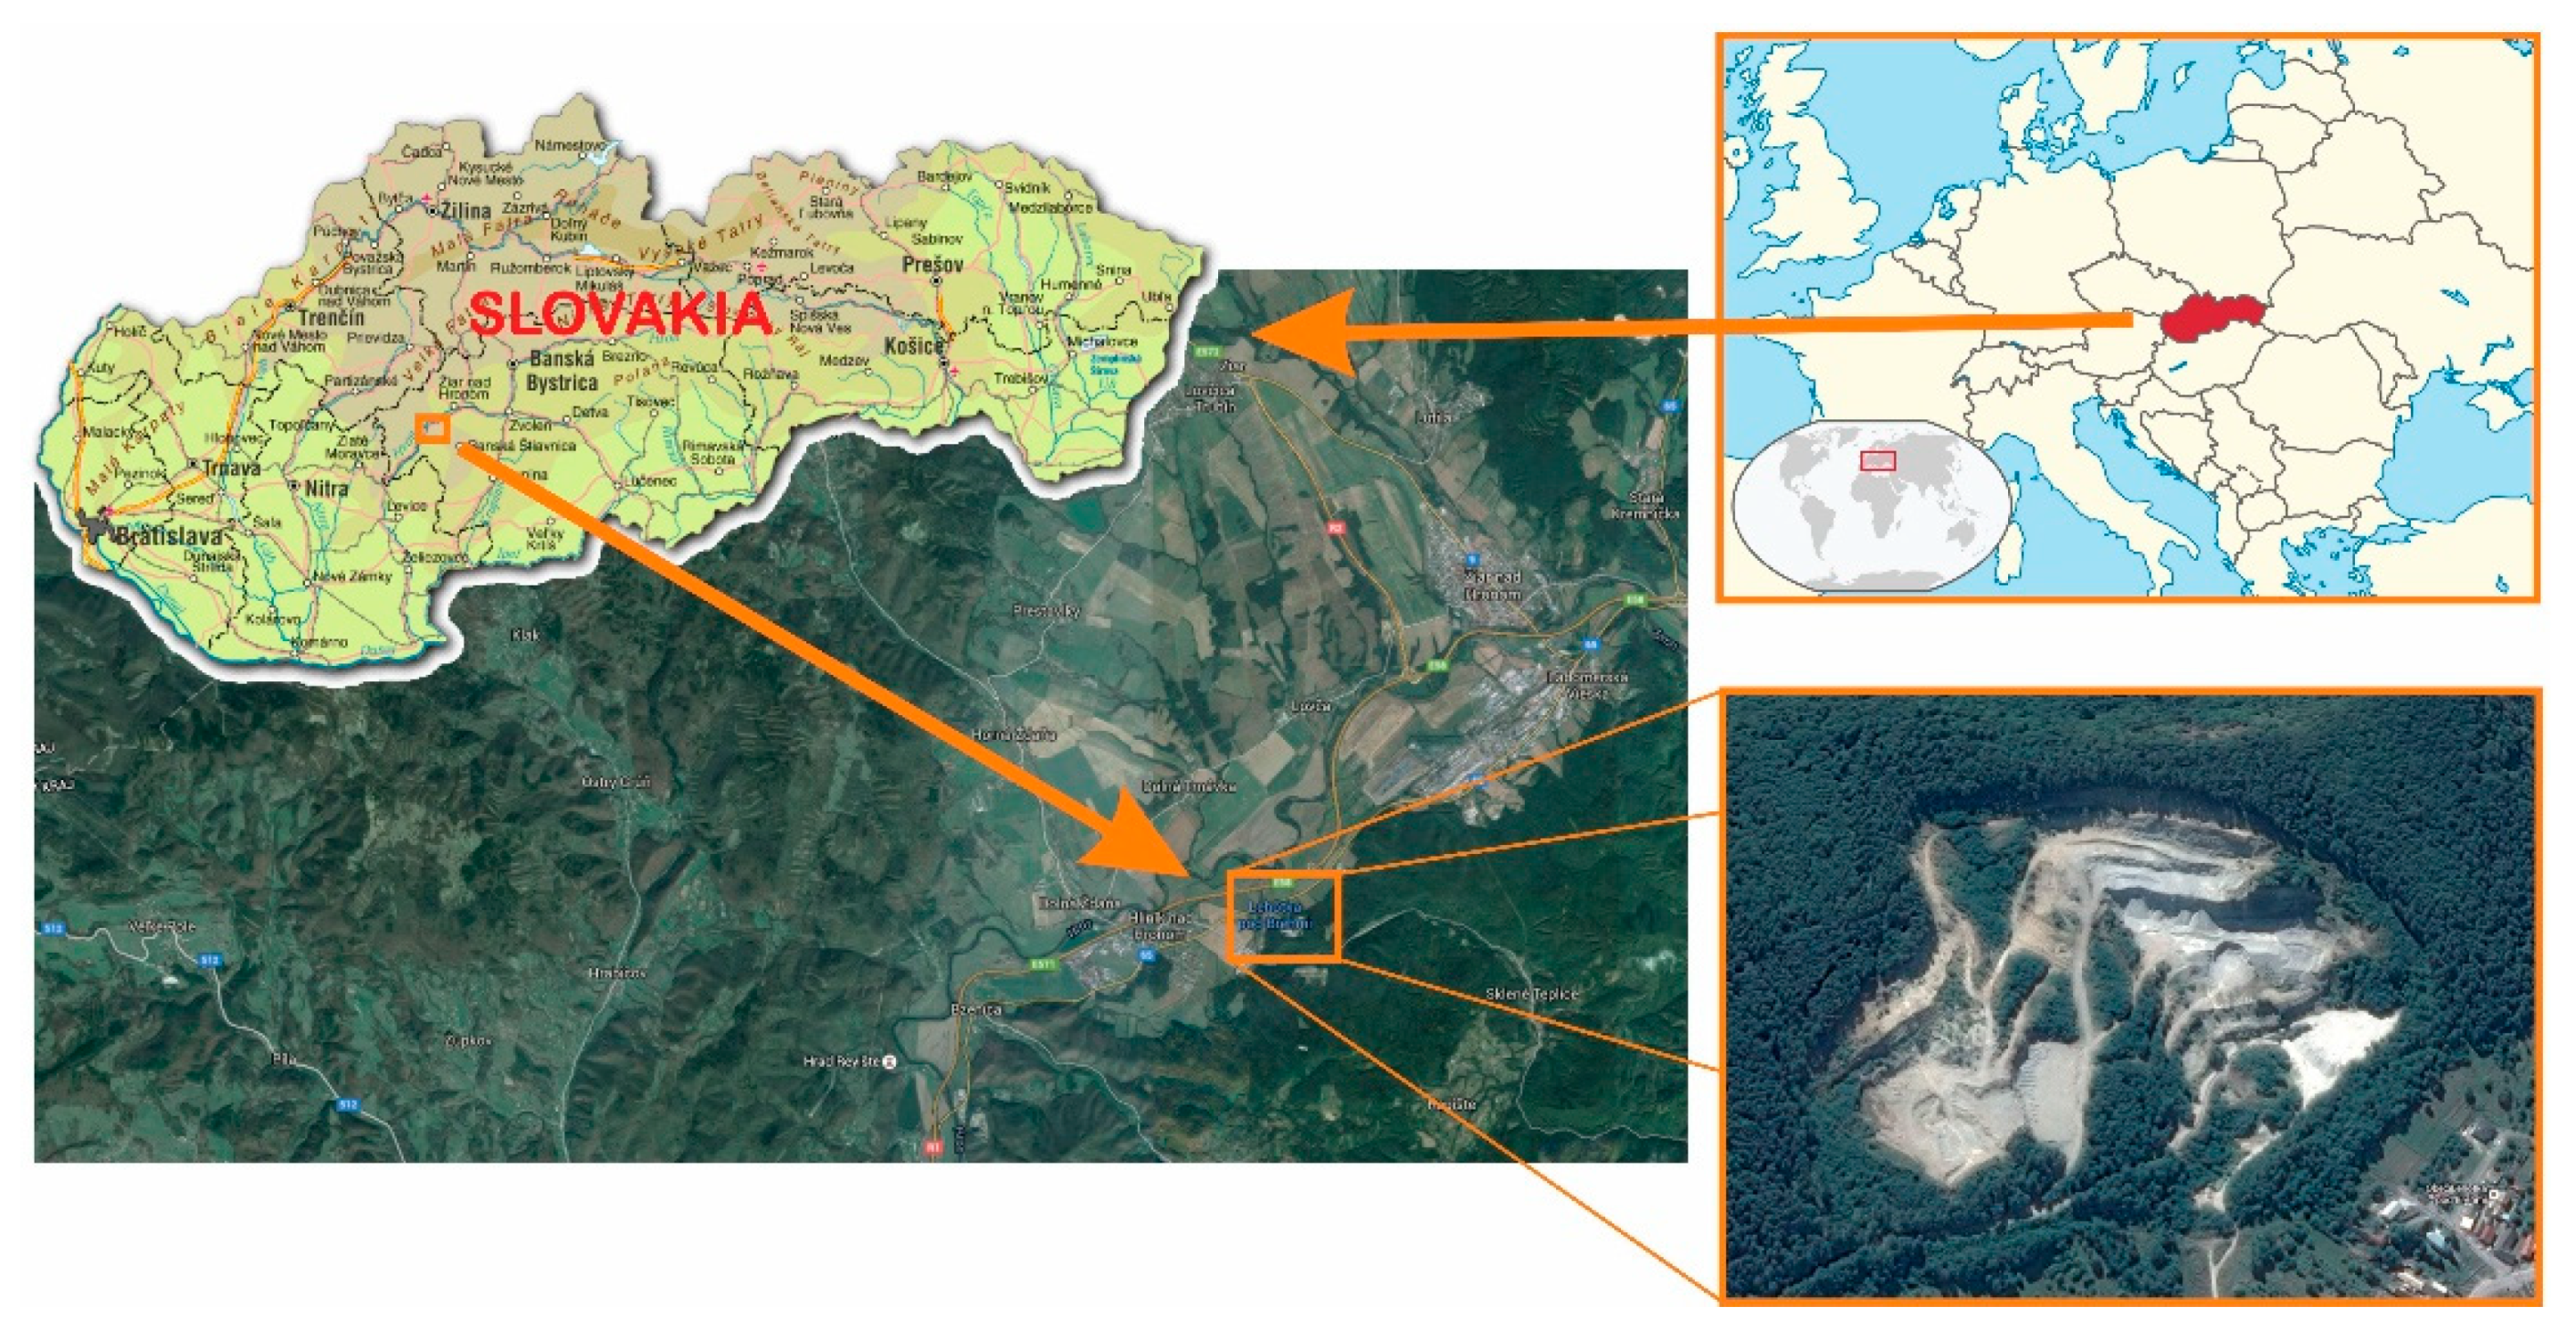
A model example of a heterogeneous deposit (heterogeneous raw material) chosen for testing the in situ method of determination of bulk density is the perlite deposit of Lehôtka pod Brehmi, Slovakia (Figure 1). The deposit consists of several lithological rock varieties from volcaniclastics, lava flows, extrusions to diluvial sediments. The deposit is mined by surface quarry mining in the mining area of 159,747 m2. Technologically, the mining area is divided into five mining levels for the needs of surface mining and the transport of raw material.
The geological structure of the perlite deposit Lehôtka pod Brehmi (Slovakia) is formed by the accumulation of perlite of the Jastrabská formation. It consists of the Late Miocene hyaloclastite breccias. It is built by a spatially incoherent set of dikes, extrusions, lava flows, and volcanoclastic material of rhododacite and rhyolite composition, which are the product of Miocene volcanism and sedimentation in the Žiarska Basin and adjacent Kremnické and Štiavnické Mts. with a total thickness of up to 300 m.
The morphology of the deposit is rugged, the relief of the geological cover is steep, sporadically slightly undulating, with gorges with a dip towards NW and NE. The productive deposit position is irregular and is situated at an altitude of 270 to 350 m above sea level in the North-South direction. It is filled with tuff breccias represented by grey and grey-green bomb tuffs in the upper part, which are usually weathered. These are considerably weathered rhyolite tuffs and tuff breccias of volcanic glass. The productive position of underlay contains gray-yellow partially distributed rhyolites and below them red to red-brown rhyolites of felsitic or felsospherolitic, porous, with pore sizes up to 5 mm and their chaotic arrangement. The age of the rhyoliths is from the Late Badenian to Sarmatian. In the geological cover of the productive position, tuffs and tuffitic clays of the Sarmatian to Pannonian age, possibly gravels, are developed. From the point of view of the technological properties of the raw material, the most important are the tuff breccias of the volcanic glass, located near the rhyolite body, where there are larger accumulations of volcanic glass [31]. Typically, the tuff breccias of volcanic glass are lens-like bodies, with a preferred orientation of the lenses in the east-west direction. The maximum deposit thickness in the quarry is 62 m. The productive position wedges north as well as south. The thickness of the productive formation is highly irregular and has only 2 m in the borehole HV-8, while in the borehole HV-11 it is up to 79 m. The maximum thickness of the productive position is unknown as the HV-11 borehole did not drill through it. The layer of tuff breccias and tuffite breccias is deposited on an eroded underlay consisting of tuff breccias with fragments of andesites. It is a transitional layer, which was created by destruction and weathering of rhyolite bodies and lava andesite streams, that does not uncover on the surface. Partly, tuffs and tuffite breccias are also used on the deposit. The thickness of tuffs is up to 30 m [31]. Due to the heterogeneity of the deposit, the bulk density of the extracted material varies from 1400 kg∙m−3 to 2300 kg∙m−3.
The stripping on the deposit is formed by eluvial-diluvial sediments and terrace sediments of the river Hron. The stripping also includes tuffites in the geological cover if they do not meet the qualitative parameters of the extracted material. The thickness of the stripping in the deposit thus varies from 0 m to 12.5 m, with an average thickness of 3.75 m.

2.2. Methods for Determination of Bulk Density

The bulk density of a substance (mineral, rock, raw material, etc.) generally reflects the ratio of the substance’s weight to its volume and should reflect a value that is as close as possible to the environmental conditions. It is defined in EN ISO 11508 [32] as follows “The bulk density is defined as the ratio of the total mass of oven-dry solid particles, e.g., minerals or organic matter, to the volume of these particles” and can be calculated by hydrostatic weighting as
ρ p = m V =   m s     m 0 ( m s     m 0 ) ( m s w m w ) ρ w =   ρ w   ( m s m 0 ) m s +   m w   m s w m 0
where:
  • m is the mass in [g]
  • V is the volume in [cm3]
  • ρw is the density of water in [g/cm3]
  • ms is the oven-dry mass of the gravel and stones with container and weighing dish in [g]
  • m0 is the mass of container and weighing dish in [g]
  • msw is the mass of large particles and dish submerged in water in [g]
  • mw is the mass of container and dish alone, submerged in water in [g].
The determination is based on the volume of the rock, including all cavities, pores, and fissures, depending on the structural and textural properties of the raw material. This implies that the bulk density will often have significantly different (always smaller) values relative to density. Its determination will be greatly affected by the correct (representative) sampling location, the shape, and size of the sample on which this parameter will be determined. The bulk density is always determined on the raw material samples in their natural state. Two different methods of measurement were used for objective determination of bulk density of the raw material—the laboratory method and field measurement by in situ method.
In addition to bulk density, the term loose bulk density is also used in practice. The loose bulk density of mineral resources is an important parameter of naturally loose, disconnected or crushed mineral resources, which enters into the calculation of stocks of raw material deposited in a stock-pile in a loosened state. It essentially determines the bulk density of the loosened raw material, that is to say, the raw material which was loosened during the extraction or treatment process and deposited in a loose state in a stock-pile. It is also calculated by Equation (1), as a proportion of the sample weight and its volume, but as the volume of the loosened raw material. The loose bulk density of raw material is always less than its bulk density.

2.3. Laboratory Determination of Bulk Density

The determination of bulk density is performed by accredited tests of a particular raw material in an accredited laboratory. When determining the density, it is necessary to ensure that representative samples delivered to the laboratory reflect as much as possible all technological types of raw material in its natural state. The total bulk density is then determined as the sum of the bulk densities of individual technological types of raw materials and the percentage of their representation (occurrence) in the deposit or in the taken sample per cubic meter.
For each technological and natural type of material, we need to have laboratory measurements from which we calculate the average bulk density and use it to calculate the reserves of the relevant parts of the deposit. When calculating stocks, the bulk density is usually expressed in tones per cubic meter (t∙m−3) or kilograms per cubic meter (kg∙m−3).
According to EN ISO 11508 [32], the standard values of bulk densities of materials and other mechanical characteristics of loose materials (and other materials) are informative average values. These values are used in the elaboration of prefeasibility design engineering solutions, where it is not necessary to consider exact values. When using them, it is necessary to take into account the physical conditions of the material (moisture, compaction, loose bulk density, etc.).
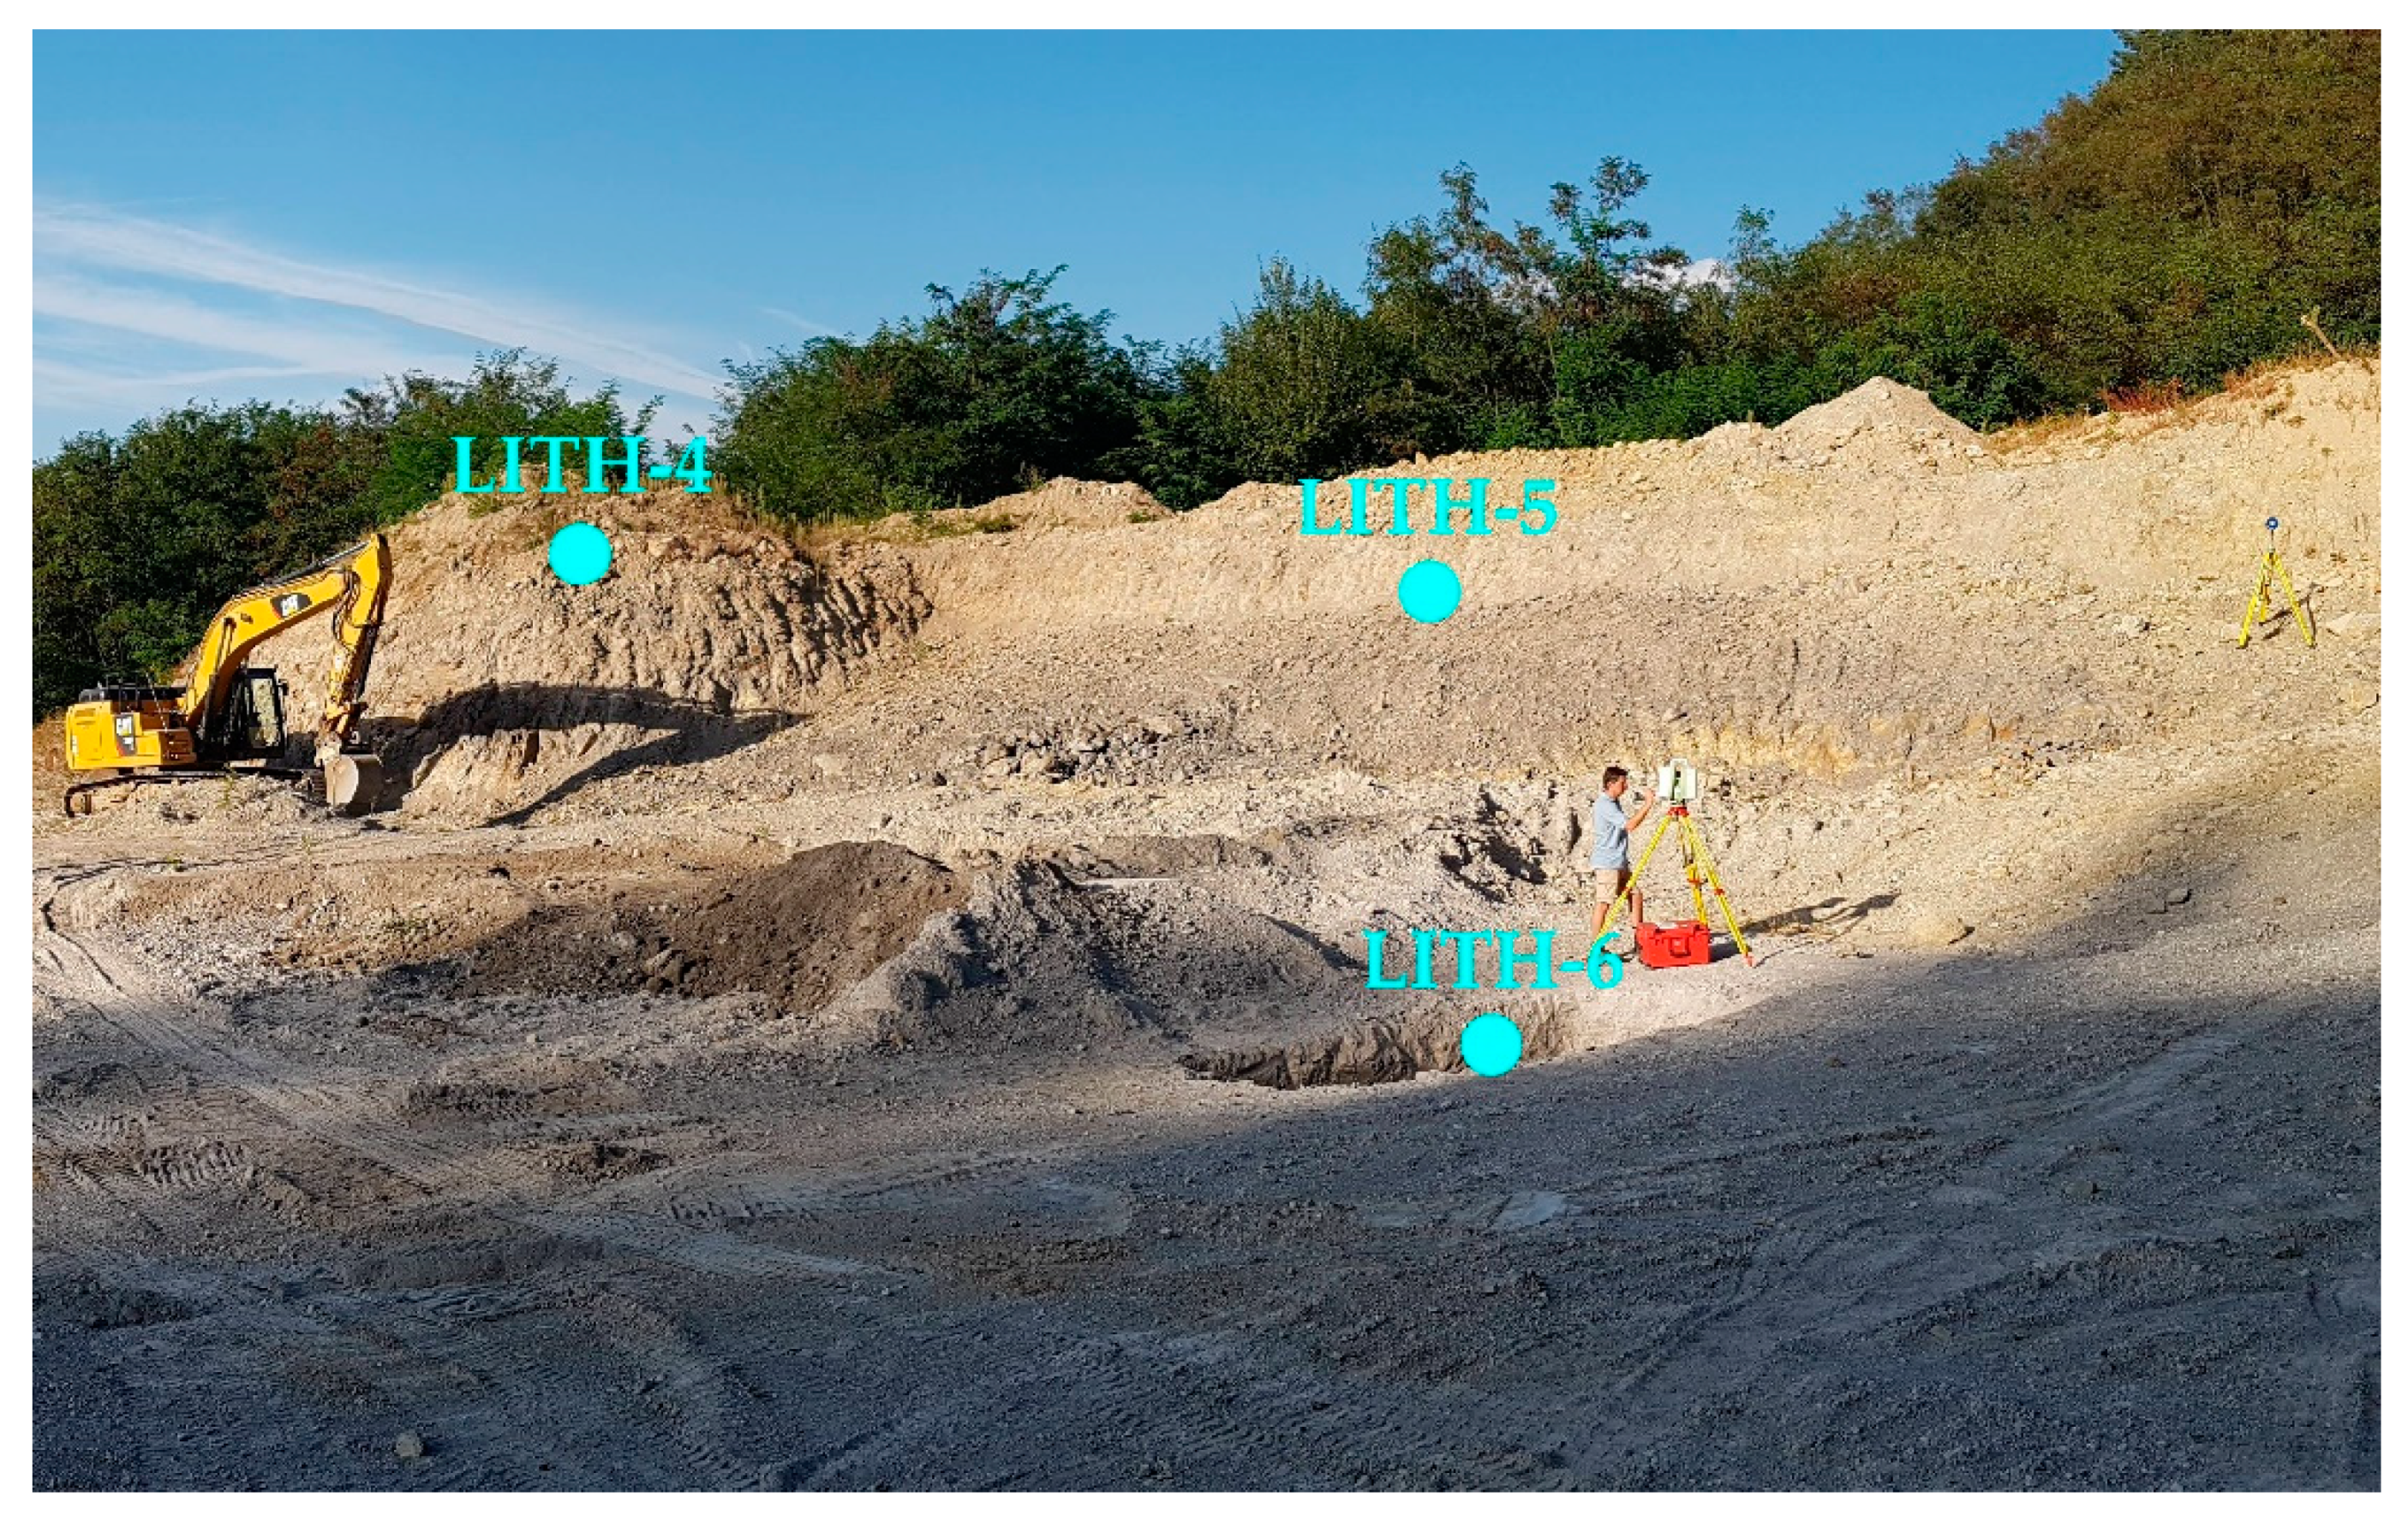
During the research at the testing site, the sampling for laboratory determination of bulk density was carried out in such a way that all samples were representative and respected the geological structure and distribution of the raw material in the deposit. Based on the geological structure and lithological changes in the deposit, 6 lithotypes (LITH) were selected from which 3 samples were taken. A total of 18 samples were analyzed. Samples were taken from two profiles (Figure 2 and Figure 3).
Profile 1 is located on the SE edge of the quarry (Figure 2). In this profile 9 samples were taken, representing 3 lithotypes appearing in this part of the quarry.
The sample LITH-1 was taken from the top mining level. There are diluvial sediments, which form a sedimentary cover of the deposit. In addition to clay, rhyolites or andesites can be found here. The LITH-2 sample represents sedimentary rocks with a distinctive layered texture. These are coarse-grained laminar tuffs, which are formed by fragments of volcanic material such as tuffs, andesites, and rhyolites. The LITH-3 sample is the dominant lithotype in Profile 1. Due to the largest volume representation in the profile, this sample was taken, in addition to laboratory analysis, also for large-scale in situ method of measurement. The sample composition is very heterogeneous. These are tuff breccias build by of pyroclastic material. The components are often sharp-edged, they reach a size of up to 20 cm, fragments are made of volcanic glass, rhyolites, tuffs. The intergranular matrix consists of dark brown tuffs.
Profile 2 is located one level below, in the central part of the quarry (Figure 3). In this case, 9 samples were taken, representing 3 lithotypes appearing in the given part of the quarry. The LITH-4 sample is dark grey andesite with a glassy ground substance with feldspar phenocrysts. The LITH-5 sample is glassy rhyolite. The LITH-6 sample is a small-grain tuff breccia with fragments of andesite and volcanic glass.
The laboratory results for the determination of bulk density of point samples in accordance with EN ISO 11508 are given in Table 1. The laboratory determination was realized as an accredited test in the State Geological Institute with an expanded uncertainty of 3% (relative combined standard uncertainty with coverage factor k = 2).
The table shows that the average bulk density, determined in the laboratory on representative samples that respected the geological structure and distribution of the raw material in the deposit, is 1756 kg∙m−3. The data were obtained by laboratory analysis of samples taken for typical lithotypes in the investigated part of the deposit and calculated as an average value taking into account also the proportion of individual lithotypes in the deposit. Therefore, it should be representative of the raw material in the investigated part of the deposit.

2.4. Determination of Bulk Density and Loose Bulk Density in Situ

The in situ method is the determination of bulk density from direct field measurements. In this case, it is important to take a sample with the highest volume possible, ideally around 10 m3, but at least 1 m3. A sample of rock material in the natural state with a volume of 5 to 7 m3 is usually sufficient for objective determination of bulk density. In the field determination of bulk density, the aim is generally to collect as much raw material as possible, that can be weighed together with the vehicle, by one weighing, without further manipulation (loading, unloading, emptying, etc.). A sufficient sample size reduces the bulk density error due to the heterogeneity of the raw material. Thus, the larger the volume entering the measurement, the more representative the resulting bulk density will be. The weighing of the sample taken shall be carried out on a certified weight immediately after sampling to avoid drying or wetting of the sample due to climatic conditions. The volume of the sample taken for field bulk density determination is then determined using geodetic or photogrammetric methods. The bulk density itself is then calculated according to (1) as the ratio of the mass of the large-scale sample to its volume from the data determined directly in the field.
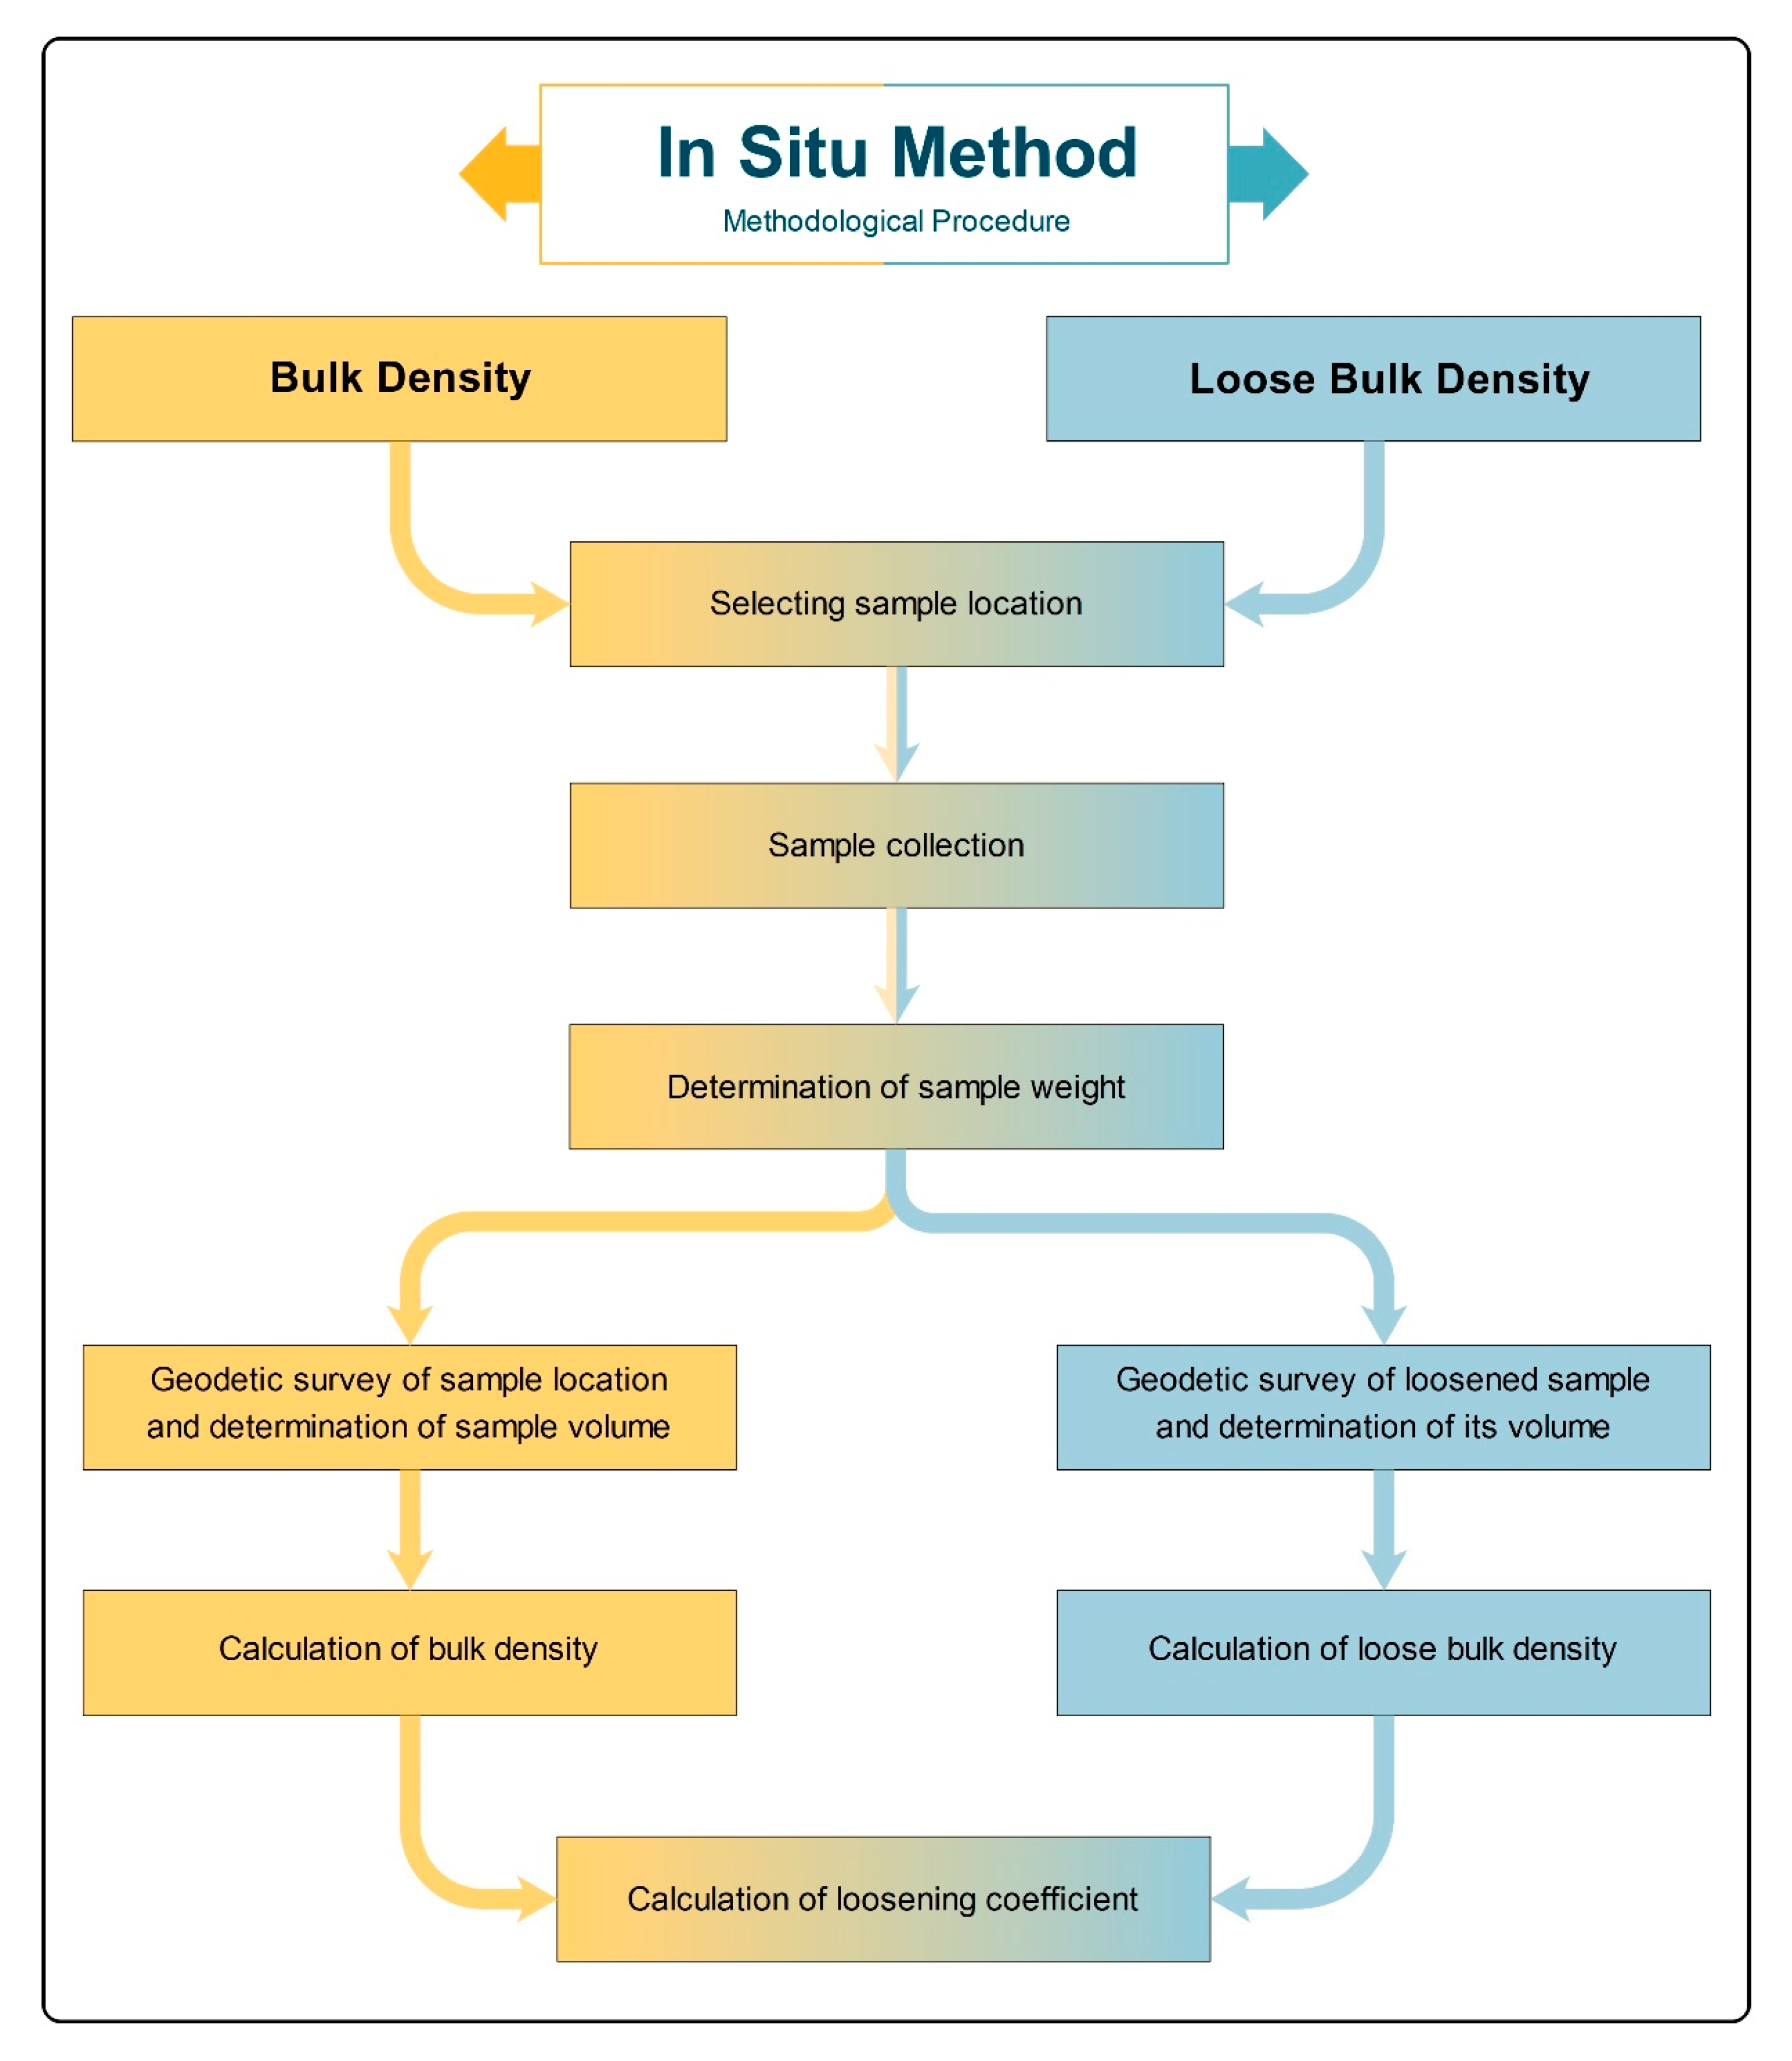
In order to determine the loose bulk density, the weighed sample must be deposited in a loose state on a stock-pile, followed by a determination of its volume. The loose bulk density is then calculated as the ratio of the weight of the sample to the volume of the material deposited in the loose state in the stock-pile. The whole methodological procedure of determination of bulk density and loose bulk density by in situ method is shown on the workflow diagram—Figure 4.

2.4.1. Collection and Determination of the Mass of the Large-Scale Sample

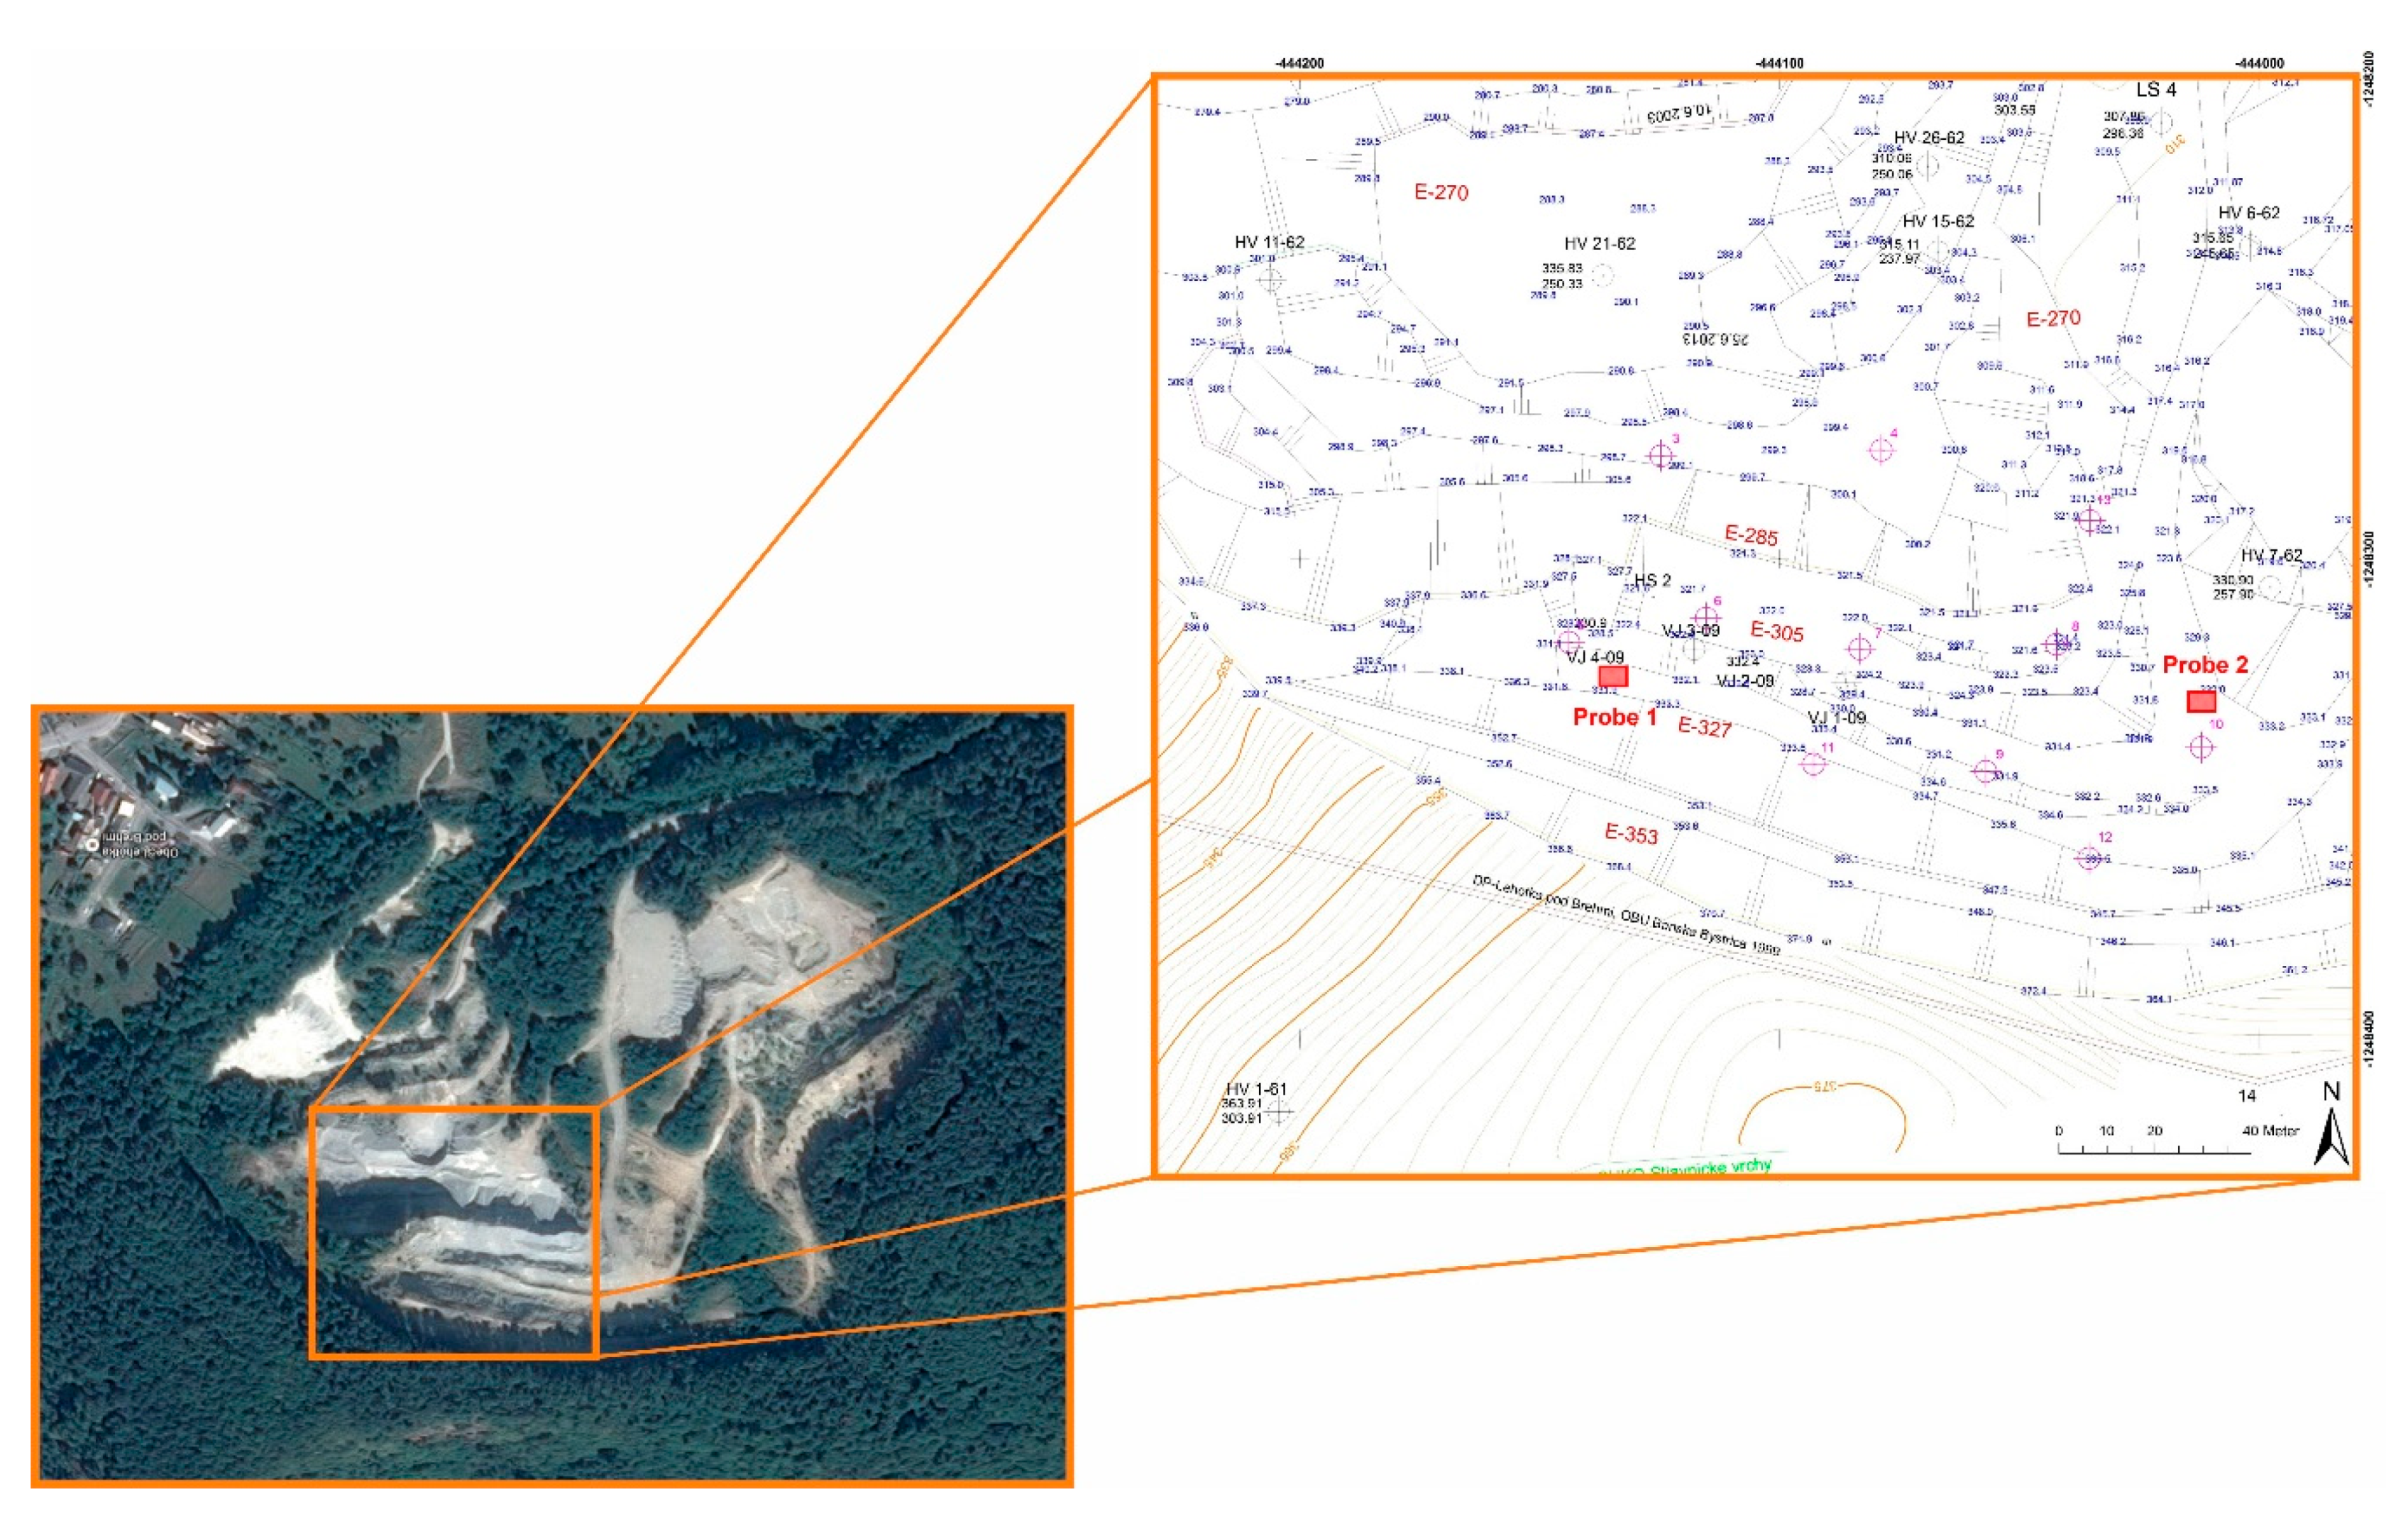
Two large-scale samples labeled Probe 1 and Probe 2 were taken to determine the bulk density of the mineral by in situ method. Their location is shown in Figure 5. Taking of samples was done by an excavator (Figure 6 and Figure 7). The samples were then transported for weighing by a TATRA truck to a certified weight bridge with weighing accuracy of 20 kg. Each sample was weighed three times, and the average sample weight was calculated from these measurements. After weighing, the samples were taken to the LBK Perlit plant and deposited there in two separate stock-piles (Figure 12). The results of large-scale sample weighing are given in Table 2.

2.4.2. Geodetic Survey of Samples Location and Determination of Their Volume in Situ

There are several geodetic methods and technologies, such as tacheometry, grid leveling, photogrammetry, laser scanning, or GNSS methods, which can be implemented to determine the shape of a body—the volume of the stock or volume of a material sample. In practice, terrestrial laser scanning, digital photogrammetry, and GNSS methods are currently most commonly used. For purposes of this research, terrestrial laser scanning was chosen as the most accurate and effective technology and digital close-range photogrammetry as the comparative method.
Terrestrial Laser Scanning (TLS)
TLS measurements were performed in the coordinate system Datum of Uniform Trigonometric Cadastral Network (S-JTSK) and vertical datum Baltic Vertical Datum—After Adjustment (Bpv). These are obligatory systems used in Slovakia. Nail survey marks, as temporary monumented points with respect to the operation of the quarry, were used as reference points. The approximate coordinates and heights of these points were determined by the RTK (real-time kinematic) method using the Leica GPS900CS GNSS instrument (Leica Geosystems AG, Heerbrugg, Switzerland) connected to a network of SKPOS (Slovak real-time positioning service) reference stations. The horizontal accuracy of the coordinates of the points determined in this way (guaranteed by the SKPOS service) is usually up to ±20 mm and vertical ±40 mm with respect to the measurement conditions. The resulting coordinates of the survey net points were determined by the spatial polar method using a total station Leica TS 02 (Leica Geosystems AG, Heerbrugg, Switzerland) with an internal accuracy in the survey net of up to 2 mm.
The method of the temporary station was used to determine the coordinates of HDS (High Definition Survey) targets used for TLS. The Leica TS 02 instrument was used for the measurement. The technical specification of this instrument gives an angular accuracy (horizontal and vertical) of 1.5 mgon. The length measurement accuracy is 2 mm + 2 ppm according to the manufacturer in standard measurement mode. The Leica GMP 111 surveying prism was used for the orientation. The Leica HDS 6” circular tilt & turn targets placed on a tripod were used as ground control points (GCP) for laser scanning. Their coordinates were determined by the spatial polar method.
The horizontal accuracy of the polar method is expressed by the mean positional error mp of the coordinates of the measured point according to the equation:
m P 2 =   m p A 2 + s i n 2 z   ×   m S 2 + s 2   ×   c o s 2 z   ×   ( m z ρ ) 2 + s 2   ×   s i n 2 z   ×   ( m ω ρ ) 2 ,
where:
  • mpA—mean positional error of the instrument’s survey station,
  • s—slope distance,
  • z—zenithal distance,
  • mω—mean error of the observed direction,
  • mz—mean error of the observed zenithal distance,
  • ms—mean error of the measured length,
  • ρ—conversion coefficient.
The vertical accuracy is determined by the mean error derived for trigonometrical measurement of heights by the equation:
m h 2 = m h A 2 + c o s 2 z   ×   m S 2 + s 2   ×   s i n 2 z   ×   ( m z ρ ) 2 ,
where:
  • mhA—mean error of the height of the instrument’s survey station.
The internal accuracy is calculated as a priori mean error of measurement for the furthest measured points from the survey station (assuming s = 80 m, z = 105 g) as mp ≤ 10 mm and mh = ≤ 10 mm.
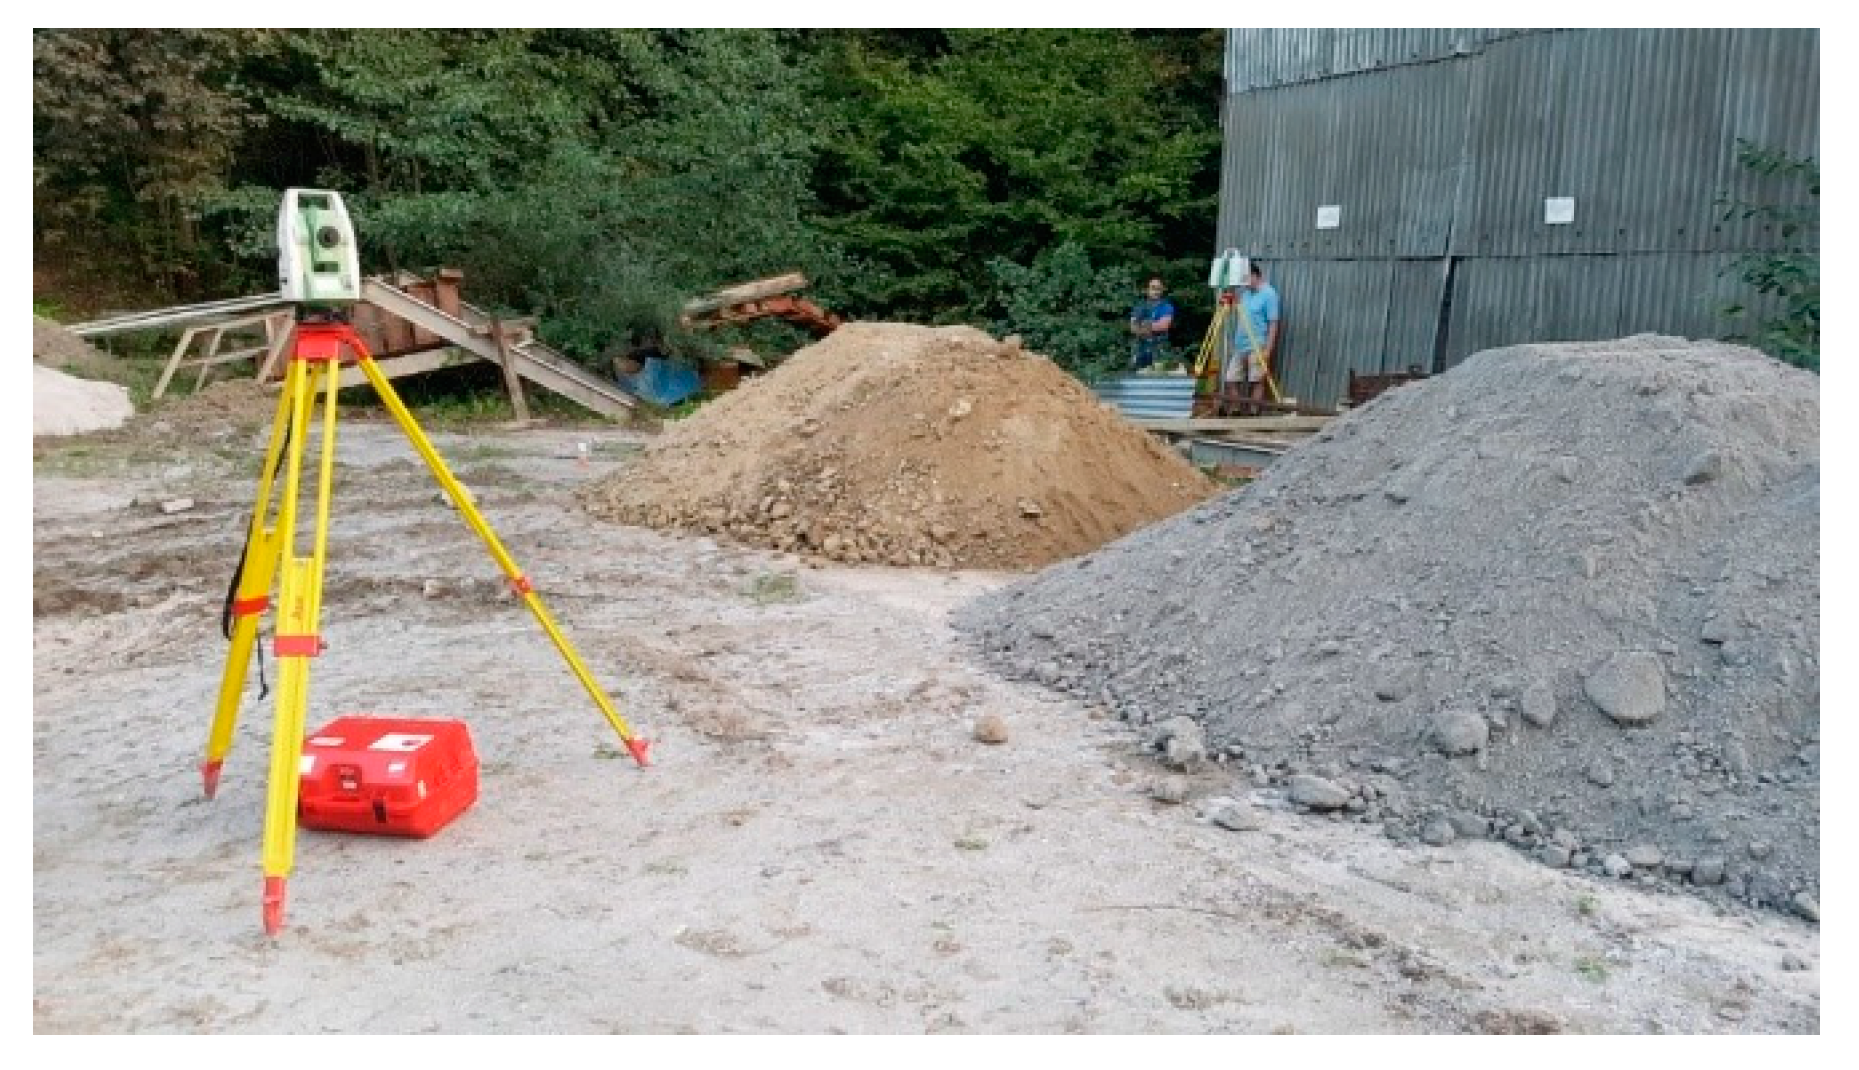
The Leica ScanStation C10 laser scanner (Leica Geosystems AG, Heerbrugg, Switzerland) was used to measure and determine the volume of large-scale samples of the raw material in the natural state (Figure 8). The scanner uses a pulse laser distance meter with 532 nm wavelength and class 3R with green visible light for length measurements. Partial scans were mutually registered by direct georeferencing in the S-JTSK coordinate system using the ground control points with Leica HDS targets (Figure 9). The accuracy of registration is derived from the intersection residues. Its value was up to mp = ±2 mm. The point density setting for laser scanning was set as 10 mm at a distance of 30 m, both horizontally and vertically. The initial point cloud from scanning contained 1.20/0.8 mil. points for both probes. In postprocessing, the overlapped scans were registered together and spatially filtered for a 10 mm point spacing due to the granularity and physical properties of the raw material. The resampled point cloud used for calculations contained approximately 163,000/143,000 points.
The TLS measurements resulted in a dense point cloud from which TIN models of individual surfaces were generated—always before and after excavation. The volume of the excavated raw material—the large-scale sample was determined by the difference between the two TIN models.
Digital Close-Range Photogrammetry
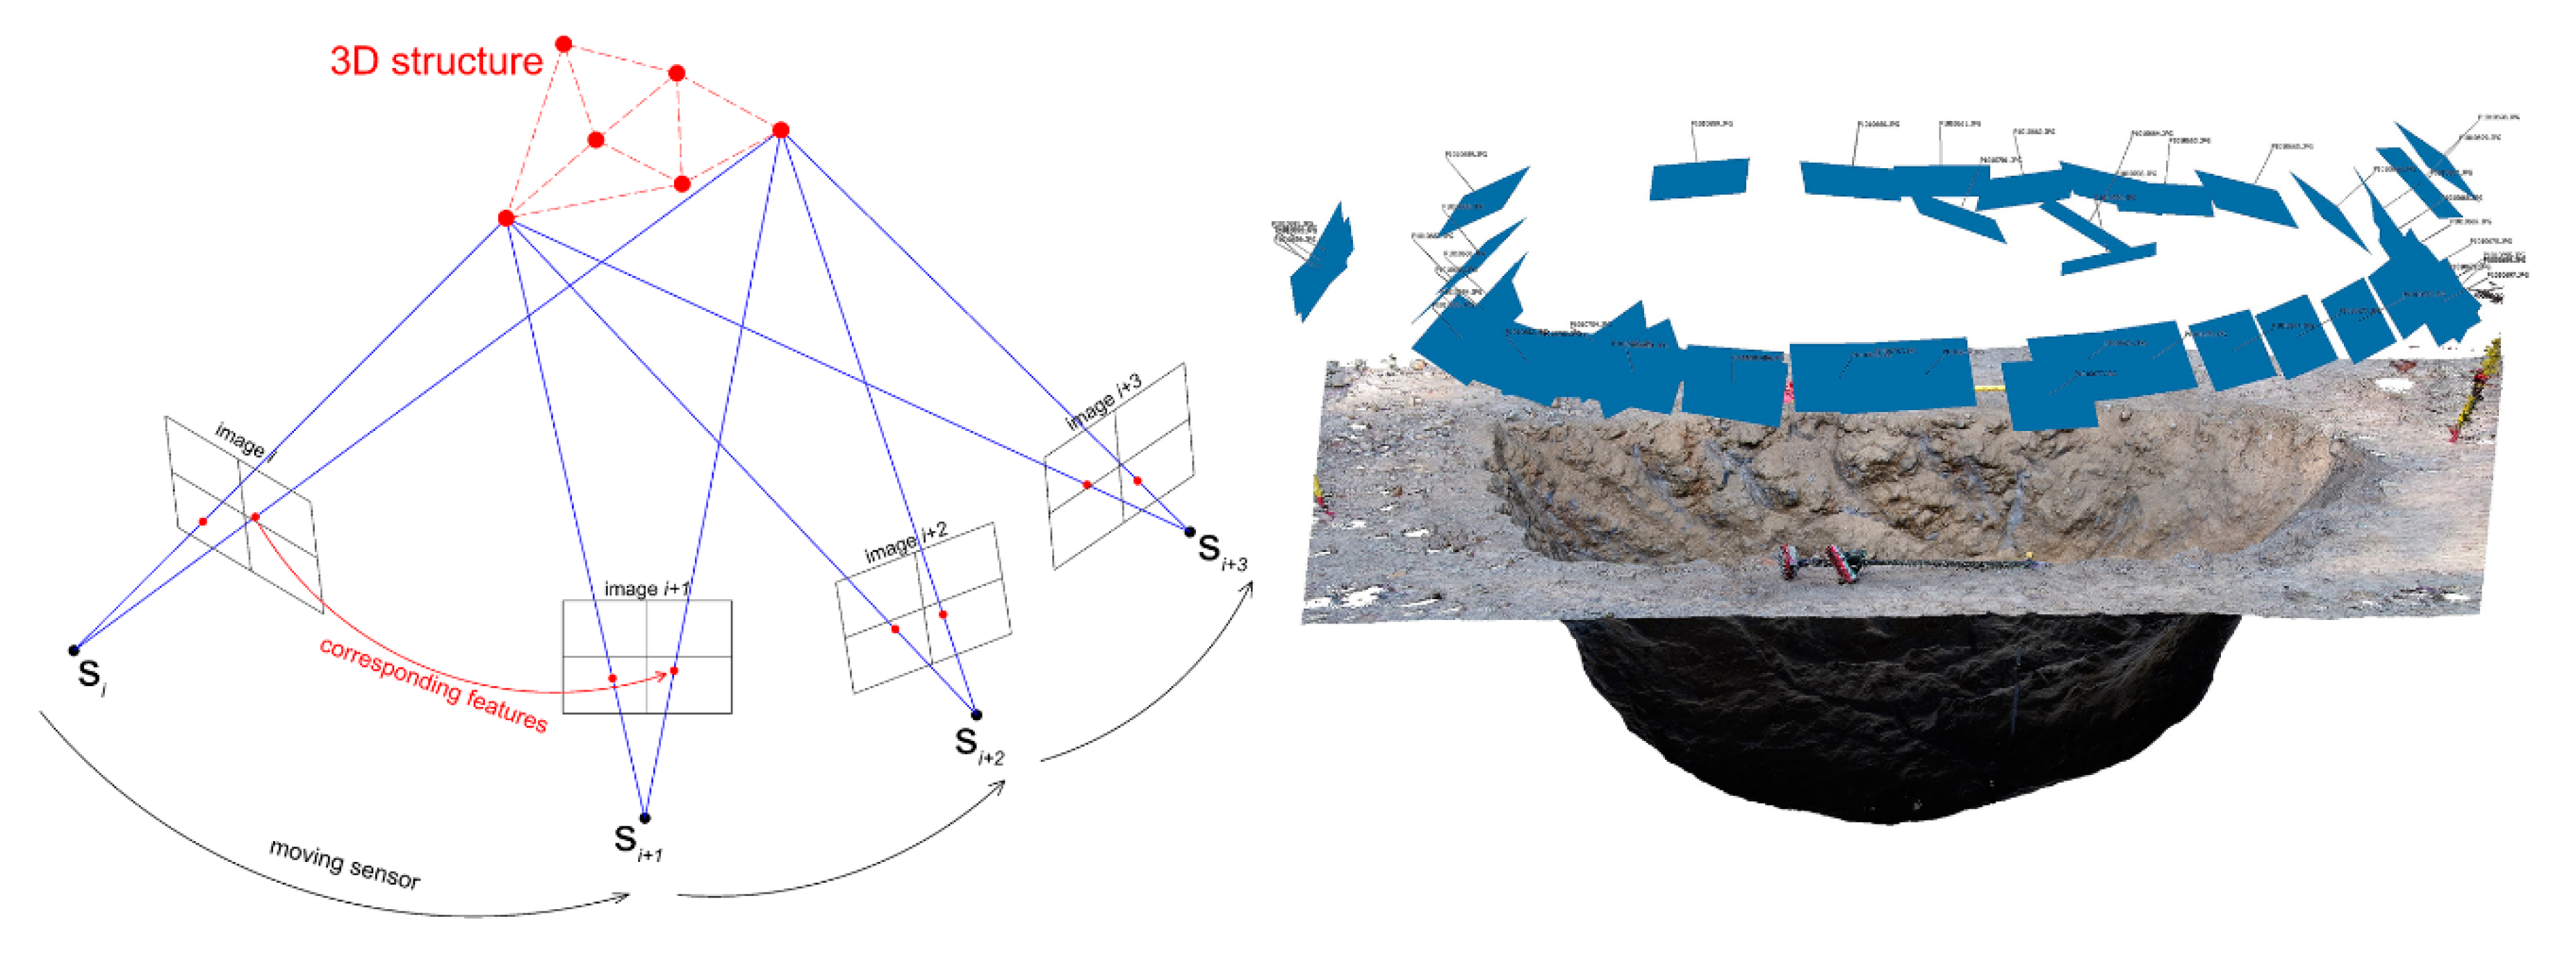
Photogrammetric measurement of large-scale samples was performed after excavation, using the “Structure from Motion” (SfM) method. The SfM method represents one of the most advanced approaches in photogrammetric image processing and is based on estimating the 3D structure of 2D sequences of digital images that are associated with the movement of the used recording medium – digital camera (Figure 10). The principle of the method is based on biological vision, thanks to which people can reconstruct the spatial structure of their surroundings from a 2D image perceived and projected onto the retina. Essentially, it can be characterized as the combination of stereophotogrammetry and convergence case of photogrammetry—i.e., the possibility to use images with both parallel and convergent axes. The big advantage of this method is the automated image processing and simultaneous determination of the elements of the interior and exterior orientation of the camera and the 3D structure on the images [33].
Photogrammetric imaging was performed using an Olympus PEN E-PL5 digital camera (Olympus Corporation, Tokyo, Japan) with a focal length of 14 mm, aperture f/6.3 and ISO 200, from a distance of about 3.7 m and without using a tripod. Subsequent image processing was performed in Agisoft PhotoScan® Professional Edition, Version 1.2 software (Agisoft LLC, St. Petersburg, Russia).
Trimble RealWorks® Version 10.0.4.441 software (Trimble Inc., Sunnyvale, CA, USA) was used to calculate the volume of large-scale samples. Using this software, the volume of large-scale samples (excavated pit) was determined using the two-volume calculation function (upper and lower surface). Table 3 shows the volumes of large-scale samples—Probe 1 and 2.
To verify the accuracy of the measurements and calculation of sample volume from the TLS measurements, an alternative measurement using the close-range photogrammetry (SfM method) was also performed. The resulting data from photogrammetric processing were subsequently used to create control 3D models for independent-control calculation of the volume of large-scale samples. The results of the control calculation are given in Table 3. It shows that the calculations differ only insignificantly—by less than 2 percent of the volume. This is also consistent with the results from the differential models created for the large-scale samples.
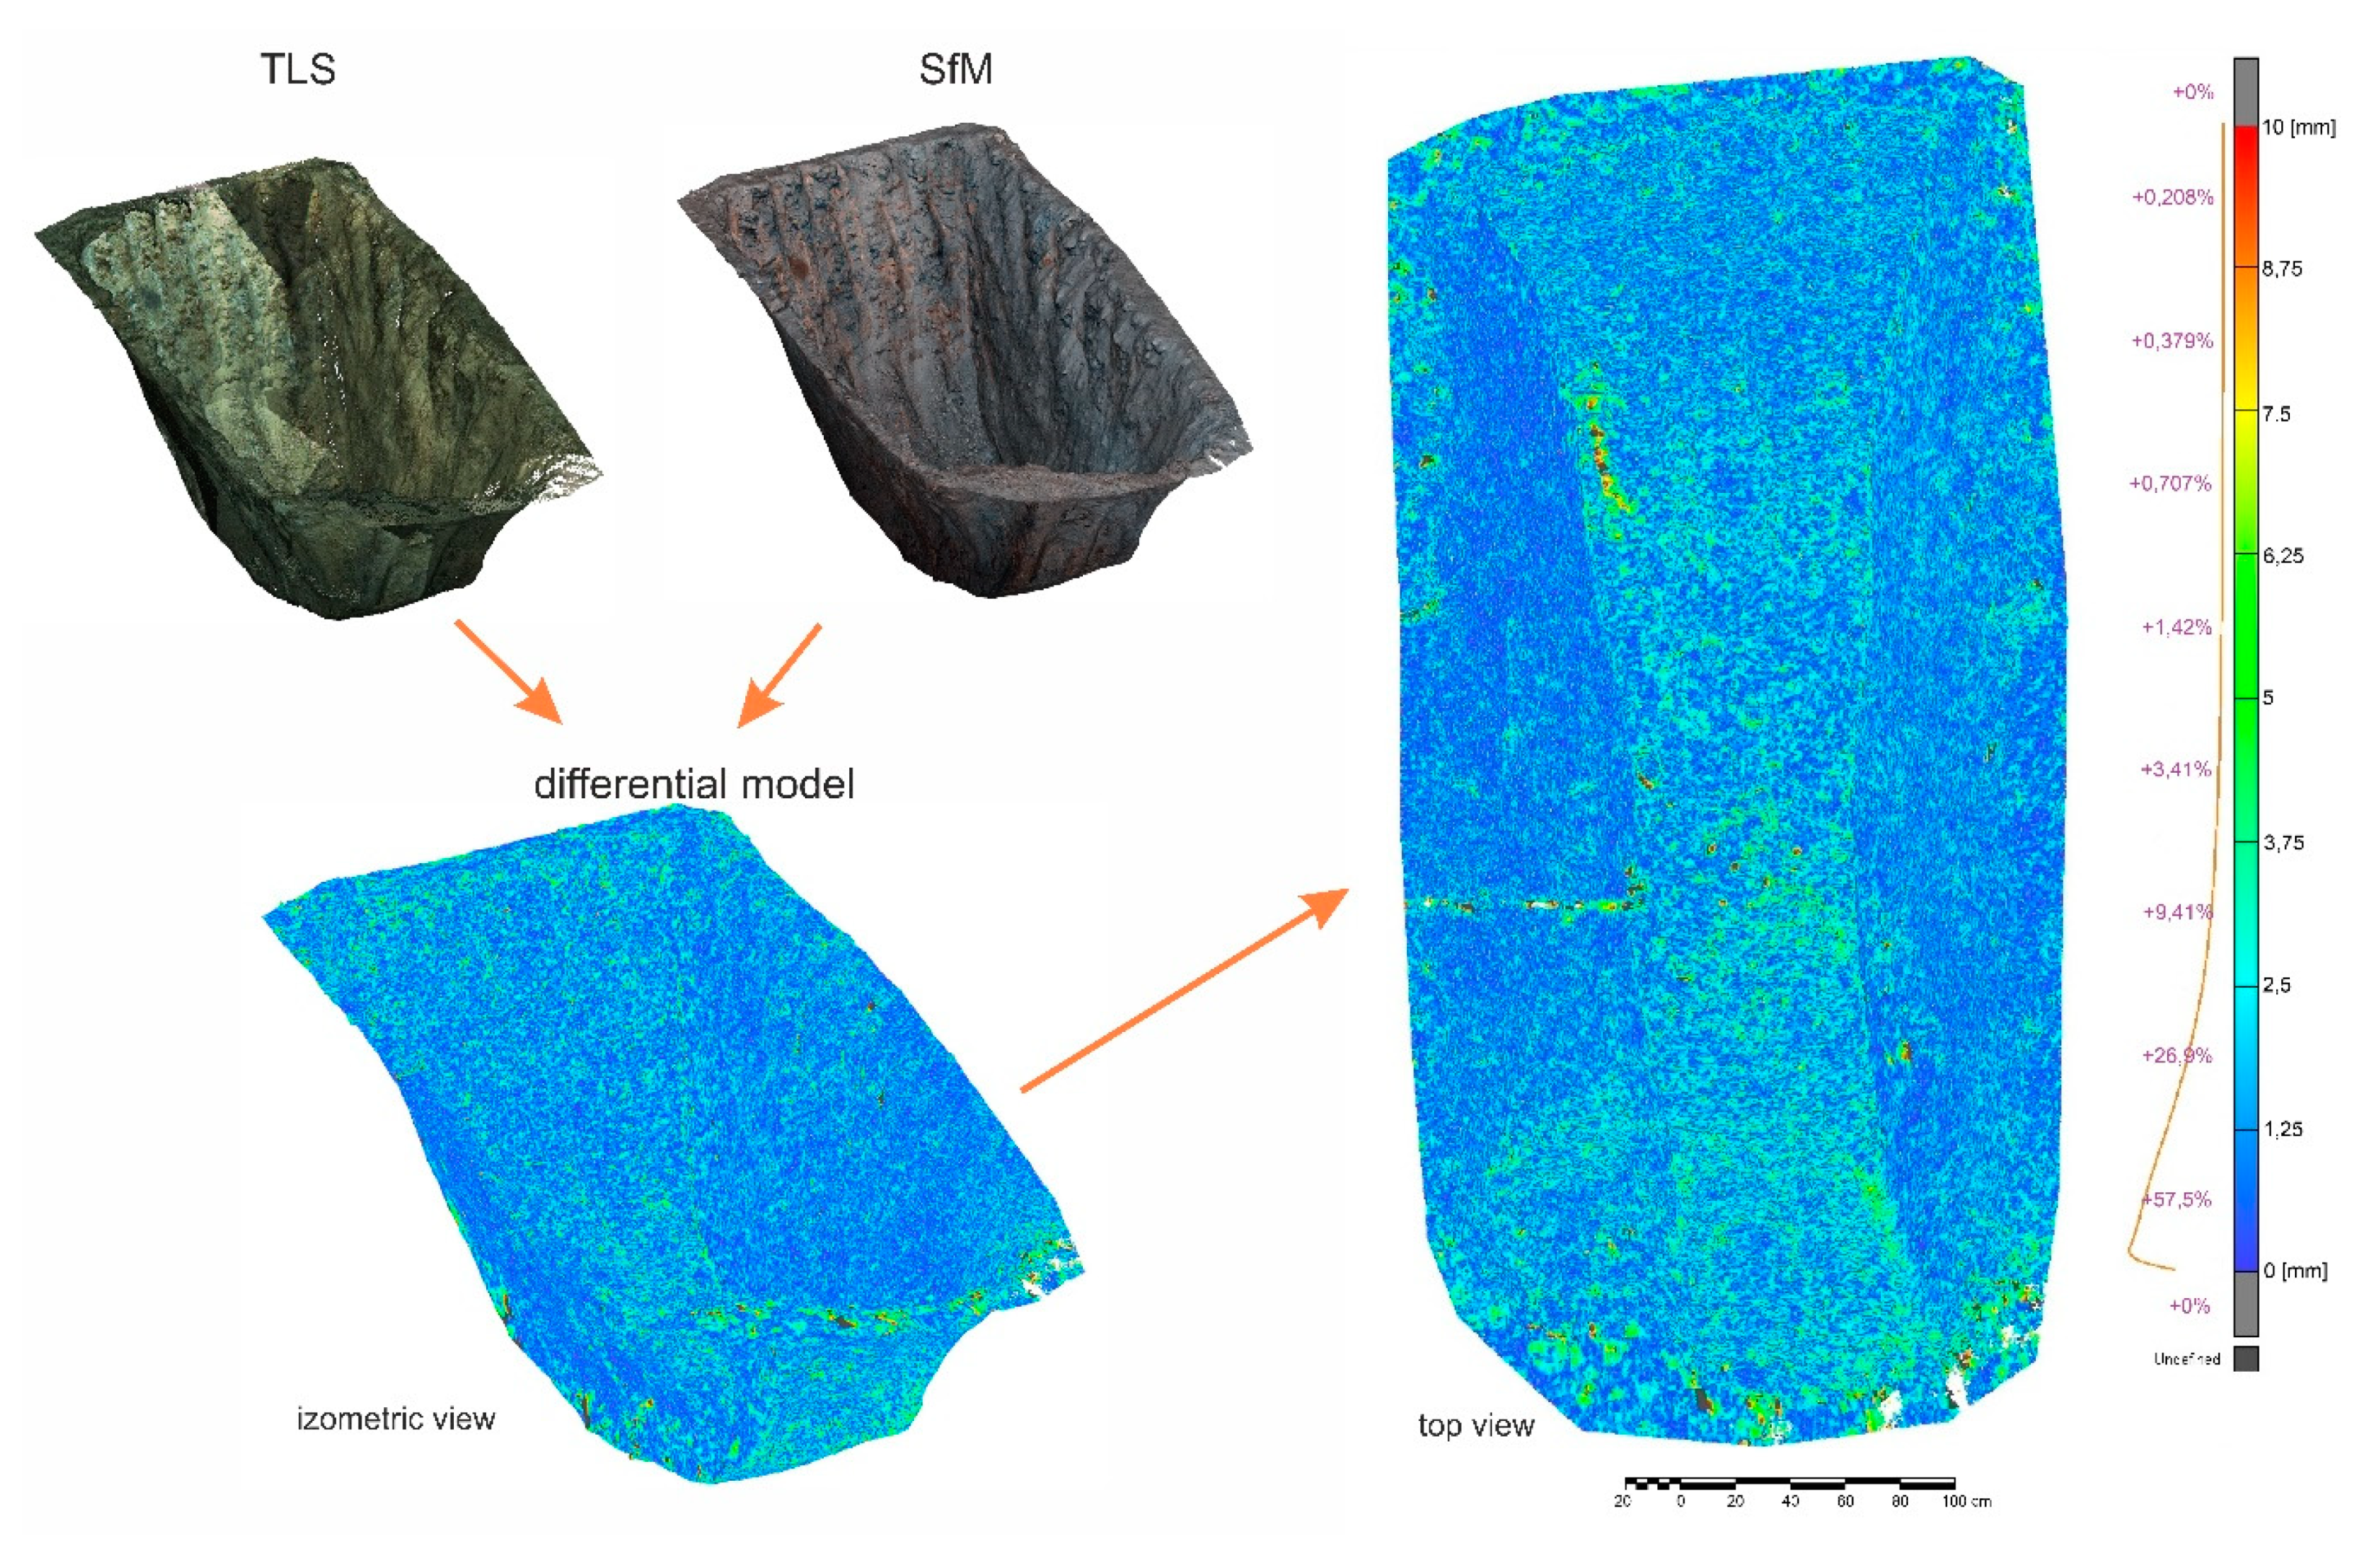
The photogrammetric processing of both large-scale samples resulted in a dense point cloud with an assigned RGB texture from the images. The point clouds of both probes were then compared with the point clouds obtained by terrestrial laser scanning. This was done by means of a differential model determining the spatial variation of the two compared models (Figure 11). The model was generated in the 3DReshaper 2018 Version 18.0 software (Leica Geosystems AG, Heerbrugg, Switzerland) using the compare/inspect function, which is used to determine robust distances between two point clouds. The different models show that the distances between the two clouds reach the maximum value of 9.5 mm with the mean value of deviations at 1.6 mm. Overall, 99% of the deviations are between 0 and 6.25 mm.
The statistics of the process of measuring the shape and volume of large-scale samples by the close-range photogrammetry and the results of the photogrammetric processing by the SfM method are given in Table 4.
Based on the results obtained by both methods, it can be concluded that the control measurement by the SfM photogrammetry method gives comparable results in terms of accuracy. However, the comparable accuracy has been achieved for the given averaged scanning/imaging distance (approx. 4 m in our case), respectively for comparable distances, as the achievable accuracy of photogrammetric processing decreases as the imaging distance increases (while laser scanning achieves guaranteed accuracy within the range of the instrument) [35].
Results of photogrammetric processing, unlike TLS, provide a higher density of the resulting point clouds. Moreover, thanks to better “maneuverability” with the camera, it is possible to capture even areas that may remain obscured during scanning, and their absence in the resulting model can lead to distorted results. On the other hand, photogrammetric imaging is sensitive to light conditions and, in the case of insufficient illumination of the measured surface (or significantly varying illumination during imaging), subsequent processing of the images can be problematic as well as lead to incorrect results.
2.4.3. Calculation of the Volume of Loosened Material from the Probe 1 and Probe 2 Samples for the Determination of the Loose Bulk Density

For the determination of loose bulk density, it was necessary to determine the volume of loosened mineral from the large-scale samples Probe 1 and Probe 2. For this purpose, the raw material from the large-scale samples (after the weighing process) was deposited on a horizontal reinforced panel surface on two separate piles (Figure 12). The volume of these piles was measured by TLS from four scanning stations. The connection of measurement to geodetic control and determination of volume was performed similarly to the measurement in the quarry.
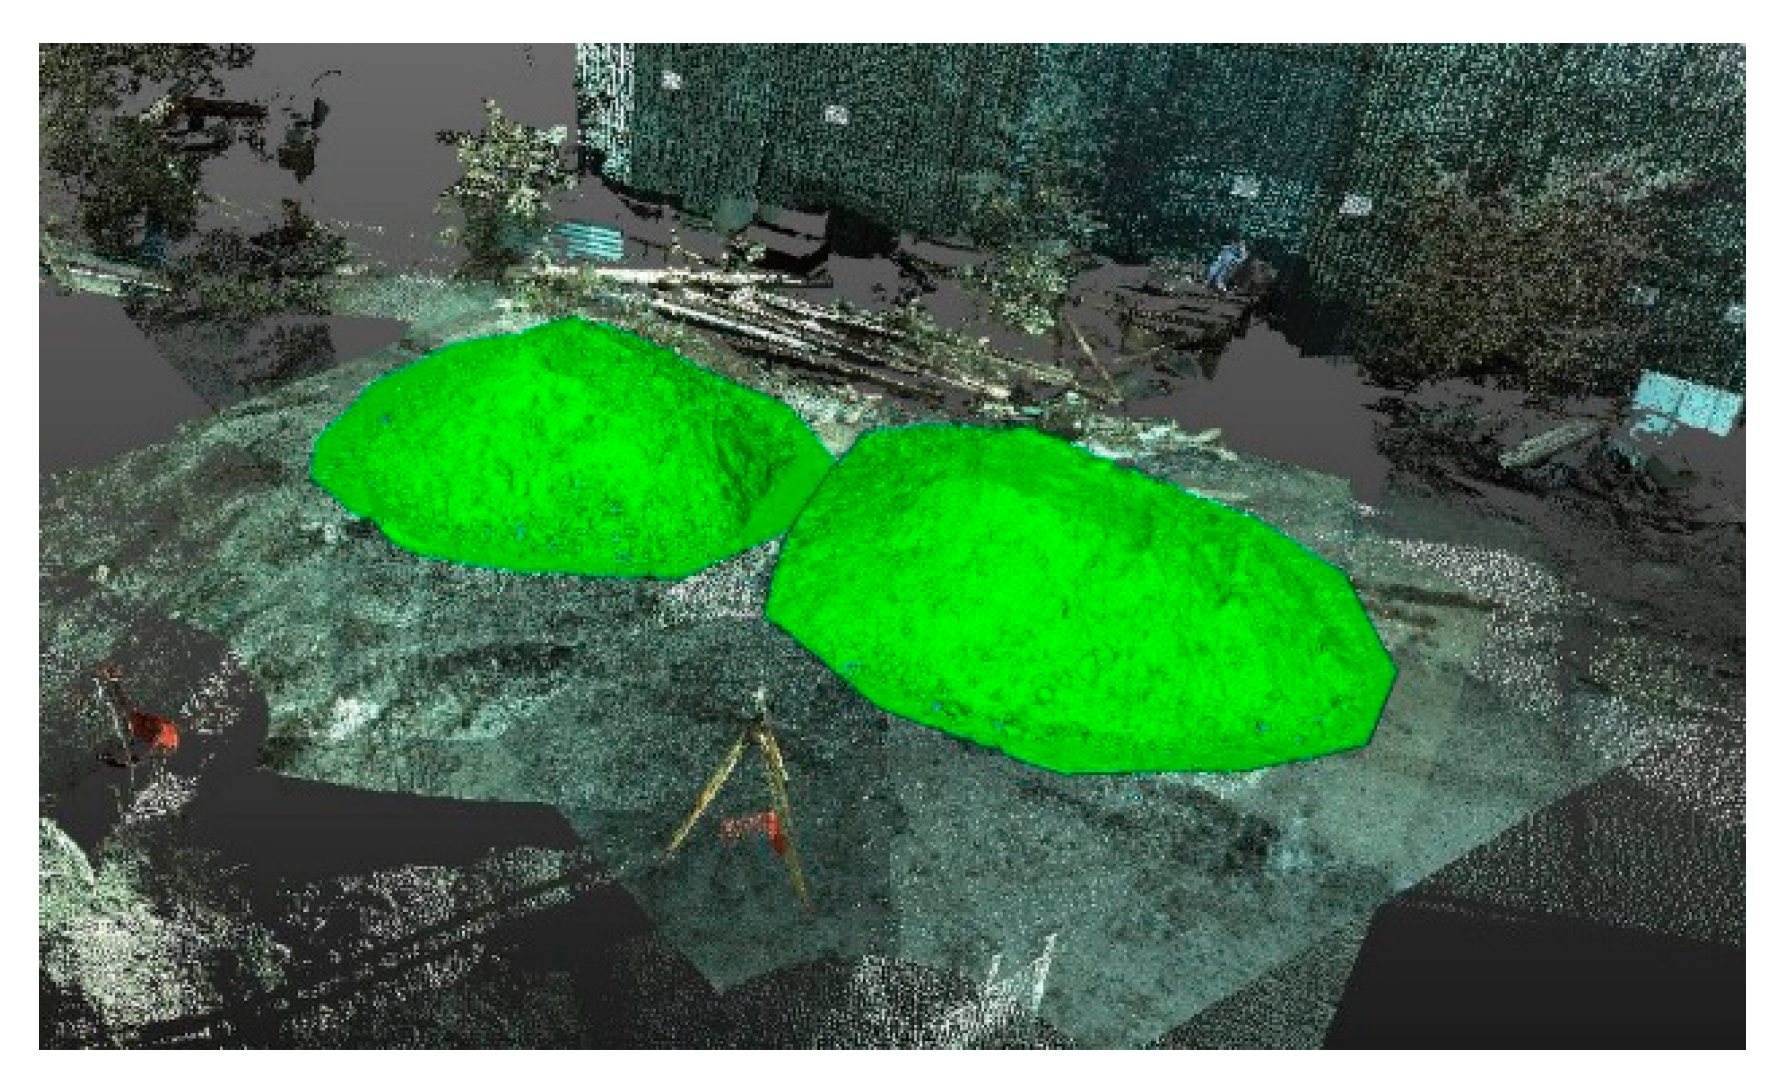
The point clouds from geodetic measurements were then processed again in Trimble RealWorks® Version 10.0.4.441 software (Trimble Inc., Sunnyvale, California, US) (Figure 13). The calculation of the volume of the loosened material was performed similarly as in the case of calculation of the volume of samples. The resulting volumes are given in Table 5.

2.4.4. Calculation of Bulk Density and Loose Bulk Density by in Situ Method

The results of the determination of bulk density by in situ method from the large-scale samples are given in Table 6. By comparing the measured results, we can conclude that both large-scale samples Probe 1 and Probe 2, which represent dominant geological lithotypes, have a comparable bulk density (Probe 1) of 1865 kg∙m−3 and (Probe 2) of 1818 kg∙m−3. The average bulk density of the raw material in the examined part of the deposit, determined by the in situ method, is 1841 kg∙m−3.
The average loose bulk density (Table 7) determined in situ from large-scale samples is 1327 kg∙m−3 in the area of interest of the deposit.
Subsequently, the loosening coefficient, which is a dimensionless number with value always greater than 1 and which represents the ratio of the bulk and loose bulk density of the raw material, was determined for a given raw material. The loosening coefficient is an important indicator in the transport and landfilling of the extracted material and represents the value of 1.38 for the material from the tested part of the deposit.

3. Discussion

The determination of the volume of irregular bodies depends on the accuracy of the measurement and the detail of the model (density of points on the measured surface). In TLS and photogrammetry, these also depend on the distance of the sensor to the measured object. Large-scale photogrammetry or lidar surveying of the ground surface is characterized by RMSE of more than 10 mm [11,20,21,36]. For small-scale surveying, the measurement accuracy of a few mm and high density of points can be expected. When comparing TLS and SfM mesh models of such size, RMSE values of approximately 2 mm [37] are expected. We used this fact in our research, where the distance of the measured objects from TLS and photogrammetry sensors was up to 5 m. We achieved RMSE up to 3 mm by comparing our TLS and photogrammetry models.
The calculation of the density by the laboratory method and the in situ method is affected by:
  • heterogeneity of the lithological composition of the raw material and related selection of representative samples,
  • accuracy of sample weight determination,
  • accuracy of sample volume determination.
Although laboratory methods accurately determine bulk density, they cannot statistically capture the lithological variability. Therefore, multiple sampling is required, which has also been realized. Obviously, an incorrectly selected location of a sample can significantly distort the actual bulk density of the raw material in the deposit. Therefore, as a representative value for laboratory determination of bulk density, it is always advisable to use a weighted average of the values of all established laboratory values, which takes into account the representation and proportion of individual lithotypes in the deposit (Table 1).
Laboratory determination of bulk density from field samples displayed a high variability of bulk density, ranging from 1497 kg∙m−3 to 2245 kg∙m−3. The average bulk density of the raw material, calculated from laboratory values and taking into account the proportion of individual lithotypes in the deposit, is 1756 kg∙m−3. To capture the variability of the deposit and the quality of the raw material within the in situ method, large-scale samples weighing 13–16 tonnes were taken. Their weight was determined by repeated weighing on a certified weight bridge. For the purposes of calculating the sample volume, places of samples were geodetically surveyed by the method of terrestrial laser scanning. To verify the accuracy of the TLS method, digital close-range photogrammetry was also implemented. Subsequently, the bulk densities of the bulk samples of 1818 kg∙m−3 and 1865 kg∙m−3 were determined by the calculation from in situ measurements, yielding the average bulk density of the raw material of 1841 kg∙m−3.
For an operative bulk density determination, the in situ method is more suitable for the operational needs of the quarry. The main prerequisite for its correct use is that the selection of sample location and sampling itself will capture the variability of the raw material and the sample will thus capture all the dominant petrographic varieties (lithotypes) of the examined part of the deposit.
Assume the following:
a)
when taking a large-scale sample, the heterogeneity of the raw material in the examined part of the deposit is represented,
b)
the weight of the sample is correctly determined with regard to the accuracy of the certified weight bridge, and also thanks to repeated weightings and their averaging,
c)
the sample volume was determined with high accuracy and minimal deviation due to accurate geodetic measurements using TLS, which was confirmed by a control volume determination from the photogrammetric survey.
Then, we can say that the determination of bulk density by the in situ method will not be weighted with any significant technical or systematic error and the result should be as representative as the result of laboratory determination of bulk density. The average bulk density in the examined part of the deposit with the value of 1841 kg∙m−3 was determined by this method.
Summarizing and comparing the results, the method of determining the average density by the in situ method using terrestrial laser scanning and digital close-range photogrammetry yields nearly the same results as the laboratory method—the difference of both values is only 4.5% (Table 8).
Regarding the change in the volume of transported material, Kociuba et al. dealt with the volume of material of eroded banks of the Scott River in Svalbard in their research [5]. From TLS measurements, they determined the erosion/accumulation volume balance. As in our research, a differential model of two surfaces was used to determine the volume. Prior to material transfer, surfaces were approximated to the surrounding terrain. The volume change of eroded and deposited material was +6%. This value corresponds to a loosening coefficient of 1.06.
In their research in the Austrian Alps, Bremer and Sass identified a difference in the volume change of transported material mixture of the debris flow accumulations of +7% (with a corresponding loosening coefficient of 1.07) [38].
The loosening coefficient determined in our research has an average value of 1.38. The difference between the value determined in our research and the results of the cited works can be discussed in relation to the method of material transfer and its fraction. In our case, it was a “dry” process with a machine transfer of material within approximately two hours. In works [5] and [38], it was a long-term natural process with the action of water, which may contribute to the compaction of the material. Similarly, the finer fraction is washed away in the “wet” erosion process and therefore does not affect the settled volume. The study of bedload transport of material in the glacial river is discussed in, for example, the research by Kociuba and Janicki [6].
Another aspect can be a method of creating a reference model of the original state. In our case, the original surface measured in situ at the quarry was planar, i.e., close to the truth, while, for example, in the work by Kociuba et al. [5], it was approximated according to the surrounding terrain.

4. Conclusions

The operative determination of some technological parameters of raw materials is a current problem of practice, and therefore this issue is addressed in various scientific and professional forums. This paper presents the results of the research carried out for the needs of a mining company, where the aim was to develop a methodical procedure for determining the bulk density and loose bulk density of heterogeneous mineral resources under operational conditions directly in the quarry-in situ.
The application of the developed methodological procedure should speed up the process of determination of bulk density for the purposes of the operative calculation of reserves in the deposit. The application of the method for determining the bulk density in situ should facilitate and refine the operative calculation of stocks of the extracted material deposited in stock-piles.
The proposed and tested methodology uses technologies, methods and procedures for geodetic determination of volumes by and terrestrial laser scanning and digital photogrammetry. These geodetic methods, when used correctly, offer highly accurate results that are almost identical to laboratory results. The use of the in situ method has several positive aspects:
  • the minimal difference 4.5% between in situ measurements (1840 kg∙m−3) and laboratory measurements (1756 kg∙m−3), confirm efficiency methods for rapid and accurate bulk density determination,
  • the loosening coefficient 1.38 is dependent on lithology, rheology, disintegration, humidity, and raw materials disturbance
  • it is applicable to all types of mineral resources as well as to highly heterogeneous raw materials and stocks (including waste deposited in a landfill) where it is extremely difficult to correctly determine the representative value of both bulk and loose bulk density.
  • its use in practice is operative, effective and we can get results on the same day as we make measurements,
  • using the in situ method is technically very simple and can be done by a common surveyor together with a geologist or technologist,
  • the possible error of the in situ method is minimal despite its simplicity.
In conclusion, the presented in situ method is an effective, fast, cheap and sufficiently accurate equivalent to the laboratory determination of bulk density and loose bulk density, especially on deposits with heterogeneous raw materials. Moreover, it is equally well applicable to any other type of deposit in operative reserves calculations as well as in the calculation of stocks of extracted raw material deposited in stock-piles.

Author Contributions

Described research was carried out by P.B., S.J., Ľ.K., and J.K. on datasets obtained by P.B., S.J., Ľ.K., and J.K. The paper was written by P.B., S.J., Ľ.K., J.K., K.P., and K.B. All authors have read and agreed to the published version of the manuscript.

Funding

The study is the result of Grant Project of Ministry of Education of the Slovak Republic APVV-0339-12: “Perlite genesis and innovative approaches to its exploitation and processing”; VEGA No. 1/0844/18: “Experimental research on the limiting factors of application of non-contact surveying systems for the documentation of specific surfaces for the creation of their digital models”; VEGA No. 1/0585/20: “Application of millisecond timing to decrease the negative effects of seismic waves generated by blasts” and KEGA No. 004TUKE-4/2019: “Scientific and educational centre for remote sensing with the focus on the application of e-learning approaches in education”.

Acknowledgments

We would like to thank the LBK Perlit s.r.o. company for the permission with 3D laser scanning and digital photogrammetry. Many thanks to the reviewers and the editor for their useful comments and suggestions.

Conflicts of Interest

The authors declare no conflict of interest. The funders had no role in the design of the study; in the collection, analyses, or interpretation of data; in the writing of the manuscript, or in the decision to publish the results.

References

  1. Bauer, T.; Strauss, P.; Murer, E. A photogrammetric method for calculating soil bulk density. J. Plant Nutr. Soil Sci. 2014, 177, 496–499. [Google Scholar] [CrossRef]
  2. Moret-Fernández, D.; Latorre, B.; Pena, C.; González-Cebollada, C.; López, M.V. Applicability of the photogrammetry technique to determine the volume and the bulk density of small soil aggregates. Soil Res. 2016, 54, 354–359. [Google Scholar] [CrossRef] [Green Version]
  3. Chunsen, Z.; Qiyuan, Z. Research on volumetric calculation of multi-vision geometry UAV image volume. In Proceedings of the 5th International Workshop on Earth Observation and Remote Sensing Applications, EORSA 2018, Xi’an, China, 18–20 June 2018. [Google Scholar] [CrossRef]
  4. Różański, Z.; Konior, J.; Balcarczyk, L. Testing the in situ bulk density of mining waste stored in dumping grounds. Pol. J. Environ. Stud. 2019, 28, 1347–1354. [Google Scholar] [CrossRef]
  5. Kociuba, W.; Kubisz, W.; Zagórski, P. Use of terrestrial laser scanning (TLS) for monitoring and modelling of geomorphic processes and phenomena at a small and medium spatial scale in Polar environment (Scott River—Spitsbergen). Geomorphology 2014, 212, 84–96. [Google Scholar] [CrossRef]
  6. Kociuba, W.; Janicki, G. Continuous measurements of bedload transport rates in a small glacial river catchment in the summer season (Spitsbergen). Geomorphology 2014, 212, 58–71. [Google Scholar] [CrossRef]
  7. Liu, Q. Remote sensing technologies in rock mass characterization. In Rock Characterisation, Modelling and Engineering Design Methods; Feng, X.-T., Hudson, J.A., Tan, F., Eds.; Taylor & Francis Group: London, UK, 2013; ISBN 978-1-138-00057-5. [Google Scholar]
  8. Rieke-Zapp, D.; Rosenbauer, R.; Schlunegger, F. A Photogrammetric surveying method for field applications. Photogramm. Rec. 2009, 24, 5–22. [Google Scholar] [CrossRef]
  9. Riquelme, A.J.; Abellán, A.; Tomás, R. Discontinuity spacing analysis in rock masses using 3D point clouds. Eng. Geol. 2015, 195, 185–195. [Google Scholar] [CrossRef] [Green Version]
  10. Fais, S.; Cuccuru, F.; Casula, G.; Bianchi, M.; Ligas, P. Characterization of rock samples by a high-resolution multi-technique non-invasive approach. Minerals 2019, 9, 664. [Google Scholar] [CrossRef] [Green Version]
  11. Blistan, P.; Kovanič, Ľ.; Patera, M.; Hurčík, T. Evaluation quality parameters of DEM generated with low-cost UAV photogrammetry and Structure-from-Motion (SfM) approach for topographic surveying of small areas. Acta Montan. Slovaca 2019, 24, 198–212. [Google Scholar]
  12. Feteke, S.; Diederichs, M. Integration of three-dimensional laser scanning with discontinuum modelling for stability analysis of tunnels in blocky rockmasses. Int. J. Rock Mech. Min. Sci. 2013, 57, 11–23. [Google Scholar] [CrossRef]
  13. Vanhaekendover, H.; Lindenbergh, R.; Ngan-Tillard, D. Deterministic in-situ block size estimation using 3D terrestrial laser data. In Rock Engineering and Rock Mechanics: Structures in and on Rock Masses; Alejano, R., Perucho, A., Olalla, C., Jiménez, R., Eds.; Taylor & Francis Group: London, UK, 2014; ISBN 978-1-138-00149-7. [Google Scholar]
  14. Assali, P.; Grussenmeyer, P.; Villemin, T.; Pollet, N.; Viguier, F. Surveying and modeling of rock discontinuities by terrestrial laser scanning and photogrammetry: Semi-automatic approaches for linear outcrop inspection. J. Struct. Geol. 2014, 66, 102–114. [Google Scholar] [CrossRef]
  15. Monsalve, J.J.; Baggett, J.; Bishop, R.; Ripepi, N. Application of laser scanning for rock mass characterization and discrete fracture network generation in an underground limestone mine. Int. J. Min. Sci. Technol. 2019, 29, 131–137. [Google Scholar] [CrossRef]
  16. Shen, Y.; Wang, J.; Lindenbergh, R.; Hofland, B.; Ferreira, V.G. Range image technique for change analysis of rock slopes using dense point cloud data. Remote Sens. 2018, 10, 1792. [Google Scholar] [CrossRef] [Green Version]
  17. Blistan, P.; Kovanič, Ľ.; Zelizňaková, V.; Palková, J. Using UAV photogrammetry to document rock outcrops. Acta Montan. Slovaca 2016, 21, 154–161. [Google Scholar]
  18. Gallay, M.; Hochmuth, Z.; Kaňuk, J.; Hofierka, J. Geomorphometric analysis of cave ceiling channels mapped with 3-D terrestrial laser scanning. Hydrol. Earth Syst. Sci. 2016, 20, 1827–1849. [Google Scholar] [CrossRef] [Green Version]
  19. Hofierka, J.; Gallay, M.; Kaňuk, J.; Šašak, J. Modelling karst landscape with massive airborne and terrestrial laser scanning data. In The Rise of Big Spatial Data. Lecture Notes in Geoinformation and Cartography; Ivan, I., Singleton, A., Horák, J., Inspektor, T., Eds.; Springer: Cham, Switzerland, 2017. [Google Scholar]
  20. Fraštia, M.; Liščák, P.; Žilka, A.; Pauditš, P.; Bobáľ, P.; Hronček, S.; Sipina, S.; Ihring, P.; Marčiš, M. Mapping of debris flows by the morphometric analysis of DTM: A case study of the Vrátna dolina Valley, Slovakia. Geografický Časopis. Geogr. J. 2019, 71, 101–120. [Google Scholar] [CrossRef]
  21. Moudrý, V.; Gdulová, K.; Fogl, M.; Klápště, P.; Urban, R.; Komárek, J.; Moudrá, L.; Štroner, M.; Barták, V.; Solský, M. Comparison of leaf-off and leaf-on combined UAV imagery and airborne LiDAR for assessment of a post-mining site terrain and vegetation structure: Prospects for monitoring hazards and restoration success. Appl. Geogr. 2019, 104, 32–41. [Google Scholar] [CrossRef]
  22. Rusnák, M.; Sládek, J.; Kidová, A.; Lehotský, M. Template for high-resolution river landscape mapping using UAV technology. Measurement 2018, 115, 139–151. [Google Scholar] [CrossRef]
  23. Catalucci, S.; Marsili, R.; Moretti, M.; Rossi, G. Comparison between point cloud processing techniques. Measurement 2018, 127, 221–226. [Google Scholar] [CrossRef]
  24. Fraštia, M.; Marčiš, M.; Bednarik, M.; Holzer, R. Príklad kombinovaného leteckého a terestrického laserového skenovania na účely inžinierskogeologických analýz. Slovenský Geod. Kartogr. 2019, 24, 14–17. [Google Scholar]
  25. Mill, T.; Alt, A.; Liias, R. Combined 3D building surveying techniques—Terrestrial laser scanning (TLS) and total station surveying for BIM data management purposes. J. Civ. Eng. Manag. 2014, 19, 23–32. [Google Scholar] [CrossRef]
  26. Janowski, A.; Nagrodzka-Godycka, K.; Szulwic, J.; Ziolkowski, P. Remote sensing and photogrammetry techniques in diagnostics of concrete structures. Comput. Concr. 2016, 18, 405–420. [Google Scholar] [CrossRef] [Green Version]
  27. Jiang, H.; Li, Q.; Jiao, Q.; Wang, X.; Wu, L. Extraction of wall cracks on earthquake-damaged buildings based on TLS point clouds. IEEE J. Sel. Top. Appl. Earth Obs. Remote Sens. 2018, 11, 3088–3096. [Google Scholar] [CrossRef]
  28. Nuttens, T.; Stal, C.; De Backer, H.; Schotte, K.; Van Bogaert, P.; De Wulf, A. Methodology for the ovalization monitoring of newly built circular train tunnels based on laser scanning: Liefkenshoek Rail Link (Belgium). Autom. Constr. 2014, 43, 1–9. [Google Scholar] [CrossRef]
  29. Malowany, K.; Magda, K.; Rutkiewicz, J.; Malesa, M.; Kantor, J.; Michoński, J.; Kujawińska, M. Measurements of geometry of a boiler drum by time-of-flight laser scanning. Measurement 2015, 72, 88–95. [Google Scholar] [CrossRef]
  30. Riveiro, B.; González-Jorge, H.; Varela, M.; Jauregui, D.V. Validation of terrestrial laser scanning and photogrammetry techniques for the measurement of vertical underclearance and beam geometry in structural inspection of bridges. Measurement 2013, 46, 784–794. [Google Scholar] [CrossRef]
  31. Zuberec, J.; Tréger, M.; Lexa, J.; Baláž, P. Nerastné Suroviny Slovenska; Štátny geologický ústav Dionýza Štúra: Bratislava, Slovakia, 2005; pp. 232–234. [Google Scholar]
  32. ISO. Soil quality—Determination of particle density. 2017. Available online: https://www.iso.org/standard/68257.html (accessed on 23 October 2019).
  33. Westoby, M.; Brasington, J.; Glasser, N.; Hambrey, M.; Reynolds, J. ‘Structure-from-Motion’ photogrammetry: A low-cost, effective tool for geoscience applications. Geomorphology 2012, 179, 300–314. [Google Scholar] [CrossRef] [Green Version]
  34. Theia-sfm.org. Structure from Motion (SfM)—Theia Vision Library. 2019. Available online: http://theia-sfm.org/sfm.html (accessed on 11 December 2019).
  35. Luhmann, T.; Robson, S.; Kyle, S.; Boehm, J. Close-Range Photogrammetry and 3D Imaging, 2nd ed.; Walter de Gruyter GmbH: Berlin, Germany; Boston, MA, USA, 2014; ISBN 978-3-11-030269-1. [Google Scholar]
  36. Urban, R.; Štroner, M.; Blistan, P.; Kovanič, Ľ.; Patera, M.; Jacko, S.; Ďuriška, I.; Kelemen, M.; Szabo, S. The suitability of UAS for mass movement monitoring caused by Torrential Rainfall—A study on the Talus Cones in the Alpine Terrain in High Tatras, Slovakia. ISPRS Int. J. Geo-Inf. 2019, 8, 317. [Google Scholar] [CrossRef] [Green Version]
  37. Peña-Villasenín, S.; Gil-Docampo, M.; Ortiz-Sanz, J. Professional SfM and TLS vs a simple SfM photogrammetry for 3D modelling of rock art and radiance scaling shading in engraving detection. J. Cult. Herit. 2019, 37, 238–246. [Google Scholar] [CrossRef]
  38. Bremer, M.; Sass, O. Combining airborne and terrestrial laser scanning for quantifying erosion and deposition by a debris flow event. Geomorphology 2012, 138, 49–60. [Google Scholar] [CrossRef]
Figure 1. Location of the perlite deposit Lehôtka pod Brehmi (Slovakia).
Minerals 10 00174 g001
Figure 2. Profile 1—Location of point samples LITH-1–LITH-3.
Minerals 10 00174 g002
Figure 3. Profile 2—Location of point samples LITH-4–LITH-6.
Minerals 10 00174 g003
Figure 4. Methodological procedure for the determination of bulk density and loose bulk density by the in situ method.
Minerals 10 00174 g004
Figure 5. Localization of large-scale samples Probe 1 and Probe 2 in the perlite quarry Lehôtka pod Brehmi.
Minerals 10 00174 g005
Figure 6. Collection of the large-scale sample—Probe 1. Before excavation—green left, after excavation—red right.
Minerals 10 00174 g006
Figure 7. Collection of the large-scale sample—Probe 2. Before excavation—green left, after excavation—red right.
Minerals 10 00174 g007
Figure 8. Terrestrial laser scanner Leca ScanStation C10 over a survey station.
Minerals 10 00174 g008
Figure 9. The overall situation of the geodetic survey.
Minerals 10 00174 g009
Figure 10. left—the principle of the SfM photogrammetric method (after [34]); right—imaging stations for SfM processing in the case study.
Minerals 10 00174 g010
Figure 11. Difference model between point cloud from photogrammetric processing and from TLS—Probe 1.
Minerals 10 00174 g011
Figure 12. Measurement of the volume of loosened raw material—perlite from Probe 1 and Probe 2 at the LBK Perlit site using TLS.
Minerals 10 00174 g012
Figure 13. Digital data processing and calculation of the volume of loosened raw material from the large-scale samples Probe 1 and Probe 2 at the LBK Perlit site.
Minerals 10 00174 g013
Table 1. Results of laboratory determination of bulk density from LITH 1–LITH 6 point samples from Profile 1 and Profile 2.
ProfileSample DesignationThe Proportion of Lithotype Represented on the Mining Level (%)Bulk Density (kg∙m−3)
PROFILE 1LITH-1151497
LITH-2251545
LITH-3601436
Average bulk density in Profile 11493
PROFILE 2LITH-4202245
LITH-5252073
LITH-6551742
Average bulk density in Profile 22020
Average bulk density in Profiles 1 and 21756
Table 2. Calculation of average weights of large-scale samples Probe 1 and Probe 2 from measurements on a certified weight bridge (3 weightings of each probe).
Large-Scale Sample MeasurementTruck Weight (kg)Total Weight (kg)Sample Weight (kg)Measuring ToolAverage Sample Weight (kg)
Probe 1113,88027,36013,480Certified weight bridge13,486.6
213,86027,36013,500
313,94027,36013,480
Probe 2113,84030,36016,520Certified weight bridge16,533.3
213,84030,38016,540
313,84030,38016,540
Table 3. Volumes of large-scale samples 1 and 2 determined from TLS and photogrammetric data.
Large-Scale SampleVolume Determined from TLS Measurements (m3)Volume Determined by Alternative Measurement—Photogrammetry (m3)Volume Difference (%)
Probe 17.237.371.9
Probe 29.098.961.4
Table 4. Statistical parameters of photogrammetric imaging and SfM processing.
Parameters of Image ProcessingProbe 1Probe 2
No. of used images4955
Average imaging distances3.7 m3.8 m
No. of tie points 127,00029,000
No. of reconstructed points / resampled for calculation14.5 mil./155,00015 mil./141,000
Ground Sample Distance 20.9 mm1 mm
Maximal error 30.6 pix0.6 pix
Reprojection error 40.31 pix0.3 pix
Accuracy in the reference system 5 (Total error)1 mm1 mm
1 Tie points represent matches between points (referred to also as “key points”) detected on two (or more) different images. 2 Pixel size in object space units. 3 Distance between the point on the image where a reconstructed 3D point can be projected and the original projection of that 3D point detected on the photo and used as a basis for the 3D point reconstruction procedure. 4 Root mean square reprojection error averaged over all tie points on all images. 5 Root mean square error of all the scale bars in the Control/Check section.
Table 5. Volumes of loosened mineral from large-scale samples Probe 1 and Probe 2, determined geodetically from TLS.
Large-Scale SampleThe Volume of the Loosened Large-Scale Sample (m3)
Probe 110.40
Probe 212.18
Table 6. Results of bulk density determination from large-scale samples in situ.
Large-Scale SampleVolume of Large-Scale Sample (m3)Weight of Large-Scale Sample (kg)Bulk Density Determined in Situ (kg.m−3)
Probe 17.2313,486.61865
Probe 29.0916,533.31818
Average bulk density determined from large-scale samples1841
Table 7. Results of loose bulk density in situ determination on large-scale samples.
Large-Scale SampleThe Volume of the Loosened Large-Scale Sample (m3)Weight of Large-Scale Sample (kg)Loose Bulk Density Determined in Situ (kg∙m−3)
Probe 110.4013,486.61297
Probe 212.1816,533.31357
Average loose bulk density determined from large-scale samples1327
Table 8. Comparison of the bulk density of the raw material in the area of interest of the deposit, determined by the laboratory and the in situ method.
Bulk Density Determined in the Laboratory (kg∙m−3)Bulk Density Determined by in Situ Method (kg∙m−3)Difference
175618414.5%