XRD Identification of Ore Minerals during Cruises: Refinement of Extraction Procedure with Sodium Acetate Buffer

 , , , and
Abstract

1. Introduction
2. Materials and Methods
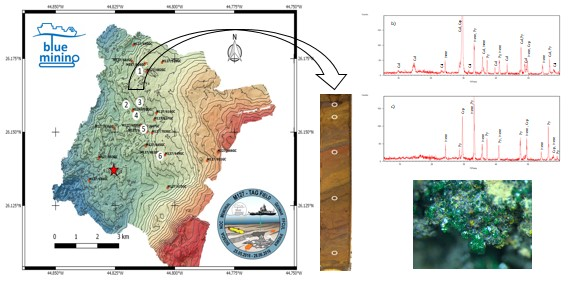
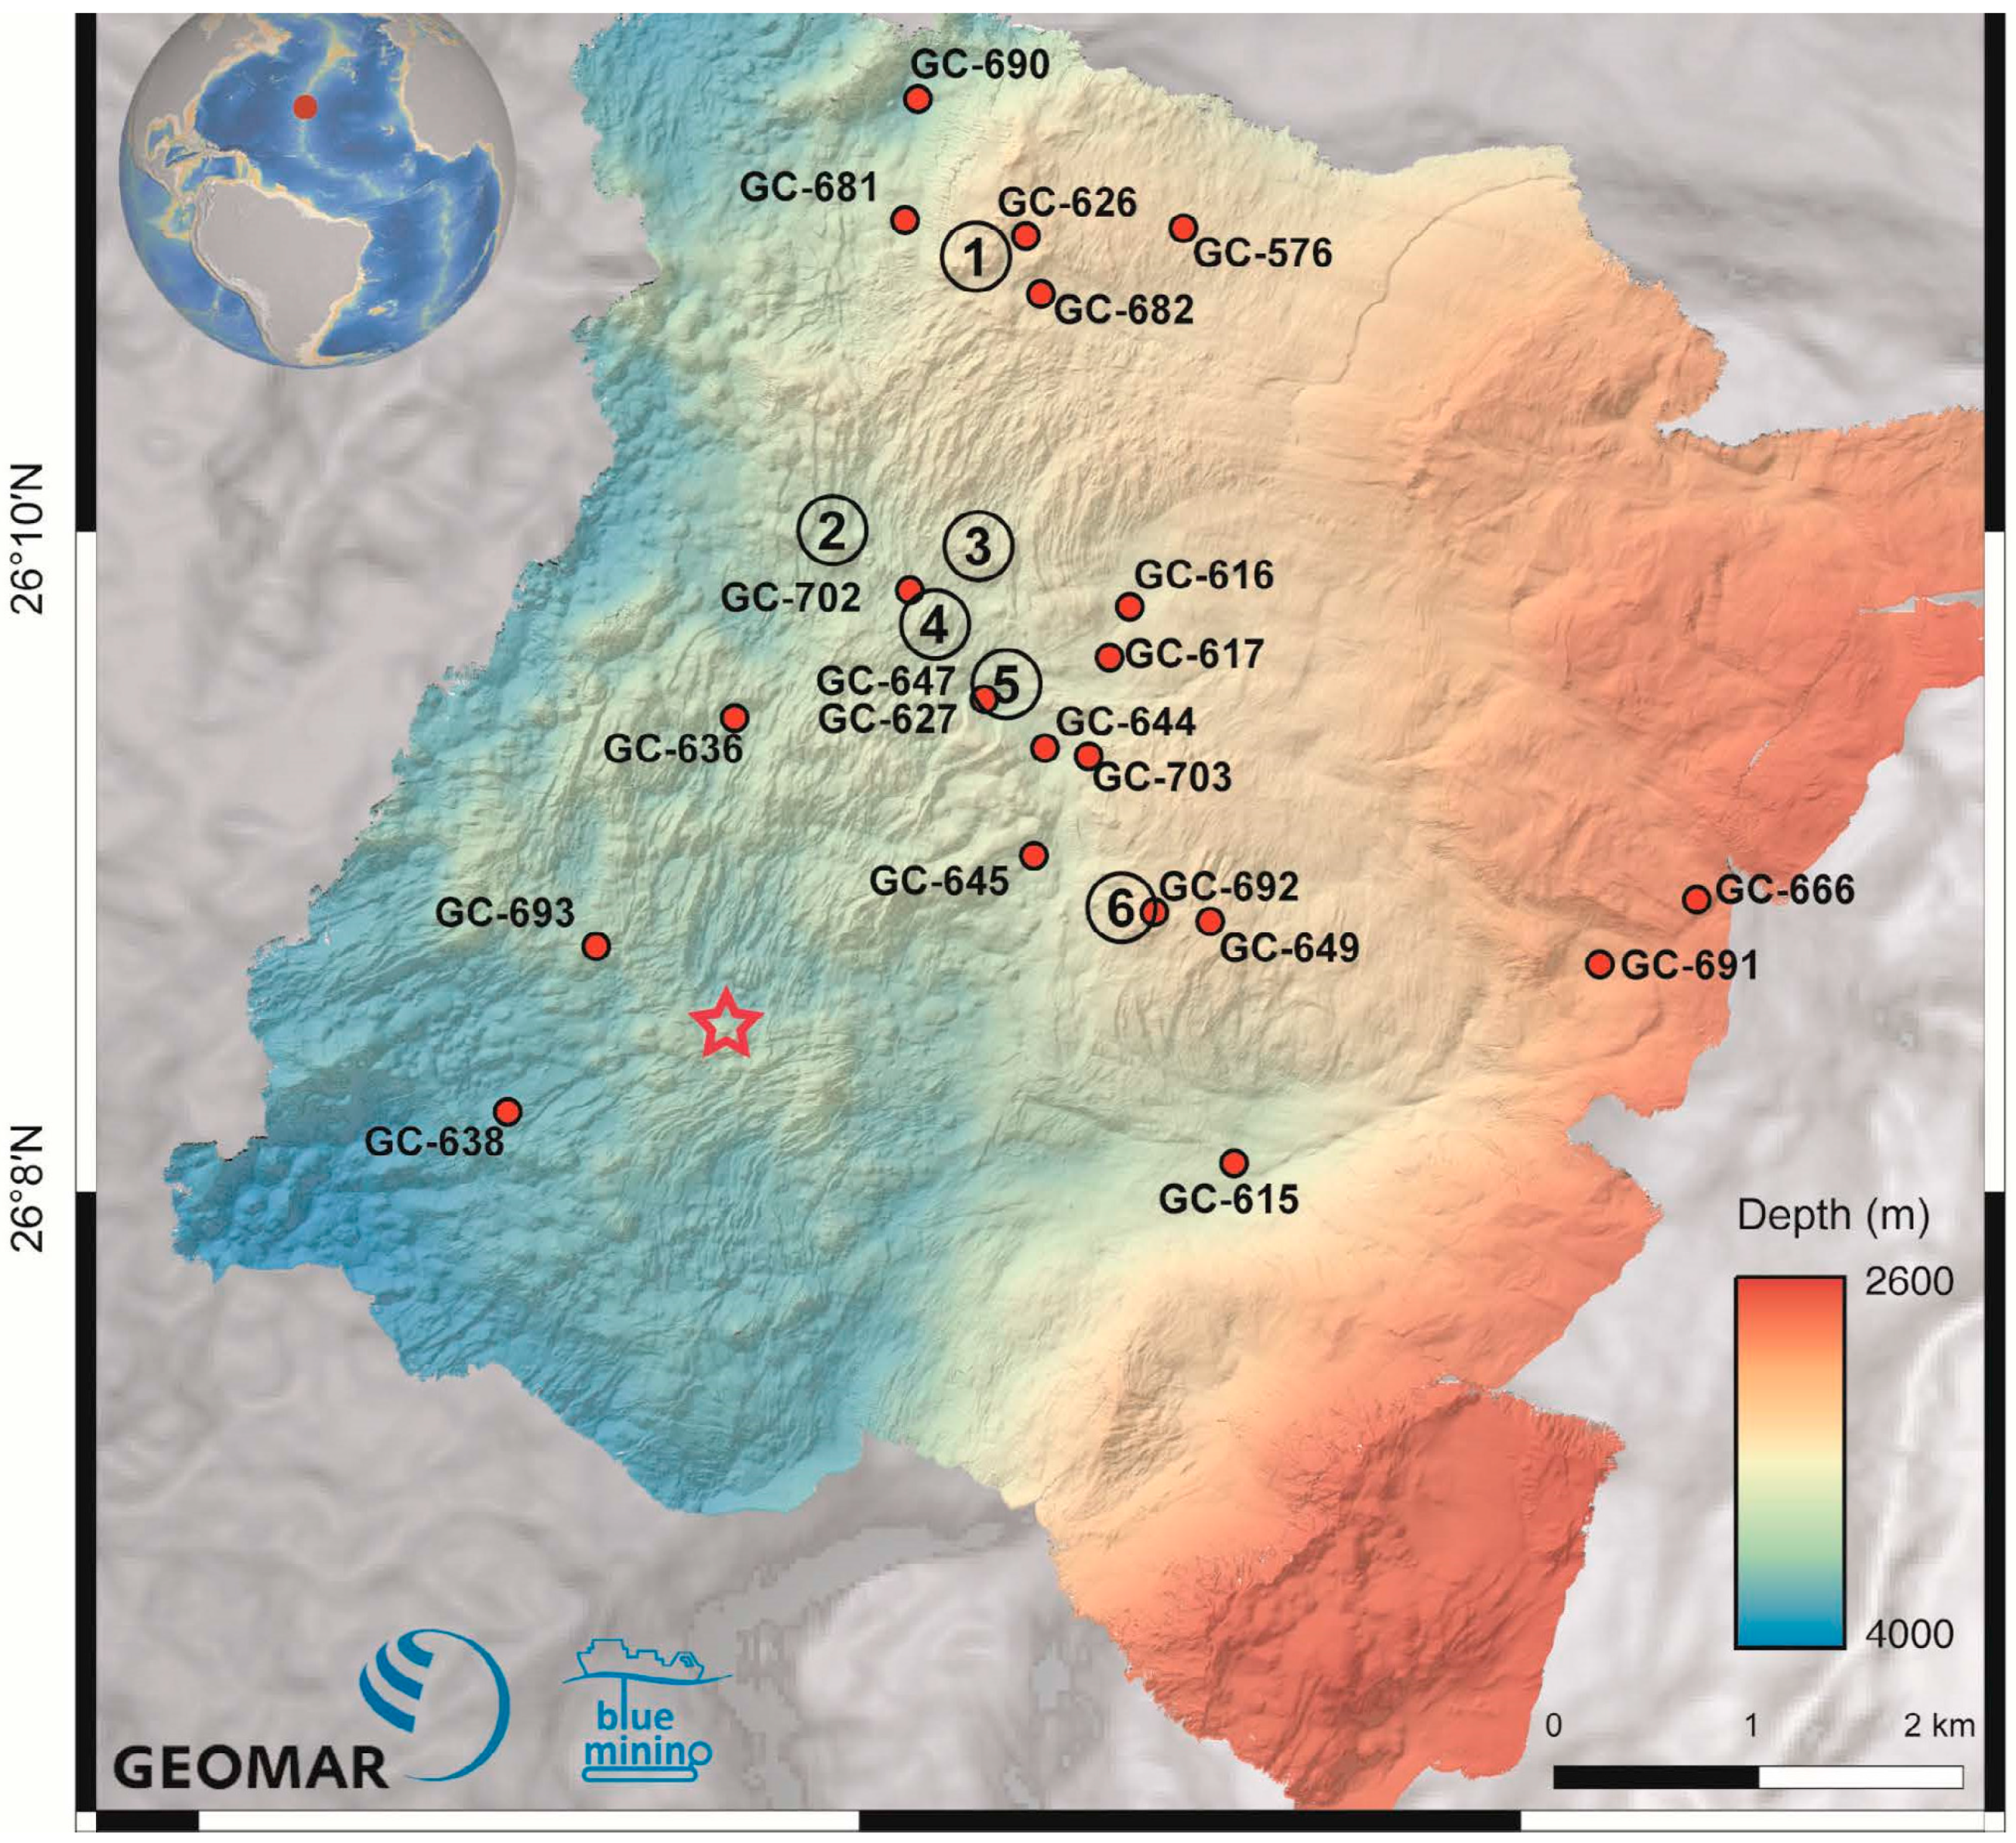
2.1. Sample Collection and Labeling
2.2. Sample Monitoring and Pre-Treatment
2.3. Sequential Extraction of Carbonates
2.4. XRD Analysis of Seafloor Sediment Samples
2.5. Quality Control
2.5.1. Optimization of Extraction Method for Removing Calcite
2.5.2. Validation of Mineral Identification
2.6. Time Constraints Related to Identification of Minerals during Cruises
3. Results and Discussion
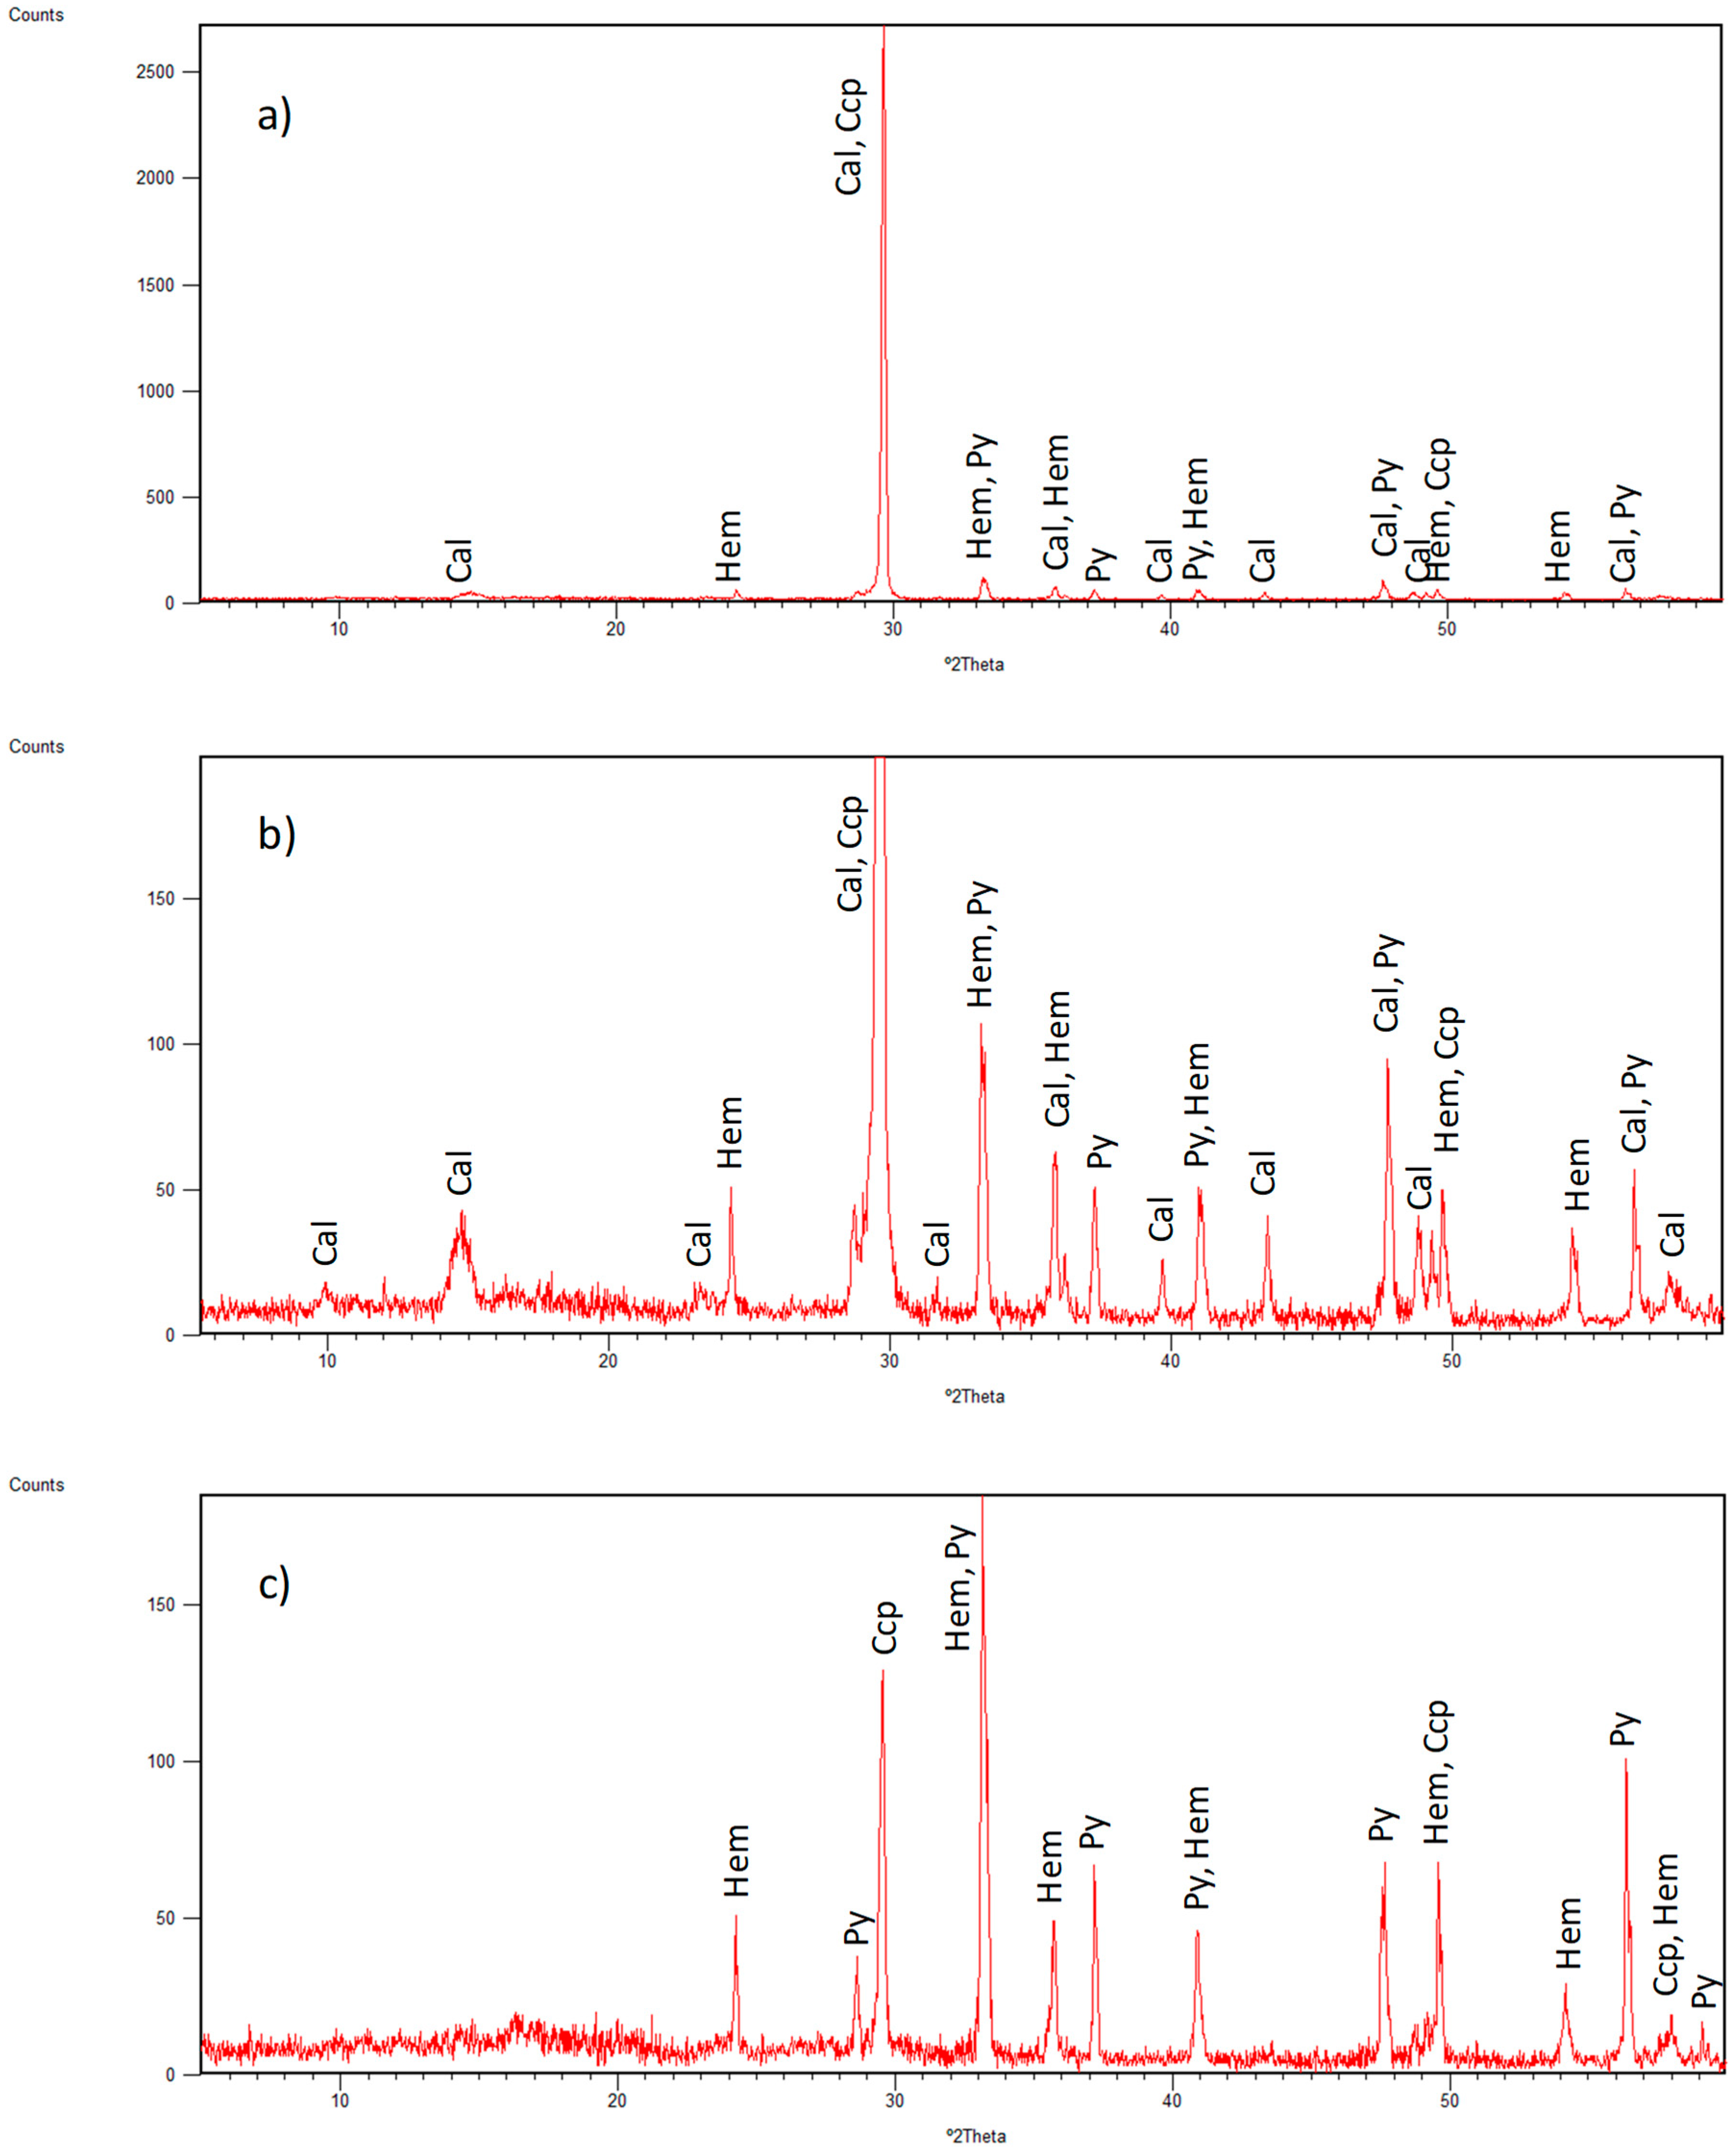
3.1. Identified Mineral Phases in Carbonated Sediment Samples
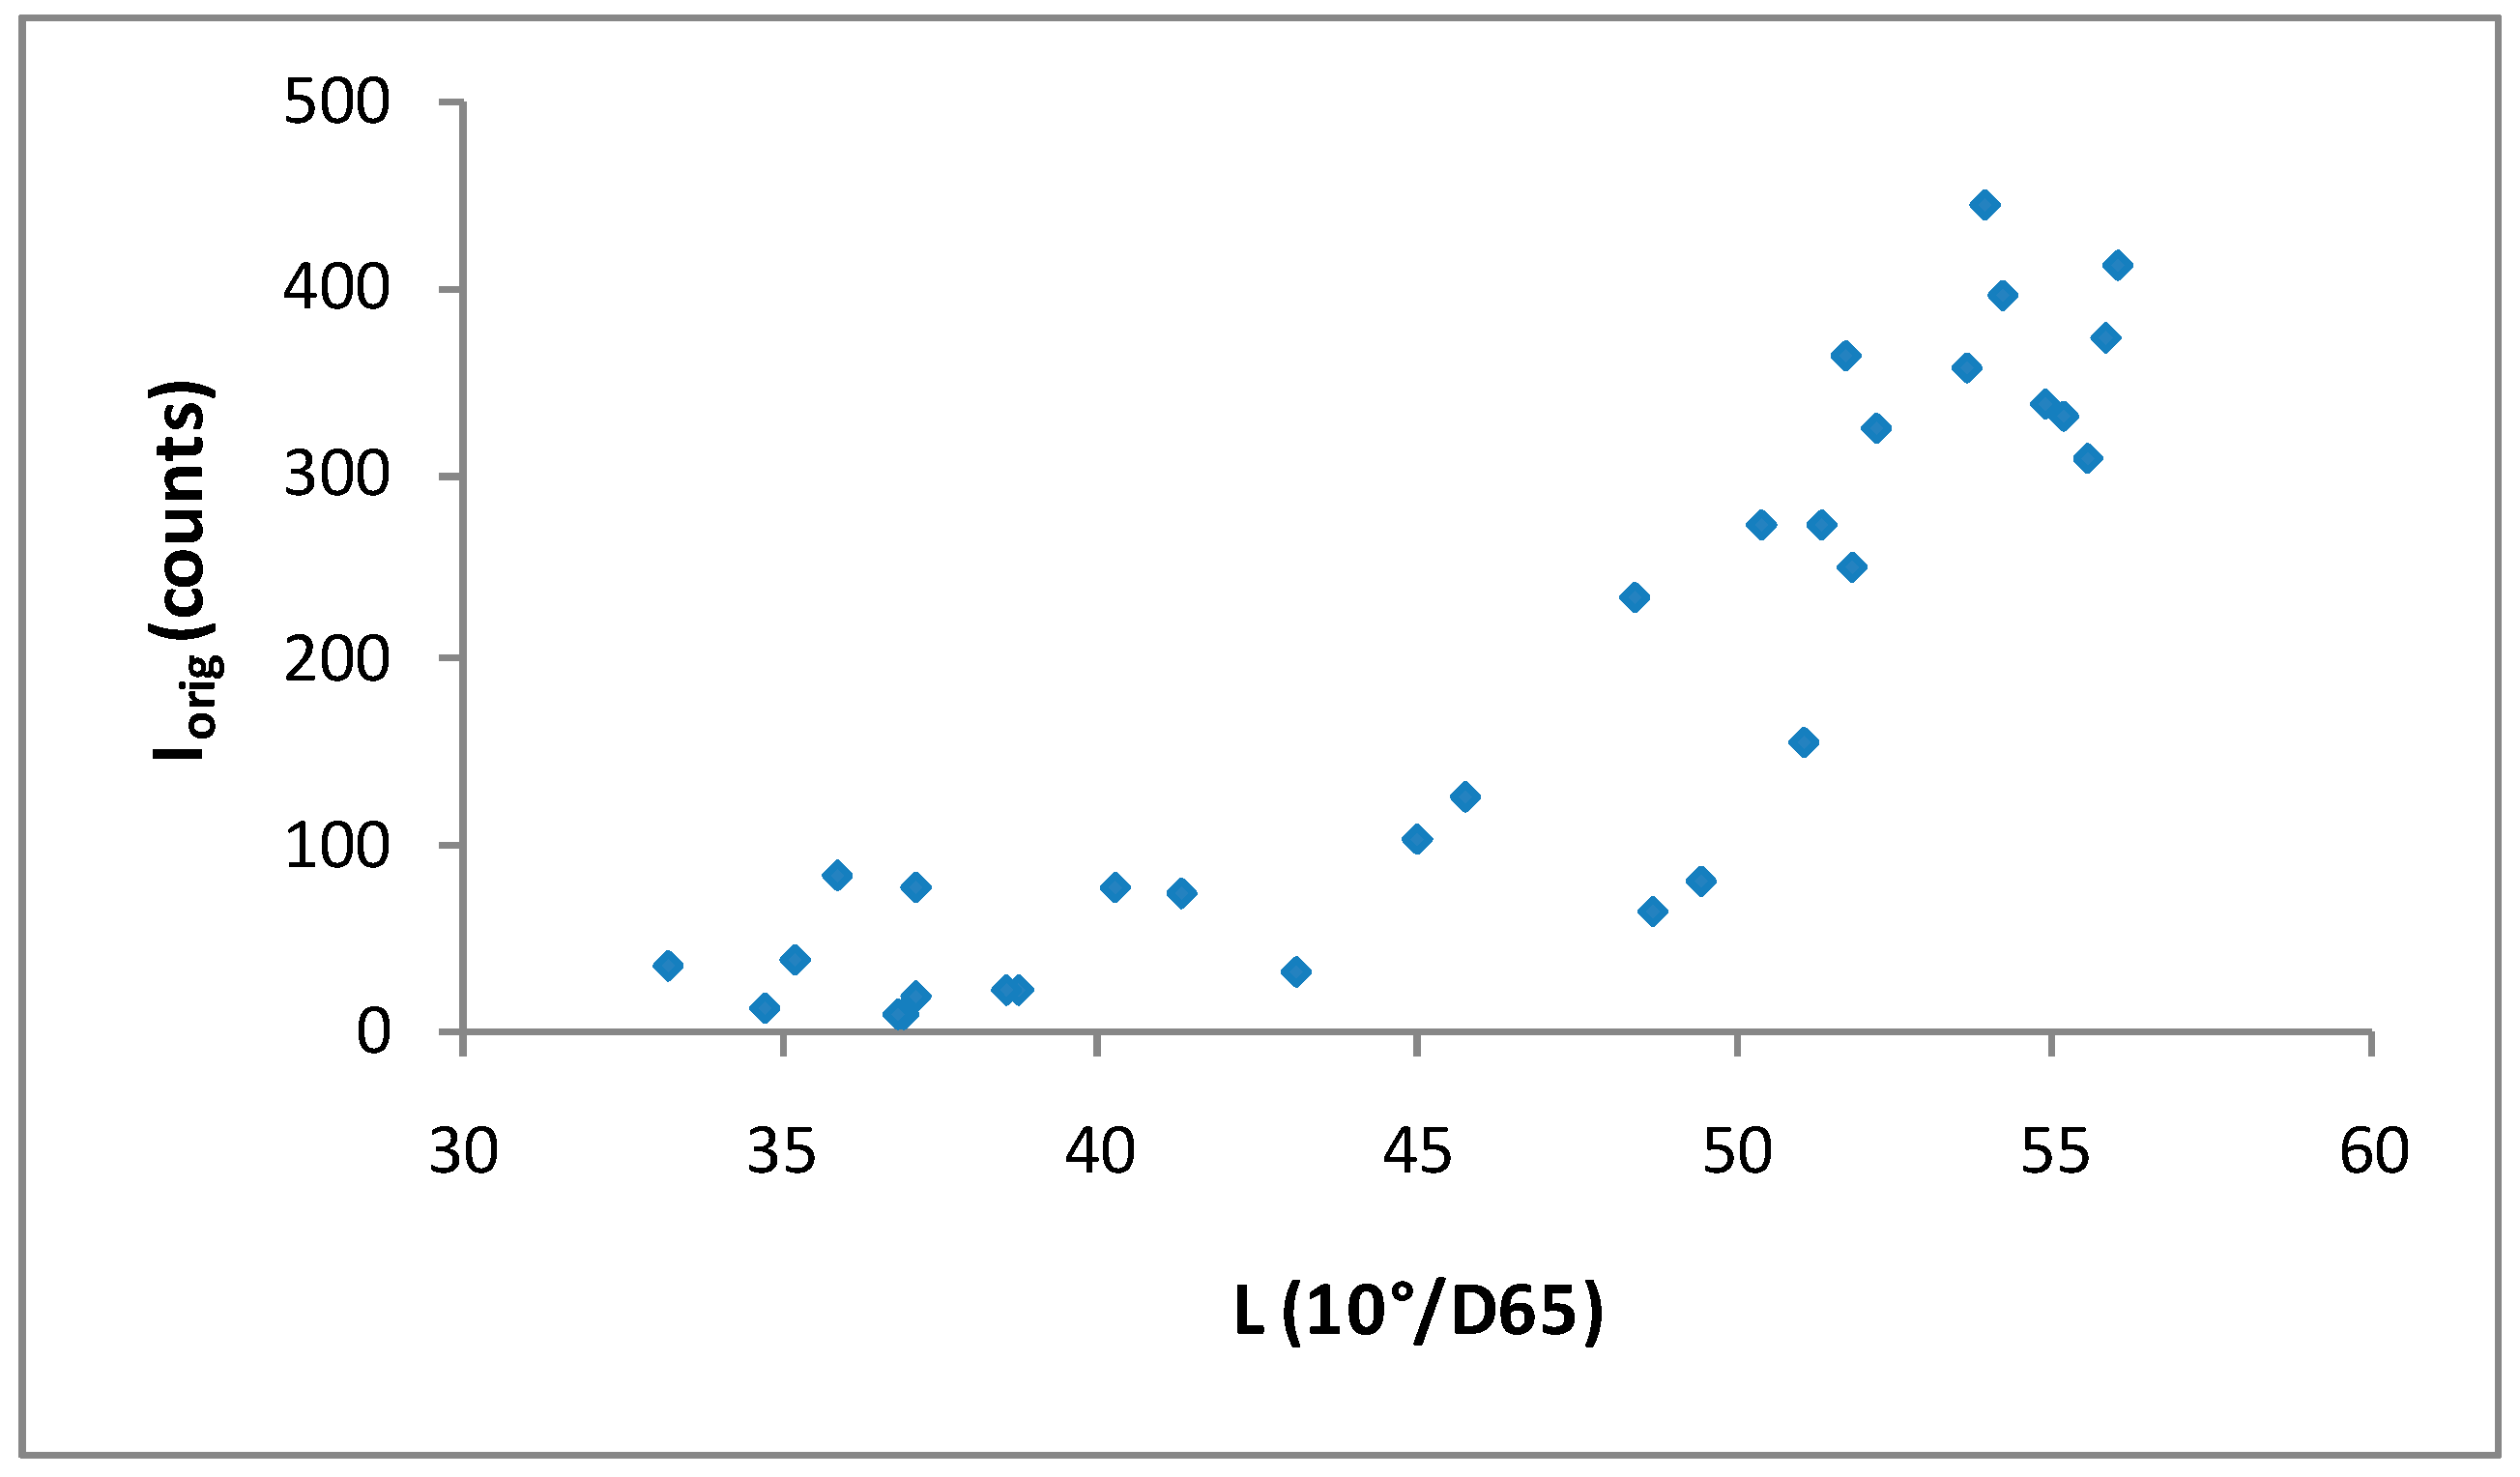
3.2. Correlation between XRD Intensity of Calcite and Lightness
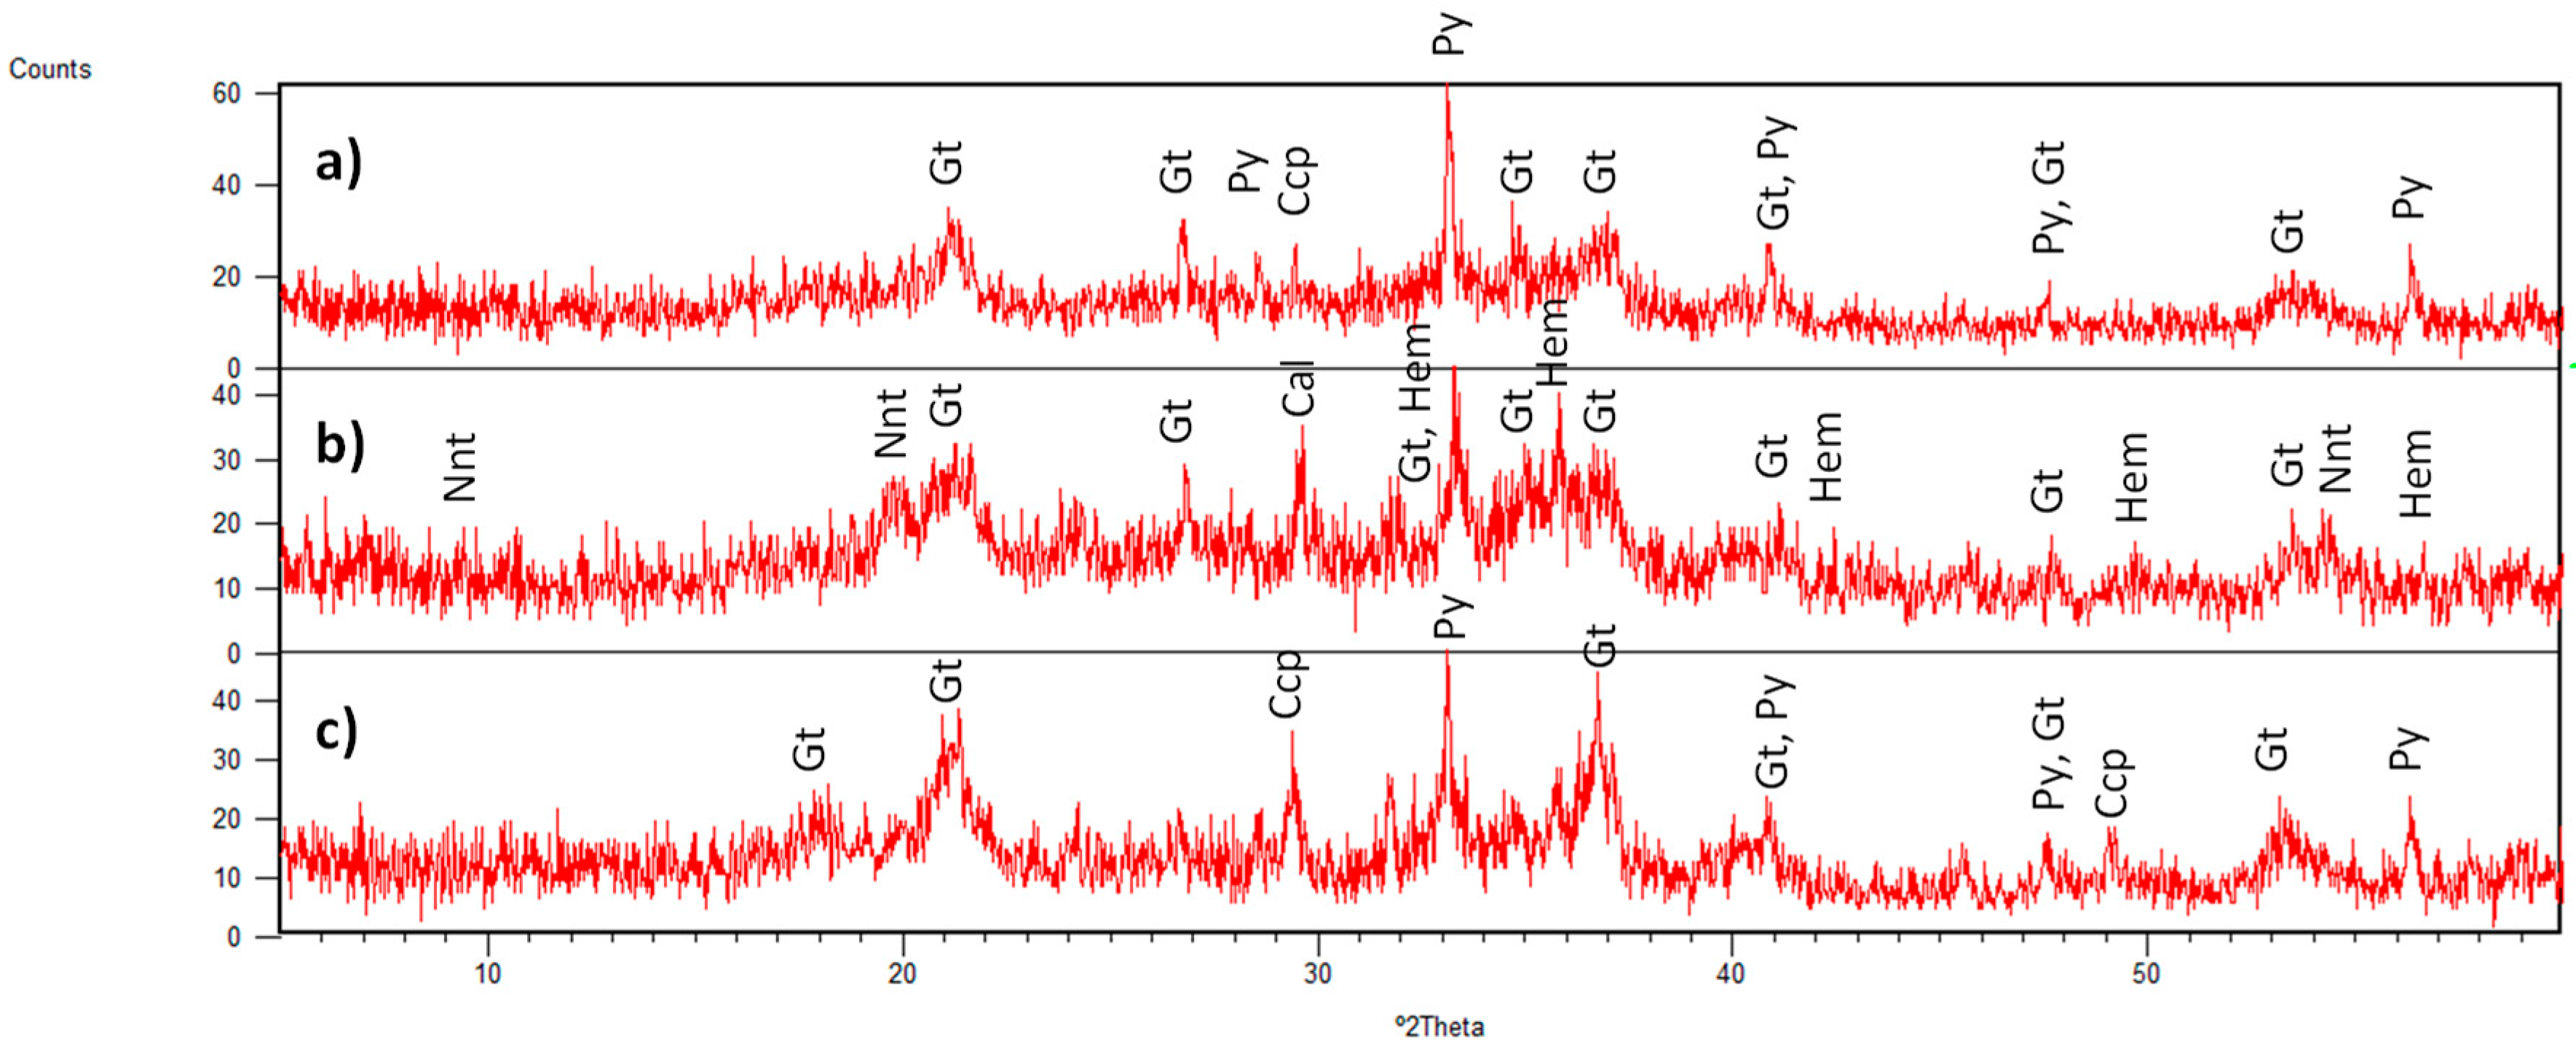
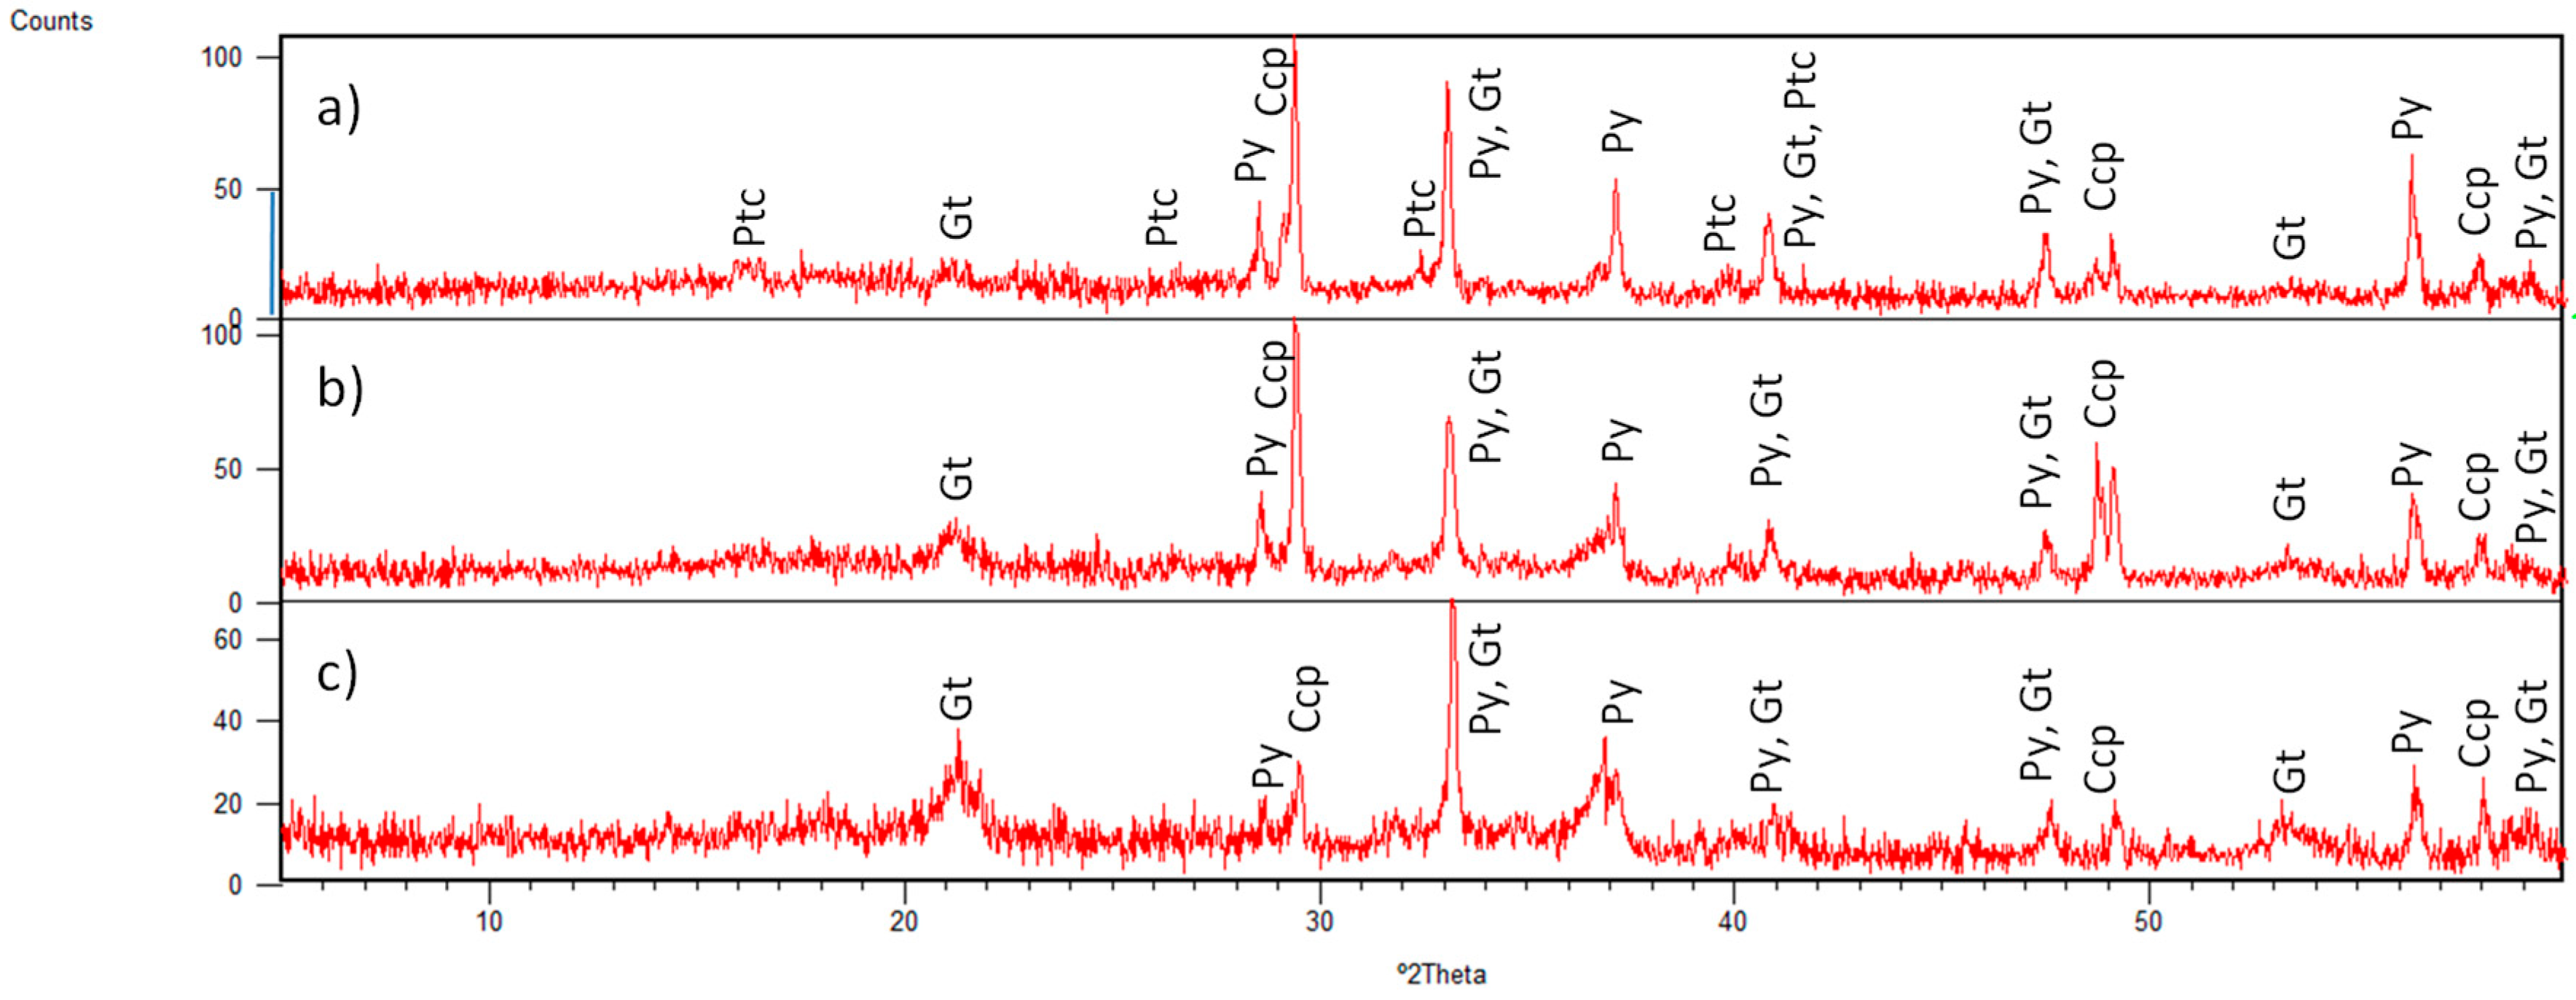
3.3. Mineral Phases Identified in Hydrothermal Samples
3.4. Overview of Mineral Distribution in Sediment Cores at the TAG Field
4. Conclusions
Supplementary Materials
Author Contributions
Funding
Acknowledgments
Conflicts of Interest
References
- Barriga, F.J.A.S. Can recycling and the circular economy render seafloor mining unnecessary? In Economical, Technological and Environmental Aspects: Cooperative Solutions for Future Deep-sea Mining; UMC, Federation of German Industries (BDI): Berlin, Germany, 2017. [Google Scholar]
- Rona, P.A.; Klinkhammer, G.; Nelsen, T.A.; Trefry, J.H.; Elderfield, H. Black smokers, massive sulphides and vent biota at the Mid-Atlantic Ridge. Nature 1986, 321, 33–37. [Google Scholar] [CrossRef]
- Tivey, M.A.; Schouten, H.; Kleinrock, M.C. A near-bottom magnetic survey of the Mid-Atlantic Ridge axis at 26° N: Implications for the tectonic evolution of the TAG segment. J. Geophys. Res. Space Phys. 2003, 108, 2277. [Google Scholar] [CrossRef]
- DeMartin, B.J.; Sohn, R.A.; Canales, J.P.; Humphris, S.E. Kinematics and geometry of active detachment faulting beneath the Trans-Atlantic Geotraverse (TAG) hydrothermal field on the Mid-Atlantic Ridge. Geology 2007, 35, 711–714. [Google Scholar] [CrossRef]
- Canales, J.P.; Sohn, R.A.; DeMartin, B.J. Crustal structure of the Trans-Atlantic Geotraverse (TAG) segment (Mid-Atlantic Ridge, 26°10′N): Implications for the nature of hydrothermal circulation and detachment faulting at slow spreading ridges. Geochem. Geophys. Geosystems 2007, 8, 1–18. [Google Scholar] [CrossRef]
- Fouquet, Y.; Cambon, P.; Etoubleau, J.; Charlou, J.L.; Ondréas, H.; Barriga, F.J.A.S.; Cherkashov, G.; Semkova, T.; Poroshina, I.; Bohn, M.; et al. Geodiversity of hydrothermal processes along the Mid-Atlantic Ridge and ultramafic-hosted mineralization: A new type of oceanic Cu-Zn-Co-Au volcanogenic massive sulfide deposit. Sea Ice 2010, 188, 321–367. [Google Scholar] [CrossRef]
- Rona, P.A.; Hannington, M.D.; Raman, C.V.; Thompson, G.; Tivey, M.K.; Humphris, S.E.; Lalou, C.; Petersen, S. Active and relict sea-floor hydrothermal mineralization at the TAG hydrothermal field, Mid-Atlantic Ridge. Econ. Geol. 1993, 88, 1989–2017. [Google Scholar] [CrossRef]
- White, S.N.; Humphris, S.E.; Kleinrock, M.C. New Observations on the Distribution of Past and Present Hydrothermal Activity in the TAG Area of the Mid-Atlantic Ridge (26°08′ N). Mar. Geophys. Res. 1998, 20, 41–56. [Google Scholar] [CrossRef]
- Dekov, V.; Damyanov, Z.; Kamenov, G.; Bonev, I.; Bogdanov, K. Native copper and α-copper–zinc in sediments from the TAG hydrothermal field (Mid-Atlantic Ridge, 26°N): nature and origin. Mar. Geol. 1999, 161, 229–245. [Google Scholar] [CrossRef]
- Thompson, G.; Mottl, M.J.; Rona, P.A. Morphology, mineralogy and chemistry of hydrothermal deposits from the TAG area, 26°N Mid-Atlantic Ridge. Chem. Geol. 1985, 49, 243–257. [Google Scholar] [CrossRef]
- Mills, R.A.; Wells, D.M.; Roberts, S. Genesis of ferromanganese crusts from the TAG hydrothermal field. Chem. Geol. 2001, 176, 283–293. [Google Scholar] [CrossRef]
- Humphris, S.E.; Tivey, M.K.; Tivey, M.A. The Trans-Atlantic Geotraverse hydrothermal field: A hydrothermal system on an active detachment fault. Deep. Sea Res. Part II Top. Stud. Oceanogr. 2015, 121, 8–16. [Google Scholar] [CrossRef]
- Severmann, S.; Mills, R.A.; Palmer, M.R.; Fallick, A.E. The origin of clay minerals in active and relict hydrothermal deposits. Geochim. et Cosmochim. Acta 2004, 68, 73–88. [Google Scholar] [CrossRef]
- Linke, P.; Lackschewitz, K. Autonomous Underwater Vehicle “ABYSS”. JLSRF 2016, 2, 79. [Google Scholar] [CrossRef]
- Petersen, S. RV METEOR Fahrtbericht/Cruise Report M127 Metal fluxes and Resource Potential at the Slow-spreading TAG Midocean Ridge Segment (26° N, MAR)—Blue Mining@Sea, Bridgetown (Barbados)–Ponta Delgada (Portugal), 25.05.–28.06. 2016 (Extended Version); Berichte aus dem GEOMAR Helmholtz-Zentrum für Ozeanforschung Kiel: Kiel, Germany, 2016. [Google Scholar] [CrossRef]
- Środoń, J.; Drits, V.A.; McCarty, D.K.; Hsieh, J.C.C.; Eberl, D.D. Quantitative X-ray diffraction analysis of clay-bearing rocks from random preparations. Clays Clay Miner. 2001, 49, 514–528. [Google Scholar] [CrossRef]
- Tessier, A.; Campbell, P.G.C.; Bisson, M. Sequential Extraction Procedure for the Speciation of Particulate Trace Metals. Anal. Chem. 1979, 51, 844–851. [Google Scholar] [CrossRef]
- Dias, Á.S.; Früh-Green, G.L.; Bernasconi, S.M.; Barriga, F.J.A.S. Geochemistry and stable isotope constraints on high-temperature activity from sediment cores of the Saldanha hydrothermal field. Mar. Geol. 2011, 279, 128–140. [Google Scholar] [CrossRef]
- Dias, Á.S.; Mills, R.A.; Ribeiro da Costa, I.; Costa, R.; Taylor, R.N.; Cooper, M.J.; Barriga, F.J.A.S. Tracing fluid–rock reaction and hydrothermal circulation at the Saldanha hydrothermal field. Chem. Geol. 2010, 273, 168–179. [Google Scholar] [CrossRef]
- Carvalho, C.M.N.; Barriga, F.J.A.S. Preliminary report on the mineralogical detailed study at the alterations zones surrounding the Feitais VMS ore body (Aljustrel, Portugal, IPB). In Proceedings of the International Conference and Field Meeting on Volcanic environments and Massive Sulfide Deposits, CODES Special Publication, Tasmania, Australia, 16–19 November 2000; Volume 3, pp. 19–21. [Google Scholar]
- Dias, Á.S.; Barriga, F.J.A.S. Mineralogy and geochemistry of hydrothermal sediments from the serpentinite-hosted Saldanha hydrothermal field (36°34′N; 33°26′W) at MAR. Mar. Geol. 2006, 225, 157–175. [Google Scholar] [CrossRef]
- Alt, J.C.; Lonsdale, P.; Haymon, R.; Muehlenbachs, K. Hydrothermal sulfide and oxide deposits on seamounts near 21° N, East Pacific Rise. Geol. Soc. Am. Bull. 1987, 98, 157–168. [Google Scholar] [CrossRef]
- Dekov, V.; Boycheva, T.; Hålenius, U.; Petersen, S.; Billström, K.; Stummeyer, G.; Shanks, W. Atacamite and paratacamite from the ultramafic-hosted Logatchev seafloor vent field (14º45′ N, Mid-Atlantic Ridge). Chem. Geol. 2011, 286, 169–184. [Google Scholar] [CrossRef]
- Barriga, F.J.A.S.; Munhá, J.; Fyfe, W.S.; Vibetti, J.; Kerrich, R. Sub Seafloor Metamorphism Down to Moho Depths at Troodos, Cyprus, Symposium Troodos 87; Ophiolites and Oceanic Lithosphere: Nicósia, Cyprus, 1987; p. 134. [Google Scholar]
- Gu, C.; Vanko, D.A. Nature of fluid inclusions in samples of the deep sheeted dikes cored during Leg 148 (Hole 504B). In Proceedings of the Ocean Drilling Program, Scientific Results; Alt, J.C., Kinoshita, H., Stokking, L.B., Michael, P.J., Eds.; Ocean Drilling Program: College Station, TX, USA, 1996; Volume 148, pp. 87–95. [Google Scholar] [CrossRef]
- Honnorez, J. Hydrothermal alteration vs. ocean-floor metamorphism. A comparison between two case histories: the TAG hydrothermal mound (Mid-Atlantic Ridge) vs. DSDP/ODP Hole 504B (Equatorial East Pacific). Comptes Rendus Geosci. 2003, 335, 781–824. [Google Scholar] [CrossRef]
- Debret, M.; Sebag, D.; Desmet, M.; Balsam, W.; Copard, Y.; Mourier, B.; Susperrigui, A.-S.; Arnaud, F.; Bentaleb, I.; Chapron, E.; et al. Spectrocolorimetric interpretation of sedimentary dynamics: The new “Q7/4 diagram”. Earth-Science Rev. 2011, 109, 1–19. [Google Scholar] [CrossRef]
- Mix, A.C.; Harris, S.E.; Janecek, T.R. Estimating lithology from nonintrusive reflectance spectra: ODP Leg 138. In Proceedings of the Ocean Drilling Program: Scientific Results/138; Pisias, N.G., Mayer, L.A., Janecek, T.R., Palmer-Julson, A., van Andel, T.H., Eds.; Ocean Drilling Program: College Station, TX, USA, 1995; pp. 413–428. [Google Scholar]
- Balsam, W.L.; Deaton, B.C.; Damuth, J.E. Evaluating optical lightness as a proxy for carbonate content in marine sediment cores. Mar. Geol. 1999, 161, 141–153. [Google Scholar] [CrossRef]
- Hannington, M.D. The formation of atacamite during weathering of sulfides on the modern seafloor. Can. Mineral. 1993, 31, 945–956. [Google Scholar]
- Dekov, V.M.; Kamenov, G.D.; Savelli, C.; Stummeyer, J.; Thiry, M.; Shanks, W.C.; Willingham, A.L.; Boycheva, T.B.; Rochette, P.; Kuzmann, E.; et al. Metalliferous sediments from Eolo Seamount (Tyrrhenian Sea): Hydrothermal deposition and re-deposition in a zone of oxygen depletion. Chem. Geol. 2009, 264, 347–363. [Google Scholar] [CrossRef]
- Mills, R.; Elderfield, H.; Thomson, J. A dual origin for the hydrothermal component in a metalliferous sediment core from the Mid-Atlantic Ridge. J. Geophys. Res. Space Phys. 1993, 98, 9671. [Google Scholar] [CrossRef]
- Petersen, S.; Krätschell, A.; Augustin, N.; Jamieson, J.; Hein, J.; Hannington, M. News from the seabed—Geological characteristics and resource potential of deep-sea mineral resources. Mar. Policy 2016, 70, 175–187. [Google Scholar] [CrossRef]
- Rona, P.A.; Petersen, S.; Becker, K.; Von Herzen, R.P.; Hannington, M.D.; Herzig, P.M.; Naka, J.; Lalou, C.; Thompson, G. Heat flow and mineralogy of TAG Relict High-Temperature Hydrothermal Zones: Mid-Atlantic Ridge 26°N, 45°W. Geophys. Res. Lett. 1996, 23, 3507–3510. [Google Scholar] [CrossRef]
- Whitney, D.L.; Evans, B.W. Abbreviations for names of rock-forming minerals. Am. Mineral. 2010, 95, 185–187. [Google Scholar] [CrossRef]


| GC | Water Depth (m) | Core Length (cm) | pH | Eh (mV) | No. of Samples | General Description |
|---|---|---|---|---|---|---|
| 576 | 3434 | 116 | 7.42–7.59 | 222–303 | 5 | Carbonate ooze; basalt fragments in the core catcher |
| 615 | 3555 | 108 | 7.56–7.65 | 149–225 | 2 | Carbonate ooze with 2 shelly layers |
| 616 | 3500 | 131 | na | na | 1 # | Carbonate ooze overlying brown to red silty-sandy layers with a few grey volcanic layers |
| 617 | 3462 | 64 | 7.58–7.63 | 195–210 | 5 # | Carbonate ooze |
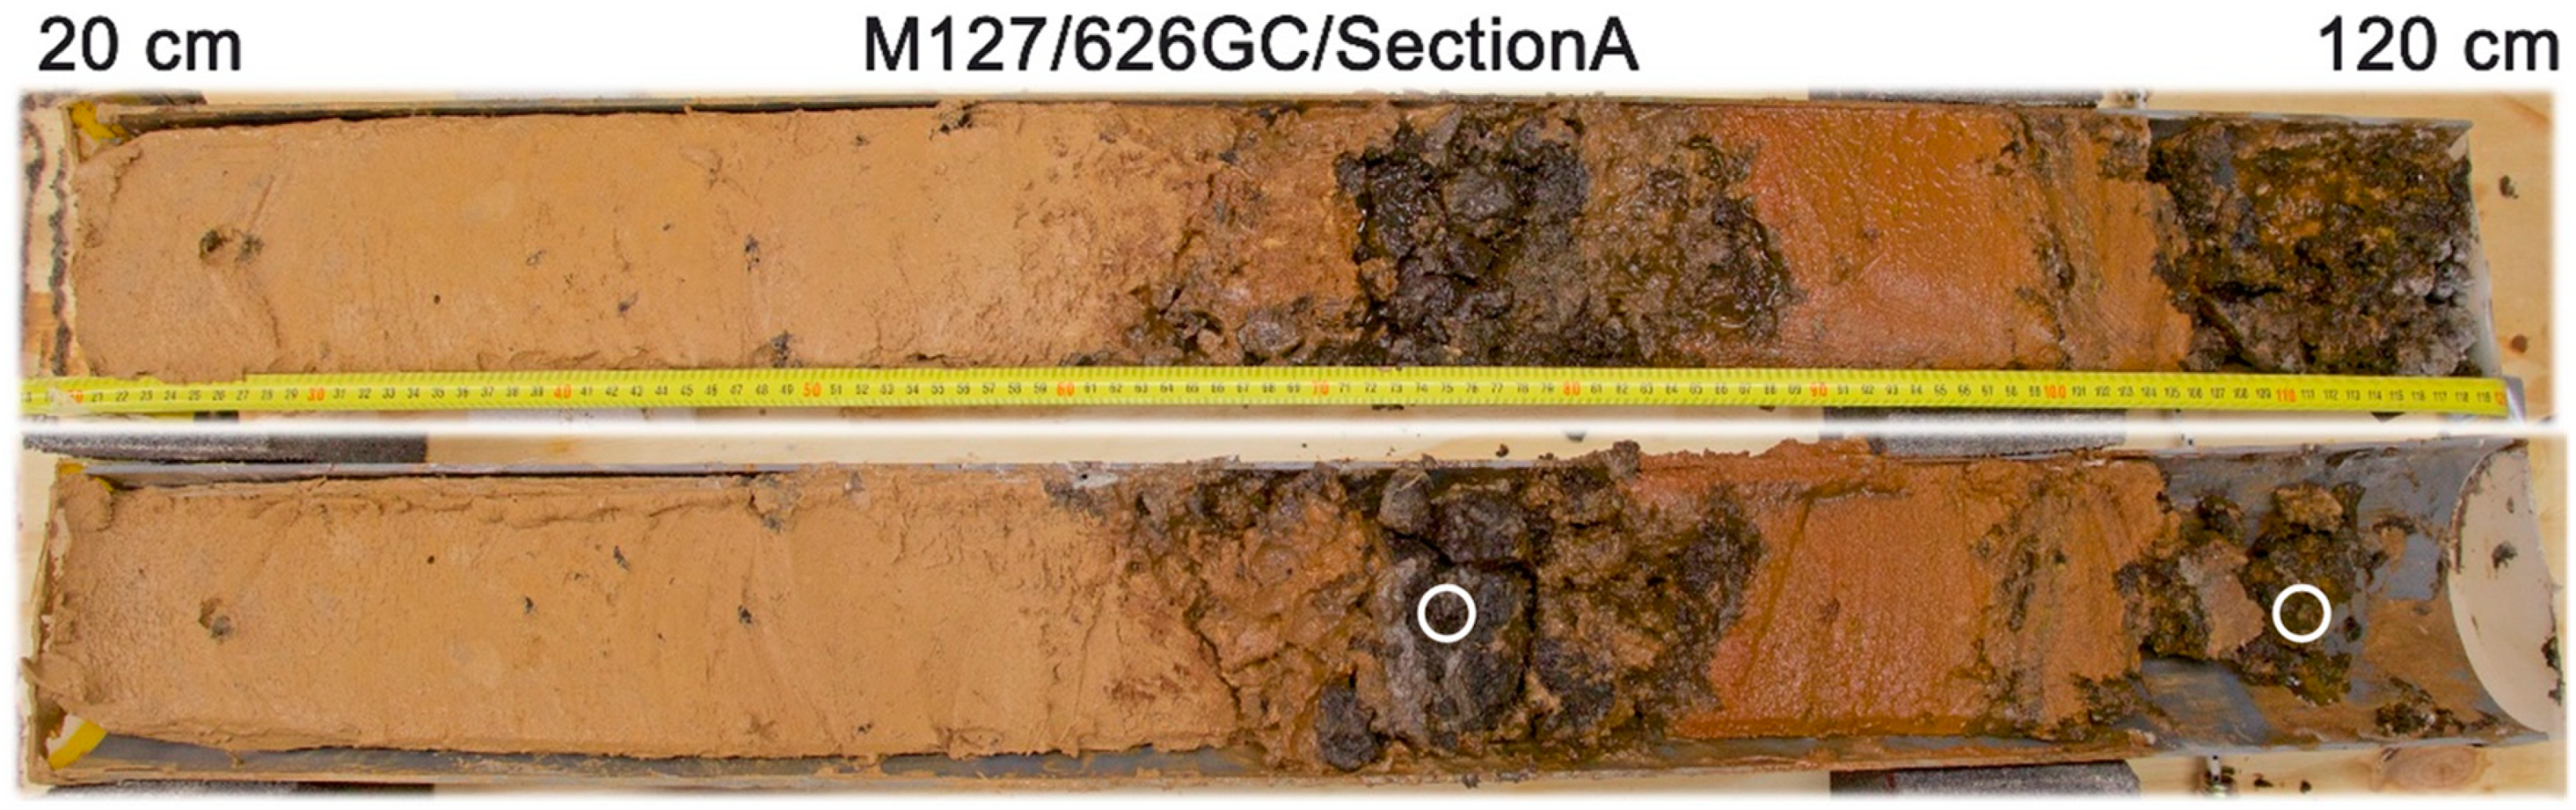
| 626 | 3407 | 120 | 7.29–7.36 | 166–226 | 4 # | Carbonate ooze overlying brown to red silty-sandy sediments and basalt fragments; several Mn oxide breccia layers |
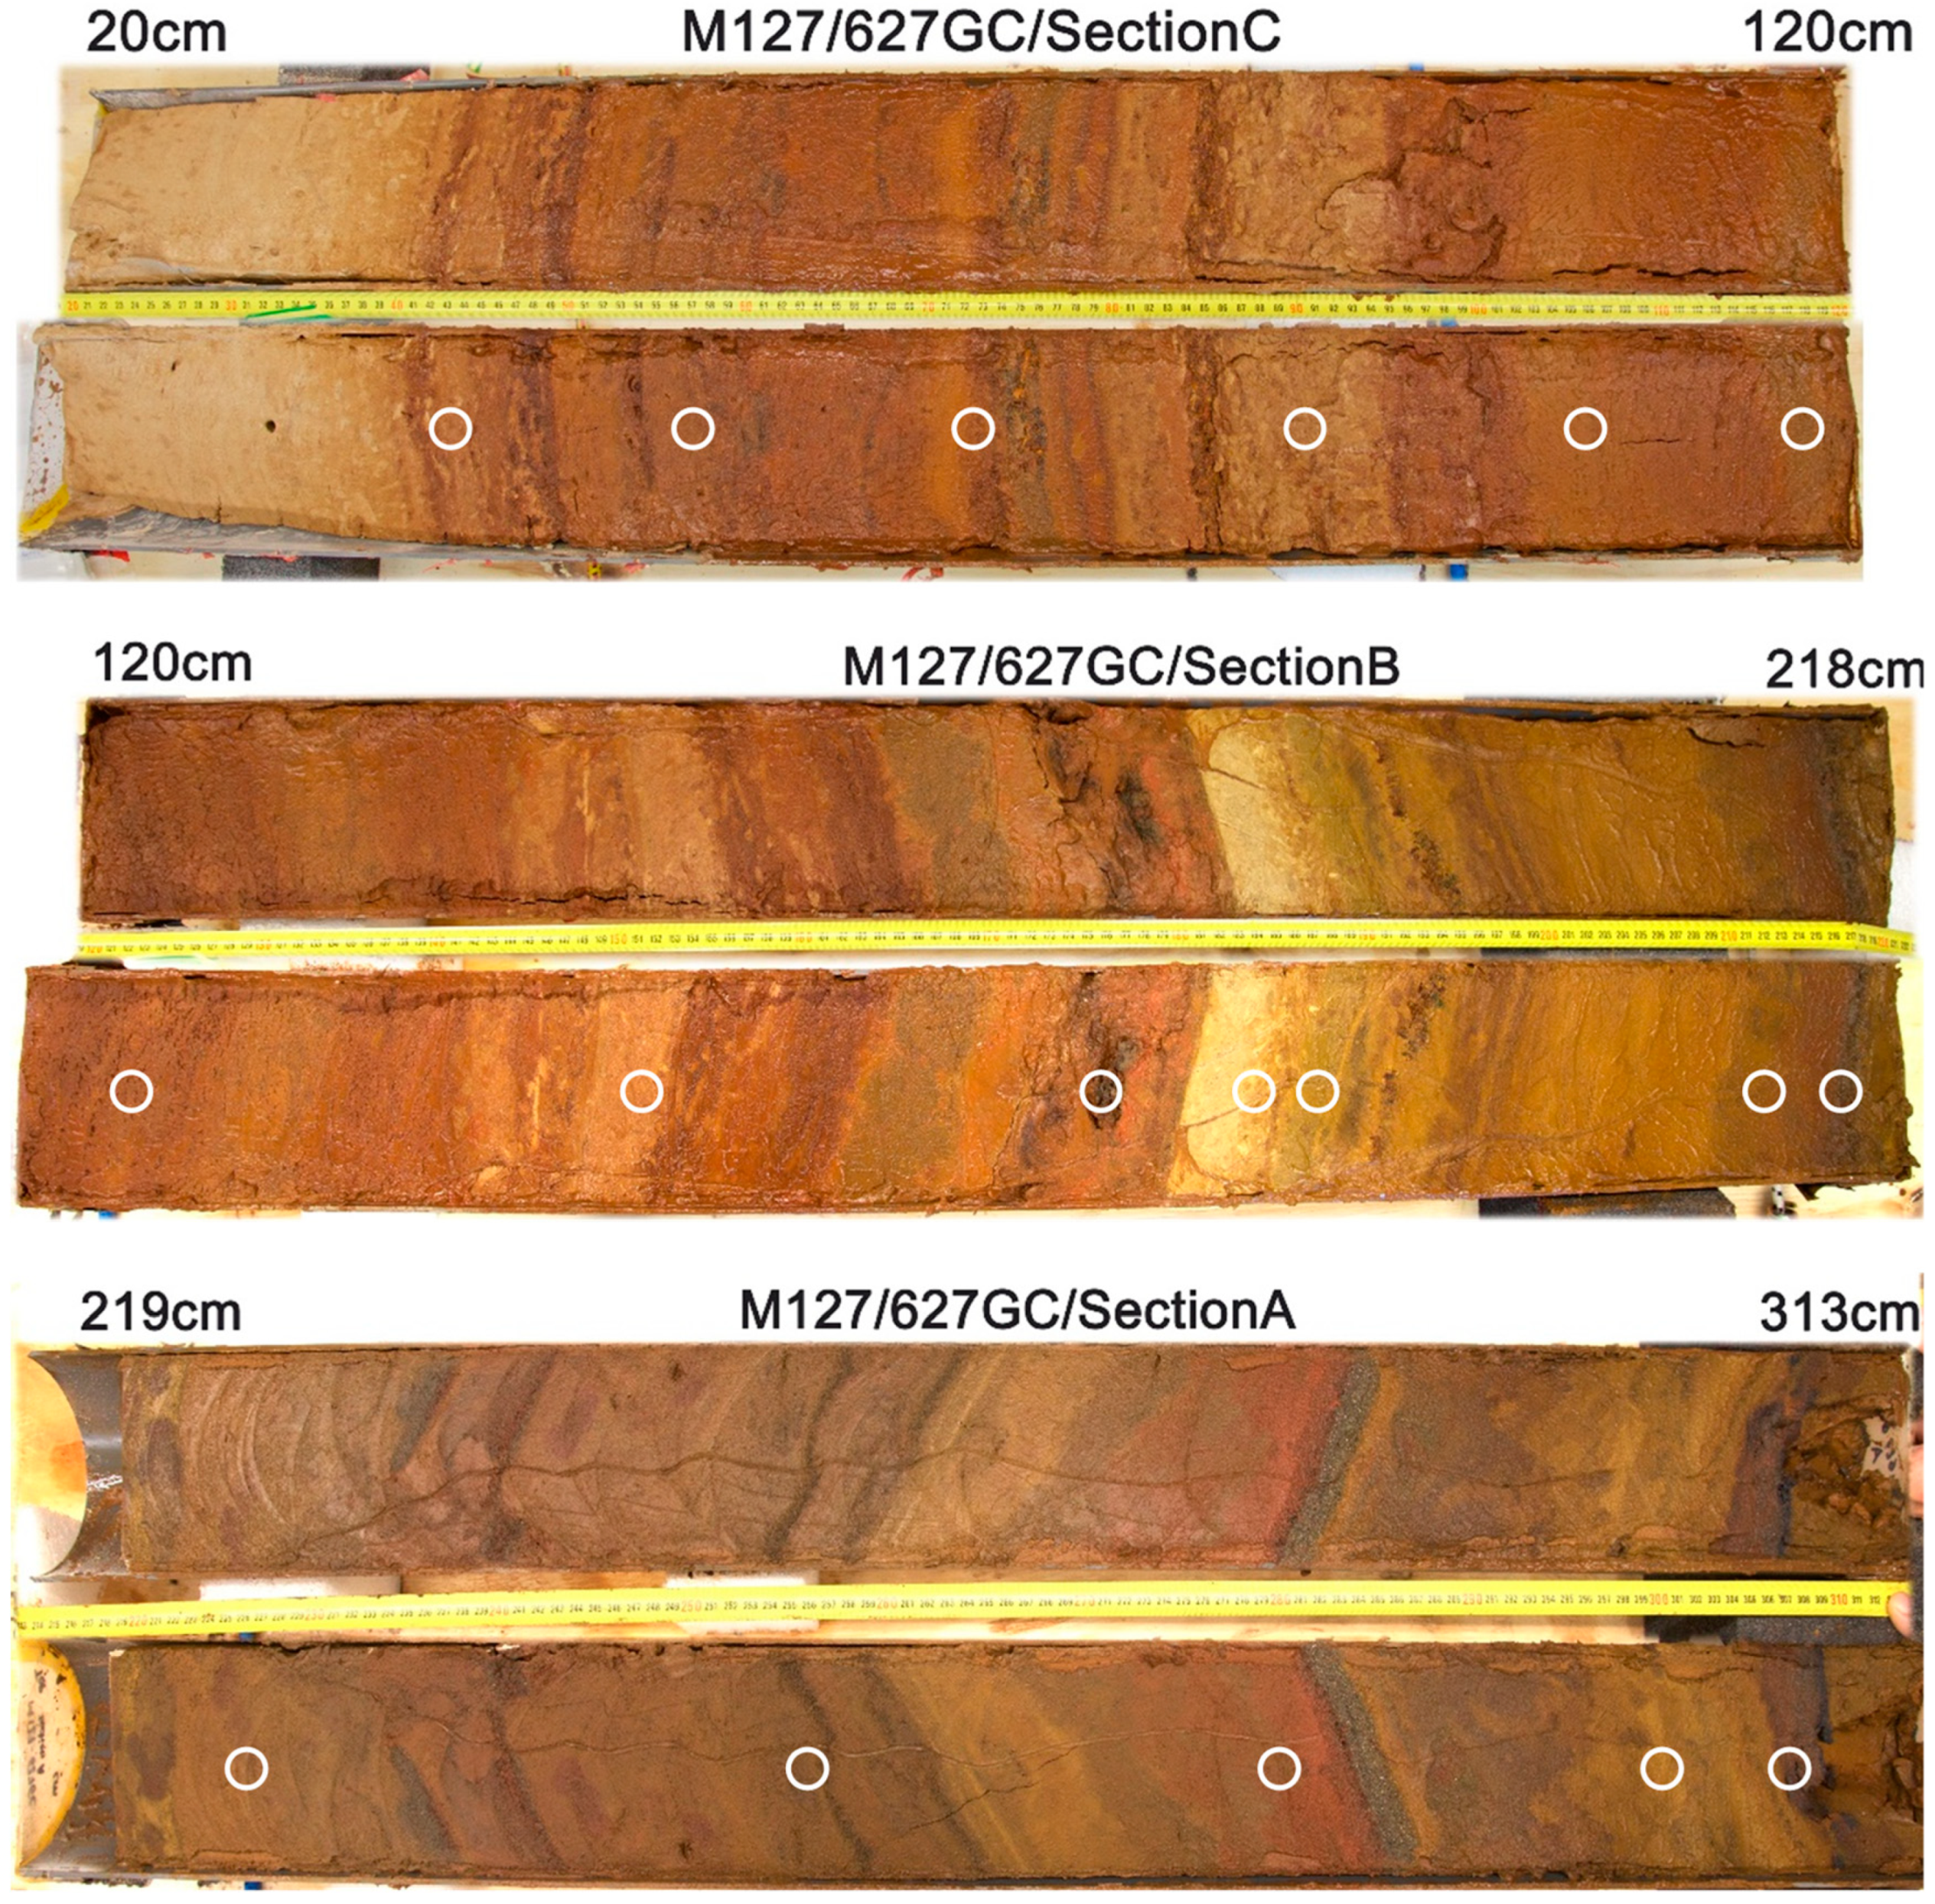
| 627 | 3519 | 313 | 7.19–7.60 | −244–235 | 20 # | Repeating series of brown-red-orange silty-sandy sediment layers with several sulfide sand layers; dark layers of Mn oxides |
| 636 | 3604 | 108 | 7.75 | 200 | 1 | Carbonate ooze |
| 638 | 3753 | 20 | na | na | 1 # | Carbonate ooze |
| 644 | 3515 | 269 | 7.42–7.73 | 172–223 | 15 | Repeating series of brown-red gravel and silty-sandy sediment layers and red-green patchy layers; several Mn oxide breccia layers |
| 645 | 3562 | 131 | 7.71 | 222 | 1 | Carbonate ooze with a 15 cm reddish silt layer |
| 647 | 3520 | 300 | 7.31–7.73 | −195–215 | 12 | Repeating series of brown-red-orange silty-sandy sediment beds with a few thin layers with fine sulfides and Mn oxides |
| 649 | 3423 | 178 | 7.68–7.75 | 176–186 | 3 # | Carbonate ooze overlying brown to red silty-sandy sediments with a few grey volcanic layers |
| 666 | 3000 | 37 | 7.88 | 171 | 1 # | Carbonate ooze |
| 681 | 3510 | 300 | 7.65–8.0 | 158–312 | 8 # | Carbonate ooze overlying repeating series of brown-red silty-sandy-gravely sediment layers; Mn and Fe oxide breccia layers |
| 682 | 3445 | 281 | 7.03–7.91 | −72–339 | 9 # | Carbonate ooze overlying repeating series of brown-red silty-sandy-gravely sediment and patchy layers; Mn and Fe oxide breccia layers |
| 690 | 3644 | 80 | 7.85 | 180 | 1 # | Carbonate ooze |
| 691 | 3067 | 66 | na | na | 1 # | Carbonate ooze |
| 692 | 3422 | 79 | 7.71–8.15 | 151–187 | 4 # | Carbonate ooze overlying patchy red-brown-green gravel layers with Mn and Fe oxides |
| 693 | 3654 | 71 | na | na | 4 | Mn oxide breccia interlaid with orange silt layers |
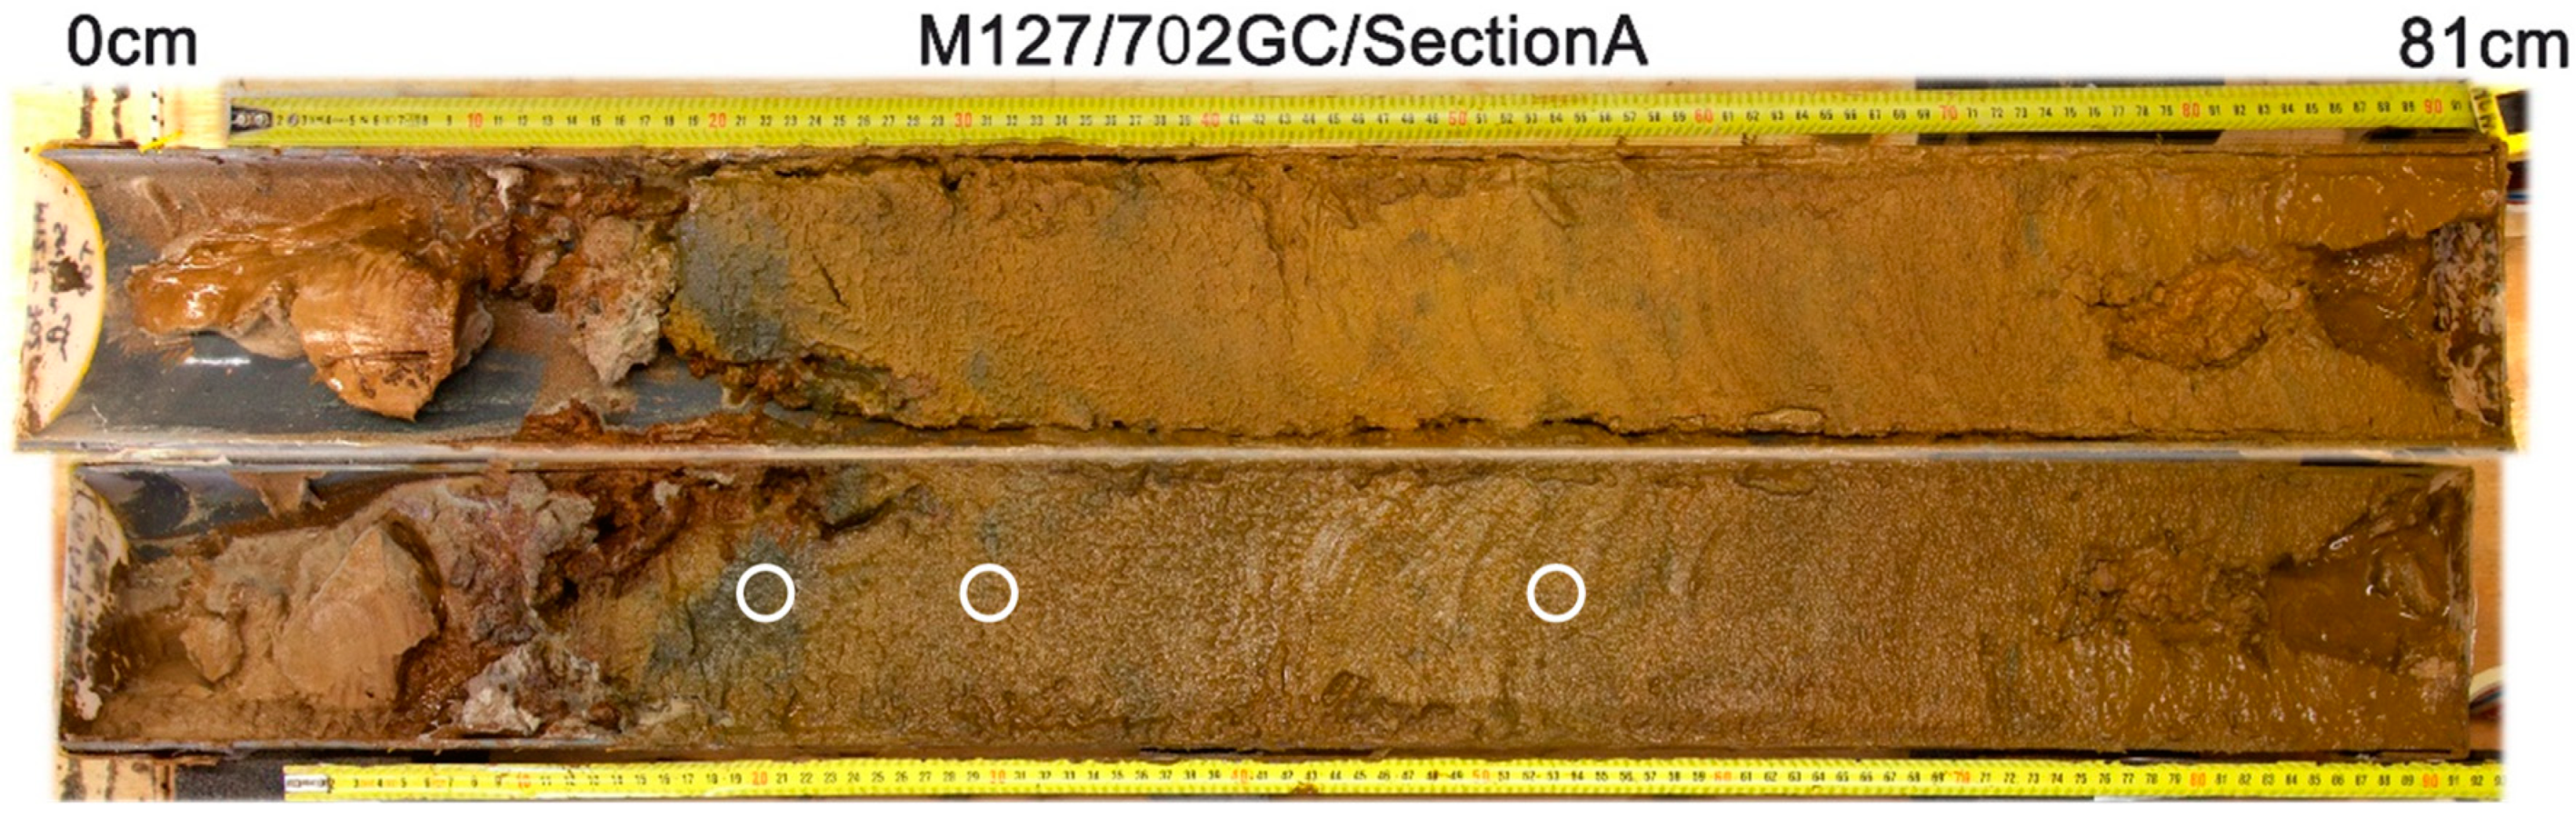
| 702 | 3560 | 92 | 6.31–6.74 | −101–−2 | 3 | Brown silty-sandy sediment with fine grained sulfide layers |
| 703 | 3460 | 300 | 7.14–7.69 | 125–234 | 6 | Carbonate ooze overlying dark heterogeneous layers of Mn and Fe oxide breccia |
| Mineral | Abbreviation * | 2θ (°) | h k l | Formula | Relative Content # |
|---|---|---|---|---|---|
| Albite | Alb | 27.88 22.03 | 0 0 2 −2 0 1 | NaAlSi3O8 | 1–5 |
| Anorthite | An | 27.34 31.64 | −2 2 0 132 | CaAl2Si2O8 | 5–10 |
| Aragonite | Arg | 26.23 | 1 1 1 | CaCO3 | 1–5 |
| Augite | Aug | 29.86 | −2 2 1 | (Ca,Mg,Fe)2Si2O6 | 1–5 |
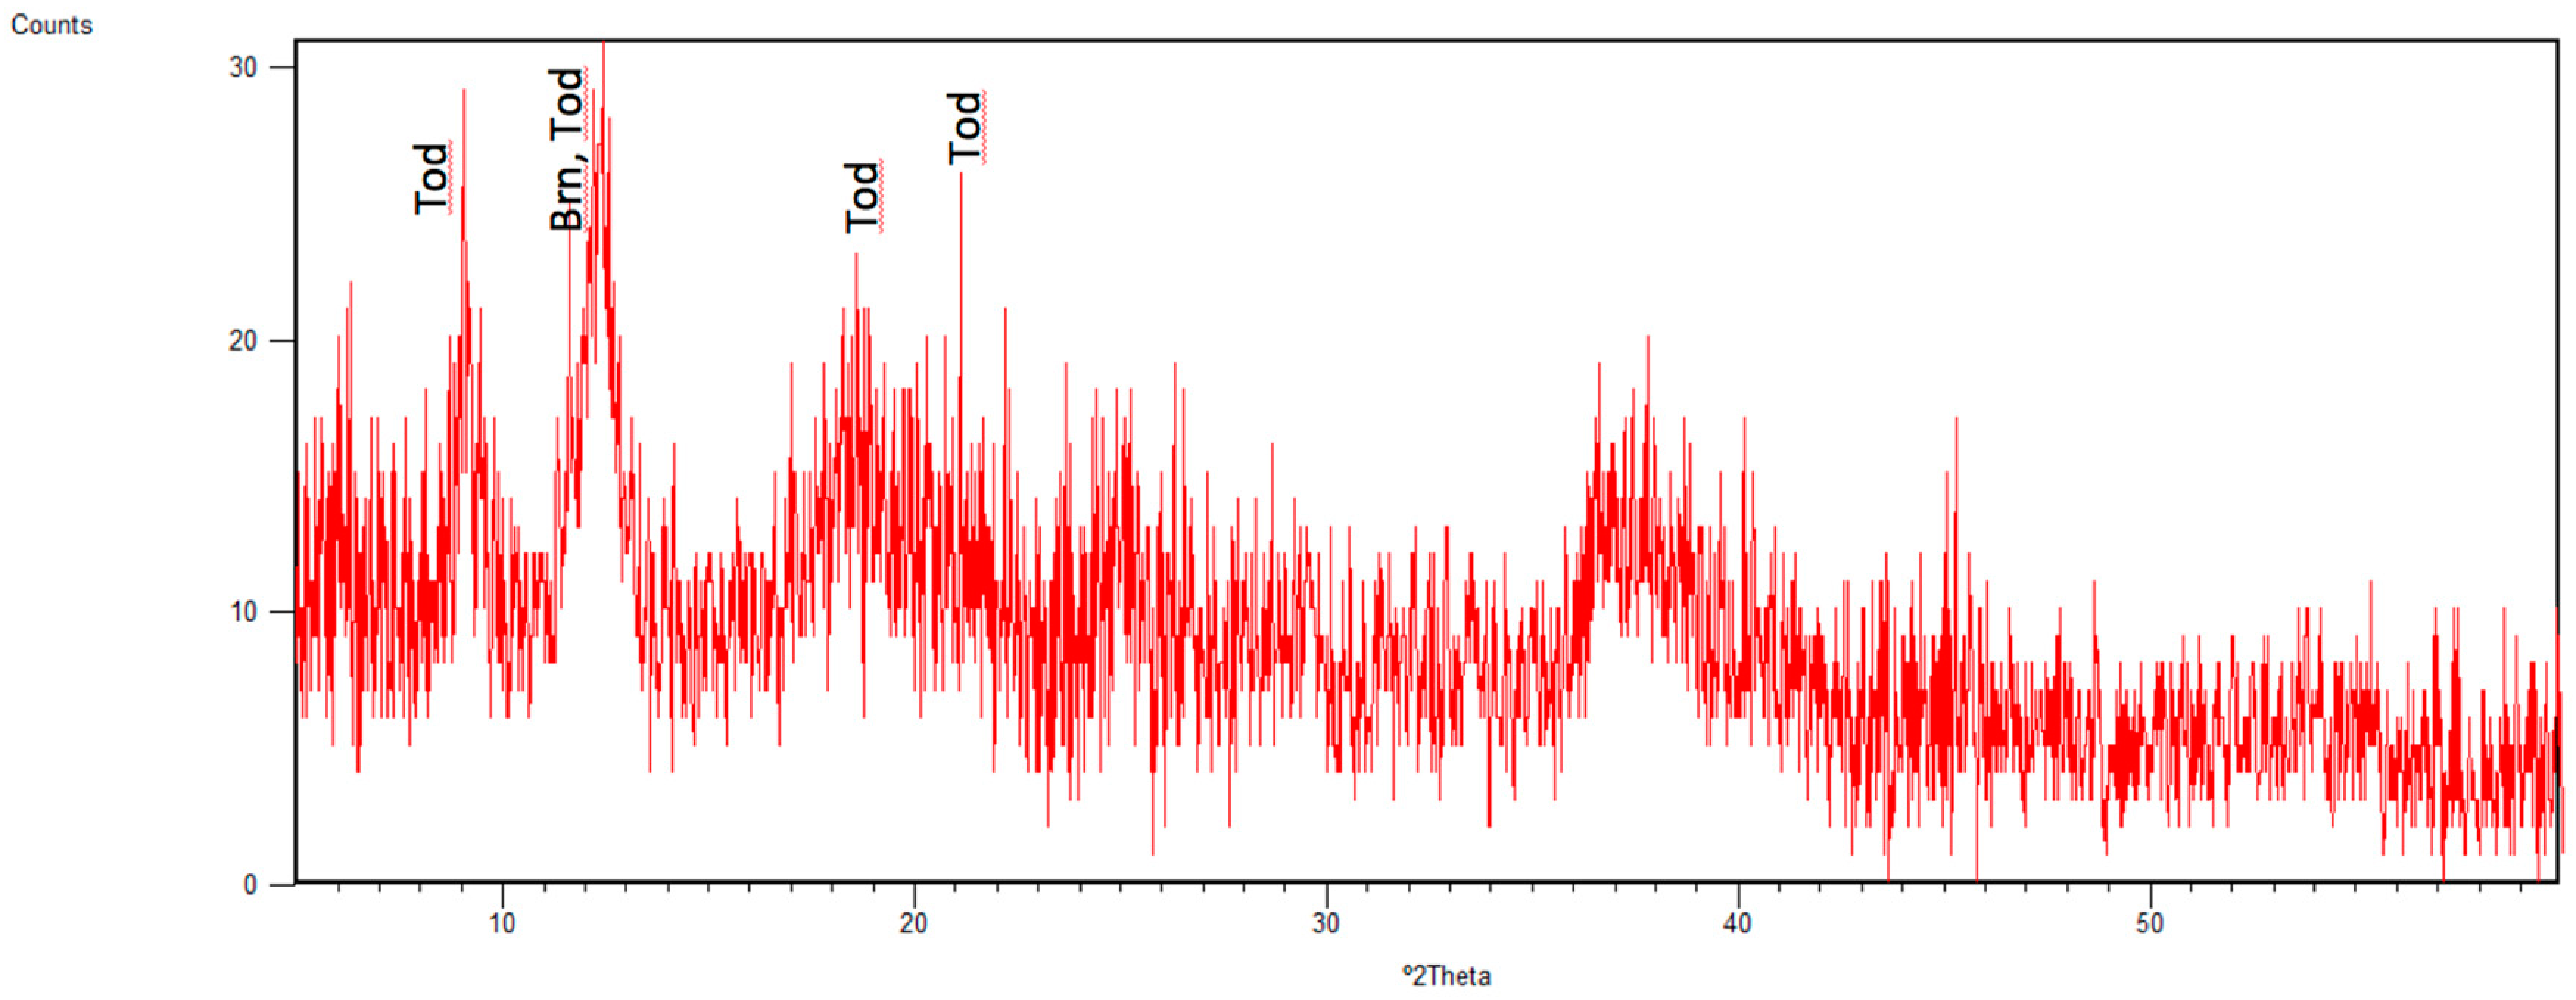
| Birnessite | Brn ** | 12.49 | 0 0 1 | (NaCaK)0.6Mn2O4·1.5H2O | 1–5 |
| Calcite | Cal | 29.42 39.43 | 1 0 4 1 1 3 | CaCO3 | 40–45 |
| Chalcopyrite | Ccp | 29.40 49.06 57.87 | 1 1 2 204 3 1 2 | CuFeS2 | 15–20 |
| Clinochlore | Clc | 7.11 12.43 | 0 0 2 0 0 2 | Mg5Al(AlSi3O10)(OH)8 | 1–5 |
| Covellite | Cv | 31.87 | 1 0 3 | CuS | 1–5 |
| Forsterite | Fo | 36.50 | 1 1 2 | Mg2SiO4 | 1–5 |
| Goethite | Gt | 21.27 | 1 0 1 | FeO(OH) | 55–60 |
| Hematite | Hem | 33.20 54.15 | 1 0 4 1 1 6 | Fe2O3 | 5–10 |
| Illite | Ilt | 8.83 26.66 | 0 0 2 006 | K,Na,Mg,Fe,Al,Si,O·H20 | 1–5 |
| Kaolinite | Kln | 12.37 | 0 0 2 | Al2Si2O5(OH)4 | 1–5 |
| Magnetite | Mag | 35.58 | 3 1 1 | Fe3O4 | 1–5 |
| Montmorillonite | Mnt | 5.89 19.84 | 0 0 1 1 0 1 | Na0.3(Al,Mg)2Si4O10(OH)2·H2O | 10–15 |
| Nontronite | Nnt ** | 9.21 19.80 | 0 0 1 1 0 0 | Na0.3Fe2(Si,Al)4O10(OH)2·H2O | 20–25 |
| Olivine | Ol | 36.45 | 1 1 2 | (Mg,Fe)2SiO4 | 1–5 |
| Paratacamite | Ptc ** | 16.27 | 0 2 1 | (Cu,Zn)2(OH)3Cl | 1–5 |
| Pyrite | Py | 56.35 33.09 | 3 1 1 2 0 0 | FeS2 | 20–25 |
| Quartz | Qtz | 26.66 | 0 1 1 | SiO2 | 40–45 |
| Saponite | Sap | 5.62 26.42 | 0 0 1 0 0 5 | Na0.33Mg3(Al0.33Si3.67)O10(OH)2 | 1–5 |
| Sepiolite | Sep | 7.36 26.66 | 1 1 0 0 8 0 | (Mg,Fe)4Si6O15(OH)2·6H20 | 1–5 |
| Sphalerite | Sp | 28.66 | 1 1 1 | ZnS | 1–5 |
| Todorokite | Tod ** | 9.08 | 1 0 0 | MnO·H2O | 1–5 |
© 2020 by the authors. Licensee MDPI, Basel, Switzerland. This article is an open access article distributed under the terms and conditions of the Creative Commons Attribution (CC BY) license (http://creativecommons.org/licenses/by/4.0/).
Share and Cite
Milinovic, J.; Dias, Á.A.; Janeiro, A.I.; Pereira, M.F.C.; Martins, S.; Petersen, S.; Barriga, F.J.A.S. XRD Identification of Ore Minerals during Cruises: Refinement of Extraction Procedure with Sodium Acetate Buffer. Minerals 2020, 10, 160. https://doi.org/10.3390/min10020160
Milinovic J, Dias ÁA, Janeiro AI, Pereira MFC, Martins S, Petersen S, Barriga FJAS. XRD Identification of Ore Minerals during Cruises: Refinement of Extraction Procedure with Sodium Acetate Buffer. Minerals. 2020; 10(2):160. https://doi.org/10.3390/min10020160
Chicago/Turabian StyleMilinovic, Jelena, Ágata Alveirinho Dias, Ana I. Janeiro, Manuel F. C. Pereira, Sofia Martins, Sven Petersen, and Fernando J. A. S. Barriga. 2020. "XRD Identification of Ore Minerals during Cruises: Refinement of Extraction Procedure with Sodium Acetate Buffer" Minerals 10, no. 2: 160. https://doi.org/10.3390/min10020160
APA StyleMilinovic, J., Dias, Á. A., Janeiro, A. I., Pereira, M. F. C., Martins, S., Petersen, S., & Barriga, F. J. A. S. (2020). XRD Identification of Ore Minerals during Cruises: Refinement of Extraction Procedure with Sodium Acetate Buffer. Minerals, 10(2), 160. https://doi.org/10.3390/min10020160