Fossil Resins–Constraints from Portable and Laboratory Near-infrared Raman Spectrometers


 ,
,  ,
,  , and
, and
Abstract
1. Introduction
2. Experimental
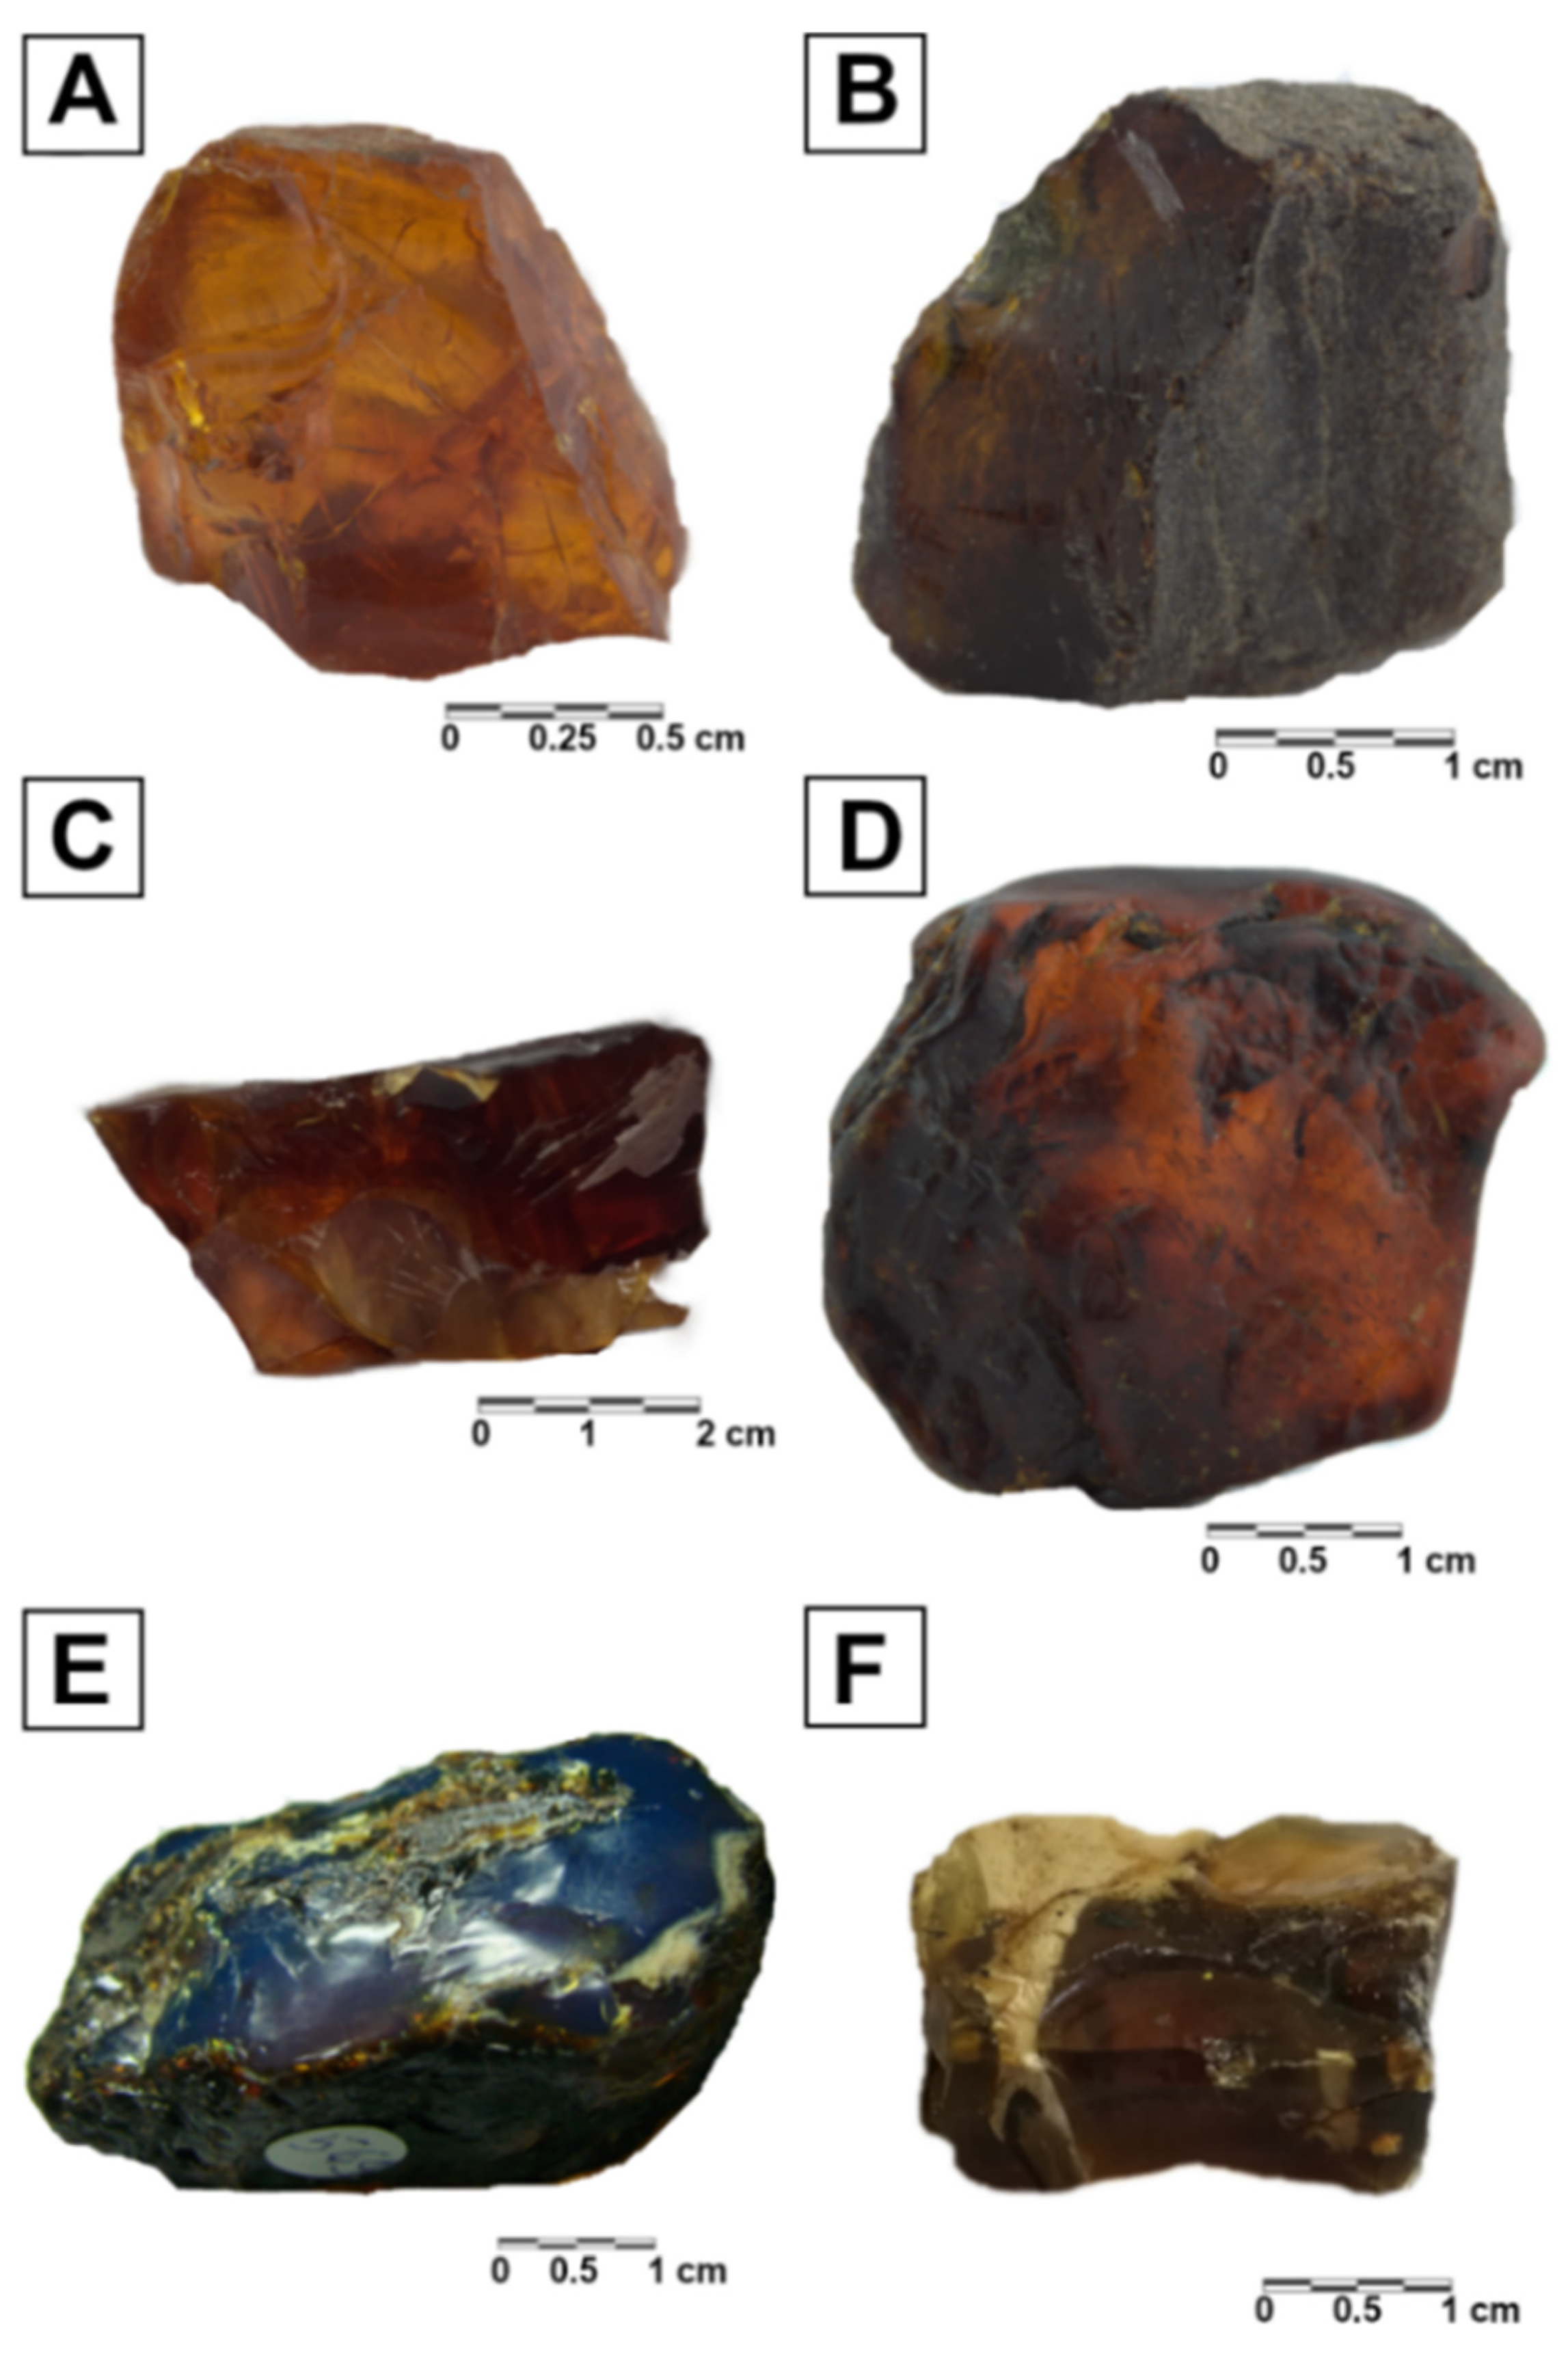
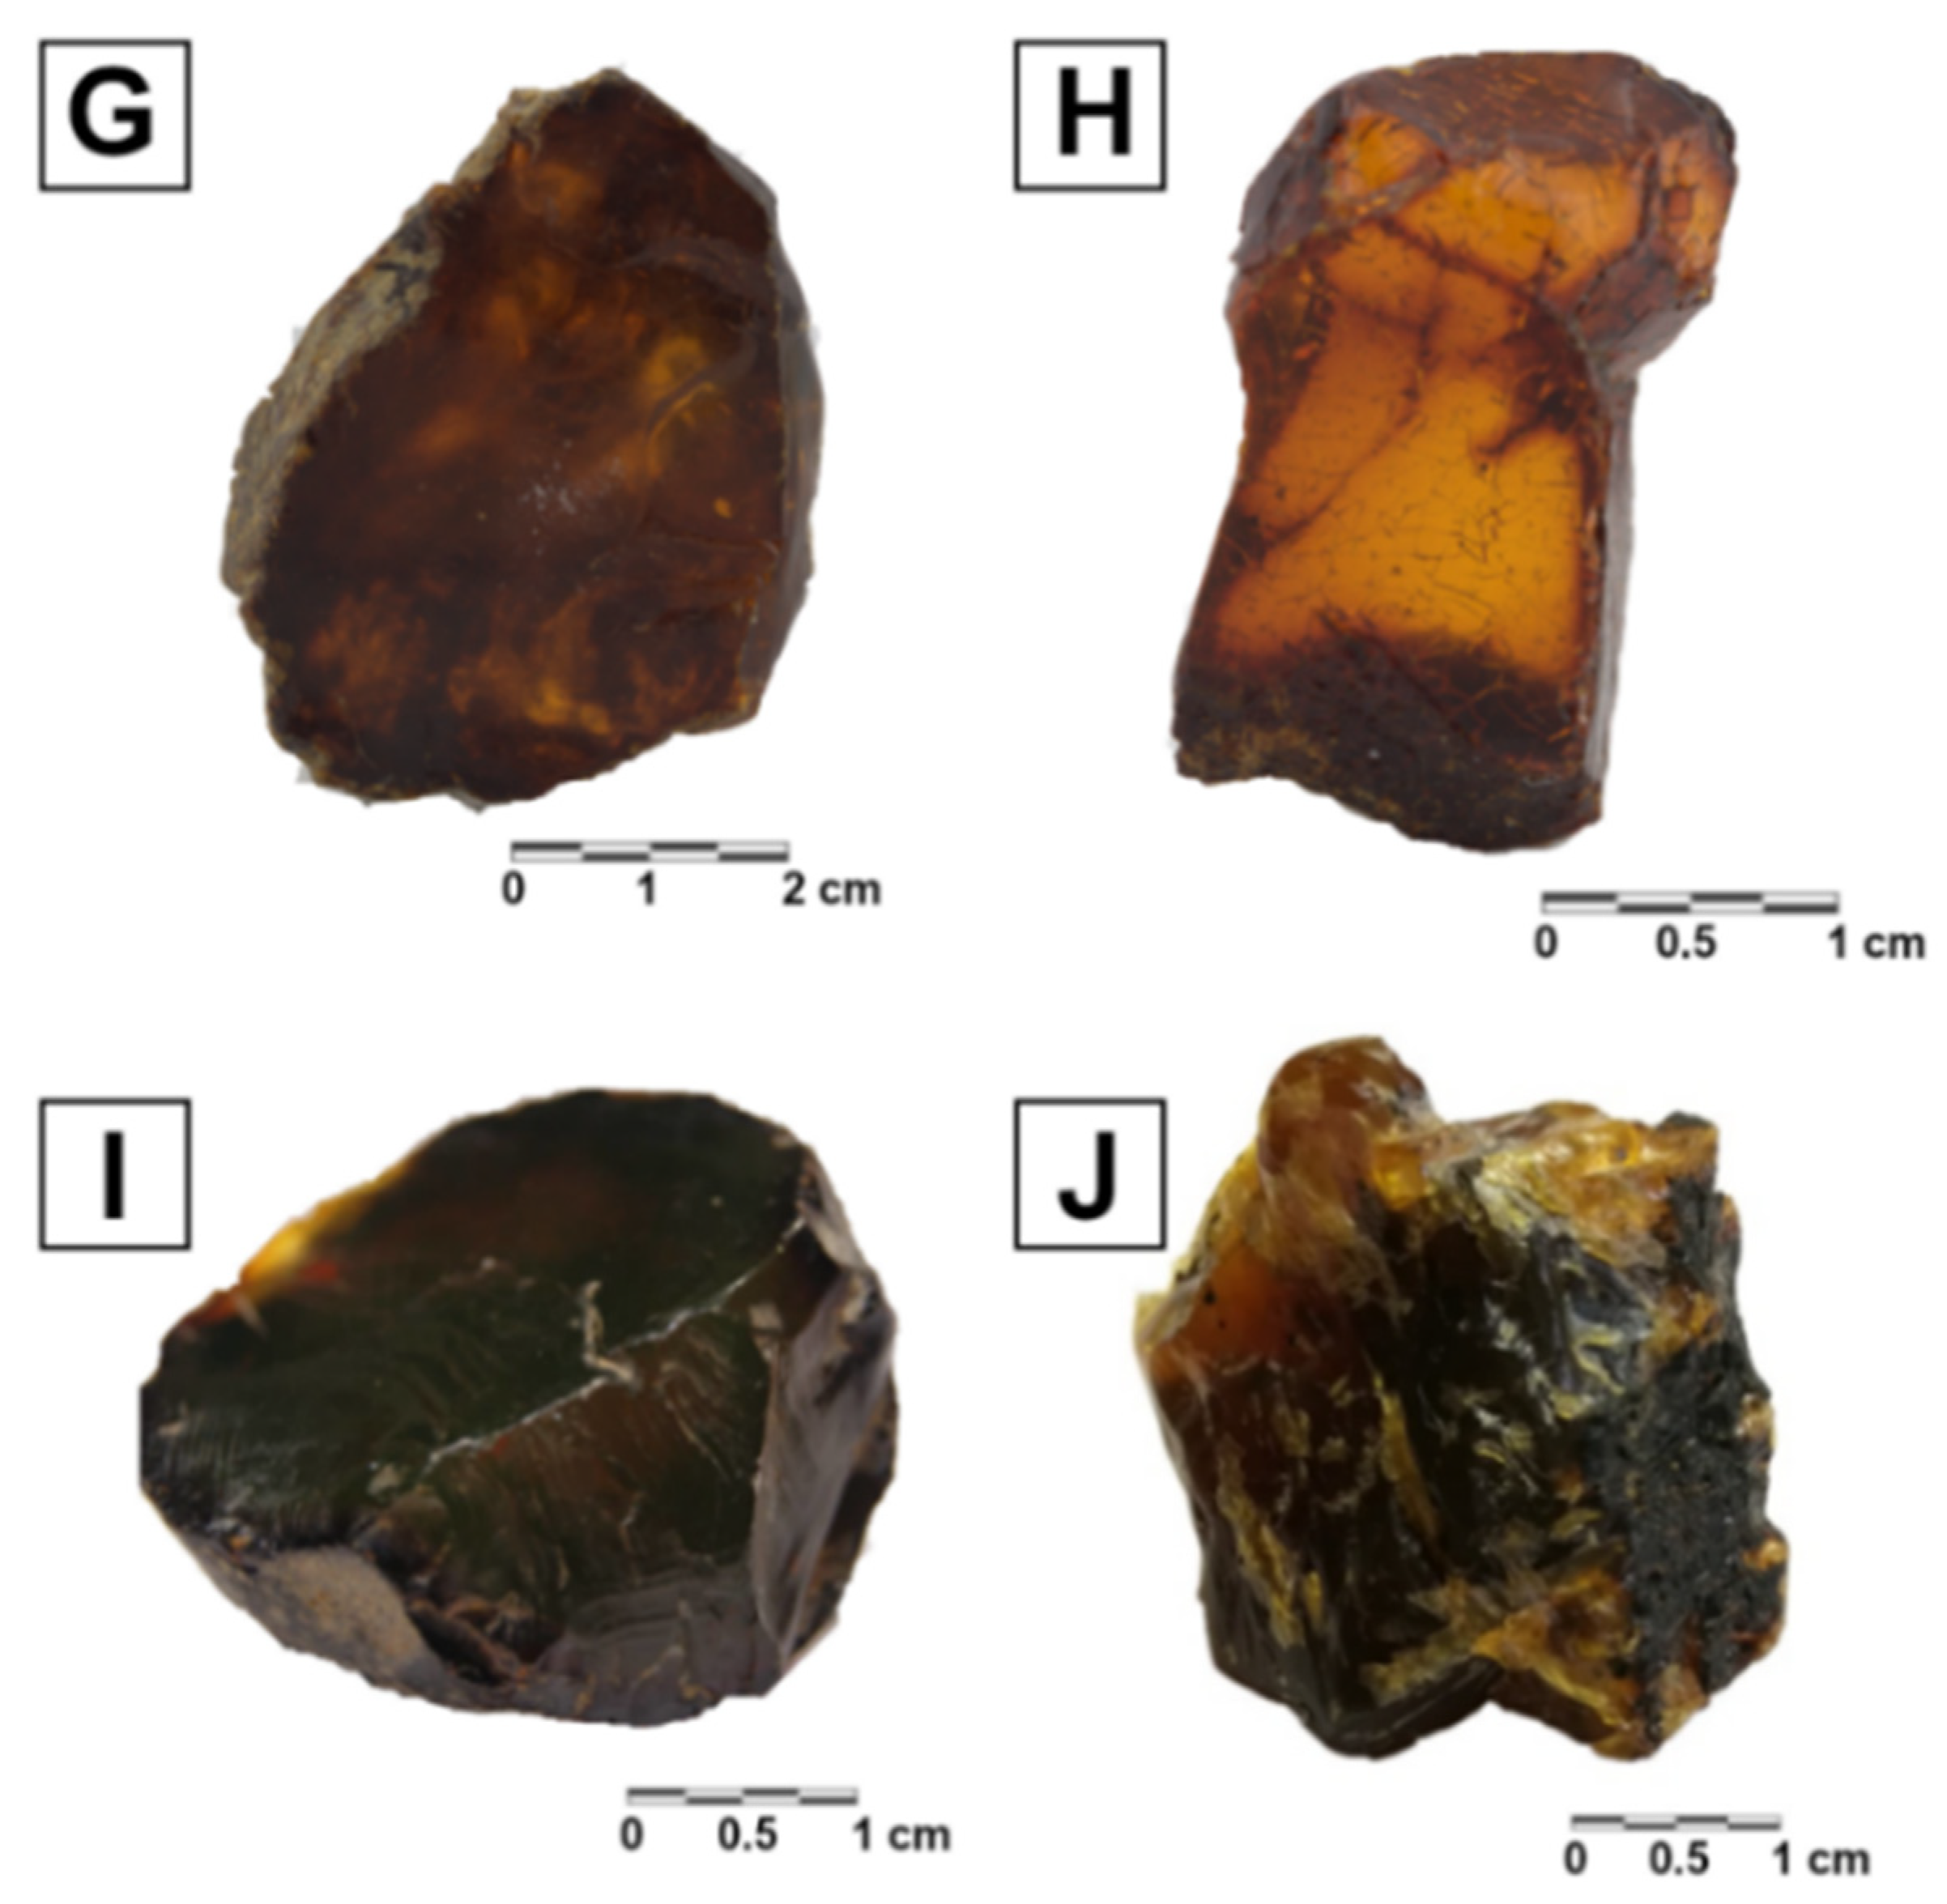
2.1. Sampling
2.2. Analytical Methods
3. Results and Discussion
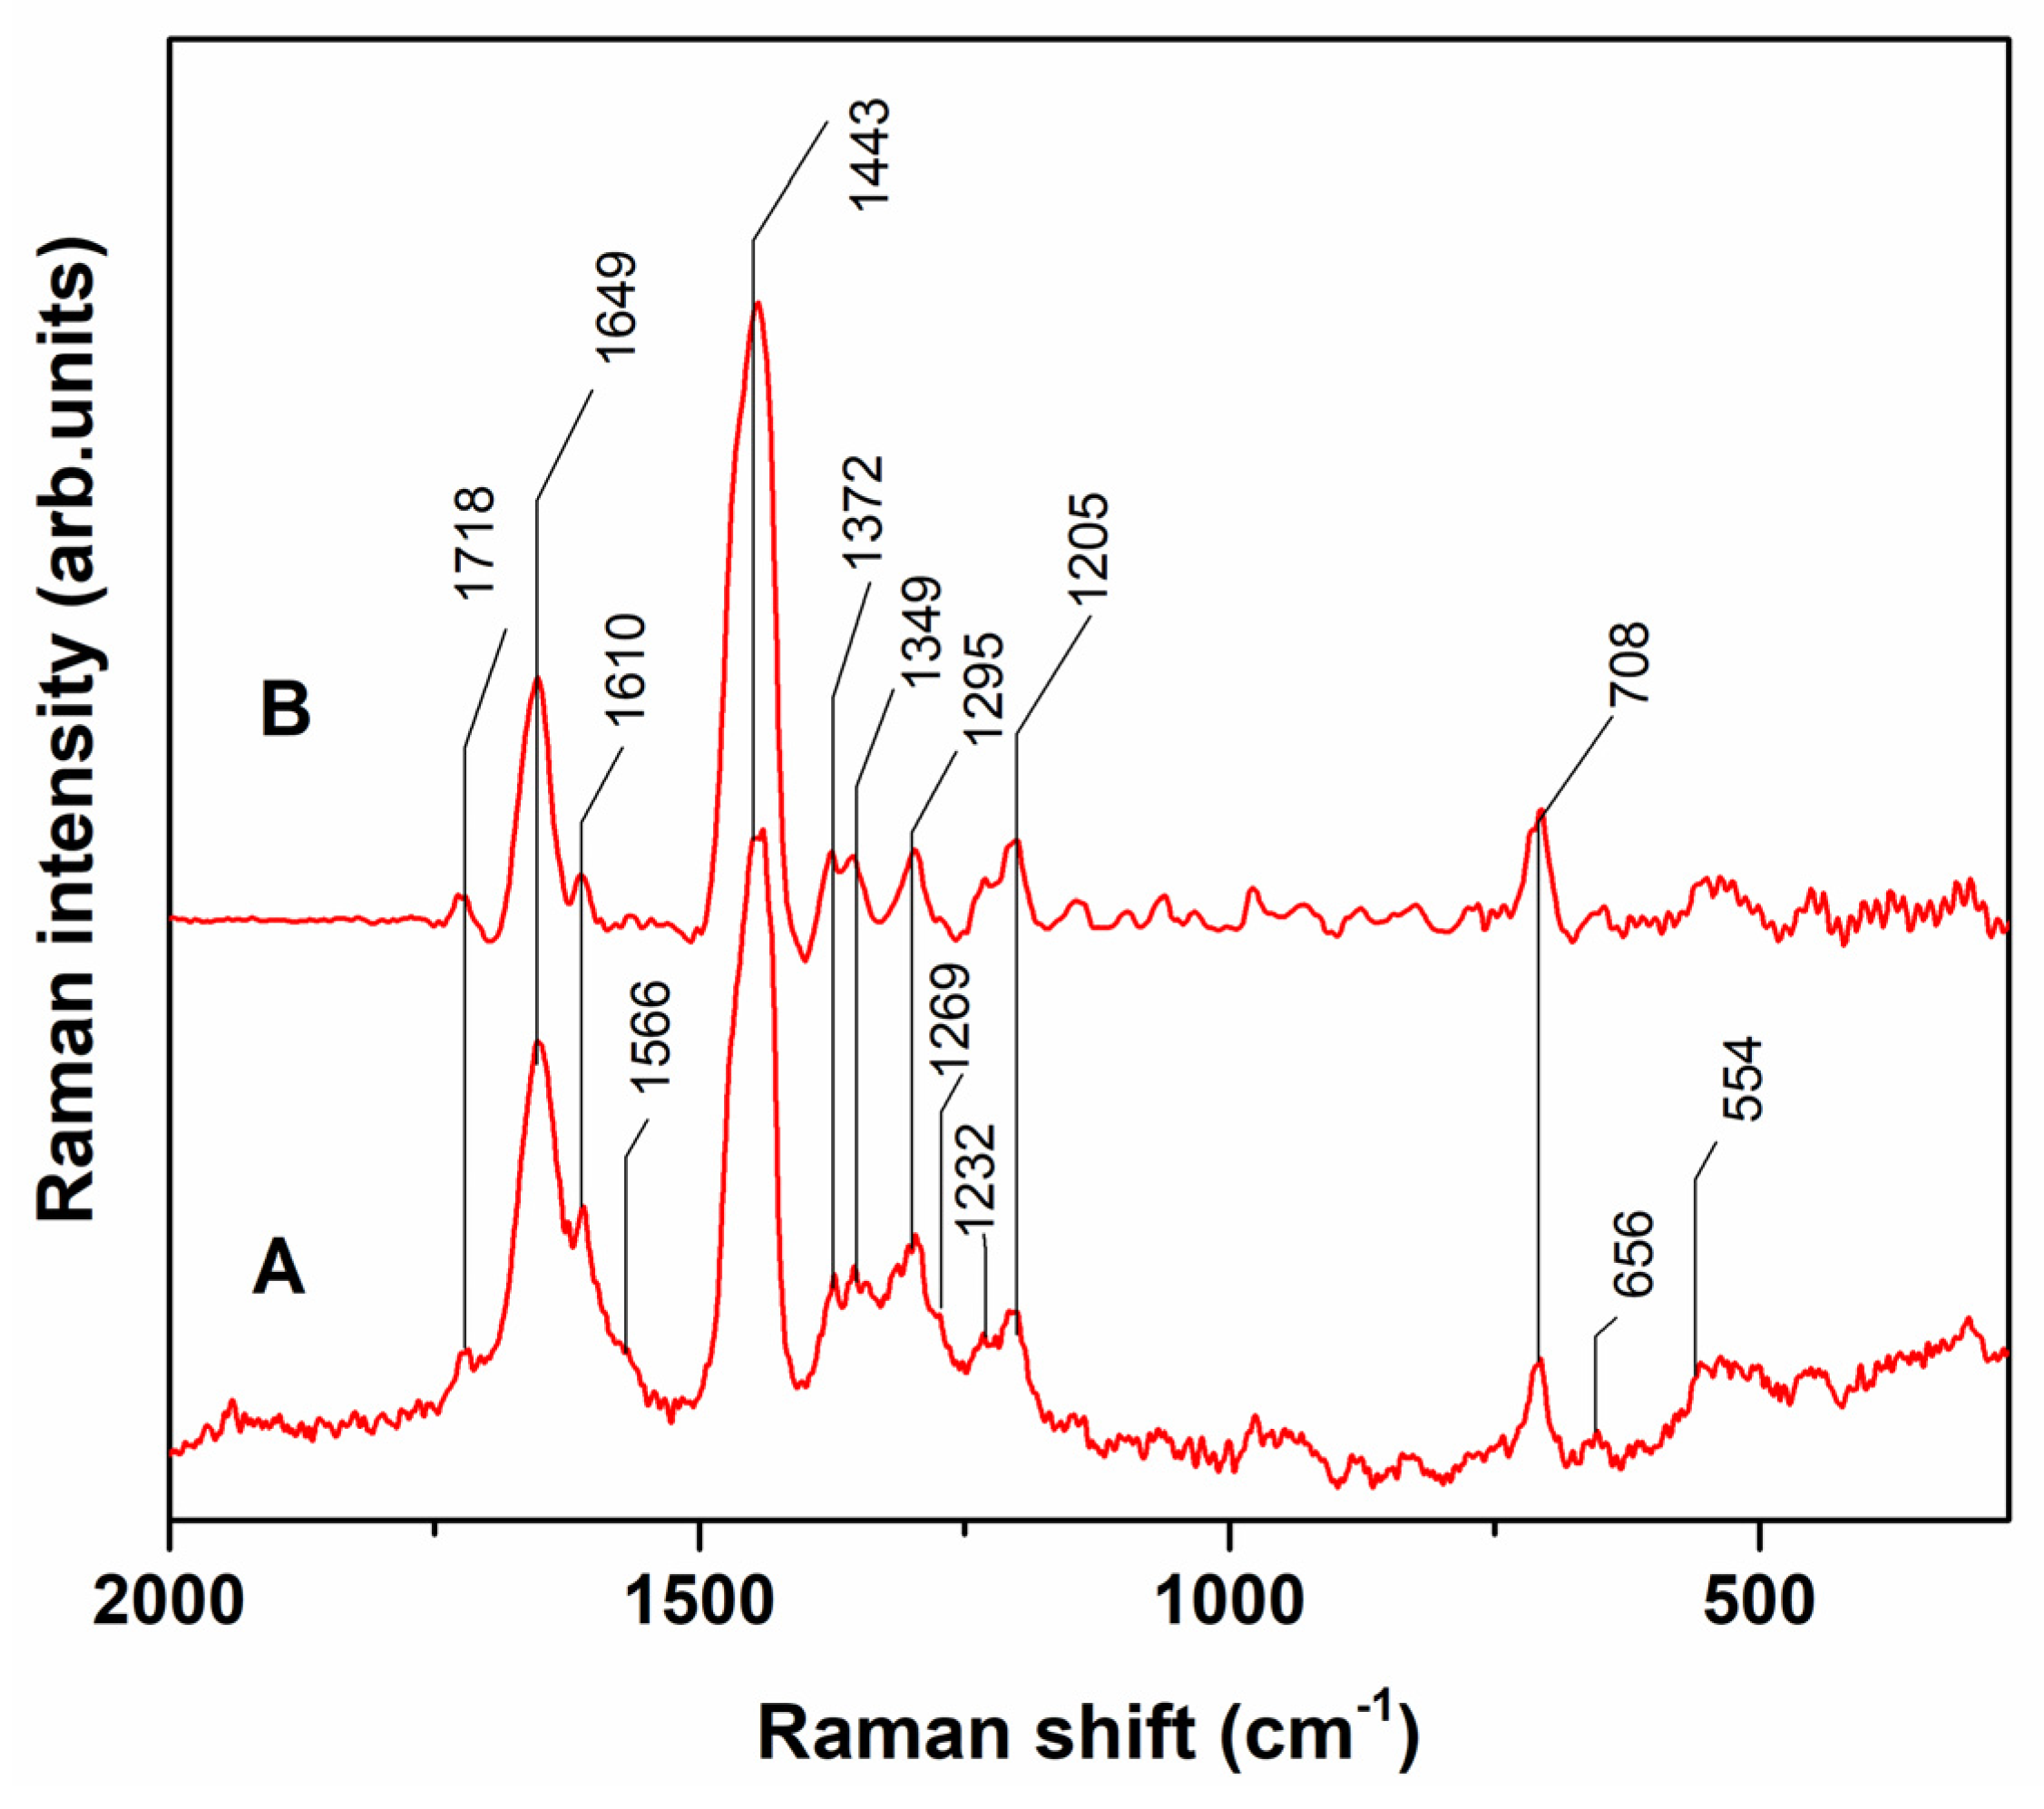
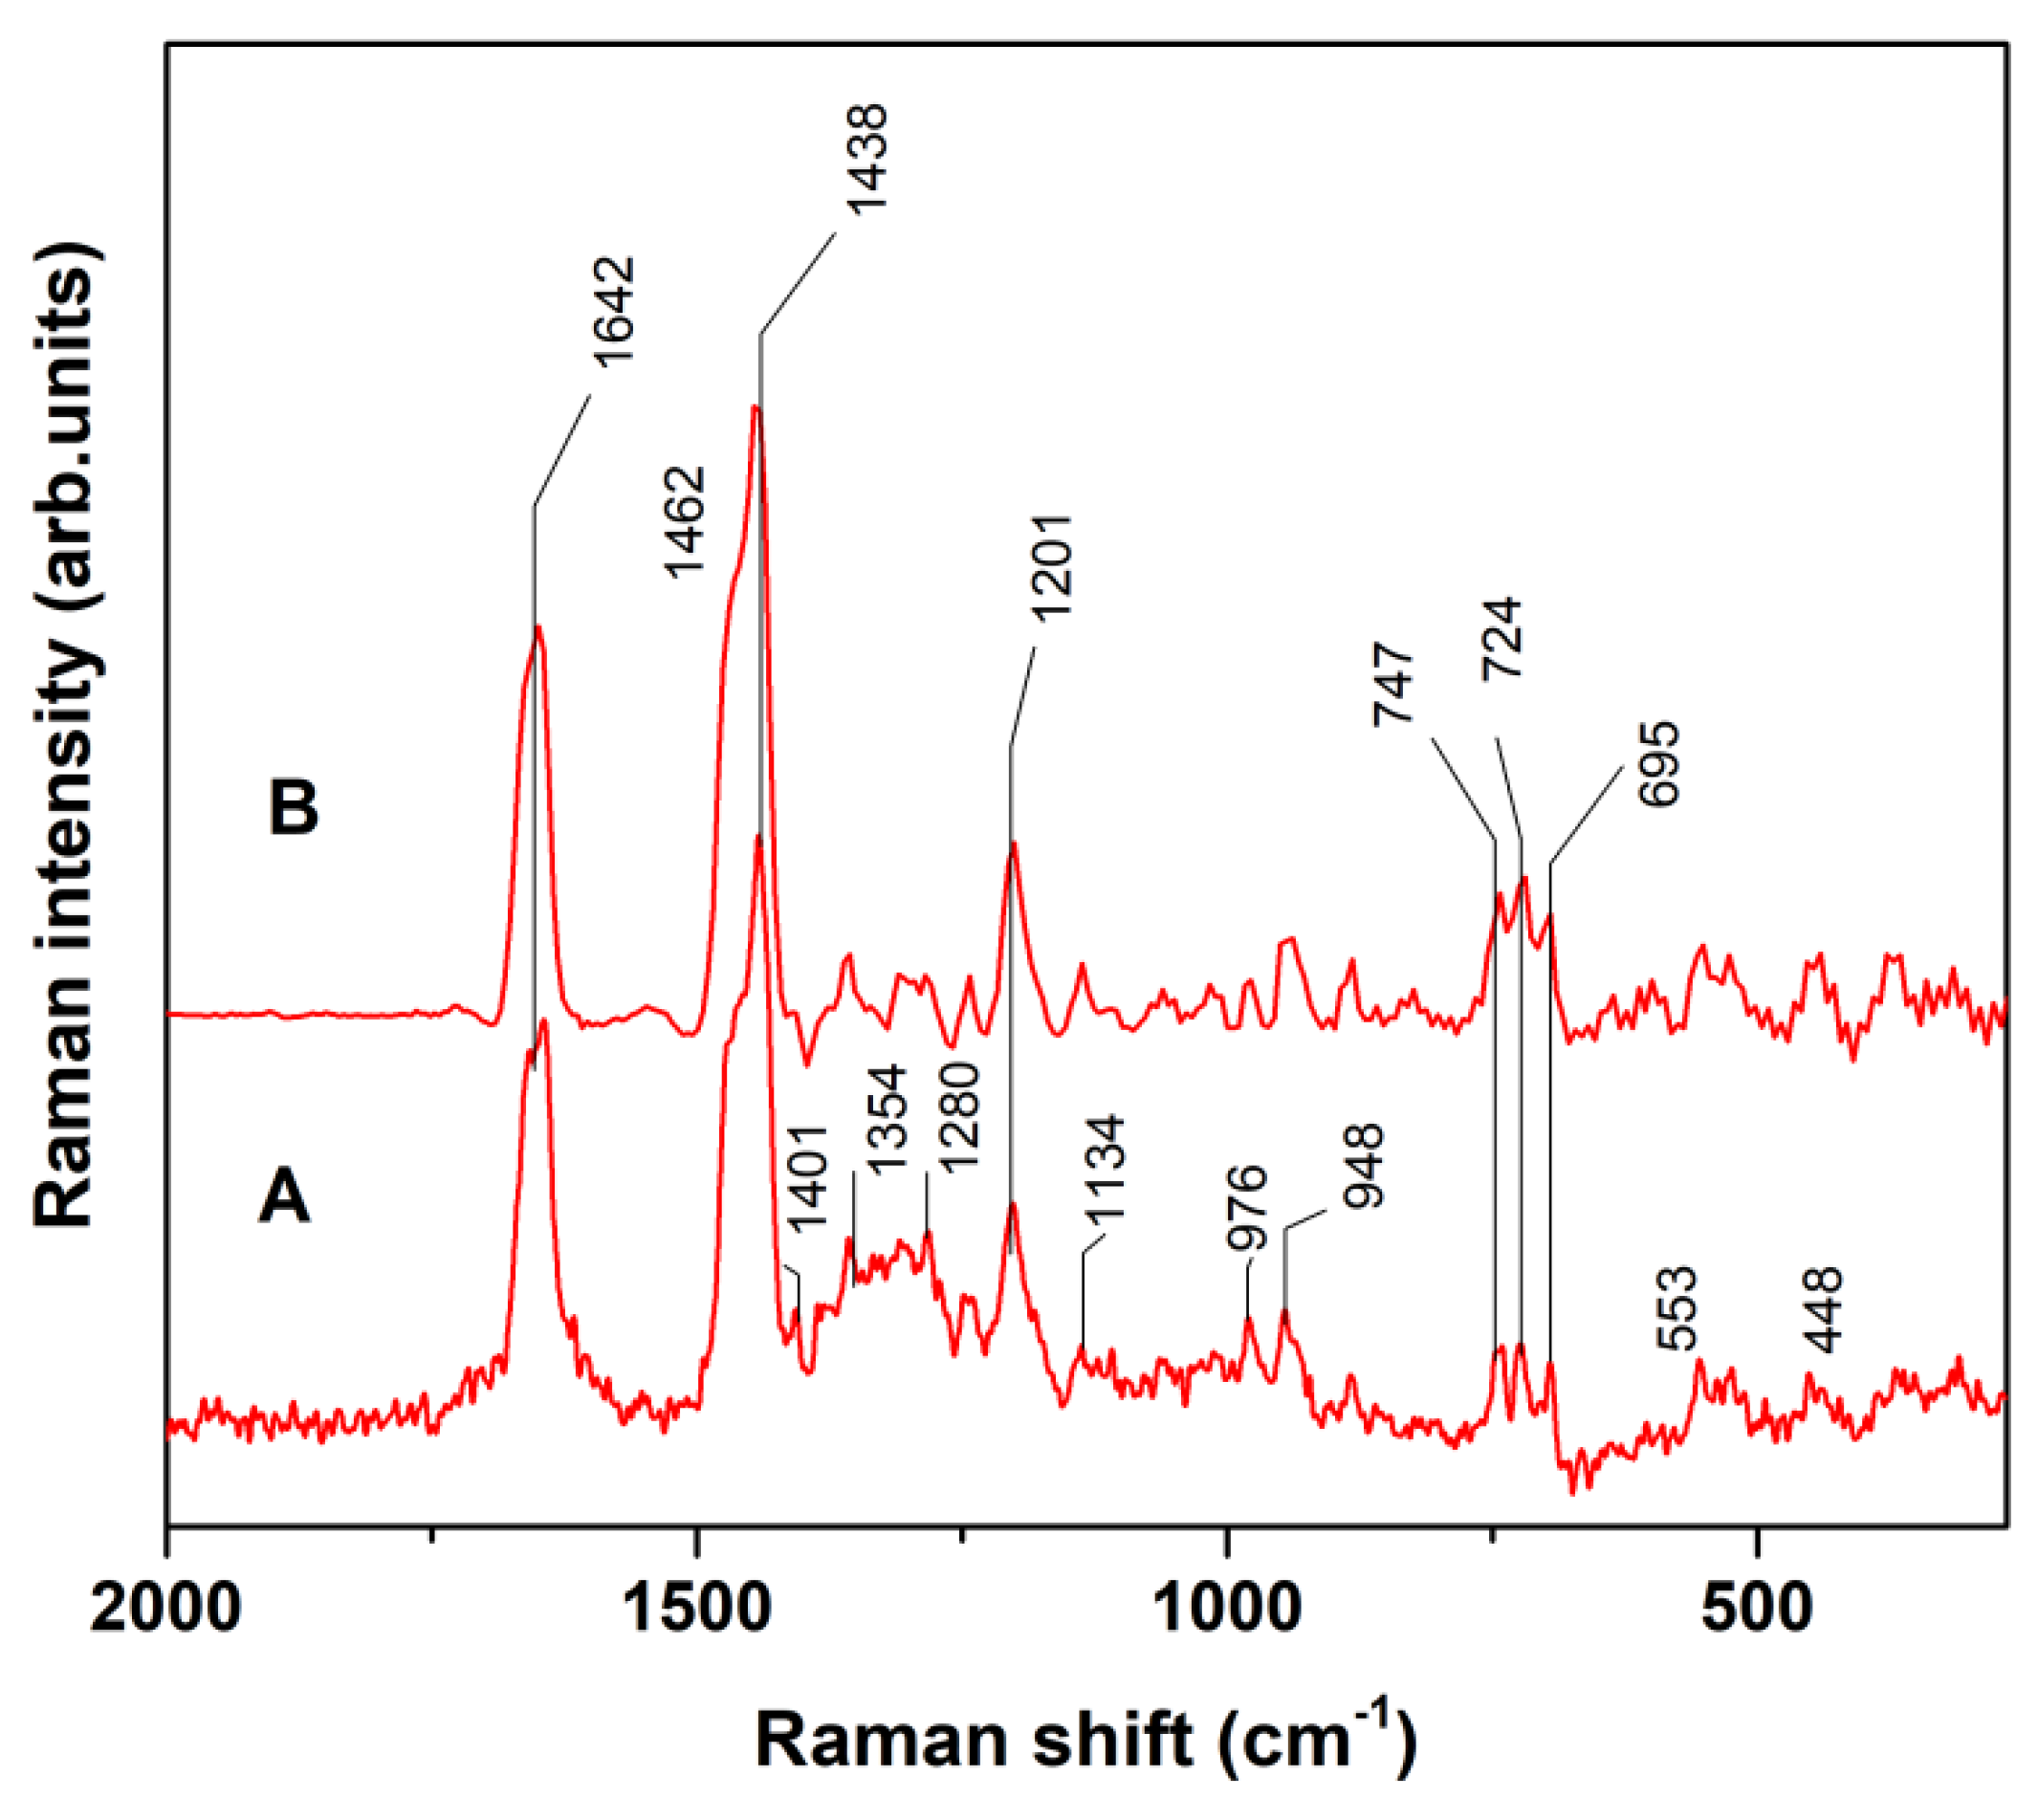
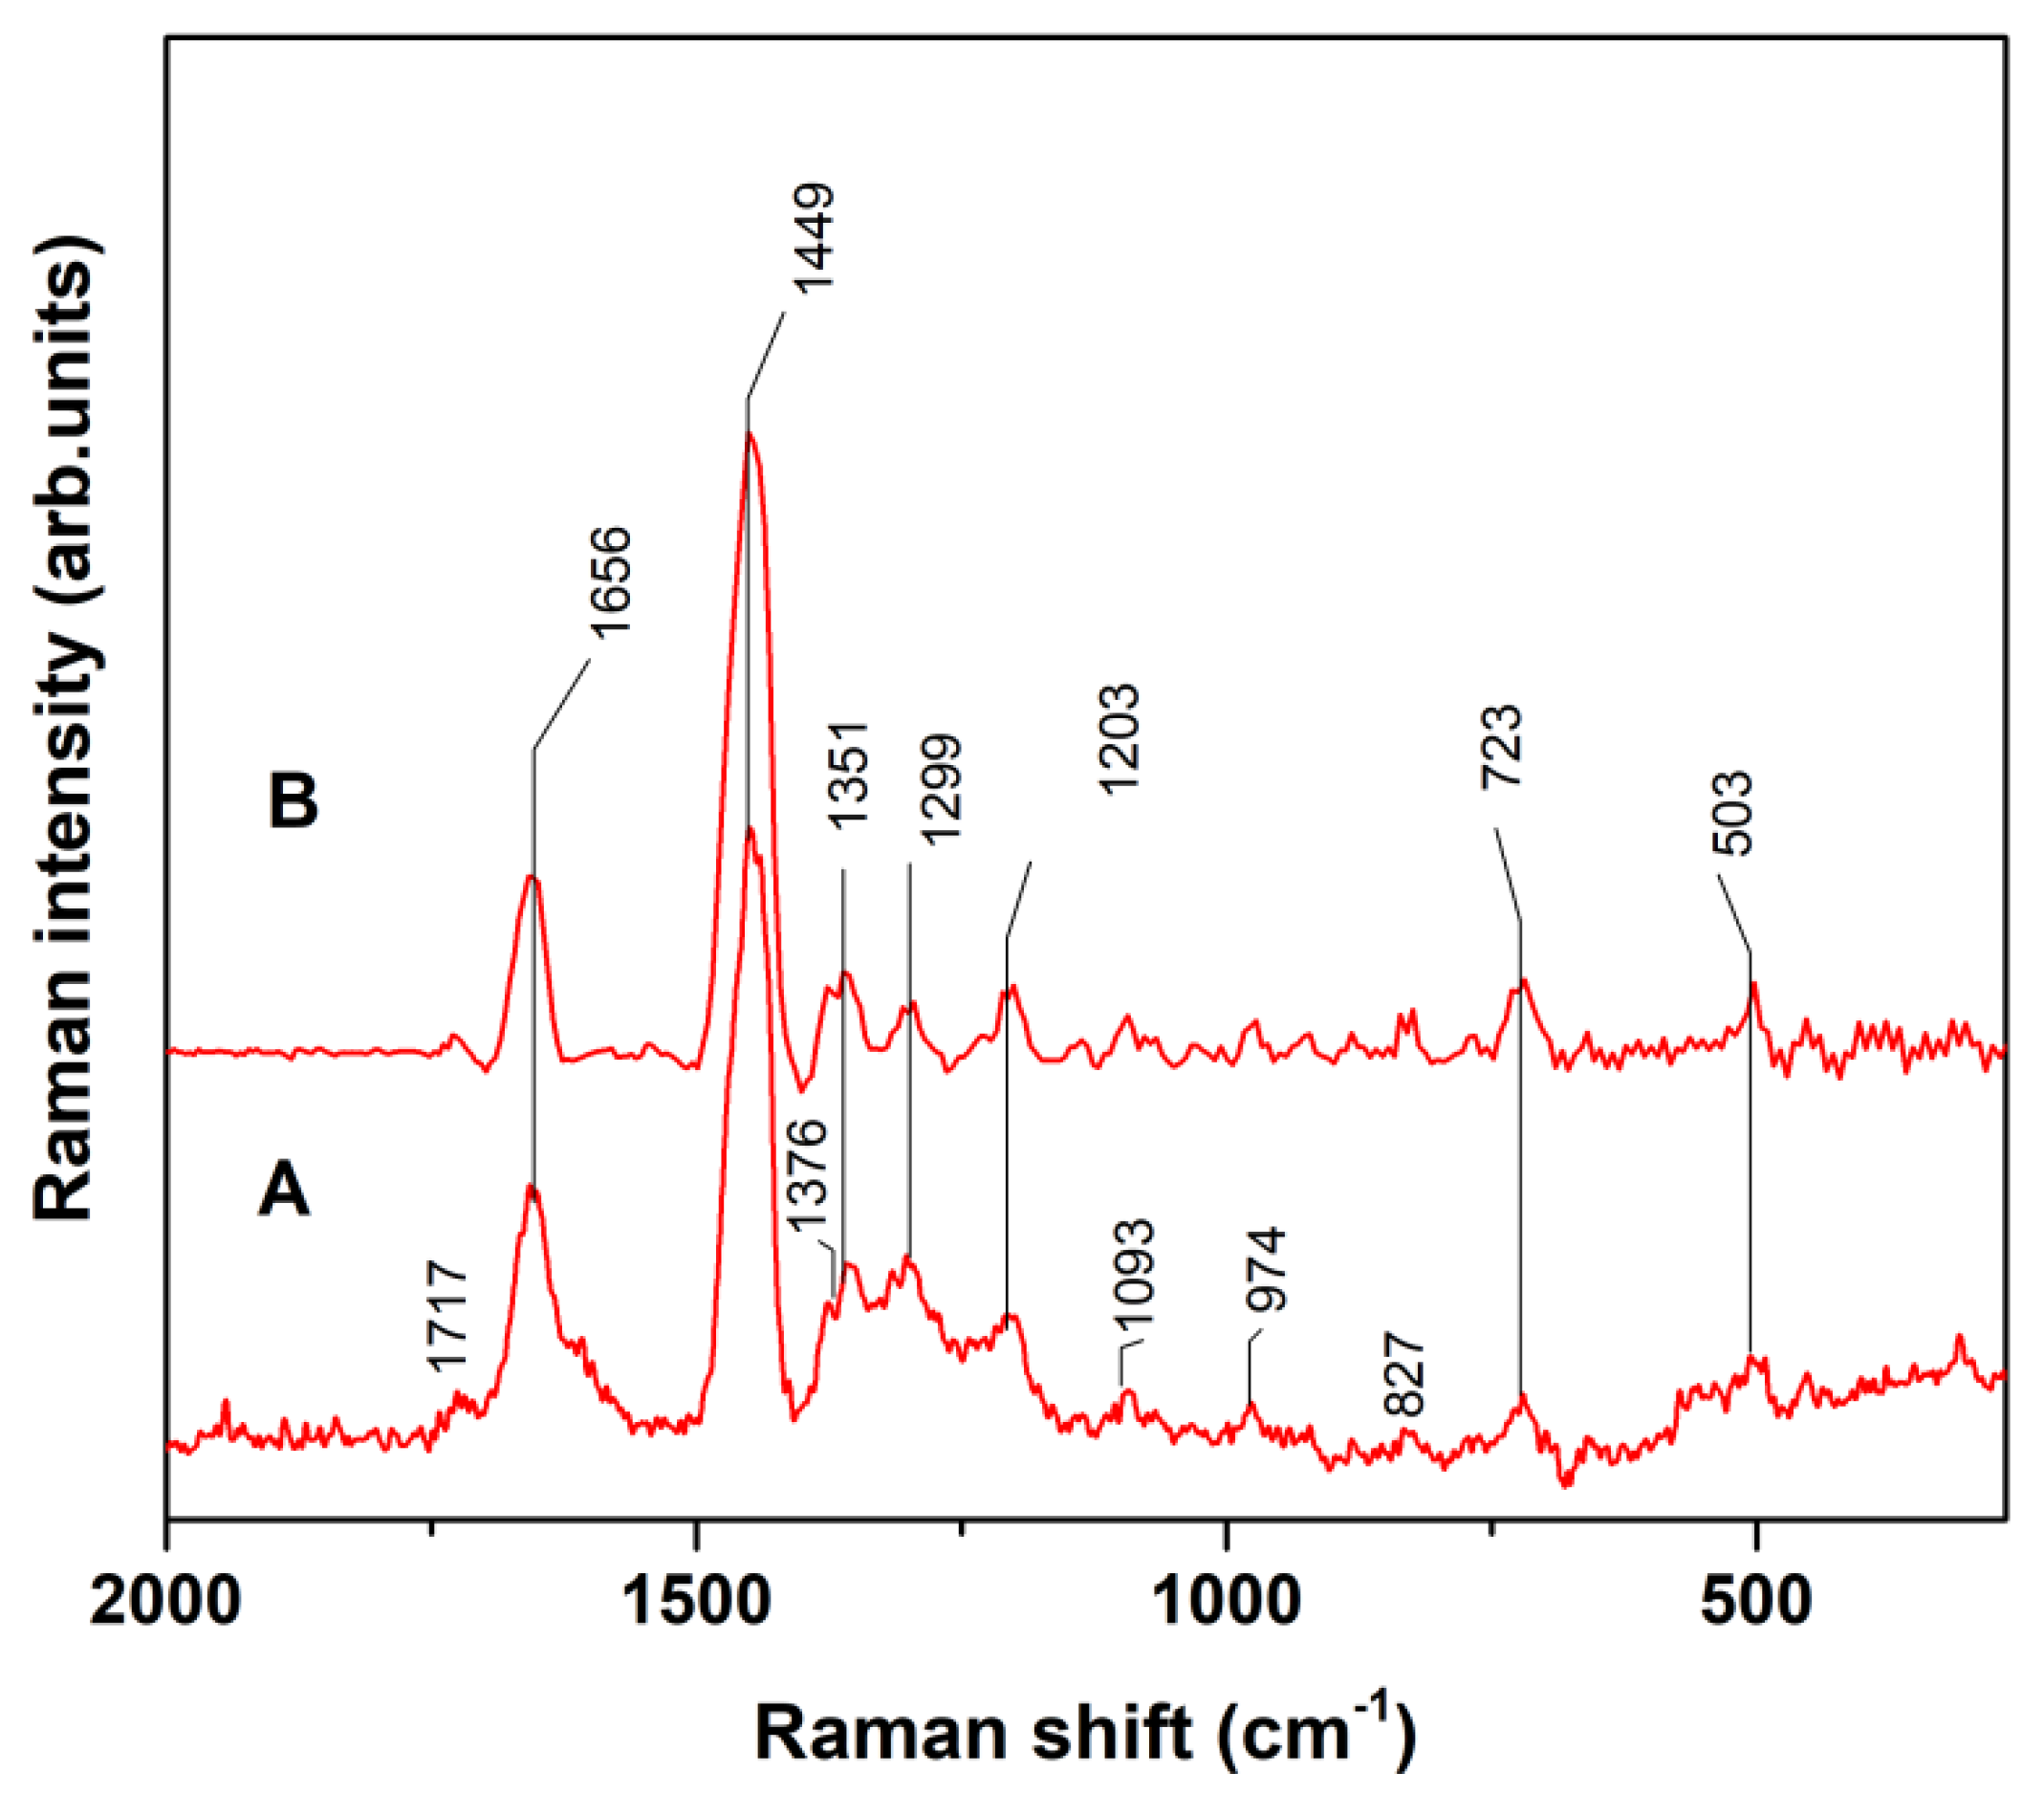
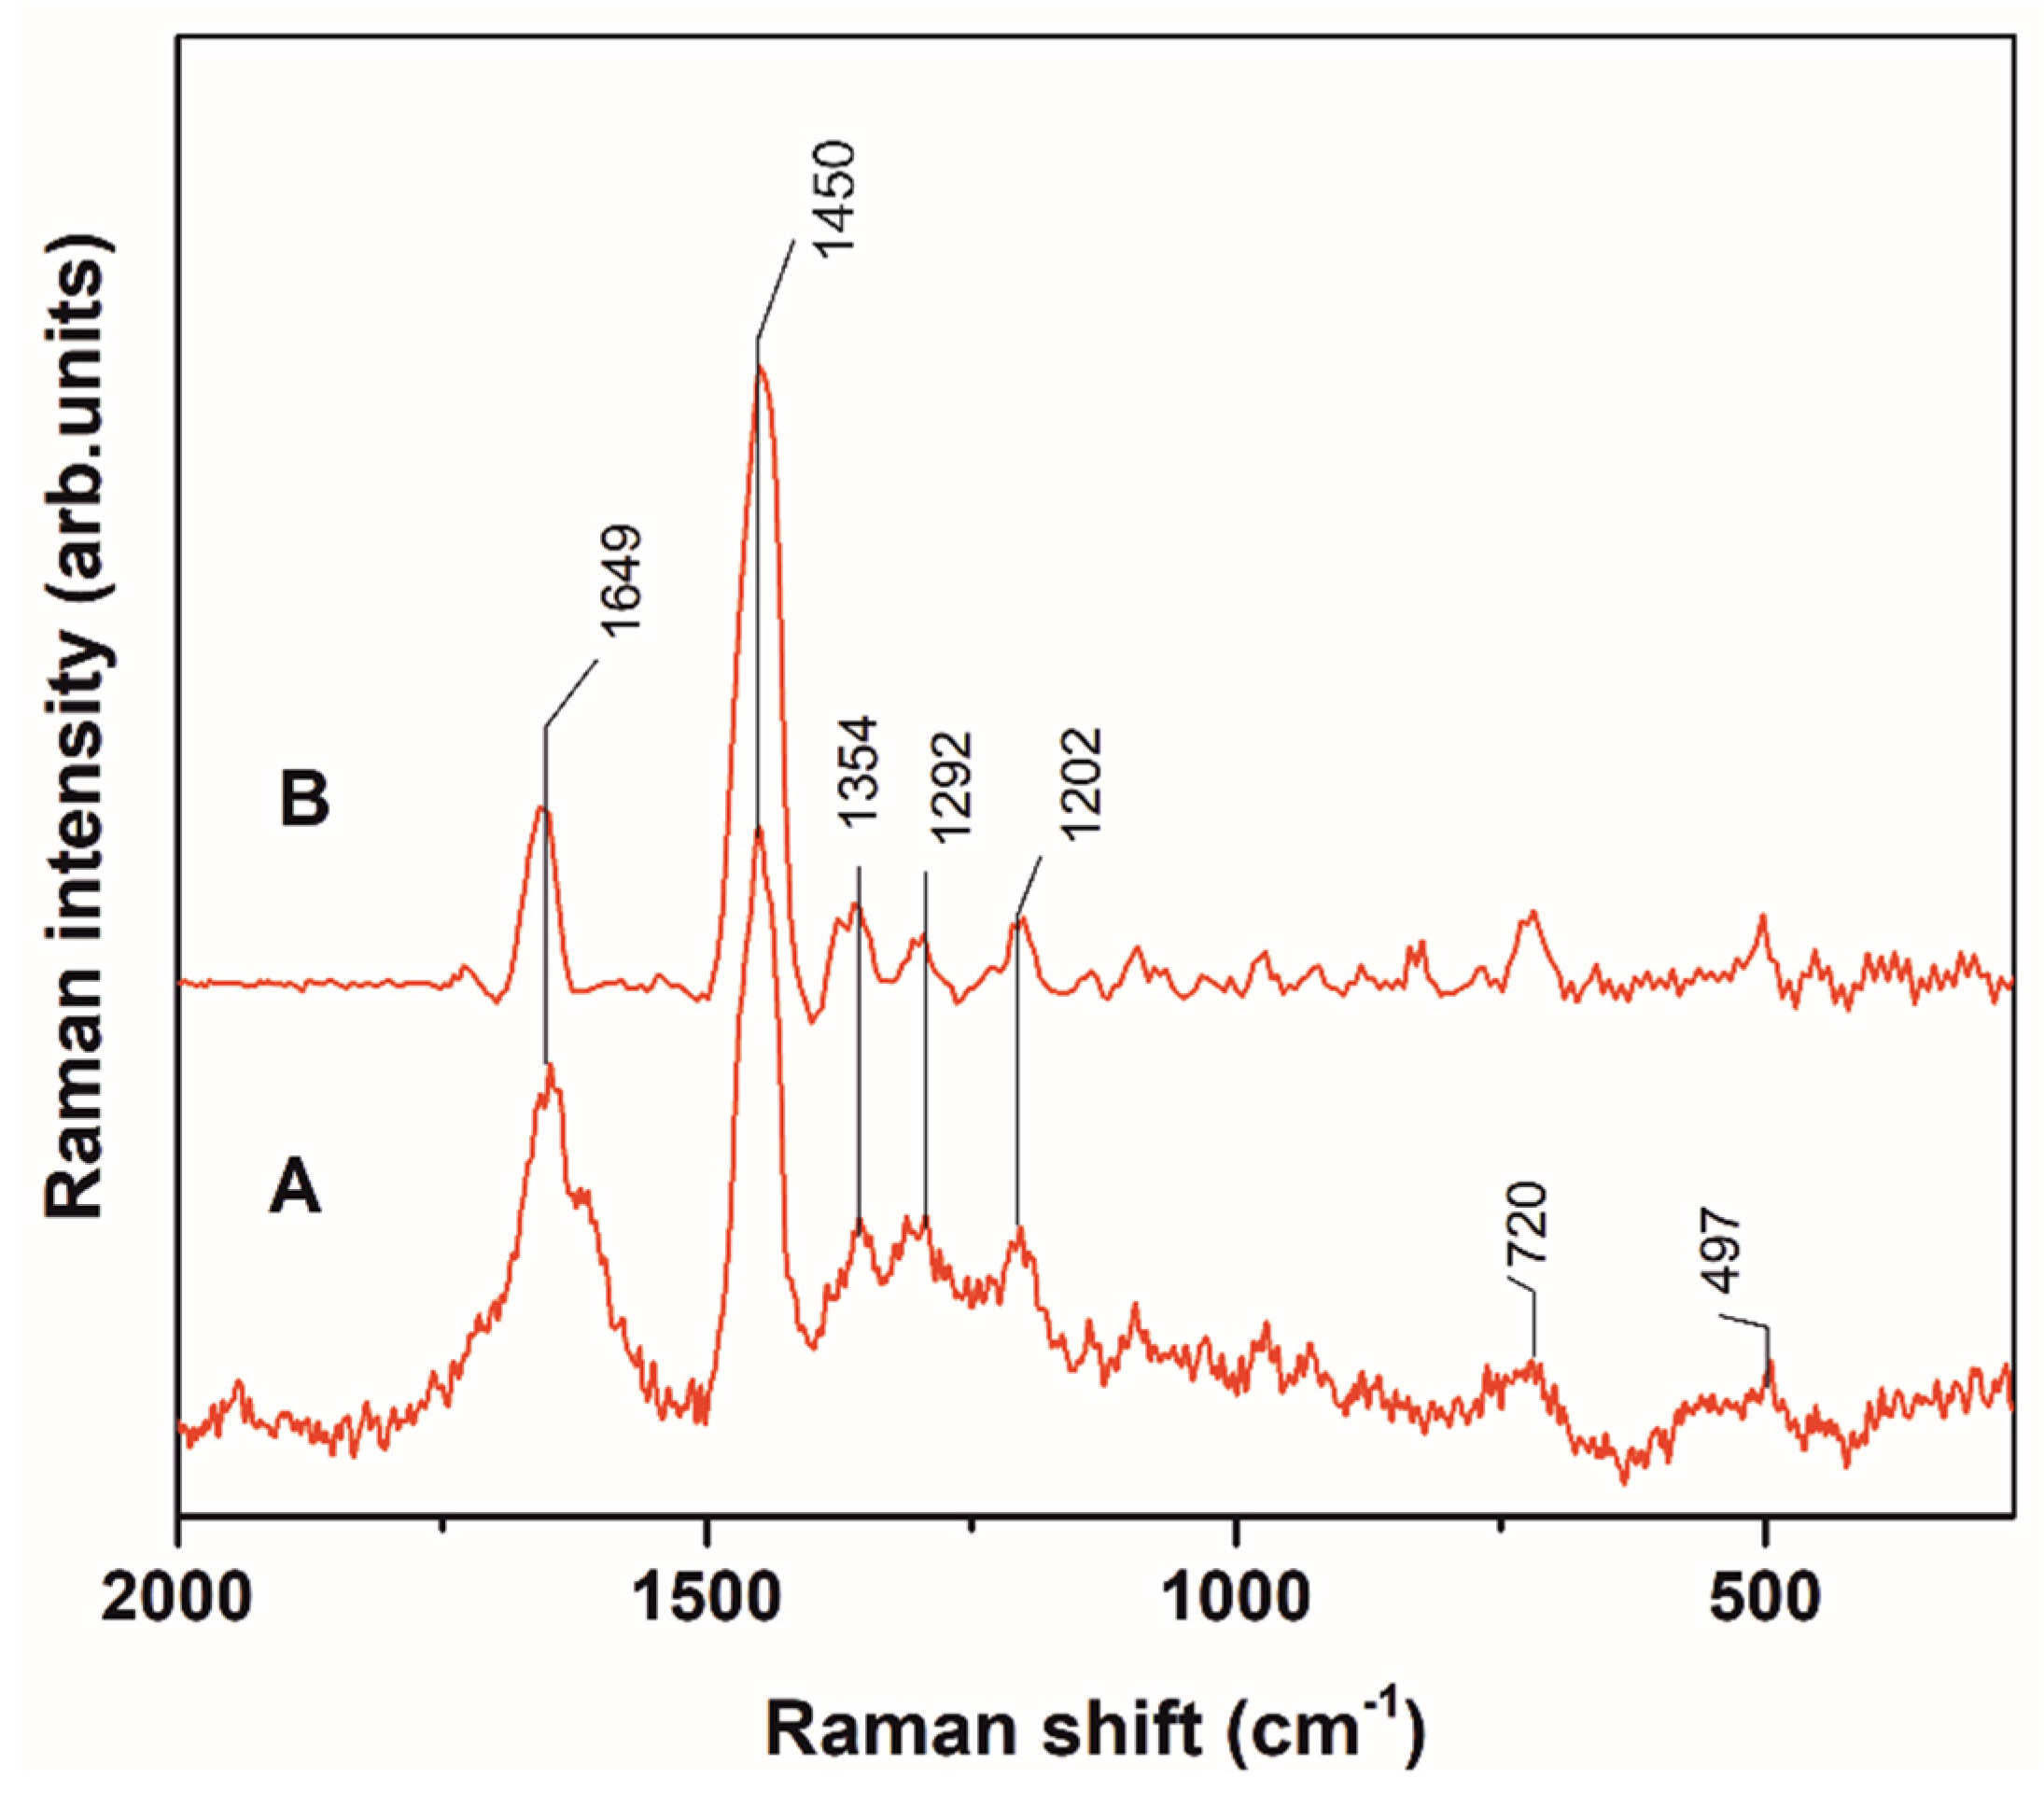
3.1. Comparison between NIR-Raman Portable, Handheld vs. Laboratory Benchtop Device for Fossil Resins Characterization
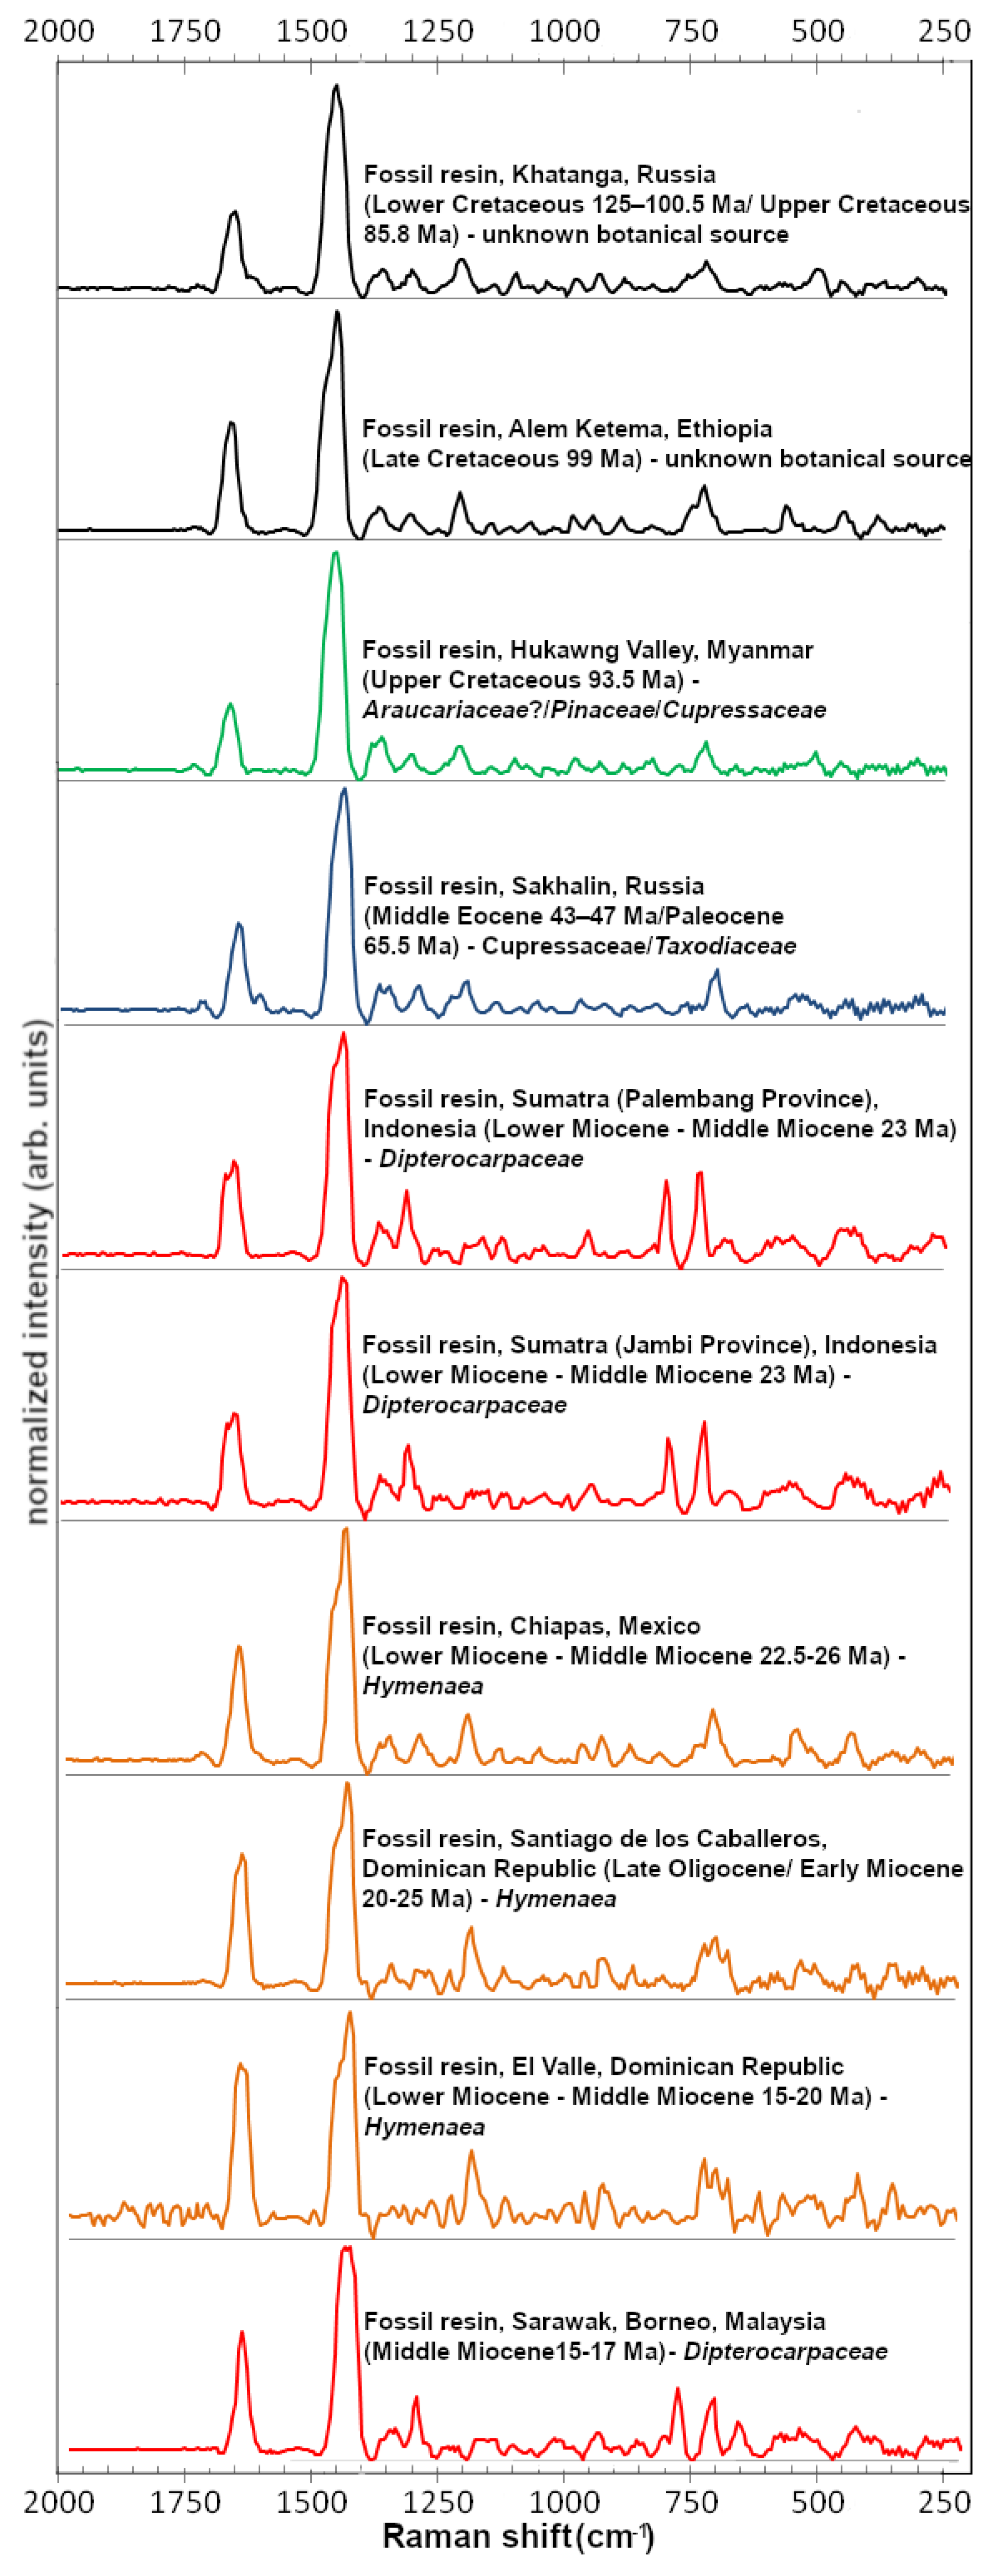
3.2. Fossil Resins Grouping Based on Criteria of Geographical Origin and Botanical Source
3.3. Fossil Resins Grouping Based on Age/Maturation Grade Criteria
4. Conclusions
- The Raman spectra of fossil resins, coming from various worldwide localities, and differing in age, botanical source, history of evolution and geological background, obtained with handheld, portable NIR-Raman spectrometer were very similar to these collected with a more advanced, benchtop Raman instrument. The only differences were found in the spectral region <800 cm−1, and locally in the intensities of some Raman bands.
- The differentiation of fossil resins of the same age and botanical source, coming from various geographical localities with Near infrared Raman spectroscopy is possible for samples coming from the Dominican Republic and Mexico (Miocene, Hymenae), but out of the question for specimens from Sumatra and Borneo (Miocene, Dipterocarpaceae). On the other hand, similar spectral features obtained for specimens of various ages and geographical localities may result from the same botanical source, as noted for resins coming from Ethiopia and Mexico. Hence, it was found that spectral features which reflect the chemical composition of fossil resins seem to depend mainly on their botanical source. Other factors affecting the features of Raman spectra are strongly connected with the alteration and maturation processes of the fossil resins.
- There was no direct correlation between the height ratio of 1640/1440 cm−1, which is commonly regarded as indicator of maturation grade, and fossil resins age. Interestingly, specimens of the same age (e.g., Dominican and Sumatran resins both of Miocene age) showed a different 1640/1440 cm−1 height ratio index, caused probably by the alterations under various temperature and pressure conditions. Hence, it was concluded, this 1640/1440 cm−1 height ratio index can provide additional data on geological events proceeding from the time of exudation through transportation, deposition in sedimentary basin to exhumation and re-exposure to hypergenic conditions, and thus will reflect the evolutionary history of resins.
Author Contributions
Funding
Acknowledgments
Conflicts of Interest
References
- Bartenev, G.M. Physics and Mechanics of Polymers; Chemistry Press: Moscow, Russia, 1983. [Google Scholar]
- Grimalt, J.O.; Simoneit, B.R.T.; Hatcher, P.G.; Nissenbaum, A. The molecular composition of ambers. Org. Geochem. 1988, 13, 677–690. [Google Scholar] [CrossRef]
- Gold, D.; Hazen, B.; Miller, W.G. Colloidal and polymeric nature of fossil amber. Org. Geochem. 1999, 30, 971–983. [Google Scholar] [CrossRef]
- Colchester, D.M.; Webb, G.; Emseis, P. Amber-like fossil resin from north Queensland, Australia. Aust. Gemm. 2006, 22, 378–385. [Google Scholar]
- Menor-Salván, C.; Simoneit, B.R.; Ruiz-Bermejo, M.; Alonso, J. The molecular composition of Cretaceous ambers: Identification and chemosystematic relevance of 1,6-dimethyl-5-alkyltetralins and related bisnorlabdane biomarkers. Org. Geochem. 2016, 93, 7–21. [Google Scholar] [CrossRef]
- Roghi, G.; Ragazzi, E.; Gianolla, P. Triassic amber of the southern Alps (Italy). Palaios 2006, 21, 143–154. [Google Scholar] [CrossRef]
- Ragazzi, E.; Alexander, R.S. (Eds.) Amber. In Encyclopedia of Geobiology; Springer: Dordrecht, The Netherlands, 2011; pp. 24–36. [Google Scholar]
- Beck, C.; Wilbur, E.; Meret, S.; Kossove, D.; Kermani, K. The infrared spectra of amber and the identification of Baltic amber. Archaeomntry 1965, 8, 96–109. [Google Scholar] [CrossRef]
- Gough, L.J.; Mills, J.S. The composition of succinite (Baltic Amber). Nature 1972, 239, 527–528. [Google Scholar] [CrossRef]
- Mills, J.S.; White, R.; Gough, L.J. The chemical composition of Baltic amber. Chem. Geol. 1984, 47, 15–39. [Google Scholar] [CrossRef]
- Mosini, V.; Samperi, R. Correlations between baltic amber and Pinus resins. Phytochemistry 1985, 24, 859–861. [Google Scholar] [CrossRef]
- Pakutinskiene, I.; Kiuberis, J.; Bezdicka, P.; Senvaitiene, J.; Kareiva, A. Analytical characterization of Baltic amber by FTIR, XRD and SEM. Can. J. Anal. Sci. Spectrosc. 2007, 52, 287–293. [Google Scholar]
- Wolfe, A.P.; Tappert, R.; Muehlenbachs, K.; Boudreau, M.; McKellar, R.C.; Basinger, J.F.; Garrett, A. A new proposal concerning the botanical origin of Baltic amber. Proc. R. Soc. B Biol. Sci. 2009, 276, 3403–3412. [Google Scholar] [CrossRef] [PubMed]
- Galletti, G.C.; Mazzeo, R. Pyrolysis/gas chromatography/mass spectrometry and Fourier-transform infrared spectroscopy of amber. Rapid Commun. Mass Spectrom. 1993, 7, 646–650. [Google Scholar] [CrossRef]
- Guiliano, M.; Asia, L.; Onoratini, G.; Mille, G. Applications of diamond crystal ATR FTIR spectroscopy to the characterization of ambers. Spectrochim. Acta Part A Mol. Biomol. Spectrosc. 2007, 67, 1407–1411. [Google Scholar] [CrossRef] [PubMed]
- Golubev, Y.A.; Martirosyan, O.V. The structure of the natural fossil resins of North Eurasia according to IR-spectroscopy and microscopic data. Phys. Chem. Miner. 2012, 39, 247–258. [Google Scholar] [CrossRef]
- Drzewicz, P.; Natkaniec-Nowak, L.; Czapla, D. Analytical approaches for studies of fossil resins. TrAC Trends Anal. Chem. 2016, 85, 75–84. [Google Scholar] [CrossRef]
- Kosmowska-Ceranowicz, B.; Vávra, N. Infrared Spectra of Fossil Resins, Subfossil Resins and Selected Imitation of Amber; Polish Academy of Science Museum of Earth: Warsaw, Poland, 2015. [Google Scholar]
- Edwards, H.G.; Farwell, D.W.; Villar, S.E.J. Raman microspectroscopic studies of amber resins with insect inclusions. Spectrochim. Acta Part A Mol. Biomol. Spectrosc. 2007, 68, 1089–1095. [Google Scholar] [CrossRef]
- Garty, J.; Giele, C.; Krumbein, W.E. On the occurrence of pyrite in a lichen-like inclusion in Eocene amber (Baltic). Palaeogeogr. Palaeoclimatol. Palaeoecol. 1982, 39, 139–147. [Google Scholar] [CrossRef]
- Grimaldi, D.; Bonwich, E.; Delannoy, M.; Doberstein, S. Electron Microscopic Studies of Mummified Tissues in Amber Fossils. Am. Mus. Novit. 1994, 3097, 1–31. [Google Scholar]
- Edwards, H.G.M.; Farewell, D.W. Fourier transform-Raman spectroscopy of amber. Spectrochim. Acta Part A Mol. Biomol. Spectrosc. 1995, 52, 1119–1125. [Google Scholar] [CrossRef]
- Moreno, Y.M.; Christensen, D.H.; Nielsen, O.F. A NIR-FT-Raman spectroscopic study of amber. Asian J. Spectrosc. 2000, 4, 49–56. [Google Scholar]
- Brody, R.H.; Edwards, H.G.M.; Pollard, A.M. A study of amber and copal samples using FT-Raman spectroscopy. Spectrochim. Acta Part A Mol. Biomol. Spectrosc. 2001, 57, 1325–1338. [Google Scholar] [CrossRef]
- Winkler, W.A.; Kirchner, E.C.; Asenbaum, A.; Musso, M. A Raman spectroscopic approach to the maturation process of fossil resins. J. Raman Spectrosc. 2001, 32, 59–63. [Google Scholar] [CrossRef]
- Winkler, W.; Musso, M.; Kirchner, E.C. Fourier transform Raman spectroscopic data on the fossil resin siegburgite. J. Raman Spectrosc. 2003, 34, 157–162. [Google Scholar] [CrossRef]
- Vandenabeele, P.; Grimaldi, D.M.; Edwards, H.G.M.; Moens, L. Raman spectroscopy of different types of Mexican copal resins. Spectrochim. Acta Part A Mol. Biomol. Spectrosc. 2003, 59, 2221–2229. [Google Scholar] [CrossRef]
- Jehlička, J.; Villar, S.E.J.; Edwards, H.G.M. Fourier transform Raman spectra of Czech and Moravian fossil resins from freshwater sediments. J. Raman Spectrosc. 2004, 35, 761–767. [Google Scholar] [CrossRef]
- Shashoua, Y.; Degn Berthelsen, M.B.L.; Nielsen, O.F. Raman and ATR-FTIR spectroscopies applied to the conservation of archaeological Baltic amber. J. Raman Spectrosc. 2006, 37, 1221–1227. [Google Scholar] [CrossRef]
- Jehlička, J.; Edwards, H.G.M. Raman spectroscopy as a tool for the non-destructive identification of organic minerals in the geological record. Org. Geochem. 2008, 39, 371–386. [Google Scholar] [CrossRef]
- Jehlička, J.; Vítek, P.; Edwards, H.G.M.; Heagraves, M.; Čapoun, T. Application of portable Raman instruments for fast and non-destructive detection of minerals on outcrops. Spectrochim. Acta Part A Mol. Biomol. Spectrosc. 2009, 73, 410–419. [Google Scholar] [CrossRef]
- Jehlička, J.; Vítek, P.; Edwards, H.G.M.; Hargreaves, M.; Čapoun, T. Rapid outdoor non-destructive detection of organic minerals using a portable Raman spectrometer. J. Raman Spectrosc. 2009, 40, 1645–1651. [Google Scholar] [CrossRef]
- Vítek, P.; Ali, E.M.A.; Edwards, H.G.M.; Jehlička, J.; Cox, R.; Page, K. Evaluation of portable Raman spectrometer with 1064nm excitation for geological and forensic applications. Spectrochim. Acta Part A Mol. Biomol. Spectrosc. 2012, 86, 320–327. [Google Scholar] [CrossRef]
- Rao, Z.; Dong, K.; Yang, X.; Lin, J.; Cui, X.; Zhou, R.; Deng, Q. Natural amber, copal resin and colophony investigated by UV-VIS, infrared and Raman spectrum. Sci. China Phys. Mech. Astron. 2013, 56, 1598–1602. [Google Scholar] [CrossRef]
- Havelcová, M.; Machovič, V.; Linhartová, M.; Lapčák, L.; Přichystal, A.; Dvořák, Z. Vibrational spectroscopy with chromatographic methods in molecular analyses of Moravian amber samples (Czech Republic). Microchem. J. 2016, 128, 153–160. [Google Scholar] [CrossRef]
- Beltran, V.; Salvadó, N.; Butí, S.; Cinque, G.; Pradell, T. Markers, reactions, and interactions during the aging of pinus resin assessed by Raman spectroscopy. J. Nat. Prod. 2017, 80, 854–863. [Google Scholar] [CrossRef] [PubMed]
- Peris-Díaz, M.D.; Łydżba-Kopczyńska, B.; Sentandreu, E. Raman spectroscopy coupled to chemometrics to discriminate provenance and geological age of amber. J. Raman Spectrosc. 2018, 49, 842–851. [Google Scholar] [CrossRef]
- Anderson, K.B.; Winans, R.E. Nature and fate of natural resins in the geosphere. I. Evaluation of pyrolysis-gas chromatography mass spectrometry for the analysis of natural resins and resinites. Anal. Chem 1991, 63, 2901–2908. [Google Scholar] [CrossRef]
- Tonidandel, L.; Ragazzi, E.; Traldi, P. Mass spectrometry in the characterization of ambers. II. Free succinic acid in fossil resins of different origin. Rapid Commun. Mass Spectrom. 2009, 23, 403–408. [Google Scholar] [CrossRef] [PubMed]
- Lambert, J.B.; Frye, J.S.; Poinar, G.O. Amber from the Dominican Republic: Analysis by nuclear magnetic resonance spectroscopy. Archaeometry 1985, 27, 43–51. [Google Scholar] [CrossRef]
- Lambert, J.B.; Johnson, S.C.; Poinar, G.O., Jr. Resin from Africa and South America: Criteria for distinguishing between fossilized and recent resin based on NMR spectroscopy. ACS Symp. Ser 1995, 617, 193–202. [Google Scholar]
- Lambert, J.B.; Levy, A.J.; Santiago-Blay, J.A.; Wu, Y. Nuclear magnetic resonance characterization of Indonesian amber. Life Excit. Biol. 2013, 1, 136–155. [Google Scholar] [CrossRef]
- Ragazzi, E.; Roghi, G.; Giaretta, A.; Gianolla, P. Classification of amber based on thermal analysis. Thermochim. Acta 2003, 404, 43–54. [Google Scholar] [CrossRef]
- Zhao, J.; Ragazzi, E.; McKenna, G.B. Something about amber: Fictive temperature and glass transition temperature of extremely old glasses from copal to Triassic amber. Polymer 2013, 54, 7041–7047. [Google Scholar] [CrossRef]
- Pagacz, J.; Stach, P.; Natkaniec-Nowak, L.; Naglik, B.; Drzewicz, P. Preliminary thermal characterization of natural resins from different botanical sources and geological environments. J. Therm. Anal. Calorim. 2019, 138, 4279–4288. [Google Scholar] [CrossRef]
- Matuszewska, A.; Gołąb, A. Próba wykorzystania parametru mikrotwardos’ci zywic kopalnych i sztucznych jako cechy klasyfikacyjnej (An attempt at using the parameter of the microhardness of fossil and artificial resins as a classification feature). Bursztynisko 2008, 31, 56–61. (In Polish) [Google Scholar]
- Stach, P.; Martinkutė, G.; Šinkūnas, P.; Natkaniec-Nowak, L.; Drzewicz, P.; Naglik, B.; Bogdasarov, M. An attempt to correlate the physical properties of fossil and subfossil resins with their age and geographic location. J. Polym. Eng. 2019, 39, 716–728. [Google Scholar] [CrossRef]
- Marshall, C.P.; Edwards, H.G.; Jehlička, J. Understanding the application of Raman spectroscopy to the detection of traces of life. Astrobiology 2010, 10, 229–243. [Google Scholar] [CrossRef] [PubMed]
- Kosmowska-Ceranowicz, B. Amber Researcher Günter Krumbiegiel and His Contacts with Poland; Amberif: Gdańsk, Poland, 2015; pp. 5–7. [Google Scholar]
- Schmidt, A.R.; Perrichot, V.; Svojtka, M.; Anderson, K.B.; Belete, K.H.; Bussert, R.; Dörfelt, H.; Jancke, S.; Mohr, B.; Mohrmann, E.; et al. Cretaceous African life captured in amber. Proc. Natl. Acad. Sci. USA 2010, 107, 7329–7334. [Google Scholar] [CrossRef] [PubMed]
- Coty, D.; Lebon, M.; Nel, A. When phylogeny meets geology and chemistry: Doubts on the dating of Ethiopian amber. In Annales de la Société entomologique de France (NS); Taylor & Francis: Abingdon, UK, 2016; Volume 52, pp. 161–166. [Google Scholar]
- Gani, N.; Abdelsalam, M.G.; Gera, S.; Gani, M.R. Stratigraphic and structural evolution of the Blue Nile Basin, northwestern Ethiopian plateau. Geol. J. 2009, 44, 30–56. [Google Scholar] [CrossRef]
- Bogdasarow, M.A. Amber and Others Fossil Resins of Eurasia; Brest State University AS. Pushkin: Brest, France, 2010; 263p. (In Russian) [Google Scholar]
- Remm, H. Midges (Diptera, Ceratopogonidae) from the Upper Cretaceous fossil resins of the Khatanga depression. Paleontologitseckiy Zhurnal 1976, 3, 107–116. [Google Scholar]
- Kosmowska-Ceranowicz, B. Bursztyn w Polsce i na Świecie (Amber in Poland and in the World), 2nd ed.; Wydawnictwo Uniwersytetu Warszawskiego: Warsaw, Poland, 2017; 310p. [Google Scholar]
- Poinar, G.O. Life in Amber; Stanford University Press: California, CA, USA, 1992. [Google Scholar]
- Azar, D.; Adaymeh, C.; Jreich, N. Paleopsychoda zherikhini, a new Cretaceous species of moth flies from Taimyr amber (Diptera: Psychodidae: Psychodinae). Afr. Invertebr. 2007, 48, 163–168. [Google Scholar]
- Grimaldi, D.A.; Engel, M.S.; Nascimbene, P.C. Fossiliferous Cretaceous amber from Myanmar (Burma): Its rediscovery, biotic diversity, and paleontological significance. Am. Mus. Novit. 2002, 2002, 1–71. [Google Scholar] [CrossRef]
- Shi, G.; Grimaldi, D.A.; Harlow, G.E.; Wang, J.; Wang, J.; Yang, M.; Lei, W.; Li, Q.; Li, X. Age constraint on Burmese amber based on U–Pb dating of zircons. Cretac. Res. 2012, 37, 155–163. [Google Scholar] [CrossRef]
- Cruickshank, R.D.; Ko, K. Geology of an amber locality in the Hukawng Valley, northern Myanmar. J. Asian Earth Sci. 2003, 21, 441–455. [Google Scholar] [CrossRef]
- Radchenko, A.G.; Perkowsky, E.E. The ant Aphaenogaster dlusskyana sp. nov. (Hymenoptera, Formicidae) from the Sakhalin amber—The earliest described species of an extant genus of Myrmicinae. Paleontol. J. 2016, 50, 936–946. [Google Scholar] [CrossRef]
- Kraemer, M.S. Mexican amber. In Biodiversity of Fossils in Amber from the Major World Deposits; Siri Scientific Press: Manchester, UK, 2010; pp. 42–56. [Google Scholar]
- Langenheim, J.H. Plant Resins: Chemistry, Evolution, Ecology, and Ethnobotany; Timber Press: Portland, OR, US, 2003. [Google Scholar]
- Iturralde-Vinent, M.A.; MacPhee, R.D.E. Age and paleogeographical origin of Dominican amber. Science 1996, 273, 1250–1252. [Google Scholar] [CrossRef]
- Poinar, J. Palaeoecological perspectives in Dominican amber. Ann. Soc. Entomol. Fr. 2010, 46, 23–52. [Google Scholar] [CrossRef]
- Iturralde-Vinent, M.A. Geology of the amber-bearing deposits of the Greater Antilles. Caribb. J. Sci. 2001, 37, 141–167. [Google Scholar]
- Bachmann, R. The Caribbean Plate and the Question of Its Formation; Institute of Geology, University of Mining and Technology, Department of Tectonophysics: Freiberg, Germany, 2001. [Google Scholar]
- Liechti, P.; Roe, F.W.; Haile, N.S. The Geology of Sarawak, Brunei and the Western Part of North Borneo; Geological Survey Dept: British Territories in Borneo, Borneo, 1960. [Google Scholar]
- Hall, R.; van Hattum, M.W.; Spakman, W. Impact of India–Asia collision on SE Asia: The record in Borneo. Tectonophysics 2008, 451, 366–389. [Google Scholar] [CrossRef]
- Ngô-Muller, V.; Garrouste, R.; Pouillon, J.M.; Christophersen, V.; Christophersen, A.; Nel, A. The first representative of the fly genus Trentepohlia subgenus Mongoma in amber from the Miocene of Sumatra (Diptera: Limoniidae). Historical Biology 2019, 1–4. [Google Scholar]
- Brackman, W.; Spaargaren, K.; Van Dongen, J.P.C.M.; Couperus, P.A.; Bakker, F. Origin and structure of the fossil resin from an Indonesian Miocene coal. Geochim. Cosmochim. Acta. 1984, 48, 2483–2487. [Google Scholar] [CrossRef]
- Barber, A.J.; Crow, M.J.; Milsom, J.S. (Eds.) Sumatra: Geology, Resources and Tectonic Evolution; Geological Society of London: London, UK, 2005. [Google Scholar]
- Adiwidjaja, P.; De Coster, G.L. Pre-Tertiary paleotopography and related sedimentation in South Sumatra. In Proceedings of the Annual Convention—Indonesian Petroleum Association 2; AAPG: Okla, OK, USA, 1973; pp. 89–103. [Google Scholar]
- Naglik, B.; Kosmowska-Ceranowicz, B.; Natkaniec-Nowak, L.; Drzewicz, P.; Dumańska-Słowik, M.; Matusik, J.; Wagner, M.; Milovsky, R.; Stach, P.; Szyszka, A. Fossilization History of Fossil Resin from Jambi Province (Sumatra, Indonesia) Based on Physico-Chemical Studies. Minerals 2018, 8, 95–107. [Google Scholar] [CrossRef]
- Bechtel, A.; Chekryzhov, I.Y.; Nechaev, V.P.; Kononov, V.V. Hydrocarbon composition of Russian amber from the Voznovo lignite deposit and Sakhalin Island. Int. J. Coal Geol. 2016, 167, 176–183. [Google Scholar] [CrossRef]
- Poinar, G., Jr.; Brown, A.E. Hymenaea mexicana sp. nov. (Leguminosae: Caesalpinioideae) from Mexican amber indicates Old World connections. Bot. J. Linn. Soc 2002, 139, 125–132. [Google Scholar] [CrossRef]
- Calvillo-Canadell, L.; Cevallos-Ferriz, S.; Rico-Arce, L. Miocene Hymenaea flowers preserved in amber from Simojovel de Allende, Chiapas, Mexico. Rev. Palaeobot. Palynol. 2010, 160, 126–134. [Google Scholar] [CrossRef]
- Cunningham, A.; Gay, I.D.; Oehlschlager, A.C.; Langenheim, J.H. 13C NMR and IR analyses of structure, aging and botanical origin of Dominican and Mexican ambers. Phytochemistry 1983, 22, 965–968. [Google Scholar] [CrossRef]
- Perrichot, V.; Boudinot, B.; Cole, J.; Delhaye-Prat, V.; Esnault, J. African fossiliferous amber: A review. In Proceedings of the 7th International Conference on Fossil Insects, Arthropods and Amber, Edinburgh, UK, 26 April–1 May 2016. [Google Scholar]
- McCoy, V.E.; Boom, A.; Kraemer, M.M.S.; Gabbott, S.E. The chemistry of American and African amber, copal and resin from the genus Hymenaea. Org. Geochem. 2017, 113, 43–54. [Google Scholar] [CrossRef]
- Kosmowska-Ceranowicz, B.; Sachanbiński, M.; Łydżba-Kopczyńska, B. Analytical characterization of “Indonesian amber” deposits: Evidence of formation from volcanic activity. Baltica 2017, 30, 55–60. [Google Scholar] [CrossRef]
- Pagacz, J.; Naglik, B.; Stach, P.; Drzewicz, P.; Natkaniec-Nowak, L. Maturation process of natural resins recorded in their thermal properties. J. Mater. Sci. 2020, 55, 4504–4523. [Google Scholar] [CrossRef]


| Sample Label | Age | Botanical Origin | Geological Settings | Samples Description |
|---|---|---|---|---|
| Ethiopia | late Cretaceous (late Cenomanian) 93–95 Ma [50 or Cenozoic (likely Miocene?) [51] | Unknown [50] | Resins occur within Debre Libanos Sandstone Unit (DLSU) from the northwestern Plateau [50]. DLSU represents continental, alluvial to fluvial depositional environment. It consists of medium to coarse grained sandstones showing dune-scale trough cross-bedding and horizontal stratifications. The DLSU unit was deposited during the NE–SW-directed extension related to Mesozoic rifting of Gondwana [52]. Those deposits are overlaid by Early-Late Oligocene volcanic rocks (basalts, trachytes, rhyolites). | Black colour, opacity |
| Russia, Khatanga | lower Cretaceous (Aptian-Albian) 125–100.5 Ma [53]/ upper Cretaceous (Santonian) 85.8 Ma [54,55] | Unknown [54,56] | Resins occur within Begichev Formation (Eastern Taymir) [57]. It consists of lagoon and coastal sediments of alluvial origin (sands) with interbeddings of clays, aleurites and coal horizons [53]. | Red to brown colour, transparency |
| Myanmar (Burma) | upper Cretaceous (Cenomanian?/Turonian?) 93.5 Ma [58] | Araucariaceae/ Pinaceae/ Cupressaceae [59] | Amber-bearing sediments are clastic sedimentary rocks ranging from fine sandstones to shales. The amber discs lie parallel to the bedding planes of finer sediment [60]. Volcanic event dated on Cenomanian is reflected in the presence of volcanic clasts. | Red to brown colour, transparency |
| Russia, Sakhalin Island | middle Eocene 43–47 Ma [61]; Paleocene–65.5 Ma [53] | Ancient species of the gymnosperm families Cupressaceae/ Taxodiaceae [53] | Quartzite altered at the p-T conditions of catagenesis [53] | Red to brown colour, transparency, shape of flat discs |
| Mexico, Chiapas | lower Miocene–middle Miocene 22.5–26 Ma [62] | Extinct Hymenaea mexicana [62] | Resins occur within three lithostratigraphic formations: Marine calcareous sandstones and silt with beds of lignite–the Early Miocene Quinta or Simojovel Fm, the Lower Middle Miocene dark-grey shales of the Mazantic Shale, Lower Miocene grey-blue to grey-green sandstones of the Balumtun Fm [62] | Yellow to brown colour, transparency |
| Dominican Republic (Cordillera Oriental) El Valle | lower Miocene–middle Miocene 15–20 Ma [63] | Hymenaea [64,65] | The Yanigua Formation is the amber-bearing unit of the eastern area of the Dominican Republic. Formation consists of conglomerates, dark clays, laminated sandy clays, lignite and carbonaceous clays and sandstones. These beds contain flattened and irregular inclusions of amber, usually as pockets or lenses ranging from a few millimeters to several centimeters in size, and may also contain freshto brackish water ostracods and molluscs [64,66] | Yellow to brown colour, transparency, visible strong blue fluorescence |
| Dominican Republic (Cordillera Septentrional Santiago de los Caballeros) | late Oligocene-early Miocene 20–25 Ma [64,65] | Hymenaea [64,65] | The La Toca Formation is the second amber-bearing unit of the northern part of the Dominican Republic. Its thickness is estimated at ca. 1200 m. There are mainly clastic (conglomerates and sandstones) rocks cutting by thin lignite beds with fragments of carbonized wood. This is probably an accumulation of deposits in different environments from deltaic to deepwater [64,66,67] | Yellow to brown colour, transparency, visible strong blue fluorescence |
| Borneo, Sarawak, Malaysia | Neogene/ Miocene; middle Miocene 15–17 Ma [55] | Dipterocarpus [55] | During the earliest Middle Miocene volcanic activity increased. Merit Pila amber was formed together within a layer of brown coal in the Nyalau Formation (NF). The unit consists of sandstones, coal layers and conglomerates. These sediments were deposited under humid tropical conditions. Amber was formed in a damp swamp surrounded by mountainous terrain. Deposition occurred in the lake and wetland flooded by sea water [68,69] | Yellow to brown colour, transparency, visible blue fluorescence |
| Sumatra, Jambi, Indonesia | lower Miocene-middle Miocene 15–23 Ma [70,71] | Dipterocarpaceae family belonging to angiosperms group [70,71] | Resins occur in coal layers (lignite beds) within middle Miocene sediments representing the transgressive depositional system of Talang Akar Formation (TAF). Sediments were uplifted, folded and faulted due to the Pliocene-Pleistocene orogeny associated with volcanic activity [72,73] | Yellow to brown colour, transparency, visible strong blue fluorescence |
| Sumatra, Palembang, Indonesia | lower Miocene −23 Ma [70,71] | Dipterocarpaceae [70,71] | Yellow to brown colour, very strong blue fluorescence |
| Ethiopia | Russia (Khatanga) | Myanmar | Russia (Sakhalin Island) | Mexico (Chiapas) | Dominican Republic (El Valle) | Dominican Republic (Santiago de los Caballeros) | Borneo (Sarawak) | Sumatra (Jambi) | Sumatra (Palembang) | Proposed Band Assignment |
|---|---|---|---|---|---|---|---|---|---|---|
| - | - | - | - | - | 371 | - | - | - | - | δ(CCC) [24] |
| 444 | - | - | - | 445 | 439 | - | - | - | - | unknown |
| - | 497 | 503 | - | - | - | - | - | - | - | ν(COC) [24] |
| 555 | - | - | - | 554 | - | - | - | - | - | δ(CCO) [24] |
| - | - | - | - | - | 695 | 695 | - | - | - | ν(CC)isolated [24] |
| 720 | 720 | 723 | 708 | 718 | 720 | 724 | 732 | 731 | 733 | νC-C [25] |
| - | - | - | - | - | 744 | 747 | - | - | - | ν(CC)isolated [24] |
| - | - | - | - | - | - | - | 800 | 799 | 800 | aromatic hydrocarbonsdeformations [27] |
| 1201 | 1202 | 1203 | 1205 | 1203 | 1202 | 1201 | - | - | - | δ(CCH) [24] |
| 1299 | 1292 | 1299 | 1295 | 1296 | - | - | 1315 | 1316 | 1316 | δ(CH2), δ(CH3) [24] |
| - | - | - | 1349 | - | - | - | - | - | 1330 | δ(CH2), δ(CH3) [24] |
| 1360 | 1354 | 1351 | 1372 | 1357 | - | - | 1360 | 1360 | - | δ(CH2), δ(CH3) [24] |
| 1443 | 1450 | 1449 | 1443 | 1442 | 1442 | 1462/1438 | 1449 | 1442 | 1442 | δ(CH2), δ(CH3) [24] |
| - | - | - | 1610 | - | - | - | - | - | - | ν(C=C)aromatic [24] |
| 1652 | 1649 | 1656 | 1649 | 1653 | 1658 | 1642 | 1657 | 1657 | 1657 | ν(C=C) non conj. [24] |
| Age | Sample label | Height Ratio of 1640/1440 cm−1 |
|---|---|---|
| Cretaceous | Ethiopia | 0.51 ± 0.01 |
| Cretaceous | Russia (Khatanga) | 0.40 ± 0.06 |
| Cretaceous | Myanmar | 0.33 ± 0.02 |
| Eocene | Russia (Sakhalin Island) | 0.36 ± 0.01 |
| Miocene | Mexico (Chiapas) | 0.52 ± 0.01 |
| Miocene | Dominican Republic (El Valle) | 0.79 ± 0.02 |
| Miocene | Dominican Republic (Santiago de los Caballeros) | 0.66 ± 0.12 |
| Miocene | Borneo (Sarawak) | 0.60 ± 0.03 |
| Miocene | Sumatra (Jambi) | 0.44 ± 0.06 |
| Miocene | Sumatra (Palembang) | 0.46 ± 0.02 |
© 2020 by the authors. Licensee MDPI, Basel, Switzerland. This article is an open access article distributed under the terms and conditions of the Creative Commons Attribution (CC BY) license (http://creativecommons.org/licenses/by/4.0/).
Share and Cite
Naglik, B.; Mroczkowska-Szerszeń, M.; Dumańska-Słowik, M.; Natkaniec-Nowak, L.; Drzewicz, P.; Stach, P.; Żukowska, G. Fossil Resins–Constraints from Portable and Laboratory Near-infrared Raman Spectrometers. Minerals 2020, 10, 104. https://doi.org/10.3390/min10020104
Naglik B, Mroczkowska-Szerszeń M, Dumańska-Słowik M, Natkaniec-Nowak L, Drzewicz P, Stach P, Żukowska G. Fossil Resins–Constraints from Portable and Laboratory Near-infrared Raman Spectrometers. Minerals. 2020; 10(2):104. https://doi.org/10.3390/min10020104
Chicago/Turabian StyleNaglik, Beata, Maja Mroczkowska-Szerszeń, Magdalena Dumańska-Słowik, Lucyna Natkaniec-Nowak, Przemysław Drzewicz, Paweł Stach, and Grażyna Żukowska. 2020. "Fossil Resins–Constraints from Portable and Laboratory Near-infrared Raman Spectrometers" Minerals 10, no. 2: 104. https://doi.org/10.3390/min10020104
APA StyleNaglik, B., Mroczkowska-Szerszeń, M., Dumańska-Słowik, M., Natkaniec-Nowak, L., Drzewicz, P., Stach, P., & Żukowska, G. (2020). Fossil Resins–Constraints from Portable and Laboratory Near-infrared Raman Spectrometers. Minerals, 10(2), 104. https://doi.org/10.3390/min10020104