Article

Laboratory Studies of Small Strain Stiffness and Modulus Degradation of Warsaw Mineral Cohesive Soils

1
Department of Geotechnical Engineering, Institute of Civil Engineering, Warsaw University of Life Sciences, 02787 Warsaw, Poland
2
Water Centre, Warsaw University of Life Sciences, 02787 Warsaw, Poland
3
Department of Hydrotechnics and Technology, Institute of Civil Engineering, 02787 Warsaw, Poland
4
Institute of Hydraulic Engineering, Vytautas Magnus University Agriculture Academy, 53361 Kaunas, Lithuania
*
Author to whom correspondence should be addressed.
Minerals 2020, 10(12), 1127; https://doi.org/10.3390/min10121127
Submission received: 30 October 2020 / Revised: 27 November 2020 / Accepted: 8 December 2020 / Published: 15 December 2020
(This article belongs to the Special Issue Clays, Clay Minerals and Geology)

Abstract

:
The shear modulus and normalized shear modulus degradation curve are the fundamental parameters describing soil behavior. Thus, this article is focused on the stiffness characteristic of 15 different Warsaw cohesive soli represented by the parameters mentioned above. In this research, standard resonant column tests were performed in a wide shear strain range, from a small one, where soil behaves like an elastic medium, to a medium one, where soil has an unrecoverable deformation. Collected data allows the authors to create empirical models describing stiffness characteristics with high reliability. The maximum shear modulus calculated by the proposed equation for Warsaw cohesive soil had a relative error of about 6.8%. The formula for normalized shear modulus estimated G/GMAX with 2.2% relative error. Combined empirical models for GMAX, and G/GMAX allow the evaluation of Warsaw cohesive soil’s shear modulus value in a wide shear deformation range, with a very low value of the relative error of 6.7%.

1. Introduction

It is commonly known that deformation characteristics of soils in soil dynamics and earthquake engineering are expressed in terms of shear stiffness (G) and damping ratio (D), which are the fundamental parameters describing soil behavior [1]. Knowledge of soil stiffness is required to calculate ground movements and obtain solutions to soil–structures interaction systems [2], when subjected to cyclic and dynamic loadings, i.e., earthquakes, machine vibration, vehicular traffic, blasting, pile driving, etc.
Soil behavior is generally nonlinear and plastic in nature. However, at the low shear strain level, below 10−3%, the soils’ response is usually assumed to be linear and elastic. Therefore, the corresponding properties are referred to as small strain properties or elastic properties [3]. The small strain properties of soil include shear modulus (GMAX), Young’s modulus (EMAX), bulk modulus (KMAX), constrained modulus (MMAX) and Poisson’s ratio (ν). As recognized, shear modulus decreases and damping ratio increases as shearing strain amplitude (γ) increases exceeding the threshold level defined in, e.g., Bai [4]. These properties are regarded as the nonlinear dynamic properties and they are usually described by the modulus reduction (G/G0) and damping curves. They are of important for the response analysis of several dynamic problems, especially for high strain cases (γ > 10−3%) [5].
Values of small strain soil properties can be measured both in field and laboratory using dynamic techniques and through a wide range of strains in the laboratory only. Laboratory testing plays a vital role in soil stiffness determination. Still, it is already noted that they can suffer from various disadvantages such as sample disturbance, sample preparation and apparatus sophistication [6]. Two different methods predominate in laboratory tests. The first one involves measuring the local strain in triaxial testing [7,8], using some standard instrumentation, e.g., the linear variable differential transformer (LVDT) [9] or submersible proximity sensor [10]. The second method is carried out under quasi-static loading and includes the potential use of dynamic testing, such as resonant column, bender elements and cyclic triaxial testing [11]. It is worth emphasizing that resonant column (RC) tests and combined resonant column/torsional shear (RC/TS) studies are one of the most popular in determining GMAX and G/GMAX.
The small strain and nonlinear dynamic soil properties are affected by a number of parameters with varying levels of importance. These parameters can be divided into two groups, namely factors related to loading conditions (strain amplitude, mean effective stress, long term time effect, number of loading cycles, loading frequency or strain rate, overconsolidation ratio or loading history) and factors regarding physical properties of soil (soil type, size, shape of grains or void ratio) [12]. Hardin and Black [13] proposed a function to describe factors that influence shear stiffness as follows:
G = F ( σ 0 , e , H , S , τ 0 , C , A , f , T , θ , K )
where, G is the shear modulus, σ0 is the mean principal effective stress (or isotropic confining pressure), e is the void ratio, H is the ambient stress history, S is the degree of saturation, τ0 is the deviatoric component of ambient stress, C is the grain characteristics (grain shape, gradation and mineralogy), A is the strain amplitude of vibration/loading, f is the frequency of vibration/loading, θ is the soil structure and K is the temperature. Over the last decades, many investigations were conducted to find the most important factors [4,5,13].
In this article, the results of RC tests performed for the investigation of the dynamic properties of natural mineral cohesive soils from Warsaw in the context of man-made vibrations such as traffic (trains, buses and lorries) and civil construction activities (installation of piles or sheet piles, tunneling, demolishing structures, etc.) are presented. The behavior of soils and the relationships for the estimation of GMAX and G/GMAX for cohesive soils proposed in the literature are described. Numerous researchers proposed their own model for soil stiffness calculation. Nevertheless, they proved to be inappropriate for the soil studied (clay mixtures and sand mixtures) in this publication. The resulting large inconsistencies between the measured values of deformation parameters and these calculated from the literature models determined the further search for more suitable formulas in order to reduce, e.g., absolute and relative errors. Thus, the major contribution of this work is to provide new empirical expressions, based on the own experiments, to correlate small strain and nonlinear stiffness to important factors (e.g., mean effective stress, void ratio and plasticity index), which compromise useful but straightforward tools in modeling the behavior of Warsaw mineral cohesive soils.

2. Extended Empirical Formulas for Cohesive Soils

The importance of small strain shear modulus (GMAX) for dynamic problems was referred to as the same level as that of shear strength for stability analysis [14]. Lefebvre and Leboeuf [15] pointed out that the small strain shear modulus is a fundamental characterization of soil deformability and plays a crucial role in dynamic response analysis. Small strain shear modulus is also called maximum shear modulus, initial shear modulus or low-amplitude shear modulus and denoted, beyond G0, by GMAX. GMAX is constant and independent of the shear strain level for γ γte = 10-5, where γte is the linear elastic threshold shear strain [16] or nonlinearity threshold strain. Shear modulus is essential for small strain cyclic situations caused by wind or wave loading. It is equally important to predict soil behavior while designing highways, runways and their surrounding structures. Shear modulus can be used as an indirect indication of various soil parameters. It correlates well to other soil properties such as density, fabric and liquefaction potential and sample disturbance [17].
Given the importance of GMAX and the relative scarcity and cost of in-situ seismic measurements, many researchers have developed empirical relations to estimate GMAX based on results from dynamic laboratory tests, e.g., Carlton and Pestana [18]. Generally speaking, each empirical equation is expressed as functions of void ratio (e) and effective confining stress (σ’0) as
G M A X = A f ( e ) σ 0 n
where, A denotes the equation coefficient and f(e) denotes the function of the void ratio. As reported in the literature, and based on the authors’ research [19], small strain shear modulus significantly increases with confining pressure and distinctly decreases with the void ratio.
In Table 1, some proposed in literature relationships for estimation of GMAX for cohesive soils, based on laboratory cyclic and dynamic tests, are summarized.
When using the empirical equations, one needs to take into consideration the test method and the effective strain range for which the interested relationship is pertinent. It was challenging to measure behaviors at small strains accurately in the old days by static tests. Therefore, resonant column tests were frequently used. However, at present, small strains with a 10−6 shear strain level can be measured according to the development of measurement devices.
As the same importance as small strain dynamic properties of soil, the nonlinear dynamic soil properties also play an essential role in analyzing the dynamic behavior of ground motion during, e.g., strong earthquakes. The shear strains induced in surface deposits during such earthquakes motions may be estimated around 10−2–1% [31]. This is only one example that shows that it is very necessary to investigate the strain-dependent dynamic characteristics of soils at a wide range of strains, from 10-4 to 10−2, in the laboratory.
Vucetic and Dobry [32] based on a review of cyclic loading test results for normally and overconsolidated clays (OCR = 1−15), and sands, concluded that the plasticity index (PI) is the main factor controlling the variation of G/GMAX versus γ. It was proved that higher values of PI correspond to higher values of reduction of shear modulus. According to the authors’ research [30], confining pressure significantly influences the shear modulus reduction curves. A confining pressure increases G/GMAX curve shifts to a higher position.
In Table 2, some important relationships, selected from the literature, for the determination of G/GMAXγ curves are summarized.

3. Tested Materials, Test Device and Testing Procedure

3.1. Soils Characterization

The comprehensive analysis of shear modulus of cohesive soils required, in addition to identifying the factors affecting soil stiffness, to select appropriate locations for collecting the tested material. Therefore, three different test sites were selected, i.e., Pełczyńskiego (test site No 1), Bartycka (test site No 2) and Pory (test site No 3) [36], from which the soil samples are particularly exposed to the occurrence of various types of paraseismic vibrations caused by human activities, primarily traffic. Every test site was located in Warsaw, test site No 1 in the northwestern part of the city namely in the Bemowo district, test sites No 2 and 3 in the southern part of Warsaw in two different locations in Mokotów district. The names of the polygons come from the streets where the samples were collected. Standard procedures for soil sampling were followed according to Polish Standard: PN-B-04481:1988 [37]. In each case, Shelby samplers were used to collect the material for testing. From the excavations in every test site, large samples were taken and subsequently transported to the laboratory. From their least disturbed fragments in the laboratory, the samples of appropriate size for dynamic testing were cut off. From the test site No 1 (Pełczyńskiego) 7 samples were collected, from a depth of 2.0 to 7.5 m below surface. From the test sites No 2 and 3 (Bartycka and Pory), altogether 8 samples were received, from a depth of 1.5 to 9.5 m below surface.
Four types of clay, namely sandy clay, silty clay, sandy silty clay and clay, and one type of sand, i.e., clayey sand [38,39], were used in this study in order to investigate the stiffness characteristics of Warsaw mineral cohesive soils. In Table 3, the index properties of tested material determined from the laboratory tests are summarized. The grain size distribution curves for all soil samples are presented in Figure 1.
All examined soils were classified as mineral cohesive soils of the tertiary (test names: 1, 3, 11, 12, 13, 14 and 15) and quaternary (test names: 2, 4, 5, 6, 7, 8, 9 and 10) origin. Only fine-grained soils were tested in the laboratory. They were from semi-stiff (LI = −0.19 for test 15) to hard-plastic (LI = 0.24 for test 10) condition, where LI means the liquidity index. Based on Atterberg limits values [40], it was determined that our soil samples were from slightly plastic with a plasticity index (PI) less than 7 (1, 6, 10) through to medium plastic, 7 < PI < 17 (3,7,8,9), and up to highly plastic materials, PI > 17 (2, 4, 5, 11, 12, 13, 14, 15). The overconsolidation ratio (OCR) calculated according to ISO 17892-5:2017 [41] allowed us to include all Quaternary soils to normally consolidated soils, with one exception, namely test No 8. The preconsolidation pressure (σ’p) of this specimen was 140 kPa despite of its shallow deposition below the surface. Tertiary soils were classified as overconsolidated soils with OCR > 1.0.

3.2. Mineralogical Identification

Due to the examination in this work of clays with a high liquid limit, i.e., LL ≥ 50%, samples 13, 14 and 15 from test site No 3 (Pory), under low load conditions and possible water soaking, there was a risk of their significant swelling. This could then have a negative impact on the reduction of their strength. The swelling process consists of increasing soil volume while absorbing water. The swelling ability is related to clay minerals’ hydrophilic character that makes up cohesive soils and their large specific surface [42]. Clay minerals are electrochemically active. The presence of even a small number of them in the soil can highly affect its physical and mechanical properties. As the content of clay minerals in soil increases, its properties become more and more similar to those of the minerals mentioned above.
Among clay minerals, there are three main groups called kaolinite, illite and smectite (montmorillonite and beidellite) [43]. Clay minerals are hydrated aluminosilicates of Al, Mg and Fe that belong to layered silicates with packet structure. A detailed description of clay minerals’ structure can be found, e.g., in Grim [44].
Thus, before conducting dynamic tests on selected mineral cohesive soils, it was necessary to identify their mineral composition, especially three samples 13, 14 and 15. The mineral composition has a significant impact on the swelling potential of clays. The most common tests on soils mineral composition are:
  • X-ray structural analysis;
  • Thermal analysis;
  • Microstructural analysis in scanning electron microscopy (SEM) [45].
These methods should be used mainly in combination, which allows a quantitative description of minerals found in soils [46].
Based on the experiments, it was detected that the content of clay minerals in clay samples collected from test site No 3 was around 45%, mostly montmorillonite. Montmorillonite is the dominant mineral build bentonite. It is formed as a result of weathering volcanic tuffs in an alkaline and highly saline environment. Montmorillonite is a very soft phyllosilicate group of minerals that form when they precipitate from water solution as microscopic crystals, known as clay. Montmorillonite, a member of the smectite group, is a 2:1 clay, meaning that it has two tetrahedral sheets of silica sandwiching a central octahedral sheet of alumina. The ability of this mineral to swell is related to the pressure of water vapor, and the type of cations that occur between the layers. Ions Ca2+, Mg2+ and Li+ have a strong polarizing interaction that binds more permanently water molecules than cations K+ and Na+. In formation, montmorillonite is similar to illite. The main difference between montmorillonite and illite is the lack of potassium ion binding individual packages [44].
According to the clay fraction (Bekkouche classification) content in samples 13, 14 and 15, this soil material can be characterized by medium swelling potential [47]. According to the FHA/HUD classification [48], in which fine-grained soils are divided into five groups with different levels of expansiveness, based on the plasticity index and liquid limit, examined clays belong to the group of very swelling soils. Based on the obtained swelling pressure values (Table 3) and according to Chen [49], soil from the Pory test site has an average swelling potential. In Table 4, the expansive properties of tested materials are summarized.

3.3. Test Device and Dynamic Testing Procedure

In this research, the fixed–free resonant Stokoe type column apparatus, manufactured by the British company, GDS Instruments Ltd. [30,50], was employed to evaluate small strain stiffness and modulus degradation of Warsaw mineral cohesive soils. A solid cylindrical specimen is placed in a triaxial cell, installed on a cell base, which is fixed to the cell base stand (the passive end). It is surrounded by fluid (water) in an inner tube, compressed air in the triaxial cell and subjected to an isotropic confining pressure (σ0) and back pressure (ub).
The RC tests involve the specimen’s excitation in sinusoidal vibrations, due to the electromagnetic drive system that induces the electromagnetic field. This system consists of a set of four magnets, placed on four rotor arms and positioned between four pairs of drive coils. The electromagnetic field’s vibrations are transferred to the free end of the specimen (its upper part). This free part of the specimen is therefore loaded with a torque of the desired excitation characteristics. The frequency and amplitude of vibrations are controlled during tests, with the frequency being gradually increased, starting from the selected minimum value. Monitoring the frequency and amplitude of the applied voltage allows finding the resonant frequency at which the signal (acceleration) size is the largest and means that the moving system has reached the state of the mechanical resonance. The vibration amplitude is monitored by the accelerometer’s output power, which is located on the drive plate. With the known value of the resonant frequency (f1), together with the sample geometry and conditions of end restraint, it is possible to back-calculate the transverse wave velocity (VS) propagating in the specimen as a result of vibrations.
After it had been trimmed to its nominal dimensions (diameter approximately 70 mm and height approximately 140 mm), each specimen was installed in the triaxial cell base and then enclosed by a membrane. The apparatus was assembled and preliminary tests started, including flushing, saturation using the back pressure method and isotropic consolidation. Saturation degree was evaluated by estimating Skempton’s parameter B. The consolidation process was carried out in stages, at various levels of p’, in such a way that the next consolidation pressure was always 1.5 or 2 times higher than the current one. The highest mean effective stress obtained in the tested mineral cohesive soil from Warsaw was 410 kPa. This limitation resulted from the maximum air pressure in the compressed air network in the laboratory.
The dynamic tests were conducted in the following order:
  • Selection of the output amplitude, which determined the amount of shear strain applied to the specimen. For this purpose, a step-by-step approach was used [51].
  • Drawing of the frequency response curve and observation of resonant frequency from torsional vibrations.
  • Stiffness analysis and shear modulus calculation based on the determined resonant frequency.
  • Calculation of torsional strain from the angle of twist of the test specimen.
  • Repeating of 1-4 steps with an increasing applied voltage, maximum up to 1.0 V.
  • Next consolidation stage with an increased effective stress.
  • Repeating steps 1–6.
All the test activities described above were then repeated for 15 specimens.
In this article, results for the torsional vibration are only presented. Calculations were made according to ASTM D4015-92 [52].

4. Results and Discussion

4.1. Small Strain Shear Modulus G0

In order to measure maximum shear modulus (GMAX), a very low voltage was applied on the free end of the sample. As a result, a very small shear strain, from 10-4% to 10-2%, was obtained. In this shear strain range, the resonant frequency of the soil specimen has a constant value. Thus, shear modulus has a constant maximum value, which corresponds to a linear elastic response of soil to dynamic loadings.
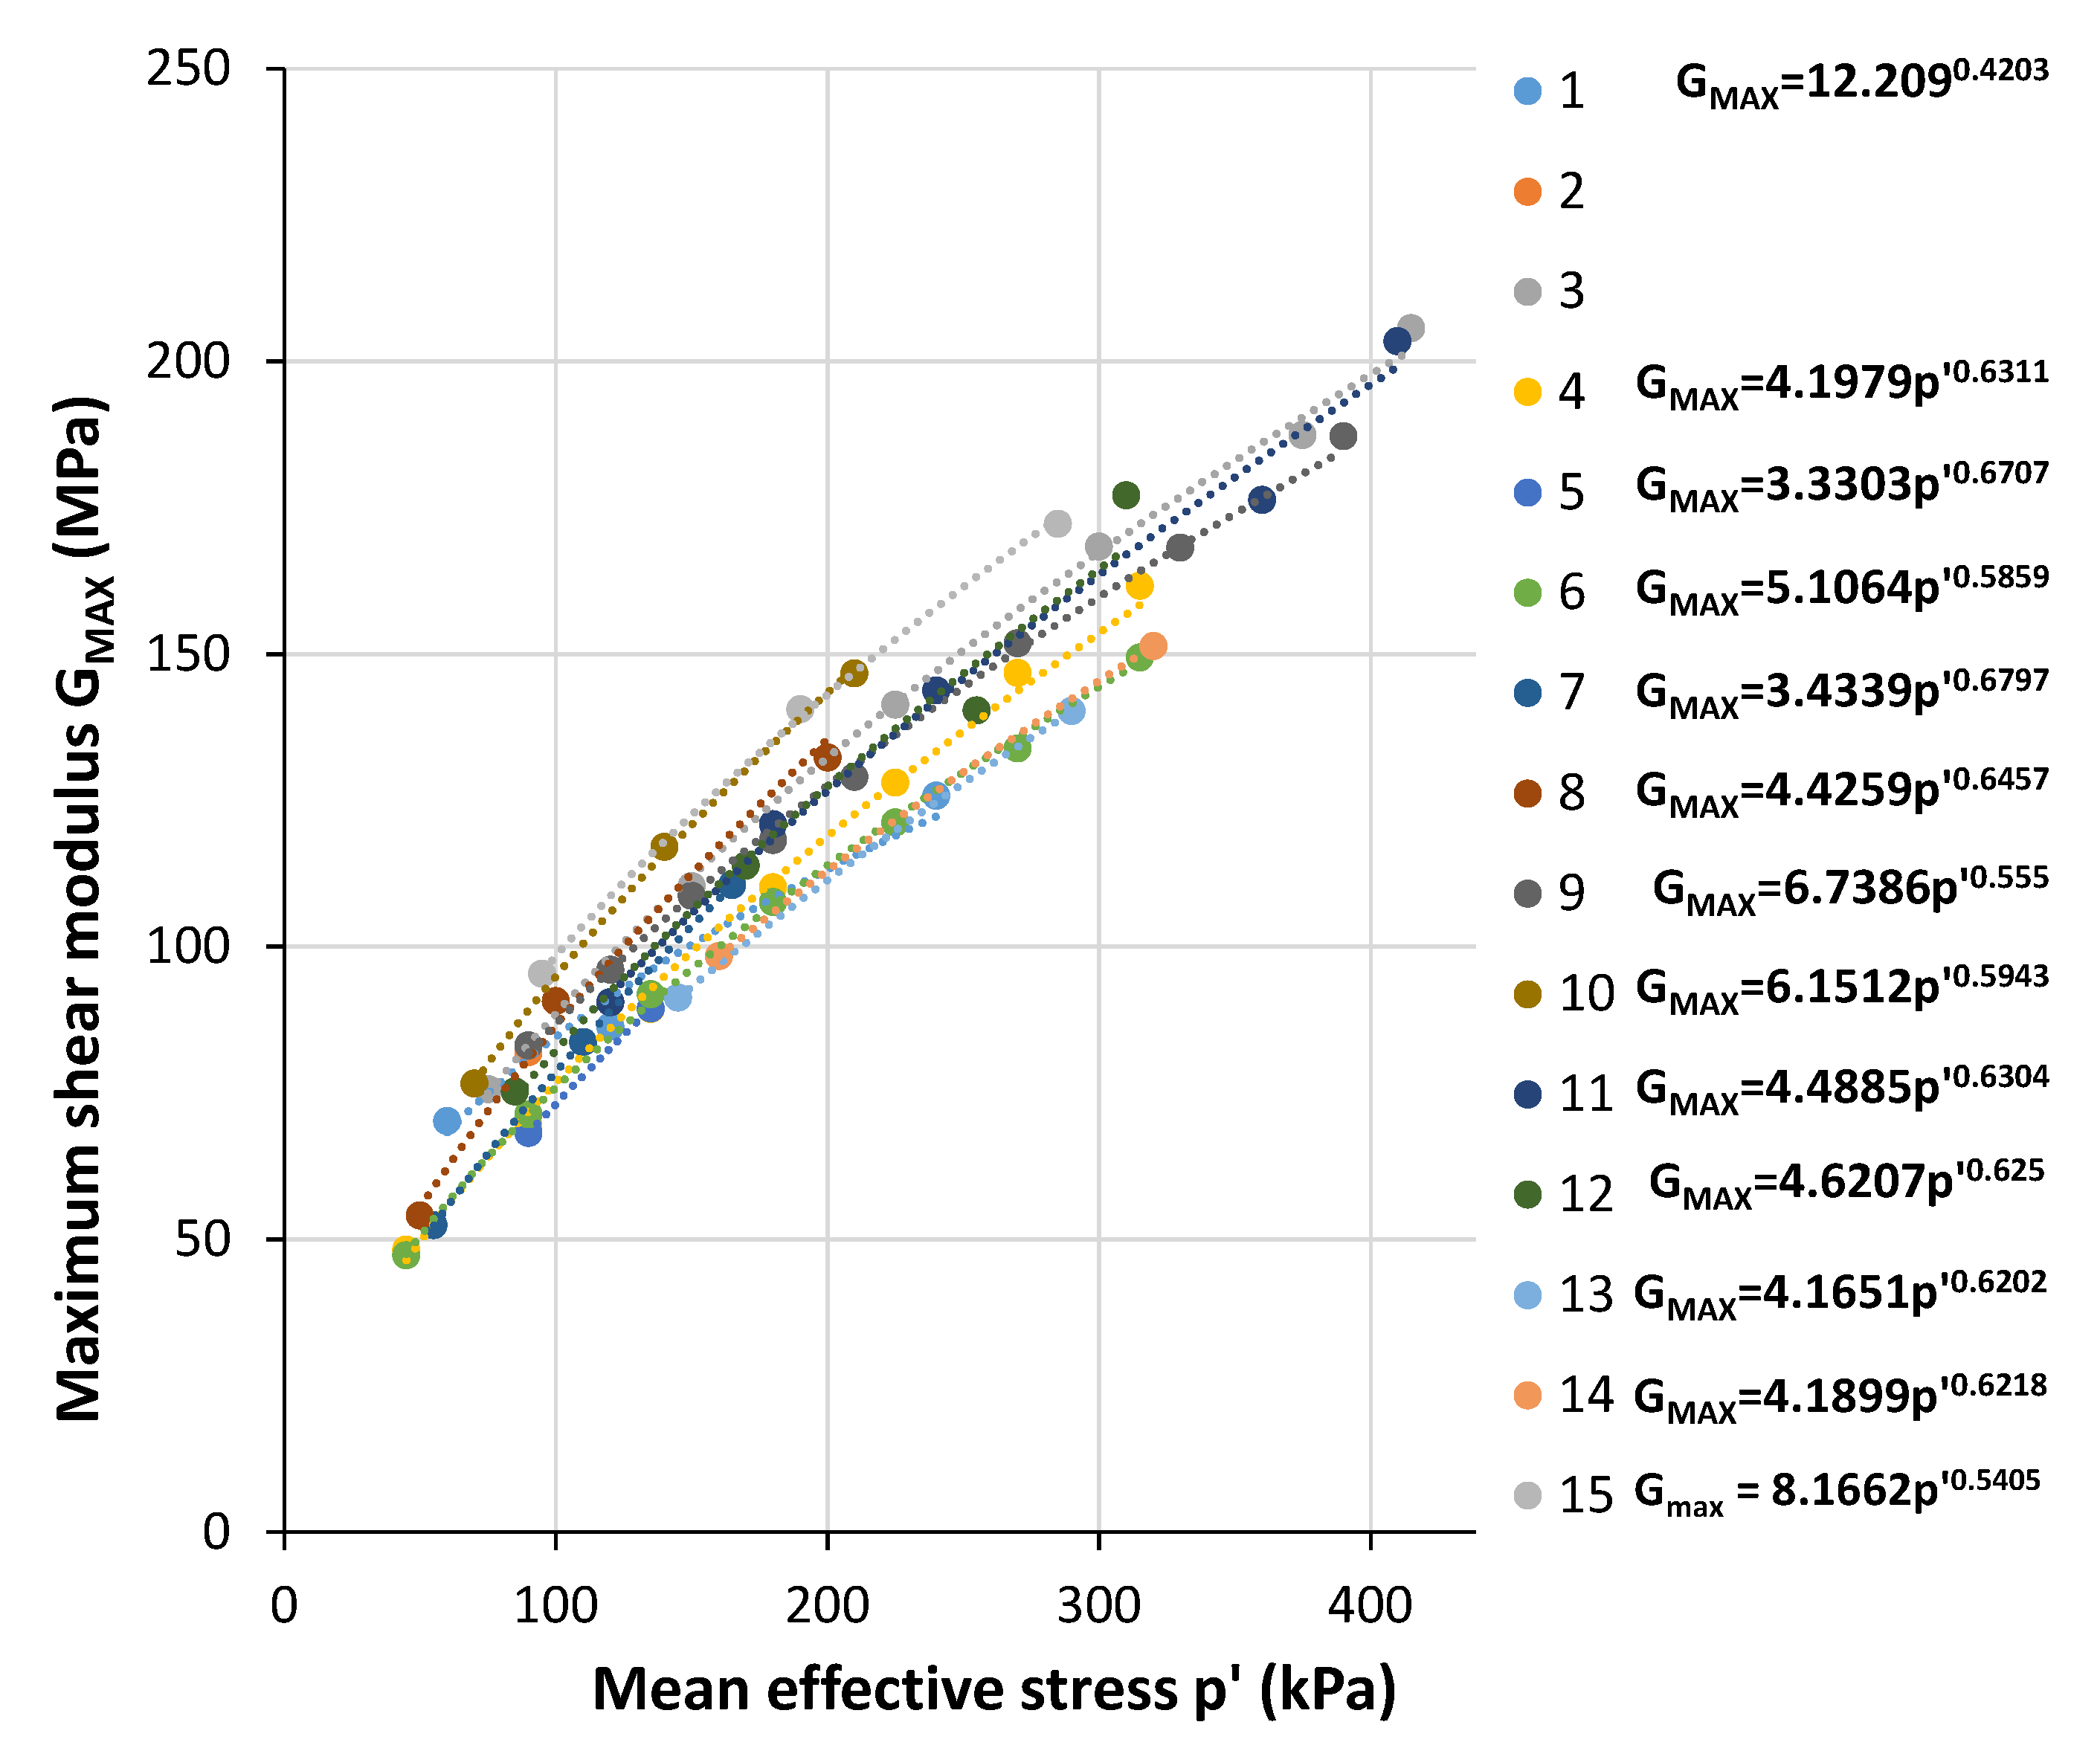
The results of the maximum shear modulus depending on effective stress on every specimen are presented in Figure 2. GMAX increases with effective stress (p’), which confirms the studies of the other researchers [30,35,36,51,53,54]. The maximum shear modulus varies from about 50 MPa for specimen 6 and effective stress 45 kPa to 205 MPa for specimen 3 and effective stress 415 kPa. The change of every maximum shear modulus is presented by curves described with the best fitting by the power function with a determination coefficient above 0.99. This indicates that the increase in GMAX with effective stress is nonlinear in cohesive Warsaw soils. This is opposite to Kallioglou et al. [1] and Darendeli [5], but the same trend is presented in Sas et al. [30]. Despite different curves equations, every researcher confirms that effective stress has the greatest impact on the maximum shear modulus value.
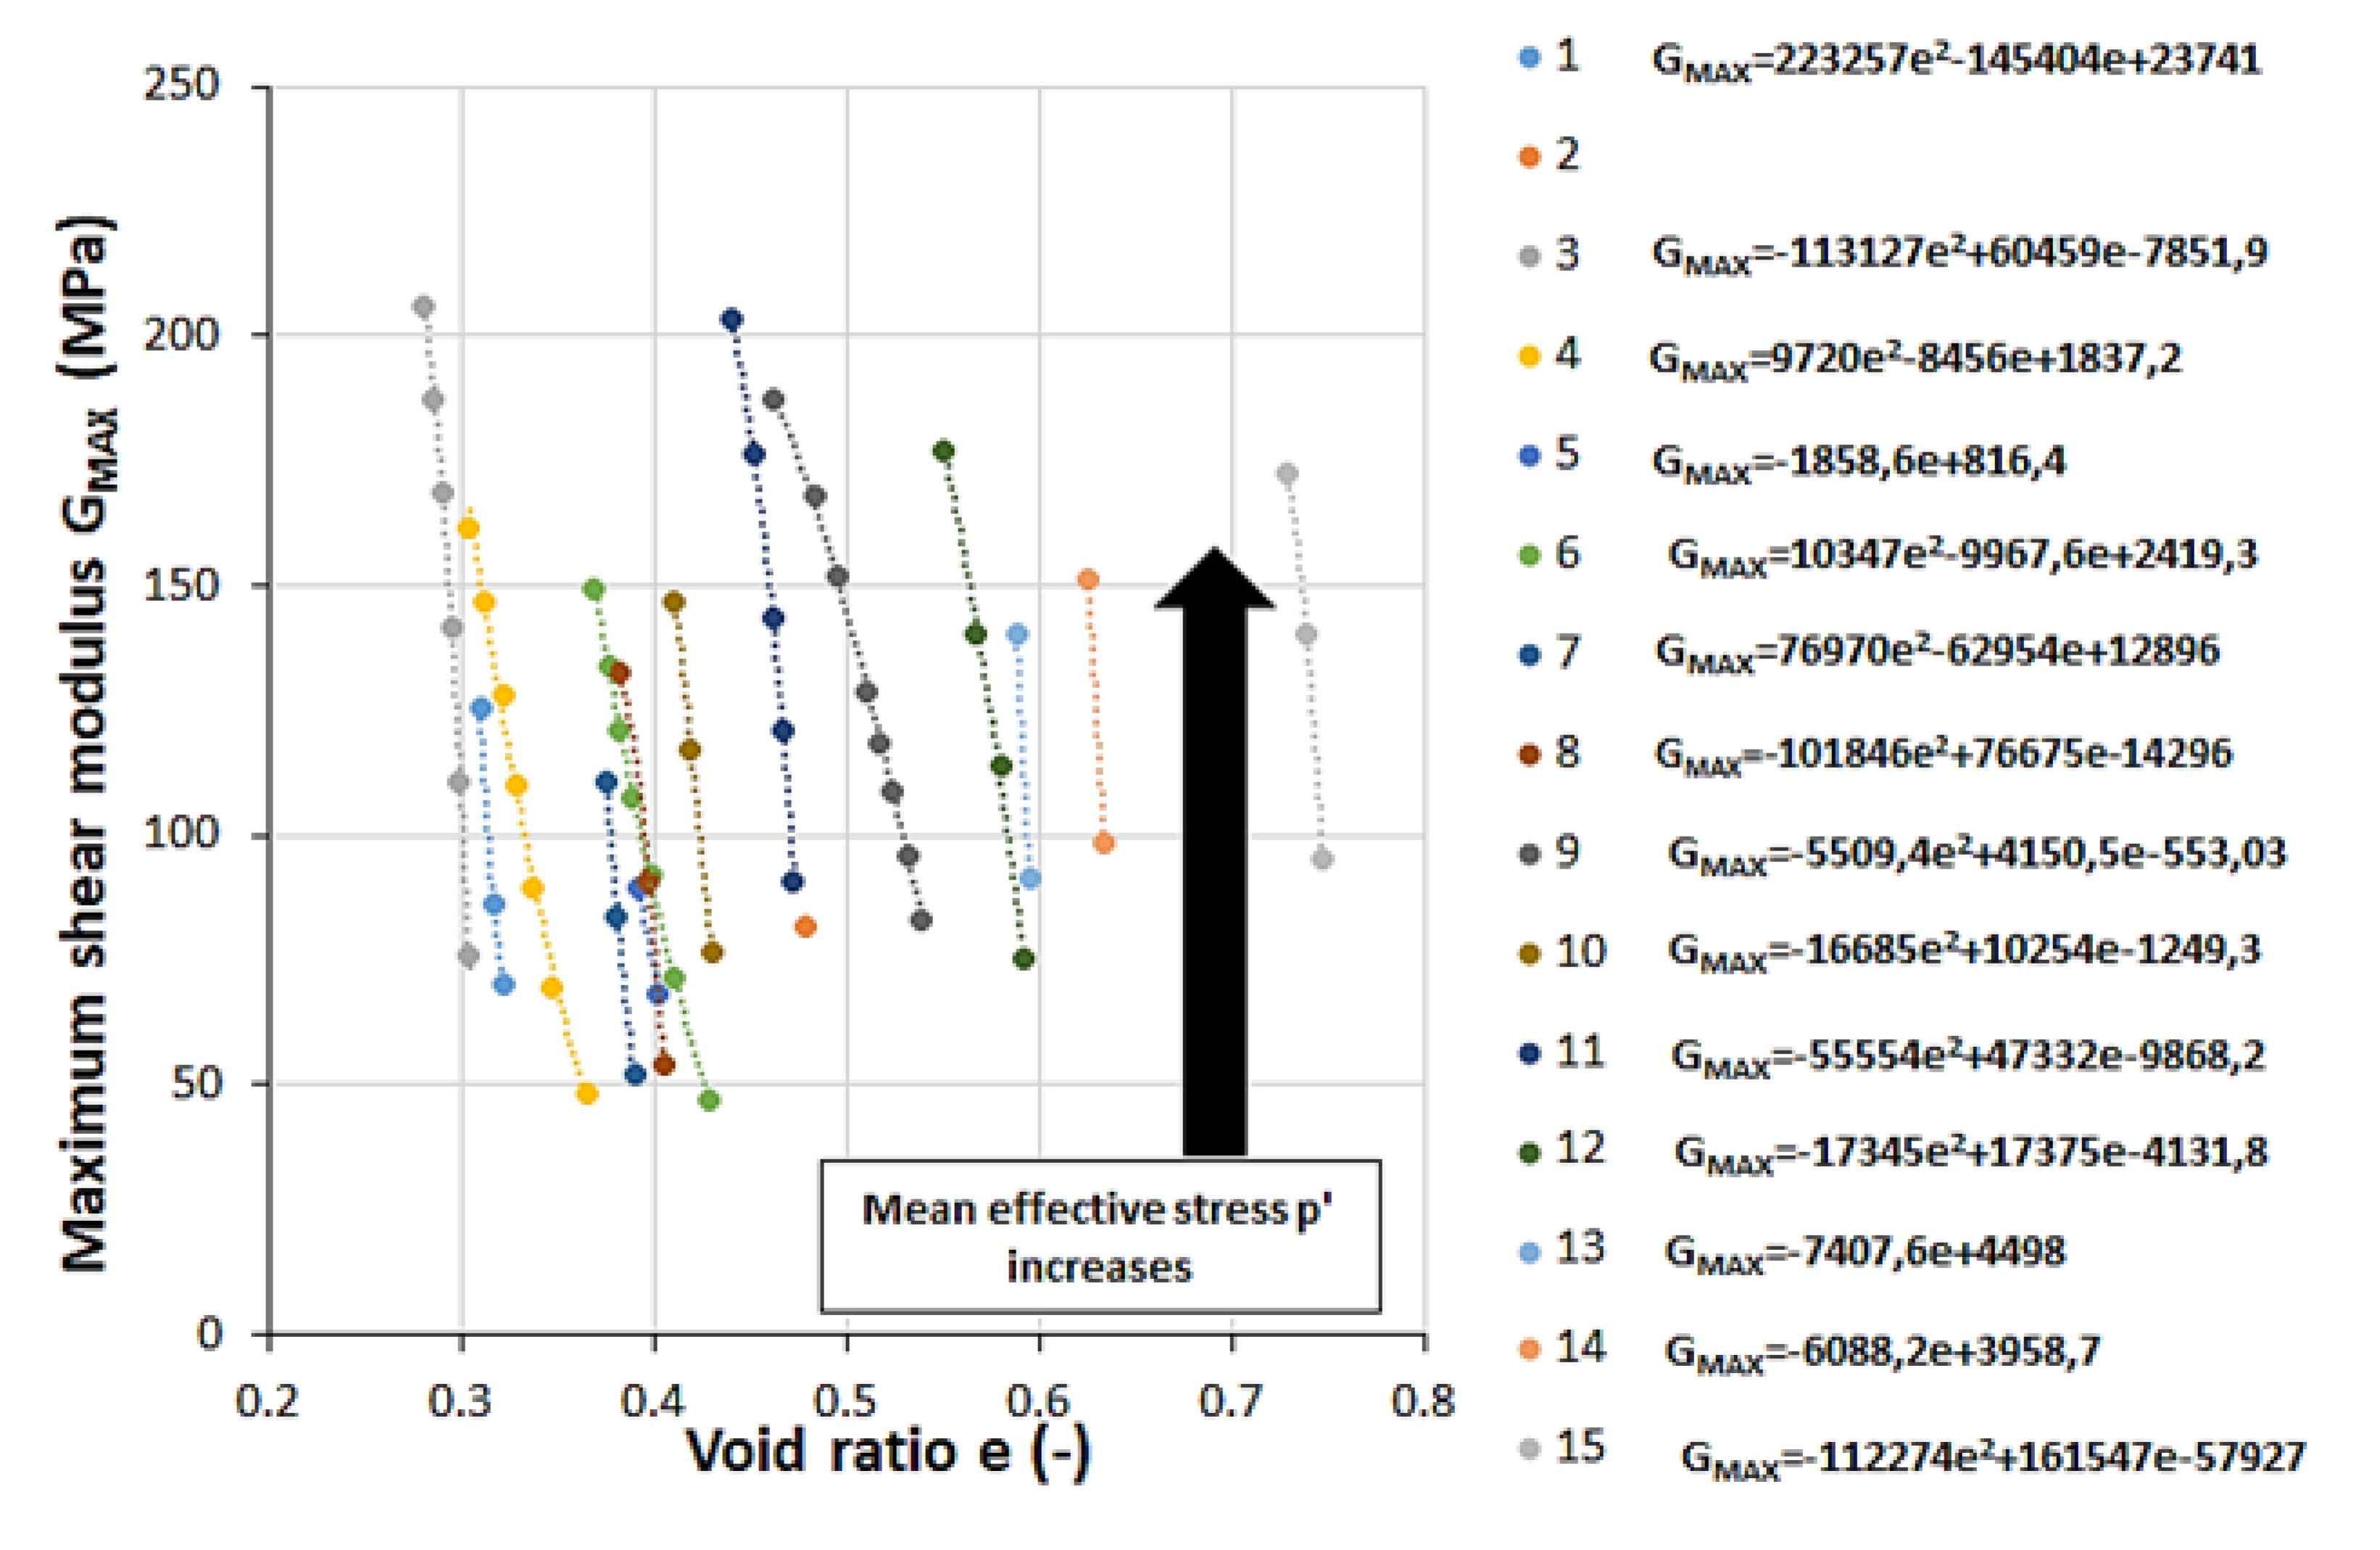
As it can be seen in Table 1, almost in every equation the void ratio can be found. Thus besides effective stress e is one of the most important parameters affecting the stiffness of the cohesive soils [1,13,20,21,22,23,24,25,26,27,28,29]. In Figure 3 GMAX depending on the void ratio (e) is presented for tested soils. The void ratio for all tested soils varied from 0.28 at p’ equals 415 kPa to 0.75 at p’ equals 95 kPa. Specimens with the highest clay mineral, i.e., 13, 14 and 15 have the largest void ratio. In every specimen, the void ratio decreases with increasing consolidation stress. However, this decrease is different for each soil. The highest e reduction can be found in sample 9 (the greatest angle of the trendline). Although a wide range of consolidation stresses, other specimen have preferably low void ratio reduction. The best-fitting function described the change of e for tested soils were the quadratic function. The exception was samples 2, 5, 13 and 14 because of only one consolidation stage in the case of sample 2 and only two consolidation stages in samples 5, 13 and 14. Increasing GMAX with decreasing in the void ratio is clearly visible in Figure 3. This phenomenon is connected straight forward with effective stress. Namely, p’ increases, then the sample’s dimensions are decreasing due to the consolidation process. Therefore porosity and void ratio decreasing and stiffness described by shear modulus increase. This proves that e and p’ are the main factor affecting stiffness represented by GMAX.
Some researchers indicate that the maximum shear modulus of cohesive soil is much affected by sand content [28] and plasticity index [1]. Mentioned parameters can be found in equations proposed by Kallioglou et al. [1] and Hassanipour et al. [28]. These parameters are connected because PI is correlated with clay mineral content in the soil mixture and it directly influences the amount of sand and gravel grains. The plasticity index of tested soils varies from about 5% to about 40%, which is very similar to materials tested by Kallioglou et al. [1]. However, any trend cannot be found—the maximum shear modulus increases in every specimen, but it is caused by an increase in effective stress. The increase of PI does not affect in any way the maximum shear modulus. Therefore, plasticity index and sand content are useless in the equation to describe the maximum shear modulus in the case of tested Warsaw cohesive soils [30].

4.2. Empirical Equations for GMAX

In order to find a correct and reliable empirical model to predict GMAX, a statistical analysis was carried out. Firstly, the matrix of the linear correlation was estimated. This method checks the linear relationship between two variables. The main parameter describing the relationship’s strength is the Pearson correlation coefficient, which varies from -1 to 1. The closer to 0 the correlation coefficient is, the weaker the correlation is and the opposite, the coefficient -1 or 1 means perfect correlation.
In Table 5, the correlation matrix for tested soils is presented. It can be noticed that the highest linear relationship between GMAX and p’ was about 0.97 (Table 5 yellow color). This high relationship can be also seen in Figure 2. Thus, mean effective stress is a necessary parameter in the maximum shear modulus equation. From the other side, the void ratio had the lowest Pearson coefficient value 0.045, which indicates a very week correlation between GMAX and e. Thus, from a statistical point of view e should not be placed in an empirical model. However, void ratio strongly correlated with clay, silt, sand and gravel content and plasticity index (Table 5 yellow color). Thus, e described very well physical properties of the tested Warsaw cohesive soils. Moreover, void ratio changed with effective stress, which corresponded with the increased consolidation stress in laboratory studies. Therefore, despite the low coefficient value between e and GMAX, the void ratio is commonly used in the equation for the maximum shear modulus [1,13,20,21,22,23,24,25,26,27,28,29,30].
After identification of the parameters for empirical equations, i.e., void ratio (e) and mean effective stress (p’), and after investigation of previous equations (Table 1), and Figure 2; Figure 3, a basic equation was created:
G M A X = ( p a ) ( b e + c ) 2
where, GMAX—maximum shear modulus (kPa), a, b, c—constants e—void ratio (-) and p’—mean effective stress (kPa). The proposed core was similar to models presented in Table 1, where in most cases, effective stress was described by the power function and void ratio by a quadratic function. Next, due to statistical software with the nonlinear regression module and the least-squares method with the Gauss–Newton estimation constants: a = 0.61, b = 3.17 and c = 69.2.
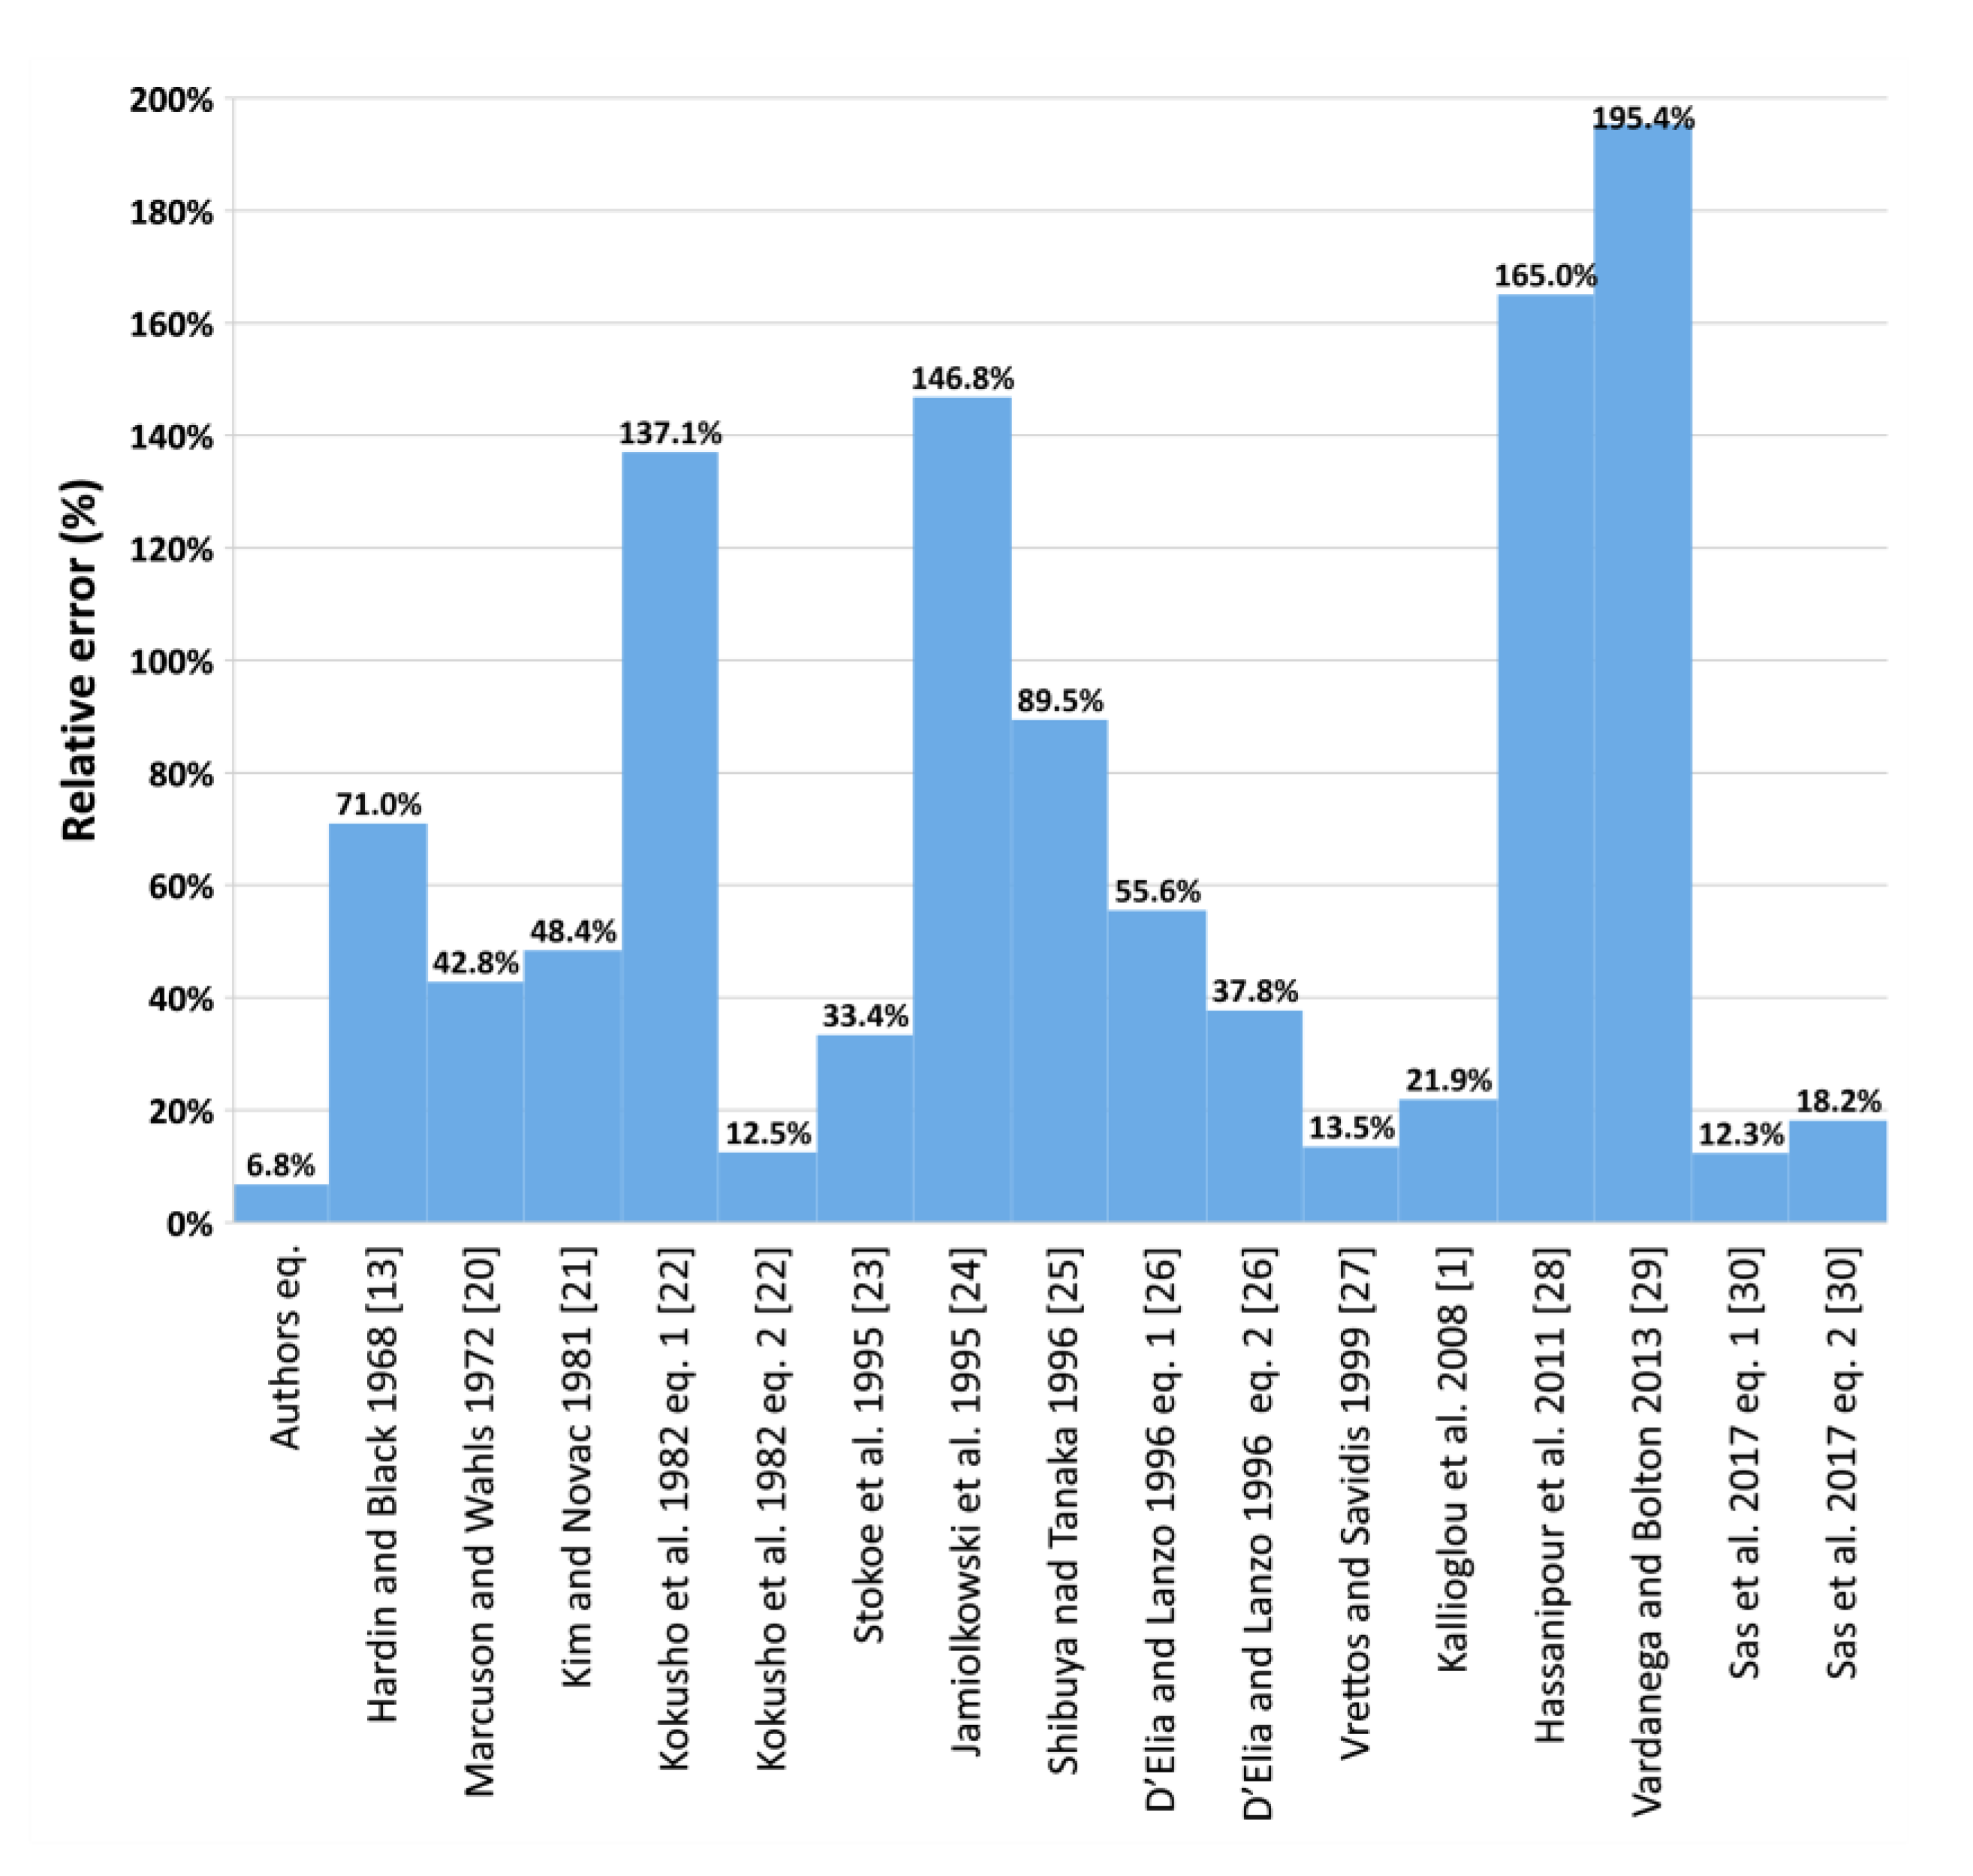
In Figure 4, the relative error of the calculated to measured values of GMAX is presented for the author’s empirical model and equation shown in Table 1. It is clearly seen that the equation proposed in this article was the most reliable and predicted the maximum shear value with the highest accuracy. The relative error of the authors’ equation was 6.8%. Very low relative error values below 15% also have equations presented by [22,27] and Equation (1) in Sas, W at all. [30] Other models presented in Table 1 have error form values above 20%–50% [1,20,21,23,26] to values between 55% and 90% [13,25,26]. Four equations are extremely inaccurate, i.e., [24,28,29], Equation (1) in Kokusho, T et al. [22] and have an error of 137.1%, 146.8%, 165.0% and 195.4% respectively.
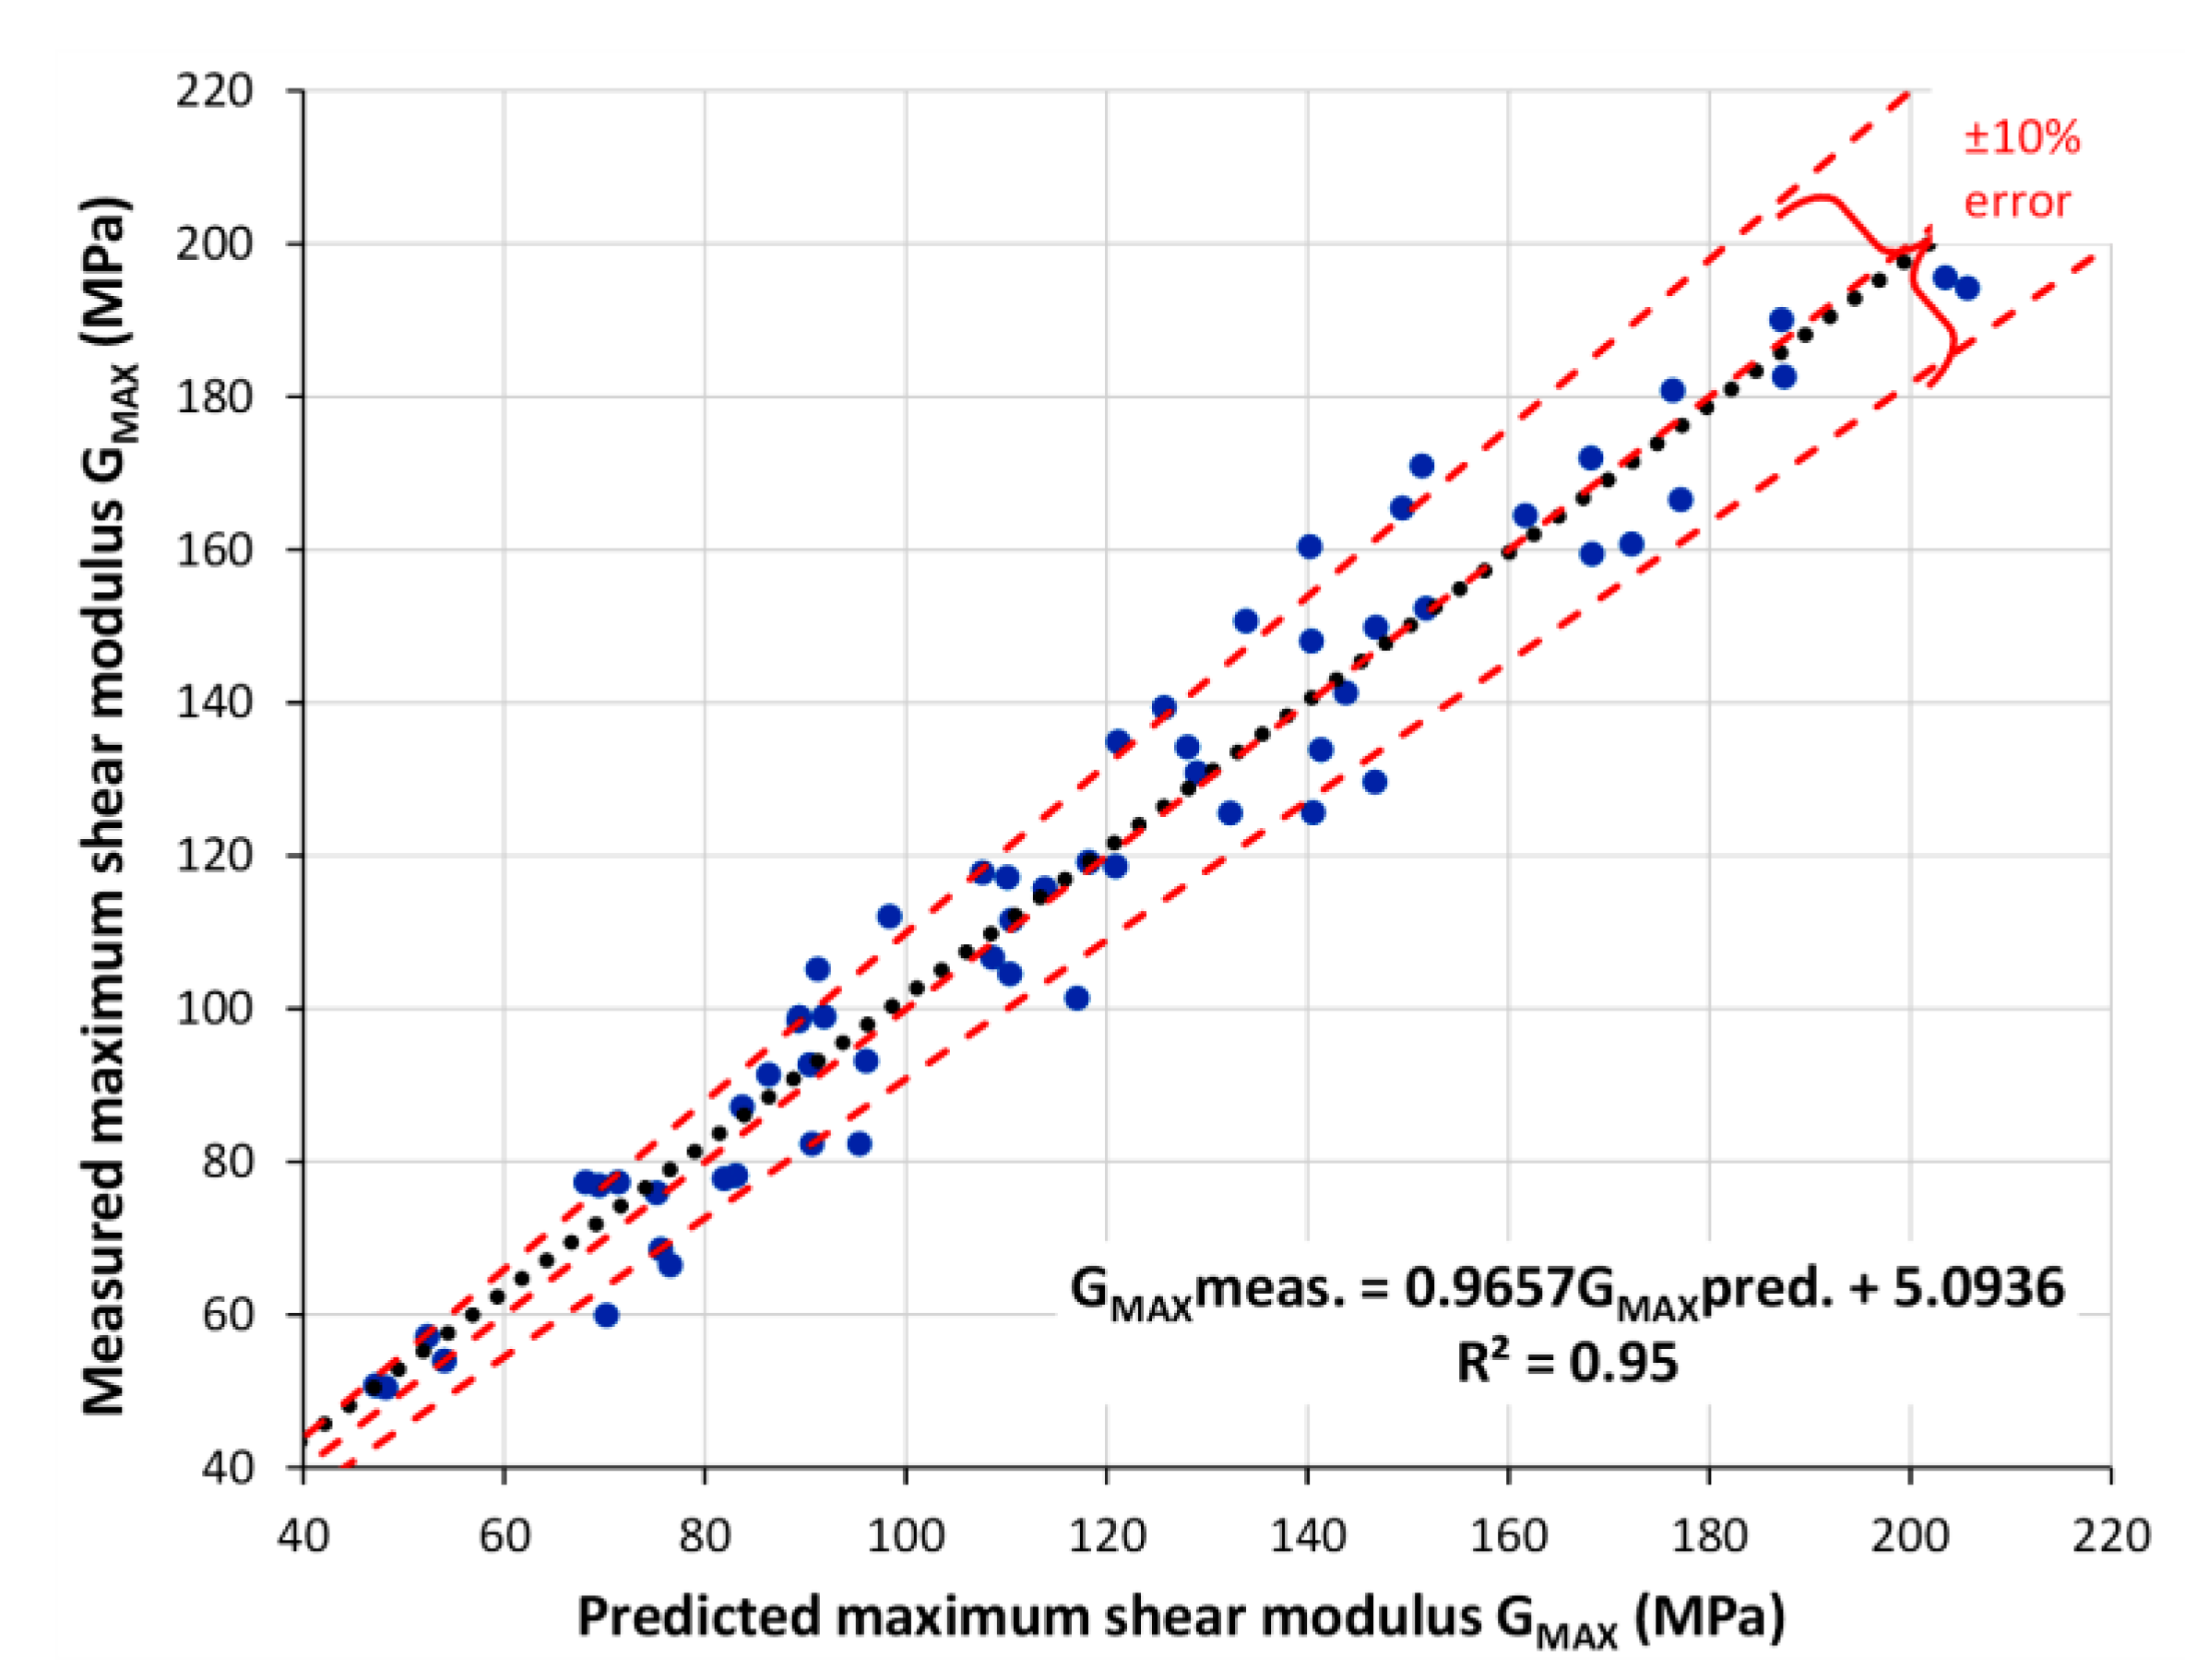
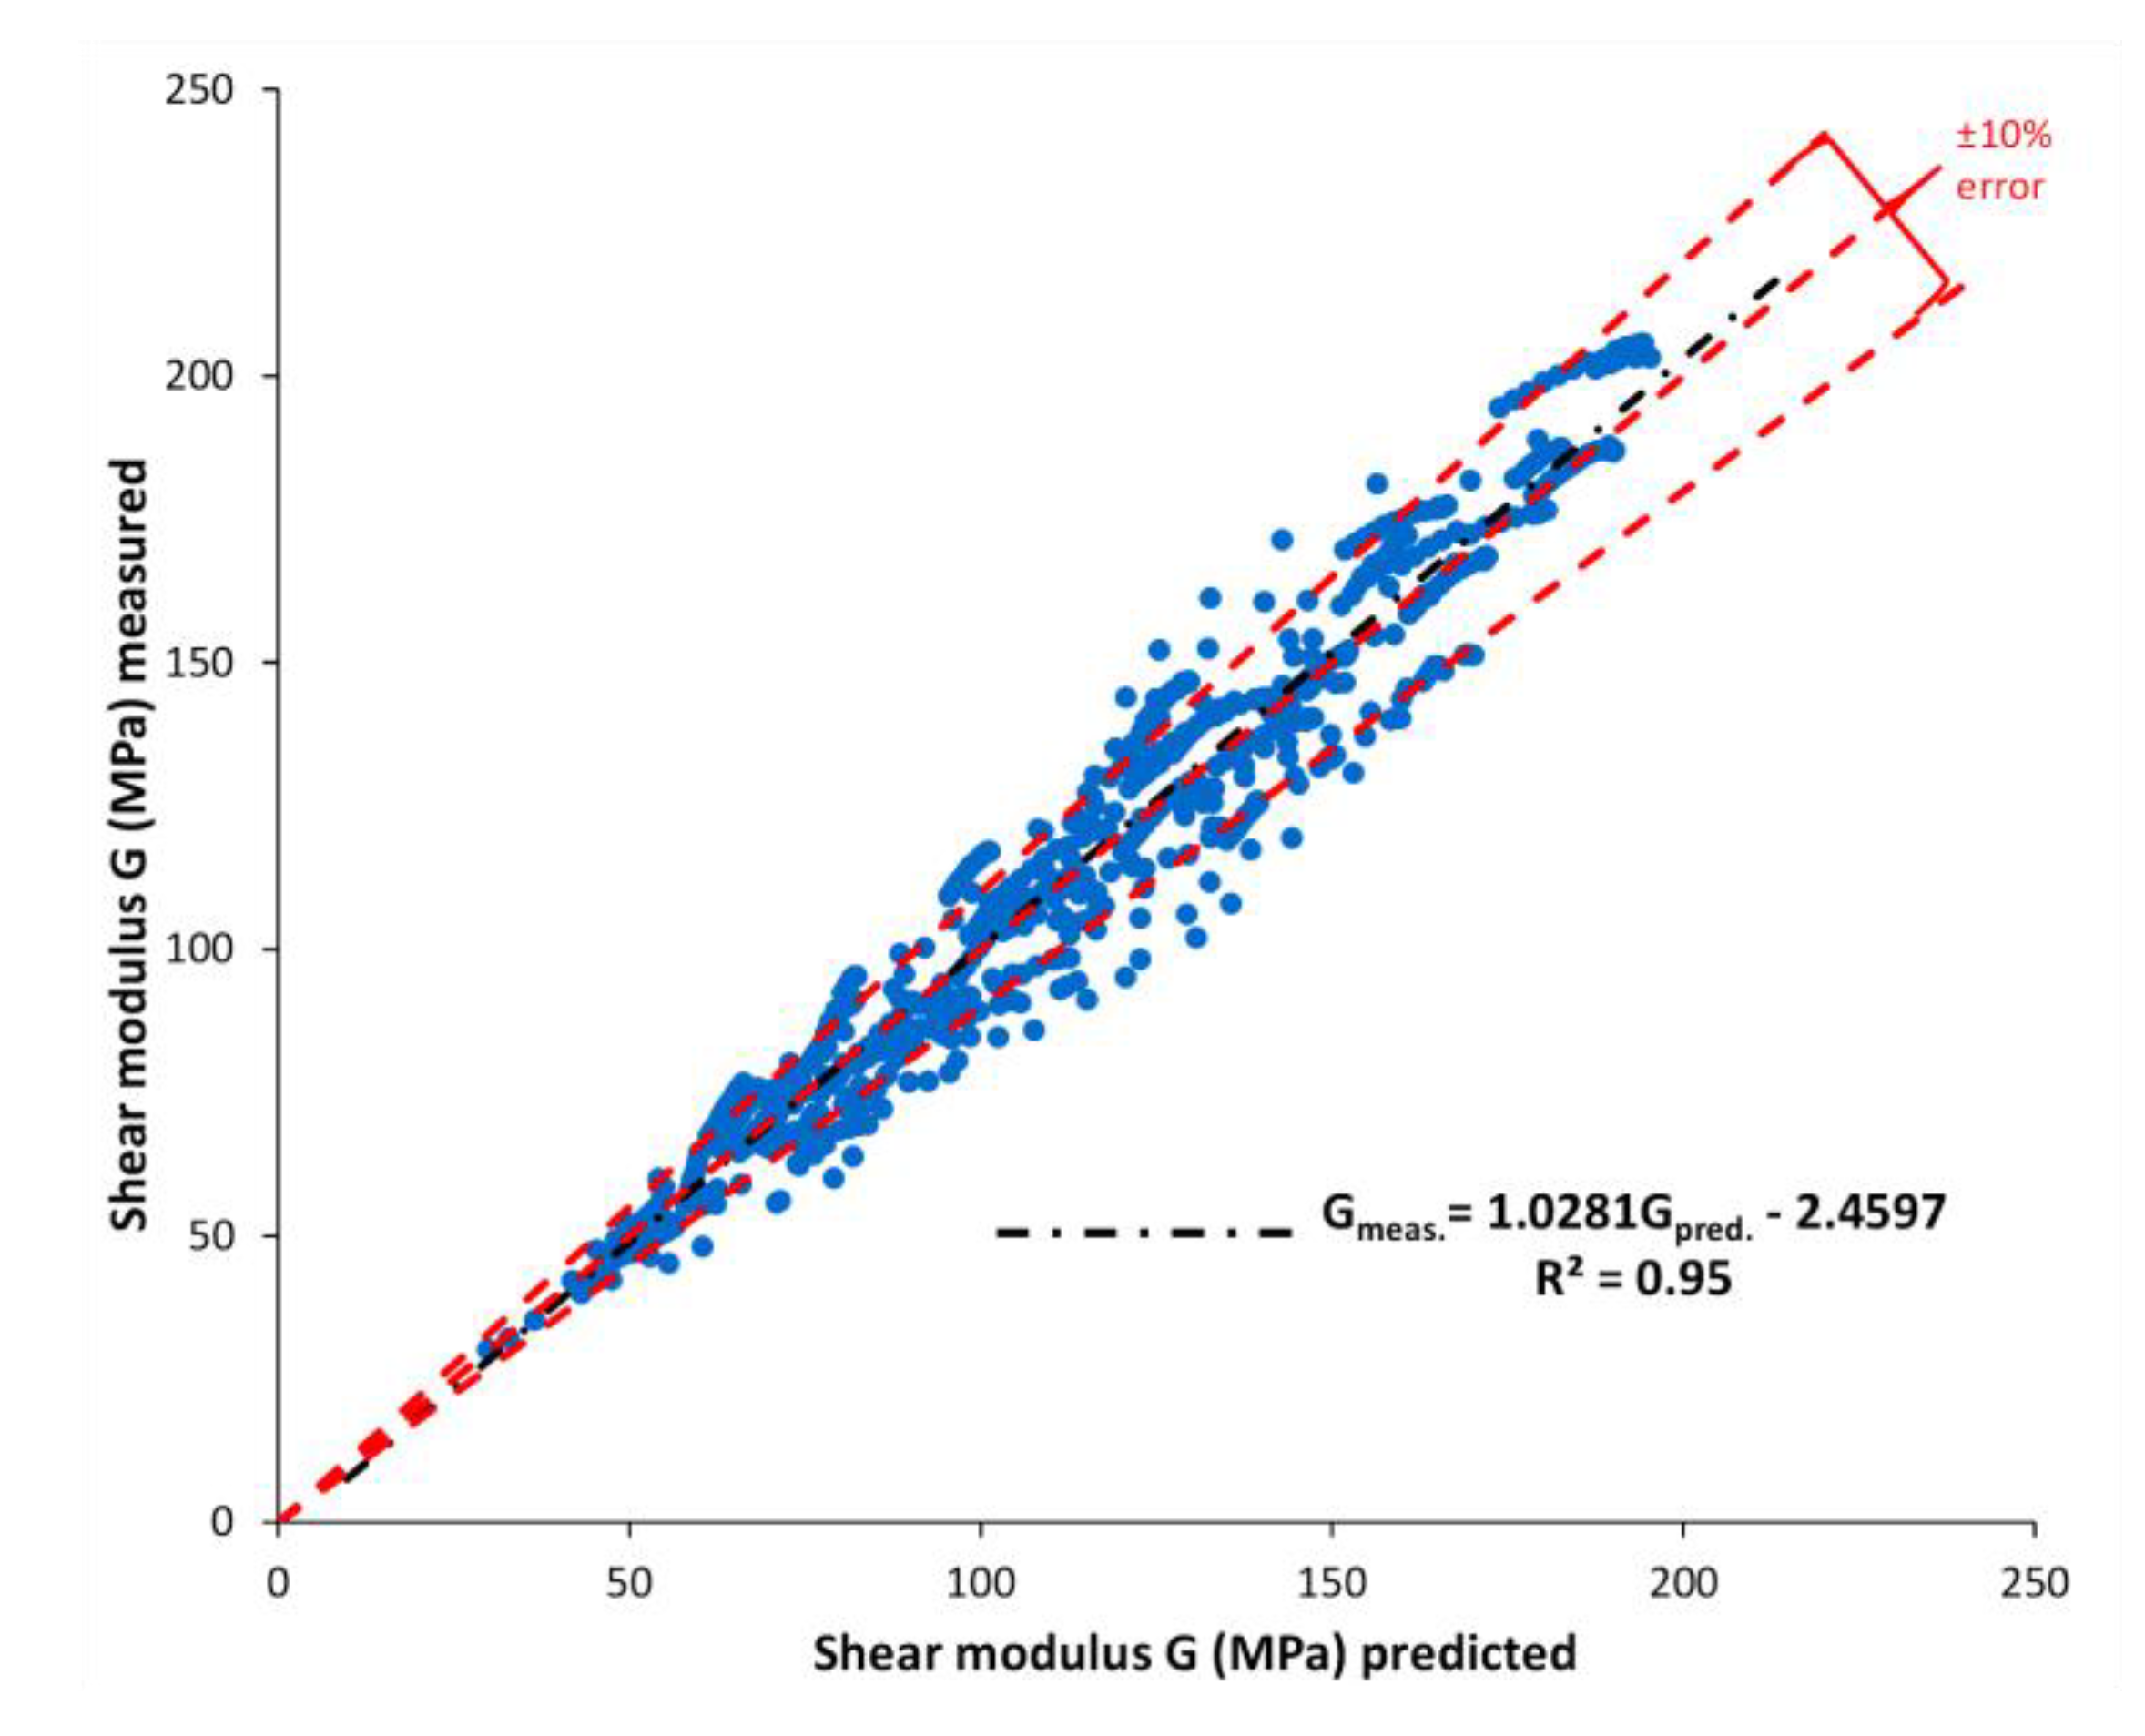
More precise results of the measured GMAX versus the predicted maximum shear modulus by the author’s equation are presented in Figure 5. In Figure 5, three red dashed lines are visible. One in the middle indicates equality between measured and predicted values and lines above and below the middle line shows ±10% error. Most of the points on the graph are in the range between ±10% error. A lot of results are placed directly in the equality line. Any single value did not significantly differ from the rest of the results. The highest error was about 15%. The black dotted line is a linear trend line described by the equation presented in the graph. It can be noticed that the black line was very close to the red equality line, and the coefficient of determination was 0.95, which also proved accurate and reliable GMAX values obtained by the proposed empirical equation.

4.3. Modulus DegradationC G(γ)/G0

The shear modulus degradation curve and normalized shear modulus degradation curve is the crucial deformation characteristic of the soil from the engineering point of view because it presents the response of soil for loading in the real operation area of construction. Thus, after GMAX was obtained, the applied voltage to the drive system was systematically increased to get a G modulus degradation curve in a wide range of shear deformation.
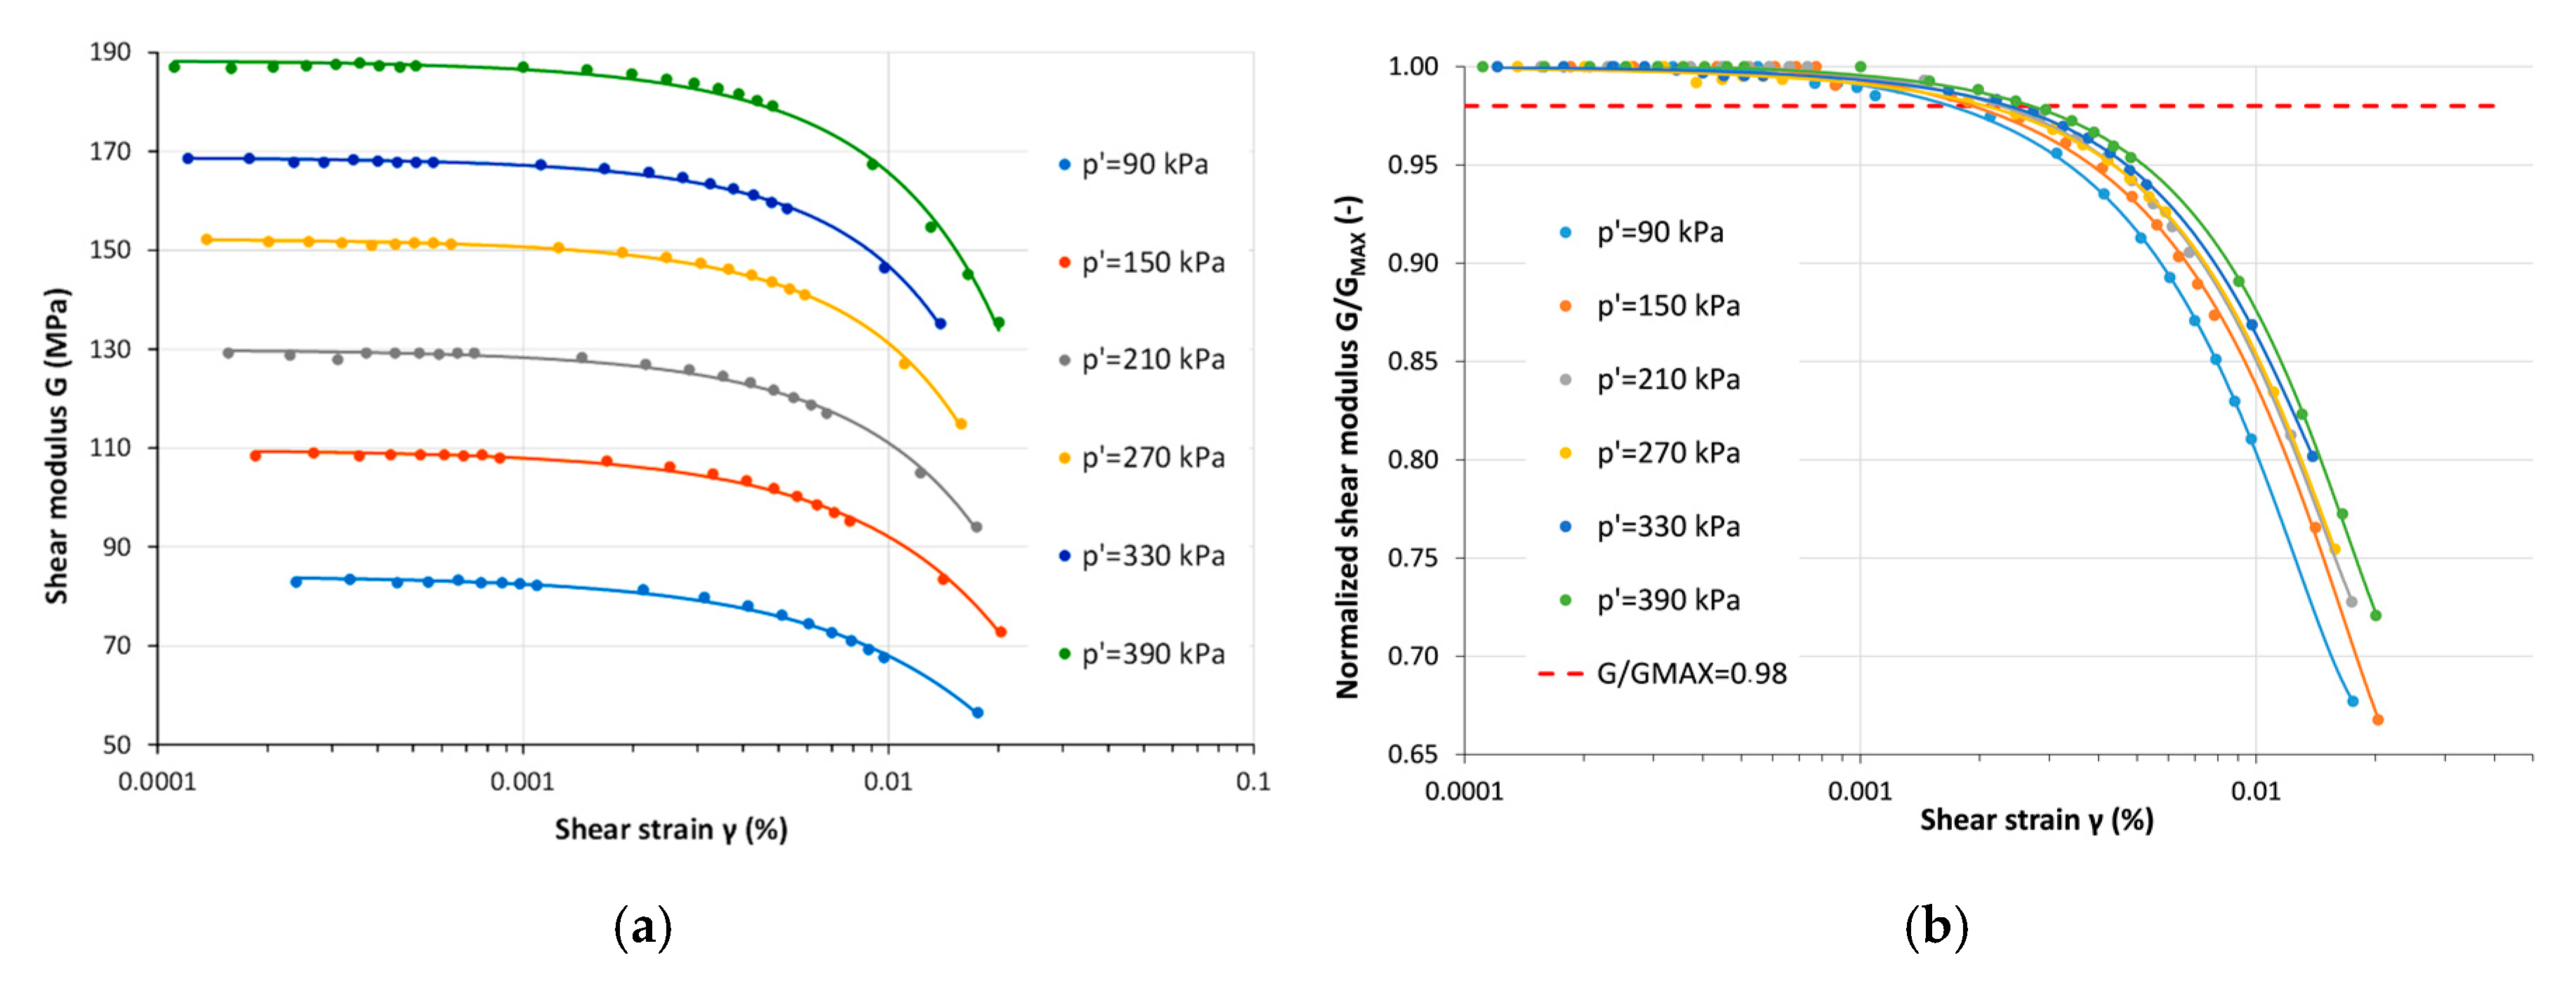
In Figure 6a, shear modulus degradation curves at different mean effective stress for specimen 9 are presented. The increase in shear modulus values with an increase in mean effective stresses can be seen at every strain level. Below a shear strain of about 0.001% constant values of G can be noticed. These values corresponded to the maximum shear modulus (GMAX). In the above mentioned strain, the values of G modulus started to decrease, firstly slowly, then more noticeably. It is connected with the change of response of the soil for loading. When shear modulus has a constant value response of soil is linear elastic, when the values of G start to drop the response change to nonlinear but still elastic. When shear modulus decreases, the significant response is also nonlinear, but caused shear is plastic [16]. This phenomenon is better visible in Figure 6b, where normalized shear modulus degradation curves (G/GMAX) at different mean effective stress for specimen 9 are presented. The red dashed line indicated G/GMAX = 0.98. This value corresponds to the so-called nonlinearity threshold strain [32,55]. Above this line, soil behaves linearly, and deformations are recoverable. The below response is nonlinear-elastic until deformation reaches the degradation threshold strain [32,55]. Then strain becomes irrecoverable. However, the value of G/GMAX correlated with that threshold strain varies from 0.85 to 0.65 depending on the researchers and studied soil [55,56,57,58].
In Figure 6b, another issue is visible, namely the impact of the effective stress on normalized shear modulus curves. It can be seen that the curve for 90 kPa effective stress starts to drop values at the smallest shear strain, and the same values of G/GMAX reached at the smallest shear strain. The line for 150 kPa went above the line for 90 kPa, and the characteristic for 210 kPa went above 150 kPa, etc. The curve for 390 kPa reached the nonlinearity threshold strain at the highest shear strain. Thus, it can be concluded that with the increase in the effective stress, the soil’s linear response for loading also increase [1,5,9,21,32,36,55]. However, the change in the linear response range was not so significant.
In Figure 7a,b, six normalized shear modulus curves for six different samples at similar effective stress are presented. In Figure 7a, the author’s results were compared with the normalized curves proposed by Vucetic and Dobry [32], while in Figure 7b, the comparison was made between the authors’ curves and Sun et al. [59] proposition. Different kinds of black lines mark the normalized curves proposed by Vucetic and Dobry [32] and Sun et al. [59], while various colors show Warsaw cohesive soils curves.
When analyzing Figure 7a, generally, medium agreement with curves proposed by Vucetic and Dobry [32] can be noticed. The biggest difference can be observed between specimen 1 and curve for PI = 0%. Namely, specimen 1 has a noticeable smaller range of elastic response than PI = 0% curve, and it is completely missing the range for cohesive soil from 0% to 15% PI. However, specimens 3, 9 and 11 were fitted in the zone for soils 15−30% PI, but only in the elasto-plastic response range. After reaching a shear strain of about 0.0079%, 0.17% and 0.23% specimens 3, 9 and 11, respectively, were crossing the curve PI = 15%. Specimen 14 also missed the range for the corresponding type of soil. However, the difference was not so significant as the case of specimen 1. The characteristic of specimen 12 was different. Firstly, it went to the off-target zone, but after reaching the shear strain at about 0.078%, it crossed the appropriate curve for 30% PI. Similar trends could be noticed in Figure 7b. In some ranges, the author’s results met appropriate curves proposed by Sun et al. [59], but in other shear strain ranges, Warsaw cohesive soil characteristics were completely different. However, discrepancies between Sun et al. [59] results and the author’s outcome were much bigger than this presented in Figure 7a.
The comparisons shown in Figure 7a,b only prove that researchers should create as many regional relationships as possible. There is no universal model in the case of stiffness degradation for every type of cohesive soil.

4.4. Empirical Formulas for G(γ)/GMAX

A complete stiffness empirical model should contain an equation for the maximum shear modulus and a formula for the normalized shear modulus degradation curve to obtain shear modulus in a wide shear strain’s range. Therefore, the authors checked every model presented in Table 2. However, these models’ relative error value was not satisfying for tested soils. Thus, the authors created a reliable equation for the modulus degradation curve (G/GMAX) for Warsaw cohesive soil.
As in the GMAX model, the authors start with the linear correlation matrix (Table 6). Obviously, the best correlation with G/GMAX had a shear strain (γ). To describe the test condition, especially the change of effective stress, the void ratio with the second-best correlation to G/GMAX was chosen. In Figure 7a,b the significant impact of the plasticity index on the shape of the normalized shear modulus reduction curves is presented. Therefore, despite the low correlation value with G/GMAX, this parameter also was chosen for the empirical model.
Firstly, the authors tried to adopt the hyperbolic model like in [5,29,34] publications. However, the results were not acceptable. Next, the core of the Amir-Faryar et al. [35] universal model for all soils was used. To improve obtained results to the Amir-Faryar et al. [35] formula, the authors added the part with the plasticity index. Below, the general pattern is presented:
G / G M a x = 1 1 + a γ b e ( c γ + d γ 2 ) ( P I f )
where, G/GMAX—normalized shear modulus (-), a, b, c, d, f—constants, e—void ratio (-) and PI—shear strain (%). The authors adopted the same statistical software as in Section 4.2 for finding constants that were respectively: a = 2.201, b = 0.721, c=−107.819, d = 1866.979 and f = −0.002.
In Table 7, the comparison between Equation (4) and other empirical models from the literature is presented. The ideal model should give the linear trend line described by equation x=y. The second column shows that from the compared model, Equation (4) proposed by the authors of this article is the closest to equality between G/GMAXmeas = G/GMAXpred. It is worth to notice that formula presented by Vardanega and Bolton [29] also has an equation close to equality between measured and predicted results. Every given model has a determination coefficient above 0.8, which is a high-value for empirical relationship. However, when R2 is compiled with the second column, only Equation (4) and the Darendeli model [5] and Vardanega and Bolton [29] model seemed to be reasonable. Confirmation of this statement could be found in 5th and 6th columns, where the absolute and relative errors are presented. The smallest of both types of error has Equation (4) and the next model from [29] and [5]. The differences between these three models seem to be very slight. However, the normalized shear modulus range was from 0 to 1, and the nonlinearity threshold strain was estimated based on specific value G/GMAX = 0.98. Thus, the model described the degradation curve of this parameter should be as accurate as it can because every 0.001 is essential and can impact a range of the soil’s elastic response for dynamic loading.
In Figure 8, measured G/GMAX versus predicted G/GMAX for models with the smallest error is presented, i.e., (a) Equation (4(b)) proposition by [5] and (c) [29]. In these figures, the middle red dashed line was equal between measured and predicted results, lines above and below represent ±10% error and the black line is a linear trend line. It can be seen that in Figure 8a, points were equally spread out above and below line x = y. Thus, the trend line nearly overlapped x = y line. Only a few points were not in the ±10% error zone. Quite similar trends could be noticed in Figure 8 b,c. From 1 to about 0.9 G/GMAX, most of the predicted values were lower than measured. Below G/GMAX = 0.8, the trend was changing to the opposite, namely predicted values in most cases were higher than the measured results.
The results from Table 7 and Figure 8 prove that from the presented empirical model, Equation (4) proposed by the authors of this article, described normalized shear modulus degradation curves of Warsaw cohesive soil with the highest accuracy and gave the most reliable results.
In Figure 9, the measured and predicted values of the shear modulus by combination of Equations (3) and (4) are presented. Firstly, based on Equation (3) GMAX was estimated, next due to Equation (4), shear modulus in a wide shear strain range was calculated. As before, the ±10% error zone and y=x are marked by red dashed lines, and the linear trend line has a black color. In this case, also the trend line was very near the x=y line. Moreover, the equation described the trend line with a determination coefficient of 0.95, which was very high. Most of the points were in the ±10% zone, which confirms the high reliability of the presented model. The relative error of the combined Equations (3) and (4) was only 6.7%.
Combination of Equations (3) and (4) allow creating the shear modulus degradation curve and determine the shear modulus’ values in the real operation range of engineering structures. Thus, it can be said that the presented empirical model thoroughly described stiffness represented by the shear modulus of cohesive Warsaw soil.

5. Summary and Conclusions

In this article, stiffness characteristics, described by the maximum shear modulus and normalized shear modulus curves, were estimated for 15 different Warsaw mineral cohesive soils using resonant column standard tests. Studied soils were collected from three various test sites in an undisturbed state. The authors created the empirical model describing the shear modulus characteristic in a wide shear strain range. The main conclusions achieved in this study are summarized below, as follows:
  • The maximum shear modulus increased with an increase in mean effective stress.
  • Change of GMAX with increasing effective stress was described with the highest determination coefficient R2 by the power function.
  • The significant GMAX empirical model parameter occurred as a void ratio e.
  • Change of e with GMAX was described with the highest R2 by quadratic functions.
  • Plasticity index (PI) occurred to have a marginal impact on the GMAX value.
  • The crated GMAX empirical model consisted of the power function of effective stress p’ and the quadratic function of the void ratio e.
  • Proposed GMAX equation calculated the values of the maximum shear modulus of Warsaw cohesive soils with the lowest relative error, of about 6.8%.
  • The shear strain had the highest impact on the shear modulus and normalized shear modulus degradation curves.
  • With increasing both plasticity and effective stress, nonlinear threshold strain moved to higher shear deformation. However, mean effective stress (p’) had a noticeably smaller impact on the elastic range of shear deformation than plasticity index (PI).
  • Proposed by the authors, the empirical model for the normalized shear modulus degradation curve consists of equation estimated by Amir-Faryar et al. [35] for all soils and power functions of the plasticity index (PI).
  • The presented equation had the lowest absolute and relative error in comparison with other models, 0.019 and 2.197%, respectively.
  • Combined GMAX and G/GMAX equations allowed us to estimate the shear modulus value of Warsaw cohesive soils in a wide shear deformation range with a low relative error of about 6.7%.
The proposed model was still preliminary and needed to be upgraded and confirmed by being applied at various clayey sites.

Author Contributions

Conceptualization, E.S.; methodology, E.S.; investigation, E.S. and K.G.; resources, W.S.; writing—original draft preparation, E.S., K.G., K.Z.; writing—review and editing, K.G., R.Š. and R.S.; supervision, W.S. All authors have read and agreed to the published version of the manuscript.

Funding

This research received no external funding.

Conflicts of Interest

The authors declare no conflict of interest.

References

  1. Kallioglou, P.; Tika, T.H.; Pitilakis, K. Shear Modulus and Damping Ration of Cohesive Soils. J. Earthq. Eng. 2008, 12, 879–913. [Google Scholar] [CrossRef]
  2. Atkinson, J. The Mechanics of Soils and Foundations, 2nd ed.; Routledge Taylor & Francis Group: London, UK; New York, NY, USA, 2007. [Google Scholar]
  3. Gu, X.; Yang, J.; Huang, M. Laboratory measurements of small strain properties of dry sands by bender elements. Soils Found. 2013, 53, 735–745. [Google Scholar] [CrossRef]
  4. Bai, L. Preloading Effects on Dynamic Sand Behavior by Resonant Column Tests. Ph.D. Thesis, Technischen Universität Berlin, Berlin, Germany, 2011. [Google Scholar]
  5. Darendeli, M.B. Development of a new family of normalized modulus reduction and material damping curves. Ph.D. Thesis, The University of Texas at Austin, Austin, TX, USA, 2001. [Google Scholar]
  6. Clayton, C.R.I. Stiffness at small strain: Research and practice. Géotechnique 2011, 61, 5–37. [Google Scholar] [CrossRef] [Green Version]
  7. Goto, S.; Tatsuoka, F.; Shibuya, S.; Kim, Y.S.; Sato, T. A simple gauge for local small strain measurements in the laboratory. Soils Found. 1991, 31, 169–180. [Google Scholar] [CrossRef] [Green Version]
  8. Scholey, G.K.; Frost, J.D.; Lo Presti, D.C.F.; Jamiolkowski, M. A review of instrumentaion for measuring small strains during triaxial testing of soil specimens. Astm. Geotech. Test. J. 1995, 18, 137–156. [Google Scholar]
  9. Jardine, R.J.; Symes, M.J.; Burland, J.B. The measurements of soil stiffness in the triaxial apparatus. Géotechnique 1984, 34, 323–340. [Google Scholar] [CrossRef]
  10. Hird, C.C.; Yung, P.C.Y. The use of proximity transducer for local strain measurements in triaxial tests. Astm Geotech. Test. J. 1989, 12, 292–296. [Google Scholar]
  11. Likitlersuang, S.; Teachavorasinskun, S.; Surarak, C.; Oh, E.; Balasubramaniam, A. Small strain stiffness and stiffness degradation curve of Bangkok Clays. Soils Found. 2013, 53, 498–509. [Google Scholar] [CrossRef] [Green Version]
  12. Kramer, S.L. Geotechnical Earthquake Engineering, 1st ed.; Prentice Hall: New York, NY, USA, 1996. [Google Scholar]
  13. Hardin, B.O.; Black, W.L. Vibration modulus of normally consolidated clays. ASCE J. Soil. Mech. Found. Div. 1968, 94, 353–369. [Google Scholar]
  14. Hardin, B.O.; Black, W.L. Vibration modulus of normally consolidated clay–closure. ASCE J. Soil Mech. Found. Div. 1969, 95, 1531–1537. [Google Scholar]
  15. Lefebvre, G.; Leboeuf, D. Laboratory and field determinations of small-strain shear modulus for a structured Champlain clay. Can. Geotech. J. 1994, 31, 61–70. [Google Scholar] [CrossRef]
  16. Jardine, R.J. Some observation on the kinematic nature of soil stiffness. Soils Found. 1992, 32, 111–124. [Google Scholar] [CrossRef] [Green Version]
  17. Gazetas, G. Vibrational characteristics of soil deposits with variable wave velocity. Int. J. Numer. Anal. Methods Geomech. 1982, 6, 1–10. [Google Scholar] [CrossRef]
  18. Carlton, B.D.; Pestana, J.M. A unified model for estimating the in-situ small strain shear modulus of clays, silts, sands, and gravels. Soil Dyn. Earthq. Eng. 2016, 88, 345–355. [Google Scholar] [CrossRef] [Green Version]
  19. Gabryś, K.; Sas, W.; Soból, E. Dynamic and cyclic static loading behavior of silty-sandy clay at small and moderate strains. Acta Sci. Pol. Ser. Archit. 2016, 15, 43–55. [Google Scholar]
  20. Marcuson, W.; Wahls, H. Time effects on dynamic shear modulus of clays. ASCE J. Soil Mech. Found. Div. 1972, 98, 1359–1373. [Google Scholar]
  21. Kim, T.; Novac, M. Dynamic properties of some cohesive soils of Ontario. Can. Geotech. J. 1981, 18, 371–389. [Google Scholar] [CrossRef]
  22. Kokusho, T.; Yoshida, Y.; Esashi, Y. Dynamic properties of soft clay for wide strain range. Soils Found. 1982, 22, 1–18. [Google Scholar] [CrossRef] [Green Version]
  23. Stokoe II, K.H.; Hwang, S.K.; Lee, J.K.; Andrus, R.D. Effects of various parameters on the stiffness and damping of soils at small to medium strains. In Proceedings of the International Symposium, Sapporo, Japan, 12–14 September 1994. [Google Scholar]
  24. Jamiolkowski, M.; Lancellotta, R.; Lo Presti, D.C.F. Remarks on the stiffness at small strains of six Italian clays. Pre-Fail. Deform. Geomaterials 1995, 2, 817–836. [Google Scholar]
  25. Shibuya, S.; Tanaka, H. Estimate of elastic shear modulus in Holocene soil deposits. Soils Found. 1996, 36, 45–55. [Google Scholar] [CrossRef] [Green Version]
  26. D’Elia, B.; Lanzo, G. Laboratory and field determinations of small-strain shear modulus of natural soil deposits. In Proceedings of the 11th World Conference on Earthquake Engineering, Acapulco, Mexico, 23–28 June 1996. [Google Scholar]
  27. Vrettos, C.; Savidis, S. Shear modulus and damping for Mediterranean sea clays of medium plasticity. In Earthquakes Geotechnical Engineering; e Pinto, P.S., Balkema, A.A., Eds.; CRC Press: Lisboa, Portugal, 1999; pp. 71–76. [Google Scholar]
  28. Hassanipour, A.; Shafiee, A.; Jafari, M.K. Low-amplitude dynamic properties for compacted sand-clay mixtures. Int. J. Civ. Eng. 2011, 9, 255–264. [Google Scholar]
  29. Vardanega, P.J.; Bolton, M.D. Stiffness of clays and silts: Normalizing shear modulus and shear strain. J. Geotech. Geoenvironmental Eng. 2013, 139, 1575–1589. [Google Scholar] [CrossRef] [Green Version]
  30. Sas, W.; Gabryś, K.; Szymański, A. Experimental studies of dynamic properties of Quaternary clayey soils. Soil Dyn. Earthq. Eng. 2017, 95, 29–39. [Google Scholar] [CrossRef]
  31. Iwasaki, T.; Tatsuoka, F. Shear moduli of sands under cyclic torsional shear loading. Soils Found. 1977, 17, 19–35. [Google Scholar] [CrossRef]
  32. Vucetic, M.; Dobry, M. Effect of Soil Plasticity on Cyclic Response. ASCE J. Geotech. Eng. 1991, 117, 89–107. [Google Scholar] [CrossRef]
  33. Ishibashi, I.; Zhang, X. Unified dynamic shear moduli and damping ratios of sand and clay. Soils Found. 1993, 33, 182–191. [Google Scholar] [CrossRef] [Green Version]
  34. Zhang, J.; Andrus, R.D.; Juang, C.H. Normalized shear modulus and material damping ratio relationships. J. Geotech. Geoenvironmental Eng. 2005, 131, 453–464. [Google Scholar] [CrossRef]
  35. Amir-Faryar, B.; Aggour, M.S.; McCuen, R.H. Universal model forms for predicting the shear modulus and material damping of soils. Geomech. Geoengin. 2017, 12, 60–71. [Google Scholar] [CrossRef]
  36. Soból, E.; Głuchowski, A.; Szymański, A.; Sas, W. The New Empirical Equation Describing Damping Phenomenon in Dynamically Loaded Subgrade Cohesive Soils. Appl. Sci. 2019, 9, 4518. [Google Scholar] [CrossRef] [Green Version]
  37. PN-B-04481:1988. Grunty Budowlane–Badania Próbek Gruntu; PKN: Plock, Poland, 1988. (In Polish) [Google Scholar]
  38. ISO 17892-4:2016 Geotechnical Investigation and Testing–Laboratory Testing of Soil–Part 4: Determination of Particle Size Distribution. Available online: http:/sklep.pkn.pl/pn-en-iso-17892-4-2017-01e.html (accessed on 18 January 2017).
  39. ISO. 17892-1:2014 Geotechnical Investigation and Testing–Laboratory Testing of Soil–Part. 1: Determination of Water Content; ISO: Geneva, Switzerland, 2007. [Google Scholar]
  40. ISO. 17892-12:2018 Geotechnical Investigation and Testing–Laboratory Testing of Soil–Part. 12: Determination of Liquid and Plastic Limits; ISO: Geneva, Switzerland, 2018. [Google Scholar]
  41. ISO. 17892-5:2017 Geotechnical Investigation and Testing–Laboratory Testing of Soil–Part. 5: Incremental Loading Oedometer Test; ISO: Geneva, Switzerland, 2017. [Google Scholar]
  42. Wiłun, Z. Zarys Geotechniki, 3rd ed.; Wydawnictwa Komunikacji i Łączności: Warsaw, Poland, 1987. (In Polish) [Google Scholar]
  43. Khan, M.I. Hydraulic Conductivity of Moderate and Highly Dense Expansive Clay. Ph.D. Thesis, University of Bochum, Bochum, Germany, 2012. [Google Scholar]
  44. Grim, R.E. Clay Mineralogy; MC Graw-Hill Book Co.: New York, NY, USA, 1960. [Google Scholar]
  45. Tazaki, K.; Fukuyama, A.; Tazaki, F.; Takehara, T.; Nakamura, K.; Okuno, M.; Hashida, Y.; Hashida, S. Electron Microscopy Observation of Biomineralization within Wood Tissues of Kurogaki. Minerals 2017, 7, 123. [Google Scholar] [CrossRef] [Green Version]
  46. Niedźwiedzka, K. Skład Mineralny Jako Główny Czynnik Wpływający na Pęcznienie Gruntów Ilastych. MSc Thesis, Warsaw University of Life Sciences, Warsaw, Poland, 2012. (In Polish). [Google Scholar]
  47. Bekkouche, A.; Djedid, A.; Aissa Mamoune, S. Identification et prevision du gonflement de quelques sols de la region de Tlemeen. Bull. Lab. Ponts Chaussees 2001, 233, 69–77. [Google Scholar]
  48. Meehan, R.; Karp, L. California Housing Damage Related to Expansive Soils. J. Perform. Constr. Fac. 1994, 8, 139–157. [Google Scholar] [CrossRef]
  49. Chen, F. Foundations on Expansive Soils; Elsevier Scientific Pub. Co.: Amsterdam, The Netherlands, 1988. [Google Scholar]
  50. Gabryś, K.; Sas, W.; Soból, E.; Głuchowski, A. Torsional shear device for testing the dynamic properties of recycled material. Studia Geotech. Mech. 2016, 38, 15–24. [Google Scholar] [CrossRef] [Green Version]
  51. Gabryś, K. Charakterystyki odkształceniowe wybranych gruntów spoistych. Ph.D. Thesis, Warsaw University of Life Sciences, Warsaw, Poland, 2014. (In Polish). [Google Scholar]
  52. ASTM Standard D4015-92. Test. Methods for Modulus and Damping of Soils by the Resonant Column Method; Annual Book of ASTM Standards; ASTM International: West Conshohocken, PA, USA, 2003; pp. 473–494. [Google Scholar]
  53. Gabrys, K.; Sobol, E.; Markowska-Lech, K.; Szymański, A. Shear Modulus of Compacted Sandy Clay from Various Laboratory Methods. In IOP Conference Series: Materials Science and Engineering; IOP Publishing: Bristol, UK, 2019. [Google Scholar]
  54. Li, H.; Senetakis, K.; Coop, M.R. Medium-strain dynamic behavior of fiber-reinforced sand subjected to stress anisotropy. Soil Dyn. Earthq. Eng. 2019, 126, 105764. [Google Scholar] [CrossRef]
  55. Stokoe, K.H.; Darendeli, M.B.; Andrus, R.D.; Brown, L.T. Dynamic soil properties: Laboratory, field and correlation studies. Earthq. Geotech. Eng. 1999, 811–845. [Google Scholar]
  56. Vucetic, M. Cyclic threshold shear strains in soils. J. Geotech. Eng. 1994, 120, 2208–2228. [Google Scholar] [CrossRef]
  57. Matsui, T.; Ohara, H.; Ito, T. Cyclic stress-strain history and shear characteristics of clay. ASCE J. Geotech. Eng. 1980, 106, 1101–1120. [Google Scholar]
  58. Santos, J.A.; Correia, A.G. Reference threshold shear strain of soil, its application to obtain a unique strain-dependent shear modulus curve for soil. In Proceedings of the 15th International Conference on Soil Mechanics and Geotechnical Engineering, Istanbul, Turkey, 27–31 August 2001; pp. 267–270. [Google Scholar]
  59. Sun, J.; Golesorkhi, R.; See, H. Dynamic Moduli and Damping Ratio for Cohesive Soils; Report No. UCB/EERC-88/15; University of California Berkeley-Earthquake Engineering Research Center: Berkeley, CA, USA, 1988. [Google Scholar]
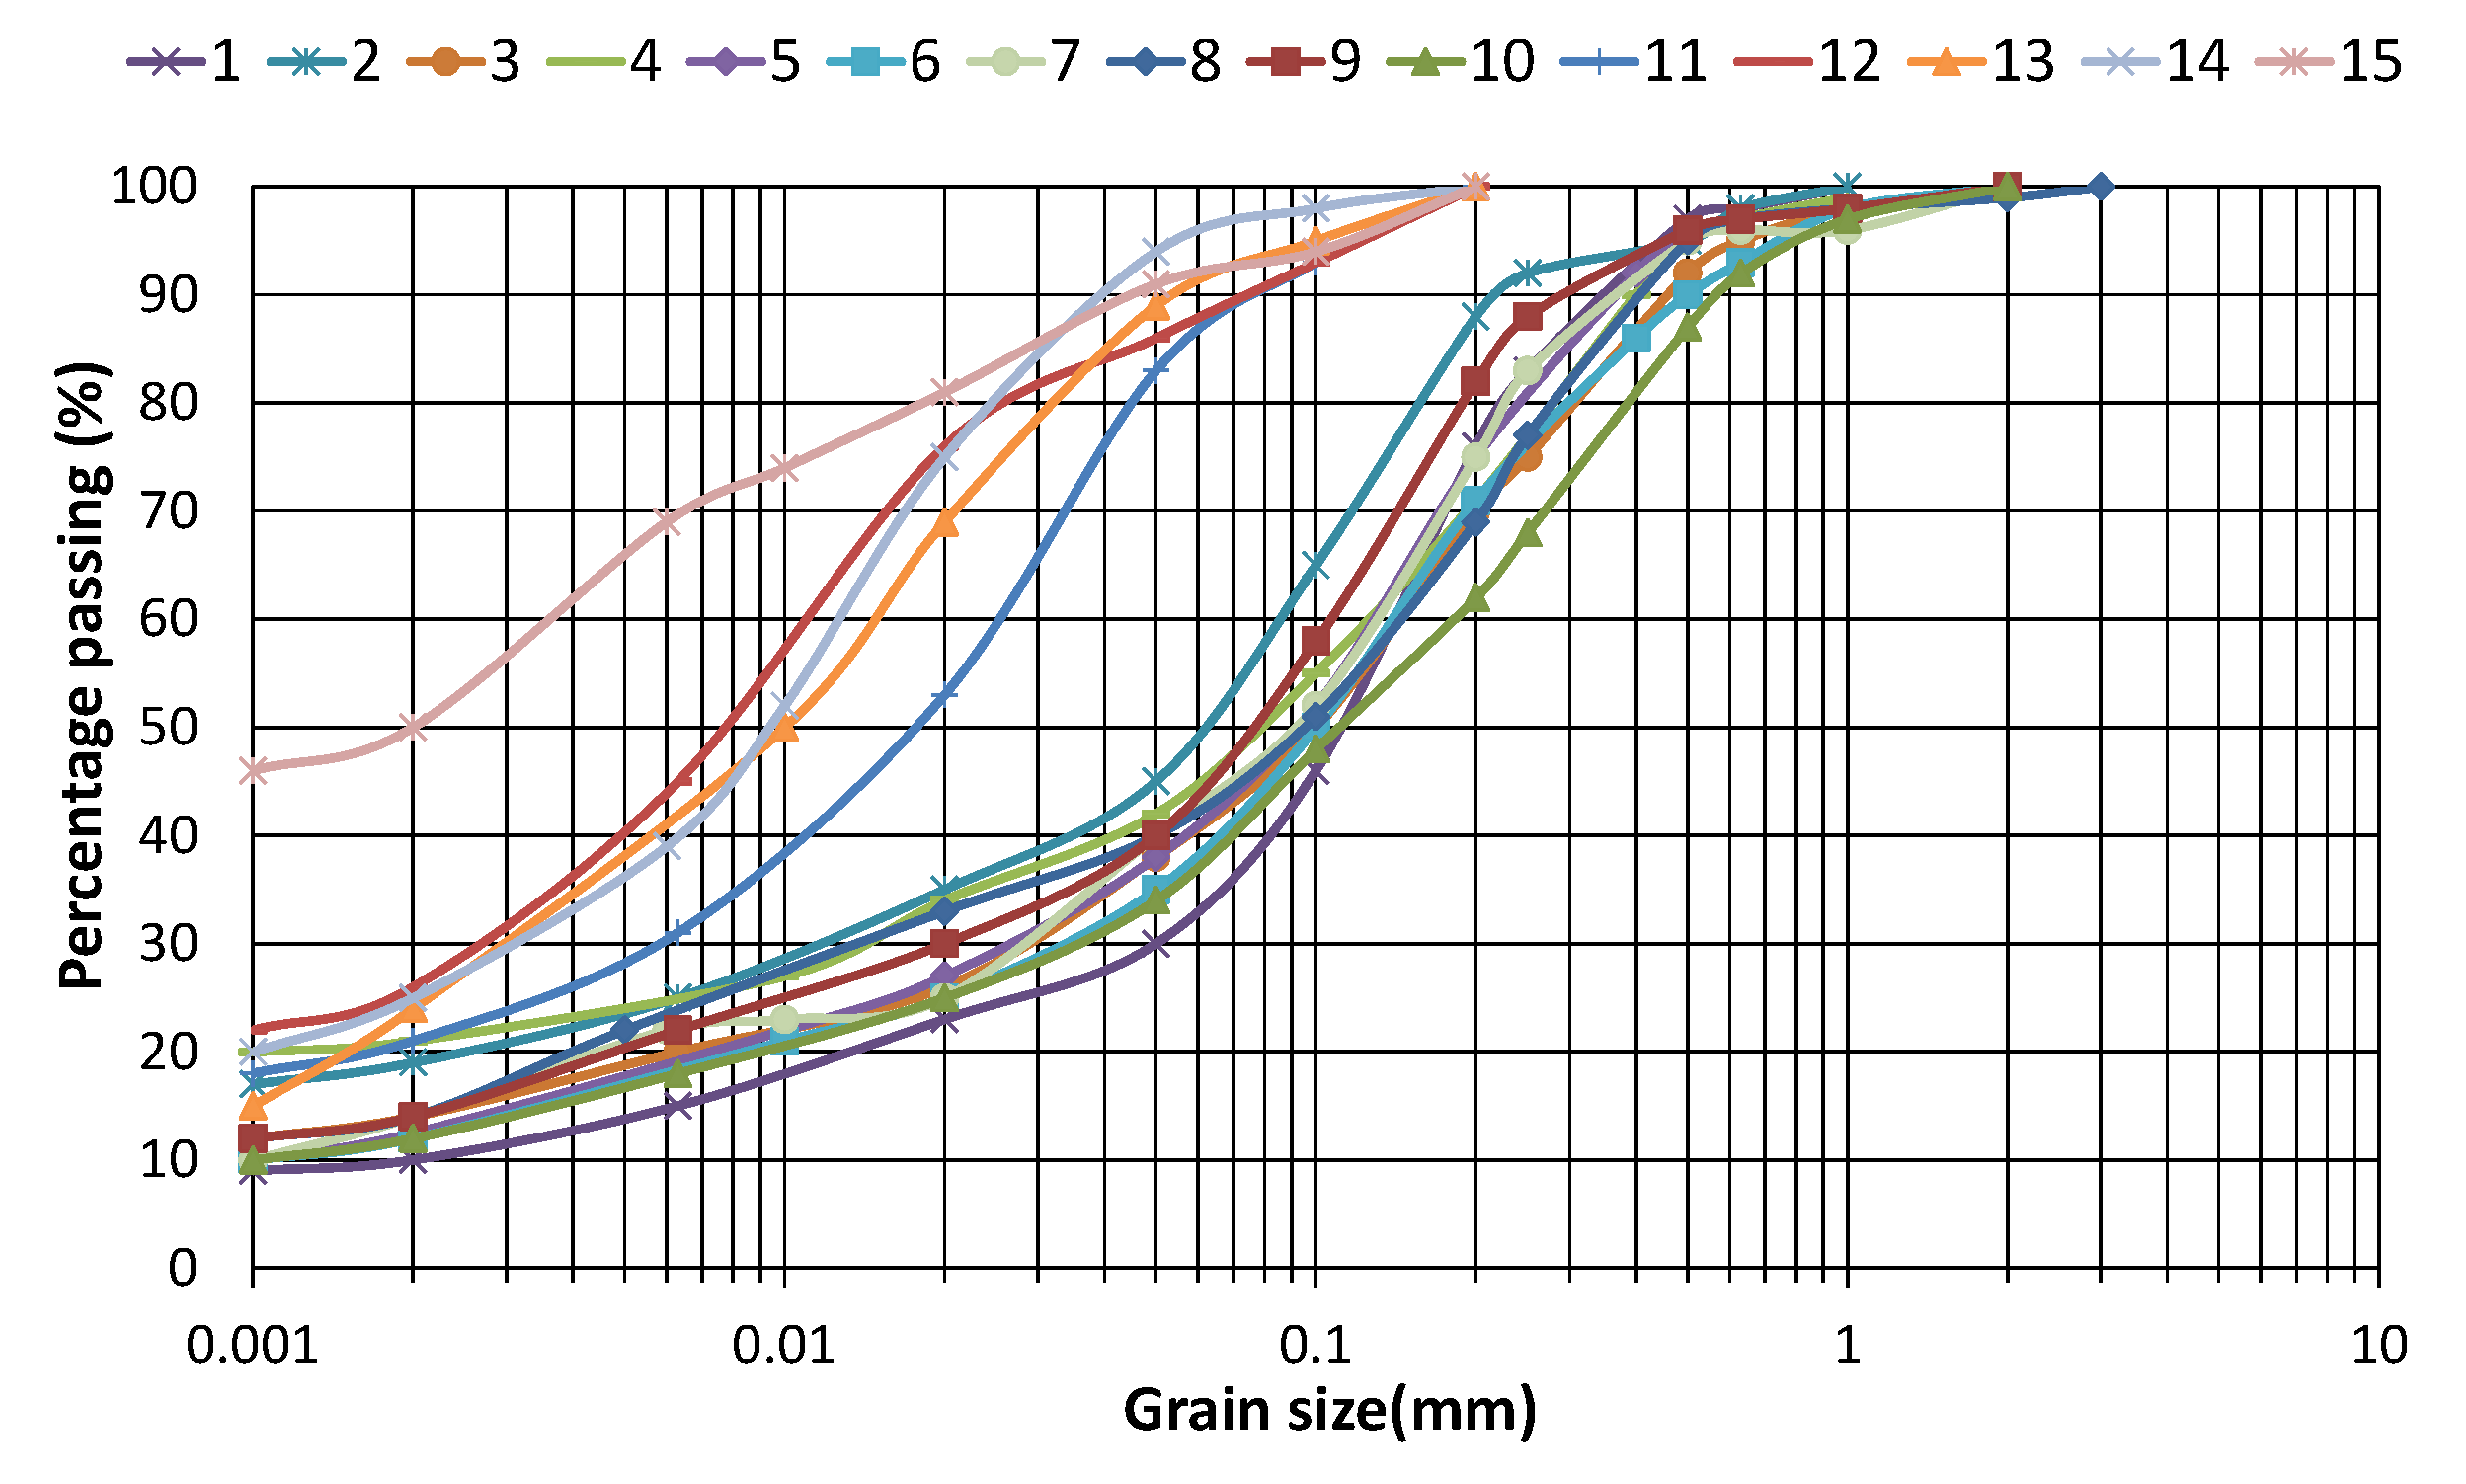
Figure 1. Grain size distribution curves of the test materials.
Minerals 10 01127 g001
Figure 2. Maximum shear modulus GMAX against mean effective stress p’.
Minerals 10 01127 g002
Figure 3. Maximum shear modulus (GMAX) against void ratio (e).
Minerals 10 01127 g003
Figure 4. Relative error (%) of the measured to calculated GMAX values by authors’ equation and equation from Table 1.
Minerals 10 01127 g004
Figure 5. Measured versus predicted by authors’ equation maximum shear modulus (GMAX) values.
Minerals 10 01127 g005
Figure 6. The example of (a) shear modulus (G) degradation curves and (b) normalized shear modulus degradation curves (G/GMAX) at various mean effective stress (p’) for specimen 9.
Minerals 10 01127 g006
Figure 7. The example of normalized shear modulus (G/GMAX) degradation curves compared to Vucetic and Dobry [32] (a) and Sun et al. [59] (b) curves for samples [1,3,9,11,12,14] with a different plasticity index PI.
Minerals 10 01127 g007
Figure 8. Measured versus predicted normalized shear modulus by empirical models purposed by (a) the authors of this article and (b) Darendeli [5] and (c) Vardanega and Bolton [29].
Minerals 10 01127 g008
Figure 9. Measured versus predicted shear modulus by Equations (3) and (4).
Minerals 10 01127 g009
Table 1. Relationships for GMAX of cohesive soils.
EquationsSoil TypeReference
G M A X = 3231 · ( 2.97 e ) 2 ( 1 + e ) · ( σ 0 ) 0.5 Remolded Edgar Plastic Kaolin and Boston blue clayHardin and Black 1968 [13]
G M A X = 445 · ( 4.4 e ) 2 ( 1 + e ) · ( σ 0 ) 0.5 Remolded specimens of kaolinite and calcium bentoniteMarcuson and Wahls 1972 [20]
G M A X = 1576 · ( 2.97 + e ) 2 ( 1 + e ) · ( σ 0 ) 0.5 Various clays; e = 0.48-1.36 and PI=12−30.3%Kim and Novac 1981 [21]
1 . G M A X = 4500 · ( 2.97 + e ) 2 ( 1 + e ) · ( σ 0 ) 0.5
2 . G M A X = 141 · ( 7.32 + e ) 2 ( 1 + e ) · ( σ 0 ) 0.6
1. Kaolinite PI = 25%
2. Alluvial clays; e = 1.5−4.0 and PI = 40−100%
Kokusho et al. 1982 [22]
G M A X = 370 · 1 ( 0.3 + 0.7 e ) 2 · ( σ 0 ) 0.54 · ( p a ) ( 0.46 ) Silty claysStokoe et al. 1995 [23]
G M A X = 600 · e 1.3 · ( σ 0 ) 0.5 · ( p a ) ( 0.5 ) Italian clays; e = 0.6−3.0 and PI = 10−75%Jamiolkowski et al. 1995 [24]
G 0 = 5000 · e 1.3 · ( σ 0 ) 0.5 Seven clays; e = 1.47−3.29 and PI = 19−116%Shibuya and Tanaka 1996 [25]
1 . G M A X = 358 · e 1.21 · ( σ 0 ) 0.57 · ( p a ) ( 0.43 )
2 .   G M A X = 506 · e 1.1 · ( σ 0 ) 0.42 · ( p a ) ( 0.58 )
1. Sandy silt, silty sand
2. Clayey silts;
e = 0.48−1.07 and PI = 10−38%
D’Elia and Lanzo 1996 [26]
G M A X = 9600 1 ( 1 + 1.2 e 2 ) ( σ 0 ) 0.5 Clays; e = 0.583–1.068 andPI = 9−27%Vrettos andSavidis 1999 [27]
G M A X = ( 6290 80 PI ) · e 0.63 · ( σ 0 ) 0.5 Undisturbed cohesive soils; e = 0.365−1.118 and PI = 5−46%Kallioglou et al. 2008 [1]
G M A X = A · ( 2.95 + e ) 2 ( 1 + e ) · ( σ 0 ) 0.5
A = 1700 S C + 2000 ;   S C 0.6
A = 2000 S C + 4300 ; 0.6 < S C 0.8
Compacted clays and sand-clay mixtures; PI = 12−50% Hassanipour et al. 2011 [28]
G M A X p r = 20000 ( 1 + e ) 2.4 · ( σ 0 p r ) 2 Various clays and silts; e = 0.48−6.15 and PI = 10−150%Vardanega and Bolton 2013 [29]
1 . G M A X = 3.02 σ 0 0.68
2 .   G M A X 0 = 0.82 σ 0 0.96
Various cohesive soils from Warsaw; e = 0.34−0.6 and PI = 14.8−27.5%Sas et al. 2017 [30]
Where: e—void ratio (-), σ’0—effective stress (kPa), pa—atmospheric pressure = 100 kPa, p’r—reference pressure = 1 kPa, PI = plasticity index (%), SC—sand content (-).
Table 2. Relationships for G/GMAX of cohesive soils.
EquationsSoil TypeReference
G G M A X = K ( γ , P I ) σ 0 m ( γ ,   P I ) m 0
m ( γ ,   P I ) m 0 = 0.272 [ 1 tanh { l n ( 0.000556 γ ) 0.4 } ] e 0.0145 P I 1.3
K ( γ , P I ) = 0.5 [ 1 + tanh { l n ( 0.000102 + n ( P I ) γ ) 0.492 } ]
n ( P I ) = { 0 , 0   f o r   P I = 0 3.37 · 10 6 P I 1.404   f o r   0 < P I 15 7.0 · 10 7 P I 1.976   f o r   15 < P I 70 2.7 · 10 5 P I 1.115   f o r   P I > 70
Various cohesive soilsIshibashi, I. and Zhang 1993 [33]
G G M A X = 1 1 + ( γ / γ r ) α
γ r = ( 0.0352 + 0.00101 · P I · O C R 0.325 ) σ 0 0.348 ;   α = 0.919
Various cohesive soilsDarendeli 2001 [5]
G G M A X = 1 1 + ( γ / γ r ) α
α = 0.0021 P I + 0.834 ;   γ r = γ r 1 ( σ 0 / P a ) k
k = 0.316 exp ( 0.0142 P I ) ;   γ r 1 = 0.0749 + 0.0011 P I
Various cohesive soilsZhang et al. 2005 [34]
G G M A X = b + c ( 0.5 + atan ( P I d e ) π ) + f ( 0.5 + atan ( γ g h ) π ) + i ( 0.5 + atan ( P I d e ) π ) ( 0.5 + atan ( γ g h ) π )
b = 0.99418785 ;   c = 2.1598671 ;   d = 10.039495 ;
e = 16.863967 ; f = 0.06296143 ; g = 0.01368813 ;
h = 0.02900694 ; i = 5.9454009
Undisturbed cohesive soils; e = 0.365−1.118 and PI = 5−46%Kallioglou et al. 2008 [1]
G G M A X = 1 1 + ( γ / γ r ) 0.943 ;   γ r = 0.0037 P I Various clays and silts; e = 0.48−6.15 and PI = 10−150%Vardanega and Bolton 2013 [29]
1 .   G G M A X = 1 1 + 6.141 γ 0.9122 e ( 1.546 γ + 0.00983 γ 2 )
2 .   G G m a x = 1 1 + a γ b e ( c γ + d γ 2 )
1. Clays
2. Universal model for all soils
Amir-Faryar et al. 2017 [35]
Where: e—void ratio (-), PI—plasticity index (%), γ—shear strain (%), OCR—overconsolidation ratio (-), σ’0—effective stress (kPa), Pa—atmospheric pressure equal 100 kPa.
Table 3. Physical properties of test materials and the range of mean effective stress.
Test SiteTest
Name
Soil Typed50 (mm)WC (%)LL
(%)
PL
(%)
PI
(%)
p’
(kPa)
e0
(-)
OCR
(-)
No 11clSa0.1111.0617.7011.106.6060–2400.3223.33–1
2sasiCl0.0617.4136.5014.1022.40900.4781.00
3sasiCl0.110.7624.5012.4712.0375–4150.3042.13–1
4saCl0.0812.2337.0011.4525.6045–3150.3651.00
5clSa0.09515.5741.7014.2627.4090–3150.4031.00
6clSa0.110.518.209.109.1045–3150.4291.00
7sasiCl0.0912.6827.1012.3214.8055–1650.3891.00
No 28saCl0.09811.7522.1011.5010.6050–2000.4052.8–1
9sasiCl0.07818.8532.7515.9616.8090–3900.5621.00
10clSa0.1114.4321.2012.248.9670–2100.4361.00
No 311siCl0.01817.5337.2517.1420.10120–4100.4731.00
12siCl0.007719.8444.6019.4925.1085–3100.5912–1
13siCl0.0121.9851.2723.6527.60145–2900.5951.38–1
14siCl0.009122.9563.5026.8236.70160–3200.6341.25–1
15Cl0.00226.0470.9533.1137.8095–2850.7476.32–2.11
where: WC—initial water content, LL—liquid limit, PL—plasticity limit, PI—plasticity index, p’—mean effective stress, e0—initial void ratio, OCR—overconsolidation ratio, d50—the diameter of the soil grains, which together with the smaller ones account for 50% of the total sample.
Table 4. Expansiveness characteristics of tested materials.
Test NameSoil TypeTotal Clay Minerals (%)Content of Expansive Clay Minerals (%)Montmorillonite (%)Illite (%)Kaolinite (%)σcs
(kPa)
13siCl41.3033.6033.60trace content7.70105
14siCl41.3029.2029.20012.10120
15Cl43.7034.5034.50trace content9.2090
where: σcs—swelling pressure, determined by the method of graduated loading of the swollen specimen.
Table 5. Correlation matrix for tested soils where Cl, Si and Sa+Gr is the clay, silt and sand and gravel content.
Cl (%)Si (%)Sa+Gr (%)PI (%)p’ (kPa)e (-)OCR (-)GMAX (MPa)
Cl (%)1.0000.510−0.7820.8230.0970.7240.1580.174
Si (%)0.5101.000−0.9350.5420.2360.620−0.1000.241
Sa+Gr (%)−0.782−0.9351.000−0.732−0.211−0.7470.008−0.246
PI (%)0.8230.542−0.7321.0000.0890.653−0.0340.096
p’ (kPa)0.0970.236−0.2110.0891.000−0.016−0.1670.971
e (-)0.7240.620−0.7470.653−0.0161.000−0.0850.045
OCR (-)0.158−0.1000.008−0.034−0.167−0.0851.000−0.098
GMAX (MPa)0.1740.241−0.2460.0960.9710.045−0.0981.000
Table 6. Correlation matrix for tested soils, where Cl, Si and Sa+Gr is the clay, silt and sand and gravel content.
Cl (%)Si (%)Sa+Gr (%)PI (%)p’ (kPa)e (-)OCR (-)γ (%)G/GMAX (-)
Cl (%)1.0000.538−0.7750.8300.0930.7260.3870.0450.062
Si (%)0.5381.000−0.9500.5550.2470.607−0.0500.0480.137
Sa+Gr (%)−0.775−0.9501.000−0.725−0.219−0.725−0.106−0.053−0.126
PI (%)0.8300.555−0.7251.0000.0900.6830.1220.166−0.032
p’ (kPa)0.0930.247−0.2190.0901.000−0.016−0.343−0.0250.084
e (-)0.7260.607−0.7250.683−0.0161.0000.1700.0230.148
OCR (-)0.387−0.050−0.1060.122−0.3430.1701.000−0.1020.040
γ (%)0.0450.048−0.0530.166−0.0250.023−0.1021.000−0.905
G/GMAX (-)0.0620.137−0.126−0.0320.0840.1480.040−0.9051.000
Table 7. Comparison between the author’s empirical model and purposed by [1,5,29,34,35].
ReferenceLinear Equation Described a Trend Line G/GMAXmeas.–G/GMAXpred. *Determination Coefficient R2Error type
Absolute (-)Relative (%)
Authors Equation (4)y = 1.0115x−0.00850.920.0192.197
Darendeli 2001 [5]Y = 1.1295x−0.11120.870.0283.290
Zhang et al. 2005 [34]y = 1.5295x−0.510.870.0293.732
Kallioglou et al. 2008 [1]y = 0.5081x+0.50150.850.08710.473
Vardanega and Bolton 2013 [29]y = 1.0781x−0.06180.860.0283.283
Amir-Faryar et al. 2017 [35]y = 1.7552x−0.74580.830.0344.391
* where, G/GMAXmeas.—normalized shear modulus measured (-), G/GMAXpred.—normalized shear modulus predicted by compared empirical models (-), yG/GMAXmeas., xG/GMAXpred.
Publisher’s Note: MDPI stays neutral with regard to jurisdictional claims in published maps and institutional affiliations.