Article

Initial Stages of Gypsum Nucleation: The Role of “Nano/Microdust”

1
JSC “Fine Chemicals R&D Centre”, 107258 Moscow, Russia
2
Department of Chemistry and Technology of Biomedical Pharmaceuticals, Mendeleev University of Chemical Technology, 125047 Moscow, Russia
3
Department of Inorganic Substances and Electrochemical Processes, Mendeleev University of Chemical Technology, 125047 Moscow, Russia
*
Author to whom correspondence should be addressed.
Minerals 2020, 10(12), 1083; https://doi.org/10.3390/min10121083
Submission received: 20 October 2020 / Revised: 27 November 2020 / Accepted: 30 November 2020 / Published: 2 December 2020
(This article belongs to the Special Issue Formation of Sulfate Minerals in Natural and Industrial Environments)

Abstract

:
The primary nucleation mechanism of the gypsum in a bulk aqueous medium was identified as a heterogeneous one for 0.05 and 0.03 mol·L−1 CaSO4·2H2O solutions and 25 °C. By means of a particle counter and dynamic light scattering (DLS) technique, solid nano/microimpurities were found, and controlled in stock brines for gypsum supersaturated solutions preparation. It is demonstrated that the common procedure of reagent grade 0.10 mol·L‒1 CaCl2 and Na2SO4 aqueous solutions filtration via 200 nm membranes is capable to reduce the foreign solid microimpurities content (size > 100 nm) from 106 to 103 units in 1 mL, but fails to affect the more numerous nanofraction (size < 100 nm). Thus, the gypsum nucleation takes place in presence of a significant amount of “nano/microcodust” templates, and has a heterogenous character. The induction time, measured by conductivity for the similar supersaturation levels, reveals a well detectable dependence on nano/microdust concentent: an increasing background particle concentration substantially decreases the induction period at a constant saturation state and temperature, and thus increases the nucleation rate. Therefore, the gypsum nucleation reaction starts tentatively through the fast heterogeneous formation of well-defined, primary nuclei via [Ca2+], [SO42‒], and [CaSO4]o species sorption on the surface of “nano/microdust” particles. Thus, the “nano/microdust”, naturally occurring in any high purity chemical, plays a key role in sparingly soluble salts nucleation in the bulk aqueous medium.

1. Introduction

Gypsum crystallization has been a matter of intensive research since the end of XIX Century [1]. From the systematic studies of van’t Hoff [2] to more recent reports [3,4,5,6], there are over 6000 publications in this field, accounted for by Chemical Abstracts. An interest in gypsum crystallization is due to the broad spectrum of its applications, including both positive and negative ones. The formation of calcium sulfate minerals (gypsum, anhydrite, and bassanite) is a common process in both natural and engineered settings. It plays a key role in the global sulfur cycle in the environment, and has been employed since antiquity in construction and architecture [3]. At the same time, the gypsum scale formation is a serious concern in reverse osmosis desalination and in oilfield technologies [7,8]. Thus, it is not surprising that the mechanisms of gypsum nucleation and growth in supersaturated aqueous solutions became a matter of intensive research during the past century [3,4,5,6,9,10,11,12,13,14,15,16,17,18,19,20,21]. These efforts resulted in a very impressive evolution of the views on gypsum formation mechanisms in aqueous solutions from a single-step process within the classical nucleation paradigm [9] to a far more complex picture of the process than previously assumed [3].
Indeed, in a set of recent excellent sophisticated studies, Stawski, Van Driessche, and co-authors [3,19,20,21] have demonstrated that gypsum appears to fall into a category of materials that do not follow classical nucleation and growth theories. Particularly, using truly in situ and fast time-resolved small-angle X-ray scattering, this research group managed to quantify the four-stage solution-based nucleation and growth of CaSO4·2H2O [20]. The reaction starts through the fast formation of well-defined, primary species of 3 nm in length (stage I), followed in stage II by their arrangement into domains. The variations in volume fractions and electron densities suggest that these fast forming primary species contain Ca-SO4-cores that self-assemble in stage III into large aggregates. Within the aggregates these well-defined primary species start to grow (stage IV), and fully crystallize into gypsum through a structural rearrangement.
However, we have noticed, that both single-step and multi-step mechanisms of a bulk gypsum crystallization in supersaturated aqueous solution [3,4,9,13,14,15,16,18,19,20,21] are built on the assumption, that a pre-nucleation step occurs via spontaneous homogeneous association [22,23] of several ion pairs of calcium-sulfate complexes [CaSO4]o as well as calcium and sulfate ions. Such [CaSO4]no aggregates are treated as solute precursors of further gypsum nuclei formation and growth. Meanwhile, the general theory assumes along with spontaneously formed homogeneous associates a bulk heterogeneous nucleation as a result of foreign impurity presence: traces of naturally dispersed solid particles [24]. The latter route is thermodynamically more favorable than a homogeneous one, and such particles should evidently serve as natural precursors (templates) for crystals formation.
Unfortunately, the bulk heterogeneous scenario of nucleation is usually not considered in crystallization experiments, as it is believed, that a commonly used filtration with 200 to 400 nm filters [14,15,16,18,20], provides a complete removal of foreign solid dispersed matter from stock solutions, prepared from high purity chemicals, applied further for supersaturated solution preparation. Moreover, some research groups do not report any filtration at all, considering the use of pure chemicals enough to guarantee the lack of solid impurities [10,11,12,13]. Meanwhile, it is not the case. The recent studies of gypsum crystallization by Fan and Pashley [25], based on the Spectrex laser particle counter test, indicated, that the normal double distilled water, left exposed to laboratory air, contains a large number of contaminant particles: more than 14,000 counts per mL of less than 3 μm in size. It was demonstrated that the induction time was obviously affected by the presence of foreign particles in the system [25]. However, the particle counter used in [25] was unable to detect particle below 500 nm size. Our recent studies [26] indicated a presence of foreign solid particles (sized over 100 nm) in some reagent grade chemicals after 220 nm membrane filtration in amounts from 102 to ≥105 units in 1 mL. They are in a good agreement with the statement of Mullin [27], that it is not possible to achieve complete absence of foreign particles, although careful filtration can reduce the amount to less than 103 units per mL.
Therefore, an objective of a present study is to figure out an impact of natural solid foreign impurities (further denoted as nano/microdust) on the kinetics of gypsum crystallization. To reach the goal a combination of a particle counter technique, dynamic light scattering (DLS) and electro conductivity (EC) is applied. As far as we know, this is the first communication in this field. Besides the work of Fan and Pashley [25] with very rough estimations, we failed to find a publication where the concentration of nano/microdust was controlled after the stock solutions have passed a filtration via 200 or 220 nm filters. In fairness it should be noted that before 2019 our research group was not an exception in this list.

2. Materials and Methods

2.1. Reagents

CaCl2 (Sigma-Aldrich ASC reagent, ≥96.0%), Na2SO4 (GOST 21458-75, RU; 98.94%) and in-house deionized water (Laboratory Reagent Water Type I, ASTM D1193-06(2011), 0.056 μS/cm) have been used in current study. This water was used for the stock solutions preparation, and passed preliminary analysis before use by a particle counter technique (Table 1) and by ICP (Table 2). These data reveal, that an in-house deionized water corresponds well to the international standards, and does not affect the natural level of foreign particles content, contributed by CaCl2 and Na2SO4.

2.2. Instruments

Element analysis of water samples was performed operating iCAP 6300 Duo (Thermo Scientific, Waltham, MA, USA) instrument. Analysis was performed for 6 elements. The results were compared with Sigma-Aldrich Catalogue water sample (Water for ion chromatography, Cat. #00612, lot BCCC3484).
The resultant gypsum crystals morphology was examined with scanning electron microscope (SEM), Hitachi TM3030, Tokyo, Japan. The sample examinations by SEM were performed using 15 kV accelerating voltage in a charge-up reduction mode; crystal phase was located on a carbon conducting tape, double-coated; the working distance 4.1 mm.
Particle counter SLS-1100 (Particle Measuring Systems Inc., Boulder, CO, USA) was used for quantitative characterization of suspended solid impurities concentration of the particles sized ≥100 nm. This instrument provides a particle concentration measurement within the size range from 100 nm to 1 mm. Due to a high concentration of particles in the nonfiltered solutions, the corresponding stock solution probe was diluted 100-fold by deionized water, then the measurement was performed, and the results are recalculated back to initial concentration. For the gypsum solutions, the direct experimental measurements were not performed, as the measurement time was comparable with the nucleation period. Thus, the nano/microparticle concentration at the moment, when calcium and sulfate brines get mixed, was taken as the mean value of corresponding stock solutions.
Liquid phase was monitored by the dynamic light scattering technique (DLS) for qualitative characterization of suspended solid impurities within the particles size (hydrodynamic diameter) range from 1 nm to 1000 nm. DLS experiments were performed at 25 °C with Malvern Nano ZS instrument (Malvern Panalytical Ltd, Malvern, UK) (λ = 633 nm, operating power 4 mW) at Θ = 173°.
Specific conductivity was measured at 25 °C with HI 8733 conductivity meter (Hanna Instruments, Salaj, Romania), in a glass beaker (100 mL), equipped with magnetic stirrer. The precise determination of the induction time was done by the determination of the inflection point of the specific conductivity-time curve.
Besides of a normal washing procedure with acid and base solutions all the glassware (flasks, pipettes, beakers, etc.) as well as DLS cuvette and conductivity measurement cells have been washed at least triply with deionized water with controlled low nano/micro particles content before use. In the latter case some blank experiments have been run to check the capability of conductivity cell walls to emit the residual nanoparticles, left from the previous measurement. In all cases, the conductivity measurements of filtrated solutions preceded those of nonfiltrated.

2.3. Gypsum Nucleation Measurements

All experiments were run in a certified laboratory room (ISO 14644-1, class 8) with a limited dust microparticle air phase content, controlled by an air particle counter Particle Measuring Systems Inc. with analytical channels 0.3; 0.5; 5.0 µm.
The nucleation mechanisms of gypsum were detected, based on induction time (tind) measurements in the batch experiments. The induction times were measured at two different supersaturations (SI) via specific conductivity ϰ [16,28], and are correlated with concentration of natural solid micro-impurities fraction with particle sizes >100 nm in the samples. To reach the goal, the two types of calcium and sulfate brines of equal concentration have been prepared: A and B, Table 3.
The type A corresponds to initial solution of either Na2SO4 or CaCl2. The type B represents the same A brines after the common procedure of filtration (200 nm; Hydrophilic PTFE Millipore Millex-LG membrane). The B type solutions filtration was performed at a special laboratory filtration unit, equipped with 24 mm diameter syringe attachments Millex-LG (Millipore) under the excessive pressure 1 bar, provided by extra pure gaseous argon. Each sample was prepared using a virgin membrane, which passed a special pretreatment before use. It was washed by three portions (60 mL) of deionized water. Then, the fourth one was analyzed by a particle counter. If the particle concentration in a 500 nm channel did not exceed 5 units in 1 mL, then the membrane was recognized to be ready for use. This procedure was done in order to eliminate the possibility for the membrane to emit its own solid impurities into aqueous phase.
Then, the stock solutions (50 mL each) have been mixed in 1:1 volume ratio to give 0.05 and 0.03 mol·L‒1 supersaturated gypsum solutions, and immediately analyzed in a parallel way for conductivity and for light scattering (DLS). The mixing was done in less than 30 s, and maximum reproducibility was thus achieved.
The value of gypsum solubility in water depends drastically on the background NaCl. Thus, the solubility values provided by [29,30] for 25 °C and 0.1 mol·L‒1 NaCl (gypsum solubility 0.022 mol·L‒1) and 0.05 mol·L‒1 NaCl (gypsum solubility 0.019 mol·L‒1) have been used in a present study. The selected initial gypsum concentrations (0.05 and 0.03 mol·L‒1) correspond therefore to supersaturation indexes SI 2.3 and 1.6 respectively, where SI is denoted as SI = (gypsum initial concentration, mol⋅L‒1)/(gypsum solubility, mol⋅L‒1). However, these can be easily recalculated for another saturation level and another definition of SI.
For a better control of the reaction conditions, all the parameters that may affect kinetics, were kept constant. Every reaction run was carried out in the same glass vessel. All equipment was washed triply by deionized water between experiments. The reaction mixtures were agitated with an adjustable speed magnetic stirrer; the agitation rate was set to 700 rpm, and the same magnetic stirrer bar was used in every case. The measuring electrodes were always placed at the same position to minimize the variations occurring in the hydrodynamics of the reactions. Each experiment was run in two replicates.

2.4. Chemical Speciations

Chemical speciation modeling was used for a better conductivity data interpretation. This was done for a homogeneous formation of aquatic complexes [CaSO4]o, using SPECIES software, v.2.2 [31,32] and a stability constant from IUPAC DATABASE [33] for 25 °C and ionic strength I = 0.10 mol·L‒1 for the equilibrium (1):
Ca2+ + SO42‒ ⇆ [CaSO4 ]osolution
which precedes the further step of crystal CaSO4·2H2O formation (2)
[CaSO4 ]osolution ⇆ CaSO4·2H2O
For a present work, we have found in [33] and used a value, reported by Craggs et al. [34] for equilibrium (1) logK(Ca + SO4) = 1.39.

3. Results

3.1. Stock Solutions Characterization

The stock 0.10 mol·L‒1 solutions of high purity chemicals Na2SO4 and CaCl2 in a deionized water reveal a high content of solid microimpurities larger than 100 nm in 1 mL: 370,000 and 480,000 respectively, Table 3. Thus, both salts emit a lot of solid particles into the stock solution. This is in a good agreement with our previous data on KCl (Sigma-Aldrich, 99%) dissolution in deionized water [26] (268,000 ± 2000 units in 1 mL with size >100 nm) and with the report of Fan and Pashley [25] for 0.02 mol·L‒1 gypsum solution (15,350 units in 1 mL with size >500 nm).
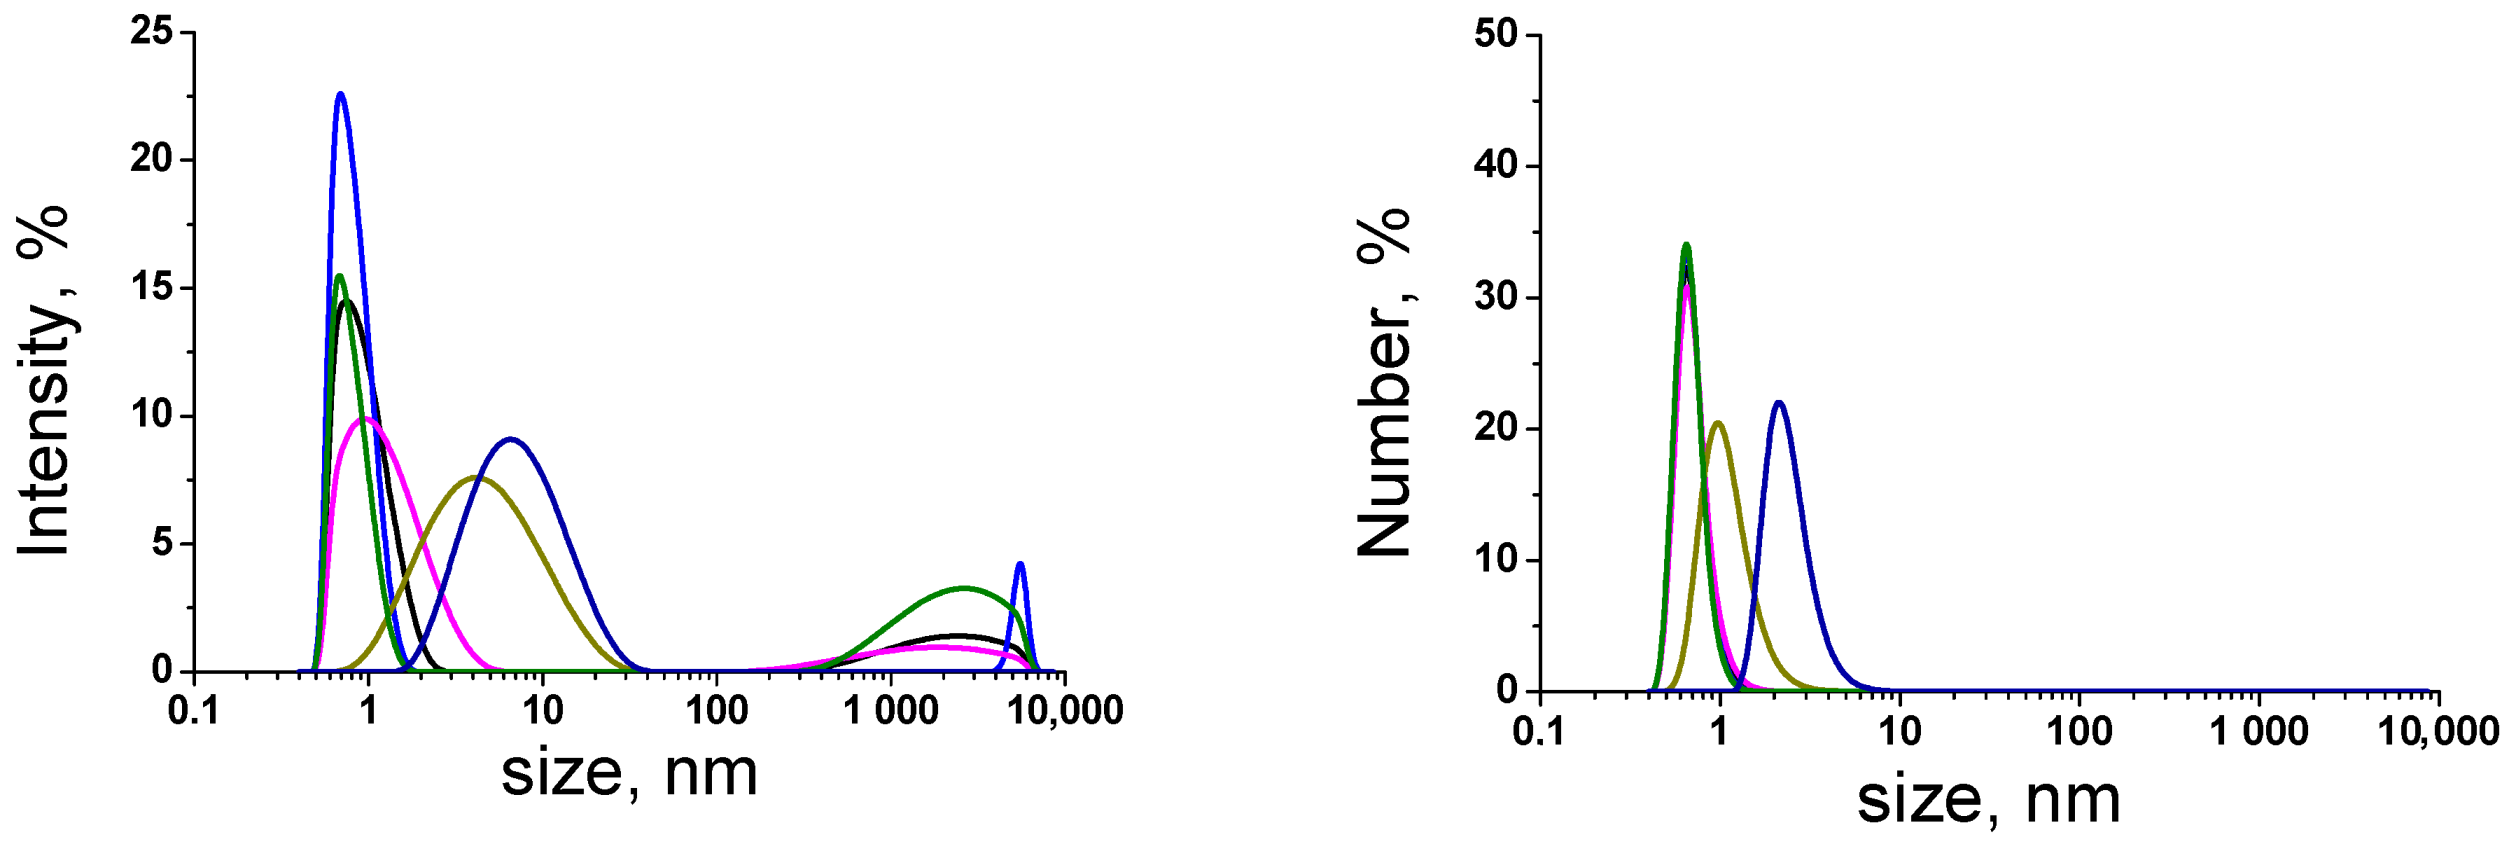
The filtration procedure (200 nm filter) provides a c.a. 100-fold reduction of the total amount of native suspended particles, larger than 100 nm. A similar result was also obtained in [25] for particles, sized >500 nm. Notably, quite logically the content of fractions >500 nm and >300 nm in our work is diminished more drastically. At the same time the 200 nm membrane is retarding also the particles, smaller than 200 nm. Meanwhile, from 1000 to 4000 of particle units, lager than 100 nm, still remain in aqueous phase. Thus, it is reasonable to suppose that the fraction sized below 100 nm is rather significant. Unfortunately, this fraction is not detectable by a particle counter used in this study. However, the DLS technique provides some semi-quantitative assessment of this “invisible” for a particle counter nano-fraction content, as shown in Figure 1 and Figure 2.
Two different particle size distribution modes have been used: by number, and by intensity. The former is more sensitive to the fine particles, while the latter one–to the larger ones. Here, each band corresponds to a certain replicate measurement. For the 0.1 mol·L‒1 Na2SO4 stock solution (Figure 1-left) an intensity distribution reveals presence of both nanoparticle fraction (size below 100 nm) and microparticle fraction (size above 100 nm). The latter one corresponds to those particles that are already detected by a particle counter (Table 3), while the former one indicates also presence of those particles, which are beyond the particle counter sensitivity.
A poor reproducibility of size distribution arises from the low particle concentration: each moment a spontaneously formed combination of solids within the laser beam is changing. This effect is negligible for high particle concentration, but it becomes critical for the low particle content. Thus, the bands are “wandering” within a certain sizes range. For example, the green, blue, pink, and red bands at Figure 1(left) represent the sequential measurements (scans), taken with 30 s delay one after another. These reveal a chaotic distribution of particle sizes, although the fractions with a mean size around 1 nm, 100 nm and 4000 nm are reproduced rather well. A similar situation can be observed in Figure 2 (left), although the bimodal distribution was dominating in this case. Anyhow, these data reflect correctly the presence of both nano- and microfractions of solid impurities both in sulfate and calcium brines.
At the same time, the distribution by number (Figure 1-right) demonstrates that the nanoparticle fraction dominates over microparticles. In this mode, only nanofraction remains visible, indicating at least 106-fold excess of nanoparticles number over that one of microparticles. Indeed, according to Rayleigh’s law, the light scattering intensity increases roughly in proportion to R6, where R corresponds to a particle radius [35,36], when R ≤ λ/15. Thus, even traces of larger particles would be visible in the background of dominating small ones in the intensity mode, while in distribution by number they would be lost in noise.
For the 0.1 mol·L‒1 CaCl2 stock solution (Figure 2) a similar relationship between particle size distribution by intensity and by number is observed. Thus, both B-type solutions contain approximately 109 nano/micro particles in 1 mL. In our opinion, this residual (after 200 nm filtration) content of solid nucleation templates excludes a spontaneous homogeneous mechanism of gypsum crystallization. At the same time, the difference in a total particle concentration between A and B solutions represents only a small change on the “tip of the iceberg”. Therefore, one shouldn’t expect too drastic changes in induction time as the microfraction concentration gets reduced from 105 to 103 units in 1 mL. However, such changes still appeared to be detectable, as shown in Table 4.

3.2. Gypsum Nucleation

After the stock solutions get mixed, the nucleation at SI = 2.3 starts immediately, Figure 3. The dominating light scattering band shifts fast from 1 nm size to 1000 nm size. Notably, the type B solution reveals c.a. 1 min lag relative to the type A (Figure 3). However, the solution A remains optically transparent within the first 6 to 8 min. Then the slight turbidity arrives, and after 20 min the solution becomes completely muddy. The B solution stays transparent during first 12–13 min, and a well-expressed turbidity arrives after 20 min of experiment. The full-fledged gypsum crystals, isolated 24 h later (Figure 4), correspond to the typical gypsum morphology, and reveal no differences in size and shape between A and B solutions. For SI = 1.6 the type A solution remains transparent much longer relative to SI = 2.3 case, and the first gypsum crystals arrive c.a. 150 min later. At the same time the type B solution at SI = 1.6 exhibits the first visible crystals only c.a. 18 h after the brines get mixed.
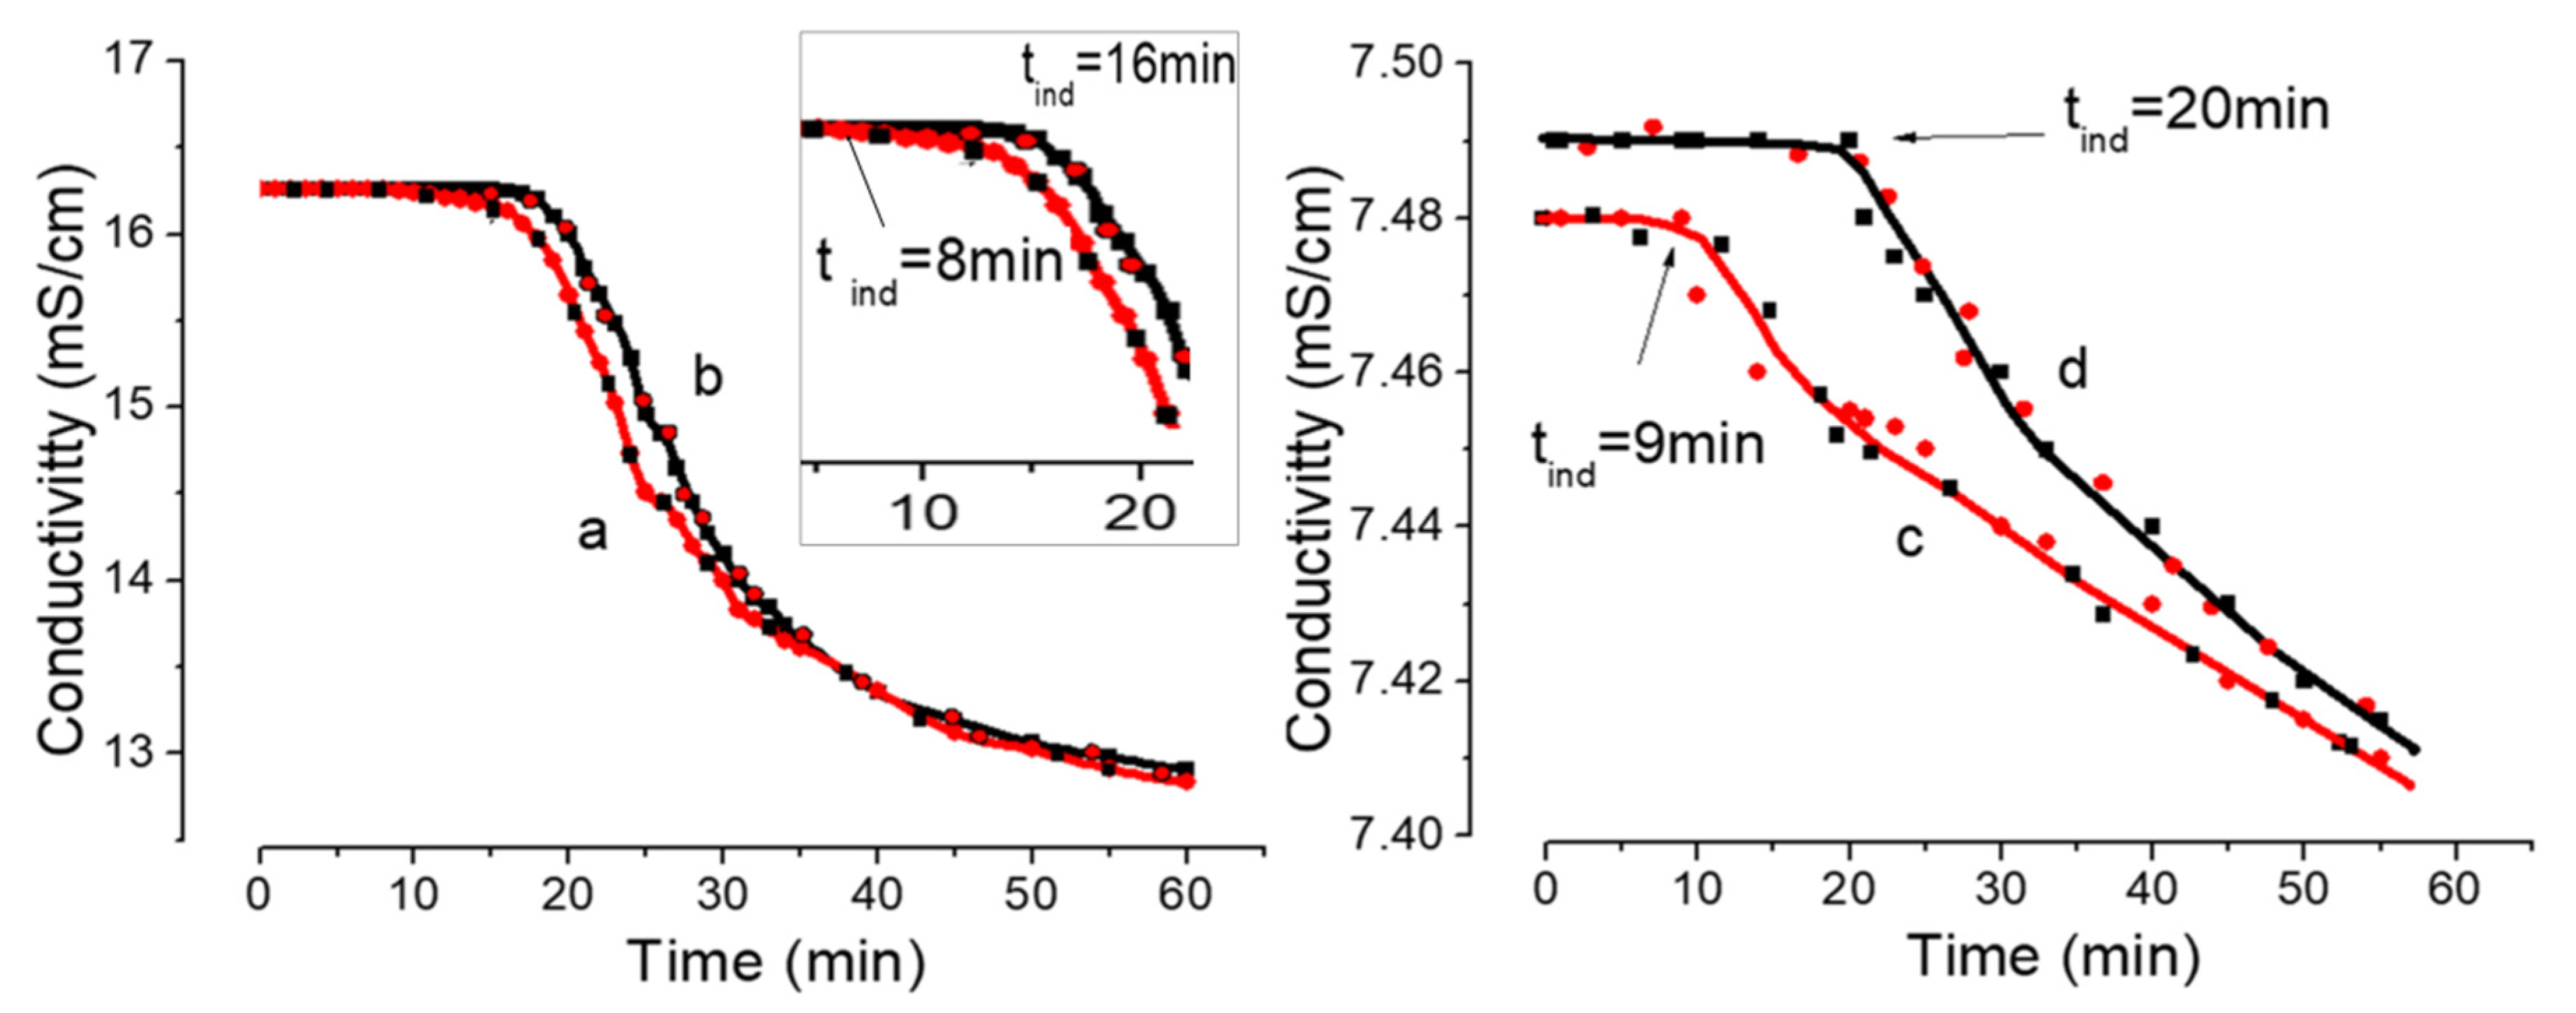
The conductivity measurements are very useful and common for the gypsum induction time (tind) estimations [27,37,38,39]. Thus, this method was chosen for gypsum nucleation monitoring in the bulk aqueous phases with different nano/microdust content, Figure 5. A dependence of conductivity on time after the sulfate and calcium brine get mixed, in all cases looks very typical: for a certain period it remains constant (plateau), then it starts to decrease due to the calcium and sulfate ions mutual binding and nonconductive species formation via equilibria (1) and (2). The moment of the curve deviation from the plateau is treated as induction time. Notably, for SI 2.3, the conductivity becomes constant after 75 min, and for SI 1.6 after 170 min. In both cases A and B solutions reach similar levels.
For an A type supersaturated gypsum initial concentration 0.05 mol·L‒1 it is found that tind = 8 min, Figure 5a, while for B type solution tind = 16 min, Figure 5a. The curve 5a corresponds well to the data reported by Sipos et al. [36]. Meanwhile, the curve 5b demonstrates evidently, that a decrease in nano/micro particles content for one and the same SI leads to a well detected increase of tind.
This effect becomes more pronounced for 0.03 mol·L‒1 gypsum concentration. The difference between A (tind = 9 min) and B (tind = 20 min) solutions is increasing up to 11 min, Figure 5c,d. These data show that an increase of background particle concentration in A solution relative to B case substantially decreases the induction period at a constant saturation state and temperature, and thus increases the nucleation rate. Therefore, it becomes obvious, that (i) concentration of nano/microdust particles has a key impact on the gypsum nucleation process along with supersaturation SI and temperature [16,18], and therefore, (ii) the nucleation mechanism is likely heterogeneous. Indeed, in presence of c.a. 109 readymade solid nano/micro templates in 1 mL (sized from 1 to 200 nm), the alternative pathway of gypsum nuclei formation via spontaneous homogeneous aggregation of [Ca2+], [SO42‒], and [CaSO4]o species becomes highly improbable [27]. Although, according to chemical speciations up to 40% of calcium exists in the form of uncharged species [CaSO4]o, Table 4. Such species are normally treated as building blocks of homogeneous aggregates [CaSO4]no, that are supposed to get transformed then into heterogeneous nuclei of gypsum [40]. On the other hand, the same [CaSO4]o species are quite capable to absorb fast on “nano/microdust” particle surface along with either [Ca2+] or [SO42‒] ions.

4. Discussion

The data presented in Table 4 reveal a clear qualitative relationship between tind and the number of background foreign solid particles. Although the true induction period is hardly possible to measure, as it depends on the technique employed to measure it [18,25,27], the knowledge of its relationships with process parameter, such as the number of background foreign solid particles (fraction with size >100 nm) at constant temperature and constant supersaturation, can give some important information about the crystallization process.
Our data are in a good agreement with the known facts of gypsum crystals formation enhancement by the artificially implemented nanoparticles [41], by solid impurities in saline waters [42] and in laboratory-prepared solutions [25,27]. Besides, they are the direct consequence of the bulk nucleation theory [24,43], that gives preference to the bulk heterogeneous nucleation in presence of solid impurities if any, over spontaneous homogeneous nucleation. Moreover, they are strongly supported by our previous data on the mechanisms of gypsum [44,45,46,47] and barite [48] scale inhibition. Indeed, on the grounds of fluorescent-tagged antiscalants, it was demonstrated that, despite expectations, the scale inhibitor does not interact with gypsum deposits, but isolates the solid impurities in aqueous phase from sulfate and calcium ions [44,45,46,47].
An uncontrolled nano/microdust content may provide some additional and reasonable explanation to the large diversity of gypsum surface tension data, ranging from 4 to 1000 mJ·m‒2, and reported by different research groups, see [17,49,50,51] and references there. Actually, none of these studies has provided control of solid impurities, while measuring induction times. Meanwhile, our data indicate that, along with the supersaturation (well controlled parameter), the content of nanoimpurities also changes (noncontrolled parameter) and impacts the nucleation kinetics in a similar way.
Generally, our data go far beyond the gypsum crystallization case. They have relevance to any inorganic salt crystallization. Our present research is intended to draw attention to the role of background solid matter, always present in any chemical compound used in Chemistry labs.
Indeed, those research groups that claim a homogeneous nucleation mechanism, are expected to specify at least: (i) the class of certified clean rooms according to ISO 14644-1 Standard [52], that have been used in their study; (ii) the reagents purity and the procedure of nano/microdust removal; and (iii) the instrumental means of nanoparticles concentration control in the stock solutions. Actually, we have failed to find so far a report on a homogeneous nucleation mechanism, that specifies all the listed above issues. Meanwhile, it is reasonable to note, that the particles-free chemicals do not exist in Nature. Even for the inorganic acids, specially prepared for semiconductors, the manufacturers do not specify the concentration of nanoimpurities, sized below 100 nm. However, our recent data reveal, that the concentration of microparticles (size > 100 nm) in such extra-pure chemicals is still high and may constitute c.a. 5·103 units in 1 mL [26]. On the other hand, the appropriate tools for an accurate quantitative measurement of the fine fraction (1 nm < size < 30 nm) content in an aqueous phase are also missing [53,54,55]. As far as we know, the lowest limit of nanoimpurities tracking is now 25 nm (NanoCount 25+). Thus, the most numerous fraction with 1 nm < size < 25 nm (Figure 2 and Figure 3) is quantitatively undetectable. Moreover, any research group that aims to diminish the level of nano/micro impurities in the stock brines, has to work not with a single particle counter, but with a set of such instruments. At least one instrument has to control the range of 100 to 500 nm, while the second one would be needed to measure the fraction ranging from 25 to 200 nm. Thus, at present moment the mission of nano/microdust complete removal and/or control is hardly feasible.
At first glance, our data conflict the gypsum formation mechanisms proposed by Stawski, Van Driessche and co-authors [3,19,20,21]. However, this is not the case. Our results are quite compatible. According to Stawski and co-workers the gypsum deposition reaction starts through the fast homogeneous formation of well-defined, primary species of 3 nm in length (stage I). We agree with such a step, but with a single refinement: the gypsum deposition reaction starts through the fast heterogeneous formation of well-defined, primary species via [Ca2+], [SO42‒] and [CaSO4]o species sorption on the surface of “nano/microdust” particles. As can be seen from Figure 1 and Figure 2 the dominant fraction of such a dust corresponds to 1 or 2 nm size. Thus, the fast formation of gypsum core on these solid templates may truly result in primary species of 3 nm in length. Then, everything goes according to the stages, proposed by Stawski and co-authors.

5. Conclusions

By means of a particle counter and DLS technique, solid nano/microimpurities were found, and controlled in stock brines for gypsum supersaturated solutions preparation. It is demonstrated that the common procedure of reagent grade CaCl2 and Na2SO4 aqueous solutions filtration via 200 nm membranes is capable to reduce the microimpurities (size > 100 nm) content from 106 to 103 units in 1 mL, but fails to affect the more numerous nanofraction (size < 100 nm). Thus, the gypsum nucleation takes place in the presence of a significant number of nano/microcodust templates, and has therefore tentatively a heterogeneous character. This fact is undeservedly not taken into consideration, when gypsum crystallization is usually described.
The induction time, measured by conductivity for the similar supersaturation levels, reveals a well detectable dependence on nano/microdust concentration: an increasing background particle concentration substantially decreases the induction period at a constant saturation state and temperature, and thus increases the nucleation rate. Therefore, the gypsum nucleation reaction starts tentatively through the fast heterogeneous formation of well-defined, primary nuclei via [Ca2+], [SO42‒] and [CaSO4]o species sorption on the surface of “nano/microdust” particles both in filtered and non-filtered supersaturated gypsum aqueous solutions.

Author Contributions

Conceptualization, M.O. and K.P.; methodology, A.R. and J.D.; software, A.R.; validation, I.P.; formal analysis, I.P.; investigation, A.K. (conductivity, DLS), I.P. (speciations), J.D. (SEM, ICP), and A.R. (filtration, particle counter analysis); data curation, A.K. and I.P.; writing—original draft preparation, A.K. and K.P.; writing—review and editing, M.O. and K.P.; visualization, A.R.; supervision, K.P. and M.O.; project administration, M.O.; funding acquisition, M.O. All authors have read and agreed to the published version of the manuscript.

Funding

This research was funded by the Russian Science Foundation, grant number 19-79-10220.

Conflicts of Interest

The authors declare no conflict of interest.

References

  1. Radcliffe, T. Notes from the chemical laboratory of the University of North Carolina—Analysis of rock-salt from saltville, Washington co., va. J. Am. Chem. Soc. 1882, 4, 255–256. [Google Scholar] [CrossRef] [Green Version]
  2. Van’T Hoff, J.H. Über Gips. Z. für Elektrochem. 1902, 8, 575–579. [Google Scholar] [CrossRef]
  3. Van Driessche, A.E.S.; Stawski, T.M.; Kellermeier, M. Calcium sulfate precipitation pathways in natural and engineered environments. Chem. Geol. 2019, 530, 119274. [Google Scholar] [CrossRef]
  4. Rabizadeh, T.; Peacock, C.L.; Benning, L.G. Investigating the Effectiveness of Phosphonate Additives in Hindering the Calcium Sulfate Dihydrate Scale Formation. Ind. Eng. Chem. Res. 2020, 59, 14970–14980. [Google Scholar] [CrossRef]
  5. Schm, T.; Jungnickel, R.; Dariz, P. Insights into the CaSO4-H2O system: A Raman-spectroscopic study. Minerals 2020, 10, 115. [Google Scholar] [CrossRef] [Green Version]
  6. Choi, J.Y.; Lee, T.; Cheng, Y.; Cohen, Y. Observed crystallization induction time in seeded gypsum crystallization. Ind. Eng. Chem. Res. 2019, 58, 23359–23365. [Google Scholar] [CrossRef]
  7. Matin, A.; Rahman, F.; Shafi, H.Z.; Zubair, S.M. Scaling of reverse osmosis membranes used in water desalination: Phenomena, impact, and control; future directions. Desalination 2019, 455, 135–157. [Google Scholar] [CrossRef]
  8. Mady, M.F.; Kelland, M.A. Review of nanotechnology impacts on oilfield scale management. ACS Appl. Nano Mater. 2020, 3, 7343–7364. [Google Scholar] [CrossRef]
  9. Smith, B.R.; Sweett, F. The crystallization of calcium sulfate dihydrate. J. Colloid Interface Sci. 1971, 37, 612–618. [Google Scholar] [CrossRef]
  10. Liu, S.T.; Nancollas, G.H. The kinetics of crystal growth of calcium sulfate dihydrate. J. Cryst. Growth 1970, 6, 281–289. [Google Scholar] [CrossRef]
  11. Liu, S.T.; Nancollas, G.H. Linear crystallization and induction period studies of the growth of calcium sulfate dihydrate crystals. Talanta 1973, 20, 211–216. [Google Scholar] [CrossRef]
  12. Liu, S.T.; Nancollas, G.H. A kinetics and morphological study of the seeded growth of calcium sulfate dihydrate in the presence of additives. J. Colloid Interface Sci. 1975, 52, 593–601. [Google Scholar] [CrossRef]
  13. Packter, A. The precipitation of calcium sulphate dihydrate from aqueous solution: Induction periods, crystal numbers and final size. J. Cryst. Growth 1974, 21, 191–194. [Google Scholar] [CrossRef]
  14. He, S.; Oddo, J.E.; Tomson, M.B. The nucleation kinetics of calcium sulfate dihydrate in NaCl solutions up to 6 m and 90 C. J. Colloid Interface Sci. 1994, 162, 297–303. [Google Scholar] [CrossRef]
  15. Lancia, A.; Musmarra, D.; Prisciandaro, M. Measuring induction period for calcium sulfate dehydrate precipitation. AICHE J. 1999, 45, 390–397. [Google Scholar] [CrossRef]
  16. Klepetsanis, P.G.; Dalas, E.; Koutsoukos, P.G. Role of temperature in the spontaneous precipitation of calcium sulfate dehydrate. Langmuir 1999, 15, 1534–1540. [Google Scholar] [CrossRef]
  17. Hina, A.; Nancollas, G.H. Precipitation and dissolution of alkaline earth sulfates: Kinetics and surface energy. Rev. Mineral. Geochem. 2000, 40, 277–301. [Google Scholar] [CrossRef]
  18. Prisciandaro, M.; Lancia, A.; Musmarra, D. Gypsum nucleation into sodium chloride solutions. AICHE J. 2001, 47, 929–934. [Google Scholar] [CrossRef]
  19. Van Driessche, A.E.S.; Garcia-Ruiz, J.M.; Delgado-Lopez, J.M.; Sazaki, G. In situ observation of step dynamics on gypsum crystals. Cryst. Growth Des. 2010, 10, 3909–3916. [Google Scholar] [CrossRef]
  20. Stawski, T.M.; Van Driessche, A.E.; Ossorio, M.; Rodriguez-Blanco, J.D.; Besselink, R.; Benning, L.G. Formation of calcium sulfate through the aggregation of sub-3 nanometre primary species. Nat. Commun. 2016, 7, 1–9. [Google Scholar] [CrossRef] [Green Version]
  21. Stawski, T.M.; Van Driessche, A.E.S.; Besselink, R.; Byrne, E.H.; Raiteri, P.; Gale, J.D.; Benning, L.G. The structure of CaSO4 nanorods: The precursor of gypsum. J. Phys. Chem. C 2019, 123, 23151–23158. [Google Scholar] [CrossRef] [Green Version]
  22. Gebauer, D.; Kellermeier, M.; Gale, J.D.; Bergström, L.; Cölfen, H. Pre-nucleation clusters as solute precursors in crystallization. Chem. Soc. Rev. 2014, 43, 2348–2371. [Google Scholar] [CrossRef] [PubMed] [Green Version]
  23. Gebauer, D.; Coelfen, H. Prenucleation clusters and non-classical nucleation. Nano Today 2011, 6, 564–584. [Google Scholar] [CrossRef] [Green Version]
  24. Sosso, G.C.; Chen, J.; Cox, S.J.; Fitzner, M.; Pedevilla, P.; Zen, A.; Michaelides, A. Crystal nucleation in liquids: Open questions and future challenges in molecular dynamics simulations. Chem. Rev. 2016, 116, 7078–7116. [Google Scholar] [CrossRef] [Green Version]
  25. Fan, C.; Pashley, R.M. The controlled growth of calcium sulfate dihydrate (gypsum) in aqueous solution using the inhibition effect of a bubble column evaporator. Chem. Eng. Sci. 2016, 142, 23–31. [Google Scholar] [CrossRef]
  26. Popov, K.; Oshchepkov, M.; Kovalenko, A.; Redchuk, A.; Dikareva, J.; Pochitalkina, I. The Scale nucleation natural precursors: A case study of “micro/nanodust” impurities nature in laboratory aqueous samples, obtained from Moscow tap water. Int. J. Corros. Scale Inhib. 2020, 9, 1097–1112. [Google Scholar] [CrossRef]
  27. Mullin, J.W. Crystallization; Butterworth-Heinemann: Woburn, MA, USA, 2001. [Google Scholar]
  28. Rahman, F. Calcium sulfate precipitation studies with scale inhibitors for reverse osmosis desalination. Desalination 2013, 319, 79–84. [Google Scholar] [CrossRef]
  29. Marshall, W.L.; Slusher, R. Thermodynamics of Calcium Sulfate Dihydrate in Aqueous Sodium Chloride Solutions, 0-1 10°112. J. Phys. Chem. 1966, 70, 4015–4027. [Google Scholar] [CrossRef]
  30. Raju, K.; Atkinson, G.J. The thermodynamics of «scale» mineral solubilities. 3. Calcium sulfate in aqueous sodium chloride. Chem. Eng. Data 1990, 35, 361–367. [Google Scholar] [CrossRef]
  31. Powell, K.J.; Pettit, L.D.; Town, R.M.; Popov, K.I. SolEq: Tools and tutorials for studying solution equilibria. Univ. Chem. Educ. 2000, 4, 7–11. [Google Scholar]
  32. SPECIES in Solution Equilibria: Principles and Applications [Windows 95, 98]; Powell, K.J. (Ed.) Release 1.04; Academic Software: Timble, UK, 2000. [Google Scholar]
  33. Stability Constants Database and Mini-SCDatabase; IUPAC and Academic Software, Version 5.3; Sourby Old Farm: Timble, UK; Otley, UK; Yorks, UK, 2011.
  34. Craggs, A.; Moody, G.J.; Thomas, J.D.R. Calcium ion-selective electrode-measurements in the presence of complexing ligands. Analyst 1979, 104, 961–972. [Google Scholar] [CrossRef]
  35. International standard ISO 13321. Methods for Determination of Particle Size Distribution; Part 8: Photon correlation spectroscopy; International Organization for Standartisation (ISO): Geneva, Switzerland, 1996. [Google Scholar]
  36. Dahneke, B.E. (Ed.) Measurement of Suspended Particles by Quasi-Elastic Light Scattering; John Wiley Sons: Hoboken, NJ, USA, 1983. [Google Scholar]
  37. Abdel-Aal, E.A.; Abdel-Ghafar, H.M.; El-Sayed, D.; El-Shazly, A.N.; Hoinkis, J. Crystallization study of reverse osmosis desalination scales at low salinity with and without inhibitor. Part. Sci. Technol. 2017, 35, 749–754. [Google Scholar] [CrossRef]
  38. Ziegenheim, S.; Peintler, G.; Palinko, I.; Sipos, P. The kinetics of the precipitation of gypsum, CaSO4·2H2O, over a wide range of reactant concentrations. React. Kinet. Mech. Catal. 2020, 131, 75–88. [Google Scholar] [CrossRef]
  39. Azaza, H.; Doggaz, A.; Mechi, L.; Optasanu, V.; Tlili, M.; Ben Amor, M. Synthesis of intermediate crystal Ba1-xCaxSO4 system via co-precipitation of BaSO4-CaSO4 and partial hindrance of gypsum formation. Desalin. Water Treat. 2017, 66, 80–87. [Google Scholar] [CrossRef]
  40. Kashchiev, D.; van Rosmalen, G.M. Review: Nucleation in solutions revisited. Cryst. Res. Technol. 2003, 38, 555–574. [Google Scholar] [CrossRef]
  41. Wang, L.T.; Ge, H.H.; Han, Y.T.; Wan, C.; Sha, J.Y.; Sheng, K. Effects of Al2O3 nanoparticles on the formation of inorganic scale on heat exchange surface with and without scale inhibitor. Appl. Therm. Eng. 2019, 151, 1–10. [Google Scholar] [CrossRef]
  42. Gromov, S.L. Deposit formation in spiral-wound reverse osmosis and nanofiltration elements and ways of preventing it. Therm. Eng. 2014, 61, 433–441. [Google Scholar] [CrossRef]
  43. Nielsen, A.E.; Toft, J.M. Electrolyte crystal growth kinetics. J. Cryst. Growth 1984, 67, 278–288. [Google Scholar] [CrossRef]
  44. Oshchepkov, M.; Golovesov, V.; Ryabova, A.; Tkachenko, S.; Redchuk, A.; Rönkkömäki, H.; Rudakova, G.; Pervov, A.; Popov, K. Visualization of a novel fluorescent-tagged bisphosphonate in reverse osmosis facility during gypsum brine desalination. Sep. Sci. Technol. 2021, 225, 117382. [Google Scholar] [CrossRef]
  45. Oshchepkov, M.; Golovesov, V.; Ryabova, A.; Redchuk, A.; Tkachenko, S.; Pervov, A.; Popov, K. Gypsum crystallization during reverse osmosis desalination of water with high sulfate content in presence of a novel fluorescent-tagged polyacrylate. Crystals 2020, 10, 309. [Google Scholar] [CrossRef] [Green Version]
  46. Oshchepkov, M.; Kamagurov, S.; Tkachenko, S.; Popov, K.; Ryabova, A. An insight into the mechanisms of the scale inhibition. A case study of a novel task-specific fluorescent-tagged scale inhibitor location on gypsum crystals. ChemNanoMat 2019, 5, 586–592. [Google Scholar] [CrossRef]
  47. Oshchepkov, M.; Golovesov, V.; Ryabova, A.; Frolova, S.; Tkachenko, S.; Kamagurov, S.; Rudakova, G.; Popov, K. Synthesis and visualization of a novel fluorescent-tagged polymeric antiscalant during gypsum crystallization in combination with bisphosphonate fluorophore. Crystals 2020, 10, 992. [Google Scholar] [CrossRef]
  48. Oshchepkov, M.; Popov, K.; Ryabova, A.; Redchuk, A.; Tkachenko, S.; Dikareva, J.; Koltinova, E. Barite crystallization in presence of novel fluorescent-tagged antiscalants. Int. J. Corros. Scale Inhib. 2019, 8, 998–1021. [Google Scholar] [CrossRef]
  49. Wu, W.; Nancollas, G.H. Determination of interfacial tension from crystallization and dissolution data: A comparison with other methods. Adv. Colloid Interface Sci. 1999, 79, 229–279. [Google Scholar] [CrossRef]
  50. Ben Ahmed, S.; Tlili, M.M.; Ben Amor, M. Influence of a polyacrylate antiscalant on gypsum nucleation and growth. Cryst. Res. Technol. 2008, 43, 935–942. [Google Scholar] [CrossRef]
  51. Abdel-Aal, E.A.; Abdel-Ghafar, H.M.; El Anadouli, B.E. New findings about nucleation and crystal growth of reverse osmosis desalination scales with and without inhibitor. Cryst. Growth Des. 2015, 15, 5133–5137. [Google Scholar] [CrossRef]
  52. ISO 14644-1. Part 1: Classification of air cleanliness by particle concentration. In Cleanrooms and Associated Controlled Environments, 2nd ed.; ISO: Geneva, Switzerland, 2015. [Google Scholar]
  53. Knotter, D.M.; Wolters, S.A.M.; Kasanrokijat, M.A. Particle concentration measurements in process liquids using light-scattering techniques. Part. Sci. Technol. 2007, 25, 435–447. [Google Scholar] [CrossRef]
  54. Peuchot, C.; Lynch, G.J.; Petillon, N. Filter testing: Automatic particle counters and fluid contamination monitors. Filtr. Sep. 2011, 48, 29–33. [Google Scholar] [CrossRef]
  55. Knotter, D.M.; Wali, F. Particles in semiconductor processing. Dev. Surf. Contam. Clean 2010, 2, 81–120. [Google Scholar] [CrossRef]
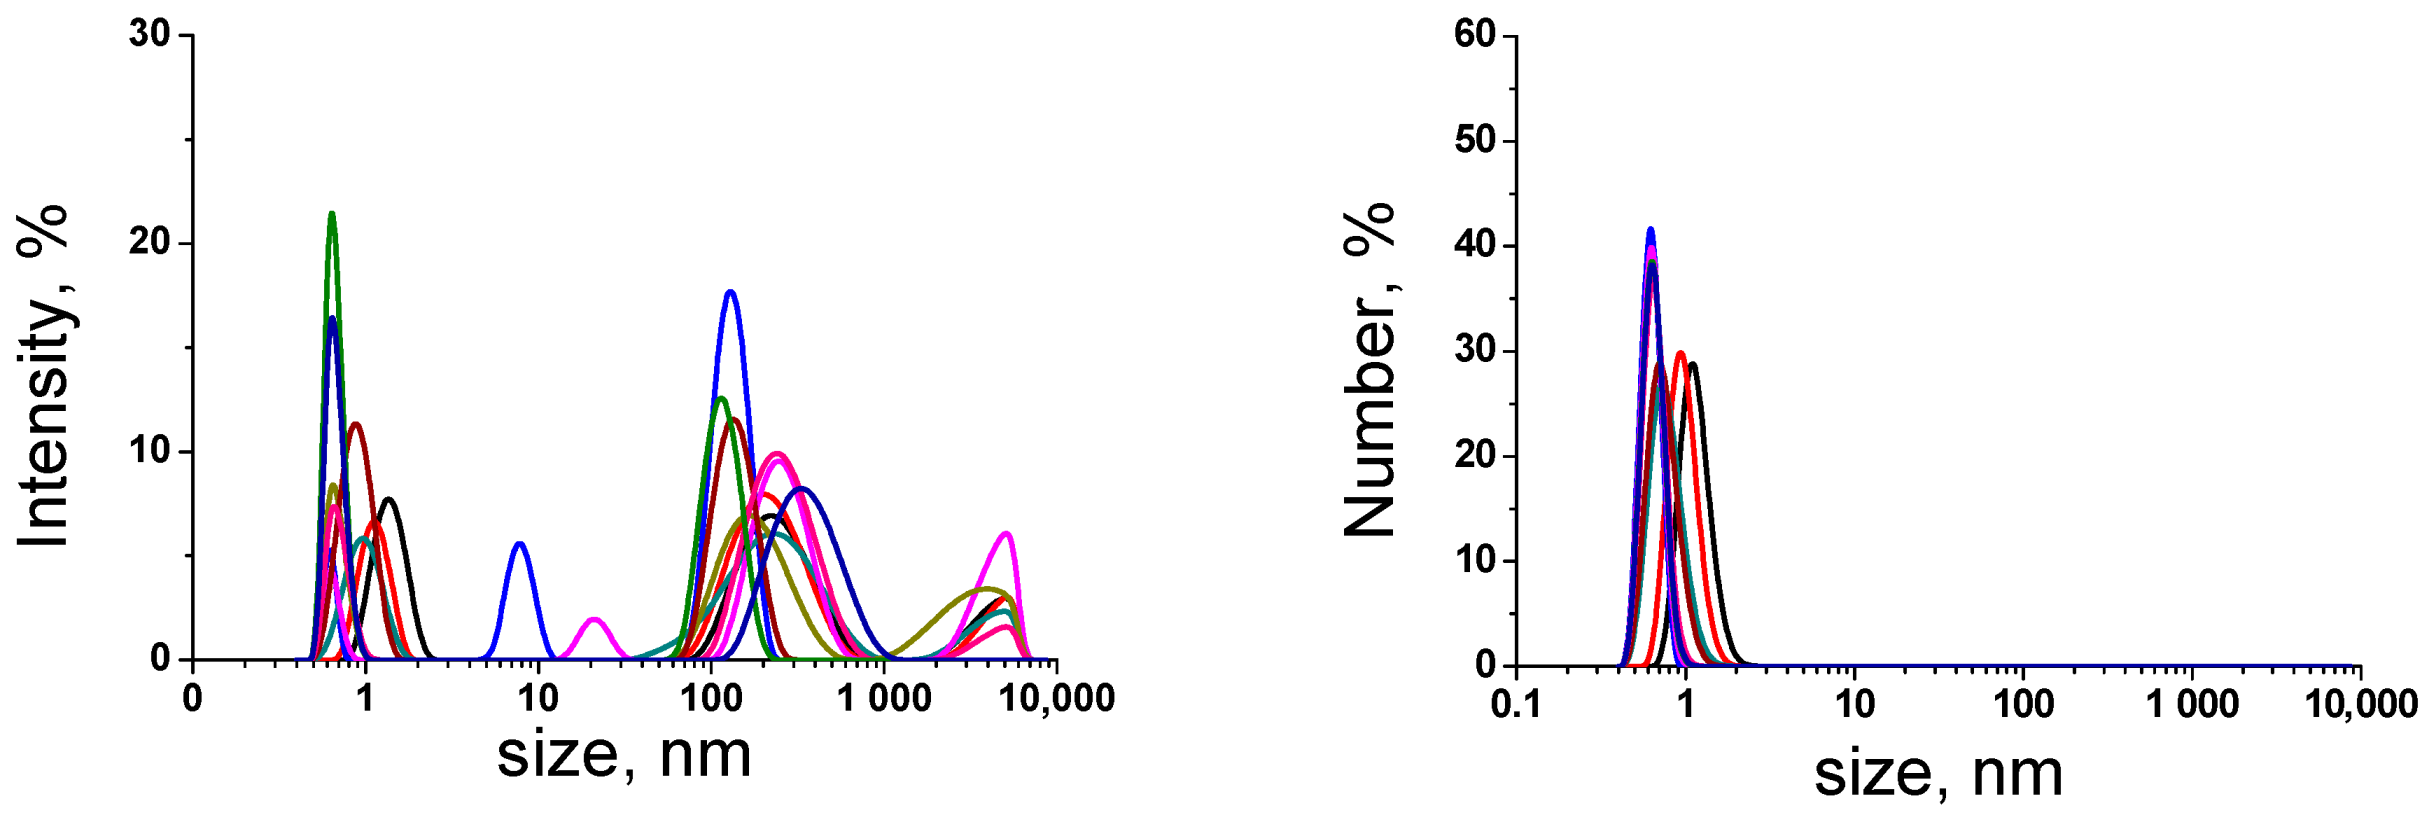
Figure 1. Some consecutive measurements of a particle size distribution by intensity (left) and by number (right) in 0.10 mol·L‒1 Na2SO4 stock solution (Sample type B), detected by DLS; the green (first scan), blue, pink, red, brown, swamp green, dark blue, dark brown (last scan) bands correspond to the sequential measurements (scans), taken with 30 s delay one after another.
Minerals 10 01083 g001
Figure 2. Some consecutive measurements of a particle size distribution by a light scattering intensity (left) and by number (right) in 0.10 mol·L‒1 CaCl2 stock solution (Sample type B), detected by DLS; the swamp green (first scan), blue, pink, brown, dark blue, dark brown (last scan) bands correspond to the sequential measurements (scans), taken with 30 s delay one after another.
Minerals 10 01083 g002
Figure 3. Gypsum mean particle size change within the induction time for A (left) and B (right) supersaturated solutions (0.05 mol·L‒1): 3 min (a); 4 min (b); 6 min (c); 10 min (d) and 15 min (e) after the stock brines get mixed.
Minerals 10 01083 g003
Figure 4. SEM images of gypsum crystals isolated from (a) (nonfiltered) and (b) (filtered) gypsum solutions 24 h after sulfate and calcium brines get mixed. Scale marker corresponds to 100 µm.
Minerals 10 01083 g004
Figure 5. Dependence of conductivity on time for 0.05 (left) and 0.03 (right) mol·L‒1 gypsum supersaturated aqueous solutions at 25 °C, prepared from nonfiltered (a,c) and filtered (b,d) stock brines (squares and circles correspond to different replicate measurements).
Minerals 10 01083 g005
Table 1. In-house deionized water characterization by a particle counter.
SampleConductivity 25 °C; μS/cmpHCumulative Number of Foreign Particles in 1 mLRef.
≥100 nm≥200 nm≥300 nm≥500 nm
In-house deionized water0.0566.3320 ± 1060 ± 1023 ± 89 ± 3Present work
Water for ion chromatography, Cat. #00612; Sigma-Aldrich1.85.63040 ± 20630 ± 10170 ± 20130 ± 10[26]
In-house distilled water<2.05.7Particles are not detected due to the limitations of a particle counter used in this work14,000[25]
Table 2. In-house deionized water characterization by ICP.
ElementElement Content, ppm
In-House Deionized Water; Present StudyWater for Ion Chromatography, Cat.#00612; Sigma-Aldrich [26]
Al0.0011 ± 0.00010.0010 ± 0.0001
Fe0.0012 ± 0.00010.0011 ± 0.0001
CaNot found0.0005 ± 0.0001
NaNot found0.0005 ± 0.0001
KNot found0.0026 ± 0.0002
Zn0.0006 ± 0.00010.0005 ± 0.0001
Table 3. The stock solutions characterization by a particle counter.
Sample *Concentration,
mol·L‒1
Sample
Type
pHCumulative Number of Foreign Particles in 1 mL
≥ 100 nm≥ 200 nm≥ 300 nm≥ 500 nm
Na2SO4 solution0.10A6.7(370 ± 60)·103(92 ± 20)·103(30 ± 6)·103(13 ± 2)·103
B6.6(40 ± 8) ·10254 ± 1013 ± 34 ± 2
0.06A6.6(300 ± 60)·103(80 ± 20)·103(20 ± 5)·103(8 ± 1)·103
B6.6(30 ± 6)·10235 ± 810 ± 34 ± 2
CaCl2 solution0.10A9.8(480 ± 70)·103(180 ± 40)·103(81 ± 20)·103(40 ± 8)·103
B9.8(90 ± 3)·10223 ± 49 ± 34 ± 2
0.06A9.7(330 ± 60)·103(50 ± 10)·103(20 ± 5)·103(9 ± 2)·103
B9.7(15 ± 3)·10250 ± 1020 ± 410 ± 3
* Prepared using deionized water, see Table 1.
Table 4. The gypsum solutions characterization.
Gypsum Initial Conc., mol·L‒1% of [CaSO4]o
Complexes *
Gypsum Solution TypeCumulative Number of Foreign Particles (≥100 nm) in 1 mLInduction Time, min.
0.0642A(430 ± 70)·1038 ± 1
B(30 ± 7)·10216 ± 1
0.0333A(300 ± 60)·1039 ± 1
B(20 ± 6)·10220 ± 1
* Calculated by speciation software.
Publisher’s Note: MDPI stays neutral with regard to jurisdictional claims in published maps and institutional affiliations.