Submarine Hydrothermal Discharge and Fluxes of Dissolved Fe and Mn, and He Isotopes at Brothers Volcano Based on Radium Isotopes

 , , , , ,
  and
and
Abstract
1. Introduction
2. Materials
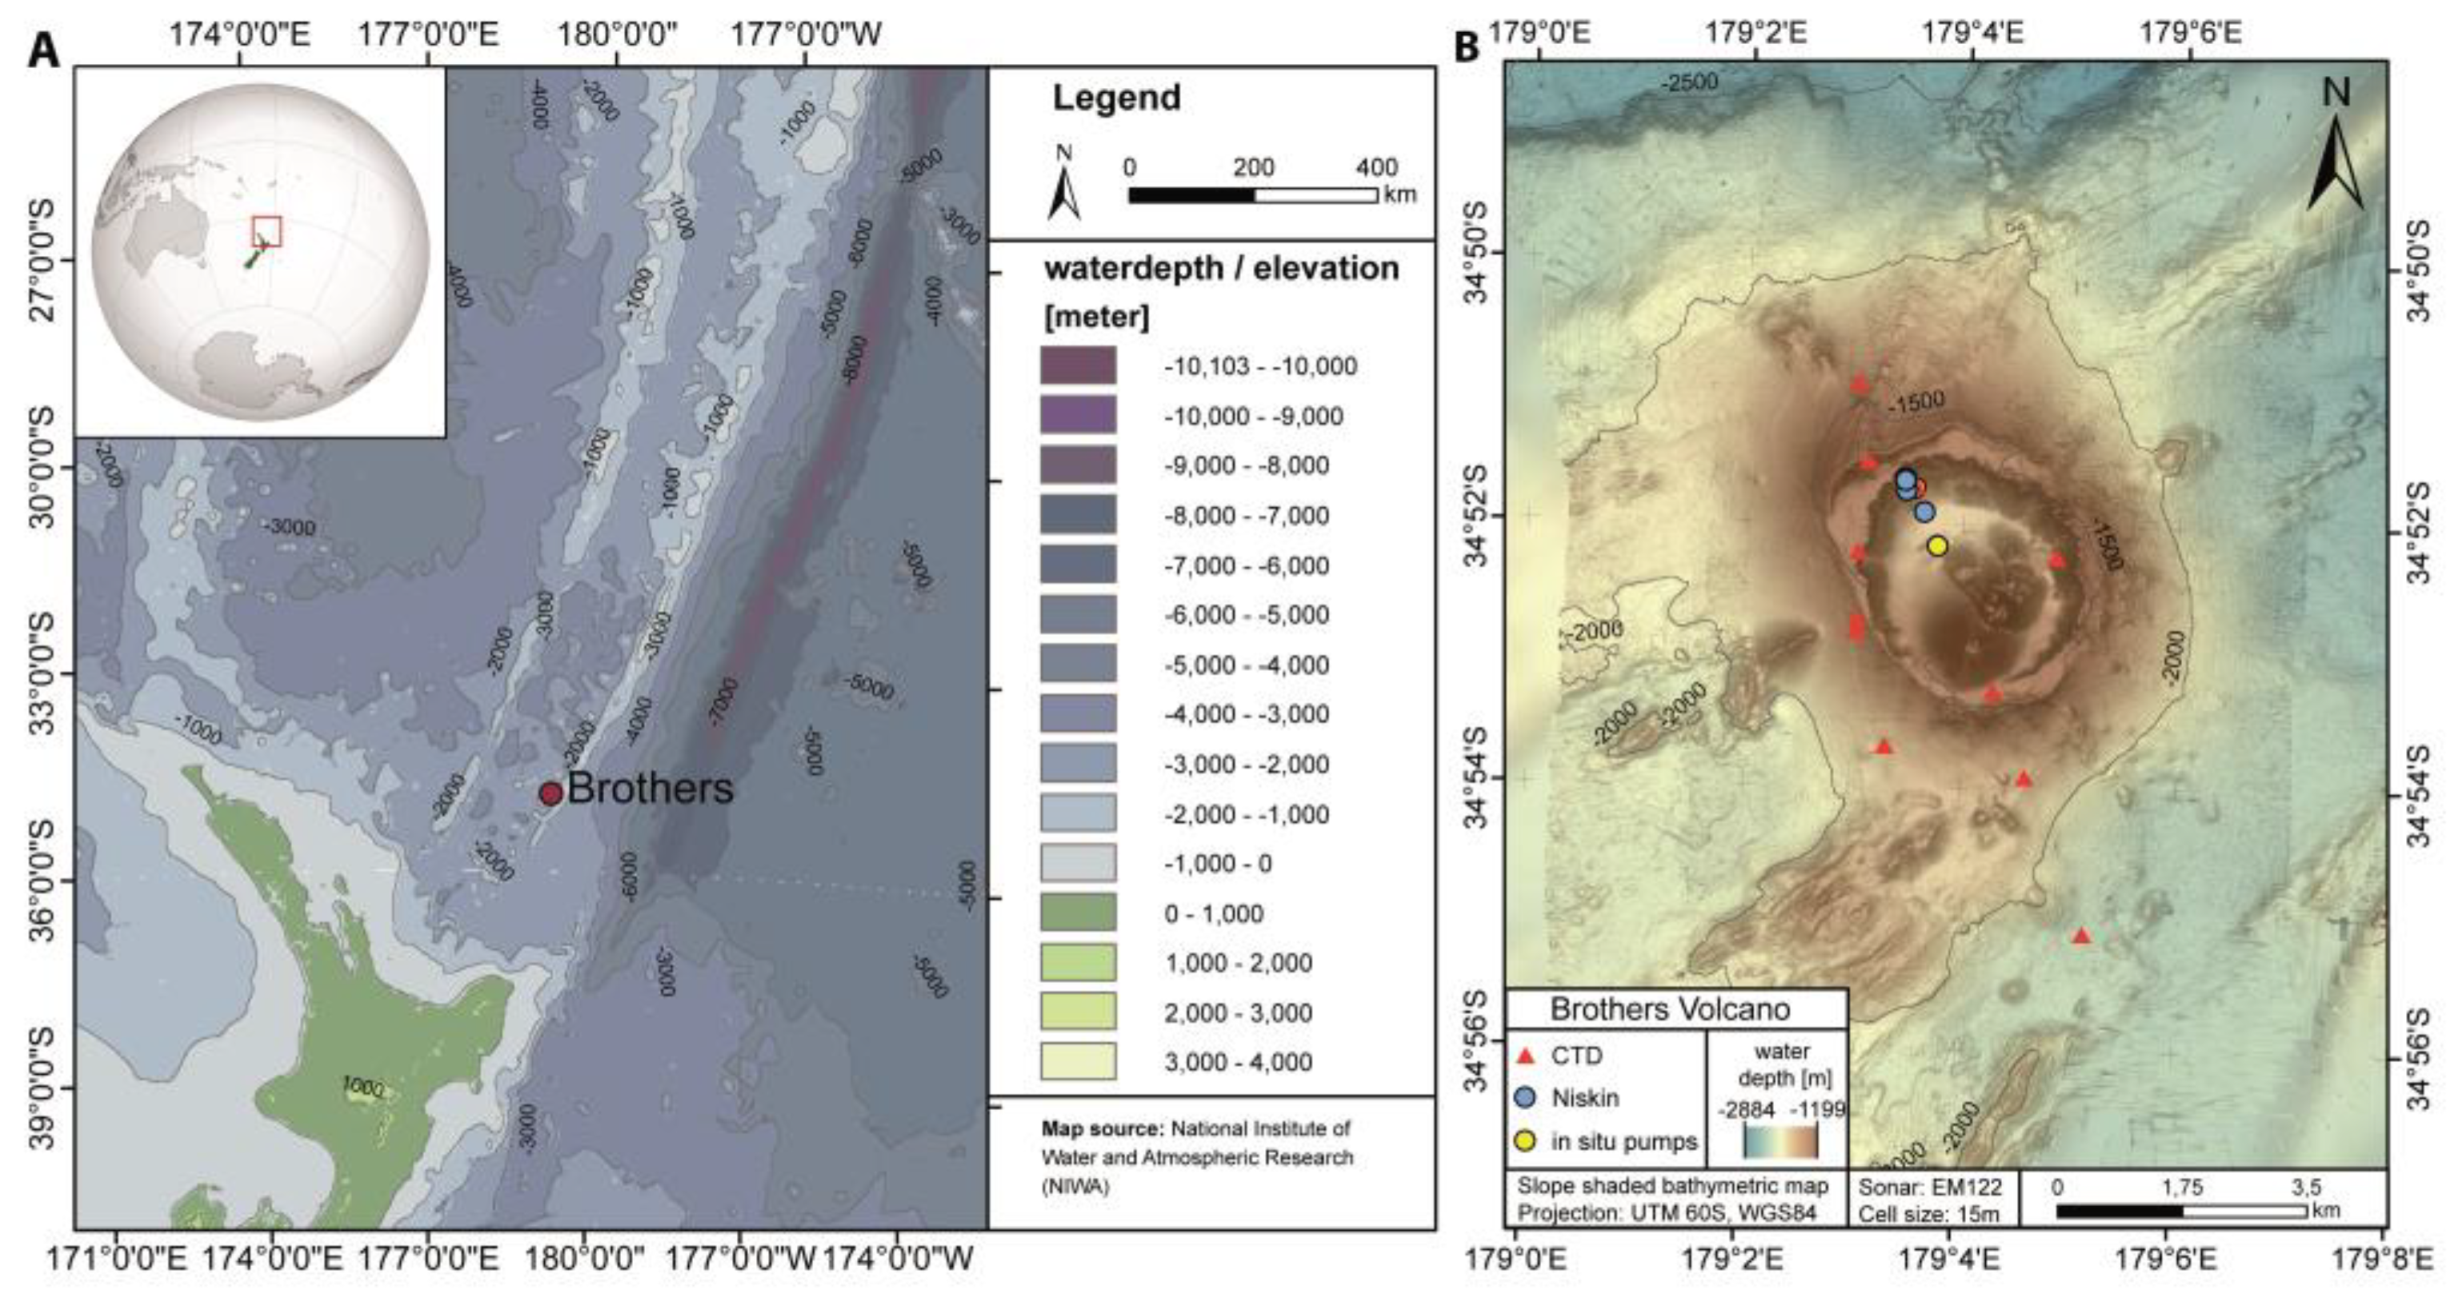
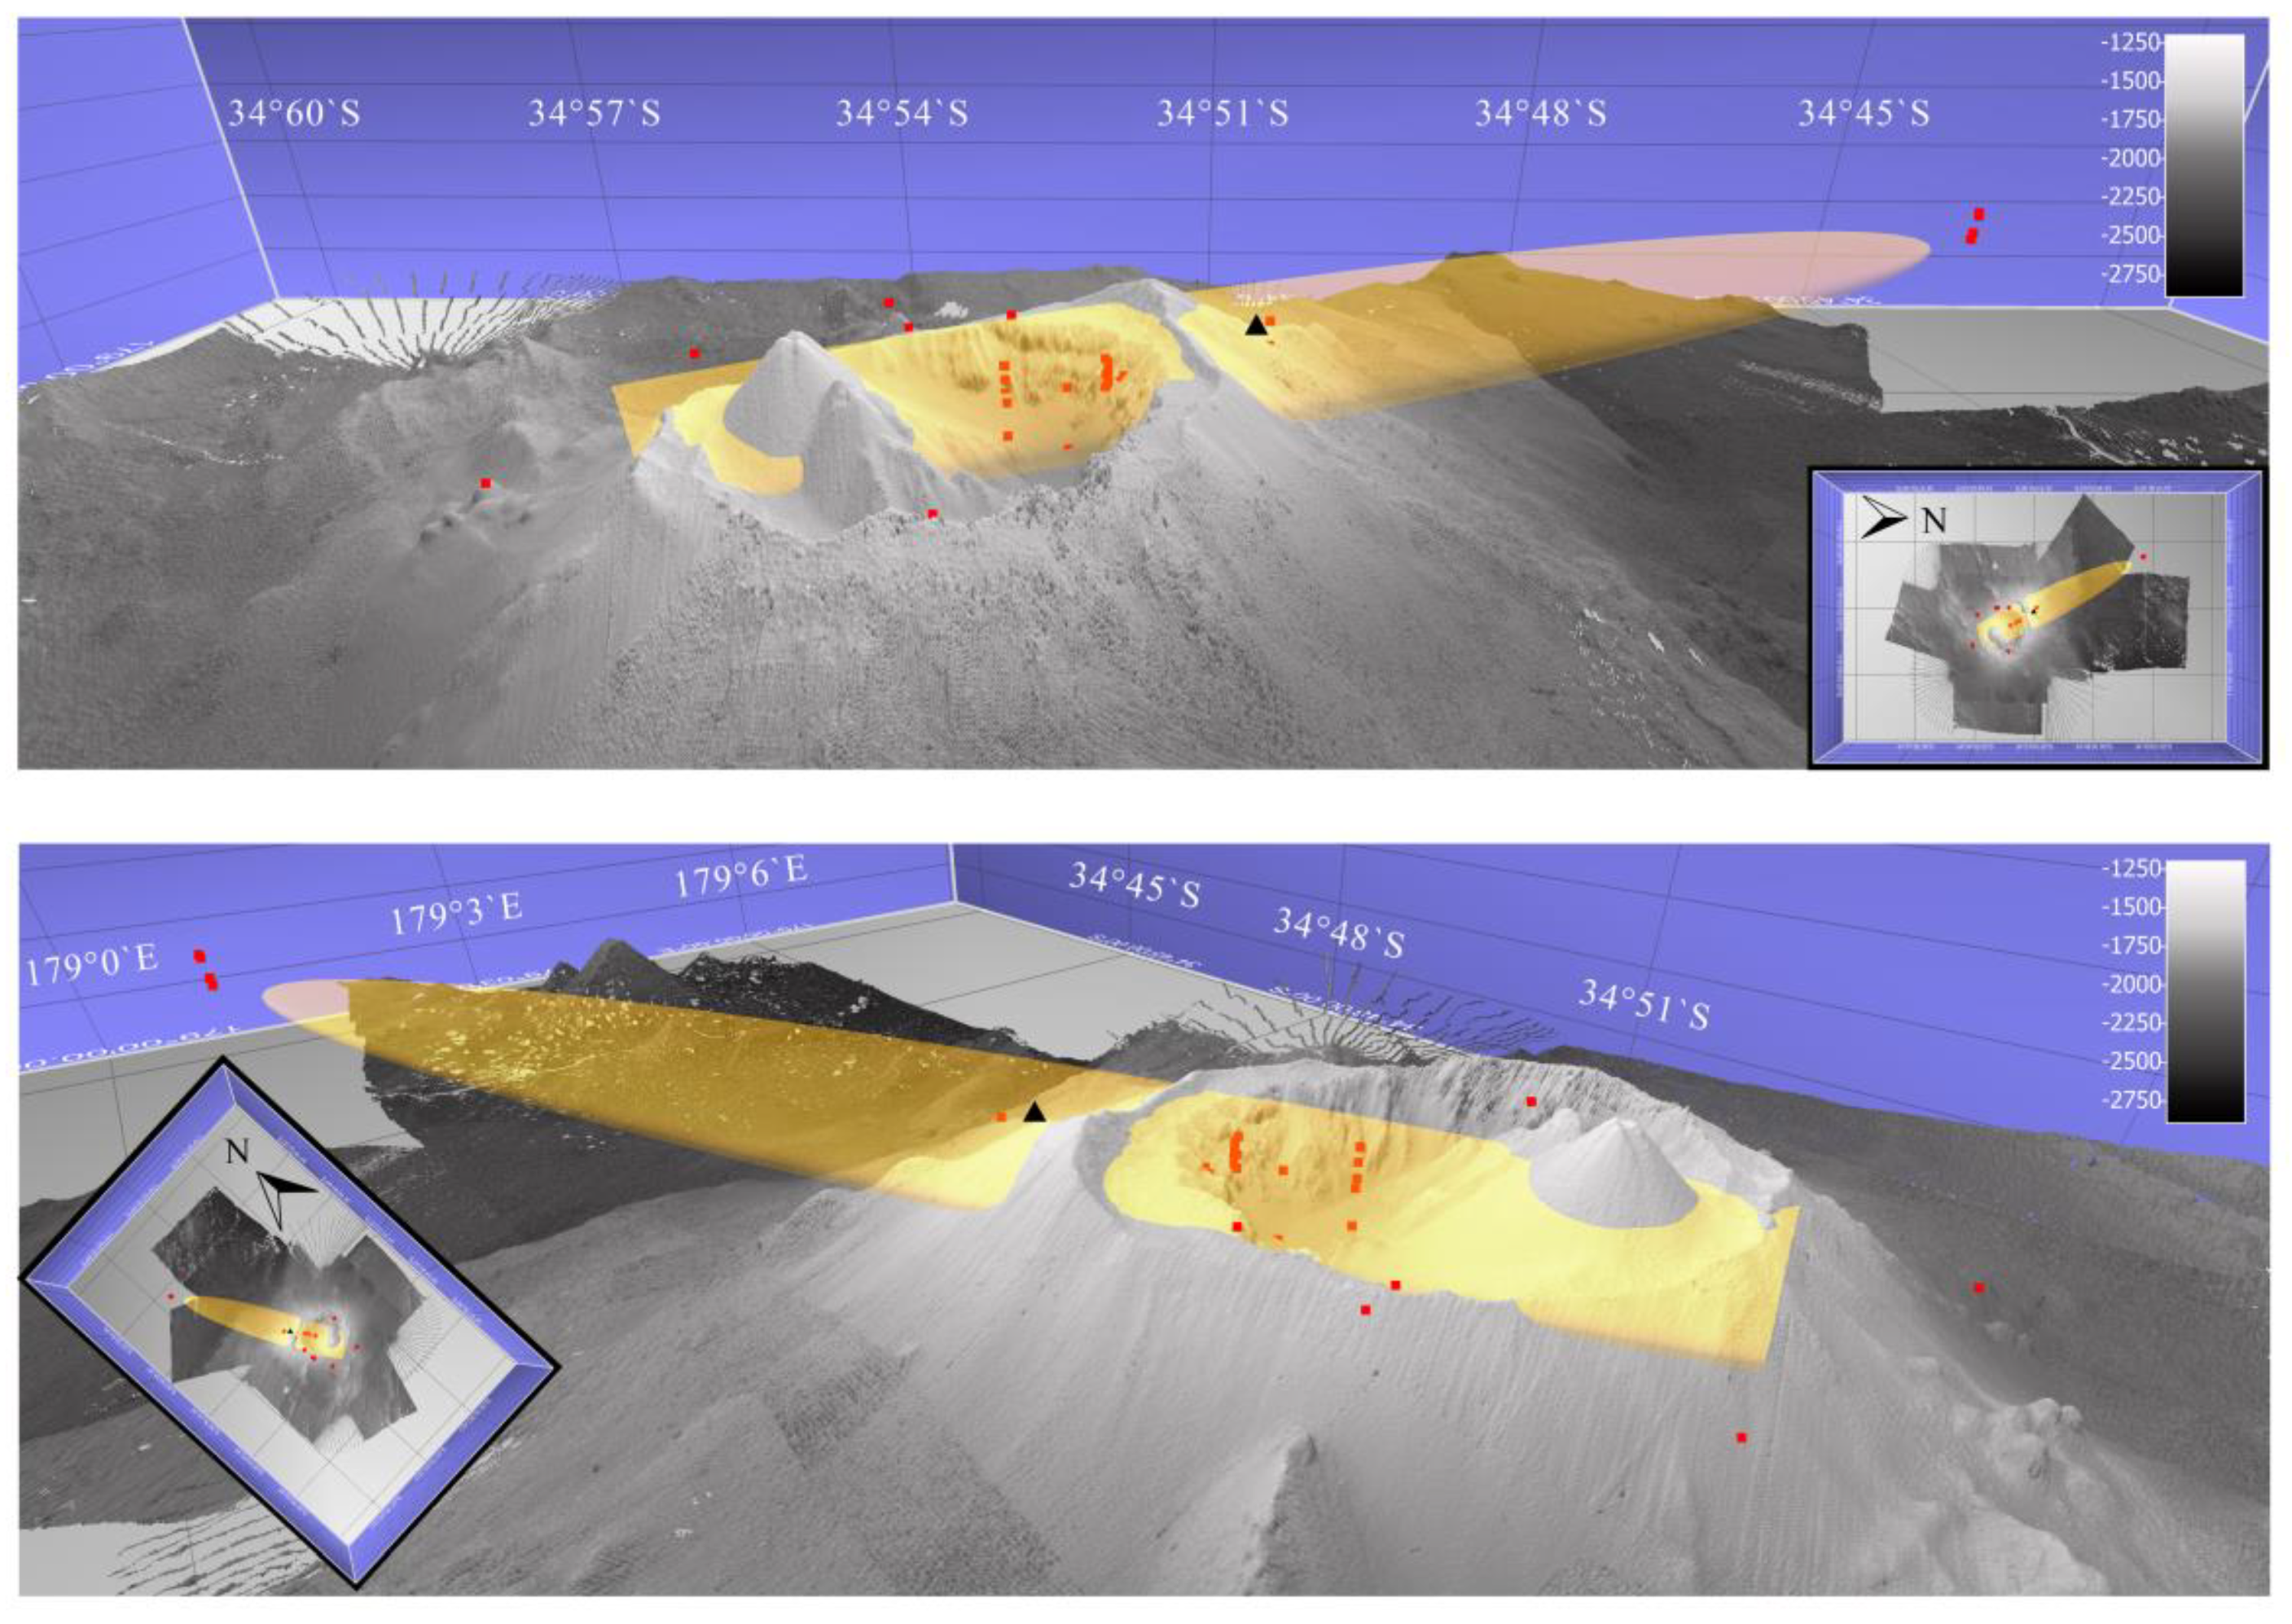
2.1. Study Area
2.2. Sampling and Analysis
2.2.1. Radium
2.2.2. Iron and Manganese
2.2.3. Helium
2.3. Submarine Hydrothermal Discharge (SHD) Calculation
2.3.1. SHD of Associated Trace Elements and Isotopes
3. Results
4. Discussion
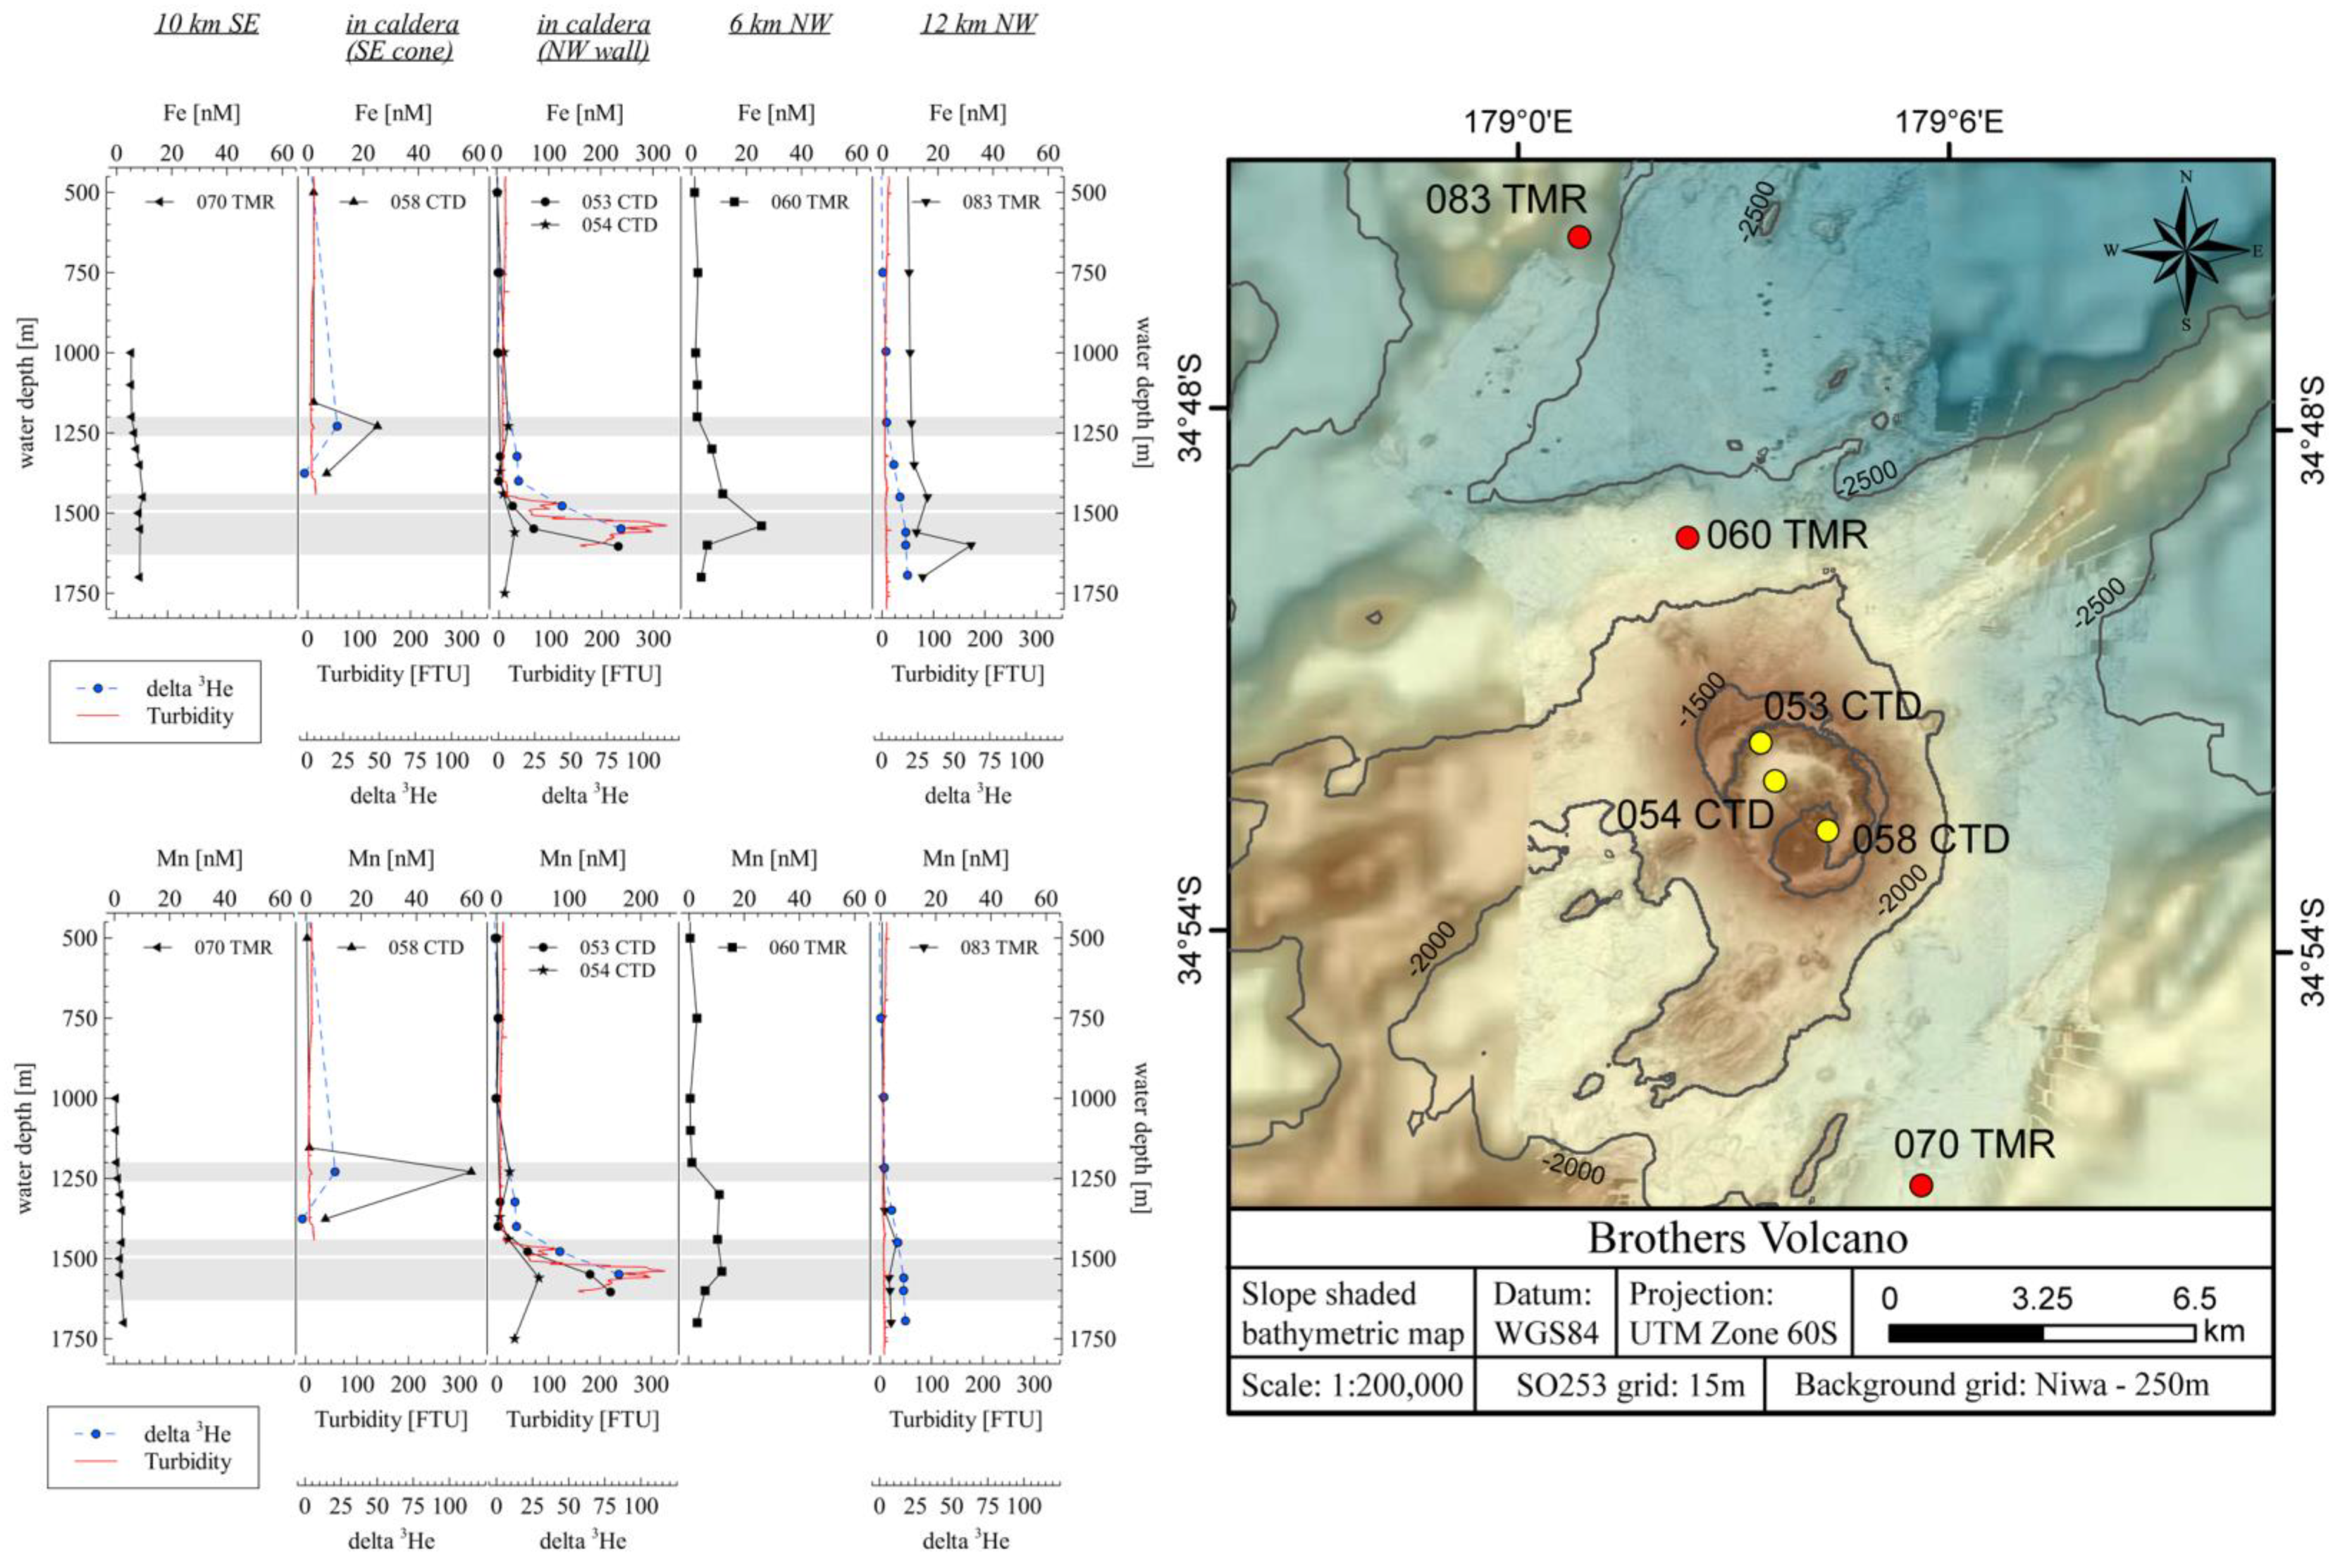
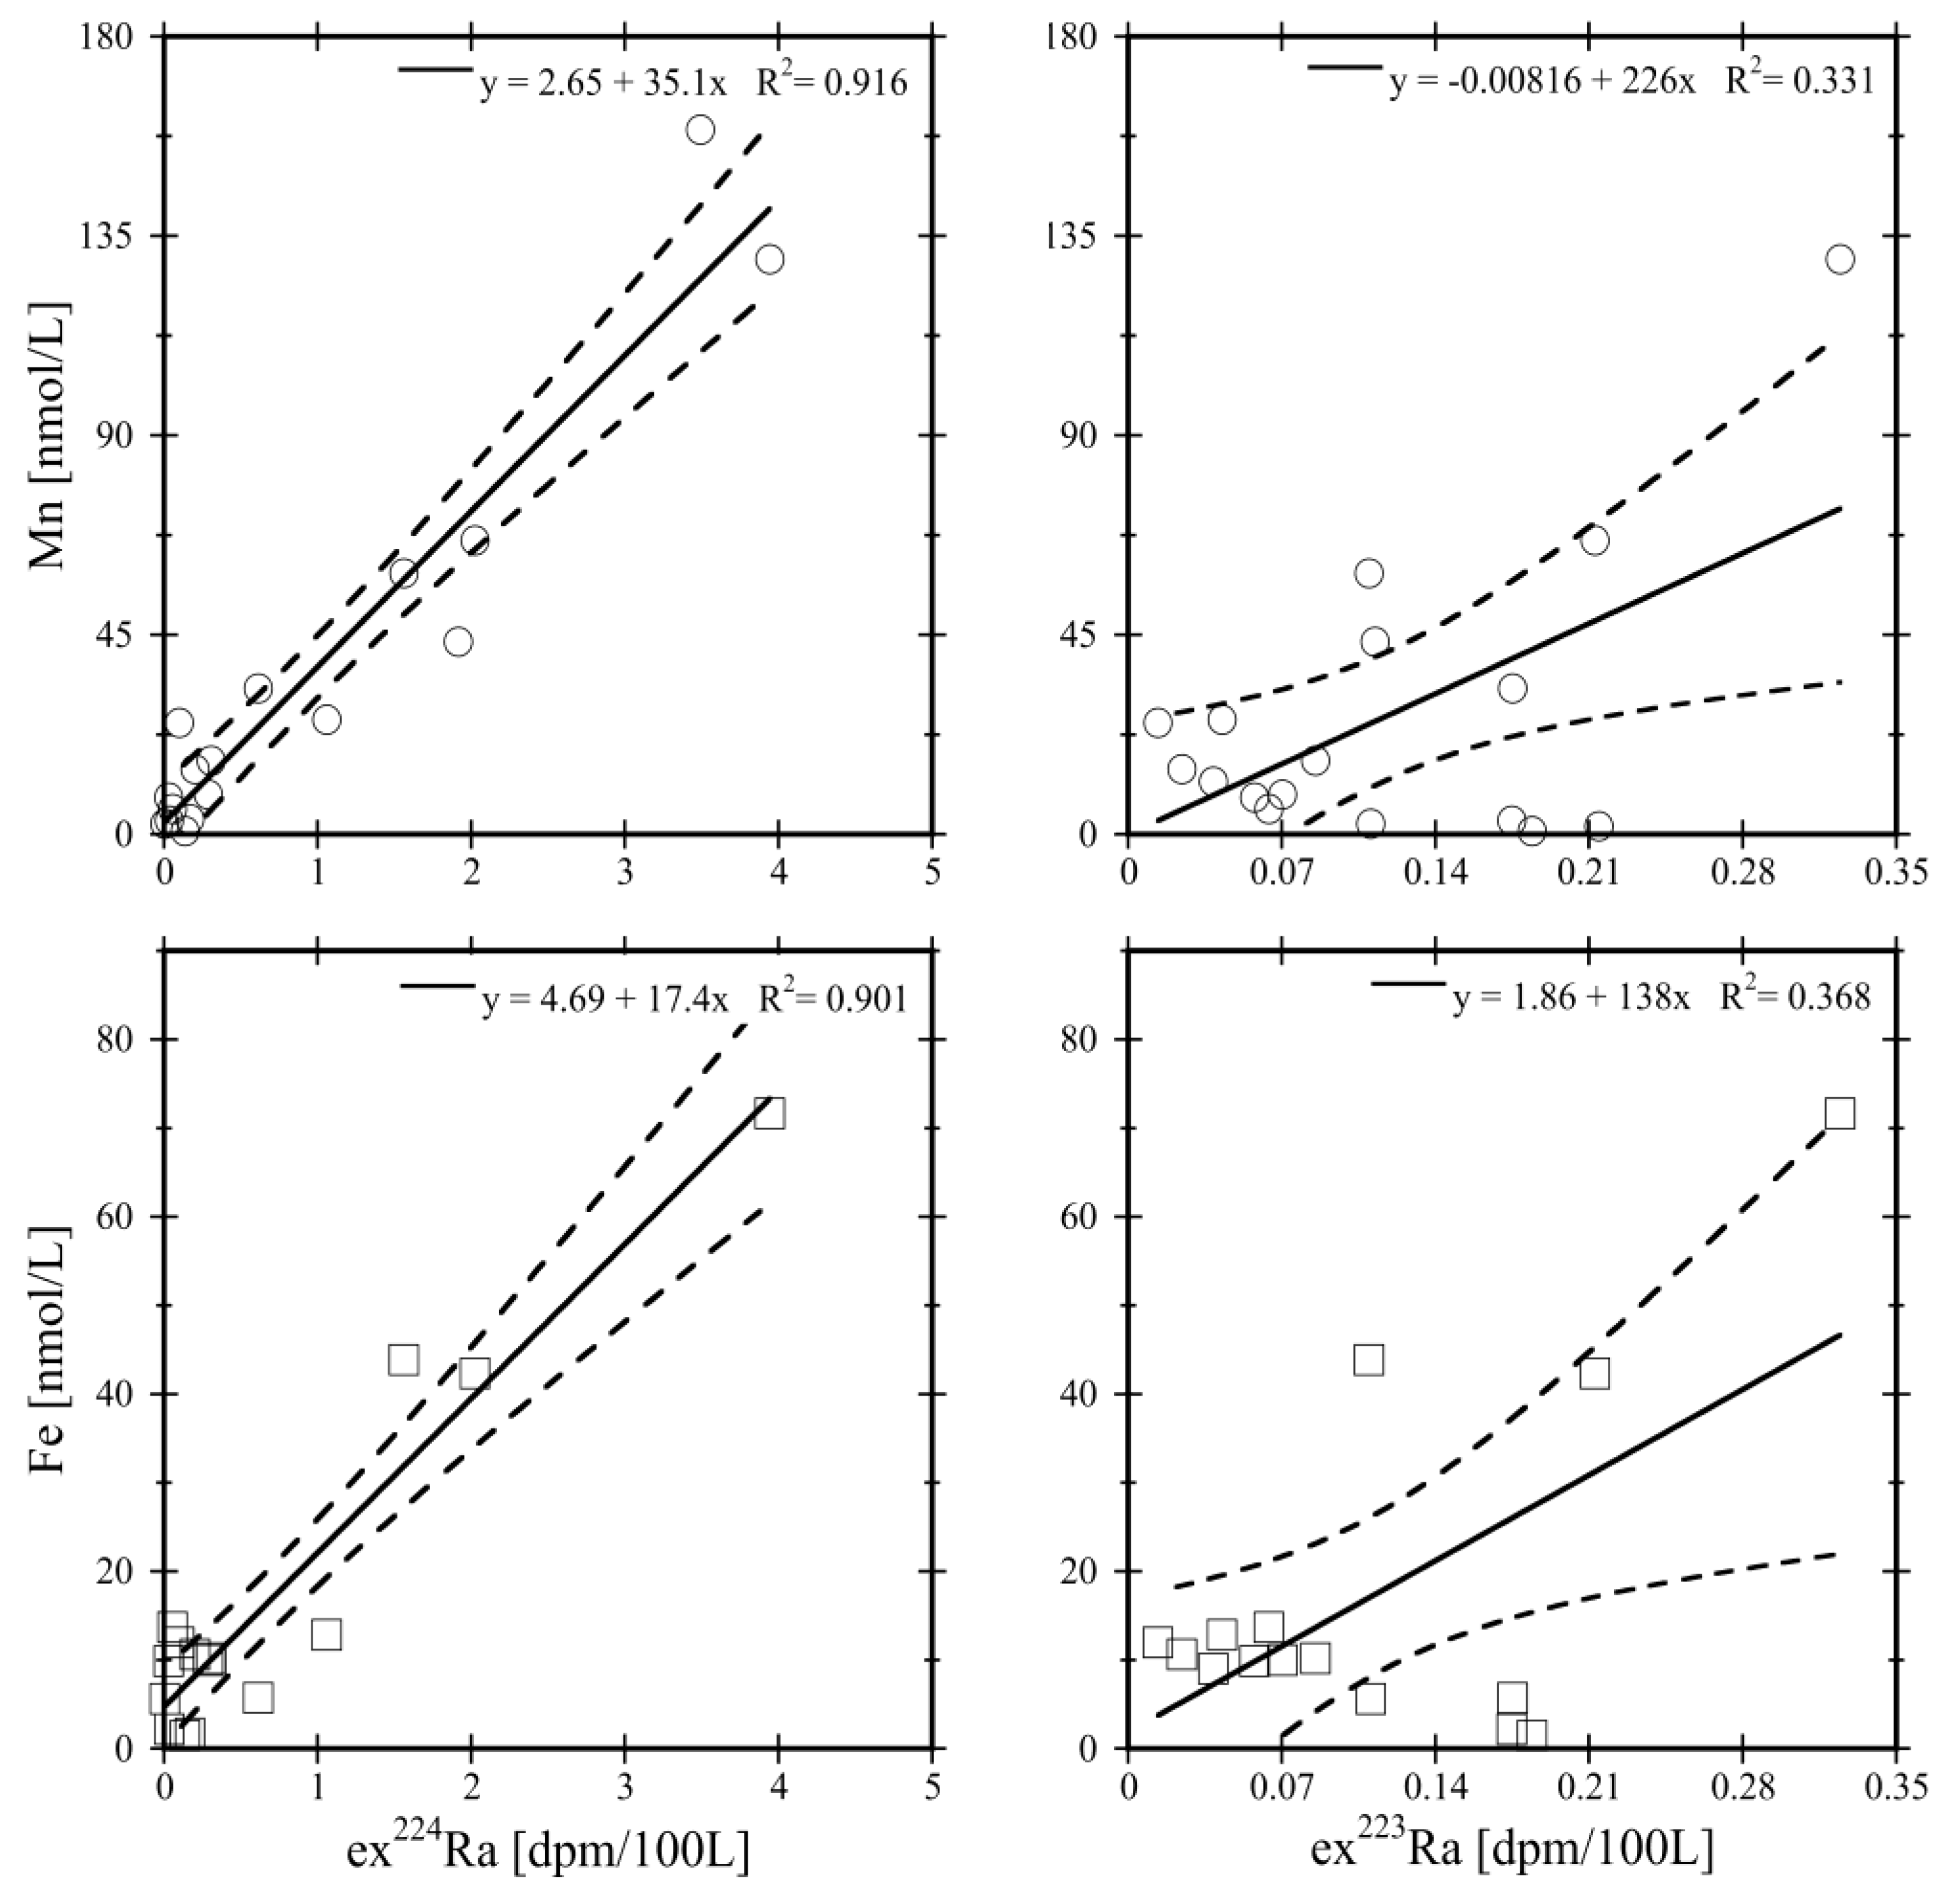
4.1. Dissolved Metals in the Plume
4.2. Uncertainty of Ra-Based Hydrothermal Flux Estimations
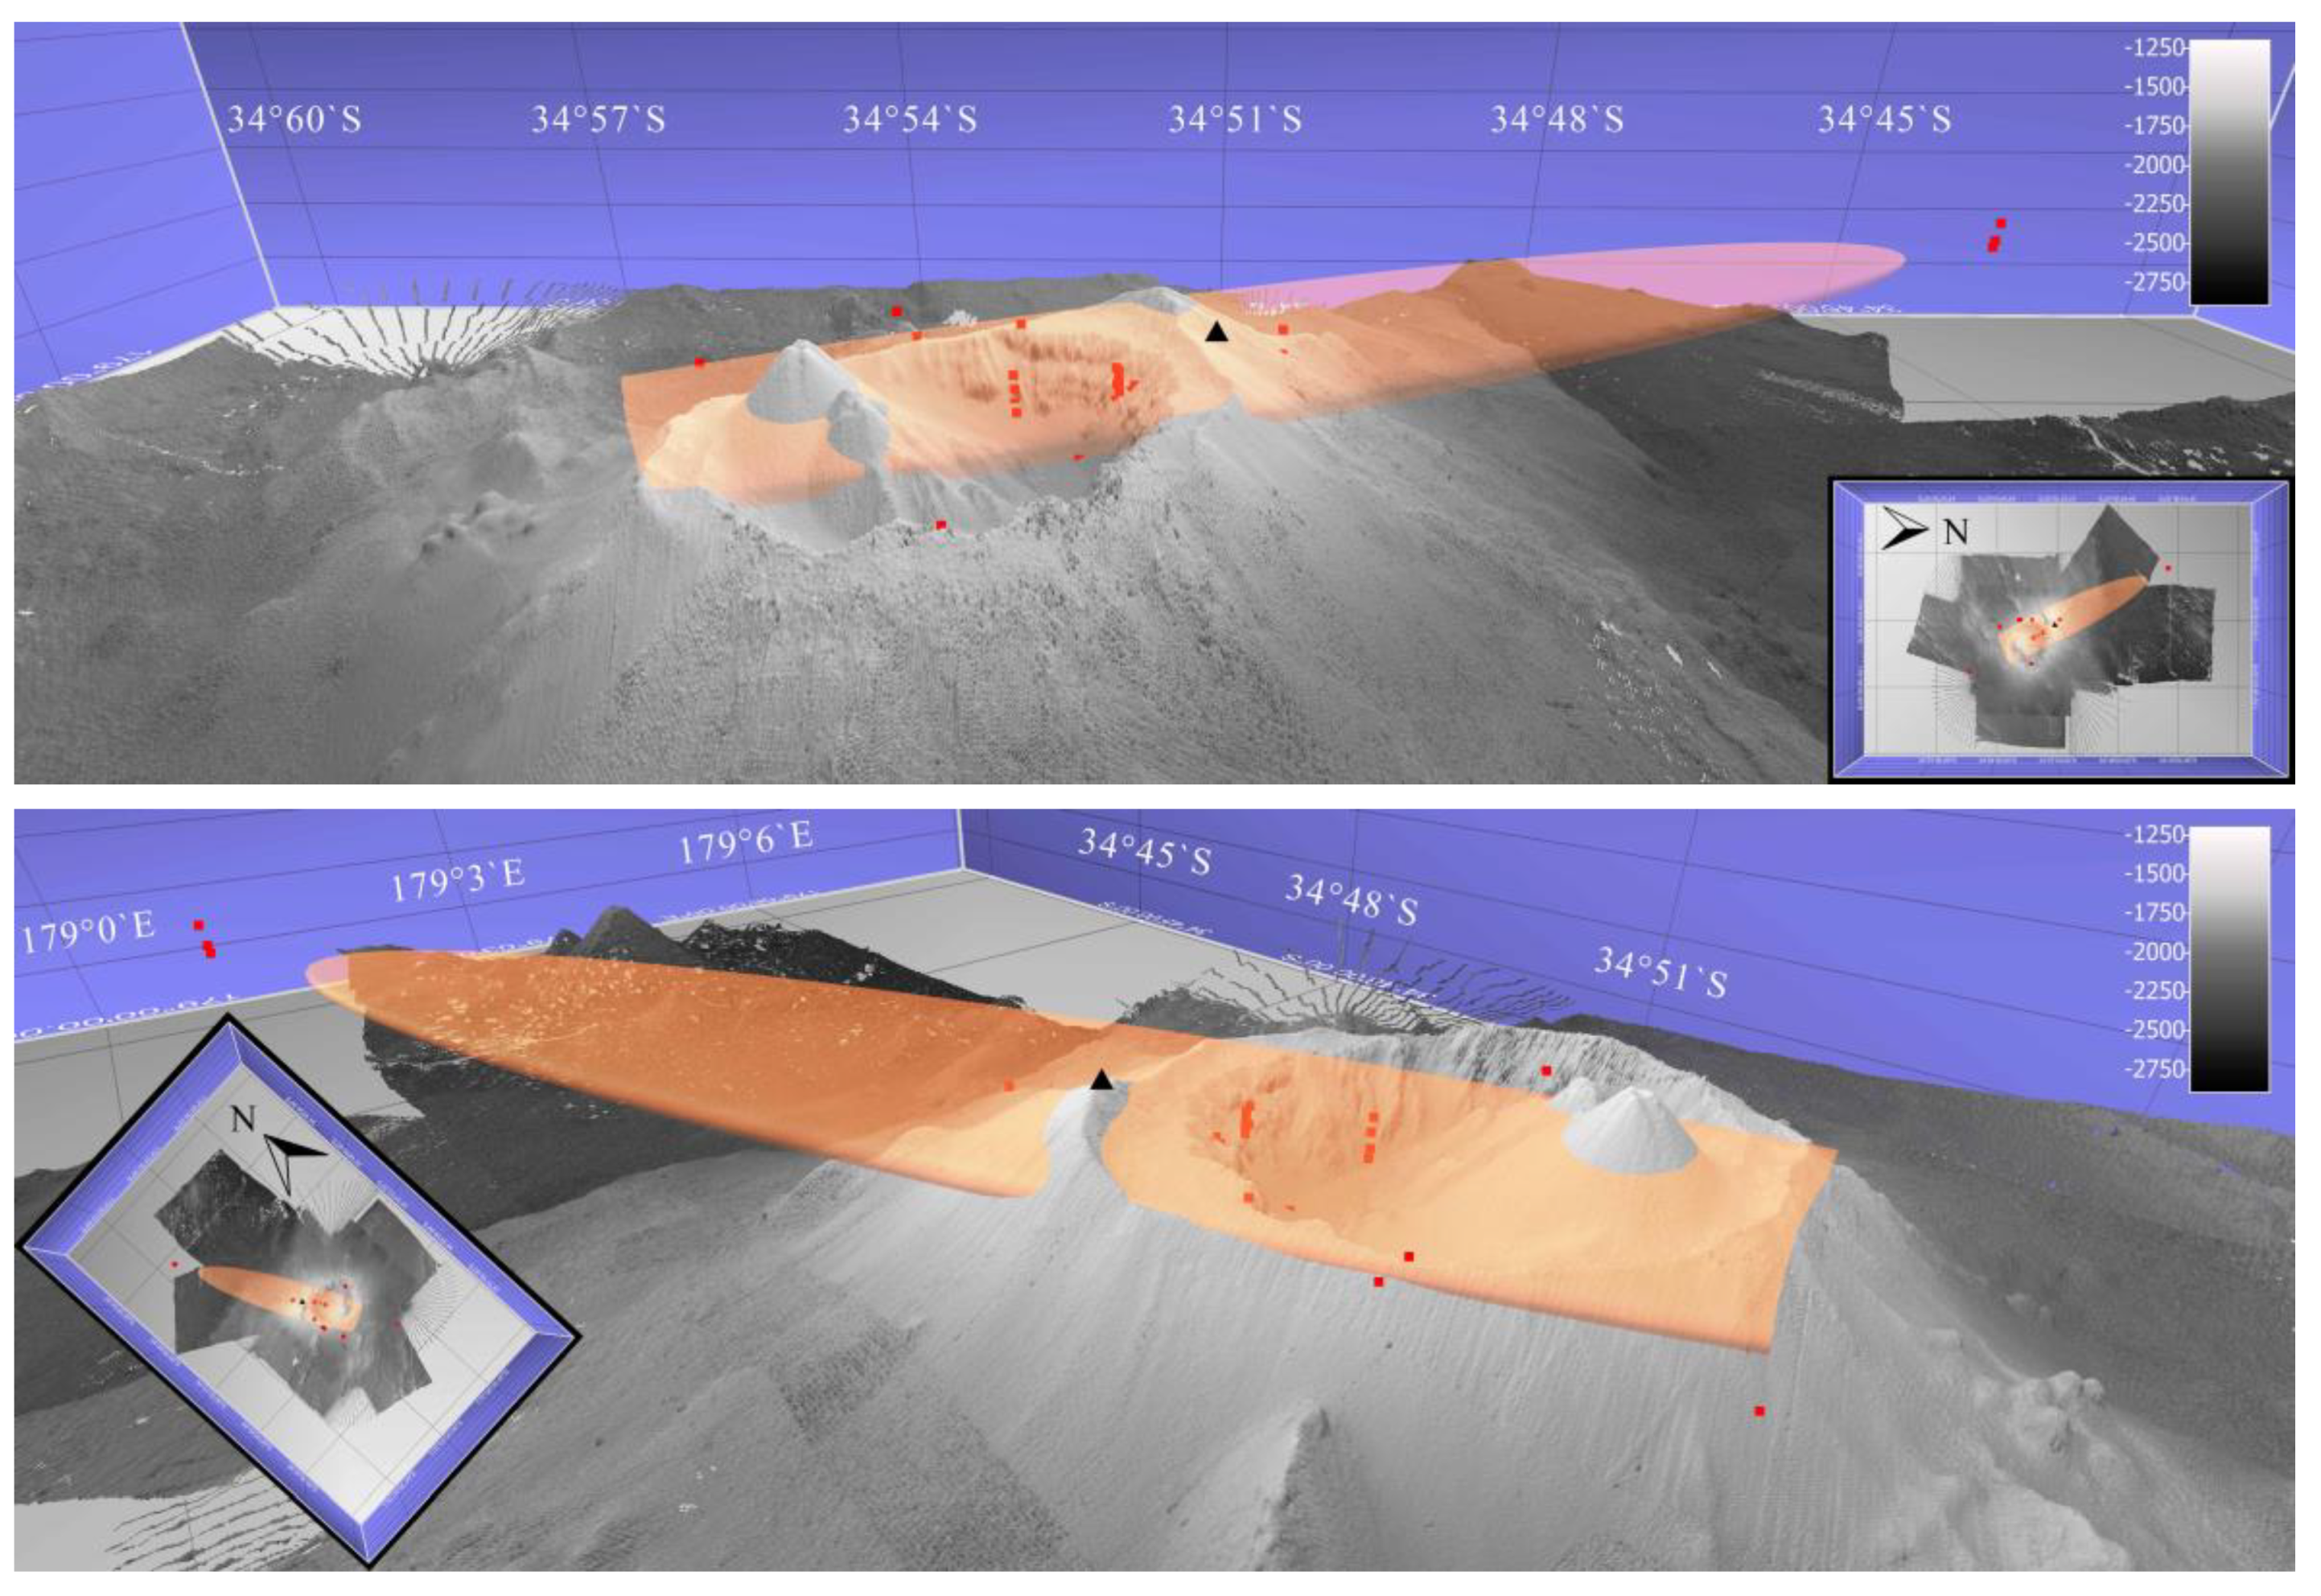
4.2.1. Uncertainty Caused by Estimations of the Plume Dimension
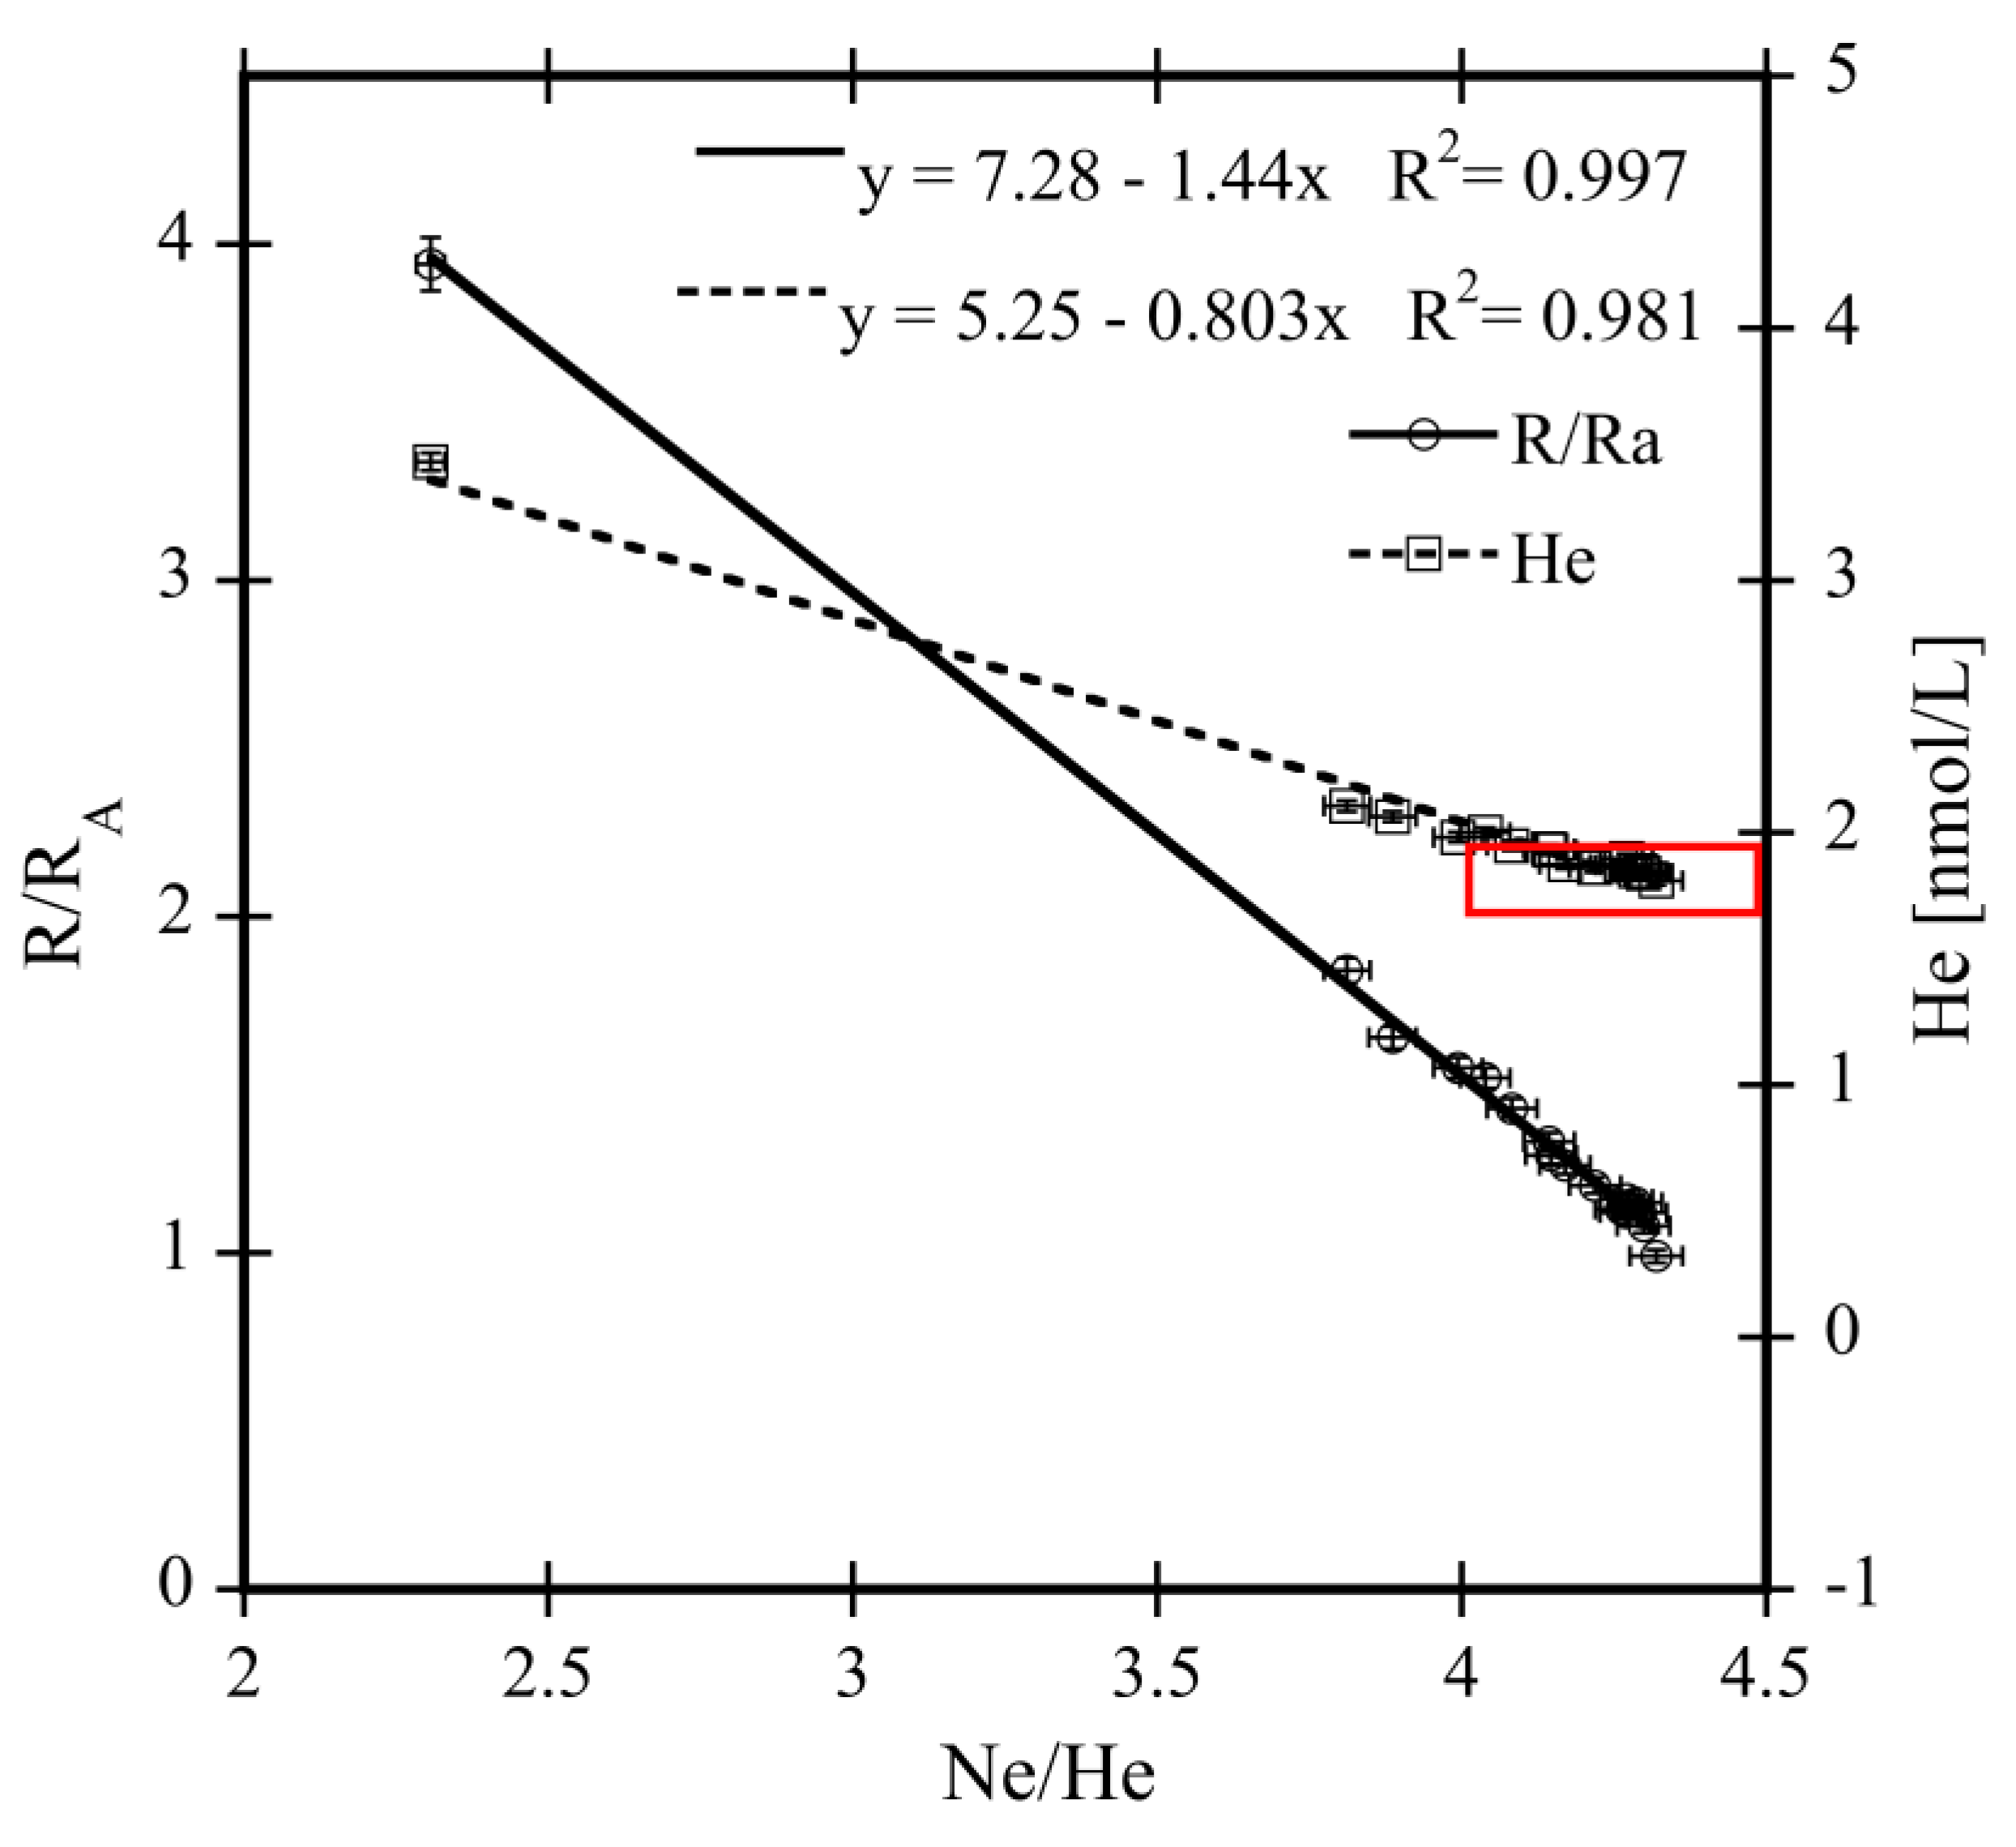
4.2.2. Uncertainty of Extrapolated 3He and 4He End Member
4.2.3. Uncertainty of Trace Element End Member and Niskin Bottle Concentrations
4.3. Additional Near-Bottom Input of 227Ac and 223Ra
4.4. Comparison of Measured and Calculated Trace Element Plume Concentrations at Brothers Volcano
4.5. Importance of Hydrothermal Fluxes at Brothers Compared to Other Hydrothermal Vent Sites
5. Conclusions
Author Contributions
Funding
Acknowledgments
Conflicts of Interest
Appendix A
Appendix A.1. Calculated Plume Ellipsoids at Brothers Volcano

Appendix A.2. Dissolved Trace Metal Concentrations in the Plume

| Sample ID | Lat (°N) | Long (°E) | Depth (m) | Mn (nmol/L) | Fe (nmol/L) |
|---|---|---|---|---|---|
| 46_CTD_4 | −34.86228333 | 179.0593333 | 1576 | 101.6 | 49.0 |
| 46_CTD_6 | −34.86938333 | 179.0626833 | 1584 | 30.9 | 12.0 |
| • 46_CTD_14 | −34.89270000 | 179.0736833 | 1530 | 8.9 | 6.4 |
| 49_CTD_3 | −34.86228333 | 179.0593333 | 1576 | 8.8 | 9.6 |
| 49_CTD_5 | −34.86938333 | 179.0626833 | 1584 | 51.1 | 20.6 |
| 49_CTD_17 | −34.89525000 | 179.0550833 | 1557 | 0.7 | 1.7 |
| 53_CTD_2 | −34.86230000 | 179.0593667 | 1604 | 158.0 | 233.4 |
| 53_CTD_4 | −34.86230000 | 179.0593667 | 1549 | 129.6 | 71.3 |
| 53_CTD_10 | −34.86230000 | 179.0593667 | 1478 | 43.1 | 30.7 |
| 53_CTD_12 | −34.86230000 | 179.0593667 | 1400 | 2.1 | 3.8 |
| 54_CTD_6 | −34.86943333 | 179.0626500 | 1560 | 58.8 | 34.6 |
| 54_CTD_10 | −34.86943333 | 179.0626500 | 1440 | 16.6 | 12.7 |
| • 57_CTD_6 | −34.86155000 | 179.0387000 | 1515 | 10.6 | 14.3 |
| 57_CTD_8 | −34.86701667 | 179.0500667 | 1441 | 4.8 | 6.0 |
| 57_CTD_14 | −34.86903333 | 179.0542667 | 1556 | 95.3 | 57.3 |
| 57_CTD_18 | −34.88135000 | 179.0799167 | 1518 | 30.9 | 13.2 |
| • 57_CTD_20 | −34.88788333 | 179.0935333 | 1495 | 5.4 | 6.1 |
| 58_CTD_2 | −34.87895000 | 179.0750500 | 1376 | 7.0 | 6.8 |
| • 60_TMR_1 | −34.82296667 | 179.0411167 | 1700 | 3.0 | 3.6 |
| • 60_TMR_2 | −34.82296667 | 179.0411167 | 1600 | 5.8 | 5.8 |
| • 60_TMR_3 | −34.82296667 | 179.0411167 | 1540 | 11.9 | 3.4 |
| • 60_TMR_4 | −34.82296667 | 179.0411167 | 1440 | 10.3 | 11.4 |
| • 62_CTD_2 | −34.84910000 | 179.0501667 | 1607 | 8.3 | 8.3 |
| 62_CTD_4 | −34.84913333 | 179.0501667 | 1486 | 25.9 | 19.0 |
| 62_CTD_8 | −34.87051667 | 179.0503667 | 1462 | 14.7 | 16.7 |
| • 62_CTD_10 | −34.87416667 | 179.0503833 | 1441 | 15.7 | 14.5 |
| • 62_CTD_14 | −34.87911667 | 179.0504167 | 1524 | 11.9 | 10.9 |
| • 62_CTD_19 | −34.88058333 | 179.0504167 | 1404 | 2.4 | 5.6 |
| • 83_TMR_1 | −34.76591667 | 179.0144833 | 1700 | 3.8 | 14.5 |
| • 83_TMR_2 | −34.76591667 | 179.0144833 | 1600 | 3.4 | 32.0 |
| • 83_TMR_3 | −34.76591667 | 179.0144833 | 1560 | 3.1 | 12.2 |
| • 83_TMR_4 | −34.76591667 | 179.0144833 | 1450 | 5.7 | 16.2 |
Appendix A.3. Calculation Example for Calculated Mean Metal Concentration in the Plume (Section 4.4)
- Calculation of JSHD with average SHD for 223Ra and 224Ra from Equation (3) and average Fe concentration in plume samples (Niskin bottles) (Table 5). See also Section 2.3.1.
References
- Baker, E.T.; Embley, R.W.; Walker, S.L.; Resing, J.A.; Lupton, J.E.; Nakamura, K.-I.; de Ronde, C.E.J.; Massoth, G.J. Hydrothermal activity and volcano distribution along the Mariana arc. J. Geophys. Res. Solid Earth 2008, 113. [Google Scholar] [CrossRef]
- Hekinian, R. Subduction Zones. In Sea Floor Exploration: Scientific Adventures Diving into the Abyss; Springer International Publishing: Cham, Switzerland, 2014; pp. 347–363. [Google Scholar]
- Sigurdsson, H. Introduction. In The Encyclopedia of Volcanoes, 2nd ed.; Sigurdsson, H., Ed.; Academic Press: Amsterdam, The Netherlands, 2015; pp. 1–12. [Google Scholar]
- Staudigel, H.; Hart, S.R.; Koppers, A.A.P.; Constable, C.; Workman, R.; Kurz, M.; Baker, E.T. Hydrothermal venting at Vailulu’u Seamount: The smoking end of the Samoan chain. Geochem. Geophys. Geosyst. 2004, 5. [Google Scholar] [CrossRef]
- German, C.R.; Seyfried, W.E., Jr. 8.7—Hydrothermal Processes. In Treatise on Geochemistry, 2nd ed.; Holland, H.D., Turekian, K.K., Eds.; Elsevier: Oxford, UK, 2014; Volume 8, pp. 191–233. [Google Scholar]
- Herzig, P.M.; Hannington, M.D. Input from the Deep: Hot Vents and Cold Seeps. In Marine Geochemistry; Schulz, H.D., Zabel, M., Eds.; Springer: Berlin/Heidelberg, Germany, 2006; pp. 457–479. [Google Scholar]
- Sander, S.G.; Koschinsky, A. Metal flux from hydrothermal vents increased by organic complexation. Nat. Geosci. 2011, 4, 145–150. [Google Scholar] [CrossRef]
- Fitzsimmons, J.N.; John, S.G.; Marsay, C.M.; Hoffman, C.L.; Nicholas, S.L.; Toner, B.M.; German, C.R.; Sherrell, R.M. Iron persistence in a distal hydrothermal plume supported by dissolved-particulate exchange. Nat. Geosci. 2017, 10, 195–201. [Google Scholar] [CrossRef]
- Resing, J.A.; Sedwick, P.N.; German, C.R.; Jenkins, W.J.; Moffett, J.W.; Sohst, B.M.; Tagliabue, A. Basin-scale transport of hydrothermal dissolved metals across the South Pacific Ocean. Nature 2015, 523, 200–203. [Google Scholar] [CrossRef]
- Tagliabue, A.; Bopp, L.; Dutay, J.-C.; Bowie, A.R.; Chever, F.; Jean-Baptiste, P.; Bucciarelli, E.; Lannuzel, D.; Remenyi, T.; Sarthou, G.; et al. Hydrothermal contribution to the oceanic dissolved iron inventory. Nat. Geosci. 2010, 3, 252–256. [Google Scholar] [CrossRef]
- Saito, M.A.; Noble, A.E.; Tagliabue, A.; Goepfert, T.J.; Lamborg, C.H.; Jenkins, W.J. Slow-spreading submarine ridges in the South Atlantic as a significant oceanic iron source. Nat. Geosci. 2013, 6, 775–779. [Google Scholar] [CrossRef]
- Lupton, J. Hydrothermal helium plumes in the Pacific Ocean. J. Geophys. Res.-Ocean. 1998, 103, 15853–15868. [Google Scholar] [CrossRef]
- Rüth, C.; Well, R.; Roether, W. Primordial He-3 in South Atlantic deep waters from sources on the Mid-Atlantic Ridge. Deep-Sea Res. Part I-Oceanogr. Res. Pap. 2000, 47, 1059–1075. [Google Scholar] [CrossRef]
- de Ronde, C.E.J.; Massoth, G.J.; Baker, E.T.; Lupton, J.E. Submarine Hydrothermal Venting Related to Volcanic Arcs Volcanic, Geothermal, and Ore-Forming Fluids: Rulers and Witnesses of Processes within the Earth; Simmons, S.F., Graham, I., Eds.; Society of Economic Geologists: Littleton, CO, USA, 2005; Volume 10. [Google Scholar]
- de Ronde, C.E.J.; Massoth, G.J.; Butterfield, D.A.; Christenson, B.W.; Ishibashi, J.; Ditchburn, R.G.; Hannington, M.D.; Brathwaite, R.L.; Lupton, J.E.; Kamenetsky, V.S.; et al. Submarine hydrothermal activity and gold-rich mineralization at Brothers Volcano, Kermadec Arc, New Zealand. Miner. Depos. 2011, 46, 541–584. [Google Scholar] [CrossRef]
- Hawkes, J.A.; Connelly, D.P.; Rijkenberg, M.J.A.; Achterberg, E.P. The importance of shallow hydrothermal island arc systems in ocean biogeochemistry. Geophys. Res. Lett. 2014, 41, 942–947. [Google Scholar] [CrossRef]
- Resing, J.A.; Lebon, G.; Baker, E.T.; Lupton, J.E.; Embley, R.W.; Massoth, G.J.; Chadwick, W.W.; de Ronde, C.E.J. Venting of Acid-Sulfate Fluids in a High-Sulfidation Setting at NW Rota-1 Submarine Volcano on the Mariana Arc. Econ. Geol. 2007, 102, 1047–1061. [Google Scholar] [CrossRef]
- Buck, N.J.; Resing, J.A.; Baker, E.T.; Lupton, J.E. Chemical Fluxes From a Recently Erupted Shallow Submarine Volcano on the Mariana Arc. Geochem. Geophys. Geosyst. 2018, 19, 1660–1673. [Google Scholar] [CrossRef]
- Achterberg, E.P.; Moore, C.M.; Henson, S.A.; Steigenberger, S.; Stohl, A.; Eckhardt, S.; Avendano, L.C.; Cassidy, M.; Hembury, D.; Klar, J.K.; et al. Natural iron fertilization by the Eyjafjallajökull volcanic eruption. Geophys. Res. Lett. 2013, 40, 921–926. [Google Scholar] [CrossRef]
- Baker, E.T. Exploring the ocean for hydrothermal venting: New techniques, new discoveries, new insights. Ore Geol. Rev. 2017, 86, 55–69. [Google Scholar] [CrossRef]
- Ardyna, M.; Lacour, L.; Sergi, S.; d’Ovidio, F.; Sallee, J.B.; Rembauville, M.; Blain, S.; Tagliabue, A.; Schlitzer, R.; Jeandel, C.; et al. Hydrothermal vents trigger massive phytoplankton blooms in the Southern Ocean. Nat. Commun. 2019, 10, 2451. [Google Scholar] [CrossRef]
- Elderfield, H.; Schultz, A. Mid-Ocean Ridge Hydrothermal Fluxes and the Chemical Composition of the Ocean. Annu. Rev. Earth Planet. Sci. 1996, 24, 191–224. [Google Scholar] [CrossRef]
- Murton, B.J.; Redbourn, L.J.; German, C.R.; Baker, E.T. Sources and fluxes of hydrothermal heat, chemicals and biology within a segment of the Mid-Atlantic Ridge. Earth Planet. Sci. Lett. 1999, 171, 301–317. [Google Scholar] [CrossRef]
- Hart, S.R.; Staudigel, H.; Workman, R.; Koppers, A.A.P.; Girard, A.P. A fluorescein tracer release experiment in the hydrothermally active crater of Vailulu’u volcano, Samoa. J. Geophys. Res.-Solid Earth 2003, 108. [Google Scholar] [CrossRef]
- Jenkins, W.J.; Edmond, J.M.; Corliss, J.B. Excess He-3 and He-4 in Galapagos Submarine Hydrothermal Waters. Nature 1978, 272, 156–158. [Google Scholar] [CrossRef]
- Nielsen, S.G.; Rehkämper, M.; Teagle, D.A.H.; Butterfield, D.A.; Alt, J.C.; Halliday, A.N. Hydrothermal fluid fluxes calculated from the isotopic mass balance of thallium in the ocean crust. Earth Planet. Sci. Lett. 2006, 251, 120–133. [Google Scholar] [CrossRef]
- Wheat, C.G.; Mottl, M.J. Composition of pore and spring waters from Baby Bare: Global implications of geochemical fluxes from a ridge flank hydrothermal system. Geochim. Cosmochim. Acta 2000, 64, 629–642. [Google Scholar] [CrossRef]
- Thurnherr, A.M.; Richards, K.J. Hydrography and high-temperature heat flux of the Rainbow hydrothermal site (36 degrees 14′N, Mid-Atlantic Ridge). J. Geophys. Res.-Ocean. 2001, 106, 9411–9426. [Google Scholar] [CrossRef]
- German, C.R.; Thurnherr, A.M.; Knoery, J.; Charlou, J.L.; Jean-Baptiste, P.; Edmonds, H.N. Heat, volume and chemical fluxes from submarine venting: A synthesis of results from the Rainbow hydrothermal field, 36 degrees N MAR. Deep-Sea Res. Part I—Oceanogr. Res. Pap. 2010, 57, 518–527. [Google Scholar] [CrossRef]
- Schmale, O.; Walter, M.; Schneider von Deimling, J.; Sültenfuß, J.; Walker, S.; Rehder, G.; Keir, R. Fluid and gas fluxes from the Logatchev hydrothermal vent area. Geochem. Geophys. Geosyst. 2012, 13. [Google Scholar] [CrossRef]
- Kadko, D.; Butterfield, D.A. The relationship of hydrothermal fluid composition and crustal residence time to maturity of vent fields on the Juan de Fuca Ridge. Geochim. Cosmochim. Acta 1998, 62, 1521–1533. [Google Scholar] [CrossRef]
- Kadko, D.; Gronvold, K.; Butterfield, D. Application of radium isotopes to determine crustal residence times of hydrothermal fluids from two sites on the Reykjanes Peninsula, Iceland. Geochim. Cosmochim. Acta 2007, 71, 6019–6029. [Google Scholar] [CrossRef]
- Kadko, D.; Moore, W. Radiochemical Constraints on the crustal residence time of submarine hydrothermal fluids—Endeavor ridge. Geochim. Cosmochim. Acta 1988, 52, 659–668. [Google Scholar] [CrossRef]
- Elsinger, R.J.; Moore, W.S. Ra-224,Ra-228, and Ra-226 in Winyah Bay and Delaware Bay. Earth Planet. Sci. Lett. 1983, 64, 430–436. [Google Scholar] [CrossRef]
- Moore, W.S.; Krest, J. Distribution of Ra-223 and Ra-224 in the plumes of the Mississippi and Atchafalaya Rivers and the Gulf of Mexico. Mar. Chem. 2004, 86, 105–119. [Google Scholar] [CrossRef]
- Webster, I.T.; Hancock, G.J.; Murray, A.S. Use of Radium Isotopes to Examine Pore-Water Exchange in an Estuary. Limnol. Oceanogr. 1994, 39, 1917–1927. [Google Scholar] [CrossRef]
- Yang, H.-S.; Hwang, D.-W.; Kim, G. Factors controlling excess radium in the Nakdong River estuary, Korea: Submarine groundwater discharge versus desorption from riverine particles. Mar. Chem. 2002, 78, 1–8. [Google Scholar] [CrossRef]
- Kipp, L.E.; Sanial, V.; Henderson, P.B.; van Beek, P.; Reyss, J.-L.; Hammond, D.E.; Moore, W.S.; Charette, M.A. Radium isotopes as tracers of hydrothermal inputs and neutrally buoyant plume dynamics in the deep ocean. Mar. Chem. 2018, 201, 51–65. [Google Scholar] [CrossRef]
- Neuholz, R.; Schnetger, B.; Kleint, C.; Koschinsky, A.; Lettmann, K.; Sander, S.; Türke, A.; Walter, M.; Zitoun, R.; Brumsack, H.-J. Near-field hydrothermal plume dynamics at Brothers Volcano (Kermadec Arc): A short-lived radium isotope study. Chem. Geol. 2020, 533, 119379. [Google Scholar] [CrossRef]
- Cho, H.M.; Kim, G.; Kwon, E.Y.; Moosdorf, N.; Garcia-Orellana, J.; Santos, I.R. Radium tracing nutrient inputs through submarine groundwater discharge in the global ocean. Sci. Rep. 2018, 8, 2439. [Google Scholar] [CrossRef] [PubMed]
- Moore, W.S. Sources and fluxes of submarine groundwater discharge delineated by radium isotopes. Biogeochemistry 2003, 66, 75–93. [Google Scholar] [CrossRef]
- Taniguchi, M.; Dulai, H.; Burnett, K.M.; Santos, I.R.; Sugimoto, R.; Stieglitz, T.; Kim, G.; Moosdorf, N.; Burnett, W.C. Submarine Groundwater Discharge: Updates on Its Measurement Techniques, Geophysical Drivers, Magnitudes, and Effects. Front. Environ. Sci. 2019, 7. [Google Scholar] [CrossRef]
- Lupton, J.E.; Weiss, R.F.; Craig, H. Mantle Helium in Hydrothermal Plumes in the Galapagos Rift. Nature 1977, 267, 603–604. [Google Scholar] [CrossRef]
- Moore, W.S.; Ussler, W.; Paull, C.K. Short-lived radium isotopes in the Hawaiian margin: Evidence for large fluid fluxes through the Puna Ridge. Mar. Chem. 2008, 109, 421–430. [Google Scholar] [CrossRef]
- Kipp, L.E.; Charette, M.A.; Hammond, D.E.; Moore, W.S. Hydrothermal vents: A previously unrecognized source of actinium-227 to the deep ocean. Mar. Chem. 2015, 177, 583–590. [Google Scholar] [CrossRef]
- Charette, M.A.; Morris, P.J.; Henderson, P.B.; Moore, W.S. Radium isotope distributions during the US GEOTRACES North Atlantic cruises. Mar. Chem. 2015, 177, 184–195. [Google Scholar] [CrossRef]
- Koschinsky, A. RV Sonne 253 Cruise Report/Fahrtbericht, Nouméa (New Caledonia) 22.12.2016—Auckland (New Zealand) 21.01.2017, SO253—HYDROTHERMADEC; Jacobs University Bremen: Bremen, Germany, 2017; p. 183. [Google Scholar]
- De Ronde, C.E.J.; Humphris, S.E.; Höfig, T.W. Expedition 376 Scietific Prospectus: Brothers Arc Flux; International Ocean Discovery Program: Bremen, Germany, 2017. [Google Scholar] [CrossRef]
- De Ronde, C.E.J.; Humphris, S.E.; Höfig, T.W.; The Expedition 376 Scientists. Expedition 376 Preliminary Report: Brothers Arc Flux; International Ocean Discovery Program: Bremen, Germany, 2019. [Google Scholar]
- Baker, E.T.; Walker, S.L.; Embley, R.W.; de Ronde, C.E.J. High-Resolution Hydrothermal Mapping of Brothers Caldera, Kermadec Arc. Econ. Geol. 2012, 107, 1583–1593. [Google Scholar] [CrossRef]
- de Ronde, C.E.J.; Hannington, M.D.; Stoffers, P.; Wright, I.C.; Ditchburn, R.G.; Reyes, A.G.; Baker, E.T.; Massoth, G.J.; Lupton, J.E.; Walker, S.L.; et al. Evolution of a Submarine Magmatic-Hydrothermal System: Brothers Volcano, Southern Kermadec Arc, New Zealand. Econ. Geol. 2005, 100, 1097–1133. [Google Scholar] [CrossRef]
- Mitchell, J.; Mackay, K.; Neil, H.; Mackay, E.; Pallentin, A.; Notman, P. Undersea New Zealand, 1: 5,000,000; NIWA chart, miscellaneous series; NIWA: Auckland, New Zealand, 2012. [Google Scholar]
- Koschinsky, A.; Thal, J.; Wölfl, A.-C. Raw Multibeam EM122 Data: Transits of SONNE Cruise SO253 (South Pacific); PANGAEA: Bremen, Germany, 2018. [Google Scholar] [CrossRef]
- Von Damm, K.L.; Edmond, J.M.; Grant, B.; Measures, C.I.; Walden, B.; Weiss, R.F. Chemistry of submarine hydrothermal solutions at 21 °N, East Pacific Rise. Geochim. Cosmochim. Acta 1985, 49, 2197–2220. [Google Scholar] [CrossRef]
- Garbe-Schönberg, D.; Koschinsky, A.; Ratmeyer, V.; Westernströer, U.; Jähmlich, H. KIPS -A new Multiport Valve-based all-Teflon Fluid Sampling System for ROVs. In EGU Meeting; Geophysical Research Abstracts: Vienna, Austria, 2006; Volume 8. [Google Scholar]
- Petrick, G.; Schulz-Bull, D.E.; Martens, V.; Scholz, K.; Duinker, J.C. An in-situ filtration/extraction system for the recovery of trace organics in solution and on particles tested in deep ocean water. Mar. Chem. 1996, 54, 97–105. [Google Scholar] [CrossRef]
- Moore, W.S. Sampling Ra-228 in Deep Ocean. Deep-Sea Res. 1976, 23, 647–651. [Google Scholar] [CrossRef]
- Henderson, P.B.; Morris, P.J.; Moore, W.S.; Charette, M.A. Methodological advances for measuring low-level radium isotopes in seawater. J. Radioanal Nucl. Chem. 2013, 296, 357–362. [Google Scholar] [CrossRef]
- Giffin, C.; Kaufman, A.; Broecker, W. Delayed coincidence counter for the assay of actinon and thoron. J. Geophys. Res. 1963, 68, 1749–1757. [Google Scholar] [CrossRef]
- Moore, W.S.; Arnold, R. Measurement of Ra-223 and Ra-224 in coastal waters using a delayed coincidence counter. J. Geophys. Res.-Ocean. 1996, 101, 1321–1329. [Google Scholar] [CrossRef]
- Garcia-Solsona, E.; Garcia-Orellana, J.; Masqué, P.; Dulaiova, H. Uncertainties associated with Ra-223 and Ra-224 measurements in water via a Delayed Coincidence Counter (RaDeCC). Mar. Chem. 2008, 109, 198–219. [Google Scholar] [CrossRef]
- Moore, W.S. Fifteen years experience in measuring Ra-224 and Ra-223 by delayed-coincidence counting. Mar. Chem. 2008, 109, 188–197. [Google Scholar] [CrossRef]
- Scholten, J.C.; Pham, M.K.; Blinova, O.; Charette, M.A.; Dulaiova, H.; Eriksson, M. Preparation of Mn-fiber standards for the efficiency calibration of the delayed coincidence counting system (RaDeCC). Mar. Chem. 2010, 121, 206–214. [Google Scholar] [CrossRef]
- Moore, W.S.; Cai, P. Calibration of RaDeCC systems for 223Ra measurements. Mar. Chem. 2013, 156, 130–137. [Google Scholar] [CrossRef]
- JCGM. International Vocabulary of Metrology—Basic and General Concepts and Associated Terms (VIM). Joint Committee for Guides in Metrology. 2008. Available online: https://www.bipm.org/utils/common/documents/jcgm/JCGM_200_2012.pdf (accessed on 28 August 2020).
- Menditto, A.; Patriarca, M.; Magnusson, B. Understanding the meaning of accuracy, trueness and precision. Accredit. Qual. Assur. 2007, 12, 45–47. [Google Scholar] [CrossRef]
- Staats, G. The Semantic and Technical Concept of True Values and of Trueness of Values in Inorganic Bulk and Trace Analysis. Fresenius J. Anal. Chem. 1995, 352, 413–419. [Google Scholar] [CrossRef]
- GEOTRACES Standards and Reference Materials. Available online: http://www.geotraces.org/sic/intercalibrate-a-lab/standards-and-reference-materials (accessed on 28 August 2020).
- Sültenfuss, J.; Roether, W.; Rhein, M. The Bremen mass spectrometric facility for the measurement of helium isotopes, neon, and tritium in water. Isot. Environ. Health Stud. 2009, 45, 83–95. [Google Scholar] [CrossRef] [PubMed]
- Moore, W.S. Ages of continental shelf waters determined from Ra-223 and Ra-224. J. Geophys. Res. Ocean 2000, 105, 22117–22122. [Google Scholar] [CrossRef]
- Null, K.A.; Reide Corbett, D.; Crenshaw, J.; Peterson, R.N.; Peterson, L.E.; Lyons, W.B. Groundwater discharge to the western Antarctic coastal ocean. Polar Res. 2019, 38, 11. [Google Scholar] [CrossRef]
- Dissanayake, A.L.; Yapa, P.D.; Nakata, K. Modelling of hydrothermal vent plumes to assess the mineral particle distribution. J. Hydraul. Res. 2014, 52, 49–66. [Google Scholar] [CrossRef]
- Tao, Y.; Rosswog, S.; Brüggen, M. A simulation modeling approach to hydrothermal plumes and its comparison to analytical models. Ocean Model. 2013, 61, 68–80. [Google Scholar] [CrossRef]
- Tao, C.; Chen, S.; Baker, E.T.; Li, H.; Liang, J.; Liao, S.; Chen, Y.J.; Deng, X.; Zhang, G.; Gu, C.; et al. Hydrothermal plume mapping as a prospecting tool for seafloor sulfide deposits: A case study at the Zouyu-1 and Zouyu-2 hydrothermal fields in the southern Mid-Atlantic Ridge. Mar. Geophys. Res. 2017, 38, 3–16. [Google Scholar] [CrossRef]
- Lavelle, J.W.; Massoth, G.J.; Baker, E.T.; de Ronde, C.E.J. Ocean current and temperature time series at Brothers volcano. J. Geophys. Res. Ocean 2008, 113. [Google Scholar] [CrossRef]
- Adler, D.; Murdoch, D.; Nenadic, O.; Urbanek, S.; Chen, M.; Gebhardt, A.; Bolker, B.; Csardi, G.; Strzelecki, A.; Senger, A.; et al. rgl: 3D Visualization Using OpenGL, 0.99.16. CRAN R-Project. 2018. Available online: https://CRAN.R-project.org/package=rgl (accessed on 28 August 2020).
- R Foundation for Statistical Computing. R: A Language and Environment for Statistical Computing, 3.6.1; R Foundation for Statistical Computing: Vienna, Australia, 2019. [Google Scholar]
- RStudio. RStudio: Integrated Development Environment for R, 1.2.5001; RStudio: Boston, MA, USA, 2019. [Google Scholar]
- Angel, B.M.; Apte, S.C.; Batley, G.E.; Raven, M.D. Lead solubility in seawater: An experimental study. Environ. Chem. 2016, 13, 489–495. [Google Scholar] [CrossRef]
- Fergusson, J.E. The heavy elements in water and sediments. In The Heavy Elements: Chemistry, Environmental Impact and Health Effects, 1st ed.; Fergusson, J.E., Ed.; Pergamon Press: Oxford, UK, 1990. [Google Scholar]
- Ozima, M.; Podosek, F.A. Chapter 4—Water. In Nobel Gas Geochemistry; Cambridge University Press: Cambridge, UK, 2001; Volume 2, pp. 98–122. [Google Scholar]
- Kleint, C.; Bach, W.; Diehl, A.; Fröhberg, N.; Garbe-Schönberg, D.; Hartmann, J.F.; de Ronde, C.E.J.; Sander, S.G.; Strauss, H.; Stucker, V.K.; et al. Geochemical characterization of highly diverse hydrothermal fluids from volcanic vent systems of the Kermadec intraoceanic arc. Chem. Geol. 2019, 528, 119289. [Google Scholar] [CrossRef]
- Sano, Y.; Fischer, T.P. The Analysis and Interpretation of Noble Gases in Modern Hydrothermal Systems. In The Noble Gases as Geochemical Tracers; Burnard, P., Ed.; Springer: Berlin/Heidelberg, Germany, 2013; pp. 249–317. [Google Scholar]
- Shimizu, A.; Sumino, H.; Nagao, K.; Notsu, K.; Mitropoulos, P. Variation in noble gas isotopic composition of gas samples from the Aegean arc, Greece. J. Volcanol. Geotherm. Res. 2005, 140, 321–339. [Google Scholar] [CrossRef]
- Gerringa, L.J.A.; Slagter, H.A.; Bown, J.; van Haren, H.; Laan, P.; de Baar, H.J.W.; Rijkenberg, M.J.A. Dissolved Fe and Fe-binding organic ligands in the Mediterranean Sea—GEOTRACES G04. Mar. Chem. 2017, 194, 100–113. [Google Scholar] [CrossRef]
- Kleint, C.; Hawkes, J.A.; Sander, S.G.; Koschinsky, A. Voltammetric Investigation of Hydrothermal Iron Speciation. Front. Mar. Sci. 2016, 3. [Google Scholar] [CrossRef]
- Feely, R.A.; Trefry, J.H.; Massoth, G.J.; Metz, S. A Comparison of the Scavenging of Phosphorus and Arsenic from Seawater by Hydrothermal Iron Oxyhydroxides in the Atlantic and Pacific Oceans. Deep-Sea Res. Part A 1991, 38, 617–623. [Google Scholar] [CrossRef]
- Rudnicki, M.D.; Elderfield, H. A Chemical-Model of the Buoyant and Neutrally Buoyant Plume above the Tag Vent Field, 26 Degrees-N, Mid-Atlantic Ridge. Geochim. Cosmochim. Acta 1993, 57, 2939–2957. [Google Scholar] [CrossRef]
- Millero, F.; Woosley, R.; DiTrolio, B.; Waters, J. Effect of Ocean Acidification on the Speciation of Metals in Seawater. Oceanography 2009, 22, 72–85. [Google Scholar] [CrossRef]
- Schlitzer, R.; Anderson, R.F.; Dodas, E.M.; Lohan, M.; Geibere, W.; Tagliabue, A.; Bowie, A.; Jeandel, C.; Maldonado, M.T.; Landing, W.M.; et al. The GEOTRACES Intermediate Data Product 2017. Chem. Geol. 2018, 493, 210–223. [Google Scholar] [CrossRef]
- Le Roy, E.; Sanial, V.; Lacan, F.; van Beek, P.; Souhaut, M.; Charette, M.A.; Henderson, P.B. Insight into the measurement of dissolved 227-Ac in seawater using radium delayed coincidence counter. Mar. Chem. 2019, 212, 64–73. [Google Scholar] [CrossRef]
- Reid, D.F.; Key, R.M.; Schink, D.R. Radium, thorium, and actinium extraction from seawater using an improved manganese-oxide-coated fiber. Earth Planet. Sci. Lett. 1979, 43, 223–226. [Google Scholar] [CrossRef]
- German, C.R.; Klinkhammer, G.P.; Edmond, J.M.; Mitra, A.; Elderfield, H. Hydrothermal scavenging of rare-earth elements in the ocean. Nature 1990, 345, 516–518. [Google Scholar] [CrossRef]
- German, C.R.; Fleer, A.P.; Bacon, M.P.; Edmond, J.M. Hydrothermal scavenging at the Mid-Atlantic Ridge: Radionuclide distributions. Earth Planet. Sci. Lett. 1991, 105, 170–181. [Google Scholar] [CrossRef]
- Sherrell, R.M.; Field, M.P.; Ravizza, G. Uptake and fractionation of rare earth elements on hydrothermal plume particles at 9 degrees 45′N, East Pacific Rise. Geochim. Cosmochim. Acta 1999, 63, 1709–1722. [Google Scholar] [CrossRef]
- Edmonds, H.N.; German, C.R. Particle geochemistry in the Rainbow hydrothermal plume, Mid-Atlantic Ridge. Geochim. Cosmochim. Acta 2004, 68, 759–772. [Google Scholar] [CrossRef]
- Lam, P.J.; Ohnemus, D.C.; Auro, M.E. Size-fractionated major particle composition and concentrations from the US GEOTRACES North Atlantic Zonal Transect. Deep-Sea Res. Part II-Top. Stud. Oceanogr. 2015, 116, 303–320. [Google Scholar] [CrossRef]
- Baker, E.T.; Feely, R.A.; De Ronde, C.E.J.; Massoth, G.J.; Wright, I.C. Submarine hydrothermal venting on the southern Kermadec volcanic arc front (offshore New Zealand): Location and extent of particle plume signatures. Geol. Soc. Lond. Spec. Publ. 2003, 219, 141–161. [Google Scholar] [CrossRef]
- Di Iorio, D.; Lavelle, J.W.; Rona, P.; Bemis, K.; Xu, G.; Germanovich, L.; Lowell, R.; Genc, G. Measurements and Models of Heat Flux and Plumes from Hydrothermal Discharges Near the Deep Seafloor. Oceanography 2012, 25, 168–179. [Google Scholar] [CrossRef]
- Wright, I.C. In situ modification of modern submarine hyaloclastic/pyroclastic deposits by oceanic currents: An example from the Southern Kermadec arc (SW Pacific). Mar. Geol. 2001, 172, 287–307. [Google Scholar] [CrossRef]
- Haase, K.M.; Stroncik, N.; Garbe-Schönberg, D.; Stoffers, P. Formation of island arc dacite magmas by extreme crystal fractionation: An example from Brothers Seamount, Kermadec island arc (SW Pacific). J. Volcanol. Geotherm. Res. 2006, 152, 316–330. [Google Scholar] [CrossRef]
- Haase, K.M.; Worthington, T.J.; Stoffers, P.; Garbe-Schönberg, D.; Wright, I. Mantle dynamics, element recycling, and magma genesis beneath the Kermadec Arc-Havre Trough. Geochem. Geophys. Geosyst. 2002, 3, 1–22. [Google Scholar] [CrossRef]
- Timm, C.; de Ronde, C.E.J.; Leybourne, M.I.; Layton-Matthews, D.; Graham, I.J. Sources of Chalcophile and Siderophile Elements in Kermadec Arc Lavas. Econ. Geol. 2012, 107, 1527–1538. [Google Scholar] [CrossRef]
- de Ronde, C.E.J.; Baker, E.T.; Massoth, G.J.; Lupton, J.E.; Wright, I.C.; Sparks, R.J.; Bannister, S.C.; Reyners, M.E.; Walker, S.L.; Greene, R.R.; et al. Submarine hydrothermal activity along the mid-Kermadec Arc, New Zealand: Large-scale effects on venting. Geochem. Geophys. Geosyst. 2007, 8. [Google Scholar] [CrossRef]
- Findlay, A.J.; Gartman, A.; Shaw, T.J.; Luther, G.W. Trace metal concentration and partitioning in the first 1.5 m of hydrothermal vent plumes along the Mid-Atlantic Ridge: TAG, Snakepit, and Rainbow. Chem. Geol. 2015, 412, 117–131. [Google Scholar] [CrossRef]
- Feely, R.A.; Baker, E.T.; Marumo, K.; Urabe, T.; Ishibashi, J.; Gendron, J.; Lebon, G.T.; Okamura, K. Hydrothermal plume particles and dissolved phosphate over the superfast-spreading southern East Pacific Rise. Geochim. Cosmochim. Acta 1996, 60, 2297–2323. [Google Scholar] [CrossRef]
- Lough, A.J.M.; Homoky, W.B.; Connelly, D.P.; Comer-Warner, S.A.; Nakamura, K.; Abyaneh, M.K.; Kaulich, B.; Mills, R.A. Soluble iron conservation and colloidal iron dynamics in a hydrothermal plume. Chem. Geol. 2019, 511, 225–237. [Google Scholar] [CrossRef]
- Boyle, E.A.; Bergquist, B.A.; Kayser, R.A.; Mahowald, N. Iron, manganese, and lead at Hawaii Ocean Time-series station ALOHA: Temporal variability and an intermediate water hydrothermal plume. Geochim. Cosmochim. Acta 2005, 69, 933–952. [Google Scholar] [CrossRef]
- Massoth, G.J.; Baker, E.T.; Lupton, J.E.; Feely, R.A.; Butterfield, D.A.; Von Damm, K.L.; Roe, K.K.; Lebon, G.T. Temporal and Spatial Variability of Hydrothermal Manganese and Iron at Cleft Segment, Juan-De-Fuca Ridge. J. Geophys. Res. Solid Earth 1994, 99, 4905–4923. [Google Scholar] [CrossRef]
- Morgan, J.J. Kinetics of reaction between O-2 and Mn(II) species in aqueous solutions. Geochim. Cosmochim. Acta 2005, 69, 35–48. [Google Scholar] [CrossRef]
- Cowen, J.P.; Bertram, M.A.; Baker, E.T.; Feely, R.A.; Massoth, G.J.; Summit, M. Geomicrobial transformation of manganese in Gorda Ridge event plumes. Deep Sea Res. Part II 1998, 45, 2713–2737. [Google Scholar] [CrossRef]
- Cowen, J.P.; Massoth, G.J.; Feely, R.A. Scavenging Rates of Dissolved Manganese in a Hydrothermal Vent Plume. Deep-Sea Res. Part A-Oceanogr. Res. Pap. 1990, 37, 1619–1637. [Google Scholar] [CrossRef]
- Mandernack, K.W.; Tebo, B.M. Manganese Scavenging and Oxidation at Hydrothermal Vents and in Vent Plumes. Geochim. Cosmochim. Acta 1993, 57, 3907–3923. [Google Scholar] [CrossRef]
- Li, M.; Toner, B.M.; Baker, B.J.; Breier, J.A.; Sheik, C.S.; Dick, G.J. Microbial iron uptake as a mechanism for dispersing iron from deep-sea hydrothermal vents. Nat. Commun. 2014, 5, 3192. [Google Scholar] [CrossRef] [PubMed]
- Böhnke, S.; Sass, K.; Gonnella, G.; Diehl, A.; Kleint, C.; Bach, W.; Zitoun, R.; Koschinsky, A.; Indenbirken, D.; Sander, S.G.; et al. Parameters Governing the Community Structure and Element Turnover in Kermadec Volcanic Ash and Hydrothermal Fluids as Monitored by Inorganic Electron Donor Consumption, Autotrophic CO2 Fixation and 16S Tags of the Transcriptome in Incubation Experiments. Front. Microbiol. 2019, 10. [Google Scholar] [CrossRef] [PubMed]
- Campbell, A.C.; Gieskes, J.M.; Lupton, J.E.; Lonsdale, P.F. Manganese geochemistry in the Guaymas Basin, Gulf of California. Geochim. Cosmochim. Acta 1988, 52, 345–357. [Google Scholar] [CrossRef]
- Rosenberg, N.D.; Lupton, J.E.; Kadko, D.; Collier, R.; Lilley, M.D.; Pak, H. Estimation of heat and chemical fluxes from a seafloor hydrothermal vent field using radon measurements. Nature 1988, 334, 604–607. [Google Scholar] [CrossRef]
- Zeng, Z.; Wang, X.; Chen, C.-T.A.; Qi, H. Understanding the Compositional Variability of the Major Components of Hydrothermal Plumes in the Okinawa Trough. Geofluids 2018, 2018, 1536352. [Google Scholar] [CrossRef]
- Ozima, M.; Podosek, F.A. Chapter 6—Mantle. In Nobel Gas Geochemistry; Cambridge University Press: Cambridge, UK, 2001; Volume 2, pp. 160–216. [Google Scholar]
- de Ronde, C.E.J.; Baker, E.T.; Massoth, G.J.; Lupton, J.E.; Wright, I.C.; Feely, R.A.; Greene, R.R. Intra-oceanic subduction-related hydrothermal venting, Kermadec volcanic arc, New Zealand. Earth Planet. Sci. Lett. 2001, 193, 359–369. [Google Scholar] [CrossRef]
- Tagliabue, A.; Resing, J. Impact of hydrothermalism on the ocean iron cycle. Philos. Trans. R. Soc. A-Math. Phys. Eng. Sci. 2016, 374. [Google Scholar] [CrossRef] [PubMed]
- Van Hulten, M.; Middag, R.; Dutay, J.-C.; de Baar, H.; Roy-Barman, M.; Gehlen, M.; Tagliabue, A.; Sterl, A. Manganese in the west Atlantic Ocean in the context of the first global ocean circulation model of manganese. Biogeosciences 2017, 14, 1123–1152. [Google Scholar] [CrossRef]


| Sample ID | Lat (°N) | Long (°E) | Depth (m) | Bot. Depth (m) | 223Ra | ex223Ra | 224Ra | ex224Ra | 227Ac | 228Th | 228Ra | Age (d) |
|---|---|---|---|---|---|---|---|---|---|---|---|---|
| 046_CTD_2 | −34.88805 | 179.07148 | 1515 | 1568 | 0.1 ± 0.1 | 0.1 ± 0.1 | 0.6 ± 0.1 | 0.3 ± 0.1 | bdl | 0.4 ± 0.1 | bdl | bdl |
| 046_CTD_4 | −34.86511 | 179.06066 | 1580 | 1720 | bdl | bdl | bdl | bdl | bdl | 0.2 ± 0.1 | 2.2 ± 0.7 | bdl |
| 046_CTD_16 | −34.89903 | 179.07667 | 1568 | 1800 | 0.1 ± 0.1 | 0.02 ± 0.1 | 0.3 ± 0.1 | 0.2 ± 0.1 | 0.03 ± 0.02 | 0.1 ± 0.04 | 0.5 ± 0.3 | 14.2 ± 10.9 |
| 049_CTD_7 | −34.87098 | 179.08095 | 1538 | 1630 | 0.2 ± 0.1 | 0.2 ± 0.1 | 0.9 ± 0.2 | 0.6 ± 0.2 | bdl | 0.3 ± 0.1 | 0.3 ± 0.9 | bdl |
| 049_CTD_17 | −34.89525 | 179.05508 | 1557 | 1830 | 0.2 ± 0.1 | 0.2 ± 0.1 | 0.4 ± 0.2 | 0.1 ± 0.2 | 0.03 ± 0.02 | 0.2 ± 0.1 | 0.1 ± 0.3 | 32.7 ± 7.4 |
| 050_Pumps_B | −34.86213 | 179.05923 | 1497 | 1712 | 0.1 ± 0.02 | 0.1 ± 0.1 | 0.6 ± 0.1 | 0.5 ± 0.4 | bdl | 0.02 ± 0.01 | 0.4 ± 0.1 | 15.2 ± 6.4 |
| 050_Pumps_A | −34.86213 | 179.05923 | 1519 | 1712 | 0.1 ± 0.02 | 0.1 ± 0.02 | 0.9 ± 0.1 | 0.9 ± 0.1 | 0.02 ± 0.01 | 0.1 ± 0.01 | 0.3 ± 0.1 | 8.9 ± 6.4 |
| 050_Pumps_S | −34.86213 | 179.05923 | 1547 | 1712 | 0.3 ± 0.1 | 0.3 ± 0.02 | 4.1 ± 0.4 | 4.0 ± 0.1 | 0.03 ± 0.02 | 0.1 ± 0.02 | 1.6 ± 0.4 | 9.6 ± 6.3 |
| 050_Pumps_H | −34.86213 | 179.05923 | 1567 | 1712 | 0.1 ± 0.03 | 0.1 ± 0.03 | 3.3 ± 0.1 | 3.3 ± 0.1 | 0.01 ± 0.01 | 0.1 ± 0.01 | 0.9 ± 0.1 | 5.5 ± 6.2 |
| 050_Pumps_V | −34.86213 | 179.05923 | 1587 | 1712 | 0.3 ± 0.1 | 0.3 ± 0.1 | 7.3 ± 0.6 | 7.1 ± 0.6 | 0.03 ± 0.01 | 0.2 ± 0.04 | 1.9 ± 0.6 | 5.7 ± 6.2 |
| 053_CTD_2 | −34.8491 | 179.05017 | 1604 | 1708 | bdl | bdl | 3.7 ± 0.5 | 3.5 ± 0.5 | bdl | 0.3 ± 0.1 | 1.6 ± 0.8 | bdl |
| 053_CTD_5 | −34.84913 | 179.05017 | 1486 | 1708 | 0.3 ± 0.1 | 0.3 ± 0.1 | 4.1 ± 0.3 | 3.9 ± 0.3 | bdl | 0.2 ± 0.05 | 2.8 ± 0.7 | bdl |
| 053_CTD_10 | −34.87051 | 179.05037 | 1462 | 1708 | 0.1 ± 0.1 | 0.1 ± 0.1 | 2.2 ± 0.3 | 1.9 ± 0.3 | bdl | 0.3 ± 0.1 | 0.3 ± 0.7 | bdl |
| 054_CTD_1 | −34.87911 | 179.05042 | 1750 | 1804 | 0.1 ± 0.1 | 0.01 ± 0.1 | 0.2 ± 0.1 | 0.1 ± 0.2 | 0.1 ± 0.04 | 0.1 ± 0.04 | 0.01 ± 0.3 | 15.0 ± 9.8 |
| 054_CTD_5 | −34.88058 | 179.05042 | 1560 | 1804 | 0.1 ± 0.1 | 0.1 ± 0.1 | 1.7 ± 0.2 | 1.6 ± 0.2 | bdl | 0.2 ± 0.04 | 1.6 ± 0.5 | bdl |
| 054_CTD_9 | −34.94658 | 179.09878 | 1440 | 1804 | 0.1 ± 0.1 | 0.1 ± 0.1 | 0.5 ± 0.1 | 0.3 ± 0.1 | bdl | 0.2 ± 0.1 | 0.6 ± 0.5 | bdl |
| 059_Pumps_S | −34.94658 | 179.09878 | 1440 | 1806 | 0.04 ± 0.02 | 0.02 ± 0.01 | 0.3 ± 0.1 | 0.2 ± 0.05 | 0.02 ± 0.01 | 0.1 ± 0.02 | 0.4 ± 0.2 | 13.7± 7.3 |
| 059_Pumps_H | −34.94658 | 179.09878 | 1500 | 1806 | 0.1 ± 0.01 | 0.1 ± 0.03 | 0.2 ± 0.05 | 0.2 ± 0.1 | 0.01 ± 0.01 | 0.03 ± 0.01 | 0.02 ± 0.1 | 22.3 ± 6.5 |
| 059_Pumps_V | −34.94658 | 179.09878 | 1600 | 1806 | 0.1 ± 0.03 | 0.1 ± 0.02 | 1.1 ± 0.1 | 1.0 ± 0.1 | 0.03 ± 0.01 | 0.1 ± 0.02 | 0.7 ± 0.2 | 14.0 ± 6.2 |
| 062_CTD_1 | −34.8491 | 179.05017 | 1607 | 1638 | 0.1 ± 0.1 | 0.1 ± 0.1 | 0.3 ± 0.4 | 0.03 ± 0.4 | bdl | 0.3 ± 0.1 | bdl | bdl |
| 062_CTD_3 | −34.84913 | 179.05017 | 1486 | 1638 | 0.04 ± 0.1 | 0.04 ± 0.1 | 1.3 ± 0.3 | 1.1 ± 0.3 | bdl | 0.2 ± 0.1 | bdl | bdl |
| 062_CTD_7 | −34.87051 | 179.05037 | 1462 | 1522 | 0.1 ± 0.1 | 0.02 ± 0.1 | 0.5 ± 0.4 | 0.2 ± 0.4 | 0.1 ± 0.05 | 0.3 ± 0.1 | 1.6 ± 0.8 | 14.0 ± 10.3 |
| 062_CTD_13 | −34.87912 | 179.05042 | 1524 | 1577 | 0.1 ± 0.1 | 0.04 ± 0.1 | 0.1 ± 0.1 | bdl | 0.02 ± 0.01 | 0.1 ± 0.1 | 0.5 ± 0.3 | bdl |
| 062_CTD_18 | −34.88058 | 179.05042 | 1404 | 1645 | 0.2 ± 0.1 | 0.1 ± 0.1 | 0.1 ± 0.2 | 0.01 ± 0.2 | 0.1 ± 0.02 | 0.1 ± 0.1 | bdl | 53.9 ± 10.4 |
| 068_CTD_2 | −34.86103 | 179.05767 | 1407 | 1431 | 0.2 ± 0.1 | 0.1 ± 0.1 | 0.6 ± 0.1 | 0.4 ± 0.2 | 0.05 ± 0.02 | 0.1 ± 0.03 | 1.0 ± 0.4 | 21.5 ± 6.9 |
| 069_CTD_1 | −34.85918 | 179.05175 | 1550 | 2204 | 0.1 ± 0.03 | 0.1 ± 0.04 | 0.1 ± 0.1 | 0.1 ± 0.1 | 0.1 ± 0.02 | 0.03 ± 0.01 | 0.2 ± 0.1 | 27.5 ± 7.5 |
| 081_Niskin | −34.9188 | 179.08602 | 1616 | 1619 | 0.2 ± 0.1 | 0.21 ± 0.1 | 3.7 ± 0.5 | 3.3 ± 0.5 | bdl | 0.4 ± 0.2 | 4.0 ± 1.5 | 9.2 ± 7.9 |
| Excess 223Ra | Excess 224Ra | |
|---|---|---|
| Ravent (dpm/100 L) | 51.3 ± 21.6 | 2175 ± 236 |
| Raoce (dpm/100 L) | 0.07 ± 0.04 | 0.03 ± 0.1 |
| Raplume (dpm/100 L) | 0.11 ± 0.06 | 1.4 ± 0.2 |
| Tplume (d) | 17.7 ± 7.6 | 17.7 ± 7.6 |
| Vplume (km3) | 7.34 ± 7.34 | 8.13 ± 8.13 |
| SHD (m3/s) | 8.2 (0–25.5) | 14.5 (0–29.6) |
| Used Isotope | Length (m) | Width (m) | Height (m) | Corrected Volume (km3) |
|---|---|---|---|---|
| excess 224Ra | 13,850 | 3473 | 345 | 8.13 |
| excess 223Ra | 12,964 | 3577 | 327 | 7.34 |
| Sample ID | Lat (° N) | Long (° E) | Depth (m) | 3He (fmol/L) | 4He (nmol/L) | He (nmol/L) | Ne/He | R/RA |
|---|---|---|---|---|---|---|---|---|
| 46_CTD_2 | −34.85083333 | 179.0539167 | 1500 | 3.57 | 1.93 | 1.935 | 4.144 | 1.33 |
| 46_CTD_4 | −34.86228333 | 179.0593333 | 1576 | 4.69 | 2.06 | 2.063 | 3.887 | 1.64 |
| 46_CTD_6 | −34.86938333 | 179.0626833 | 1584 | 3.45 | 1.93 | 1.930 | 4.147 | 1.29 |
| 46_CTD_8 | −34.87981667 | 179.0676167 | 1278 | 3.28 | 1.87 | 1.874 | 4.170 | 1.26 |
| 46_CTD_12 | −34.88805000 | 179.0714833 | 1350 | 2.96 | 1.85 | 1.848 | 4.286 | 1.15 |
| 53_CTD_5 | −34.86230000 | 179.0593667 | 1549 | 5.38 | 2.11 | 2.105 | 3.812 | 1.84 |
| 53_CTD_10 | −34.86230000 | 179.0593667 | 1478 | 3.88 | 1.95 | 1.948 | 4.083 | 1.43 |
| 53_CTD_12 | −34.86230000 | 179.0593667 | 1400 | 2.95 | 1.87 | 1.871 | 4.262 | 1.13 |
| 53_CTD_13 | −34.86230000 | 179.0593667 | 1323 | 2.88 | 1.85 | 1.847 | 4.294 | 1.12 |
| 53_CTD_14 | −34.86230000 | 179.0593667 | 1000 | 2.49 | 1.81 | 1.808 | 4.320 | 0.99 |
| 57_CTD_17 | −34.88135000 | 179.0799167 | 1518 | 4.28 | 1.98 | 1.981 | 3.994 | 1.55 |
| 58_CTD_4 | −34.87895000 | 179.0750500 | 1229 | 3.11 | 1.86 | 1.861 | 4.219 | 1.20 |
| 61_ROV_10F | −34.86248333 | 179.0579333 | 1656 | 4.21 | 2.00 | 2.000 | 4.039 | 1.52 |
| 64_ROV_6F | −34.86103333 | 179.0576667 | 1594 | 19.01 | 3.47 | 3.470 | 2.307 | 3.94 |
| 82_CTD_4 | −34.76586667 | 179.0145000 | 1600 | 3.06 | 1.90 | 1.897 | 4.271 | 1.16 |
| 82_CTD_8 | −34.76586667 | 179.0145000 | 1450 | 2.92 | 1.87 | 1.871 | 4.270 | 1.12 |
| 82_CTD_10 | −34.76586667 | 179.0145000 | 1349 | 2.76 | 1.84 | 1.838 | 4.299 | 1.08 |
| Fe | Mn | 3He (×10−12) | 4He (×10−6) | Pb (×10−6) | |
|---|---|---|---|---|---|
| Conc. Vent (mmol/L) | 6.27 ± 3.57 | 0.75 ± 0.76 | ◇ 53.09 ± 0.16 | ◇ 5.25 ± 0.13 | 21.0 ± 11.8 |
| Flux (mol/s) | 71.2 (0–173) | 8.6 (0–20.8) | 603 (0–1464) | 59.6 (0–145) | [238 (0–578)] |
| Conc. plume (mmol/L) | 0.013 ± 0.019 | 0.005 ± 0.005 | 19.01 ± 0.38 | 3.47 ± 0.04 | * 1.35 ± 1.35 |
| Flux (mol/s) | 0.15 (0–0.36) | 0.06 (0–0.14) | 216 (0–524) | 39.4 (0–95.7) | [15.3 (0–37.2)] |
| Scenario | Concentration | Fe (nmol/L) | Mn (nmol/L) | 3He (fmol/L) | 4He (nmol/L) | Pb (pmol/L) |
|---|---|---|---|---|---|---|
| Scenario 1 Total plume | Mean calc. conc. | 30.3 (0–85) | 15.5 (0–43) | 3.07 (0–8.6) | 1.89 (0–5.3) | [3.73 (0–10.4)] |
| Median measured conc. | 10.4 (0–63) | 8.94 (0–29) | 3.06 (2.4–3.8) | 1.87 (1.8–1.9) | 20.9 (0–47.0) | |
| Factor | 2.9 | 1.7 | 1.00 | 1.01 | [0.18] | |
| Scenario 2 inner caldera plume | Mean calc. conc. | 88.1 (0–247) | 38.3 (0–107) | 3.30 (0–9.3) | 1.91 (0–5.4) | [9.73 (0–27)] |
| Median measured conc. | 12.1 (0–79) | 16.6 (0–42) | 3.13 (2.3–3.9) | 1.87 (1.8–2.0) | 26.1 (18–34.6) | |
| Factor | 7.3 | 2.3 | 1.05 | 1.02 | 0.37 | |
| Local background conc. | 1.07 | 3.97 | 2.95 | 1.87 | [0.7] | |
| Location | Location Category | Volume (m3/s) | Fe (mol/s) | Mn (mol/s) | 3He (pmol/s) | 4He (µmol/s) |
|---|---|---|---|---|---|---|
| Brothers NW caldera, hot fluids 1 | Island arc | 11.4 | 71.2 | 8.6 | 603 | 59.6 |
| Brothers NW caldera, Niskin 1 | Island arc | 11.4 | 0.15 | 0.06 | 216 | 39.4 |
| Endeavour vent field, JDFR–min 2 | MOR | 10,000 | 0.27 | 44,600 | 4460 | |
| Endeavour vent field, JDFR–max 2 | MOR | 30,000 | 0.73 | 44,600 | 4460 | |
| Cleft Segment, JDFR 3 | MOR | 0.61 | 0.36 | |||
| Rainbow vent field 4 | MOR | 0.45 | 9.6 | 0.9 | 7600 | |
| Logatchev vent field 5 | MOR | 0.9 | 20,000 | |||
| Ahyi Seamount, Northern Mariana Island 6 | Island arc | 0.14 | 0.0016 * | 8400 | ||
| Vailulu´u Seamount, Samoan chain 7 | Hot spot seamount | 1504 | 0.06 | |||
| Okinawa Trough, individual vent–min 8 | Back arc basin | 0.05 | ||||
| Okinawa Trough, individual vent–max 8 | Back arc basin | 2.93 |
Publisher’s Note: MDPI stays neutral with regard to jurisdictional claims in published maps and institutional affiliations. |
© 2020 by the authors. Licensee MDPI, Basel, Switzerland. This article is an open access article distributed under the terms and conditions of the Creative Commons Attribution (CC BY) license (http://creativecommons.org/licenses/by/4.0/).
Share and Cite
Neuholz, R.; Kleint, C.; Schnetger, B.; Koschinsky, A.; Laan, P.; Middag, R.; Sander, S.; Thal, J.; Türke, A.; Walter, M.; et al. Submarine Hydrothermal Discharge and Fluxes of Dissolved Fe and Mn, and He Isotopes at Brothers Volcano Based on Radium Isotopes. Minerals 2020, 10, 969. https://doi.org/10.3390/min10110969
Neuholz R, Kleint C, Schnetger B, Koschinsky A, Laan P, Middag R, Sander S, Thal J, Türke A, Walter M, et al. Submarine Hydrothermal Discharge and Fluxes of Dissolved Fe and Mn, and He Isotopes at Brothers Volcano Based on Radium Isotopes. Minerals. 2020; 10(11):969. https://doi.org/10.3390/min10110969
Chicago/Turabian StyleNeuholz, René, Charlotte Kleint, Bernhard Schnetger, Andrea Koschinsky, Patrick Laan, Rob Middag, Sylvia Sander, Janis Thal, Andreas Türke, Maren Walter, and et al. 2020. "Submarine Hydrothermal Discharge and Fluxes of Dissolved Fe and Mn, and He Isotopes at Brothers Volcano Based on Radium Isotopes" Minerals 10, no. 11: 969. https://doi.org/10.3390/min10110969
APA StyleNeuholz, R., Kleint, C., Schnetger, B., Koschinsky, A., Laan, P., Middag, R., Sander, S., Thal, J., Türke, A., Walter, M., Zitoun, R., & Brumsack, H.-J. (2020). Submarine Hydrothermal Discharge and Fluxes of Dissolved Fe and Mn, and He Isotopes at Brothers Volcano Based on Radium Isotopes. Minerals, 10(11), 969. https://doi.org/10.3390/min10110969