Article

Economic and Socio-Environmental Benefits of Dry Beneficiation of Magnetite Ores

by
Emmanuel Baawuah
1,*,
Christopher Kelsey
2,
Jonas Addai-Mensah
1,3 and
William Skinner
1
1
Future Industries Institute, University of South Australia, Mawson Lakes, SA 5000, Australia
2
Kelsey Engineering Pty. Limited, 83A Proctor Road, Hope Forest, SA 5172, Australia
3
Department of Mining and Process Engineering, Namibia University of Science and Technology, 13388 Windhoek, Namibia
*
Author to whom correspondence should be addressed.
Minerals 2020, 10(11), 955; https://doi.org/10.3390/min10110955
Submission received: 6 October 2020 / Revised: 21 October 2020 / Accepted: 22 October 2020 / Published: 26 October 2020
(This article belongs to the Section Mineral Processing and Extractive Metallurgy)

Abstract

:
In our previous studies, we demonstrated the performance of novel superfine crusher and pneumatic planar magnetic separator as energy-efficient technologies for dry processing of magnetite ores. The present study investigates the economic and socio-environmental benefits of applying these technologies in conceptual dry magnetite ore processing flowsheet. The outcome of the study is compared with that of a conceptual wet processing flowsheet for the same ore. The cost estimations used are based on the Brook Hunt C1 methodology whilst revenue estimations are based on the Platts Iron Ore Index specification. The demonstrated economic and socio-environmental benefits show that dry processing flowsheet offers significant energy and cost savings and improved revenue generation compared with the wet process flowsheet. These findings are vital to the magnetite industry, particularly in water- and energy-scarce regions as a benchmark for future studies aimed at deepening and expanding the knowledge base of dry beneficiation of magnetite ores.

1. Introduction

Iron (Fe) ores play a significant role in the global mining industry judging by the high tonnes of ore processed yearly and the associated energy, water, and tailings storage facility (TSF) requirements [1]. Historically, the steel industry has been supported by iron products sourced from hematite and magnetite ores. Unlike the high-grade hematite ores which are easily processed into saleable iron products, through crushing, grinding or milling, concentration by screening, and/or using hydraulic or magnetic classification [2], magnetite ores require extensive beneficiation to produce iron concentrates. This is because most magnetite ores are fine-grained and mineralogically complex, require fine and ultrafine milling (usually finer than 45 µm) [3] to sufficiently liberate the magnetite mineral from the predominantly silica gangue. Typical magnetite beneficiation is carried out as a wet process, and it consists of comminution, wet magnetic separation (to concentrate the magnetite mineral), reverse flotation (for silica removal), and concentrate dewatering.
Most magnetite comminution circuits commonly consist of a high capacity autogenous (AG) and/or conventional Semi-autogenous ball mill crusher (SABC) process. For example, the North American subsidiary of Cleveland-Cliffs Inc. uses an AG milling circuit consisting of an AG mill followed by cobber magnetic separation, pebble milling of the magnetic concentrate which is followed by magnetic separation and silica flotation. The concentration plant has a processing capacity of 8 million tonnes (Mt) per annum, with a target grind size varying between 90% and 95% passing 32 µm depending on the ore type [3]. Additionally, CITIC Pacific in Western Australia operates the largest AG mill in the world which has a diameter of 12.2 m, length of 11 m, and equipped with a 28 MW gearless motor [4]. The LKAB iron ore operations in Sweden process high-grade magnetite ore through an AG milling circuit with a throughput of 500 to 582 t/h to achieve product P80 of 45 µm [5].
Since the conventional SABC milling circuits are not efficient in achieving the required magnetite liberation sizes, usually less than 45 µm, IsaMill™ and stirred media mills have recently been introduced into magnetite comminution flowsheets. In 2011, the first IsaMill was successfully commissioned in Xstrata Coppers’ Ernest Henry Mine (EHM) magnetite plants. The magnetite concentrator produces 1.2 Mt of magnetite concentrate per annum. The 3 MW M10000 installed IsaMill grinds the magnetite concentrate (with particle size ranging between 150 to 200 µm) from the rougher magnetic separation stage to generate 40 µm to 45 µm product before final cleaner magnetic separation to produce the final concentrate [6]. In 2014, SIMEC Mining commissioned a 3 MW M10000 IsaMill at their magnetite concentrator in the South Middleback Ranges of South Australia. The IsaMill is designed to grind feed with a particle size of 60 µm to generate a product with a particle size of P80 of 32 µm at a throughput of 300 t/h [7]. The Karara magnetite concentrator in Western Australia has four TowerMills (ETM 1500) installed for tertiary grinding duties. The TowerMill circuit receives a ball mill product with a particle size of about 50 µm and reduces it to a product particle size of about 35 µm to prepare the feed for reverse flotation operations. The TowerMill circuit has an installed power of 1028 kW and a feed rate of 300 t/h with a circulating load of 129% [8,9].
A study by Palaniandy and Ishikawa [9] showed that TowerMill is 30 to 35% more energy-efficient than ball mill in fine grinding duties below 100 µm. Moreover, the specific energy requirement of the TowerMill is estimated to be 30 to 48% lower than that of a ball mill [9]. Although the introduction of ultrafine milling increases comminution energy efficiency and unlocks more magnetite resources, it also results in a significant increase in the capital and operating costs of magnetite projects.
The current mining climate has seen more mineral projects being developed in remote and arid regions such as Australia, the Andes, and the Sahara Desert [10]. For example, Australia is the driest continent globally and is home to some of the largest magnetite production in the world. Examples of magnetite operations in Australia are Savage River, Karara, SIMEC Mining, and the Sino Iron Project. The Sino Iron Project in the Pilbara region of Western Australia is the largest magnetite mining and processing operation in Australia. The cost associated with comminution energy requirement and infrastructure and the scarcity of potable water for mineral processing within such dry regions remains major bottlenecks for the economic viability of such resources and cognate commercial projects located within such regions. Moreover, wet processing of such finely ground feed particles negatively affects magnetic separation and concentrate and tailings dewatering. Another challenge associated with wet beneficiation of magnetite is the need to store process effluents. Traditionally, effluents from mineral processing operations are disposed into TSF where the fine particles settle slowly, and clarified water harvested for reuse in the plant operations. Since TSFs are required to accommodate large quantities of solids and water, the design, construction, and maintenance of tailings impoundments require huge capital expenditure to ensure the necessary infrastructure with structural integrity is achieved and maintained. Moreover, the legacy costs of TSF management, maintenance, and/or remediation can be significant. Potentially disastrous iron ore waste tailings impoundment dam failure also poses a significant threat to life, properties, and health [11]. For example, in January 2019, the tailings dam of one of Vale’s iron ore mines in Brazil collapsed killing 270 people with more than 180 people reported missing [12]. These challenges bring substantial economic uncertainties to large-scale, heavily capitalized wet mineral processing operations.
Given these challenges, the application of dry processing technologies in iron ore beneficiation is a topical area of research, and current technological innovations are aimed at improved comminution energy efficiency and developing technologies for dry beneficiation of magnetite ores [13]. The successful introduction of high pressure grinding roll (HPGR) and IsaMills along with stirred media milling into the iron ore industry in the last two decades is among the success stories achieved in this effort [14]. However, no significant breakthrough has been introduced for the dry processing of magnetite ores, i.e., dry comminution through to dry magnetic separation. In our previous studies, we investigated the performance of a novel superfine crusher (SFC) [15] and a pneumatic planar magnetic separator (PMS) [16,17] as dry comminution and magnetic separation technologies, respectively, for processing fine-grained magnetite ores.
The SFC is a media-free, energy-efficient crusher which consists of a vertically mounted compression chamber with an internal gyrating mandrel. The description of the SFC, its mode of operation, and how its operational parameters affect its performances have been presented by Baawuah et al. [18], Batterham et al. [19], and Kelsey et al. [20]. Baawuah et al. [15] studied and compared the grinding efficiency of the SFC and HPGR and demonstrated that in comminuting a selected magnetite ore at identical net specific energy (NSE) input (~1.60 kWh/t), the SFC achieved a higher particle reduction ratio, operated at a lower operating work index (Wio), and lower size-specific energy (SSE) at 75 µm than the HPGR. In subsequent studies by Baawuah et al. [16] using the same magnetite ore, the performance of the PMS in dry beneficiation of the finely ground magnetite ore feed was investigated and the outcomes were compared with those of wet drum low-intensity magnetic separator (WLIMS). The study demonstrated that the PMS produced cleaner magnetite concentrate than that of the WLIMS. The results summarized in Table 1 and Table 2 clearly demonstrate that the SFC and PMS provide energy-efficient dry processing alternative of magnetite ores over conventional wet processing flowsheets. However, for a mineral project to be worthwhile for investment, it must be profitable. This is because mineral projects are highly capital intensive and consequently it is essential to evaluate their economic potential before committing investment resources into them.
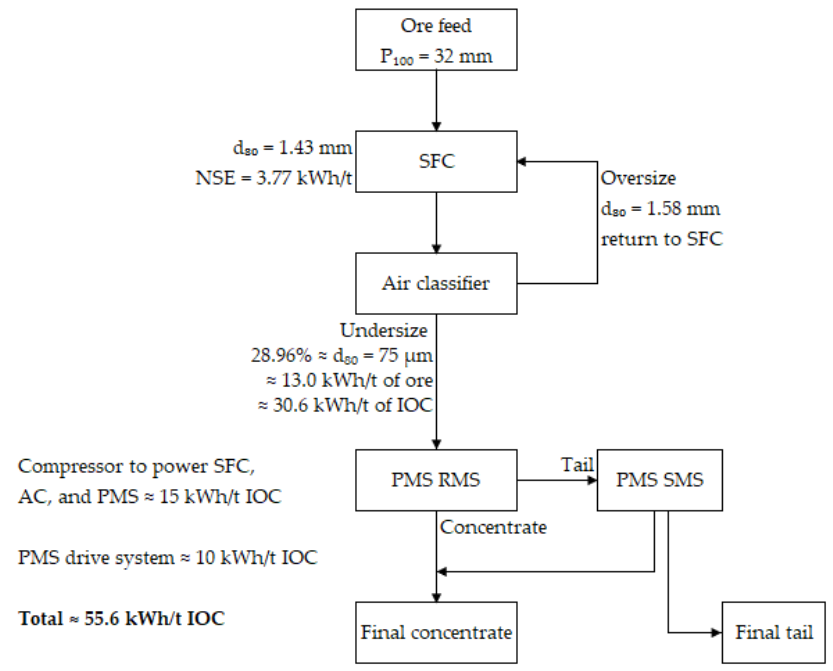
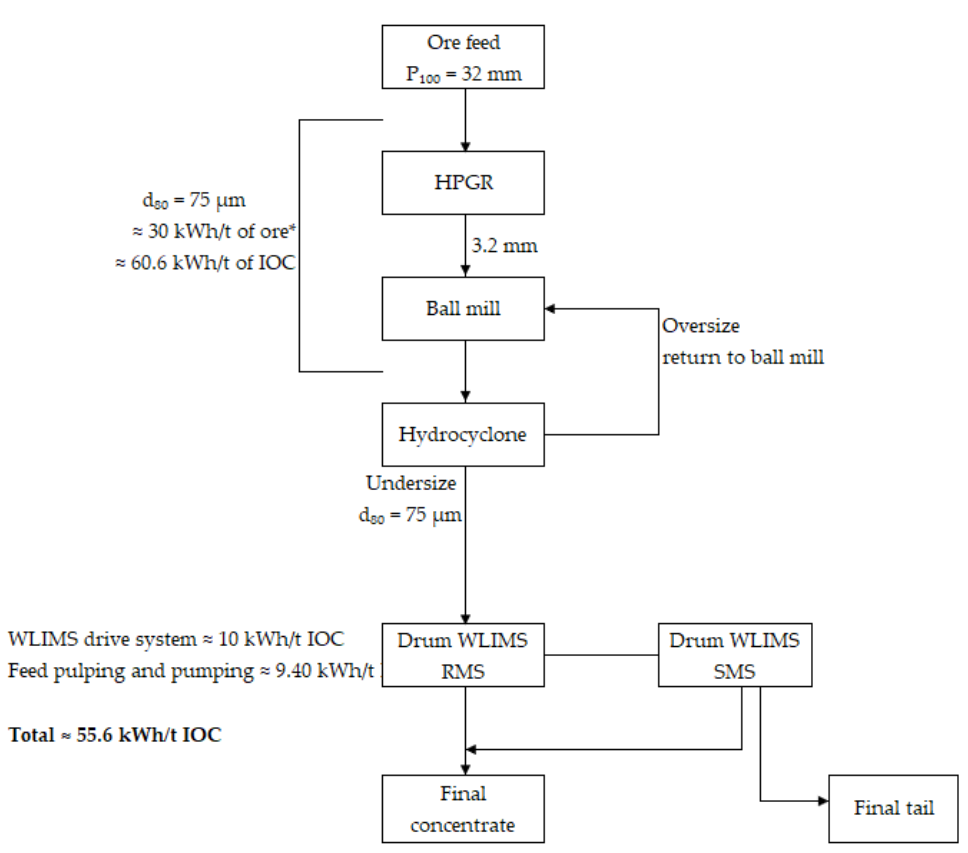
This study aims to investigate the potential economic benefits of a conceptual dry beneficiation flowsheet (Flowsheet 1) of hard, fine-grained magnetite ore involving the SFC and PMS and to compare the outcome with a conceptual wet beneficiation flowsheet (Flowsheet 2) for the same ore. Flowsheet 2 involves an HPGR and ball mill comminution circuit followed by WLIMS. The study uses the application of typical conceptual assessment methodologies used by engineering companies and aims to address the following research questions:
  • What is the operating cost for a conceptual dry magnetite processing flowsheet involving the SFC and PMS?
  • What is the operating cost for a conceptual wet magnetite processing flowsheet involving the HPGR, ball mill, and WLIMS?
  • How sensitive are the estimated costs and revenues of both the dry and wet conceptual flowsheets on the profit margins?
  • What are the economic benefits in terms of energy, water, and cost savings and environmental and social acceptance that may be expected from using the conceptual dry processing flowsheet compared with the conceptual wet processing flowsheet?

2. Methodology

2.1. Flowsheet 1—Dry Beneficiation

The SFC was operated in a close circuit with an air classifier (AC) and the oversize from the AC was returned to the SFC for further size reduction. Unlike most conventional crushers where the crushed products exit the crushing chamber by gravity, the SFC’s crushed product is drawn out of its crushing chamber using an AC. The air classifier operating frequency was adjusted to generate a product (classifier overflow) with a P80 of 75 µm. The SFC was equipped with an online power logger to record the power consumption which is used to calculate the comminution energy per tonne of ore (kWh/t). The outcome of this study has been presented by Baawuah et al. [15] and a summary is presented in Table 1.
The concentration of the magnetite mineral was achieved using the PMS. The dry magnetic separation circuit involved a rougher magnetic separator (RMS) followed by a scavenger magnetic separator (SMS). The tailings from the RMS were subjected to SMS and the concentrates from both streams are combined as the final concentrate. After each test, the concentrate and tailings were assayed using an X-ray fluorescence (XRF) analyzer to determine their respective elemental compositions. Based on the concentrate mass yield, the comminution energy per tonne of iron oxide concentrate (IOC) was determined and used in the cost estimation. The outcomes from the study have been presented by Baawuah et al. [16] and a summary is presented in Table 2. The beneficiation circuit and energy balance for Flowsheet 1 are shown in Figure 1.

2.2. Flowsheet 2—Wet Beneficiation

Wet processing of magnetite ores has been extensively researched and documented. The comminution circuit used for this conceptual flowsheet is based on designs that are currently used in magnetite concentrators in South Australia. The energy consumptions used in estimating the comminution energy are based on published data. However, for consistency with the magnetic separation studies with Flowsheet 1, the same feed material was used for both Flowsheets 1 and 2.
For Flowsheet 2, the magnetite concentration was achieved using an Eriez series L8 model WLIMS at a feed pulp density of 30% solids. Like Flowsheet 1, the magnetic separation circuit of Flowsheet 2 consisted of RMS and SMS stages. The tailings from the RMS were subjected to SMS and the concentrates from both streams are combined as the final concentrate as in Flowsheet 1. After the tests, the concentrates and tailings were dewatered using a pressure filter. The filter cake was dried, weighed, and assayed for the respective elemental compositions. The outcome of this study is presented by Baawuah et al. [16] and a summary of some of the key findings with the energy balance is presented in Table 2. Figure 2 shows the conceptual beneficiation circuit for Flowsheet 2.

2.3. Economic Calculations

The key evaluation metric used for the economic analysis was the profit margin of Flowsheet 1 over Flowsheet 2. The profit for each flowsheet was calculated by subtracting the total cost incurred to produce one tonne of IOC from the total revenue gained from the sale of one tonne of IOC. In this study, a positive profit margin means that Flowsheet 1 is more economical than Flowsheet 2, and vice versa. A profit margin of zero means that the economic benefits of both flowsheets are identical.

2.4. Cost Estimations

The Brook Hunt C1 cost methodology was used for estimating the costs associated with each flowsheet. The Brook Hunt C1 cost estimations are based on direct costs, which include expenditures typically incurred in mining, processing (such as labor cost, electricity, water, consumables, maintenance, and repairs, etc.) and general administration (G&A) costs. It does not include capital costs for exploration, mine capital development and capital works on processing, and the cost of royalties [21]. For simplicity, some minor operating costs such as expenses associated with metallurgical tests and analyses, which are common to both flowsheet options are omitted. Where appropriate, the mass and energy balances obtained from both Flowsheets 1 and 2 were used to estimate the operating costs of both processes. The basis and assumptions that were made in estimating the operating costs per tonne of IOC, for both flowsheets are summarized below. All the costs are reported in Australian dollars.

2.4.1. Mining Cost

The mining cost is vital in estimating the costs associated with mining and mineral projects. In this study, the cost for mining and transporting the run-of-mine (ROM) ore was estimated at $17.59 per dry metric tonne (DMT) of ore. This estimate was based on the report for the Project Prefeasibility Study (PFS) conducted on the Hawsons iron project, located in Broken Hill, New South Wales, Australia [22].

2.4.2. Electricity Cost

Electricity for mining and mineral projects may be purchased from a third-party supplier, (either from a power grid or a purpose-built power station) or generated on-site by the business owners. The costs for the supply of electricity from a local utility are usually identical to that charged to most residential customers. According to the Australian Government Department of the Environment and Energy, electricity price ranges from < $0.10/kWh for grid electricity, $0.10/kWh to $0.30/kWh for electricity derived from pipeline gas, and $0.15/kWh to $0.30/kWh (after rebates) for electricity derived from off-grid diesel or gas power plant. For this study, the electrical energy price of $0.10/kWh was used in the cost estimation. The electricity consumption used was limited to the estimates made for the processing plant. From Figure 1 and Figure 2, the total energy consumptions for Flowsheets 1 and 2 were estimated at 55.6 kWh/t and 80 kWh/t, respectively.

2.4.3. Water Cost

For Flowsheet 1, water use is limited to dust suppression and tailings agglomeration before stacking in the mining pits. For Flowsheet 2, water is used in the milling circuit as well as the wet magnetic separation circuit. The price of water used in this estimation is $3.41 per m3. This estimate was based on data published by SA Water [23]. Flowsheet 1 was assumed to use 10% of the total volume of water used by Flowsheet 2.

2.4.4. Air Compressor for Flowsheet 1

The entire operations for Flowsheet 1 (SFC, PMS, and AC) are carried out in an air medium. The cost associated with the operation of the air compressor was estimated at $0.10 per tonne of IOC (modified after Drechsler [24]).

2.4.5. Concentrate Dewatering for Flowsheet 2

Magnetite concentrate from wet processing operations is dewatered before shipping. This is done to reduce the volume of material to handle at the ports and to meet the transportable moisture limit (TML) requirements of less than 10% for IOC for shipping purposes. Generally, magnetite concentrators use a filter press to dewater the final magnetite concentrate. The cost of concentrate dewatering for Flowsheet 2 was estimated at $0.40 per tonne of ore (modified after Drechsler [24]).

2.4.6. Tailings Disposal

Generally, dry tailings from mining projects are considered as a source of construction material unless an evaluation shows it to be a source of risk on its own, or it is likely to be generated at high volumes that it exceeds the quantity needed for the construction purposes. Coarse dry tailings can be returned directly to the mined pit whilst in the case of fine dry tailings, they need to be agglomerated and backfilled into a mined-out open pit, or in some instances, they can be used as underground stope-backfill. The cost of dry tailings disposal for Flowsheet 1 was estimated at $0.20 per tonne of ore [24].
Conventionally, the tailings slurry from wet processing operations are pumped into a TSF where the solid particles settle, and the supernatant liquid is recovered for reuse in the processing plant. This process means that Flowsheet 2 requires additional expenditure for a wet TSF over a dry stack TSF for Flowsheet 1. This additional expenditure comprises the cost of the additional land required, TSF embankment construction, and maintenance to ensure their structural integrity. Furthermore, there are reclamation and other legacy costs associated with a wet TSF. Carneiro and Fourie [25] estimated the operating costs of filtered tailings disposal to be between $1.07 to $2.18 per dry tonne of tailings. Using the lower estimate of $1.07 per tonne of tailings in Flowsheet 2 equates to $2.16 per tonne of ore.

2.4.7. Penalty/Concentrate Refining Cost

Penalty/concentrate refining cost accounts for expenditure on concentrate refining and/or penalties on concentrates containing gangue beyond the acceptable threshold. The outcomes from the pilot plant tests presented in Table 3 show that Flowsheet 1 generated a cleaner concentrate than that of Flowsheet 2. This cleaner concentrate means that the penalty/concentrate refining cost for Flowsheet 1 is lower than that of Flowsheet 2. Penalty/concentrate refining costs per tonne of ore for Flowsheets 1 and 2 were estimated at $1.0 and $2.50, respectively (modified after Drechsler [24]).

2.4.8. Labor Cost

The estimate for labor cost covers the total production costs required to produce 1 tonne of IOC, but not the maintenance labor cost. Labor cost of $85 per hour with an estimated 0.05 h spend per tonne of IOC produced were assumed for both Flowsheets 1 and 2 [24].

2.4.9. Consumables

Consumable expenditures include the costs of grinding media, mill, and crusher liners, etc. An estimate of $5 per tonne of IOC was made (Modified after [24]). The cost of consumables for Flowsheet 1 was assumed to be 40% of that of Flowsheet 2. This is mainly because the SFC is a media-free crusher which obviates the cost associated with grinding media. It is estimated that the cost of grinding media accounts for about 25% of the total cost associated with fine and ultrafine milling/grinding [20]. Additionally, the comminution circuit of Flowsheet 1 used only the SFC to achieve the required particle size used in this study, whilst that of Flowsheet 2 used both the HPGR and ball mill to achieve the required size. This obviously demonstrates that Flowsheet 2′s consumption expenditure is higher than Flowsheet 1.

2.4.10. Maintenance and Repairs

The estimates for maintenance and repair cost cover expenditure on repair parts and maintenance labor cost. An estimate of $2.27 per tonne of IOC was made for maintenance and repairs cost [24]. In this study, maintenance, and repair costs for both flowsheets are assumed to be identical.

2.4.11. General and Administrative Cost

G&A cost is generally a low proportion of the total operating expenditure of a mineral project and cover expenses incurred on administration, site medical and security personnel, training, warehouse, and procurement, among others. However, G&A costs are typically substantially higher where a fly-in fly-out (FIFO) system is operated for the operation. For this study, both Flowsheets 1 and 2 are assumed to have the same G&A costs estimated at $2.14 per tonne of IOC (modified after Drechsler [24]).

2.5. Revenue Estimation

In this study, it is assumed that the IOC is sold as iron fines, not as pellets. The price for iron ore used in this study is the iron ore spot price based on Platts Iron Ore Index [26]. The Platts Iron Ore Index is a benchmark assessment of the spot price of physical iron ore concentrate which is based on a standard specification of iron ore fines with 62% Fe, 2.25% alumina, 4% silica, and 0.09% phosphorus, among other gangue elements.

3. Results

3.1. Ore Characteristics

A detailed characterization of the ore used in this study has been presented in our previous study [16], and it was composed of 45.2% Fe, 10.4% Si, 8.1% Mg, 3.82% Ca, and 2.34% Al. Mineralogical analysis of the ore using QEMSCAN™ showed that the major iron-bearing minerals in the ore are magnetite (38%), goethite (16%), and hematite (5%). The major gangue minerals were carbonates (14%), quartz (5%), pyroxene (7%), and chlorite (7%).

3.2. Pilot Plant Results

A summary of the results from the magnetic separation pilot plant is presented in Table 3. As can be seen, Flowsheet 1 produced higher concentrate Fe grades with lower gangue content compared with Flowsheet 2. The higher content of gangue minerals in the concentrate from Flowsheet 2 is primarily due to the liquid medium used for the concentration. In the liquid medium, there can be high gangue entrainment as a result of the high particle–particle interactions that are caused by the liquid medium. Furthermore, during magnetic separation, the presence of hydrodynamic drag forces due to the viscous liquid medium significantly affects the separation process.
On the other hand, operating in an air medium ensured that the feed particles were well dispersed which resulted in improved selectivity and subsequently, improved concentrate quality. Additionally, using air as a separation medium produces minimal resistive forces to the separation process thereby producing cleaner concentrates [16].

3.3. Cost and Revenue Analysis

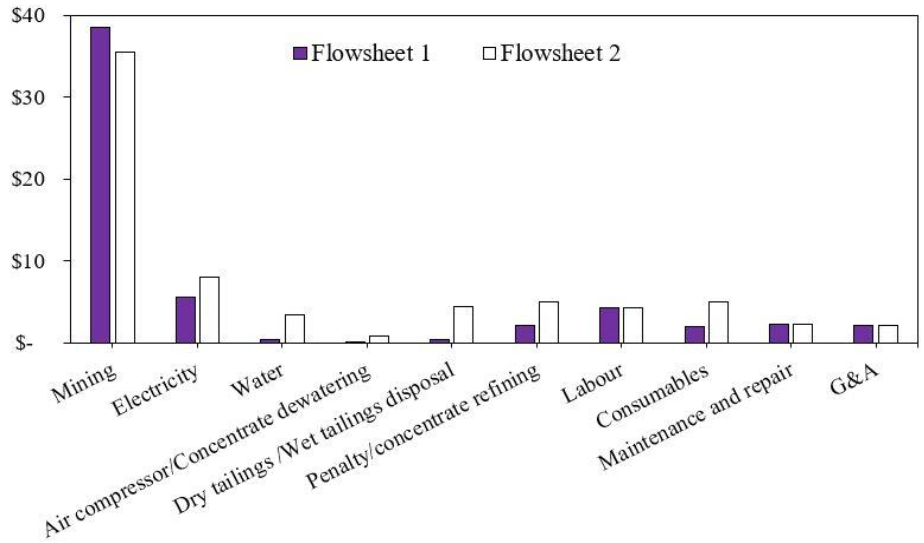
The estimated production costs for Flowsheets 1 and 2 have been summarized in Table 4 and Table 5, respectively, whilst Figure 3 shows a comparison between the various unit costs associated with both flowsheets. Table 6 summarizes the revenue estimations for Flowsheets 1 and 2.

3.4. Economic Benefits of the Proposed Dry Flowsheet

Based on the conceptual economic study results and the underlying assumptions provided in Table 4 and Table 5 the direct operating costs (excluding mining cost) per tonne of IOC were estimated to be $19.3 and $35.3 for Flowsheets 1 and 2, respectively, whilst their respective cumulative costs (including mining cost) per tonne of IOC were estimated as $57.8 and $70.8, respectively.
Although the mining costs per tonne of ore were identical for both flowsheets, mining cost per IOC for Flowsheet 1 was higher than that of Flowsheet 2. This is because Flowsheet 1 generated lower IOC product tonnes than Flowsheet 2 as can be seen in Table 3. Flowsheet 1 generated concentrate mass of 45.6% whilst Flowsheet 2 generated concentrate mass of 49.5%. On the other hand, the higher concentrate mass yields obtained from Flowsheet 2 did not depict higher productivity than Flowsheet 1 since the concentrate contained a significant amount of gangue minerals and subsequently resulted in a higher penalty/concentrate refining cost compared with Flowsheet 1.
Analysis of the costs of production of IOC showed that Flowsheet 1′s direct operating cost (excluding mining costs) was $16 lower than that of Flowsheet 2 for each tonne of IOC, whilst for the cumulative operating costs, again, Flowsheet 1 was $13 less than Flowsheet 2. The high cost of producing IOC from Flowsheet 2 can be attributed primarily to the expenditures associated with electricity, water, consumables and tailings disposal, and dewatering. These are the cost components that can be leveraged to lower the production cost of dry processing of magnetite using Flowsheet 1.
The final IOC grade achieved by Flowsheet 1 is 68.4% Fe whilst that of Flowsheet 2 is 64.8% Fe. Based on Platts Iron Ore Index, the price for 62% Fe is $119.9 per tonne of IOC, with an additional $5.80 per tonne of 1% Fe IOC. Based on these values, the total revenue per tonne of IOC for Flowsheet 1 is $157, whilst that of Flowsheet 2 is $136.3. This means that for every tonne of IOC produced, the operators of Flowsheet 1 receive $20.7 extra in total revenue than Flowsheet 2. Altogether, Flowsheet 1 provides up to $33.7 extra profit (net revenue) per DMT of IOC compared with Flowsheet 2. This means there are two benefits in using Flowsheet 1 compared with Flowsheet 2 and these are lower operating costs and higher revenue.
Assuming a magnetite concentrator produces 1 million tonnes of dry IOC per annum, then for Flowsheet 1, the production costs (excluding capital) and total revenues are estimated as approximately $58,000,000 and $157,000,000, respectively, whilst those of Flowsheet 2 are approximately $71,000,000 and $136,000,000, respectively. This means that for this conceptual study, Flowsheet 1 provides up to approximately $34,000,000 per annum in profit compared with Flowsheet 2.

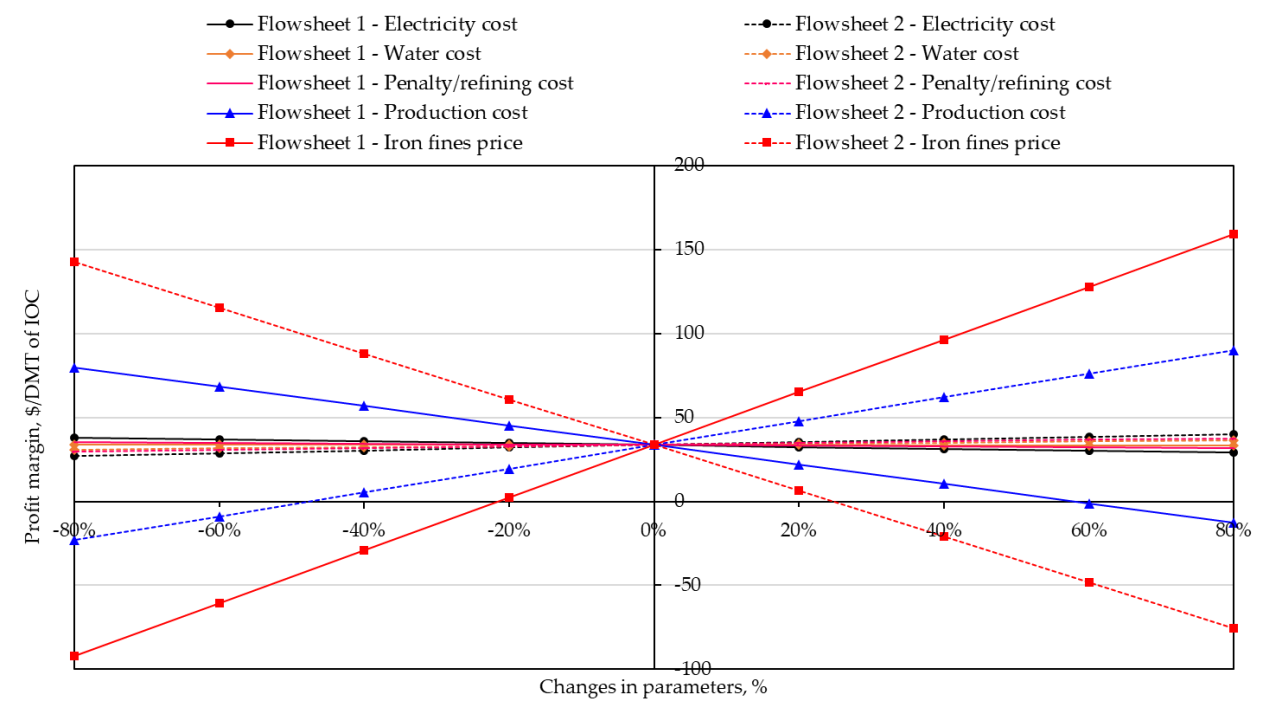
3.5. Sensitivity Analysis

Sensitivity analysis studies were conducted to understand the effect of variations (within ± 80%) in the costs of selected cost items and revenue on the profit margin of Flowsheet 1 over Flowsheet 2. The cost items that were studied are electricity, water, and penalty/concentrate refining costs as well as the production cost. The results are presented in Figure 4.
The results show that the selected operating costs have an insignificant effect on the profit margin of Flowsheet 1 over 2. For example, an increase of up to 80% in the costs of electricity, water, and penalty/concentrate refining for Flowsheet 1 still provided a positive profit margin over Flowsheet 2. Specifically, increasing the electricity cost of Flowsheet 1 by 80% resulted in a profit margin of $29.3 per tonne of IOC whilst a decrease in electricity costs of Flowsheet 2 by 80% yielded a profit margin of $27.3 per tonne of IOC.
The most sensitive parameters were the IOC fines price and the production cost, which includes the mining cost. In terms of the price of IOC fines, both flowsheets were sensitive to its fluctuations. For example, a 21% reduction in the IOC fines price for Flowsheet 1 brings the profit margin to zero, whilst it takes a 25% increase in the IOC fine price for Flowsheet 2 to achieve a profit margin of zero. This means that any slight increase in IOC prices will boost the economic potential of Flowsheet 1 but will not necessarily increase Flowsheet 2′s profitability. Moreover, it takes up to an 18% decrease in IOC price to bring the economic potential of Flowsheet 1 to the level of Flowsheet 2, whilst any slight reduction in IOC price for Flowsheet 2 improves the profit margins of Flowsheet 1 over Flowsheet 2.
Moreover, the results show that an increase in the production costs of Flowsheet 1 by 40% resulted in a profit margin of $10.6 over Flowsheet 2. Similarly, a reduction in the total production cost of Flowsheet 2 by 40% also showed that Flowsheet 1 has a positive profit margin of $5.38. This means that the profitability of Flowsheet 1 is significantly resilient to fluctuations in operating costs of both flowsheets to about 40%. The profit margin reaches zero when the production cost of Flowsheet 2 is reduced by 48%. However, it requires a 58% increase in the production cost of Flowsheet 1 for the profit margin to reach zero, at which point the economic potential of both flowsheets is identical.
The economic studies conducted on these conceptual magnetite processing flowsheets have shown that Flowsheet 1 which uses dry processing technologies (SFC and PMS) not only produced a cleaner IOC which ultimately will result in a more environmentally friendly steelmaking, but it also provided cost savings in terms of energy consumption, water acquisition, and tailings disposal. These potential economic benefits are sufficiently encouraging to warrant their development or inclusion into existing magnetite concentration flowsheets.

4. Economic Benefit of the Dry Processing Option

4.1. Energy Savings

Comminution energy consumption is a significant component in establishing the economic viability of mineral projects. The cost estimations presented in this study show that using Flowsheet 1 offered a 31% reduction in the cost associated with the electrical power consumption per tonne of IOC compared with Flowsheet 2. The lower NSE of Flowsheet 1 is mostly due to the SFC extending crushing duties to extremely fine particle sizes. Since crushing is less energy-intensive compared with milling, Flowsheet 1 provides improved comminution energy efficiency. Lane et al. [27] estimated that a 10% improvement in comminution efficiency will improve the overall plant operating cost by 3% to 5%. This study shows that the SFC offers potential energy and cost savings in mineral comminution operations.

4.2. Water Savings

The cost of process water acquisition and use in arid and remote regions also plays a major role in establishing the economic viability of resources located in such regions. Commonly, operating mineral projects in these arid regions require the construction of desalination plants to provide potable water for the operation. Clearly, sustainable dry beneficiation offers significant cost and operational benefits in such cases.
In the conventional wet magnetite beneficiation flowsheets, comminution and magnetic separation require a significant amount of water. On the other hand, using a dry processing flowsheet will drastically reduce the amount of water required. The outcomes of the cost estimations show that, compared with Flowsheet 2, Flowsheet 1 offers up to a 90% reduction in water costs per tonne of IOC. The lower water requirement for Flowsheet 1 ensures frugal water use and cost reduction in the processing operation.

4.3. Cost Savings

The cost savings discussed here are focused on capital and operational expenditures associated with dewatering and impoundment dam construction. Both the concentrate and tailing obtained from wet magnetite processing require dewatering to a certain degree. The wet concentrate is dewatered to adhere to the TML setpoint whilst the wet tailings are commonly dewatered, thickened, and disposed into purpose-built dams to be stored.
Our knowledge and understanding of the main challenges and performance associated with the dewatering of iron oxide tailings and impoundment have been advanced in studies reported by Addai-Mensah and Ralston [28], McGuire et al. [29], and Lu and Grau [30]. The construction and operation of thickeners and impoundment dams have significant capital and operational costs associated with them. For example, the estimated capital expenditure for building a 110-m diameter thickener to handle iron ore tailings (in Belo Horizonte in Brazil) was US$10,406,000 and an annual operating cost of US$1,614,000 [30]. The estimated capital cost included costs of supply, freight, tank construction, and equipment installation whilst the operating cost was limited to costs of flocculant and/or coagulant. Furthermore, the QCC Resources report on the Cobbora Coal Project estimated about $20 million as the capital expenditure for the construction of a tailings dam [31]. Other expenditures associated with tailing dams’ operations include labor, seepage monitoring, and maintenance.
These capital and operational costs typically associated with wet processing flowsheets are obviated in dry processing options. This means that using Flowsheet 1 has significant capital and operational cost savings compared with Flowsheet 2.

4.4. Environmental Benefits and Social Acceptance

The continuous decline in high-grade ore resources has compelled the minerals industry to process lower-grade ores. This means that to produce the same amount of ore concentrate, larger tonnes of lower-grade ore must be mined and processed compared with higher-grade ores. This inevitably results in the production of several tonnes of waste tailings per annum which must be safely stored. Whilst dry tailings can be easily disposed into worked-out mining pits, wet tailings require much higher space to store them.
The total volume of wet tailings ( V T ) of magnetite to be disposed into tailing dams is the sum of the volume of magnetite ( V F e 3 O 4 ) and volume of water ( V w a t e r ) as shown in Equation (1).
V T =   V F e 3 O 4 + V w a t e r
V T =   M a s s F e 3 O 4 D e n s i t y F e 3 O 4 + M a s s w a t e r D e n s i t y W a t e r
Addai-Mensah et al. [32] showed that iron oxide tailings slimes can be consolidated to solid loadings in the range of 50 to 60 wt.%. Assuming a magnetite ore concentrator generates one tonne of magnetite tailing with a pulp density of 60 wt.% solids, then the total wet tailing volume can be estimated below. (The specific gravity of magnetite is 5180 kg/m3).
=   1000   kg 5180   kg / m 3 + 667   kg 1000   kg / m 3
=   0.193   m 3 + 0.667   m 3
=   0.86   m 3
The results show that the volume of land required to accommodate the one tonne of dry magnetite tailings is 0.193 m3; however, the presence of the 40 wt.% water increases the volume requirements by almost 80%. This means that assuming a magnetite concentrator generates 10 million tonnes of tailings annually, then the wet flowsheet will require about 9 million cubic meters of land to accommodate the tailings whilst the dry tailings will require about 2 million cubic meters. The land requirement for storing wet tailings significantly increases when the wet tailings wt.% solid loading decreases. For example, for the same one-tonne of dry magnetite tailing, if the pulped density declines to 40 wt.% solids, the wet tailing will require about 1.69 m3 of land to store it, an increase of almost 50% of what was required for the pulp with 60 wt.% solids. This clearly demonstrates that Flowsheet 1 requires a smaller environmental footprint for tailings storage than Flowsheet 2.
Other potential deleterious effects of wet tailing dam are contamination of surface and underground water bodies through seepages, dam failure which also affects flora and fauna, and land degradation. All these challenges highlight major socio-economic aspects confronting wet processing of mineral resources. The above analysis shows that the adoption or application of sustainable dry processing technologies (Flowsheet 1) offers a revolutionary and economically competitive opportunity for the mineral processing industry.

5. Conclusions

In this study, economic evaluation and analysis of two conceptual flowsheets have been conducted and compared. Flowsheet 1 is a dry processing flowsheet consisting of a novel superfine crusher and pneumatic planar magnetic separator whilst Flowsheet 2 consists of HPGR, ball mill, and wet drum magnetic separators. Based on the recoveries obtained from processing the selected magnetite ore using these two flowsheets, cost estimations based on The Brook Hunt C1 cost methodology and revenue estimations calculation were made to determine the profitability margin of Flowsheet 1 compared with Flowsheet 2.
The cost estimations of Flowsheets 1 and 2 showed that the total production cost per tonne of IOC for Flowsheet 1 was $57.8, whilst that of Flowsheet 2 was $70.8. The revenue estimations of Flowsheets 1 and 2, based on Platts Iron Ore Index showed that the revenue per tonne of IOC for Flowsheet 1 was $157, whilst that of Flowsheet 2 was $136.3. This resulted in an additional profit of $33.7 per tonne of IOC for Flowsheet 1 over Flowsheet 2.
Sensitivity studies conducted to understand the effect of variations of selected costs (electricity, water, and penalty/refining) showed that the cost variations within ±80% still yielded a positive profit margin for Flowsheet 1 over Flowsheet 2. Additionally, sensitivity analysis showed that Flowsheet 1 must suffer a 58% increase in the total production cost before its profit equals that of Flowsheet 2, whilst Flowsheet 2 requires a reduction of its total production cost by a 48% to achieve a similar profit as Flowsheet 1. Conversely, it will take a 21% decrease in Flowsheet 1′s IOC fines prices, or an increase of 25% in Flowsheet 2′s IOC fines prices for both flowsheets to achieve identical profit. These show the economic robustness of Flowsheet 1 over Flowsheet 2 in terms of their profit.
The economic analyses conducted on these conceptual magnetite processing flowsheets show unambiguously that the dry processing flowsheet offers substantial cost savings and revenue generation, as well as lower environmental footprint and risks compared with the wet processing alternative. These potential economic benefits are encouragingly sufficient to warrant serious consideration of the introduction of dry beneficiation flowsheets in new projects or inclusion of dry circuit into existing magnetite concentration flowsheets.

Author Contributions

E.B.; Conceptualization, methodology, investigation, validation, formal analysis, visualization, writing—original draft; writing—review and editing; C.K.; resources; J.A.-M.; formal analysis, writing—review and editing, supervision; W.S.; formal analysis, writing—review and editing, supervision, funding acquisition. All authors have read and agreed to the published version of the manuscript.

Funding

This research received no external funding.

Acknowledgments

The Australian Government Research Training Program Scholarship and the Future Industries Institute of the University of South Australia are thankfully acknowledged. The authors also acknowledge the Technical Service Team of the Future Industries Institute of the University of South Australia for the QEMSCAN and SEM-EDS analyses.

Conflicts of Interest

I (First author: Emmanuel Baawuah) declare that I have no financial and personal relationship with other people or organizations that could inappropriately influence (bias) this work. This research work is part of a PhD research which is aimed at the application of novel dry processing technologies for magnetite beneficiation. The second author (Christopher Kelsey) provided access to the technology. The third (Jonas Addai-Mensah) and fourth authors (William Skinner) are my research supervisors and advisors.

References

  1. Jankovic, A.; Valery, W. Reducing Grinding Energy and Cost-Magnetite Iron Ore Design Case Study. In Proceedings of the XII International Mineral Processing Symposium, Cappadocia, Turkey, 6–8 October 2010; pp. 71–78. [Google Scholar]
  2. Yellishetty, M.; Mudd, G.; Mason, L.; Mohr, S.; Prior, T.; Giurco, D. Iron Resources and Production: Technology, Sustainability and Future Prospects; Prepared for CSIRO Minerals Down Under Flagship, by the Department of Civil Engineering (Monash University) and the Institute for Sustainable Futures (University of Technology, Sydney), October 2012; Institute for Sustainable Futures: University of Technology: Sydney, Australia, 2012; ISBN 978-1-922173-46-1. [Google Scholar]
  3. McNab, B.; Jankovic, A.; David, D.; Payne, P. Processing of magnetite iron ores–comparing grinding options. In Proceedings of the Iron Ore Conference, Perth, Australia, 27–29 July 2009; pp. 277–287. [Google Scholar]
  4. CITIC Pacific Mining. 2019. Available online: https://CITICpacificmining.com/our-operation/processing (accessed on 17 October 2019).
  5. Powell, M.S.; Benzer, H.; Dundar, H.; Aydogan, N.; Adolfsson, G.; Partapuoli, Å.; Wikströ, P.; Tano, K. LKAB AG Milling of Magnetite. In Proceedings of the International Autogenous and Semiautogenous Grinding Technology (SAG 2011) of CIM, Vancouver, BC, Canada, 25–28 September 2011; pp. 1–24. [Google Scholar]
  6. Larson, M.; Do, T.; Siliezar, J. Enhancing Magnetite Returns—The Benefits of IsaMilling. In Iron Ore 2013; The Australasian Institute of Mining and Metallurgy: Perth, Australia, 2013; pp. 411–416. [Google Scholar]
  7. Larson, M.; Anderson, G.; Mativenga, M.; Stanton, C. The Arrium IsaMill from Design through Commissioning and Optimisation. In Proceedings of the Metallurgical Plant Design and Operating Strategies, Perth, Australia, 7–8 September 2015; pp. 110–119. [Google Scholar]
  8. Palaniandy, S.; Halomoan, R.; Ishikawa, H. TowerMill circuit performance in the magnetite grinding circuit–The multi-component approach. Miner. Eng. 2019, 133, 10–18. [Google Scholar] [CrossRef]
  9. Palaniandy, S.; Ishikawa, H. Towermill Performances in Magnetite Concentrator and It’s Scale-Up Validation. In Proceedings of the International Mineral Processing Congress, Moscow, Russia, 17–21 September 2018; pp. 1–10. [Google Scholar]
  10. Jankovic, A.; Suthers, S.; Wills, T.; Valery, W. Evaluation of dry grinding using HPGR in closed circuit with an air classifier. Miner. Eng. 2015, 71, 133–138. [Google Scholar] [CrossRef]
  11. Azam, S.; Li, Q. Tailings dam failures: A review of the last one hundred years. Geotech. News 2010, 28, 50–54. [Google Scholar]
  12. Vale, S.A. Annual Report Pursuant to Section 13 or 15(D) of The Securities Exchange Act of 1934. Available online: http://www.vale.com/EN/investors/information-market/annual-reports/20f/20FDocs/Vale%2020-F%202019_i.pdf (accessed on 31 August 2020).
  13. Holmes, R.J.; Lu, L. Introduction: Overview of the global iron ore industry. In Iron Ore: Mineralogy, Processing and Environmental Sustainability; Lu, L., Ed.; Woodhead Publishing: Cambridge, UK, 2015; pp. 1–42. [Google Scholar]
  14. Batterham, R. Trends in comminution driven by energy. Adv. Powder Technol. 2011, 22, 138–140. [Google Scholar] [CrossRef]
  15. Baawuah, E.; Kelsey, C.; Addai-Mensah, J.; Skinner, W. Comparison of the performance of different comminution technologies in terms of energy efficiency and mineral liberation. Miner. Eng. 2020, 156, 106454. [Google Scholar] [CrossRef]
  16. Baawuah, E.; Kelsey, C.; Addai-Mensah, J.; Skinner, W. Assessing the performance of a novel pneumatic magnetic separator for the beneficiation of magnetite ore. Miner. Eng. 2020, 156, 106483. [Google Scholar] [CrossRef]
  17. Baawuah, E.; Kelsey, C.; Addai-Mensah, J.; Skinner, W. A Novel Pneumatic Planar Magnetic Separator for Magnetite Beneficiation: A Focus on Flowsheet Configuration. Mineral 2020, 10, 759. [Google Scholar] [CrossRef]
  18. Baawuah, E.; Kelsey, C.; Addai-Mensah, J.; Skinner, W. Advances in superfine crushing—A study on IMPTEC superfine crusher (SFC 160) operating parameters. In Proceedings of the Iron Ore Conference, Perth, Australia, 22–24 July 2019; pp. 633–644. [Google Scholar]
  19. Batterham, R.; Kelsey, C.G.; Kelly, J.R. The next chapter of comminution: Ultra-fine crushing. In Proceedings of the International Energy Raw Materials and Energy Summit, Istanbul, Turkey, 1–3 October 2015. [Google Scholar]
  20. Kelsey, C.G.; Kelly, J.; Skinner, W. Dry Processing of Magnetic Iron Ores—Addressing Cost and Environmental Issues. In Proceedings of the Iron Ore Conference, Perth, Australia, 24–26 July 2017; pp. 215–220. [Google Scholar]
  21. Lanz, T.; Seabrook, W. Operating cost estimation. In Cost Estimation Handbook; McCarthy, L.P., Ed.; AusIMM: Melbourne, Australia, 2012; Volume 2, pp. 57–82. [Google Scholar]
  22. Carpentaria Resources. 2019. Available online: https://carpentariares.com.au/hawsons-iron-project-detail-report/ (accessed on 17 November 2019).
  23. SA Water. 2019. Available online: https://www.sawater.com.au/ (accessed on 29 November 2019).
  24. Drechsler, M. IMPTEC Technology Comparison for Magnetite Processing based on Australian Dollars and Price Items. 2017. [Google Scholar]
  25. Carneiro, A.; Fourie, A.B. A conceptual cost comparison of alternative tailings disposal strategies in Western Australia. In Proceedings of the 21st International Seminar on Paste and Thickened Tailings, Perth, Australia, 11–13 April 2018; pp. 439–454. [Google Scholar]
  26. S&P Global Platts. 2020. Available online: www.spglobal.com/platts (accessed on 5 February 2020).
  27. Lane, G.S.; Fleay, J.; Reynolds, K.; La Brooy, S. Selection of Comminution Circuits for Improved Efficiency. In Proceedings of the Crushing and Grinding Conference, Kalgoorlie, Australia, 27–28 April 2002; pp. 1–19. [Google Scholar]
  28. Addai-Mensah, J.; Ralston, J. Interfacial chemistry and particle interactions and their impact upon the dewatering behaviour of iron oxide dispersions. Hydrometallurgy 2004, 74, 221–231. [Google Scholar] [CrossRef]
  29. McGuire, M.J.; Addai-Mensah, J.; Bremmell, K.E. Improved dewaterability of iron oxide dispersions: The role of polymeric flocculant type, pH and shear. Asia Pac. J. Chem. Eng. 2008, 3, 18–23. [Google Scholar] [CrossRef]
  30. Lu, J.Z.; Grau, J.P. Conventional or High Capacity Thickeners, a Better Choice to Make. In Proceedings of the 51st Annual Conference of Metallurgists of CIM, Niagara, ON, Canada, 30 September–3 October 2012; pp. 363–373. [Google Scholar]
  31. QCC Resources. Appendix C: Dewatering Options Report—Comparison of Options for Tailings Dewatering (Report); QCC Resources Pty Ltd.: Hexham, UK, 2013. [Google Scholar]
  32. Addai-Mensah, J.; Larson, J.; Ralston, J. Australian Mineral Industry Research Association (AMIRA) Project P523-Interfacial Chemistry and Water Minimization in Tailings Treatment, Annual Report; Australian Mineral Industry Research Association: Parkville, Australia, 1999. [Google Scholar]
Figure 1. Beneficiation Circuit for Flowsheet 1.
Minerals 10 00955 g001
Figure 2. Beneficiation Circuit for Flowsheet 2. * Jankovic and Valery [1].
Minerals 10 00955 g002
Figure 3. Estimated Operating Costs for Flowsheets 1 and 2.
Minerals 10 00955 g003
Figure 4. Variation of Selected Cost Parameters and Revenue Versus Profit Margin.
Minerals 10 00955 g004
Table 1. Summary of superfine crusher (SFC) and high pressure grinding roll (HPGR) Comparative Studies [15].
ParameterUnitSFCHPGR
Feed F100mm10.010.0
Feed F80mm6.526.52
Product P80mm0.821.27
F80/P80-3.341.82
WiokWh/t15.937.2
SSE (75 µm)kWh/t8.9110.7
Table 2. Summary of planar magnetic separator (PMS) and wet drum low-intensity magnetic separator (WLIM)S Comparative Studies on P80 = 75 µm Feed [16].
ParameterUnitFeedConcentrate
PMSWLIMS
Mass yield%10045.649.5
Fe3O4 grade%40.885.978.8
Fe grade%41.568.464.8
Si grade%8.842.873.61
Al grade%2.911.341.59
Ca grade%4.740.911.52
Table 3. Concentrate Mass Yields and Assays of iron oxide concentrate (IOC) Obtained from Flowsheets 1 and 2.
Performance IndicatorsUnitFeedFlowsheet 1Flowsheet 2
Conc.TailConc.Tail
Mass yield%10045.654.449.550.5
Fe grade%41.568.424.564.821.6
Si grade%8.842.879.493.619.88
Al grade%2.911.342.821.593.07
P grade%0.120.050.150.050.14
Mg grade%7.583.487.354.538.31
Ca grade%4.740.916.391.526.57
Table 4. Flowsheet 1 Estimated Costs.
Cost ItemUnit CostSpecific ConsumptionsProduction Costs
RateUnitRateUnitRateUnit
Mining (M)$17.6$/t2.19t/t IOC$38.5$/t IOC
Electricity$0.10$/kWh55.6kWh/t IOC$5.56$/t IOC
Water$3.41$/m30.10m3/t IOC$0.34$/t IOC
Air compressor$0.10$/l1.00l/t IOC$0.10$/t IOC
Dry tailings stacking$0.20$/t2.19t/t IOC$0.44$/t IOC
Penalty/refining$1.00$/t2.19t/t IOC$2.19$/t IOC
Labor$85.0$/h0.05h/t IOC$4.25$/t IOC
Consumables$5.00$/unit0.40unit/t IOC$2.00$/t IOC
Maintenance and repair$2.27$/unit1.00unit/t IOC$2.27$/t IOC
G&A$2.14$/unit1.00unit/t IOC$2.14$/t IOC
Processing (P)Excluding mining cost$19.3$/t IOC
Production cost (P + M)Including mining cost$ 57.8$/t IOC
Table 5. Flowsheet 2 Estimated Costs.
Cost ItemUnit CostSpecific ConsumptionsProduction Costs
RateUnitRateUnitRateUnit
Mining (M)$17.6$/t2.02t/t IOC$35.5$/t IOC
Electricity$0.10$/kWh80.0kWh/t IOC$8.00$/t IOC
Water$3.41$/m31.00m3/t IOC$3.41$/t IOC
Concentrate dewatering$0.40$/t2.02t/t IOC$0.81$/t IOC
Tailings disposal$2.16$/t2.02t/t IOC$4.36$/t IOC
Penalty/refining$2.50$/t2.02t/t IOC$5.05$/t IOC
Labor$85.0$/h0.05h/t IOC$4.25$/t IOC
Consumables$5.00$/unit1.00unit/t IOC$5.00$/t IOC
Maintenance and repair$2.27$/unit1.00unit/t IOC$2.27$/t IOC
G&A$2.14$/unit1.00unit/t IOC$2.14$/t IOC
Processing (P)Excluding mining cost$35.3$/t IOC
Production (P + M)Including mining cost$70.8$/t IOC
Table 6. Revenue Estimates for Flowsheets 1 and 2.
Revenue EstimationFlowsheet 1Flowsheet 2
Fe fines benchmark $/t for 62% Fe = $119.968.4% Fe fines
(62% Fe Benchmark =
$119.9 per DMT of IOC)
64.8% Fe fines
(62% Fe Benchmark =
$119.9 per DMT of IOC)
Premium above 62% Fe fines $/t for 1% Fe = $5.80Plus, Premium
(Additional Fe 6.40% =
$37.1 per DMT of IOC)
Plus, Premium
(Additional Fe 2.83% =
$16.4 per DMT of IOC)
Total revenue for Fe fines$157 per DMT of IOC$136.3 per DMT of IOC
Net revenue$99.2 per DMT of IOC$65.5 per DMT of IOC
Publisher’s Note: MDPI stays neutral with regard to jurisdictional claims in published maps and institutional affiliations.

