Article

Evidence for Biogenic Silica Occurrence in the Lower Silurian Longmaxi Shale in Southeastern Chongqing, China

1
School of Energy Resources, China University of Geosciences (Beijing), Beijing 100083, China
2
Key Laboratory of Strategy Evaluation for Shale Gas, Ministry of Natural Resources, Beijing 100083, China
3
Wuxi Research Institute of Petroleum Geology, RIPEP, SINOPEC, Wuxi 214126, China
4
Development Planning Office, China University of Petroleum (Beijing), Beijing 102249, China
5
Xi’an Research Institute, China Coal Technology and Engineering Group Corp., Xi’an 710077, China
*
Author to whom correspondence should be addressed.
Minerals 2020, 10(11), 945; https://doi.org/10.3390/min10110945
Submission received: 5 September 2020 / Revised: 13 October 2020 / Accepted: 21 October 2020 / Published: 24 October 2020

Abstract

:
The gas shale in the Lower Silurian Longmaxi Formation contains a considerable amount of biogenic silica. Various originated silicas in shale, derived from different depositional environment, are commonly associated with different degrees of organic matter enrichment, resulting in different mechanical and physical properties of shale reservoirs. Thin section identification, scanning electron microscopy (SEM), energy dispersive spectroscopy (EDS), total organic carbon (TOC) analysis, X-ray diffraction (XRD) analysis, and X-ray fluorescence (XRF) spectroscopy were used to investigate the Lower Silurian Longmaxi shale from Well Yuye 1 in southeastern Chongqing, China to obtain a better understanding of the origin of silica in the Longmaxi Shale. The results show ubiquitous cryptocrystalline silicas with poorly crystalline morphology, which differs from that of the detrital silica, authigenic silica, and hydrothermal silica, proving that the cryptocrystalline silicas may have a biogenic origin. Major element and mineral composition analysis indicate no correlations between K2O/Al2O3 and SiO2/Al2O3 and between illite and SiO2, and negative correlations between TiO2 and SiO2/Al2O3, between illite and quartz and excess Si, and between Al2O3 and excess Si, and all samples being located in the area of non-hydrothermal origin in the Al-Fe-Mn diagram, excluding silicas of terrigenous detrital origin, clay mineral transformed origin, and hydrothermal origin. Moreover, the fact that almost all samples plot above the illite Si/Al line in the cross-plot of Si versus Al and the mean values of Al/(Al + Fe + Mn) and Si/(Si + Al + Fe + Ca) are close to the values of biogenic silica prove that the silicas are primarily of biogenic origin. Positive correlations between TOC and quartz and excess Si and numerous siliceous organisms are observed, indicating that the silicas are associated with siliceous organisms. The postmortem siliceous organisms underwent silica diagenesis via a dissolution-precipitation mechanism following the sequence of opal-A → opal-CT → cryptocrystalline biogenic silica as the burial depth and temperature increased.

1. Introduction

After the Hirnantian glaciation at the end of Ordovician, a global eustatic transgression led to deposit a group of black shales in many regions of the world [1]. In North Africa and Arabia, the Lower Silurian organic-rich shales were deposited during Rhuddanian times (Rhuddanian = early Llandovery), which was a result of transgression, and they are the main origin of Palaeozoic sourced hydrocarbons [2]. In China, the black shales are widely distributed in the Upper Yangtze region and usually exist in the Longmaxi Formation of the lower part of the Silurian Llandovery strata, which were mainly the products of large-scale anoxic events [1,3].
The Lower Silurian Longmaxi shale in southern China is characterized by widespread gas-bearing, large-area enrichment, and high yield [4]. At present, the industrial exploitation of shale gas has been successfully realized in the Longmaxi shale [5]. Therefore, the Longmaxi shale has been regarded as a target layer for shale gas exploration [1]. Dong et al. (2014) suggested that the controlling factors of shale gas enrichment and high yield in Longmaxi Formation included: (1) stable distribution of deep-water shelf facies shale; (2) high organic matter abundance and moderate thermal evolution; (3) development of pores and fractures in siliceous rich shale; (4) stable structure, favorable preservation conditions, and over-pressured formation [6].
The high-quality reservoir of Wufeng-Longmaxi Formations is mainly siliceous shale containing biogenic silica, and the high content of biogenic silica not only makes the shale brittle, but also facilitates the development of pores and fractures, providing sufficient space for shale gas enrichment [4]. Meanwhile, there is a positive correlation between the silica content and organic carbon content of the high-quality shale in the lower part of Wufeng-Longmaxi Formation, showing that the organic carbon content increases with an increase in the silica content [7]. The high-quality shale of sweet spot intervals in the Wufeng-Longmaxi Formations in the Sichuan Basin has an average silica content of about 60% and a radiolarian content of 30%, and up to 90% of the total silica is biogenic silica [5]. Therefore, the study of biogenic silica is of great significance to obtain an in-depth understanding of the shale formation environment, organic matter enrichment, and reservoir characteristics.
Silicas in shale include terrigenous detrital silica, biogenic silica, hydrothermal silica, and authigenic silica formed during clay mineral transformation [8,9,10,11]. Terrigenous detrital silica is a weathering product of terrestrial parent rocks and can be moved to marine environments by mechanical transportation [12]. Biogenic silica is derived from opaline tests of siliceous organisms, such as radiolarians [13]. The diagenesis of siliceous organisms involves a dissolution-redeposition reaction during the conversion of opal-A to opal-CT to cryptocrystalline silica [14]. Moreover, authigenic silica, which forms during clay mineral transformation, is generated from Si released during the smectite to illite (S-I) reaction [15]. The S-I reaction is smectite + Al + K → illite + Si, in which Si decreases in the clay minerals, and the release of Si results in the formation of authigenic silica [16]. In addition, crystalline silica can be precipitated from hydrothermal fluids at temperatures in the range of 50–750 °C [17]. Under hydrothermal conditions (temperature: 100–300 °C; pressure: 3 kb), silica gel crystallizes to chalcedonic spherulites [18]. At temperatures of 300–500 °C and pressures of 0.2–4 kbar, amorphous silicas, such as kieselgel and silica gel, can transform to crystalline silicas via cristobalite and keatite [19].
In previous studies, the identification of the source of silica is mainly based on the methods of total organic carbon (TOC) analysis, X-ray diffraction (XRD), thin section analysis, scanning electron microscopy (SEM), and X-ray fluorescence (XRF) spectroscopy, involving analysis of biological structure, organic matter, mineral, and major element [20,21,22,23,24,25,26,27]. First, the analysis of major element is a necessary method to determine the source of silica. Magnall et al. (2015) utilized the correlation between SiO2/Al2O3 and K2O/Al2O3 and TiO2 of the siliceous radiolarian-bearing mudstones to judge whether the silica has a terrigenous detrital origin [28]. Adachi et al. (1986) and Yamamoto (1987) used the Al-Fe-Mn diagram and the Al/(Al + Fe + Mn) ratio to distinguish hydrothermal cherts and non-hydrothermal cherts by examining the effect of hydrothermal activities [9,29]. Rowe et al. (2008) proposed the cross-plot of Si versus Al to estimate the abundance of excess Si, which was the proxy for biogenic silica [30]. Ruiz-Ortiz et al. (1989) utilized the Si/(Si + Al + Fe + Ca) ratio to estimate the biogenic silica content of Subbetic radiolarites in respect of aluminosilicates and calcareous and ferruginous minerals [31]. Second, the analysis of mineral and organic matter plays an important role in identifying the occurrence of biogenic silica. The positive correlation between the TOC content and the quartz content confirms that a substantial proportion of silica in the shale have a biogenic origin [32,33]. Third, the biological structure being recognized in thin section, such as radiolarian and sponge spicule, can provide evidence for the presence of biogenic silica [34]. Although previous studies have proved the existence of biogenic silica in shales by excluding terrigenous detrital silica and hydrothermal silica, few studies have investigated how to exclude authigenic silica formed during clay mineral transformation. Moreover, biogenic silica has unique crystal morphology, but there are few studies on the development mechanism of the unique crystal morphology of biogenic silica.
In this study, crystal morphology, elemental, and mineral analyses of silica are conducted to exclude the possibility that cryptocrystalline silica in the Longmaxi shales is terrigenous detrital silica, hydrothermal silica, and authigenic silica formed during clay mineral transformation. Organic matter analysis and the existence of siliceous organisms confirm that the formation of cryptocrystalline silica in the Longmaxi shales is associated with siliceous organisms, proving the existence of biological silica. In addition, we establish a formation model of cryptocrystalline biogenic silica.

2. Geological Setting and Sampling

Chongqing, which is located in the margin of the Sichuan Basin, China, belongs to the southeastern part of the Upper Yangtze Plate (Figure 1A). The structure in this region is characterized by high uplift and strong compression [35]. The exposed strata include Cambrian, Ordovician, Silurian, Devonian, and Permian, and the other strata are thin or missing [36]. The Lower Silurian Longmaxi shale in southeastern Chongqing was formed in a deep-water shelf environment [37]. The black high-over mature organic-rich shales are widely distributed, very thick, strongly deformed, and shallowly buried [38].
All samples were collected from Well Yuye 1 (Figure 1B). This well is located in Lianhu Town, Pengshui County, Chongqing Province, in the eastern part of Qiyao Mountain and is situated structurally at the axis of the Guochangba anticline [39,40]. The drilling depth of Well Yuye 1 was 325.48 m, and a continuous core of the main black shale section of the Longmaxi formation was obtained [35]. In this study, 24 samples were collected from depths ranging from 170.9 m to 316.0 m (Figure 2). The samples were analyzed to investigate the origin of silica in the Lower Silurian Longmaxi shale.

3. Analytical Methods

Thin section analysis, SEM, energy dispersive spectroscopy (EDS), TOC content analysis, XRD analysis of the whole rock and clay minerals, XRF spectroscopy were performed on the 24 shale samples. The TOC, mineralogical composition, and major element analyses were conducted in the Analytical Laboratory of the Beijing Research Institute of Uranium Geology, Beijing, China. SEM and EDS were performed in the State Key Laboratory of Oil and Gas Resources and Exploration at the China University of Petroleum (Beijing), Beijing, China.

3.1. TOC

The TOC contents were determined using a CS580A carbon and sulfur analyzer and following the Chinese National Environmental Protection Standard HJ 695 (2014) [42]. First, the samples were ground to a powder, with a particle size of less than 0.097 mm (160 mesh); 0.05 g of the powdered samples were weighed and placed into a quartz cup. Second, a phosphoric acid solution (φ = 5%) was slowly added to the quartz cup until the bubbling stopped to remove the carbonate. Finally, the quartz cup was placed into the TOC analyzer and was heated to above 680 using a carrier gas rich in oxygen. The organic carbon in the samples was oxidized to CO2. Subsequently, the TOC content was detected by an infrared detector. The standard deviation was less than 3%.

3.2. Mineralogical Composition

The XRD analysis of the whole rock and clay minerals was carried out using a Panalytical X’Pert PRO X-ray diffractometer with a Cu X-ray target (40 kV voltage, 40 mA current). The operation and calculation were in accordance with the Chinese Oil and Gas Industry Standard SY/T 5163 (2018) [43].
  • Whole rock XRD analysis.
  • The samples were crushed to a powder with a particle size less than 40 μm, and the samples were measured in an angular range of 5–70° 2θ to obtain the XRD patterns. The total clay mineral content and non-clay mineral content were determined using quantitative analysis.
  • Clay mineral XRD analysis.
  • First, the samples were ground to a particle size of less than 1 mm, and powdered samples were dispersed ultrasonically in distilled water. A suspension with a particle size of less than 2 μm was extracted and was centrifugally separated to cause the clay particles to settle. After drying, the clay samples were made into oriented slices, which were analyzed in an angular range of 3–30° 2θ to obtain the XRD patterns. Quantitative analysis was used to obtain the relative contents of different clay minerals.

3.3. Major Elements

The major element contents were detected by an Axios-mAX wavelength dispersive X-ray fluorescence spectrometer, following the Chinese National Standard GB/T 14506.28 (2010) [44]. First, the samples were ground to a powder with a particle size of was less than 74 μm. Then, 0.7 g of the powdered sample was mixed with anhydrous lithium tetraborate (Li2B4O7), lithium fluoride (LiF), ammonium nitrate (NH4NO3) and lithium bromide (LiBr). The mass ratio of the sample to solvent was 1:8. Second, the mixture was melted at 1150–1250 °C to creat a glass disc. Finally, the major elements were determined on the glass disc using an XRF spectrometer. The analytical precision was better than 1%.

3.4. SEM and EDS

The experiment was performed using the HITACHI SU8010 cold field-emission scanning electron microscopy (FE-SEM) to observe the morphology of the silica, and an IXRF X-ray spectrometer was used to analyze the chemical composition. One small sample of about 1 cm3 was taken from a large sample to obtain a natural surface. The surface was sprayed with gold conductive film with an appropriate thickness before the analysis [45]. The composition of the target spot or micro-area was analyzed by EDS.

4. Results

4.1. Organic Matter Characteristics

The TOC contents of the 24 samples of the Longmaxi shales are presented in Table 1. The TOC contents range from 1.05% to 2.57%, with an average of 1.64%. Additionally, the vitrinite reflectance (Ro) value is in the range of 1.62%−2.26%, with an average of 2.04% [35], indicating that the shales of Longmaxi Formation belong to high-over mature shales.

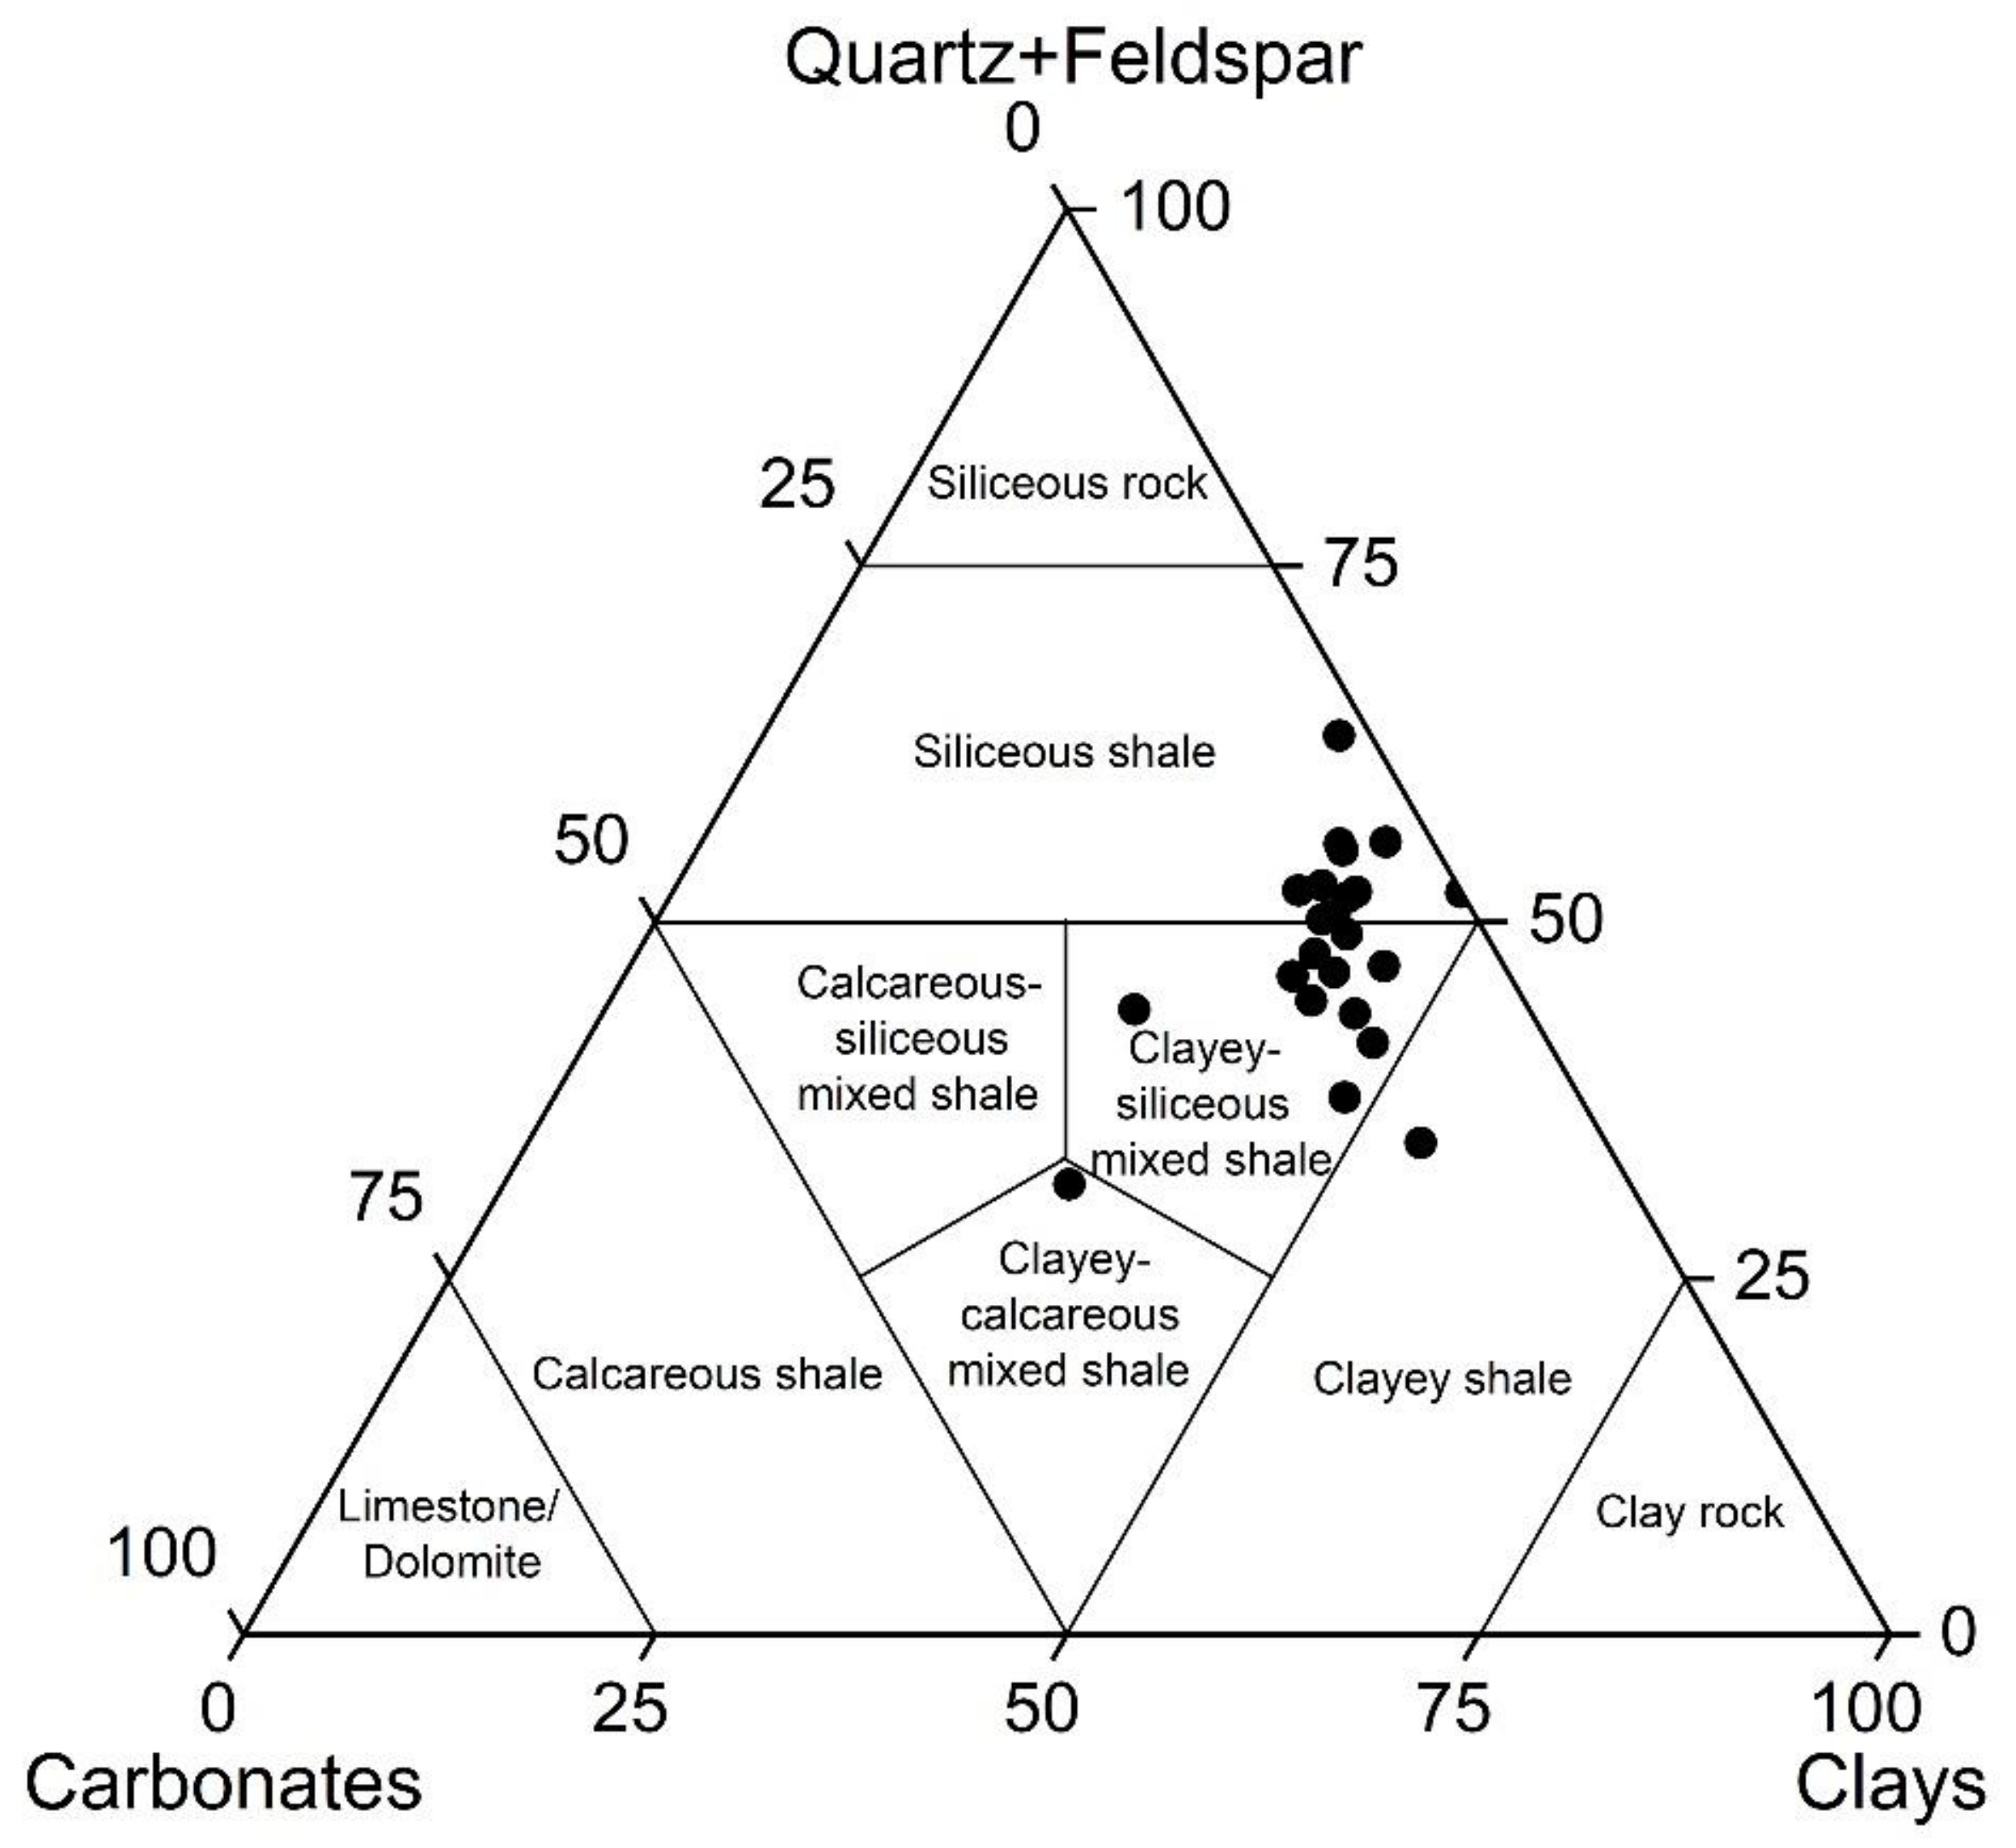
4.2. Mineral Composition

The XRD analysis suggests that the Lower Silurian Longmaxi shales are dominated by quartz and clay minerals. The analysis results are listed in Table 1. The quartz contents range from 25.2% to 46.5% (average: 36.1%), and the clay mineral contents range from 31.7% to 53.0% (average: 41.0%). Additionally, the clay minerals consist of I/S (average: 12.6%), illite (average: 25.7%), kaolinite (average: 0.9%), and chlorite (average: 2.2%). Other minerals include K-feldspar, plagioclase, calcite, dolomite, and pyrite. The contents of K-feldspar are 0.7%–4.5% (average: 2.8%), whereas the plagioclase contents are 5.9%–13.4% (average: 9.2%); the contents of K-feldspar are lower than that of plagioclase. Calcite and dolomite account for 1.9%–6.6% and 3.4%–30.7%, with an average of 3.4% and 8.8%, respectively. Pyrite is rare, with a content of less than 3.0%.
According to the results of XRD analysis, the lithofacies types of shales are divided by ternary diagram of mineral compositions [46]. The classification results show that the Longmaxi shales are mainly including siliceous shale and clayey-siliceous mixed shale (Figure 3).

4.3. Major Elements

The contents of the major element oxides of the 24 samples of the Longmaxi shales are presented in Table 2, including the loss on ignition (LOI). The composition of the major element oxides is consistent with that of the whole rock minerals. SiO2 is the most abundant of all oxides, ranging from 47.29% to 66.84% (average: 62.74%), the Al2O3 content ranges from 10.95% to 16.6% (average: 13.47%), and the CaO content ranges from 1.16% to 8.72% (average: 2.48%). The ternary plot of SiO2-Al2O3-CaO shows that the Longmaxi shales are enriched in SiO2, whereas Al2O3 and CaO have relatively low levels (Figure 4).
TFe2O3 represents total iron, including Fe2O3 and FeO, and its content ranges from 3.6% to 6.02% (average: 4.82%). The average MgO content is 2.34% (range: 1.5%–5.0%), the average Na2O content is 1.33% (range: 0.73–1.69%), and the average K2O content is 3.69% (range: 3.21–4.63%). In addition, the average contents of the other major element oxides are less than 1%, i.e., TiO2 (0.7%), P2O5 (0.12%), and MnO (0.04%).

5. Discussion

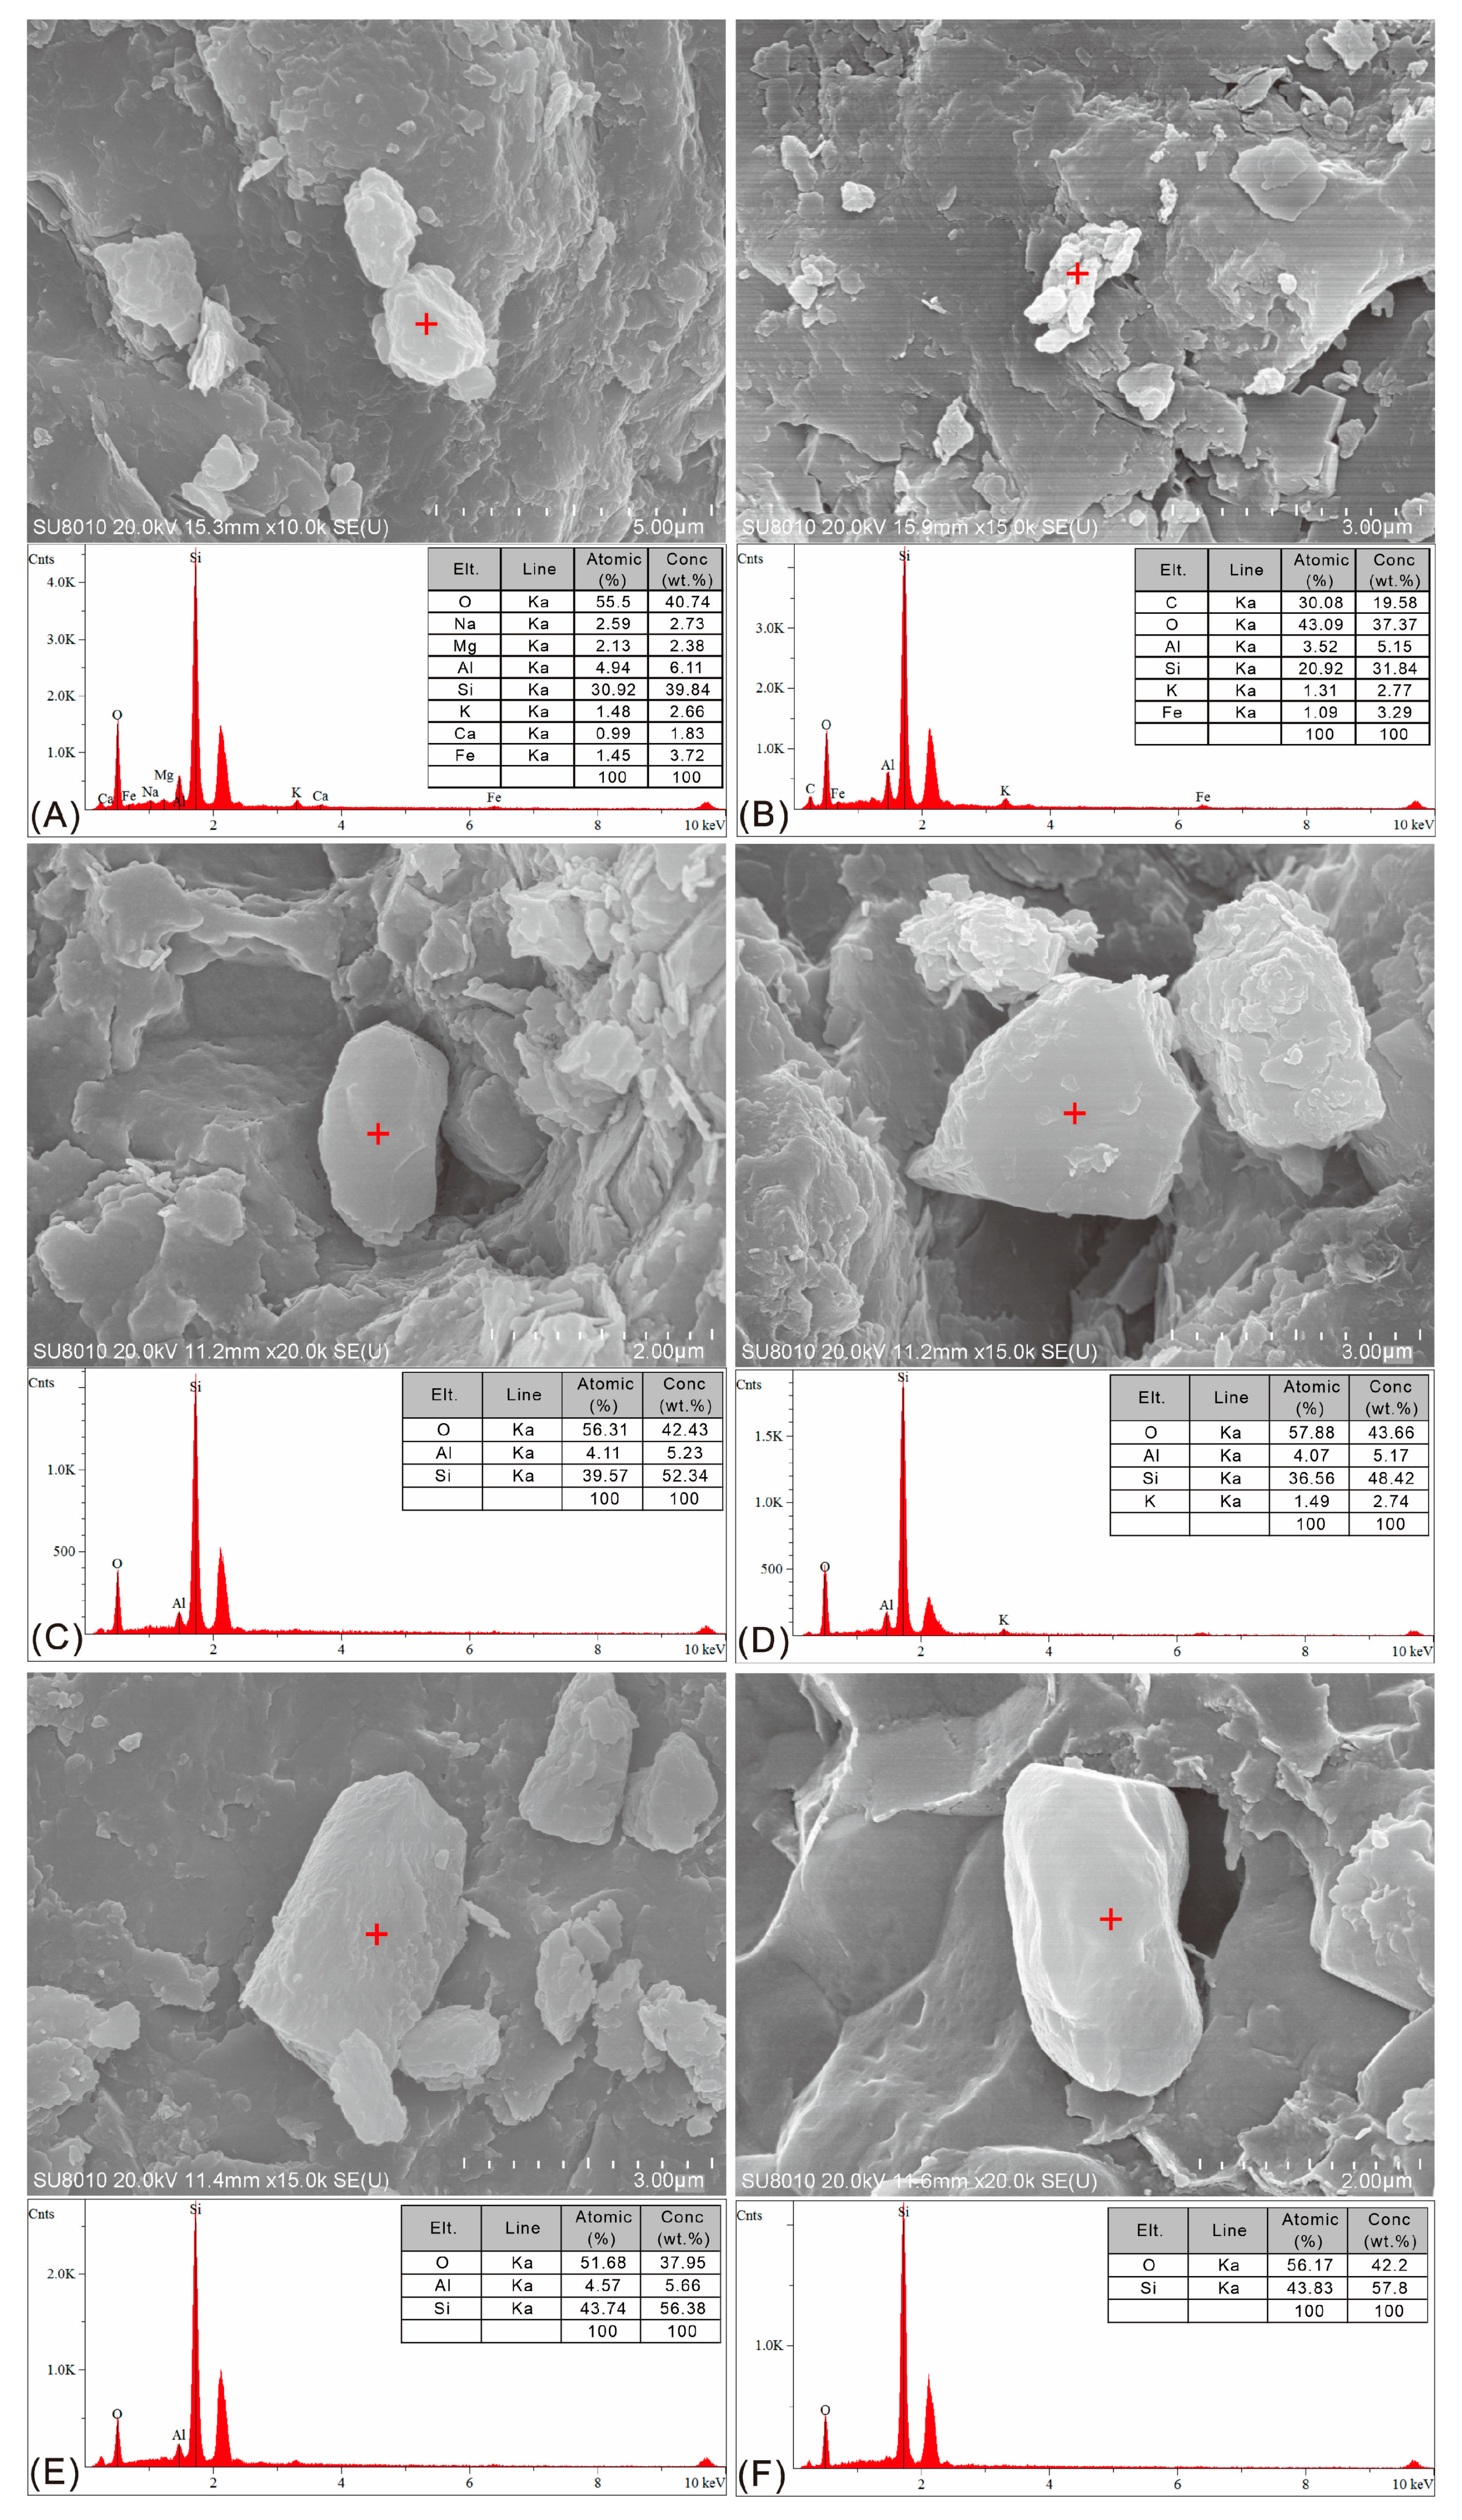
5.1. Crystal Morphology of Silica

The SEM observations and EDS analysis of the samples of the Longmaxi shale indicate a considerable amount of cryptocrystalline silicas with inferior crystallinity and irregular shape, and some crystals even have a high concentration of C element (Figure 5). It is obviously different in the morphology from terrigenous detrital silica (with subrounded, subangular, and angular outlines), the authigenic silica formed during smectite-illite transformation (granular silica, grain size is <1 μm; sheet-like silica, thickness is <100 nm), and the hydrothermal silica (trigonal structure) [11,12,47].
Natural hydrous silicas include opal-A and opal-CT [48]. Opal-A is near amorphous and highly disordered, consisting primarily of radiolarian and sponge spicules; Opal-CT is composed of disordered α-cristobalite and α-tridymite and formed from biogenic opal-A via a solution-precipitation mechanism during diagenesis; At high temperatures, opal-CT transforms into cryptocrystalline silica through a second solution-precipitation process [14,48,49,50]. Therefore, silicas originating from siliceous marine organisms have poorly crystalline morphology, and some have the typical morphology of siliceous tests. Therefore, the crystal morphology is regarded as a suitable method to identify biogenic silica [20].
Owing to the poorly crystalline morphology of the observed silicas, which is different from that of the detrital silica, authigenic silica, and hydrothermal silica, it is speculated that biogenic silicas are present in the Longmaxi shale.

5.2. Origin of Silica

5.2.1. Assessment of Detrital Input

In marine sediments, aluminum and titanium are nearly terrigenous [51]. Al always represents the aluminosilicate mineral in most sediments [52]. Moreover, Ti usually occurs in clay minerals and heavy minerals [23,53]. During weathering and transportation, the relative abundances of Si, Al, and Ti typically remain unchanged [8].
Normalization of the elements to Al is common practice in the assessment of detrital input [28,54]. The uniform K2O/Al2O3 ratios of the Longmaxi shales are consistent with terrestrial muscovite, whose molar proportion of K2O/Al2O3 is 0.29 [28]. However, there is no correlation between K2O/Al2O3 and SiO2/Al2O3 (Figure 6A). In terms of TiO2, there is a negative correlation with SiO2/Al2O3 (Figure 6B). These results provide evidence that a considerable proportion of silica in the Longmaxi shale is nondetrital input [28].

5.2.2. Assessment of Clay Mineral Transformation

The excess Si represents the amount of SiO2 that cannot be explained by the aluminosilicate phase [24]. The excess Si content of the samples (i.e., above normal detrital background) is calculated as follows [24,25,32]:
Siexcess = Sisample − Alsample × (Si/Al)background
The (Si/Al)background is the ratio between Si and Al in the detrital material. The value of the (Si/Al)background is used for the average shale; it is typically set at 3.11 [24,25,26,32,55]. Based on Equation (1), a maximum of 11% of the SiO2 in the Longmaxi shales cannot be explained by the aluminosilicate phase. The excess Si content ranges from 0.41–10.88%, with an average of 7.16% (Table 2).
The smectite to illite reaction causes the release of Si into solution, and the Si released in the illitization of smectite is partly precipitated to form authigenic silica [15]. Van de Kamp (2008) put forward the following equation to illustrate this reaction, assuming no change in the Al2O3 content [56]:
1.308[(Al3.15Mg0.85)(Si8.00)O20(OH)4(Na0.85)2H2O (smectite) + (0.06 Fe2O3 + 0.56 K2O +
0.02 CaO)] → [(Al4.12Fe0.1Mg0.56)(Si7.17)O20(OH)4(K1.47Na0.01Ca0.03)] (illite, 787.2 g) +
3.29 SiO2 (197.7 g) + 0.56 Na2O + 0.55 MgO + 3.23 H2O
According to Equation (2), when 787.2 g illite is generated, 197.7 g SiO2 is released during the smectite to illite reaction. As a result, the content of authigenic silica formed during clay mineral transformation should be positively correlated with the illite content. However, the illite content is uncorrelated with the SiO2 content (Figure 7A) and negatively correlated with the quartz content (Figure 7B) and the excess Si content (Figure 7C). In addition, there is a negative correlation between the Al2O3 content and excess Si content (Figure 7D).
These results indicate that the Si released during illitization of smectite [15] is not the source of the authigenic silica [22], demonstrating that a substantial proportion of the silica in the Longmaxi shale is not derived from clay mineral transformation.

5.2.3. Assessment of Hydrothermal Alteration

Previous research has proved that Fe and Mn originate from the hydrothermal solutions of submarine volcanism, and Al is nearly terrigenous [51]. The Al concentration of the Longmaxi shale ranges from 5.8% to 8.79% (average: 7.13%), the Fe concentration ranges from 2.52% to 4.21% (average: 3.37%), and the Mn concentration ranges from 0.02% to 0.12% (average: 0.03%). The element concentrations of Al, Fe, and Mn are calculated from the contents of Al2O3, TFe2O3, and MnO, respectively.
Adachi et al. (1986) proposed the Al-Fe-Mn diagram, which shows the difference in chemical composition between hydrothermal and non-hydrothermal siliceous rock [29]. The influence of hydrothermal activities on the chemical composition of the Longmaxi shales can be identified using this diagram [9]. In the Al-Fe-Mn diagram, all the samples of the Longmaxi shales have extremely low Mn concentrations and are located in the non-hydrothermal origin area, indicating that hydrothermal activities had no effect on the Longmaxi shales during sedimentation and diagenesis and a large proportion of the silicas was not derived from hydrothermal dissolution (Figure 8).

5.2.4. Biogenic Origin of Silica

The calculation results of the major oxides of the Longmaxi shales indicate that all samples have high SiO2/Al2O3 ratios (Table 2), ranging from 3.57 to 5.43, with an average of 4.69. It is generally believed that the ratio of SiO2/Al2O3 in the average crust is about 3, and it has been suggested that if ratio of SiO2/Al2O3 is greater than 3, the portion of SiO2 exceeding Al2O3 can be regarded as biogenic silica [51]. Moreover, in the cross-plot of Si versus Al, almost all the samples of the Longmaxi shales are located in the area above the illite Si/Al line (Figure 9), showing that they have excess Si, which is indicative of a considerable proportion of biogenic silica [30].
In addition, the Al/(Al + Fe + Mn) ratio is typically used to estimate the influence of hydrothermal activities on marine sediments, and the ratio increases with a decrease in the hydrothermal input [9,29,57]. The Al/(Al + Fe + Mn) ratio of hydrothermal precipitates is 0.01, and the value of biogenic cherts is 0.60 [29]. The Al/(Al + Fe + Mn) ratio of the Longmaxi shales ranges from 0.57 to 0.74 (average: 0.68) (Table 2, Figure 10), which is close to the value of biogenic cherts, indicating that the silicas in the Longmaxi shales are primarily of biogenic origin.
Furthermore, the Si/(Si + Al + Fe + Ca) ratio is used to estimate the biogenic silica content of shales [31,53]. The value of Si/(Si + Al + Fe + Ca) for 30 samples of Middle and Late Jurassic radiolarites of the Subbetic in southern Spain ranges from 0.661 to 0.90 (average: 0.784) (Figure 10) [31]. Meanwhile, the Si/(Si + Al + Fe + Ca) ratio of the Longmaxi shales ranges from 0.58 to 0.75 (average: 0.70) (Table 2, Figure 10), which is close to the values of the Subbetic radiolarites, demonstrating that the silicas are mainly of biogenic origin. All of the element concentrations are calculated from the oxide contents of the major elements.

5.3. Relationship between Mineral and TOC

The majority of organic carbon in marine shales is derived from phytoplankton [58]. As the basis of the marine food chain, the phytoplankton converts CO2 into organic matter through photosynthesis [59]. Silicon is an important nutrient in phytoplankton growth, and phytoplankton, such as diatoms, has a high growth rate in an environment with sufficient silicon [60]. The nutrient silicon plays an important role in determining the proportion of inorganic carbon and organic carbon [61]. Primary production controls organic carbon enrichment in the ocean [62].
In addition, the lipid content of modern radiolarians is high and is similar to that of diatoms [63]. Moreover, radiolarians often co-exist with a large number of symbiotic algae, which supply nutrients to their hosts by translocating the photosynthates [64,65]. There is a positive correlation between the radiolarian abundance and the TOC content of Changhsingian radiolarian fauna [66]. Therefore, siliceous zooplankton, especially radiolarians, also contributes to the enrichment of organic carbon in the shale.
Furthermore, many previous studies have focused on the vertical distribution of plankton in the ocean. Phytoplankton occurs at depths ranging from ∼40 to 100 m in the Southern Ocean [67]. Radiolarians are mainly found at depths of 40–300 m in the Japan Sea [68]. The depth range of radiolarians is generally greater than that of phytoplankton. As a result, the radiolarians reach the seafloor faster after death than phytoplankton, shortening the residence time in the water during settlement and reducing the decomposition of organic matter, which is conducive to the enrichment of organic matter [63].
The quartz contents of the Longmaxi shale are 25.2–46.5%, and the TOC contents are 1.05–2.57% (Table 1). Moreover, the excess Si contents are 0.41–10.88% (Table 2). The relationship between the TOC content and the quartz and excess Si contents shows that the TOC content increases with an increase in the quartz and excess Si content (Figure 11). The positive correlation between the TOC content and the quartz and excess Si contents in the Longmaxi shales is the result of the accumulation of abundant siliceous organisms on the seabed, and then silica and organic matter are buried and deposited together [69]. This result provides evidence that the silica in the shale may be derived from siliceous organisms in the ocean.

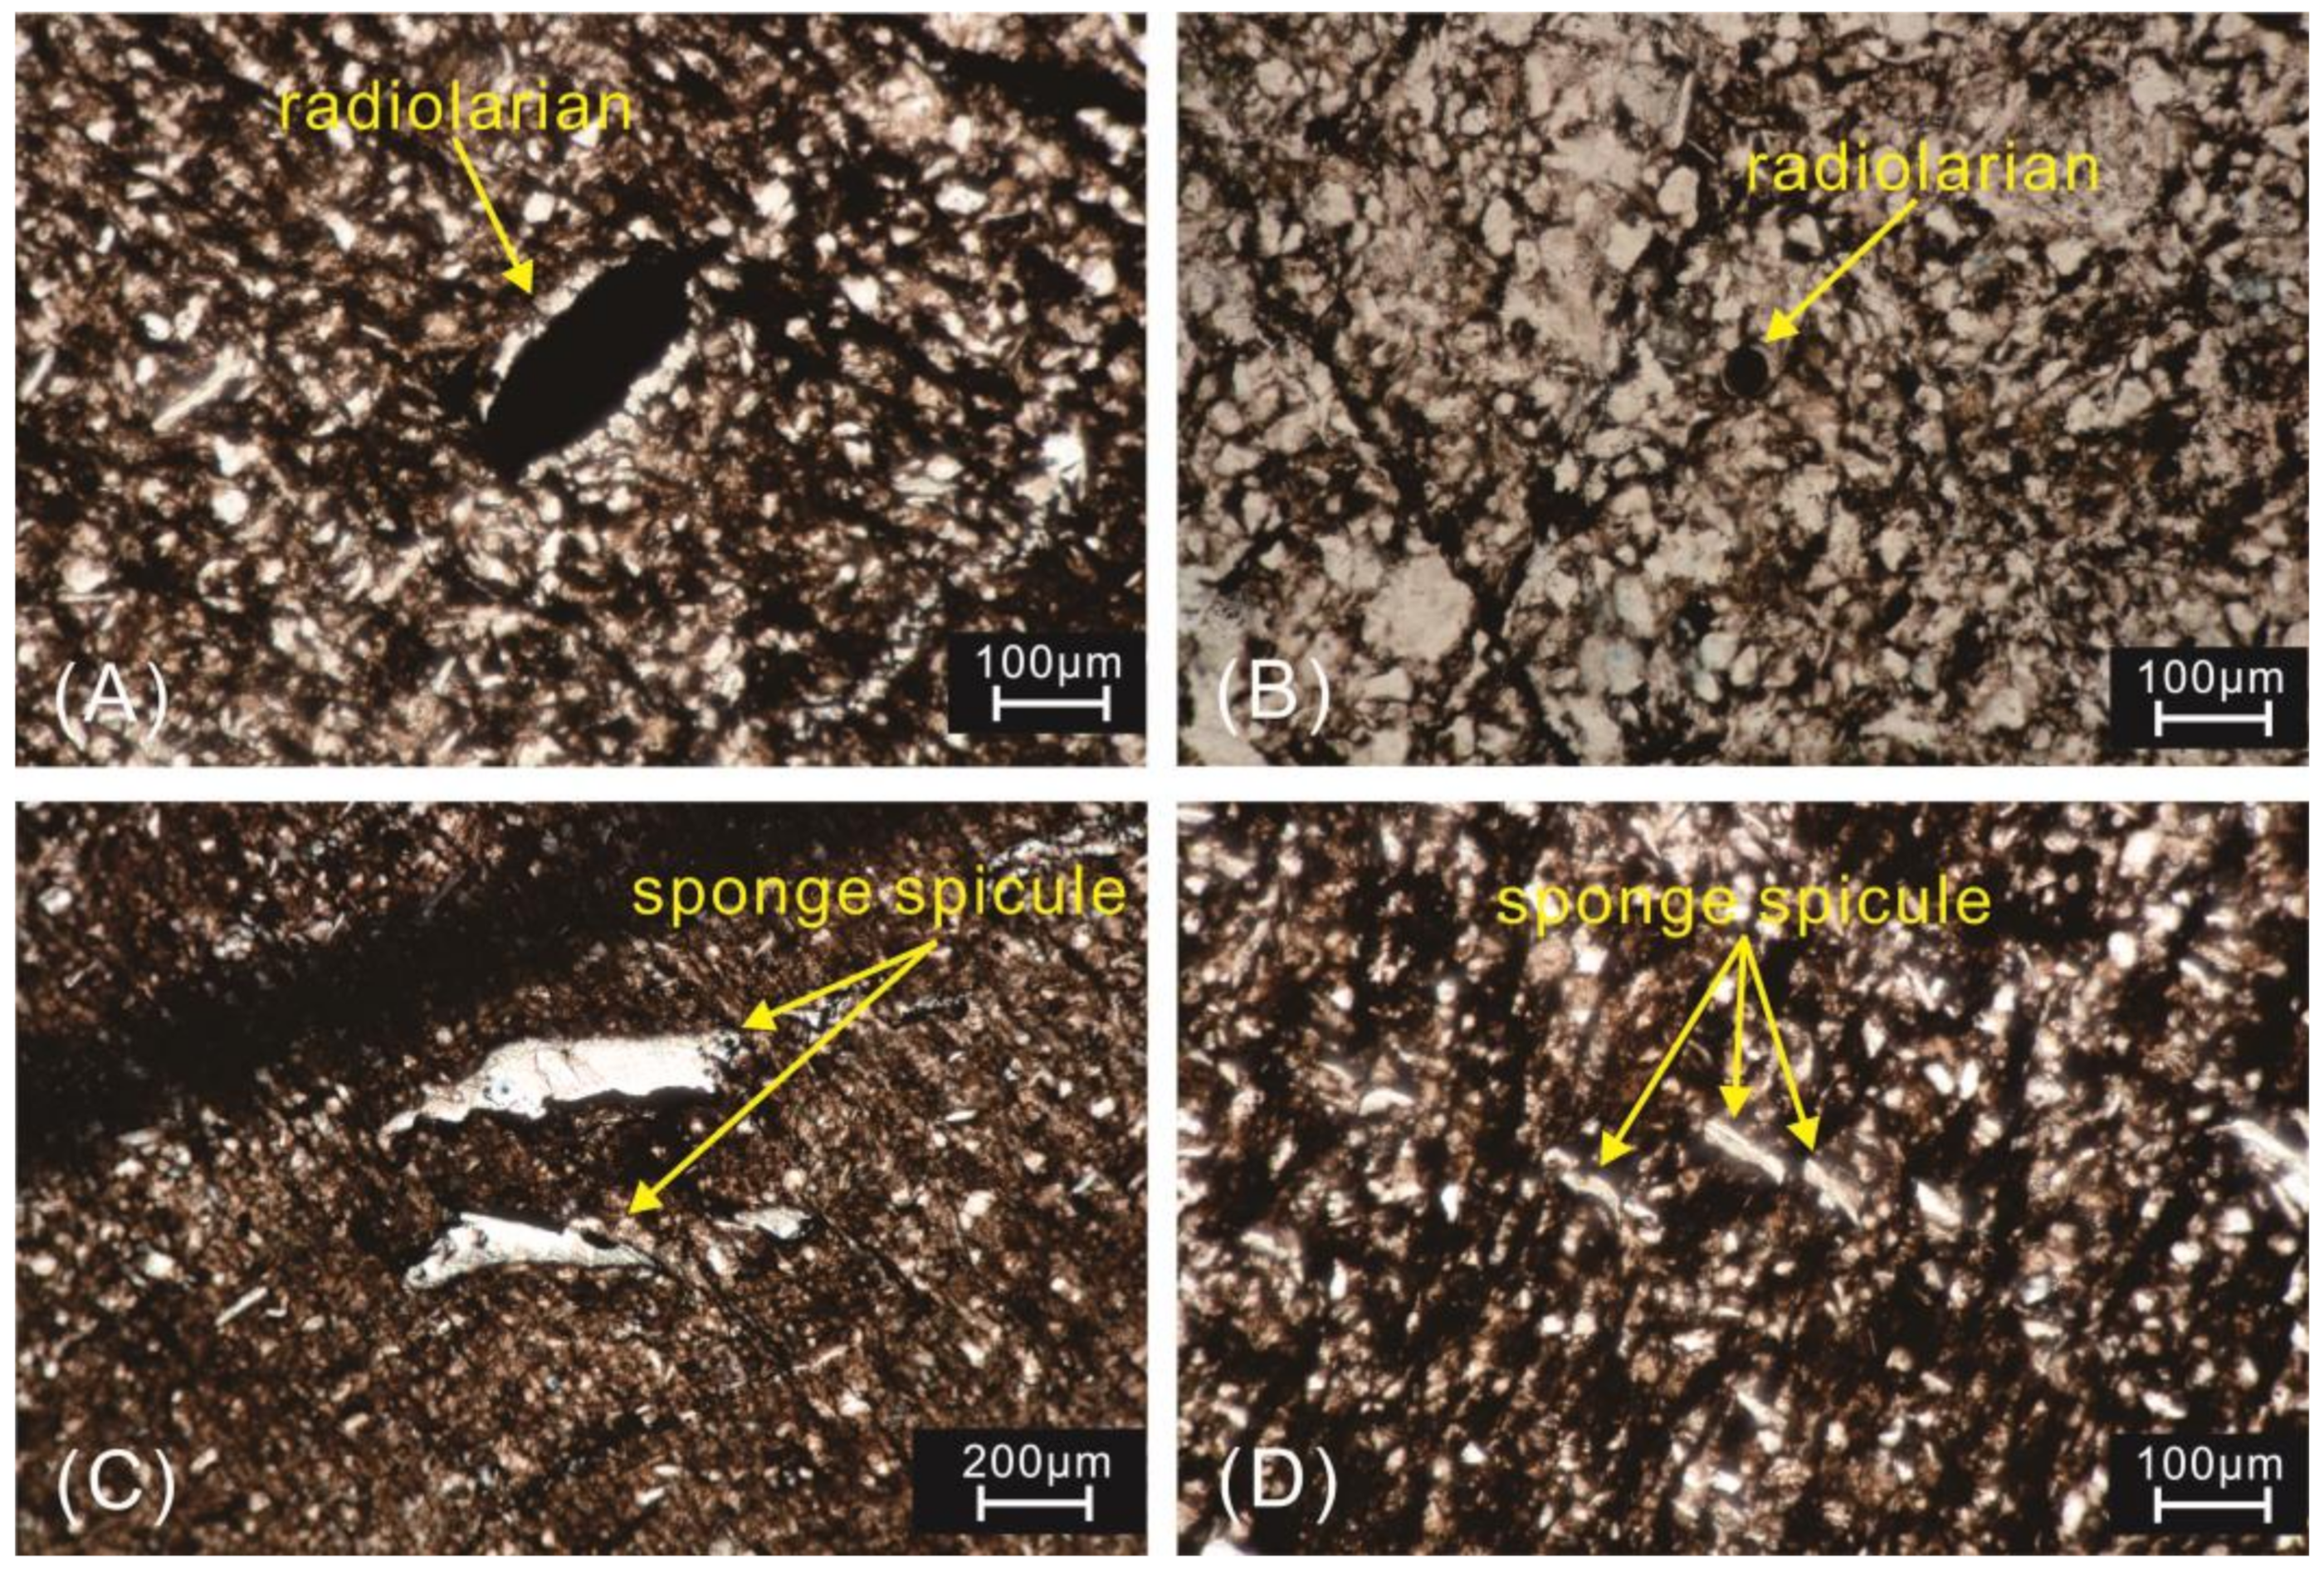
5.4. The Link between Ancient Organism and Biogenic Silica

Thin section analysis of the samples of the Longmaxi shales from Well Yuye 1 indicates a considerable amount of ancient organism microfossils, primarily radiolarians and sponge spicules (Figure 12). The ancient organism microfossils provide evidence for the presence of biogenic silica [34,58,70].
The radiolarians are spherical or ellipsoidal, with a particle size of 40–260 μm (Figure 12A,B). The chemical composition of the radiolarian test is SiO2, which belongs to the siliceous test [71]. Some radiolarian tests have a high degree of crystallization, and the tests are dissolved and have holes (Figure 12A). In addition, some radiolarians are well preserved and have circular tests (Figure 12B). Moreover, the sponge spicules are in the shape of monaxons, with a length of 70–700 μm. One end of the sponge spicule is thick, and the other end is sharp (Figure 12C,D). Under natural conditions, siliceous sponges are catalyzed by silicatein to synthesize spicules (biogenic silica), and the Si concentration of the siliceous sponge spicules is 200 times higher than the total concentration of the other elements [72].
Silicon is nutrient element required for the growth of siliceous marine organisms, such as radiolarians and sponge spicules, and siliceous organisms flourish in silicon-rich water [27]. During growth and development, siliceous marine organisms generate siliceous tests/skeletons by absorbing dissolved silica from the water, then they are eventually buried by sediments in the postmortem stage [58]. Most of the biogenic silicas are dissolved again, and only a small fraction remains in the sediments; the burial/production ratio of biogenic silica is only ∼3% [73].
A large number of siliceous organisms are present in the Longmaxi shales, such as radiolarians and sponge spicules. High productivity and settling velocity of siliceous organisms are beneficial to their preservation and the subsequent diagenetic silica conversion after the dissolution of the siliceous tests/skeletons [74]. Therefore, the cryptocrystalline silicas observed in the samples of the Longmaxi shales are associated with siliceous organisms.

5.5. Diagenetic Transformation Mechanism of Biogenic Silica

Cryptocrystalline silicas with inferior crystallinity and irregular shape are ubiquitous in the Longmaxi shales (Figure 5). Our comprehensive analysis indicates that the cryptocrystalline silicas are primarily biogenic origin.
During the Early Silurian period, siliceous marine organisms, such as radiolarians and sponge spicules, flourished in the southeastern Chongqing area (Figure 12). Dissolved silica was extracted from the seawater by the siliceous organisms and was used as a nutrient to generate opaline tests/skeletons and accomplish biological fixation [75]. After the death of the siliceous organisms, the silica was recycled by dissolution of the opaline tests/skeletons [74]. The buried biogenic opal-A experienced continuous dissolution, and the dissolved silica diffused into the seawater [76].
After burial, in addition to the dissolution of partial siliceous organisms, some underwent diagenesis. The diagenetic transformation of the biogenic silica in the Longmaxi shales followed a sequence with increasing depth and temperature: unstable amorphous biogenic opal-A → disordered metastable opal-CT → stable cryptocrystalline biogenic silica [14,74,77]. The dissolved silica of the biogenic opal-A supplied a silica source to form opal-CT through precipitation [74]. In the initial stage, individual opal-CT blades with irregular serrated edges crossed each other, and incipient lepisheres (spherical aggregates) were generated when numerous opal-CT blades were combined; Subsequently, groups of opal-CT blades were regularly intergrown to form complete lepispheres; Finally, several complete lepispheres merged to generate composite lepispheres [78]. Moreover, cryptocrystalline biogenic silica formed from opal-CT via a dissolution-reprecipitation mechanism [49,79].
On the basis of summarizing the schematic diagrams of the cycle and diagenetic transformation of silicas established by the predecessors [74,75,77], we have established a formation model of cryptocrystalline biogenic silica in Longmaxi shale (Figure 13). Although the previous schematic diagrams of the cycle and diagenetic transformation of silicas are relatively perfect, the morphology of products at each stage, such as biogenic opal-A, opal-CT, and cryptocrystalline biogenic silica, are not shown in the schematic diagrams. In addition, the opal-CT has different structures at different growth stages, including individual opal-CT blades, incipient lepisheres, complete lepispheres, and composite lepispheres [78], which are not shown in the previous schematic diagrams. Moreover, there are few studies on the morphology of cryptocrystalline biogenic silica, and people have no intuitive understanding of its morphology. Based on the deficiency of previous schematic diagrams, we have systematically established a formation model of cryptocrystalline biogenic silica on the basis of the comprehensive previous research results, including biogenic silica cycle and diagenetic transformation. The model diagram presents the morphology of products at each stage, and the cryptocrystalline biogenic silica in the Longmaxi shale is integrated into the model diagram as the final product of diagenetic transformation, which makes the model diagram more complete. The diagenetic transformation mechanism of biogenic silica in the Longmaxi shales is shown in Figure 13.

6. Conclusions

Analyses of crystal morphology, major elements, mineral composition, TOC content, and ancient organisms of the Longmaxi shales from Well Yuye 1 were conducted. We obtained the following conclusions:
  • Numerous cryptocrystalline silicas with poorly crystalline morphology, which differed from that of detrital silica, authigenic silica, and hydrothermal silica, proved that there may be biogenic silicas occurrence in the Longmaxi shale.
  • The lack of correlation between K2O/Al2O3 and SiO2/Al2O3 and a negative correlation between TiO2 and SiO2/Al2O3 excludes a terrigenous detrital origin of the silicas. Moreover, the lack of correlation between illite and SiO2, and negative correlations between illite and quartz and excess Si and between Al2O3 and excess Si proved that the silicas were not derived from clay mineral transformation. In addition, the fact that all samples were located in the non-hydrothermal origin area in the Al-Fe-Mn diagram excludes a hydrothermal origin of the silicas.
  • Almost all samples plotted above the illite Si/Al line in the cross-plot of Si versus Al, suggesting the existence of biogenic silica. Furthermore, the mean values of Al/(Al + Fe + Mn) and Si/(Si + Al + Fe + Ca) were 0.68 and 0.70, respectively, which were close to the values of biogenic silica. These pieces of evidence prove that the silicas are primarily of biogenic origin.
  • There was a considerable amount of ancient organism microfossils in the Longmaxi shales and positive correlations between TOC and quartz and excess Si, indicating that silicas are associated with siliceous organisms.
  • The postmortem siliceous organisms of the Early Silurian in the southeastern Chongqing area underwent a diagenetic process of opal-A → opal-CT → cryptocrystalline biogenic silica after burial. This sequence proceeded via a dissolution-precipitation mechanism as the burial depth and temperature increased.

Author Contributions

Conceptualization, Y.L. (Yutao Liang) and J.Z.; Formal analysis, Y.L. (Yutao Liang); Methodology, Y.L. (Yutao Liang), Y.L. (Yang Liu), and X.T.; Investigation, Z.L. and J.D.; Writing-Original Draft Preparation, Y.L. (Yutao Liang); Writing-Review & Editing, Y.L. (Yutao Liang); Supervision, Y.W. and S.Y.; Project administration, J.Z.; Resources, J.Z. All authors have read and agreed to the published version of the manuscript.

Funding

This research was jointly funded by the National Science and Technology Major Project (Grant No. 2016ZX05034–002–001) and the National Natural Science Foundation of China (Grant No. 41927801).

Acknowledgments

The authors thank the three anonymous reviewers for providing valuable comments and suggestions.

Conflicts of Interest

The authors declare no conflict of interest.

References

  1. Rong, J.; Wang, Y.; Zhan, R.; Fan, J.; Huang, B.; Tang, P.; Li, Y.; Zhang, X.; Wu, R.; Wang, G.; et al. Silurian integrative stratigraphy and timescale of China. Sci. China Earth Sci. 2019, 62, 89–111. [Google Scholar] [CrossRef]
  2. Lüning, S.; Craig, J.; Loydell, D.K.; Štorch, P.; Fitches, B. Lower Silurian ‘hot shales’ in North Africa and Arabia: Regional distribution and depositional model. Earth Sci. Rev. 2000, 49, 121–200. [Google Scholar] [CrossRef]
  3. Fan, J.; Melchin, M.J.; Chen, X.; Wang, Y.; Zhang, Y.; Chen, Q.; Chi, Z.; Chen, F. Biostratigraphy and geography of the Ordovician-Silurian Lungmachi black shales in South China. Sci. China Earth Sci. 2011, 54, 1854–1863. [Google Scholar] [CrossRef]
  4. Dong, D.; Wang, Y.; Li, X.; Zou, C.; Guan, Q.; Zhang, C.; Huang, J.; Wang, S.; Wang, H.; Liu, H.; et al. Breakthrough and prospect of shale gas exploration and development in China. Nat. Gas Ind. 2016, 36, 19–32. (In Chinese) [Google Scholar] [CrossRef] [Green Version]
  5. Ma, Y.; Cai, X.; Zhao, P. China’s shale gas exploration and development: Understanding and practice. Pet. Explor. Dev. 2018, 45, 589–603. [Google Scholar] [CrossRef]
  6. Dong, D.; Gao, S.; Huang, J.; Guan, Q.; Wang, S.; Wang, Y. A discussion on the shale gas exploration & development prospect in the Sichuan Basin. Nat. Gas Ind. 2014, 34, 1–15. (In Chinese) [Google Scholar]
  7. Jin, Z.; Hu, Z.; Gao, B.; Zhao, J. Controlling factors on the enrichment and high productivity of shale gas in the Wufeng-Longmaxi Formations, southeastern Sichuan Basin. Earth Sci. Front. 2016, 23, 1–10. (In Chinese) [Google Scholar]
  8. Sugisaki, R.; Yamamoto, K.; Adachi, M. Triassic bedded cherts in central Japan are not pelagic. Nature 1982, 298, 644–647. [Google Scholar] [CrossRef]
  9. Yamamoto, K. Geochemical characteristics and depositional environments of cherts and associated rocks in the Franciscan and Shimanto Terrenes. Sediment. Geol. 1987, 52, 65–108. [Google Scholar] [CrossRef]
  10. Milliken, K.L.; Ergene, S.M.; Ozkan, A. Quartz types, authigenic and detrital, in the Upper Cretaceous Eagle Ford Formation, South Texas, USA. Sediment. Geol. 2016, 339, 273–288. [Google Scholar] [CrossRef]
  11. Metwally, Y.M.; Chesnokov, E.M. Clay mineral transformation as a major source for authigenic quartz in thermo-mature gas shale. Appl. Clay Sci. 2012, 55, 138–150. [Google Scholar] [CrossRef]
  12. Haines, J.; Mazzullo, J. The original shapes of quartz silt grains: A test of the validity of the use of quartz grain shape analysis to determine the sources of terrigenous silt in marine sedimentary deposits. Mar. Geol. 1988, 78, 227–240. [Google Scholar] [CrossRef]
  13. Schieber, J.; Krinsley, D.; Riciputi, L. Diagenetic origin of quartz silt in mudstones and implications for silica cycling. Nature 2000, 406, 981–985. [Google Scholar] [CrossRef] [PubMed]
  14. Kastner, M.; Keene, J.B.; Gieskes, J.M. Diagenesis of siliceous oozes—I. Chemical controls on the rate of opal-A to opal-CT transformation—An experimental study. Geochim. Cosmochim. Acta 1977, 41, 1041–1059. [Google Scholar] [CrossRef]
  15. Peltonen, C.; Marcussen, Ø.; Bjørlykke, K.; Jahren, J. Clay mineral diagenesis and quartz cementation in mudstones: The effects of smectite to illite reaction on rock properties. Mar. Pet. Geol. 2009, 26, 887–898. [Google Scholar] [CrossRef]
  16. Hower, J.; Eslinger, E.V.; Hower, M.E.; Perry, E.A. Mechanism of burial metamorphism of argillaceous sediment: 1. Mineralogical and chemical evidence. Geol. Soc. Am. Bull. 1976, 87, 725–737. [Google Scholar] [CrossRef]
  17. Rusk, B.G.; Lowers, H.A.; Reed, M.H. Trace elements in hydrothermal quartz: Relationships to cathodoluminescent textures and insights into vein formation. Geology 2008, 36, 547–550. [Google Scholar] [CrossRef]
  18. Oehler, J.H. Hydrothermal crystallization of silica gel. Geol. Soc. Am. Bull. 1976, 87, 1143–1152. [Google Scholar] [CrossRef]
  19. Bettermann, P.; Liebau, F. The transformation of amorphous silica to crystalline silica under hydrothermal conditions. Contrib. Mineral. Petrol. 1975, 53, 25–36. [Google Scholar] [CrossRef]
  20. Liu, G.; Zhai, G.; Zou, C.; Cheng, L.; Guo, X.; Xia, X.; Shi, D.; Yang, Y.; Zhang, C.; Zhou, Z. A comparative discussion of the evidence for biogenic silica in Wufeng-Longmaxi siliceous shale reservoir in the Sichuan basin, China. Mar. Pet. Geol. 2019, 109, 70–87. [Google Scholar] [CrossRef]
  21. Yang, X.; Yan, D.; Wei, X.; Zhang, L.; Zhang, B.; Xu, H.; Gong, Y.; He, J. Different formation mechanism of quartz in siliceous and argillaceous shales: A case study of Longmaxi Formation in South China. Mar. Pet. Geol. 2018, 94, 80–94. [Google Scholar] [CrossRef]
  22. Zhao, J.; Jin, Z.; Jin, Z.; Wen, X.; Geng, Y. Origin of authigenic quartz in organic-rich shales of the Wufeng and Longmaxi Formations in the Sichuan Basin, South China: Implications for pore evolution. J. Nat. Gas Sci. Eng. 2017, 38, 21–38. [Google Scholar] [CrossRef]
  23. Zhao, J.; Jin, Z.; Jin, Z.; Geng, Y.; Wen, X.; Yan, C. Applying sedimentary geochemical proxies for paleoenvironment interpretation of organic-rich shale deposition in the Sichuan Basin, China. Int. J. Coal Geol. 2016, 163, 52–71. [Google Scholar] [CrossRef]
  24. Ross, D.J.K.; Bustin, R.M. Sediment geochemistry of the Lower Jurassic Gordondale Member, northeastern British Columbia. Bull. Can. Pet. Geol. 2006, 54, 337–365. [Google Scholar] [CrossRef]
  25. Ross, D.J.K.; Bustin, R.M. Investigating the use of sedimentary geochemical proxies for paleoenvironment interpretation of thermally mature organic-rich strata: Examples from the Devonian–Mississippian shales, Western Canadian Sedimentary Basin. Chem. Geol. 2009, 260, 1–19. [Google Scholar] [CrossRef]
  26. Turgeon, S.; Brumsack, H.-J. Anoxic vs dysoxic events reflected in sediment geochemistry during the Cenomanian–Turonian Boundary Event (Cretaceous) in the Umbria–Marche Basin of central Italy. Chem. Geol. 2006, 234, 321–339. [Google Scholar] [CrossRef]
  27. Ran, B.; Liu, S.; Jansa, L.; Sun, W.; Yang, D.; Ye, Y.; Wang, S.; Luo, C.; Zhang, X.; Zhang, C. Origin of the Upper Ordovician–lower Silurian cherts of the Yangtze block, South China, and their palaeogeographic significance. J. Asian Earth Sci. 2015, 108, 1–17. [Google Scholar] [CrossRef]
  28. Magnall, J.M.; Gleeson, S.A.; Paradis, S. The Importance of Siliceous Radiolarian-Bearing Mudstones in the Formation of Sediment-Hosted Zn-Pb ± Ba Mineralization in the Selwyn Basin, Yukon, Canada. Econ. Geol. 2015, 110, 2139–2146. [Google Scholar] [CrossRef]
  29. Adachi, M.; Yamamoto, K.; Sugiski, R. Hydrothermal chert and associated siliceous rocks from the northern Pacific: Their geological significance as indication of ocean ridge activity. Sediment. Geol. 1986, 47, 125–148. [Google Scholar] [CrossRef]
  30. Rowe, H.D.; Loucks, R.G.; Ruppel, S.C.; Rimmer, S.M. Mississippian Barnett Formation, Fort Worth Basin, Texas: Bulk geochemical inferences and Mo–TOC constraints on the severity of hydrographic restriction. Chem. Geol. 2008, 257, 16–25. [Google Scholar] [CrossRef]
  31. Ruiz-Ortiz, P.A.; Bustillo, M.A.; Molina, J.M. Radiolarite Sequences of the Subbetic, Betic Cordillera, Southern Spain. In Siliceous Deposits of the Tethys and Pacific Regions; Hein, J.R., Obradović, J., Eds.; Springer: New York, NY, USA, 1989; pp. 107–127. [Google Scholar]
  32. Zheng, Y.; Liao, Y.; Wang, Y.; Xiong, Y.; Peng, P.A. Organic geochemical characteristics, mineralogy, petrophysical properties, and shale gas prospects of the Wufeng–Longmaxi shales in Sanquan Town of the Nanchuan District, Chongqing. AAPG Bull. 2018, 102, 2239–2265. [Google Scholar] [CrossRef]
  33. Zhao, J.; Jin, Z.; Jin, Z.; Hu, Q.; Hu, Z.; Du, W.; Yan, C.; Geng, Y. Mineral types and organic matters of the Ordovician-Silurian Wufeng and Longmaxi Shale in the Sichuan Basin, China: Implications for pore systems, diagenetic pathways, and reservoir quality in fine-grained sedimentary rocks. Mar. Pet. Geol. 2017, 86, 655–674. [Google Scholar] [CrossRef]
  34. Wang, S.; Zou, C.; Dong, D.; Wang, Y.; Huang, J.; Guo, Z. Biogenic Silica of Organic-Rich Shale in Sichuan Basin and Its Significance for Shale Gas. Acta Sci. Nat. Univ. Pekin. 2014, 50, 476–486. (In Chinese) [Google Scholar]
  35. Zhang, J.; Li, Y.; Nie, H.; Long, P.; Tang, Y.; Tang, X.; Jiang, W. Geologic setting and drilling effect of the shale cored well Yuye-1, Penshui County of Chongqing. Nat. Gas Ind. 2010, 30, 114–118. (In Chinese) [Google Scholar]
  36. Shi, M.; Yu, B.; Xue, Z.; Wu, J.; Yuan, Y. Pore characteristics of organic-rich shales with high thermal maturity: A case study of the Longmaxi gas shale reservoirs from well Yuye-1 in southeastern Chongqing, China. J. Nat. Gas Sci. Eng. 2015, 26, 948–959. [Google Scholar] [CrossRef]
  37. Dong, D.; Cheng, K.; Wang, Y.; Li, X.; Wang, S.; Huang, J. Forming conditions and charateristics of shale gas in the Lower Paleozoic of the Upper Yangtze region, China. Oil Gas Geol. 2010, 31, 288–299. (In Chinese) [Google Scholar]
  38. Zhang, J.; Jiang, S.; Tang, X.; Zhang, P.; Tang, Y.; Jin, T. Accumulation types and resources characteristics of shale gas in China. Nat. Gas Ind. 2009, 29, 109–114. (In Chinese) [Google Scholar]
  39. Wu, J.; Yu, B.; Zhang, J.; Li, Y. Pore characteristics and controlling factors in the organic-rich shale of the Lower Silurian Longmaxi Formation revealed by samples from a well in southeastern Chongqing. Earth Sci. Front. 2013, 20, 260–269. (In Chinese) [Google Scholar]
  40. Long, P.; Zhang, J.; Jiang, W.; Nie, H.; Tang, X.; Han, S.; Xing, Y. Analysis on pores forming features and its influence factors of reservoir well Yuye-1. J. Cent. South Univ. 2012, 43, 3954–3963. (In Chinese) [Google Scholar]
  41. Ren, J.; Wang, Z.; Chen, B.; Jiang, C.; Niu, B.; Li, J.; Xie, G.; He, Z.; Liu, Z. The Tectonic Map of China and Adjacent Regions (1:5,000,000); Geological Publishing House: Beijing, China, 1997. (In Chinese) [Google Scholar]
  42. HJ 695-2014. Soil-Determination of Organic Carbon-Combustion Oxidation Nondispersive Infrared Absorption Method; Ministry of Environmental Protection of the People’s Republic of China: Beijing, China, 2014. (In Chinese)
  43. SY/T 5163-2018. Analysis Method for Clay Minerals and Ordinary Non-Clay Minerals in Sedimentary Rocks by the X-ray Diffraction; National Energy Administration of the People’s Republic of China: Beijing, China, 2018. (In Chinese)
  44. GB/T 14506.28-2010. Methods for Chemical Analysis of Silicate Rocks-Part 28: Determination of 16 Major and Minor Elements Content; General Administration of Quality Supervision, Inspection and Quarantine of the People’s Republic of China and Standardization Administration of China: Beijing, China, 2010. (In Chinese)
  45. Zhang, H.; Jiao, S.; Pang, Q.; Li, N.; Lin, B. SEM observation of organic matters in the Eopaleozoic shale in South China. Oil Gas Geol. 2015, 36, 675–680. (In Chinese) [Google Scholar]
  46. Wang, Y.; Wang, S.; Dong, D.; Li, X.; Huang, J.; Zhang, C.; Guan, Q. Lithofacies characterization of Longmaxi Formation of the Lower Silurian, southern Sichuan. Earth Sci. Front. 2016, 23, 119–133. (In Chinese) [Google Scholar]
  47. Ihinger, P.D.; Zink, S.I. Determination of relative growth rates of natural quartz crystals. Nature 2000, 404, 865–869. [Google Scholar] [CrossRef]
  48. Jones, J.B.; Segnit, E.R. The nature of opal I. nomenclature and constituent phases. J. Geol. Soc. Aust. 1971, 18, 57–68. [Google Scholar] [CrossRef]
  49. Matheney, R.K.; Knauth, L.P. New isotopic temperature estimates for early silica diagenesis in bedded cherts. Geology 1993, 21, 519–522. [Google Scholar] [CrossRef]
  50. Murata, K.J.; Friedman, I.; Gleason, J.D. Oxygen isotope relations between diagenetic silica minerals in Monterey Shale, Temblor Range, California. Am. J. Sci. 1977, 277, 259–272. [Google Scholar] [CrossRef]
  51. Boström, K.; Kraemer, T.; Gartner, S. Provenance and accumulation rates of opaline silica, Al, Ti, Fe, Mn, Cu, Ni and Co in Pacific pelagic sediments. Chem. Geol. 1973, 11, 123–148. [Google Scholar] [CrossRef]
  52. Tribovillard, N.; Algeo, T.J.; Lyons, T.; Riboulleau, A. Trace metals as paleoredox and paleoproductivity proxies: An update. Chem. Geol. 2006, 232, 12–32. [Google Scholar] [CrossRef]
  53. Rangin, C.; Steinberg, M.; Bonnot-Courtois, C. Geochemistry of the Mesozoic bedded cherts of Central Baja California (Vizcaino-Cedros-San Benito): Implications for paleogeographic reconstruction of an old oceanic basin. Earth Planet. Sci. Lett. 1981, 54, 313–322. [Google Scholar] [CrossRef]
  54. Van der Weijden, C.H. Pitfalls of normalization of marine geochemical data using a common divisor. Mar. Geol. 2002, 184, 167–187. [Google Scholar] [CrossRef]
  55. Wedepohl, K.H. Environmental influences on the chemical composition of shales and clays. Phys. Chem. Earth 1971, 8, 307–333. [Google Scholar] [CrossRef]
  56. Van de Kamp, P.C. Smectite-illite-muscovite transformations, quartz dissolution, and silica release in shales. Clays Clay Miner. 2008, 56, 66–81. [Google Scholar] [CrossRef]
  57. Boström, K.; Peterson, M.N.A. The origin of aluminum-poor ferromanganoan sediments in areas of high heat flow on the East Pacific Rise. Mar. Geol. 1969, 7, 427–447. [Google Scholar] [CrossRef]
  58. Khan, M.Z.; Feng, Q.; Zhang, K.; Guo, W. Biogenic silica and organic carbon fluxes provide evidence of enhanced marine productivity in the Upper Ordovician-Lower Silurian of South China. Palaeogeogr. Palaeoclimatol. Palaeoecol. 2019, 534. [Google Scholar] [CrossRef]
  59. Yang, D.; Miao, Z.; Shi, Q.; Chen, Y.; Chen, G. Silicon limitation on primary production and its destiny in Jiaozhou Bay, China VIII: The variation of atmospheric carbon caused by both phytoplankton and human. Chin. J. Oceanol. Limnol. 2010, 28, 416–425. [Google Scholar] [CrossRef]
  60. Egge, J.K.; Aksnes, D.L. Silicate as regulating nutrient in phytoplankton competition. Mar. Ecol. Prog. Ser. 1992, 83, 281–289. [Google Scholar] [CrossRef]
  61. Ragueneau, O.; Tréguer, P.; Leynaert, A.; Anderson, R.F.; Brzezinski, M.A.; DeMaster, D.J.; Dugdale, R.C.; Dymond, J.; Fischer, G.; François, R.; et al. A review of the Si cycle in the modern ocean: Recent progress and missing gaps in the application of biogenic opal as a paleoproductivity proxy. Glob. Planet. Chang. 2000, 26, 317–365. [Google Scholar] [CrossRef]
  62. Pedersen, T.F.; Calvert, S.E. Anoxia vs. productivity: What controls the formation of organic-carbon-rich sediments and sedimentary rocks? AAPG Bull. 1990, 74, 454–466. [Google Scholar] [CrossRef]
  63. Du, Y.; Shen, J.; Feng, Q. Applications of radiolarian for productivity and hydrocarbon-source rocks. J. China Univ. Geosci. 2012, 37, 147–155. (In Chinese) [Google Scholar]
  64. Caron, D.A.; Michaels, A.F.; Swanberg, N.R.; Howse, F.A. Primary productivity by symbiont-bearing planktonic sarcodines (Acantharia, Radiolaria, Foraminifera) in surface waters near Bermuda. J. Plankton Res. 1995, 17, 103–129. [Google Scholar] [CrossRef]
  65. Anderson, O.R.; Swanberg, N.R.; Bennett, P. Assimilation of symbiont-derived photosynthates in some solitary and colonial radiolaria. Mar. Biol. 1983, 77, 265–269. [Google Scholar] [CrossRef]
  66. Xiang, Y.; Feng, Q.; Shen, J.; Zhang, N. Changhsingian radiolarian fauna from Anshun of Guizhou, and its relationship to TOC and paleo-productivity. Sci. China Earth Sci. 2013, 56, 1334–1342. [Google Scholar] [CrossRef]
  67. Garibotti, I.A.; Vernet, M.; Ferrario, M.E.; Smith, R.C.; Ross, R.M.; Quetin, L.B. Phytoplankton spatial distribution patterns along the western Antarctic Peninsula (Southern Ocean). Mar. Ecol. Prog. Ser. 2003, 261, 21–39. [Google Scholar] [CrossRef] [Green Version]
  68. Itaki, T. Depth-related radiolarian assemblage in the water-column and surface sediments of the Japan Sea. Mar. Micropaleontol. 2003, 47, 253–270. [Google Scholar] [CrossRef]
  69. Lu, L.; Qin, J.; Shen, B.T.; Liu, W.; Zhang, Q. The origin of biogenic silica in siliceous shale from Wufeng-Longmaxi Formation in the Middle and Upper Yangtze region and its relationship with shale gas enrichment. Earth Sci. Front. 2018, 25, 226–236. (In Chinese) [Google Scholar]
  70. Han, Y.; Mahlstedt, N.; Horsfield, B. The Barnett Shale: Compositional fractionation associated with intraformational petroleum migration, retention, and expulsion. AAPG Bull. 2015, 99, 2173–2202. [Google Scholar] [CrossRef] [Green Version]
  71. Ma, Q.; Feng, Q.; Cao, W.; Zhang, L.; Ye, Y.; Gu, S. Radiolarian fauna from the Chiungchussuan Shuijingtuo Formation (Cambrian Series 2) in Western Hubei Province, South China. Sci. China Earth Sci. 2019, 49, 1357–1371. (In Chinese) [Google Scholar] [CrossRef]
  72. Wang, X.; Wang, S.; Gan, L.; Schloßacher, U.; Zhou, F.; Jochum, K.P.; Wiens, M.; Schröder, H.C.; Müller, W.E.G. Advances in Research on Siliceous Sponge Spicules: Novel Insight into the Understanding of Biomineralization Mechanisms and Bionic Applications. Acta Geosci. Sin. 2011, 32, 129–141. (In Chinese) [Google Scholar]
  73. Nelson, D.M.; Tréguer, P.; Brzezinski, M.A.; Leynaert, A.; Quéguiner, B. Production and dissolution of biogenic silica in the ocean: Revised global estimates, comparison with regional data and relationship to biogenic sedimentation. Glob. Biogeochem. Cycles 1995, 9, 359–372. [Google Scholar] [CrossRef]
  74. Riech, V.; von Rad, U. Silica Diagenesis in the Atlantic Ocean: Diagenetic Potential and Transformations. In Deep Drilling Results in the Atlantic Ocean: Continental Margins and Paleoenvironment; Maurice Ewing Series; Talwani, M., Hay, W., Ryan, W.B.F., Eds.; American Geophysical Union: Washington, DC, USA, 1979; Volume 3, pp. 315–340. [Google Scholar]
  75. Heath, G.R. Dissolved silica and deep-sea sediments. In Studies in Paleo-Oceanography; Hay, W.W., Ed.; SEPM Society for Sedimentary Geology: Tulsa, OK, USA, 1974; Volume 20, pp. 77–93. [Google Scholar]
  76. Johnson, T.C. Biogenic opal preservation in pelagic sediments of a small area in the eastern tropical Pacific. Geol. Soc. Am. Bull. 1976, 87, 1273–1282. [Google Scholar] [CrossRef]
  77. Von Rad, U.; Riech, V.; Rösch, H. Silica diagenesis in continental margin sediments off Northwest Africa. DSDP 1978, 41, 879–905. [Google Scholar]
  78. Flörke, O.W.; Hollmann, R.; von Rad, U.; Rösch, H. Intergrowth and twinning in opal-CT lepispheres. Contrib. Mineral. Petrol. 1976, 58, 235–242. [Google Scholar] [CrossRef]
  79. Stein, C.L.; Kirkpatrick, R.J. Experimental porcelanite recrystallization kinetics: A nucleation and growth model. J. Sediment. Res. 1976, 46, 430–435. [Google Scholar]
  80. Editorial Committee of a Dictionary of Earth Sciences. A Dictionary of Earth Sciences, Basic Disciplines Volume; Geological Publishing House: Beijing, China, 2006; pp. 1–1173. (In Chinese) [Google Scholar]
Figure 1. (A) Regional map of southeastern Chongqing, China, which is modified from Ren et al. (1997) [41]; (B) Location map of Well Yuye 1.
Minerals 10 00945 g001
Figure 2. Lithological column and sampling depths of Well Yuye 1.
Minerals 10 00945 g002
Figure 3. Ternary diagram of lithofacies classification of Longmaxi shales. The base map is from Wang et al. (2016) [46].
Minerals 10 00945 g003
Figure 4. The ternary plot of SiO2-Al2O3-CaO shows that the Longmaxi shales are enriched in SiO2. The base map is from Ross and Bustin (2006) and Zhao et al. (2016) [23,24].
Minerals 10 00945 g004
Figure 5. Cryptocrystalline silicas images and EDS analysis of the Longmaxi shales from Well Yuye 1. (A) YY1–8, 238.8 m; (B) YY1–13, 267.2 m; (C) YY1–15, 276 m; (DF) YY1–23, 312 m.
Minerals 10 00945 g005
Figure 6. Plots of correlation between SiO2/Al2O3 and K2O/Al2O3 and TiO2 of the Longmaxi shale. (A) SiO2/Al2O3 vs. K2O/Al2O3. (B) SiO2/Al2O3 vs. TiO2. R2 is the coefficient of determination.
Minerals 10 00945 g006
Figure 7. Plots of the correlation between the contents of illite, SiO2, quartz, excess Si, and Al2O3 of the Longmaxi shale. (A) SiO2 vs. illite. (B) Quartz vs. illite. (C) Excess Si vs. illite. (D) Excess Si vs. Al2O3. R2 is the coefficient of determination.
Minerals 10 00945 g007
Figure 8. Al-Fe-Mn diagram of the Longmaxi shales. The base map is from Adachi et al. (1986) [29].
Minerals 10 00945 g008
Figure 9. The cross-plot of Si versus Al of the Longmaxi shales. The base map is from Rowe et al. (2008) [30].
Minerals 10 00945 g009
Figure 10. The plot of the Al/(Al + Fe + Mn) ratio and Si/(Si + Al + Fe + Ca) ratio of the Longmaxi shales.
Minerals 10 00945 g010
Figure 11. Relationship between the TOC content and the quartz and excess Si contents of the Longmaxi shales. (A) TOC vs. quartz. (B) TOC vs. excess Si.
Minerals 10 00945 g011
Figure 12. Fossils of siliceous organisms in the Longmaxi shale from Well Yuye 1. (A,B) radiolarian; (A) YY1–8, 238.8 m, plane-polarized light; (B) YY1–13, 267.2 m, plane-polarized light. (C,D) sponge spicule; (C) YY1–1, 170.9 m, plane-polarized light; (D) YY1–8, 238.8 m, plane-polarized light.
Minerals 10 00945 g012
Figure 13. Principal scheme showing the cycle and diagenetic transformation of biogenic silicas in the Longmaxi shales. The radiolarian and sponge spicule are from Editorial Committee of A Dictionary of Earth Sciences (2006) [80]. The individual opal-CT blades and incipient lepisphere are from Riech and von Rad (1979) [74]. The complete lepisphere is from von Rad et al. (1978) [77]. The composite lepispheres are from Flörke et al. (1976) [78]. The cycle and diagenetic transformation of silicas are modified from Heath (1974), von Rad et al. (1978), and Riech and von Rad (1979) [74,75,77]. The cryptocrystalline biogenic silicas are the sketches of the observed silicas in the Longmaxi shales.
Minerals 10 00945 g013
Table 1. TOC and whole-rock mineral compositions of the Longmaxi shale from Well Yuye 1.
Sample No.LithologyDepth (m)TOC (%)Whole Rock Minerals Composition (wt.%)
QuartzKF.Plag.Cal.Dol.PyriteI/SIlliteKao.Chlo.
YY1–1Clayey-Siliceous Mixed Shale170.91.0530.8/6.45.191.313.3 29.9 /4.3
YY1–2Clayey shale178.61.3427.8/5.94.26.82.314.8 33.9 1.1 3.2
YY1–3Clayey-siliceous mixed shale1901.8929.10.711.13.86.71.514.1 29.2 0.9 2.8
YY1–4Siliceous shale204.81.2733.44.513.42.37.41.711.6 23.5 0.7 1.5
YY1–5Siliceous shale2121.3538.11.711.22.84.21.412.6 25.2 0.8 2.0
YY1–6Clayey-siliceous mixed shale2181.5333.9/13.14.16.81.610.1 27.5 0.8 2.0
YY1–7Clayey-siliceous mixed shale2301.0928.62.611.8/10.61.314.0 29.8 0.5 0.9
YY1–8Clayey-siliceous mixed shale238.81.635.4/10.2/131.315.2 22.5 0.8 1.6
YY1–9Clayey-siliceous mixed shale244.92.0836.5/6.96.662.416.6 21.6 0.8 2.5
YY1–10Siliceous shale2502.0138.83.17.42.16.8213.9 23.1 2.8 /
YY1–11Clayey-calcareous mixed shale2551.8125.2/5.92.830.71.66.8 25.7 0.3 1.0
YY1–12Siliceous shale2602.5742.7/6.33.74.62.810.0 27.9 0.4 1.6
YY1–13Siliceous shale267.21.4839.43.48.2//2.111.7 31.4 /3.8
YY1–14Clayey-siliceous mixed shale2721.130.12.810.3/23.61.54.4 25.0 /2.2
YY1–15Clayey-siliceous mixed shale2761.5834.92.78.2/10.41.48.5 33.5 0.4 /
YY1–16Siliceous shale2801.5439.13.911.6/5.61.611.8 24.1 /2.3
YY1–17Siliceous shale2851.5393.29.52.25.91.65.8 30.5 0.8 1.5
YY1–18Siliceous shale2901.3841.93.89.32.8/1.117.3 20.6 1.2 2.1
YY1–19Siliceous shale2951.43352.212.23.45.91.513.1 22.7 1.2 2.8
YY1–20Siliceous shale3001.5646.52.712.81.9/1.712.7 18.9 0.7 2.1
YY1–21Siliceous shale304.11.9443.437.3/5.62.413.4 22.6 0.8 1.5
YY1–22Clayey-siliceous mixed shale3081.9137.22.48.12.75.52.916.1 22.7 0.8 1.6
YY1–23Clayey-siliceous mixed shale3122.0438.9/7.43.83.41.315.8 26.2 /3.2
YY1–24Siliceous shale3162.2141.52.76.5/6.22.718.2 19.4 /2.8
Note: KF., K-feldspar; Plag., plagioclase; Cal., calcite; Dol., dolomite; I/S, illite-smectite mixed layer; Kao., kaolinite; Chlo., chlorite.
Table 2. Major oxides and element ratios of the Longmaxi shales from Well Yuye 1.
Sample NO.Major Oxides (%)Excess Si (%)SiO2/Al2O3Si/(Si + Al + Fe + Ca)Al/(Al + Fe + Mn)
SiO2Al2O3TFe2O3MgOCaONa2OK2OMnOTiO2P2O5LOITotal
YY1–158.0215.055.883.033.481.14.010.0540.7240.127.9999.4582.35 3.86 0.65 0.66
YY1–258.7816.215.892.761.811.034.380.0360.7610.1127.7799.5390.79 3.63 0.66 0.67
YY1–359.0514.535.382.433.11.413.780.0350.7260.1188.9999.5493.69 4.06 0.67 0.67
YY1–462.5613.334.62.362.971.613.40.0420.7110.1237.8199.5167.30 4.69 0.70 0.68
YY1–565.5413.264.472.141.981.543.390.0330.690.1176.4299.588.81 4.94 0.73 0.69
YY1–662.8313.814.992.32.321.633.450.0390.7390.1147.3699.5826.64 4.55 0.70 0.67
YY1–759.3316.64.322.682.271.444.630.0430.7640.1117.2599.4380.41 3.57 0.67 0.74
YY1–862.7512.595.12.562.731.193.420.0610.6580.1118.499.578.61 4.98 0.71 0.65
YY1–963.8713.225.092.082.051.23.490.0310.6830.1147.7299.5488.10 4.83 0.71 0.66
YY1–1066.212.194.61.991.951.043.30.0370.6260.1067.4899.51910.88 5.43 0.74 0.67
YY1–1147.2910.956.0258.720.7343.230.1570.5230.10416.7999.5184.08 4.32 0.58 0.57
YY1–1265.7312.124.451.752.151.073.390.0280.6470.116899.45110.78 5.42 0.74 0.67
YY1–1365.114.594.041.911.161.384.590.0310.7890.1435.8199.5436.42 4.46 0.73 0.73
YY1–1453.3811.956.014.076.21.383.210.1210.6460.12112.3699.4485.28 4.47 0.63 0.60
YY1–1564.9113.913.921.51.631.574.420.0310.7470.1336.7499.5117.45 4.67 0.73 0.73
YY1–1665.8113.574.251.891.471.424.090.0290.7180.1236.2499.618.43 4.85 0.73 0.71
YY1–1766.4213.373.61.821.711.473.890.0320.7170.1286.4299.5779.04 4.97 0.74 0.74
YY1–1865.3113.344.712.131.771.483.470.0360.7070.1226.4499.5158.57 4.90 0.72 0.68
YY1–1964.3413.644.732.182.091.653.50.0310.7430.1366.5899.627.62 4.72 0.71 0.68
YY1–2065.8113.524.451.961.741.693.480.0310.7240.1326.0299.5578.51 4.87 0.73 0.70
YY1–2166.8412.744.341.841.261.263.490.0290.6740.1136.8399.41610.27 5.25 0.75 0.69
YY1–2265.413.164.91.91.621.393.70.0340.6990.1246.5699.4878.91 4.97 0.73 0.67
YY1–2364.5712.965.12.021.741.173.470.0330.6760.1077.7499.5868.85 4.98 0.72 0.66
YY1–2465.912.594.881.961.661.143.380.0340.6580.1247.1999.51610.08 5.23 0.73 0.66
Publisher’s Note: MDPI stays neutral with regard to jurisdictional claims in published maps and institutional affiliations.

