1. Introduction
Platinum-group elements (PGEs) are essential for the modern economy. Platinum and palladium are well known in organic chemistry as cross-coupling catalysts for their unique coordination chemistry [
1]. Recent hot topics promote an increased interest in their use as metal centers of metallodrugs [
2] or metal-organic frameworks [
3]. Additionally, their commercial uses as high throughput catalysts for oil fuels [
4] and hydrogen evolution catalysts [
5] provide green applications. PGEs are also irreplaceable constituents of many devices’ data storage and electronic components such as smartphones. The demand for their use in high-technology materials, unique catalysts, and fuel evolution is ever-growing, where their applications are limited mostly by their cost.
Most PGEs occur as minor constituents of common Ni-Cu sulfide intrusions in mafic and ultramafic rocks [
6]. Variations in the composition of PGE-containing intrusions make traditional analytical methods insufficient to provide in situ information on the available mineral and gangue alongside both the prospection and extraction processes. Such in-process assessments are vital to optimize the extraction process and lower bulk price.
For scarce elements, analyzing the elemental content at the surface of drilled cores constitutes a viable prospective throughput method. The micro X-ray fluorescence spectrometry (μ-XRF) has been used to run such analyses on PGE-bearing core samples in a recent article by Meima et al. [
7]. In this article, a μ-XRF probe was used combined with other sensing techniques to shorten the analysis time. Although having promising solid-state elemental analysis applications, the long dwell times do not comply with in-situ analysis goals.
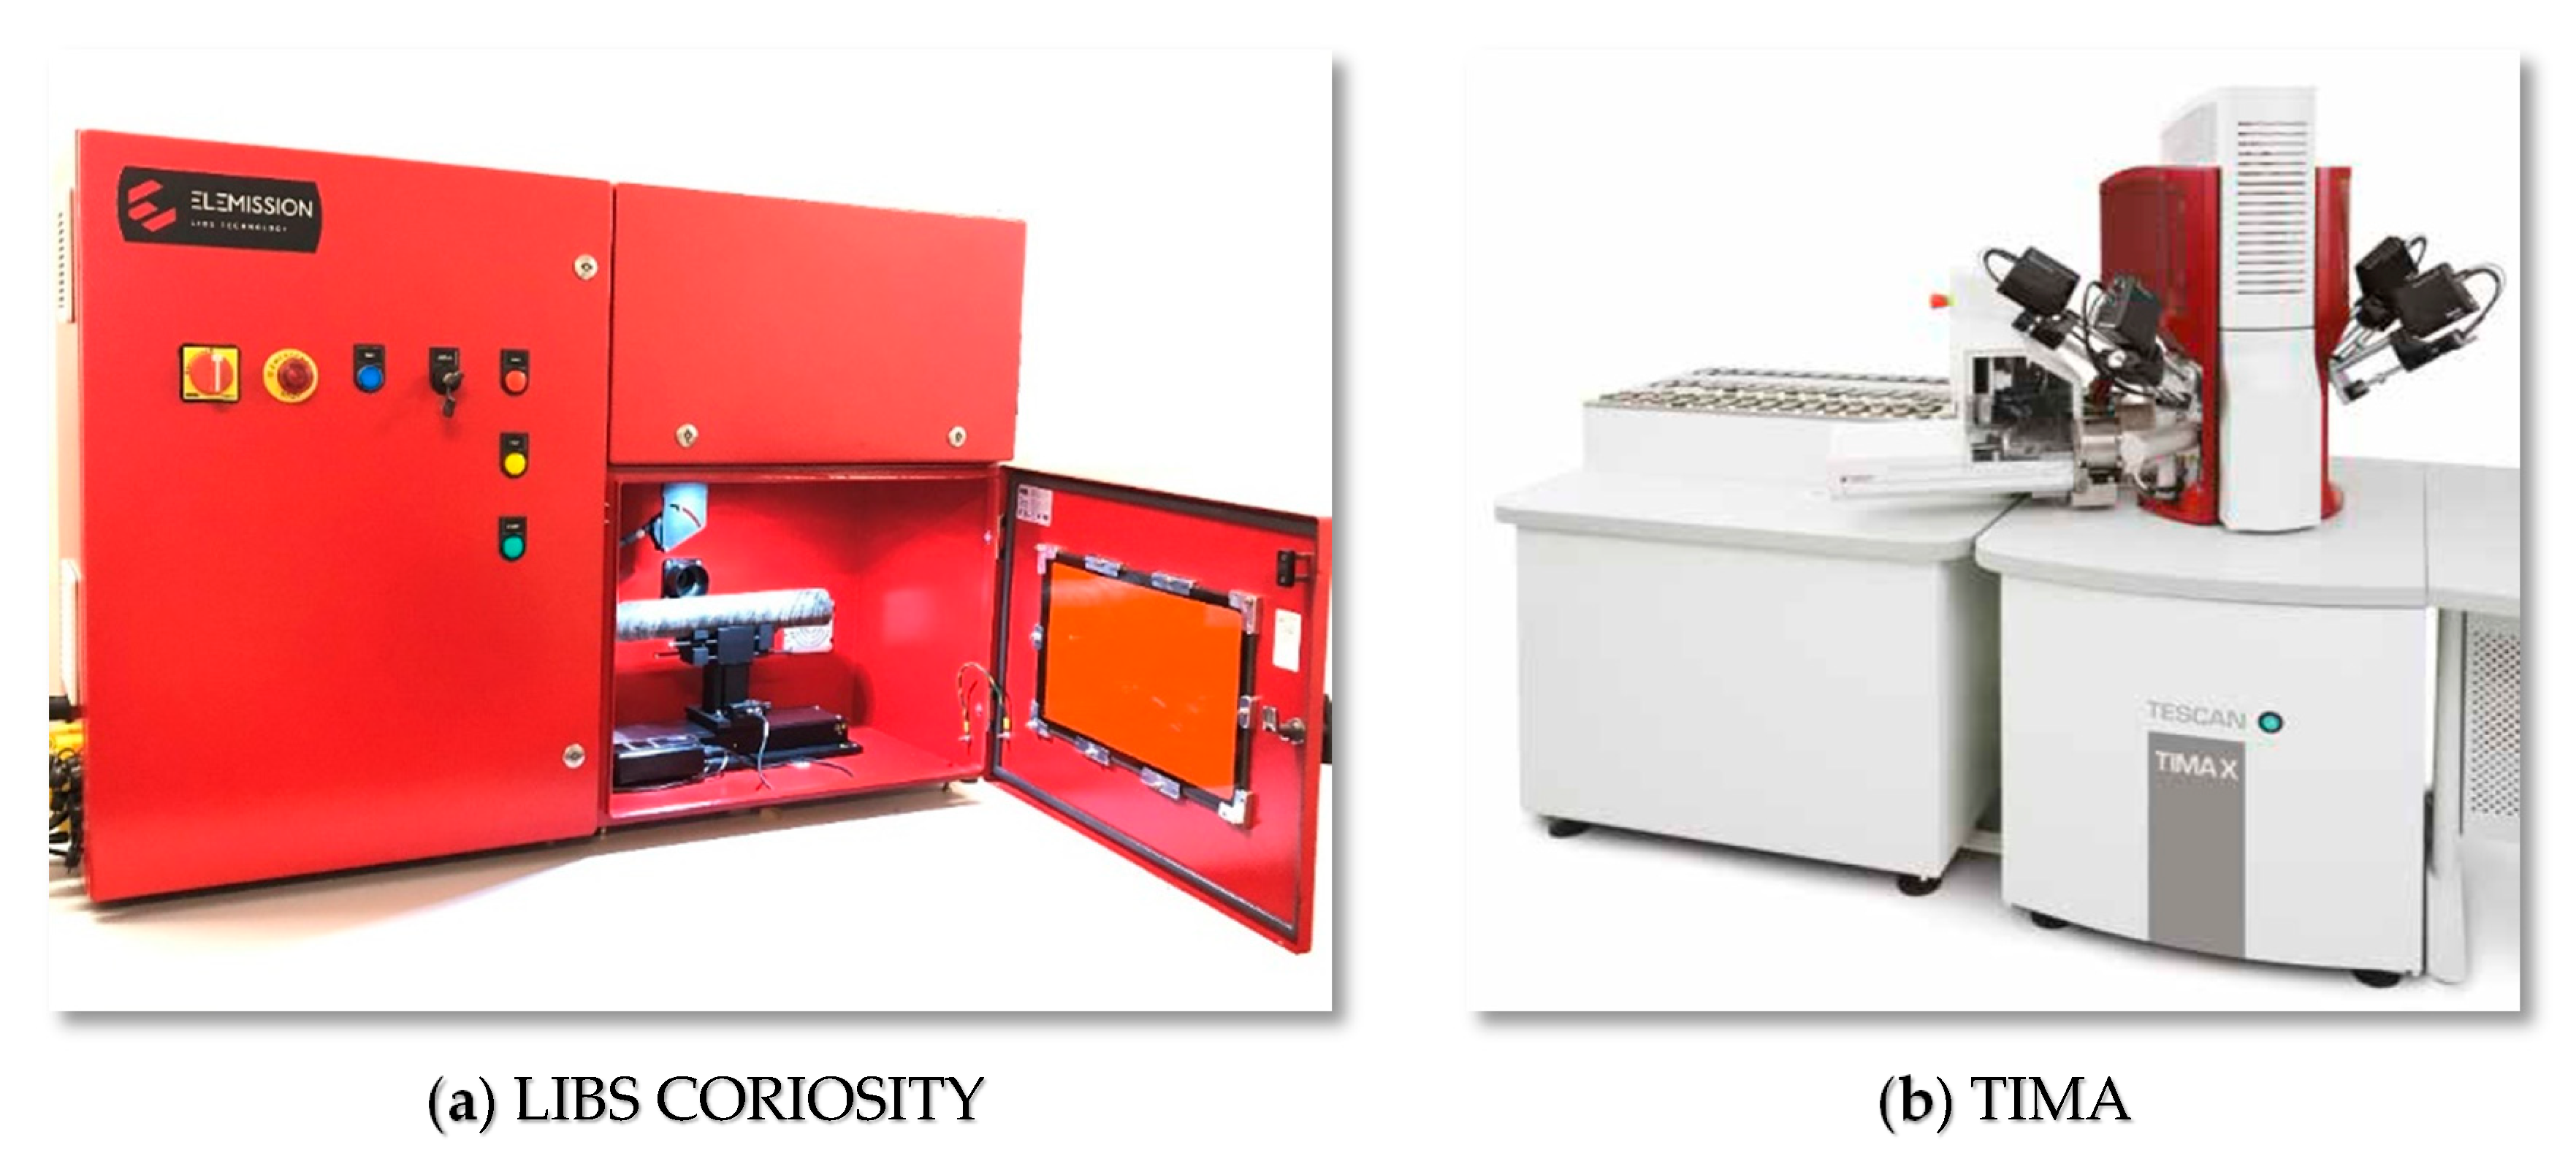
Scanning electron microscopy analyzers paired with energy-dispersive X-ray spectroscopy (SEM-EDS) are commercially mature instruments rendering a mineral surface mapping. The first analyzers, called mineral liberation analyzers (MLAs), provide mineral mappings of samples and robust databases [
8]. Technological improvements have been made on SEM-based analyzers, bringing on the market the Quantitative Evaluation of Materials by SCANning electron microscopy (QEMSCAN) analyzer [
9], and more recently, the TESCAN Integrated Mineral Analyzer (TIMA) [
10]. To avoid surface overcharge, the cut and polished core samples or resin-embedded rock samples have to be coated with a layer of conductive carbon prior to the analysis. When the automated scanning starts, SEM-EDS instruments first generate surface maps from the count of backscattered electrons proportional to the average atomic mass of the analyzed mineral. An EDS spectrum is then generated from areas having a similar backscattered electrons (BSE) signal or following a 2D pattern, providing information on both elemental and mineral content. The mineral content analysis, based on spectral pattern recognition of the EDS spectra and applied to similar BSE signal areas, reduces the acquisition time and infer the mineralogy of the non-scanned EDS areas.
QEMSCAN and TIMA technologies both yield similar outputs. A thorough study by Honeyands et al. reported similar conclusions with both instruments, although they were not able to discriminate between hematite and magnetite minerals using the TIMA instrument [
11]. That conclusion is quite specific to the chosen parameters and samples and does not affect the TIMA instrument’s main high-resolution task.
The PGE-bearing core samples analyzed in the present study come from the Stillwater Complex, Montana (USA). The USGS organization recently published the Chromium and Iron Mountain areas geological survey data from the same complex. The SEM-EDS technology used for all samples was the TIMA-X generation [
12]. Therefore, the reputation of the TIMA-X instrument paired with recent surveys really makes the TIMA-X instrument the ultimate choice to compare the SEM-EDS technology to other techniques.
A downside of such analysis is that the total SEM-EDS analysis duration is lengthy and requires a laborious sample preparation in a controlled laboratory environment. The SEM-EDS method is, therefore, incompatible for fast analysis. SEM-EDS based technologies are confined to laboratory applications because of their bulky nature and their requirements of special infrastructures such as vibration-free concrete slate and temperature control laboratory. These requirements make it difficult to deploy in remote locations near the exploration activities to reduce the analysis downtime. Additionally, the detectability of elements using X-ray based elemental analysis techniques depends on the emitted photons interacting with the material. Light elements emit none or low energy X-ray photons when excited. Since the EDS beam penetrates a fair distance beneath the surface, the lowest energy photons are absorbed within the sample. As a consequence, only elements with an atomic number above 11 are efficiently detectable using EDS [
13]. The sensitivity of the EDS elemental analysis is also too poor to quantify trace elements (<0.001%).
Altogether, SEM-EDS methods are ubiquitous in the mining industry. No such analysis can render both the elemental content and the mineral content at comparable resolutions and industrial grade. There are major applications for these instruments, but analysis duration and sample preparation make in-situ SEM-EDS analyses nearly impossible. Current efficiency issues are not resolved nor possibly answered just by the previously described methods. An ultrafast analyzer capable of both elemental and mineral surface imaging is still essential to make scarce PGE extraction efficient and waste-limited, as well as for other mineral mapping issues.
Laser-induced breakdown spectroscopy (LIBS) has been more and more identified as a robust all-state multi-elemental analyzer. To assess mineral liberation during process analysis, a lower spatial resolution may be enough to map the abundance of key minerals; therefore, LIBS technology is applicable to both high-resolution mapping and fast process analysis. Published LIBS studies applied to the mining industry have mainly focused on the quantitative analysis of major and minor elements (e.g., Harmon et al. (2013) [
14] and Harmon et al. (2019) [
15]). Jolivet et al. reviewed the recent advances and applications of LIBS imaging [
16]. Gottlieb et al. introduced a clustering algorithm (EM Lustering) applied to heterogeneous building materials (concrete) to extract spectral information from non-relevant aggregates and cement matrix [
17]. It was only in the last few years that LIBS began to be used to determine mineral phases from atomic emission spectra patterns. More precisely, LIBS pattern recognition algorithms consisted mainly of unsupervised machine learning methods to provide qualitative and quantitative mineral phases analysis. For instance, Romppanen et al. [
18] used the singular value decomposition (SVD, a principal component analysis (PCA) kernel) for the unsupervised classification of minerals containing rare earth elements in rock samples. Maps assessing the mineralogy in the sampled area have been constructed. They demonstrated using SVD that the percentage of yttrium-bearing minerals can be calculated from fine-grained rock samples.
Recently, Pagnotta et al. proposed a quantitative micro-LIBS elemental imaging method based on the application of the self-organizing map (SOM), an unsupervised machine learning algorithm, for the determination of the different classes of materials in the samples [
19]. The SOM step is followed by a calibration-free-LIBS analysis (CF-LIBS) of the average spectra. More recently, El Haddad et al. applied the Multi-Curve Resolution Alternating Least Square (MCR-ALS) algorithm to the spectral data obtained by LIBS to classify and quantify the minerals present in sectioned rock fragments [
20]. In their study, the samples were first analyzed using SEM-EDS. Then, the LIBS spectral patterns identified as single-phase minerals were deconvolved using an unsupervised MCR-ALS algorithm that uses a “pure spectrum” as a seed to help the model converge. Acceptable agreement between LIBS and SEM-EDS results was reported.
Nikonow et al. proposed the combination of LIBS, micro-EDXRF, and hyperspectral infrared reflectance analysis to provide valuable information within each technique’s limitations, such as spatial resolution or elemental sensitivity [
21]. The aim of the combinatory method was to lower the sample preparation and measurement duration. The data obtained using this method was combined with the supervised spectral angle mapper algorithm (SAM) to generate mineral phases imaging [
21]. Additionally, Meima et al. used LIBS and a supervised pattern recognition algorithm called Spectral Angle Mapper (SAM) to identify the minerals present in two drill cores from the South African Merensky Reef mine [
7]. In this work, LIBS analyses were performed using a confocal microscope (60 µm spot size) and a drill core scanner (200 µm spot size). The results were then compared to data collected using an automated SEM Mineral Liberation Analysis (SEM-MLA) instrument. The results were promising as a good match between the mineral maps generated from both analyzers was achieved. However, the authors mention that Fe sulfides (pyrite or pyrrhotite) could not be discriminated using the SAM algorithm. The acquisition time of LIBS data lasted 2–3 days [
7], which is way too long for practical applications in the mining industry. In addition, the LIBS quantitative mineral content was not presented nor compared to the SEM-MLA results. The lacking of this validation step is unfortunate since mineral content is normally available using SEM-MLA.
Finally, Nardecchia et al. [
22] used the k-means unsupervised pattern recognition algorithm to identify the different mineral phases. This study consisted of two steps: the main mineral phases were first identified, then the sub-phases. This approach could be useful to analyze rock specimens exhibiting various elemental compositions in a single mineral grain. However, the convergence of the unsupervised algorithm on mixed mineral signatures might be an issue. In their study, the mineralogical classes and subclasses identified by the pattern recognition algorithm were not compared and validated by an independent technique such as SEM-EDS, which makes it difficult to evaluate the utility and the validity of this unsupervised pattern recognition algorithm. Unsupervised machine learning algorithms such as k-means and MCR-ALS can wrongly assign as a single class a mixed mineralogy spectral pattern, which has the effect of misleading the end-user.
Considering the need for fast analysis time and high throughput, LIBS emerges as an ideal sensing technique for mine site applications. Additionally, since the instruments manufactured by ELEMISSION do not require special devices such as pumps, gases other than air or exhaust fans, they can be used both in the analytical laboratory and in harsh field conditions. A recent study by Rifai et al. using the LIBS CORIOSITY ELEMISSION technology was carried out on drill core fragments from the PGE Stillwater mine in USA [
23]. The main objective of that study was to perform a rapid LIBS surface analysis of a core sample, to assess its mineral content, and to render elemental and mineralogical maps. The mineral phases assignation was made using only the spectra elemental content, and this process was not validated by any other technique. As a result, some mineral phases were not correctly identified, as discussed later in the present manuscript.
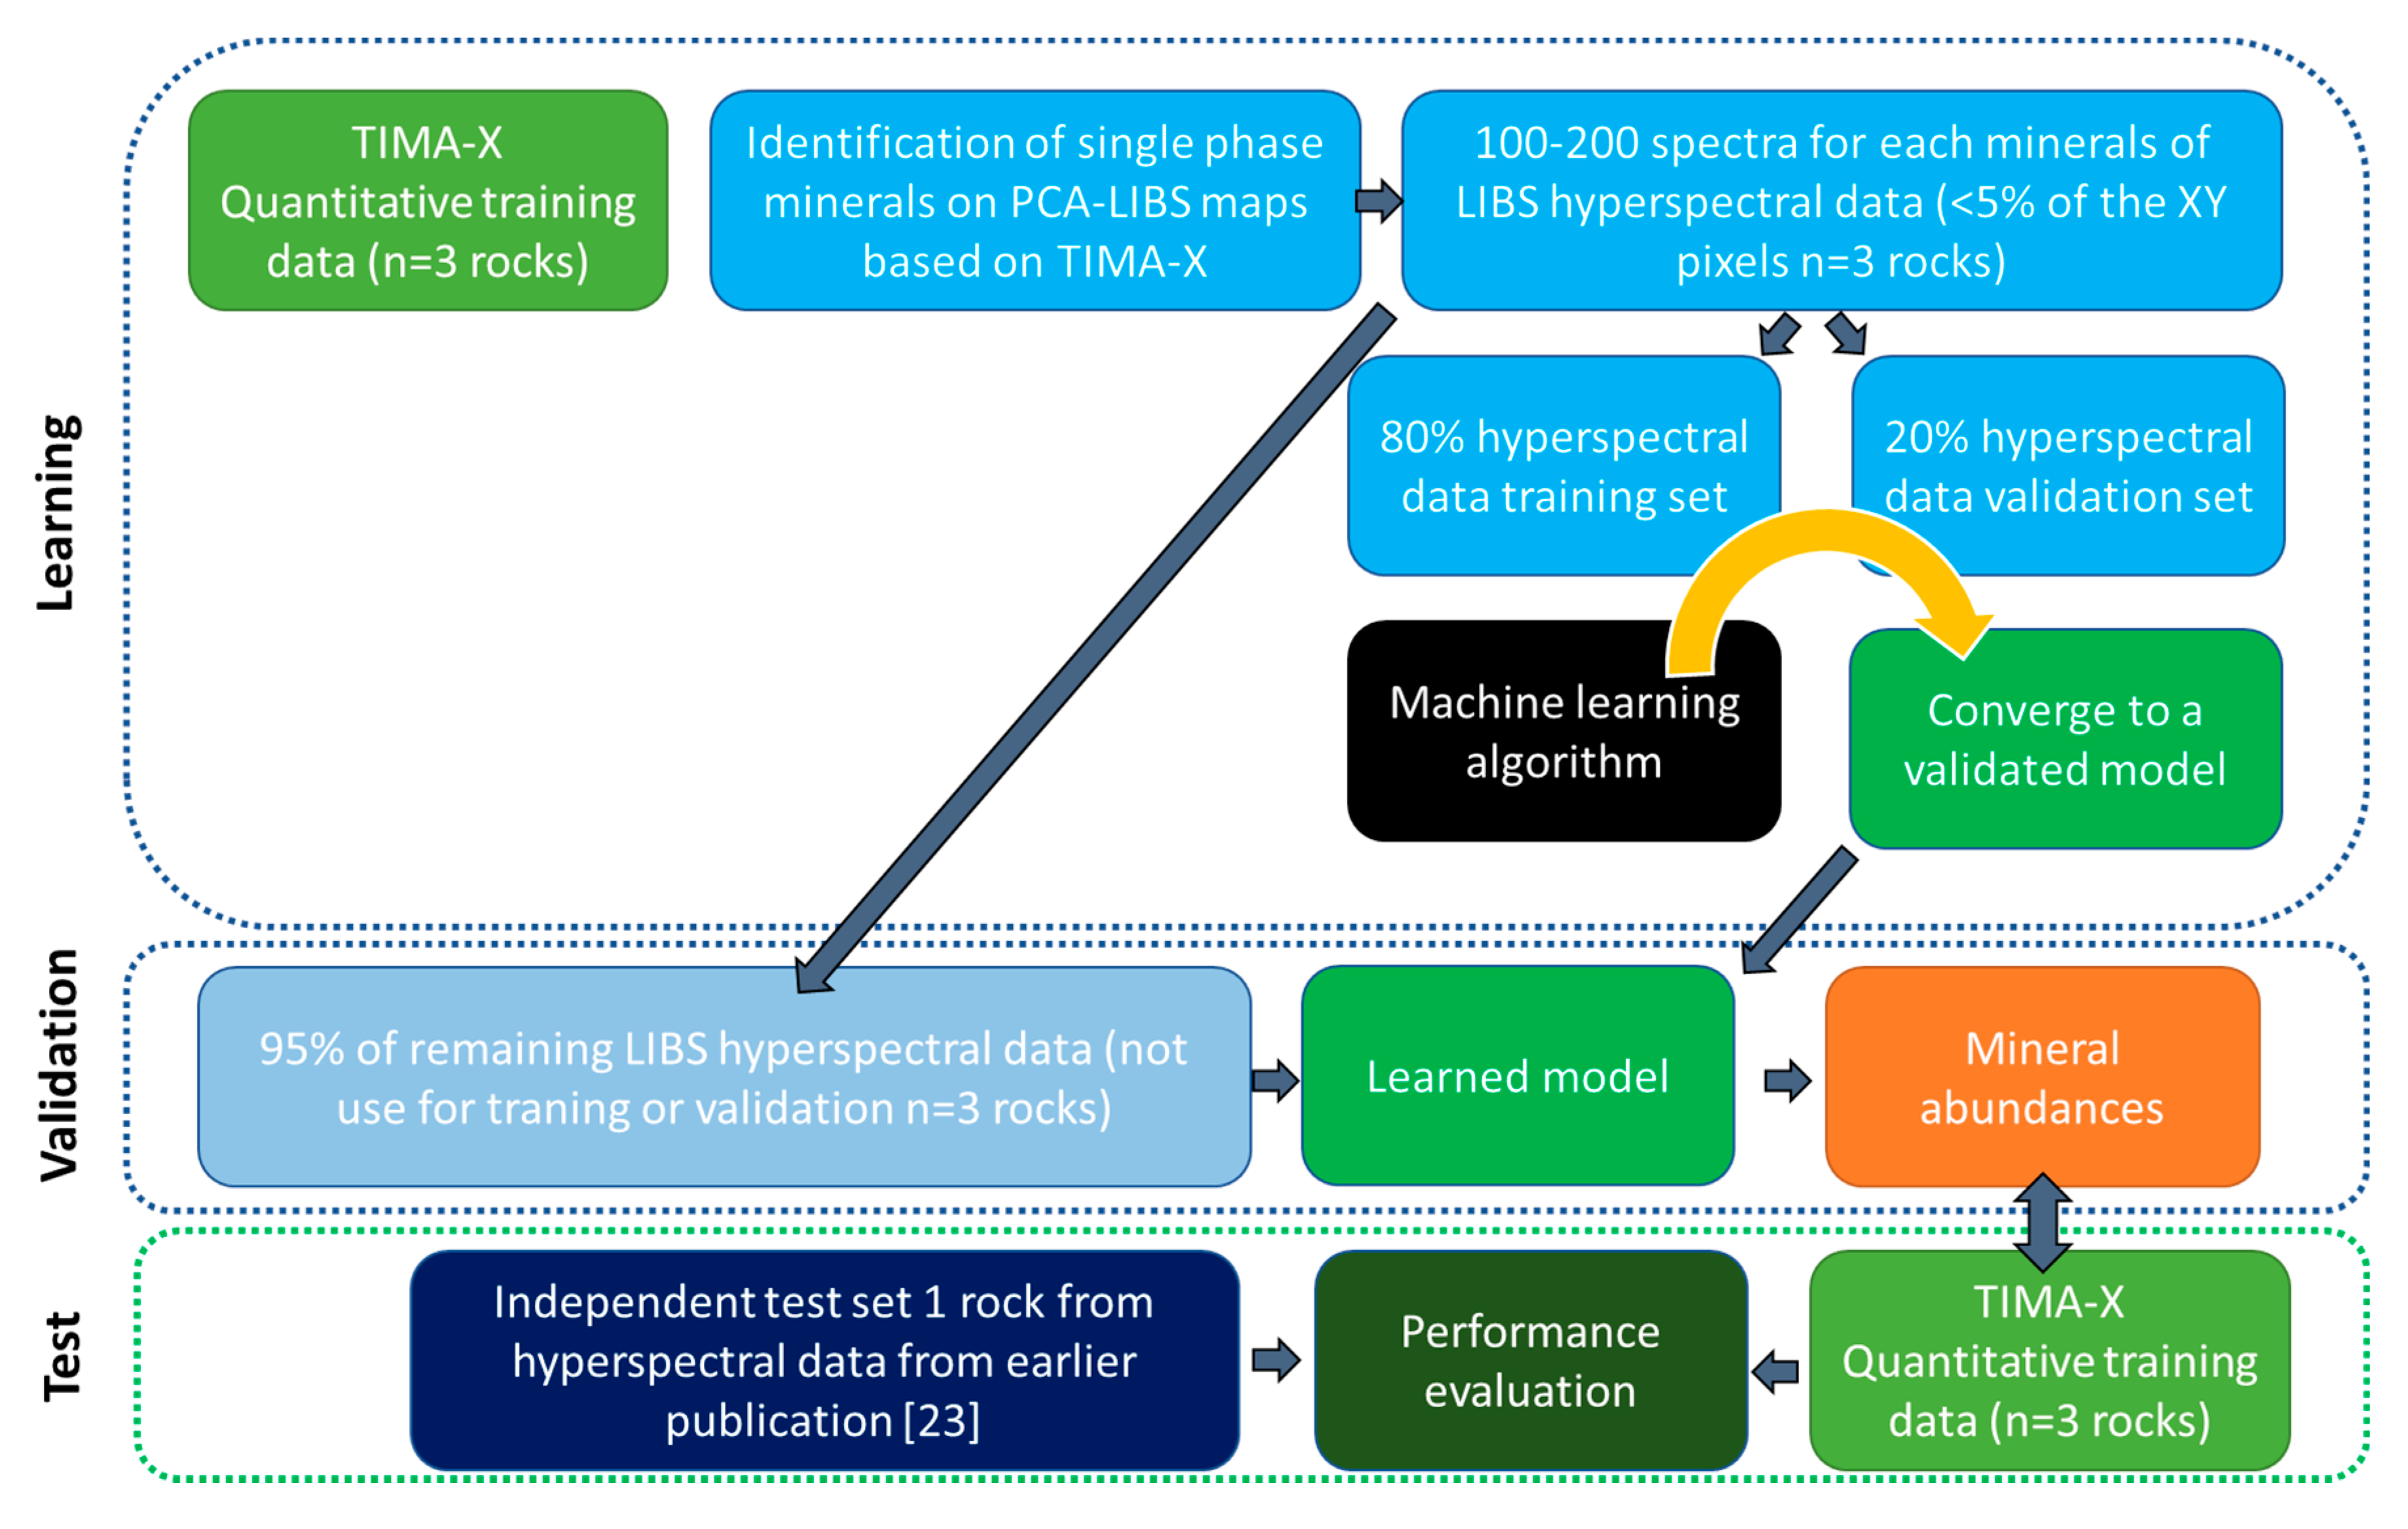
In the present manuscript, the LIBS mineral library was built on the basis of the TIMA-X automated mineralogical information. LIBS analyses based on this mineral library were discussed and compared to TIMA-X mineral maps. In addition, the robustness of the supervised machine learning algorithm was verified by predicting the mineralogy of the sample PGE2 (independent test set) from the hyperspectral data obtained during previous work using the same LIBS instrument [
23]. Moreover, the quantitative automated mineralogical information obtained by both techniques was be compared.
3. Discussion
3.1. TIMA-X Results
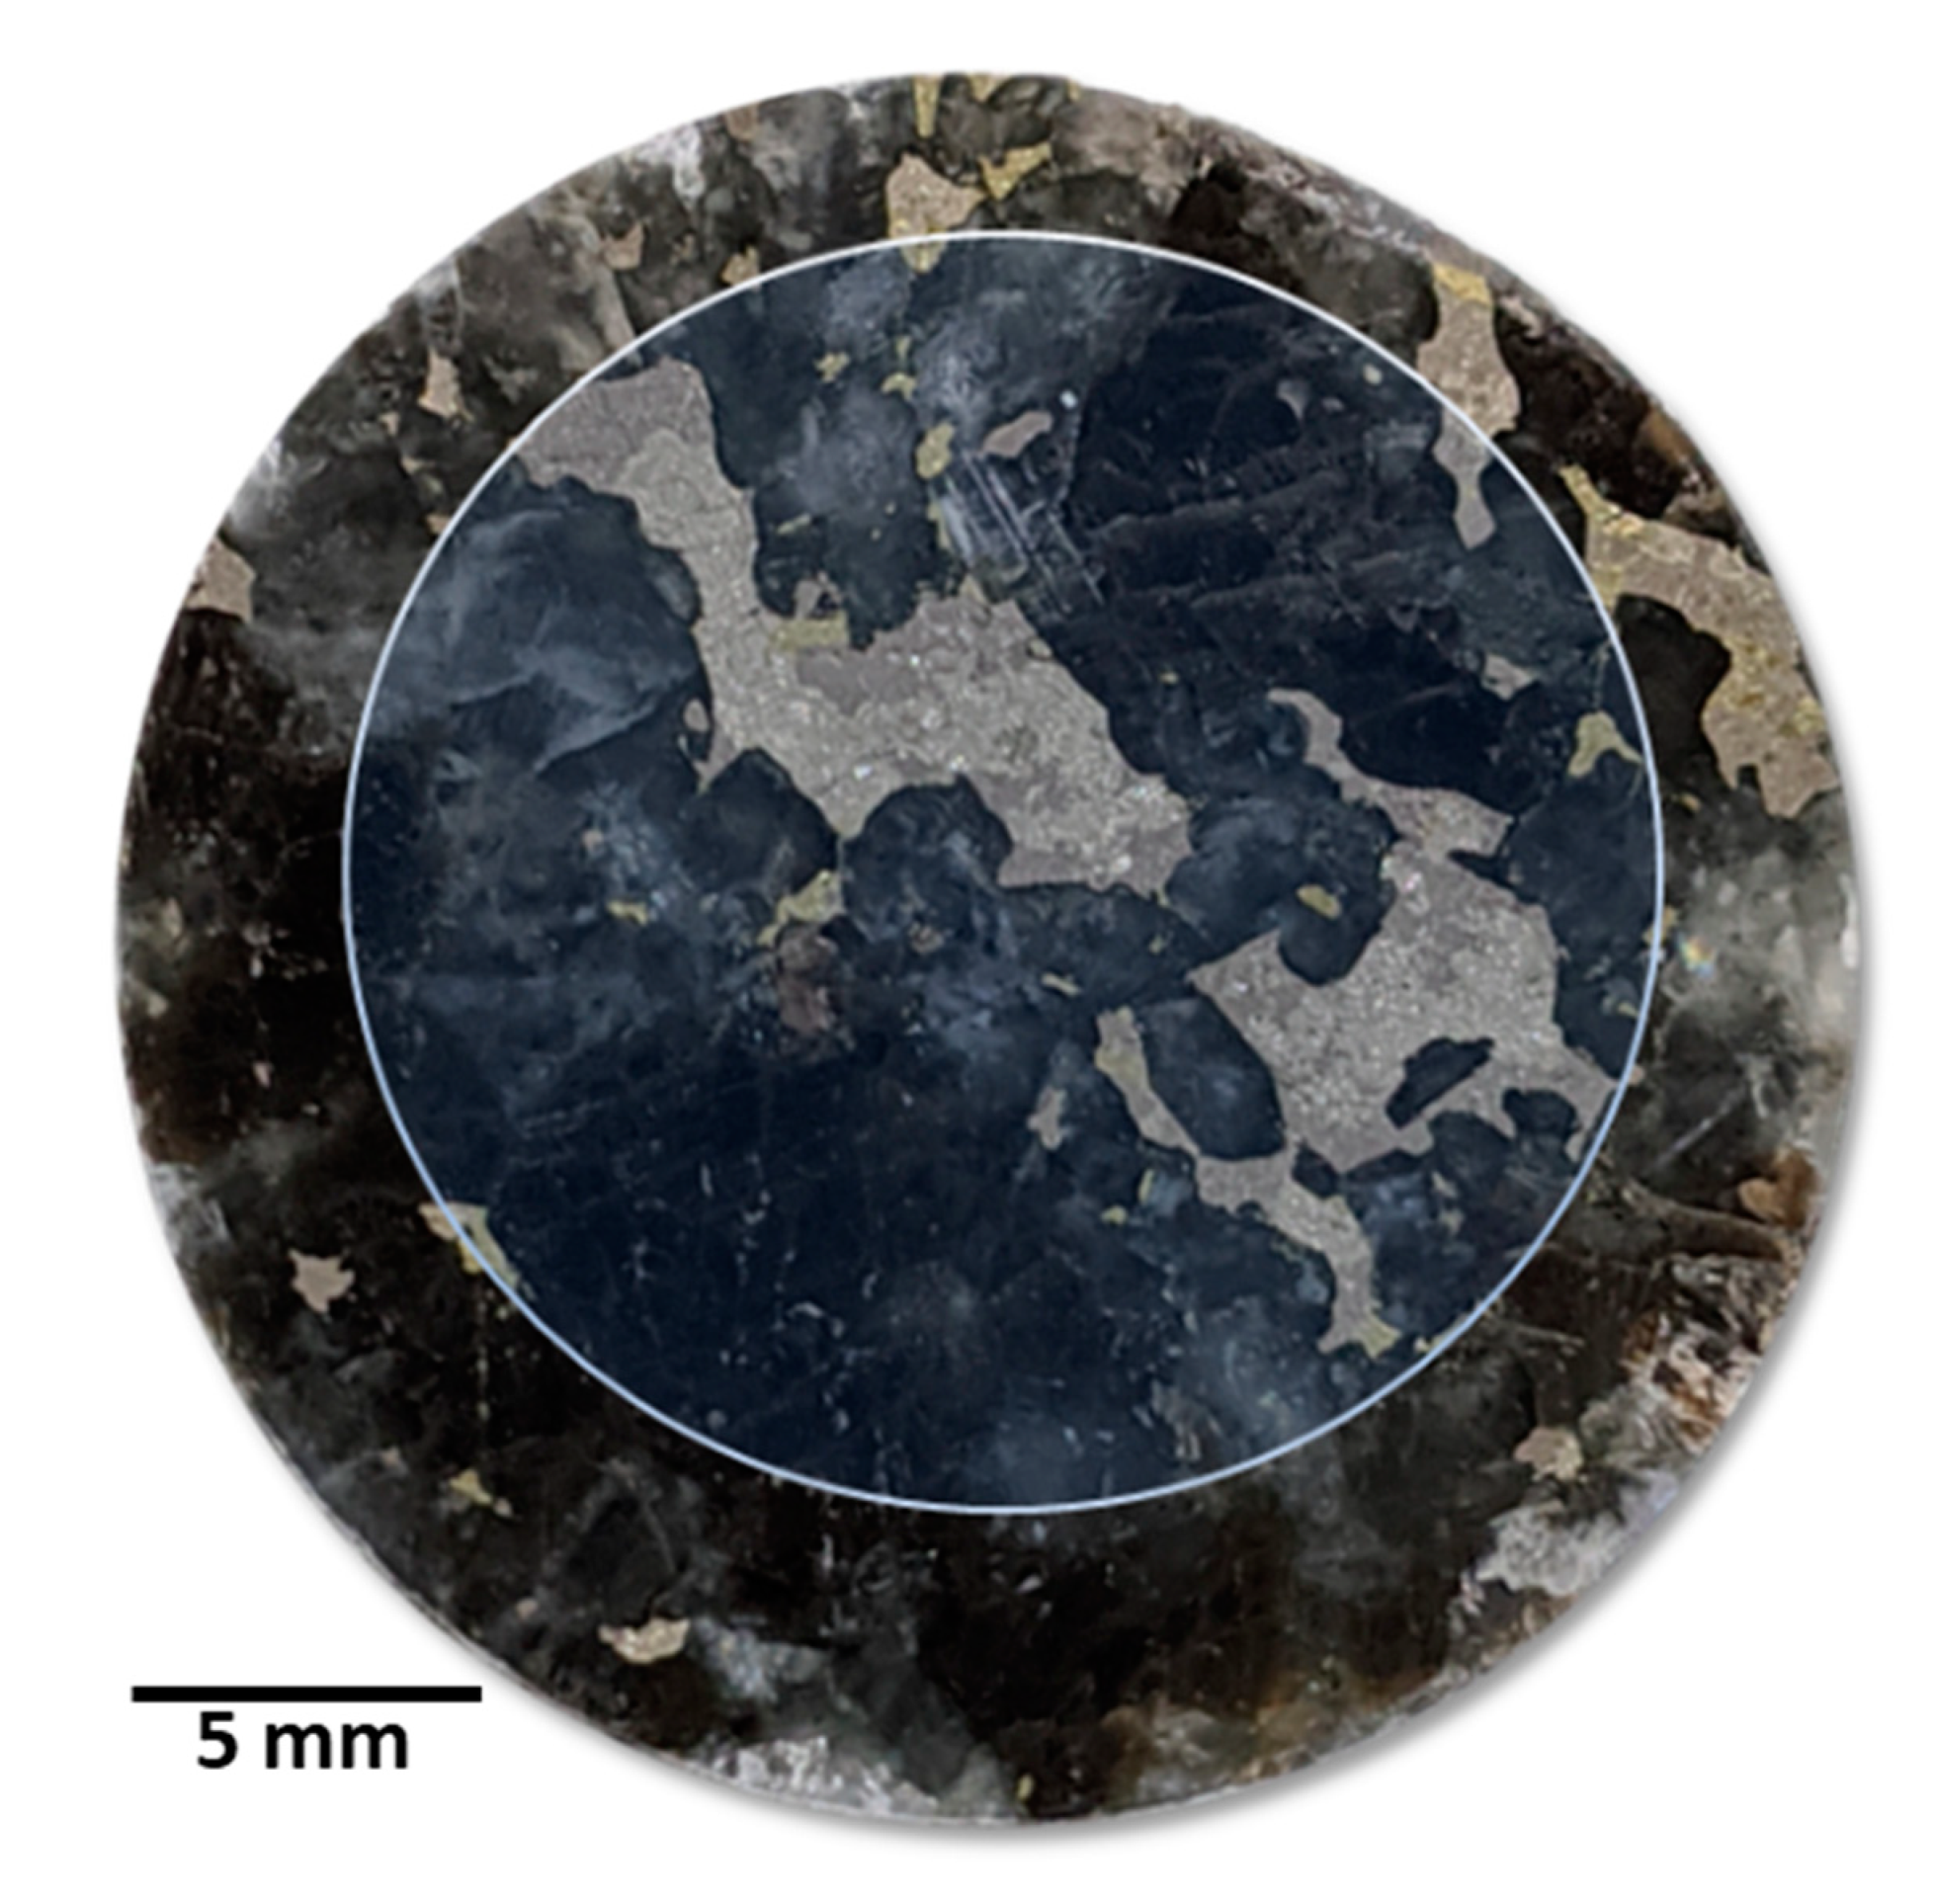
The size of the areas analyzed using the TIMA-X was considerably smaller (1.7 times) than the one analyzed using the LIBS CORIOSITY. The SEM-EDS analyzer has a sample size limit, and the whole surface may not always be scanned. The CORIOSITY G3 can accommodate a drill core fragment up to 35 cm in length; however, the LIBS system dedicated for in-situ analysis can accommodate any size of drill core boxes. As mentioned earlier, the carbon coating required for the TIMA-X analysis was ablated using the LIBS CORIOSITY laser. Although the ablated depth of the cleaned surface was not larger than about 5 μm (much larger than the 20 nm carbon coating), the small layer ablated with the carbon coating can have a possible impact on the computed mineral contents. However, it is important to keep in mind that the LIBS analysis does not systematically require a precleaning step.
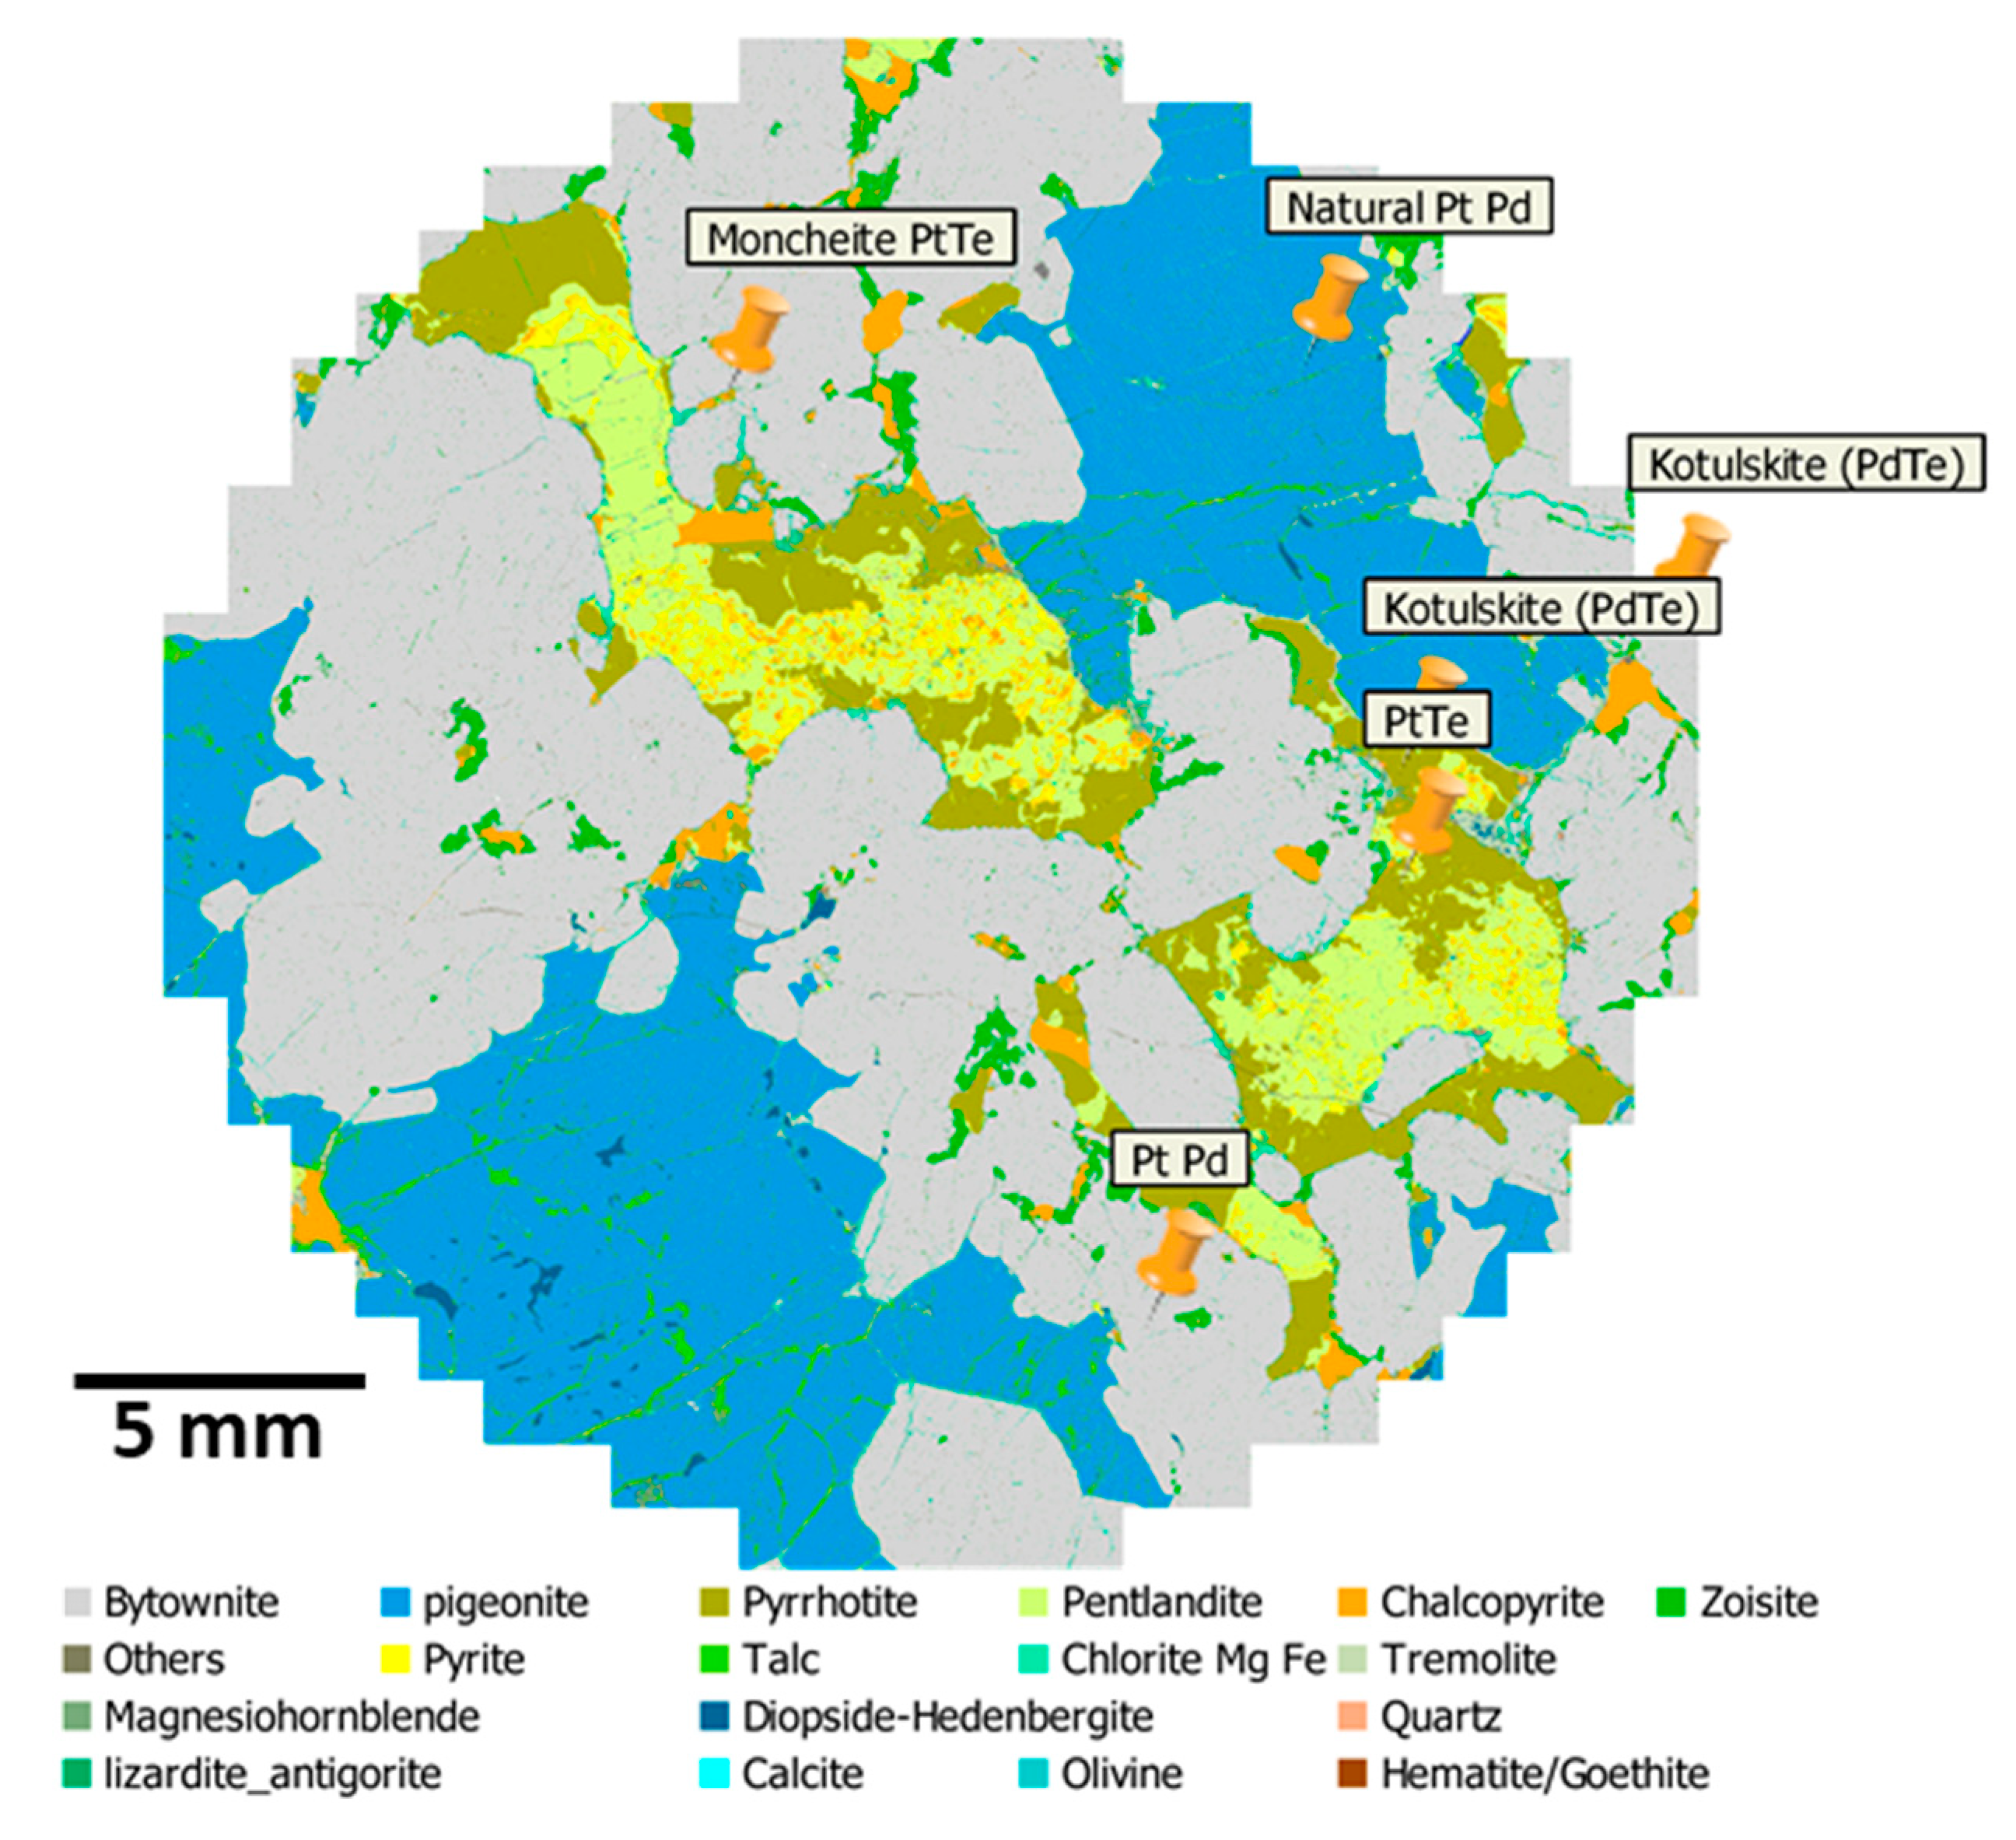
In the following, we show the results for the PGE1a sample only. Mineralogical data obtained from TIMA-X (
Figure 3) revealed that the main mineral components of the rock sample PGE1a were Ca-rich plagioclase (bytownite) and pyroxene (pigeonite with lamellae of augite exsolution, data not shown). The sample was also particularly rich in coarse-grained pentlandite and pyrrhotite, accompanied by fine chalcopyrite and pyrite. The pentlandite exhibited various concentrations of palladium ranging from 0.01 to 3.5% (1% Pd on average). The remaining PGEs occurred as Pd-Pt tellurides (telluropalladinite, kotulskite, and moncheite), which were finely disseminated in plagioclase, often in close association with pentlandite and chalcopyrite. PGE inclusions were often less than 5 µm in size. A few larger (>20 µm) mineral species containing Pt and Pd (braggite-vysotskite series) were found in the pentlandite.
The chemical formula of the most abundant minerals identified from the TIMA-X scan is given in
Table 4.
3.2. Building the LIBS Mineral Library
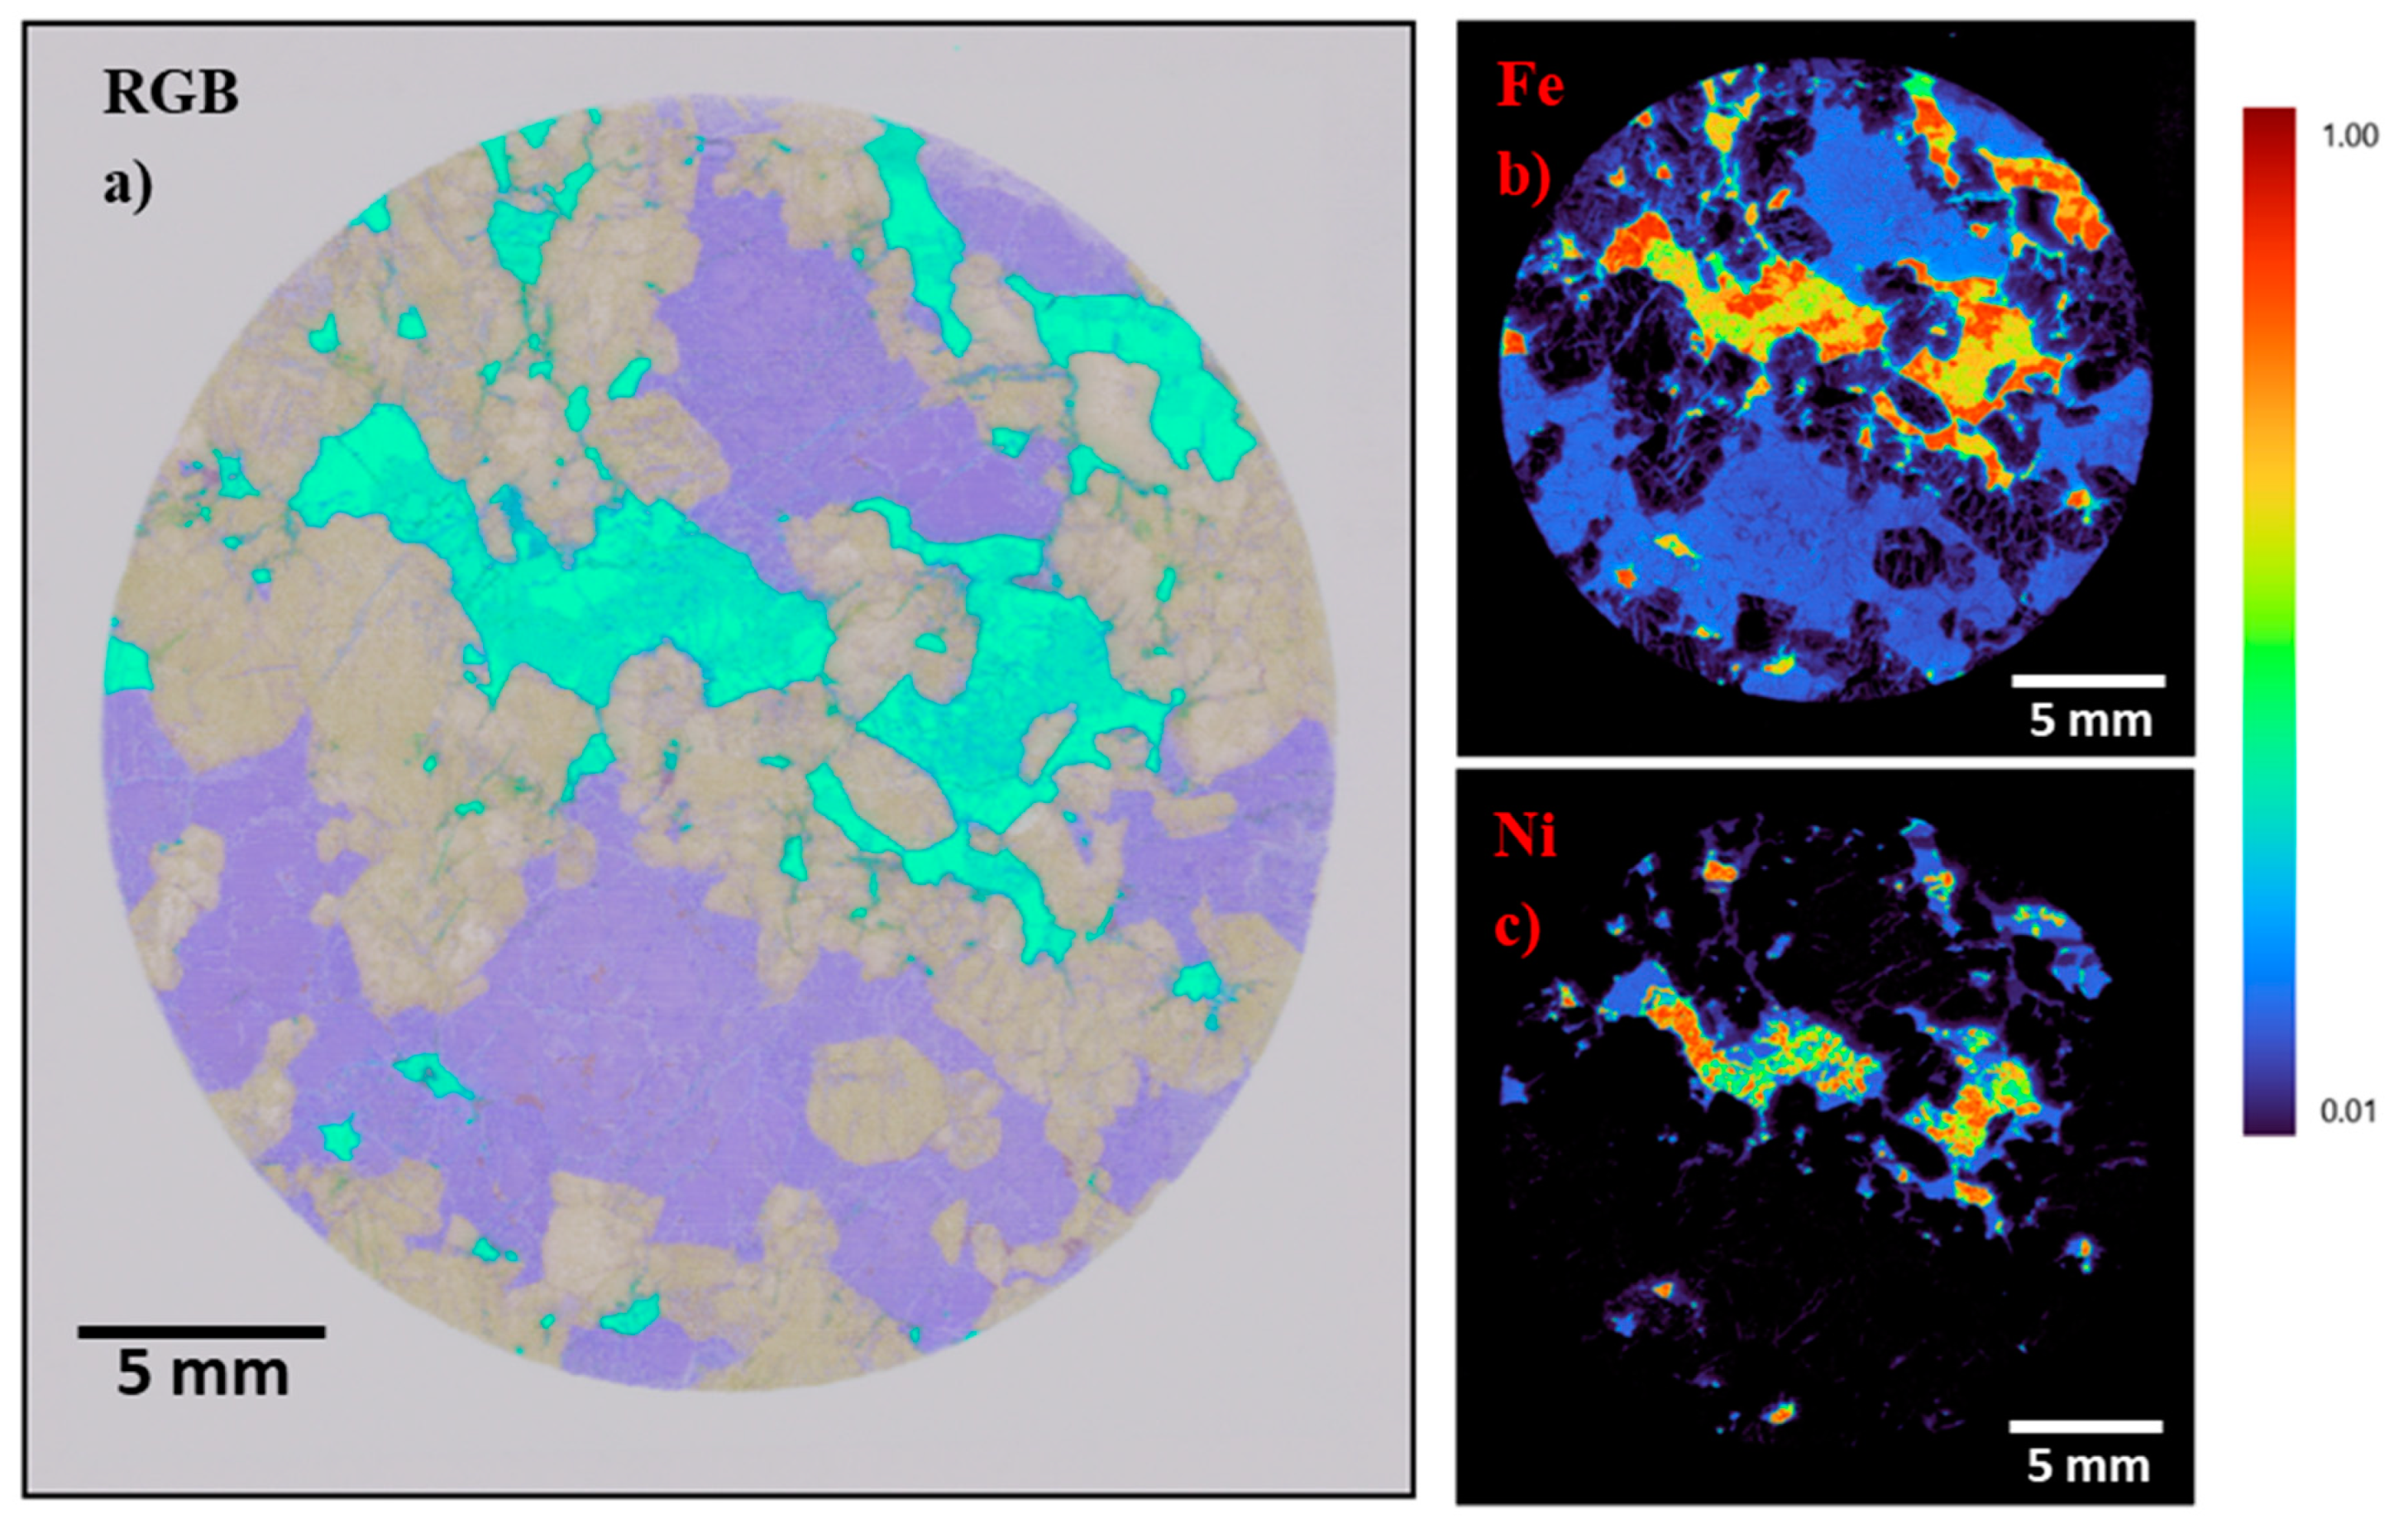
In order to identify mineral phases using the LIBS CORIOSITY instrument, we first performed an unsupervised PCA, which automatically generated the RGB (Red, Green, Blue) image shown in
Figure 4a. The image revealed three main zones represented as grey, cyan, and violet, which, by comparison with
Figure 3, were associated with plagioclase, sulfides, and pyroxene, respectively. It should be noted that minerals of similar chemical composition are generally represented with similar RGB combinations in the PCA-score map. To demonstrate the presence of different sulfide minerals in the cyan area, elemental maps of Fe and Ni are presented in
Figure 4b,c. As can be observed, the cyan color in
Figure 4a was correlated with the highest concentration of iron and nickel in
Figure 4b,c. The low iron intensity in
Figure 4b (pastel blue) belonged to the pigeonite mineral, whereas the high iron concentration in
Figure 4b (red) corresponded to the pyrrhotite mineral. The high nickel concentration in
Figure 4c was assigned to the pentlandite mineral.
Figure 4 additionally features the presence of nickel as generally less abundant in the pyrrhotite than in the pentlandite mineral. These mineral identifications were in good agreement with the TIMA-X analysis of
Figure 3.
Likewise, in the BSE images generated by SEM (data not shown), similar grayscale luminosities were assigned to minerals of the same or similar elemental composition. An important difference between mineral phases assignation using the LIBS PCA pre-imaging and using the SEM BSE pre-imaging is that the PCA is a pre-image of the same identified spectra, while the BSE image has a higher resolution image than the dot mapping EDS data matrix.
3.3. Comparison between TIMA-X and LIBS Results
Single mineral phase assignation is a challenge when comparing a TIMA-X image to lower resolution LIBS hyperspectral matrices because one LIBS spot corresponds to many TIMA-X pixels, and therefore the risk of wrongly identifying a spot containing multiple minerals to a single-phase spot is high. This is why the elemental content has been rigorously analyzed before assigning a LIBS spectrum to a specific mineral phase.
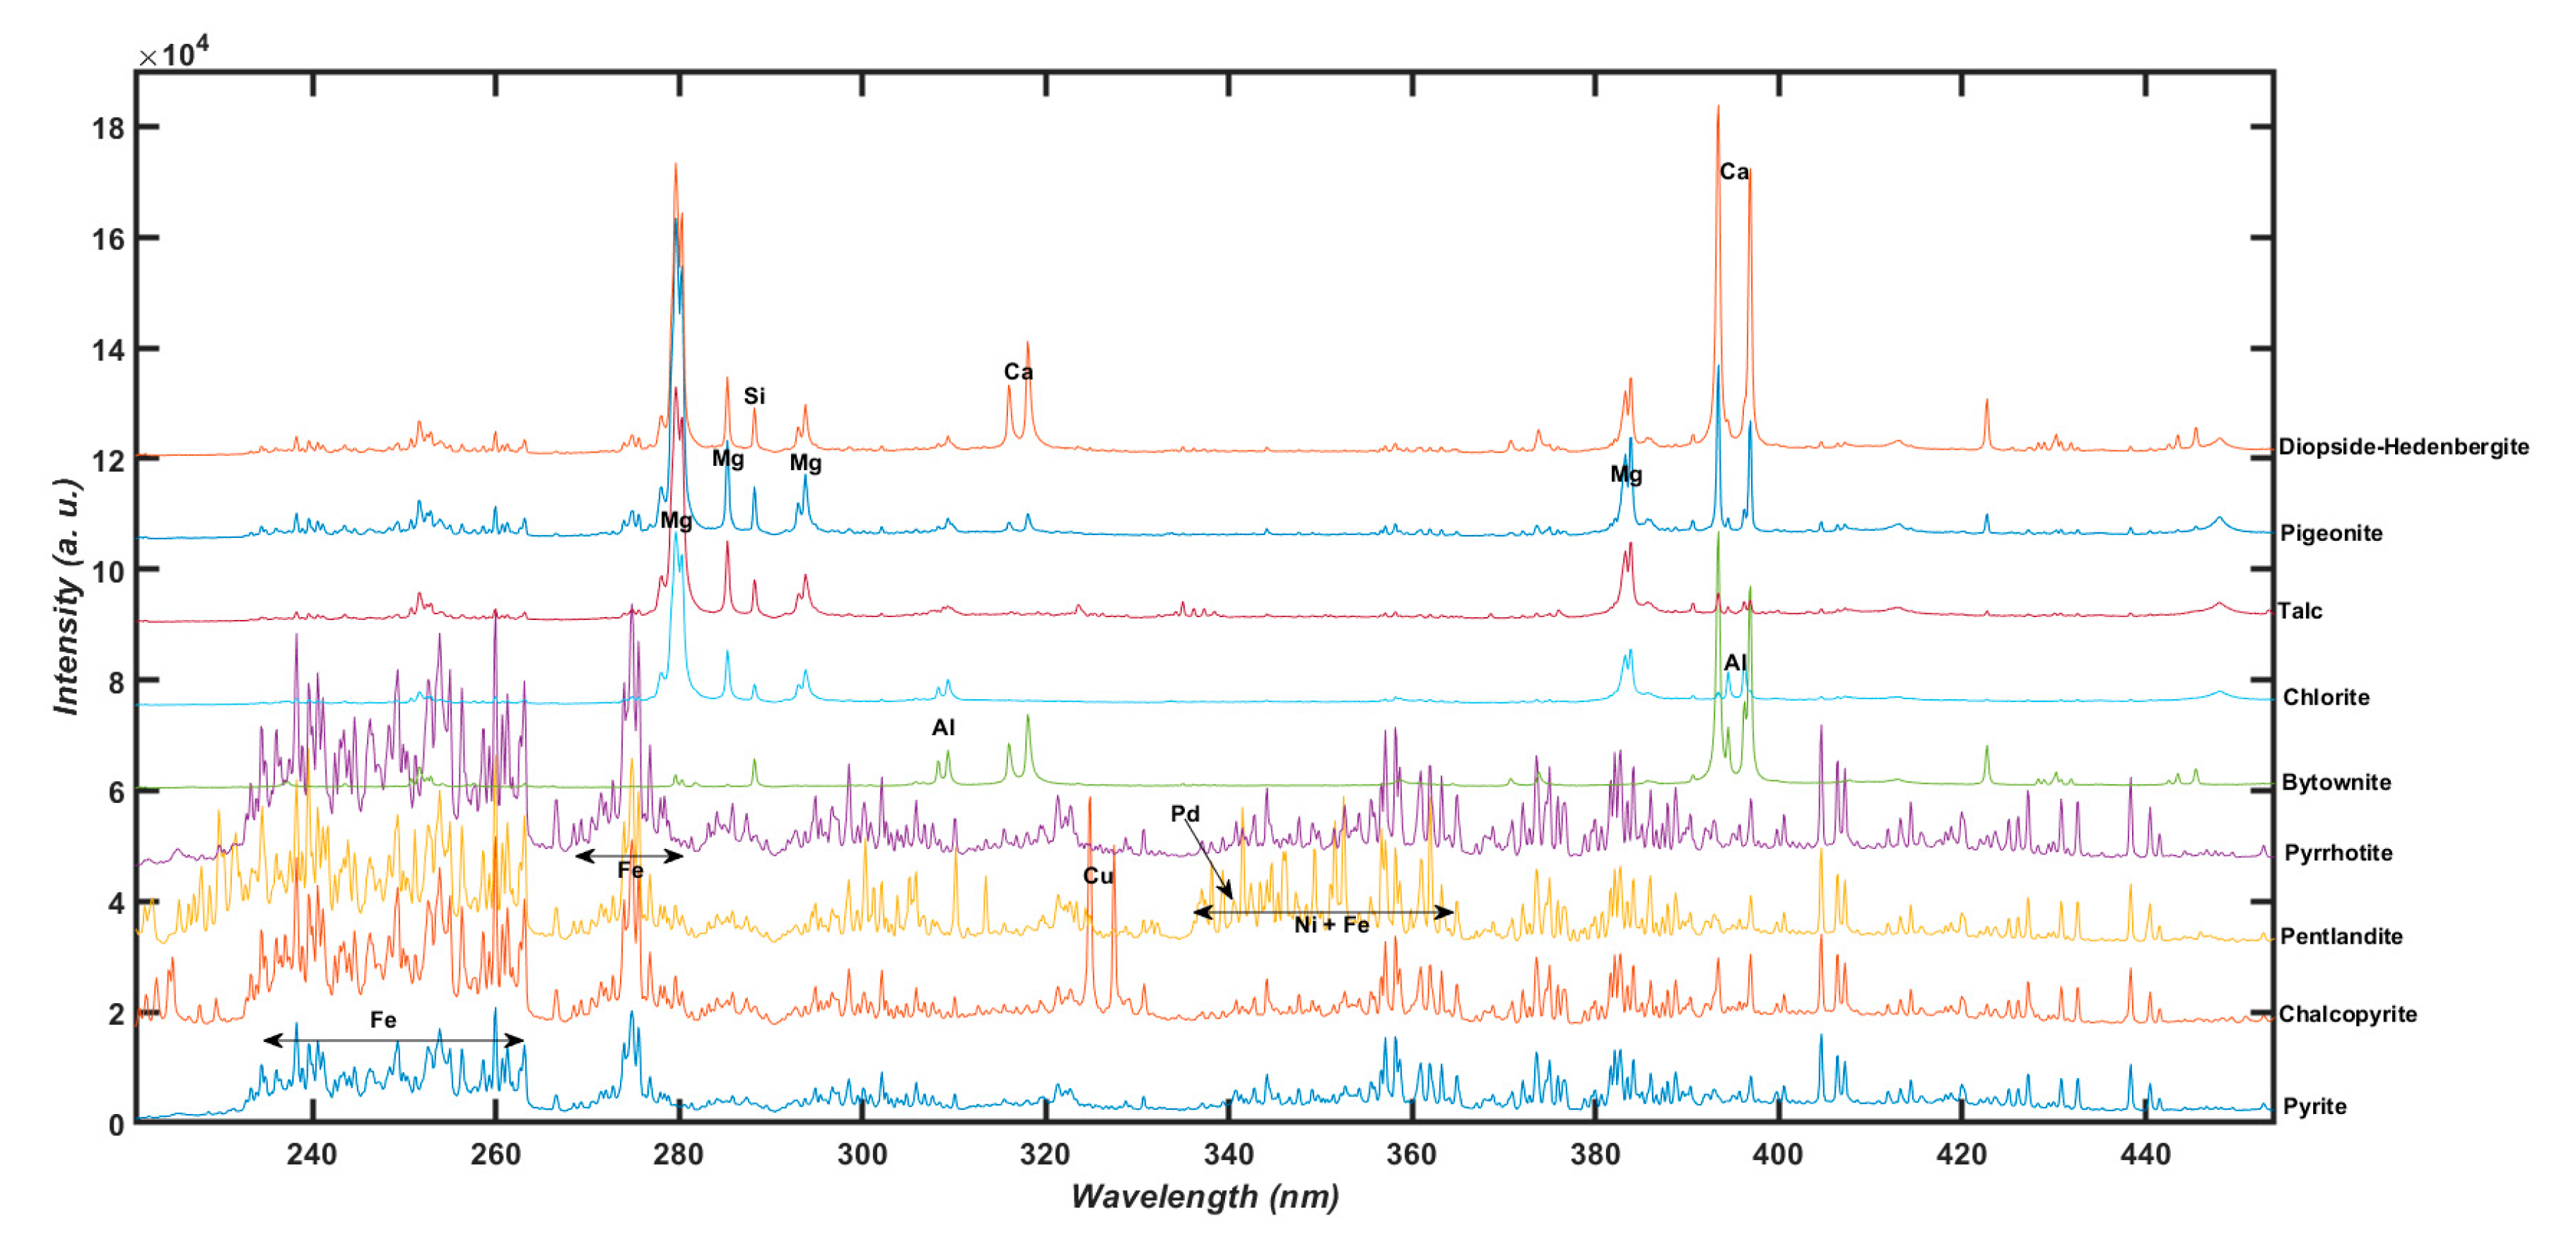
Figure 5 shows the spectra ranged between 220–460 nm for the main mineral phases identified by TIMA-X (
Figure 3). On the plotted spectra, the main atomic and ionic emission lines were identified. It can be observed that the spectra of the pyrrhotite and the pyrite phases mainly contain iron emission lines. These lines were of higher intensity for the pyrrhotite spectral pattern. The chalcopyrite spectrum was built of iron and copper emission lines, while the pentlandite one was built of iron and nickel lines. The bytownite spectrum was composed mainly of calcium, aluminum, and silicon. The chlorite spectral fingerprint was mainly composed of magnesium, silicon, and aluminum, and a small contribution of iron. In the case of talc, the emission signature mainly displayed magnesium and silicon. The pigeonite spectrum was mainly composed of magnesium, silicon, iron, and a small concentration of calcium and aluminum. Finally, the diopside-hedenbergite spectrum mainly revealed magnesium, calcium, silicon, and iron. It is worth mentioning that there was a slight discrepancy between the ideal chemical formulas (
Table 1) and the multi-elemental composition deduced from the LIBS spectra. After the algorithm assigned a single-phase mineral to each laser shot of the hyperspectral data cube (x, y, λ), a LIBS image could be successfully generated for 13 different minerals. The cases where the laser covers simultaneously mixed mineral phases are discussed below.
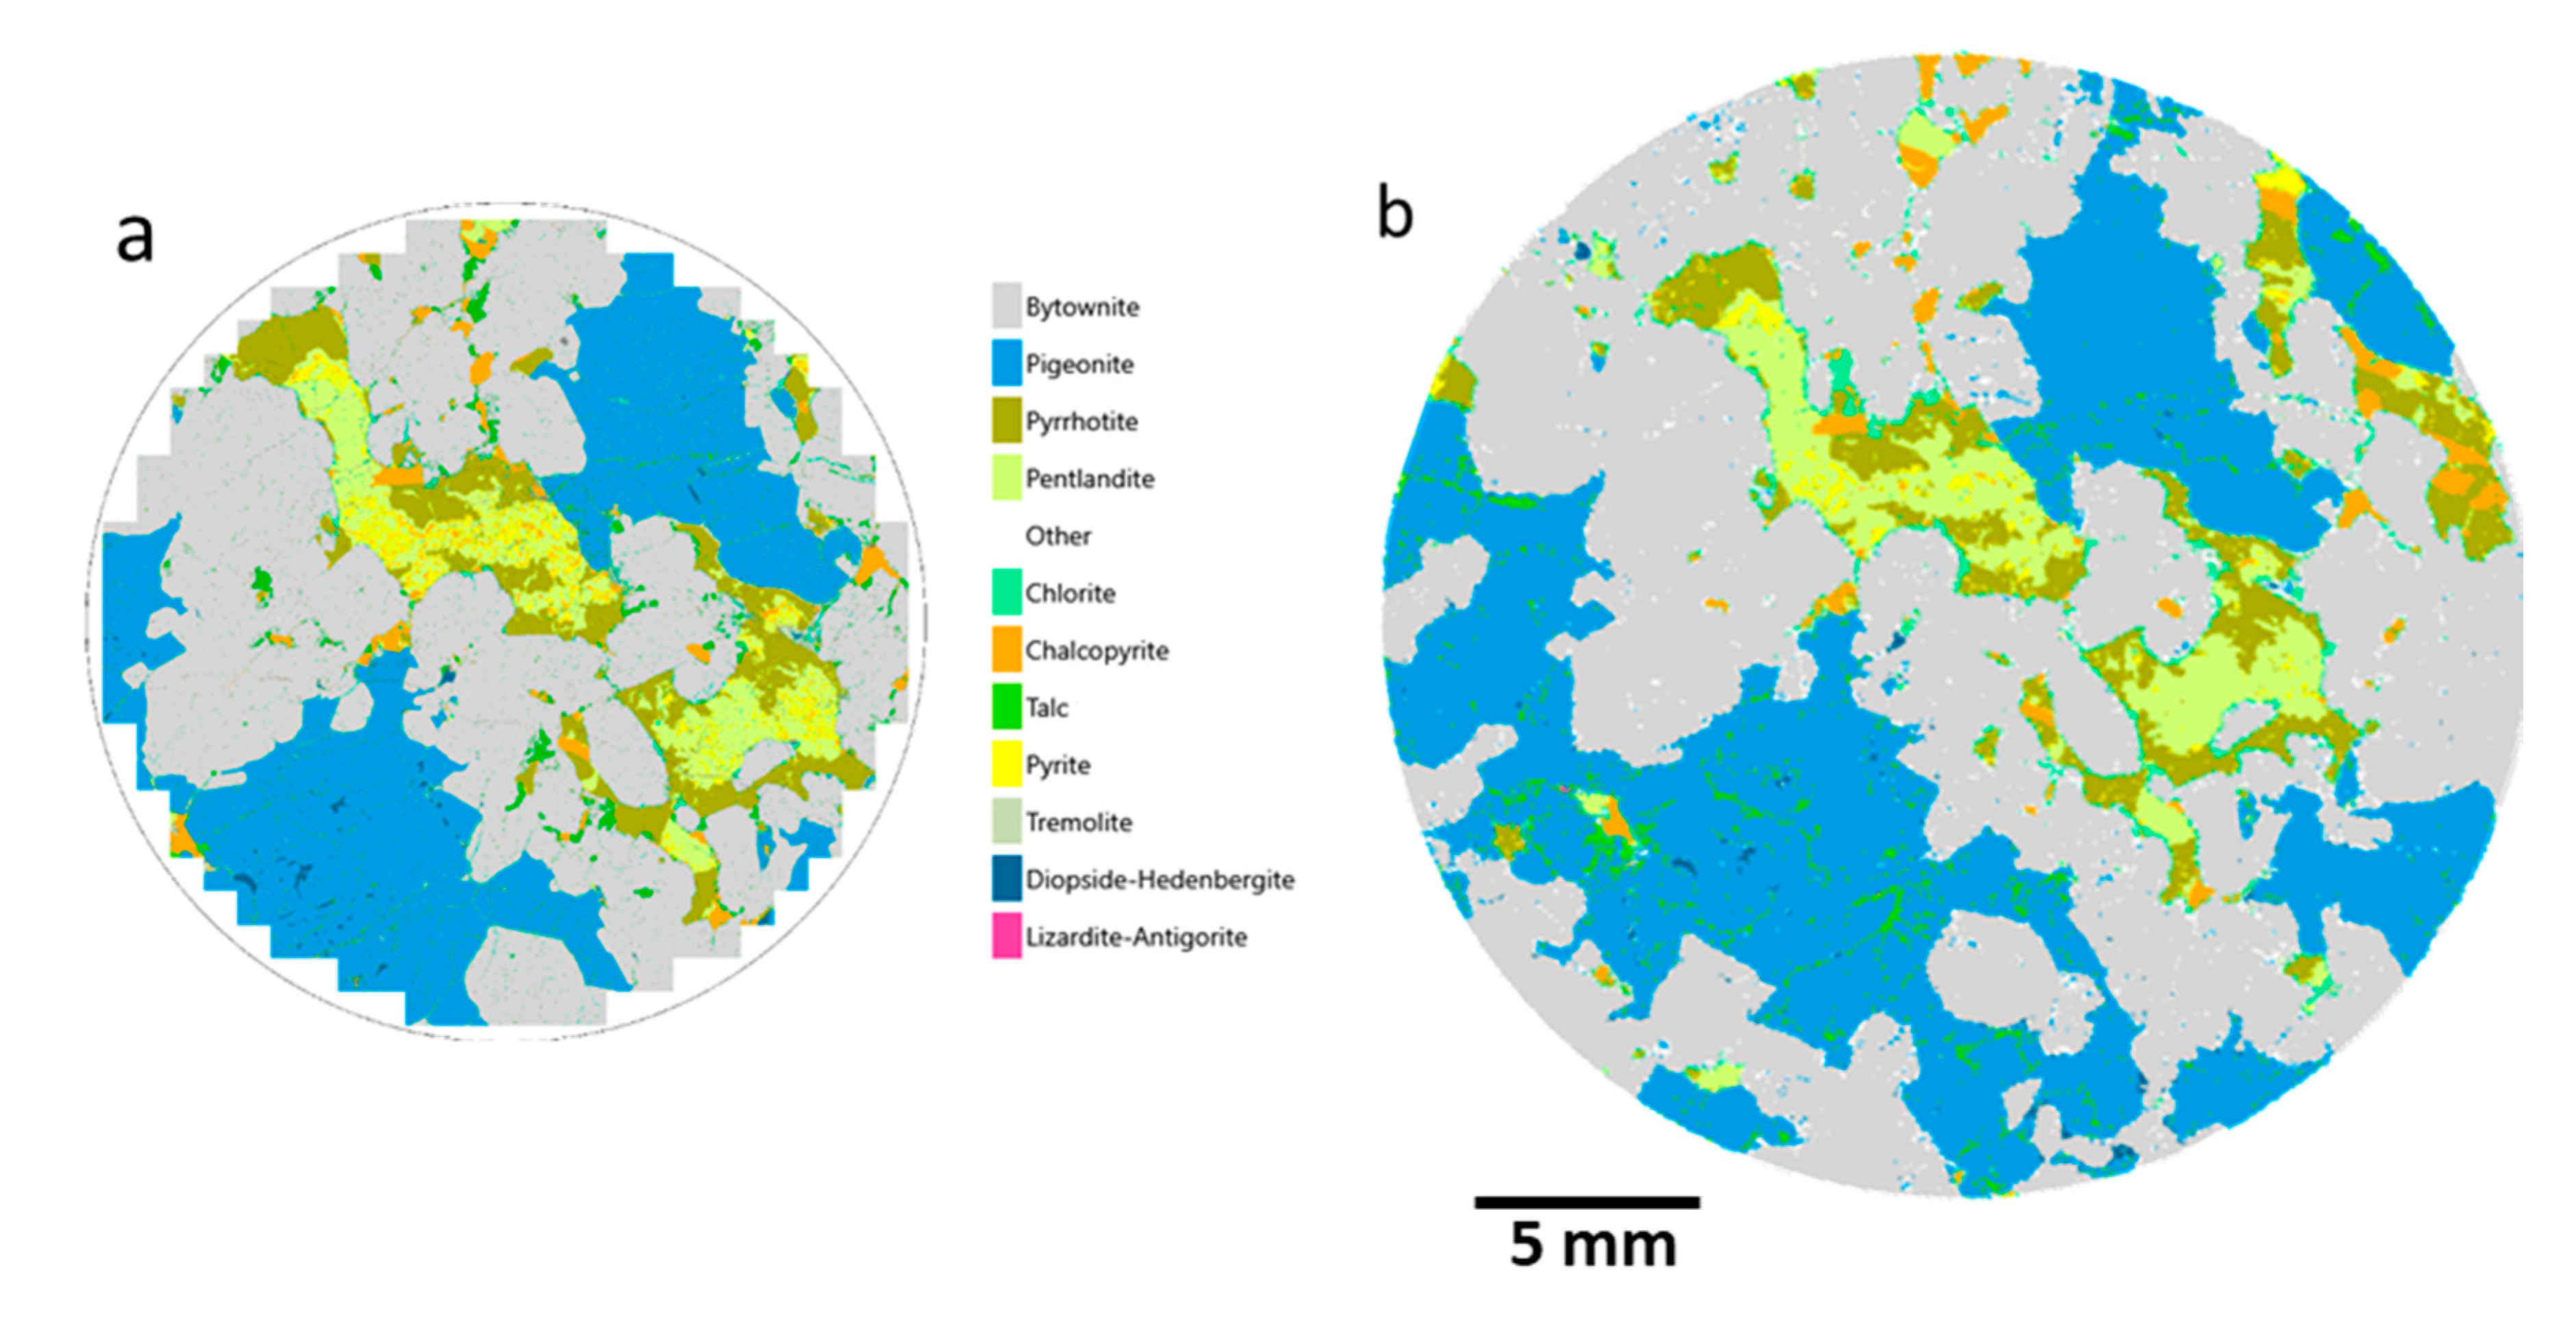
The mineral phase maps illustrated in
Figure 6 demonstrated good agreement between the analyses performed with TIMA-X and LIBS CORIOSITY. At first glance, it can be seen that the mapping of the most abundant minerals was similar for both analyses. We see that the small veins of minor minerals were better defined on the mineral map rendered by the TIMA-X due to its higher resolution. For instance, the veins of talc and even the pyrite inclusions were well defined. Furthermore, it was impossible to discern the minor mineral phase of zoisite (Ca
2Al
3(SiO
4)
3(OH)) from the major mineral phase of bytownite ((Ca,Na)(Si,Al)
4O
8) in the LIBS CORIOSITY spectral patterns due to their similar elemental content and to the fact that single-phase mineral grains smaller than the spatial resolution of LIBS (i.e., 50 µm) can hardly be assigned with certitude. Sodium emission lines would improve the assignation process, but at the time the samples were analyzed, the spectral range covered by the LIBS CORIOSITY instrument did not include the strong doublet lines of sodium (589 nm). Since then, the spectral range covered by the instrument has been upgraded by using a new spectrometer, and the discrimination of bytownite and zoisite has become possible (data not shown). The LIBS analysis has not been redone once more with the upgraded instrument because the samples PGE1a, b, and c analyzed by TIMA-X had been ablated by the first LIBS analysis. The mineral content is therefore presented here without distinguishing between bytownite and zoisite.
The few white pixels in the generated LIBS images were pixels that are not assigned to any pure mineral. In such cases, the LIBS spectra collected from these spots had a similarity index of less than 90%, with all spectra corresponding to pure minerals in the mineralogical database. This happens when the laser spot covers a mixed mineral phase, such as at the border of two or more mineral phases or when a minor phase is disseminated into a major one.
To the best of our knowledge, the CORIOSITY instrument is the first and only LIBS instrument capable of discriminating automatically between pyrite and pyrrhotite without requiring an expert in mineralogy to interpret the hyperspectral data. Although, the minerals recognized by LIBS correlated well with those determined by TIMA-X, the mineral mass abundances given in
Table 5 showed some differences between the two methods. This is probably due to the fact that the sample area scanned by LIBS was 1.7 times larger than that scanned by TIMA (
Figure 2). The area occupied by the minerals, as well as the mineral average density (same for LIBS and TIMA-X), were used to determine the mass distribution in the TIMA-X and LIBS images. The overall distributions of the main silicates and sulfides have been determined by LIBS with good accuracy, but the analysis of inclusions of fine minerals (calcite, quartz, magnesiohornblende, olivine, and PGEs) presented a larger bias due to the small size of many particles, compared to the diameter of the laser spot. For the PGEs, it is always possible to generate the mono-elemental map, such as presented in
Figure 7a, to avoid overwriting the PGE information due to their fine dissemination in other major minerals because of the moderate spatial resolution.
Other possible sources of discrepancies between the two methods were differences between the spectral resolution of the two instruments and differences between the depth of the laser ablation and the penetration depth of the electron beam. The cleaning of the carbon coating, as described before, may also have had an impact on the real mineral content since after ablating the surface, the LIBS hyperspectral data represent a mineral distribution somewhat deeper in the rock as compared to the TIMA-X measurements. Yet another factor to consider is the different algorithms used by the two methods to calculate the mineral content.
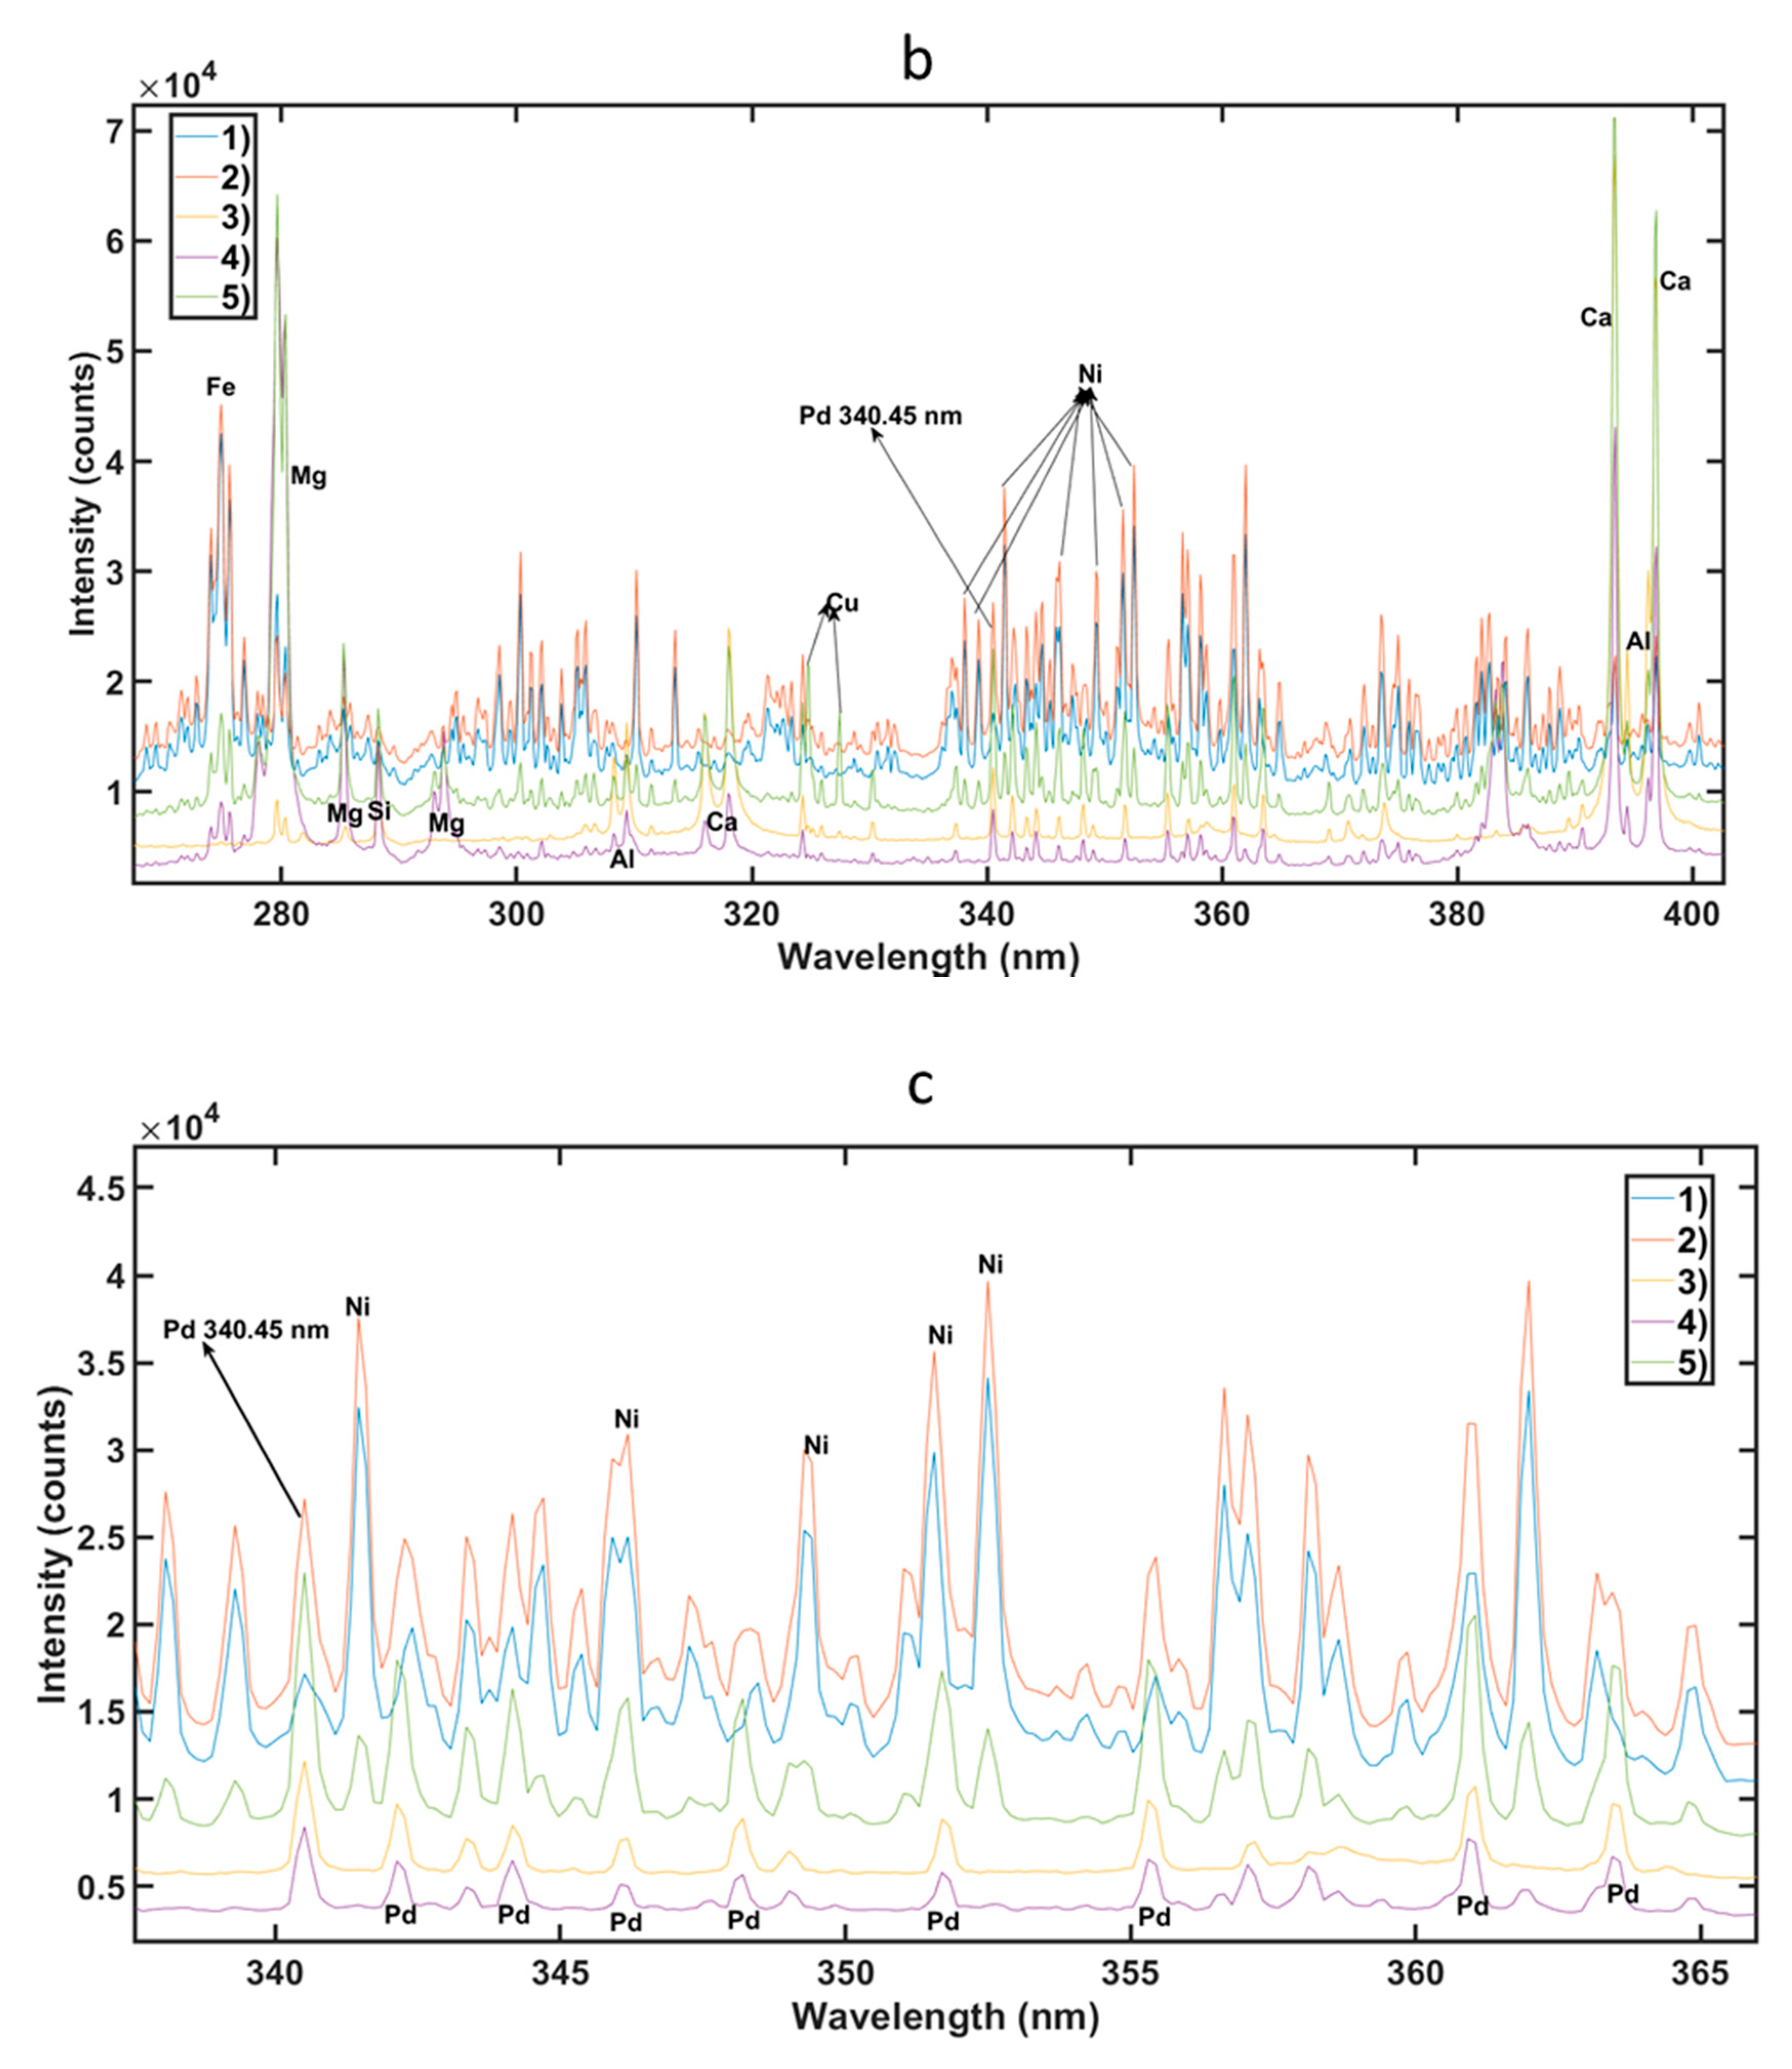
Going back to the minor minerals found by TIMA-X, such as Pd-Pt tellurides (telluropalladinite, kotulskite, and moncheite), and given that the size of these minerals is less than 5 µm, it was not possible for the LIBS technique to extract pure spectra of those minerals and consequently no pixels were attributed to those minerals in the LIBS images. Nevertheless, it was possible to identify single elements of interest by LIBS, even if they appear as small particles. This is what we illustrate in the following by considering the distribution of palladium.
Figure 7a shows the distribution of palladium using its atomic line at 340.45 nm. In
Figure 7a, areas containing palladium were encircled and numbered from one to five. These areas correspond to different minerals and different palladium concentrations. The areas one and two represent pentlandite poor (0.01–0.5%
w/
w) and rich (0.5–3.5%
w/
w) in palladium, respectively. The first type of pentlandite is far more abundant than the second type. The areas three to five were assigned to other minerals containing palladium, namely bytownite, pigeonite, and a mix of diopside-hedenbergite and chalcopyrite, respectively.
Figure 7b shows the LIBS spectra collected from the five selected areas.
Figure 7c is a magnification of
Figure 7b. In
Figure 7b,c, it can be observed that the spectra of areas one and two corresponded to pentlandite (due to the Ni and Fe lines) with different intensities of the palladium line at 340.45 nm. The palladium lines between 340 and 365 nm exhibited different intensities for different minerals, as can clearly be seen in
Figure 7c.
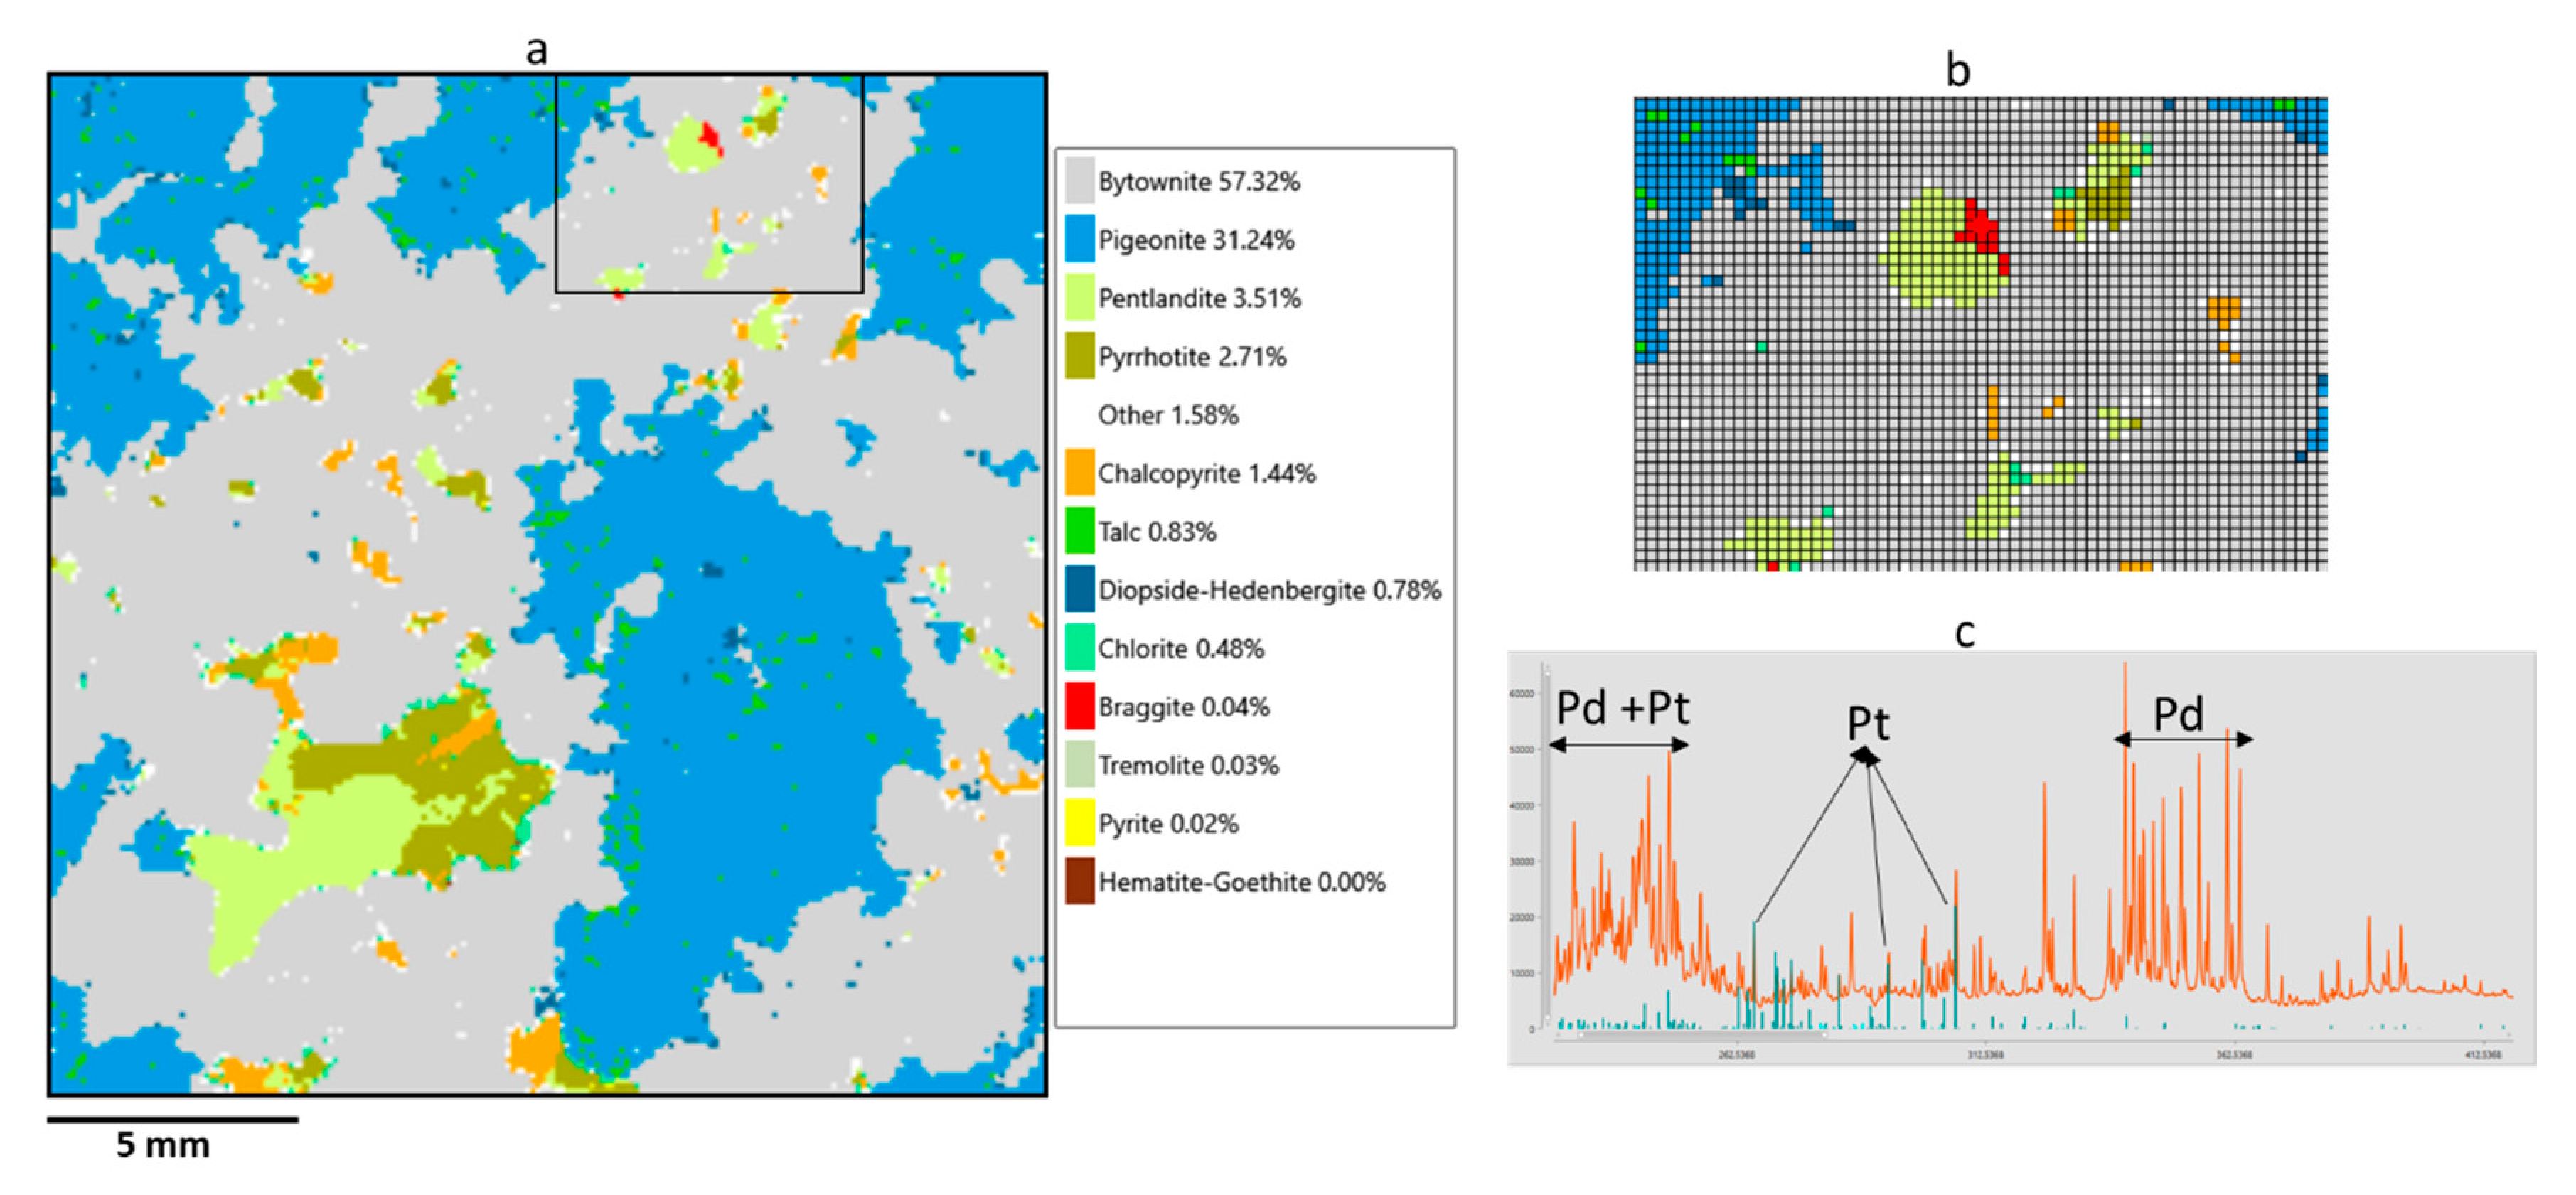
The LIBS mineral library developed from PGE1a, b, and c samples were tested on the PGE2 sample, which was used in a previous study conducted by Rifai et al. [
23]. The mineral content determined by LIBS of the sample PGE2, illustrated in
Figure 8a–c, shows that it contained relatively coarse grains of PGE-bearing braggite (>50 µm), which can be easily analyzed using the LIBS CORIOSITY technology. Prior to conducting the analysis of the mineral content, the braggite phase (not present in the PGE1 samples), identified in [
23], was included in the ELEdit mineral library. The minerals maps for PGE1b and PGE1c obtained by TIMA-X and LIBS were in good agreement (data not shown to improve the readability of the manuscript).
3.4. General Discussion
The LIBS CORIOSITY is a new analysis tool suitable for the ultra-fast quantitative analysis of minerals. Since the LIBS CORIOSITY instrument does not require any special components such as vacuum pumps, gas, or exhaust fans, it can be easily used in the analytical lab as well as in the field.
Combining multiple sensing techniques increases the implementation cost versus efficiency gain ratio. The emergence of the LIBS ultrafast automated quantitative mineral analysis promotes game-changing applications since a single LIBS scan may now render both multielement analysis and quantitative mineralogical analysis, lowering implementation costs and accelerate sample throughput.
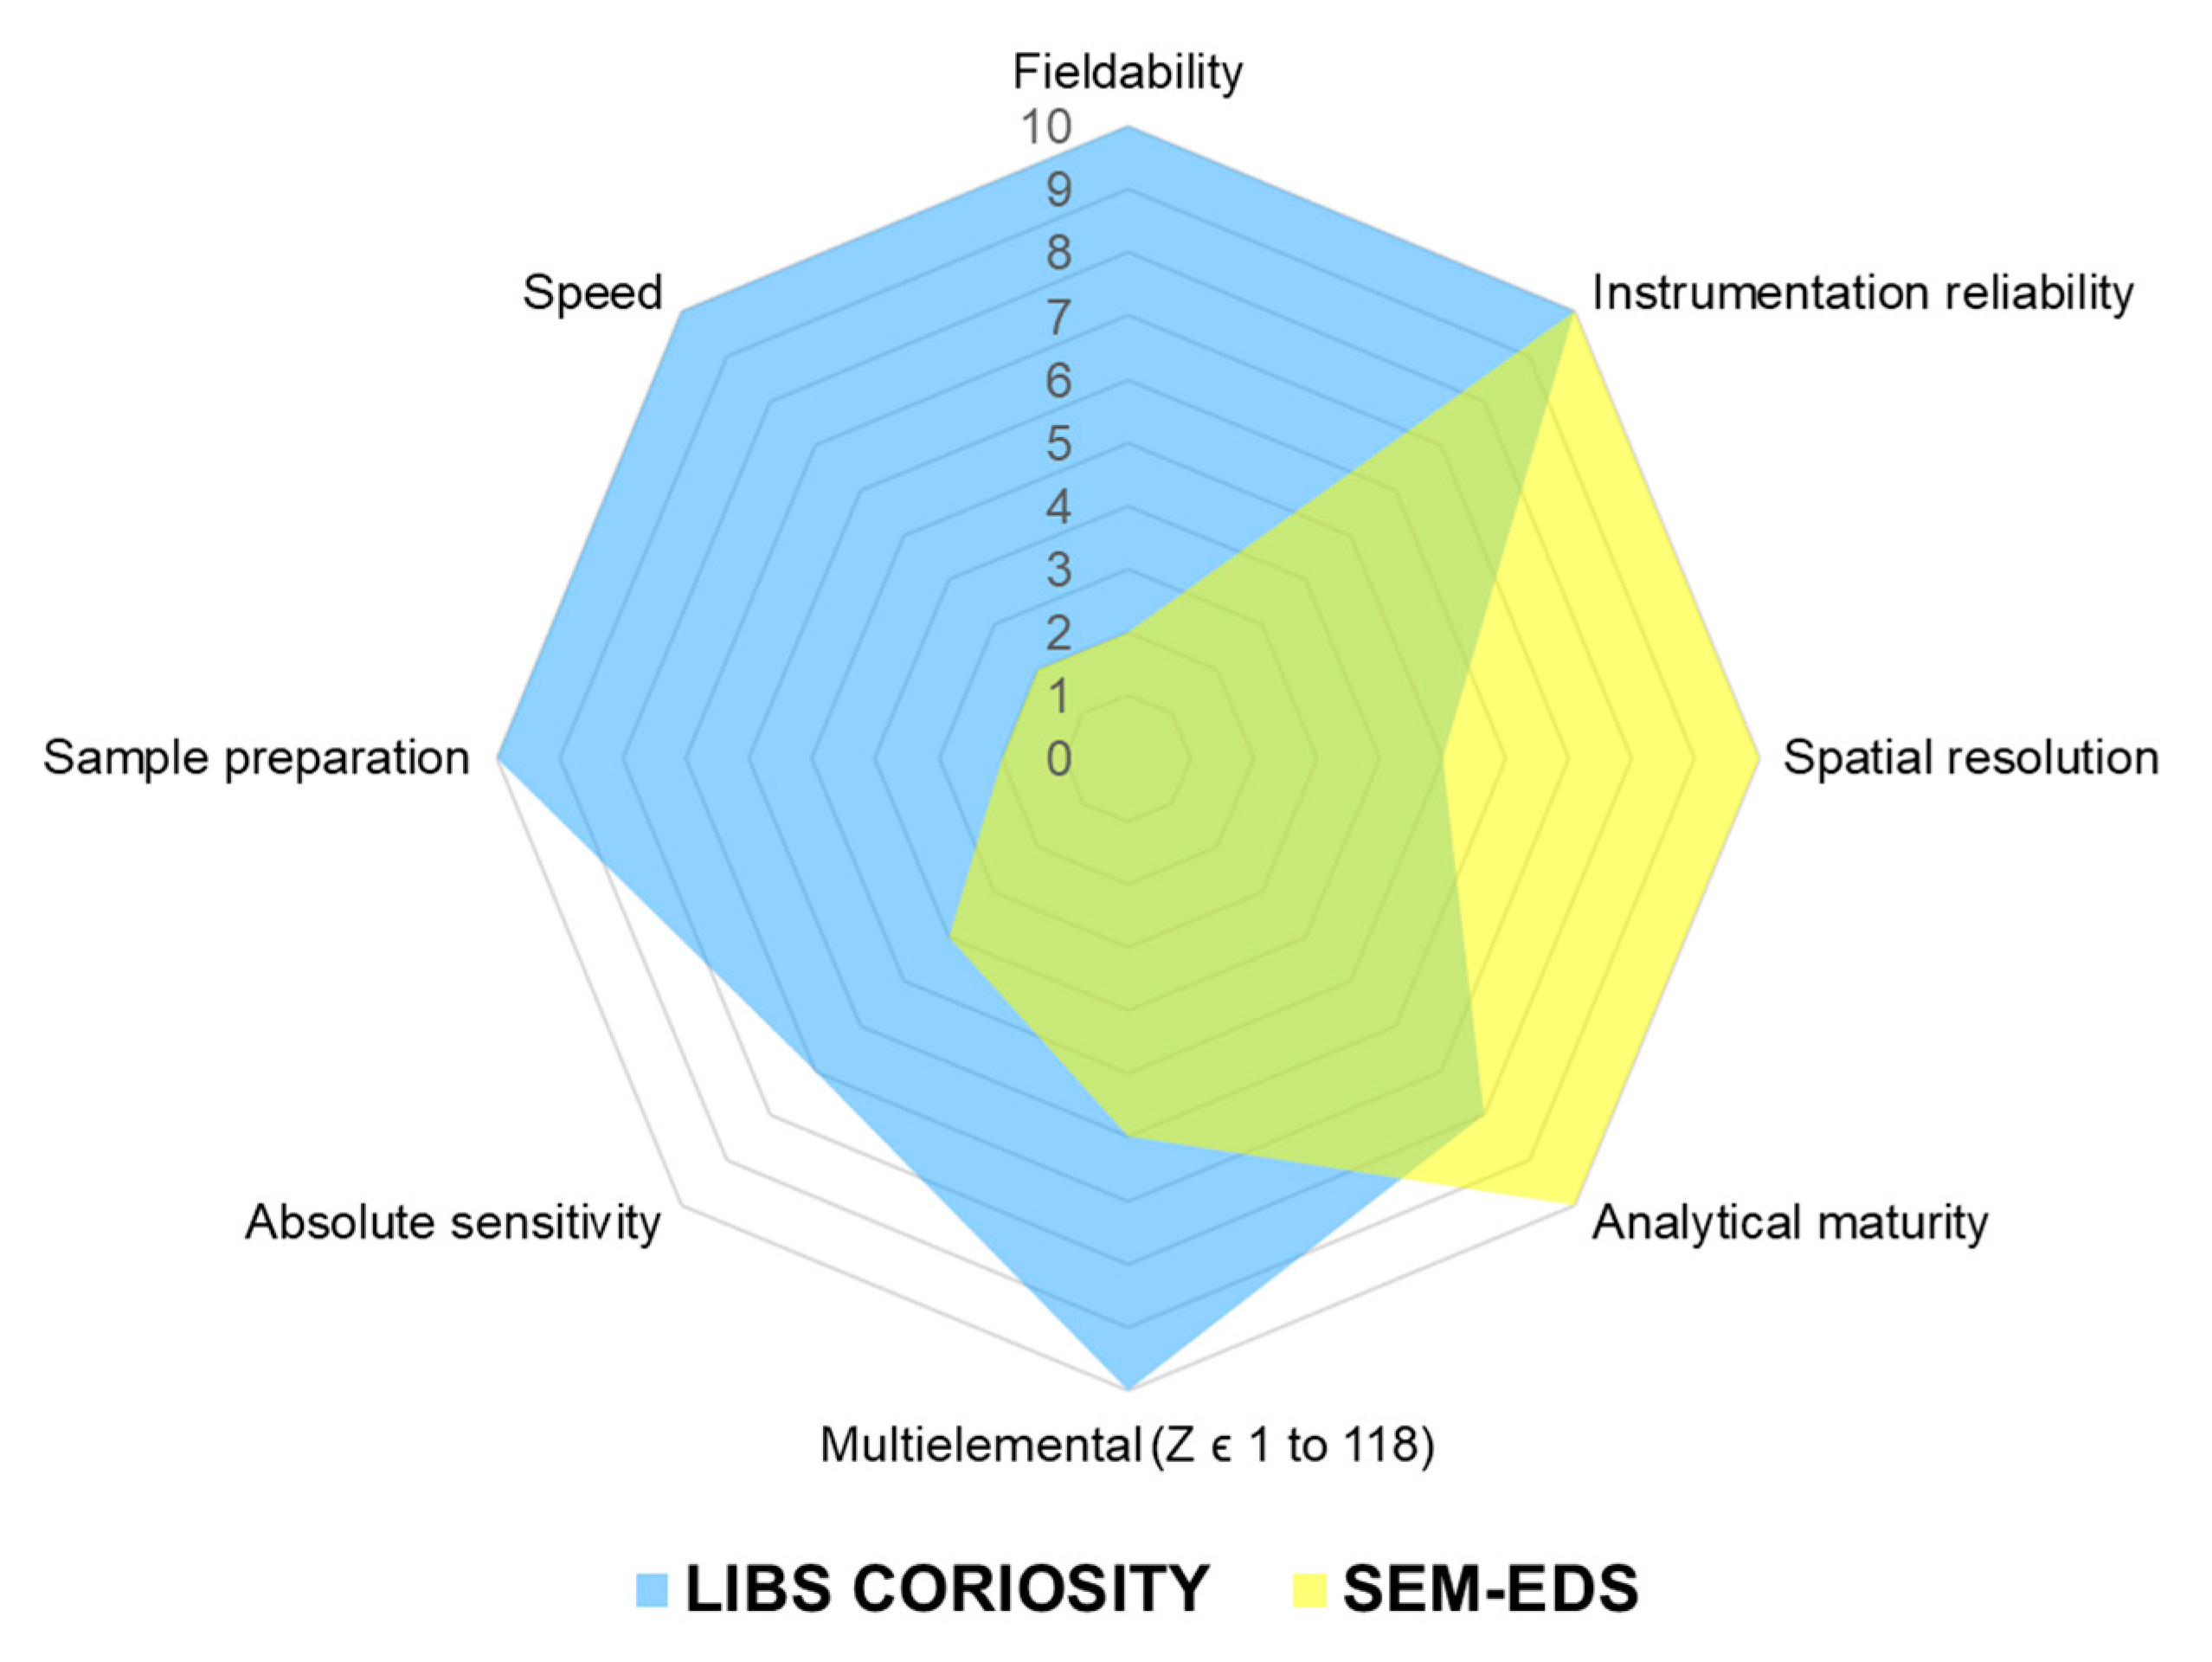
The multi-tasks SEM-EDS mapping methods have the majority vote when a high-resolution map has to be generated for geological assessments. Also, EDS spectral databases and mineralogy identification methods are more mature than the LIBS ones because SED-EDS has been applied to the mining industry for a much longer time. However, it is obvious that the LIBS CORIOSITY is the strongest player from the point of view of the speed of the analyses and transportability. The SEM-EDS method requires a controlled laboratory environment; therefore, the “fieldability” (i.e., the ability of an instrument to be used in any practical field) of SEM-EDS instruments is poor. To countervail some of the technique’s limitations, the TIMA-X was engineered to make the scan speed faster than any other SEM-EDS method. Even with these improvements, the TIMA-X is still considerably slower than the LIBS CORIOSITY instrument. In this study, a larger surface map has been generated using the LIBS instrument in a few minutes, while the TIMA-X mapping took a few hours. The spatial resolution of the LIBS instrument is adapted to field operations; higher resolutions are not needed for in situ mineral liberation analysis. The LIBS technique does not require polishing the sample nor any other preparation step prior to the surface mapping, and it can be applied directly on drill core surfaces without additional cares. On the other hand, SEM-EDS methods require laborious sample preparation. The LIBS multielement and mineralogical analysis is also more sensitive since atomic emission spectra are more complex in the visible spectral range as compared to the X-ray range. The LIBS multi-elemental analysis has no constraints on the atomic weight of chemical elements, contrary to SEM-EDS, which has low sensitivity for elements lighter than magnesium.
From these observations, a radar plot comparing LIBS CORIOSITY versus SEM-EDS is illustrated in
Figure 9. From all these practical and scientific considerations, LIBS definitely emerges as a valuable complementary tool for fast, automated mineralogical analysis. In fact, LIBS can help to characterize rapidly rock samples containing high-value minerals that can be characterized afterward using a higher spatial resolution approach such as SEM-EDS. As demonstrated by the implementation of the extra-terrestrial mining application of the ChemCam instrument on the Mars’s Curiosity rover since 2012, LIBS is definitely a valuable tool for surveying the landscape or ore body samples rapidly in order to quickly converge to high-value samples that require deeper investigation with complementary analytical approaches.


