Article

A Mathematical Model of Gas and Water Flow in a Swelling Geomaterial—Part 2. Process Simulation

by
Elias Ernest Dagher
1,2,
Julio Ángel Infante Sedano
2 and
Thanh Son Nguyen
1,2,*
1
Canadian Nuclear Safety Commission (CNSC), Ottawa, ON K1P 5S9, Canada
2
Department of Civil Engineering, University of Ottawa, Ottawa, ON K1N 6N5, Canada
*
Author to whom correspondence should be addressed.
Minerals 2020, 10(1), 32; https://doi.org/10.3390/min10010032
Submission received: 24 October 2019 / Revised: 18 December 2019 / Accepted: 20 December 2019 / Published: 29 December 2019
(This article belongs to the Special Issue Nuclear Waste Disposal)

Abstract

:
Gases can potentially generate in a deep geological repository (DGR) for the long-term containment of radioactive waste. Natural and engineered barriers provide containment of the waste by mitigating contaminant migration. However, if gas pressures exceed the mechanical strength of these barriers, preferential flow pathways for both the gases and the porewater could form, providing a source of potential exposure to people and the environment. Expansive soils, such as bentonite-based materials, are widely considered as sealing materials. Understanding the long-term performance of these seals as barriers against gas migration is an important component in the design and the long-term safety assessment of a DGR. This study proposes a hydro-mechanical mathematical model for migration of gas through a low-permeable swelling geomaterial based on the theoretical framework of poromechanics. Using the finite element method, the model is used to simulate 1D flow through a confined cylindrical sample of near-saturated low-permeable soil under a constant volume boundary stress condition. The study expands upon previous work by the authors by assessing the influence of heterogeneity, the Klinkenberg “slip flow” effect, and a swelling stress on flow behavior. Based on the results, this study provides fundamental insight into a number of factors that may influence two-phase flow.

1. Introduction

In Canada, nuclear waste has been generated and accumulated since the 1930s when the Port Radium radium mine began operating in the Northwest Territories [1]. Over the past century, Canada has become a sustainable nuclear country with operating nuclear facilities across the nuclear fuel cycle, all producing various forms of radioactive waste. To date, this waste, in the form of low-, intermediate-, and high-level radioactive waste, has been primarily stored on-site at nuclear power plants or in below surface radioactive waste management facilities.
In identifying a long-term solution to manage global radioactive waste, the international community, including Canada, has been evaluating the use of a deep geological repository (DGR) for its long-term management. The primary purpose of a DGR is to contain and isolate wastes to minimize impact to the environment and radiological exposure to people.
In developing a safety case for a DGR to provide supportive arguments that the management of radioactive waste will be protective of human health and the environment over the long term, relevant features, events, and processes (FEPs) must be evaluated [2,3]. One such process with the potential means for radiological exposure to the biosphere is the generation of radioactive gas that may migrate to the surface [4]. Gas could be generated through a number of processes, including degradation of organic matter, radioactive decay of the waste, corrosion of metals producing hydrogen gas (H2), and radiolysis of water producing H2 [4,5,6]. If production exceeds the containment capacity of the engineered barriers or the host rock, these gases could migrate through the engineered barriers and/or the host rock [7,8]. The preferential migration pathway of these radioactive gases to potentially expose people and the environment to radioactivity might be through access and ventilation shafts, as these components are typically part of the repository design.
In recent years, a number of international projects have focused on the topics of gas generation and migration with a focus on the impact of gas build-up and migration through an engineered barrier system (EBS) [4,9]. Expansive or swelling soils, such as bentonite-based materials, are currently the preferred choice of seal materials used for an EBS. Understanding the long-term performance of these seals as barriers against gas migration is an important factor in the design and the long-term safety assessment of a DGR.
In 2005, Marschall et al. [10] described gas transport processes in low-permeability clay material, and their work was further investigated by Cuss et al. [5]. Marschall et al. [10] recognized that gas transport through porous media is controlled by a number of the media’s hydraulic and mechanical characteristics, such as the intrinsic permeability, porosity, and material strength. They identified the importance of the hydro-mechanical state of the rock or the soil media (i.e., water saturation, porewater pressure, and stress state) and the gas pressure at focal points that could lead to microfracturing [10]. Marschall et al. [10] divided the basic transport mechanisms into four processes, mainly (i) advective–diffusive transport of gas, (ii) visco-capillary two-phase flow, (iii) dilatancy-controlled gas flow and the induction of microfractures creating preferential flow pathways, and (iv) gas transport along macro-fractures.
Of particular interest to this paper is the investigation of processes and characteristics that may be contributing to dilation-controlled gas flow, resulting in an accelerated rate of gas migration in a nearly saturated geomaterial. These processes and characteristics are loosely called “enhanced mechanisms” for gas migration, since without them, the migration rate is expected to be very low. A wealth of laboratory and field-scale experimental studies have investigated gas transport processes through natural (host rock) and engineered barriers. These studies provide a wealth of evidence that suggest that, at gas pressures above a critical level, there is formation of pressure-induced preferential flow pathways and dilation of the clay, resulting in increased gas flow. In addition, a number of mathematical models have been developed to simulate the gas transport processes observed through these laboratory and field scale studies with some success [11,12,13,14]. However, no studies to date have been able to determine the exact mechanisms that control gas entry, flow, and pathway sealing [5,7,9,11,15,16,17,18,19].
Marschall et al. [10] described the primary transport mechanism of dilatancy-controlled gas flow as an important transport mechanism in clay soil or clay-rich rock with low tensile strength. Dilatancy occurs when the gas pressure reaches a reference stress level acting on the clay medium, forcing the clay particles to align in a dispersed orientation and resulting in the formation of microfractures accompanied by an increase in plastic deformation [20]. As a result, gas flow along these microfractures is promoted due to the increased pore space. The presence of microfractures therefore leads to an increase in the intrinsic permeability of the material and in turn results in changes in the relationship between the capillary pressure (i.e., matric suction) and the degree of saturation (i.e., soil water characteristic curve (SWCC) of the material). Attributable to dilatancy-controlled gas flow, transport properties are now dependent on the stress state and the state of deformation of the soil.
Another consideration when conceptualizing the physical processes taking place during two-phase flow through a porous media is the phenomenon of viscous- or gas fingering. The phenomenon of gas fingering results from differences in the fluid viscosity of the liquid phase and of the gas phase. Sahimi et al. stated that viscous fingering would occur when the mobility ratio, M (generally the ratio of gas and liquid viscosities), between the gas phase and the liquid phase is less than one (M < 1) [21]. Since movement of the gas front is faster than the liquid front, this results in a displacement front (i.e., gas front is further than the liquid front). In a porous medium, the gas front may result in the formation of gas “fingers” [21].
Several works have identified that a number of factors contribute to the effect of gas fingering. These include the displacement rate of the gas with the liquid (i.e., differences in mobility of the individual phases), the extent of heterogeneity of the porous medium and spatial variations of porosity and permeability, the viscosity ratio between gas and liquid, the three-dimensional dispersion within the porous media, and the aspect ratio and boundary conditions representing the narrowness of the porous media [21,22,23]. Additionally, in order to numerically simulate fingering effects accurately, consideration of mesh size also plays a critical role [22]. Moortgat et al. also identified that other factors may help stabilize gas fingering, which include consideration of gravity, diffusion, and capillary pressure [23].
Dagher et al. [11] developed a fully-coupled hydro-mechanical (HM) linear-elastic mathematical model for advective–diffusive visco-capillary controlled two-phase flow through geomaterials in order to model the first two transport mechanisms (i.e., advection and diffusion of dissolved gas and visco-capillary “two-phase” flow) proposed by Marschall et al. [10]. Results from a constant volume 1D flow experiment was used to validate the model. A number of parametric studies were investigated to assess the contribution of advection of poregas, diffusion of dissolved gas in porewater, advection of dissolved gas in porewater, and inclusion of mechanical deformation (linear elasticity) on flow behavior with increasing gas pressures over time. Additionally, sensitivity analyses were conducted to gain an understanding of the influence of a number of soil properties on flow behavior, such as the effect of modifying the air-entry value (AEV), intrinsic permeability, and initial porosity of the soil specimen. Finally, the study investigated the use of a linear elastic damage model to better represent the experimental results. Although the model results reproduced some of the general features noted in the experimental results, the model was unable to simulate dilatancy-controlled gas flow. The study concluded that, in order to simulate dilatancy-controlled gas flow, additional mechanisms need to be considered within the model. These include the use of advanced mechanism of mechanical deformation to be coupled to gas transport, consideration of heterogeneity within the soil sample to help induce preferential flow, inclusion of a swelling stress term to incorporate the swelling behavior of expansive soils, and the incorporation of a self-healing mechanism to represent observed phenomena of experimental studies [11].
This study builds upon the authors’ previously published work by investigating the use of advanced physical relationships on flow behavior, specifically the influence of: (i) heterogeneity within the geomaterial to promote preferential flow, (ii) the Klinkenberg “slip flow” effect on gas permeability, and (iii) a linear swelling stress to promote swelling of the geomaterial. Finally, the authors investigate the conditions that promote fingering in two-phase flow. The models are validated against experimental data from a 1D flow test. The results of this study will be used to inform the development of a more sophisticated HM model that can be used to simulate dilation-controlled gas flow in a swelling geomaterial.
This research continues to be, in part, a contribution to Task A of the current project phase of the international working group for the DEvelopment of COupled models and their VALidation against EXperiments (DECOVALEX-2019). This task, led by the British Geological Survey (BGS), further attempts to identify the physical HM mechanisms required to adequately model dilatancy-controlled gas migration.

2. Mathematical Model

2.1. Study Overview

This study expands upon the work performed by Dagher et al. [11] on the development of a mathematical model for gas migration (two-phase flow) through a low-permeable swelling geomaterial. Using the theoretical framework of poromechanics, this study provides a process simulation and analysis of enhanced processes for two-phase flow related to the inclusion of the following advanced physical relations to the HM model to investigate their effect on two-phase (water and gas) flow behavior, specifically:
  • heterogeneity through the use of a random normal distribution of porosity;
  • Klinkenberg “slip flow” effect for the intrinsic permeability of the gas in soil;
  • a swelling strain to take into account volume changes of the geomaterial with suction.
The mathematical model presented in this paper follows the general formulation by Dagher et al. [11] and Nguyen and Le [24] and includes the constitutive relations for the soil water characteristic curves (SWCCs) through the application of the van Genuchten equation and the relative permeability–saturation relationships using Mualem’s model. The applicable constitutive relations and governing equations for conservation of momentum, water mass, and gas mass are also discussed in the companion paper to this one [25]. For sake of consistency, the final governing equations are also provided below along with a mathematical description of the Klinkenberg effect and swelling strain.

2.2. Governing Equations for Two-Phase Flow through a Linear Elastic Geomaterial

2.2.1. Conservation of Water Mass

The governing equation for the conservation of water mass can be expressed by Equation (1),
x i ( ρ w k ij , w k r , w μ w ( p w x j + ρ w g j ) ) = ρ w [ n ( dS w ds ) s t + n S w K w p w t + S w t ( u k x k ) ]
where ρ w is the density of water phase (kg m−3)
p w is the porewater pressure (Pa)
k ij , w is the intrinsic permeability tensor of water flow in the porous medium (m2)
k r , w is the relative permeability of the water phase (adimensional)
μ w is the dynamic viscosity of the water phase (Pa s or kg m−1 s−1)
g is the acceleration due to gravity (m s−2)
n is the porosity (m3 voids · m−3 total)
S w is the degree of saturation of water (adimensional)
s is the matric suction ( p g p w ) (Pa)
K w is the bulk modulus of the water phase (Pa s or kg m−1 s−1)
u k x k = ε vol is the volumetric strain (adimensional)
u is the displacement of the solid skeleton (m)
t is time (s)
Note that, in this study, the permeability is assumed to be isotropic, therefore kij = k; however, we keep the tensorial notation in the governing equation for the sake of generalization.

2.2.2. Conservation of Gas Mass

The governing equation for the conservation of gas mass can be expressed by Equation (2),
( ρ g ( k ij , g k r , g μ g ( p g x j + ρ g g ) + H k ij k rw μ w ( p w x j + ρ w g ) ) ) x i + x i ( D e x k ( ρ g n ( HS w ) ) )       = ρ g [ n ( H 1 ) ( dS w ds ) s t + n ( 1 S w + HS w ) K g p g t       + ( 1 S w + HS w ) t ( u k x k ) ]
where ρ g is the density of the gas phase (kg m−3)
p g is the poregas pressure (Pa)
k ij , g is the intrinsic permeability tensor of gas flow in the porous medium (m2)
k r , g is the relative permeability of the gas phase (adimensional)
μ g is the dynamic viscosity of the gas phase (Pa s or kg m−1 s−1)
H is Henry’s coefficient (kg species A m−3 in aqueous phase kg−1 species A m3 in gas phase)
D e is the effective diffusivity of gas dissolved in water through porous media (m2 s−1)
K g is the bulk modulus of the gas phase (Pa).

2.2.3. Conservation of Momentum (Quasi-Static Equilibrium)

For a linear poro-elastic swelling geomaterial, the governing equation for the conservation of momentum can be expressed by Equation (3),
G 2 u i x j x j + ( G + λ ) 2 u j x j x i K β sw s x i + ( 1 χ ) p g x i + χ p w x i + F v , i = 0
where G is the shear modulus (Pa)
λ is the Lamé constant (Pa)
β sw is a swelling coefficient (1/Pa), as discussed in Section 2.4
K is the bulk modulus of the solid skeleton (Pa)
Χ is a parameter related to the degree of saturation of the soil [26]
F v , i is the volumetric body force tensor (kg m−2 s−2)

2.3. Intrinsic Permeability and the Klinkenberg Effect “Slip Flow”

In addition to the constitutive relations for the hydraulic behavior provided in Dagher et al. [11] and the companion paper to this one [25], this paper investigates the use of the Klinkenberg effect to represent a value of the intrinsic permeability of gas that is different from that of water. In this study, the intrinsic permeability tensor is assumed to be isotropic. Therefore, off-diagonal components are nil and diagonal components are equal to a value k,
k ij = δ ij k
where δ ij is the Kronecker delta (identity tensor) (adimensional).
For fine-grained expansive clays, which have very small grain-sizes less than 2 μm and are non-uniform, Pall and Moshenin [27] proposed the following equation based on a volume–surface mean diameter and changing porosity to account for non-uniformity of the soil particles. This equation was applied to the author’s previous model [11].
k w = D vs 2 180 n 3 ( 1 n ) 2
where D vs is the volume-surface mean diameter (cm).
The porosity is calculated by,
n = n 0 + ε v o l
where n 0 is the initial porosity of the porous media (m3 voids · m−3 total).
As the intrinsic permeability is not a property of the porefluid but rather a property of the geometry of the porous media (i.e., porosity, pore shape, and pore size distribution), it is reasonable to assume that the permeability of porewater and poregas in the same soil specimen would be the same. However, a number of studies have shown that the intrinsic permeability of gas is often higher than that of water and may be related to the poregas pressure [28,29,30]. The Klinkenberg effect, also described as “slip flow”, has been used to conceptualize this phenomenon, whereby slip occurs between the gas molecules and the solid wall, resulting in an increase in the intrinsic permeability of gas as poregas pressure decreases [31].
Equations (7) and (8) provide the relationship between the intrinsic permeability value of water and the intrinsic permeability value of gas a function of pressure.
k g = k w ( 1 + b ke p g )
b ke = c ke κ B T π 2 r 3
where k g is the intrinsic permeability value of gas (m2).
k w is the intrinsic permeability value of water (m2)
b ke is the Klinkenberg slip factor (Pa)
c ke is a constant (adimensional)
κ B is Boltzmann’s constant (J K−1)
T is the temperature (K)
r is the pore radius (m).

2.4. Swelling Strain Component

Using the elastic framework, the total strain can be divided into an elastic and a swelling strain component as follows:
ε kl = ε ij el + ε ij sw
where ε kl is the total strain tensor (adimensional)
ε ij el is the elastic strain component (adimensional)
ε ij sw is the swelling strain component (adimensional)
For an expansive/swelling soil, the swelling strain increment, d ε i j s w is a function of suction, s , or the degree of saturation, S w , whereby an increase in suction (or likewise a decrease in degree of saturation) leads to shrinkage of the geomaterial and an increase in porosity due to the increase in volumetric strain provided by the swelling strain [32]. Assuming isotropic swelling, this can be expressed by the following equation,
d ε i j s w = δ i j β sw 3 ds
where β sw is a swelling coefficient (1/Pa)
s = ( p g p w ) is the suction (Pa).
To simplify the relationship between swelling strain and suction, Nasir et al. [32] proposed a linear swelling strain with a constant swelling coefficient, β sw , for a bentonite-sand mixture with a relatively good fit to experimental swelling stress results.

3. Process Simulation and Enhanced Two-Phase Flow Analysis Study

3.1. Numerical Model Description

3.1.1. Overview of the Numerical Model

For the process simulation study, a 3D HM coupled multiphysics numerical model was built using COMSOL® to numerically solve the governing equations and the constitutive relations described in Section 2. Using the FEM, the model is used to simulate the simultaneous migration of gas and liquid (two-phase flow) in porous media, which are coupled to the mechanical behavior of the solid matrix.
For process testing and enhanced flow analysis study, the numerical model setup is based on laboratory experiments conducted by the BGS to simulate 1D gas flow through a saturated bentonite sample under constant volume boundary stress conditions [33]. As per the experiment, a confined cylindrical sample of near-saturated bentonite was injected on one side with helium gas with increasing gas pressures over a period of 120 days. The other side was left at a constant water backpressure throughout the duration of the experiment. Key phases of the experiment include the hydration phase (t = 7.3 days to 39 days) where the sample was left to saturate, the gas injection phase (t = 39 days to 71 days) where gas was continuously injected into the system, resulting in increasing gas pressures, and the gas shut-off (t = 71 days) where the injection pump was stopped, and gas pressures were allowed to dissipate naturally. The experiment was conducted under isothermal conditions at a temperature of 293.15 K. During the experiment, a number of parameters were measured, including the gas inflow and outflow, the porefluid pressure at defined porefluid arrays, and the total radial stresses at radial load cell arrays. The cylindrical specimen of MX-80 bentonite had a diameter of 60 mm and a length of 120 mm. The BGS provided the experimental data that were used in the process testing and enhanced flow analysis study [33].

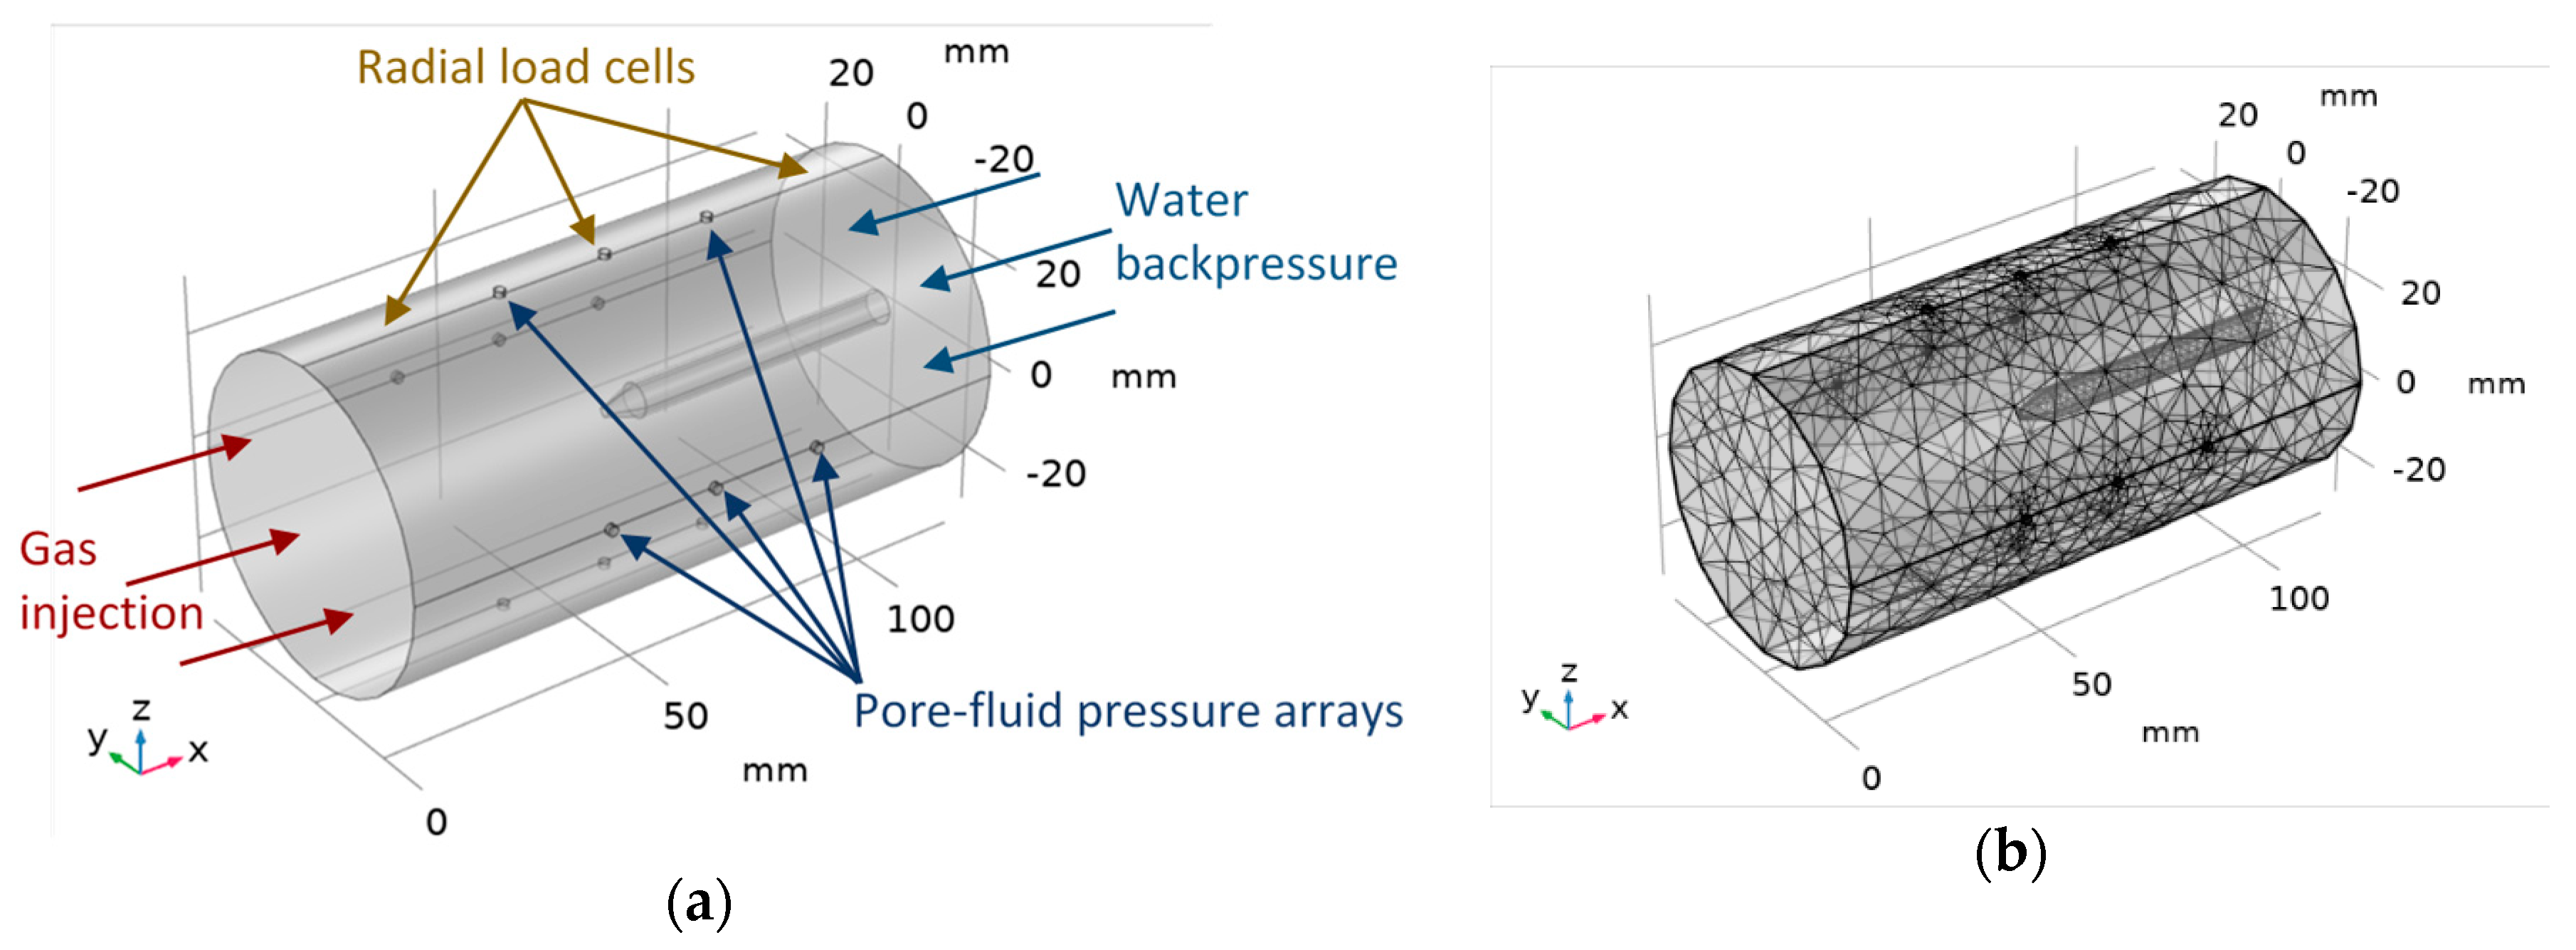
3.1.2. Model Geometry and Mesh

The model geometry and the finite element mesh are presented in Figure 1a,b, respectively. Although the experiment attempts to simulate 1D conditions, the actual conditions are truly 3D due to heterogeneity of the sample and the presence of a central injection rod inserted at the outlet face. This central injection rod is not used in this experiment but in subsequent ones to be simulated in another paper. Therefore, the FE mesh, as shown in Figure 1b, is 3D, consisting of approximately 11,000 elements.

3.1.3. Material Properties

Material properties for solid bentonite MX-80 soil matrix, helium gas, and water are provided in Table 1 and were adopted from Dagher et al. [11]. In the proposed numerical model, the expression for the density of gas, ρ g , and bulk modulus, K g , provided in Table 1, were derived from the ideal gas law, as described in Dagher et al. [11]. As the behavior of gases at high pressures deviate from that of an ideal gas, this presents an over-simplification. In light of this, future work will consider applying a correction factor to these expressions.

3.1.4. Initial Value Condition

The initial conditions at t = 0 across the domain are provided in Table 2. The initial conditions assume an initial pore gas pressure equal to atmospheric within the bentonite sample and a 96% degree of water saturation.

3.1.5. Boundary Conditions

The hydraulic and the mechanical boundary conditions (BC) for gas transport, water transport, and momentum transport are provided below.

Gas Conservation BCs

For gas transport, a no flow Neumann BC, p g x i = 0 , was set at the radial boundaries. Dirichlet BCs were set at a specified gas injection pressure, P inj , for the front-face boundary and atmospheric pressure, P a t m , at the back-face boundary.
For the concentration of gas in porewater, C g ,   H 2 O , the ideal gas law was assumed,
p g V = nRT
p g V = m g M RT
Re-arranging,
m g V = ρ g = p g M RT
where p g is the poregas pressure (Pa).
Assuming instantaneous dissolution, the concentration of gas in the porewater can be calculated by multiplying Equation (13) by Henry’s coefficient, H, and the portion of water in a unit volume, nS w
C g ,   H 2 O = ρ g H ( nS w )
where C g ,   H 2 O is the concentration of gas in water (kg gas m−3 water).

Water Conservation BCs

For water transport, Dirichlet BCs were set at a value equal to the water backpressure at the back-face boundary as well as at the radial porefluid arrays. This is a change from the BCs applied at the radial porefluid arrays in the previous study by the authors [11], which assumed no water flow through the radial porefluid arrays. This change in radial porefluid BC allowed for increased hydration during the hydration period, which ran from t = 7.3 days to 39 days and was more representative of the experiment [11,33]. A no flow Neumann BC, p w x i = 0 , was set at the front face boundary and along the radial boundaries.

Momentum Conservation BCs

For the momentum conservation equation, a roller constraint was applied along the upper, the lower, and the radial boundaries to represent a condition whereby the boundary was free to move in the tangential direction but was fixed in the normal direction, simulating an overall constant volume condition, as per the experimental set-up.
The gas injection pressure and the water backpressure Dirichlet BCs were imported from the experimental data provided by BGS and were calculated from the previously described theory plotted in Figure 2a, while the concentration of dissolved gas BCs was plotted in Figure 2b.

3.2. Modelling Approach

In this study, simulation of a number of study scenarios was performed with increasing model complexity in order to gain an understanding of the contribution of heterogeneity, the Klinkenberg “slip flow” effect, and the inclusion of a linear swelling strain on two-phase flow. The results of each simulation were compared to the experimental results and the effect of each on flow behavior analyzed [33]. Table 3 summarizes the simulations run and the values of key model parameters. It should be noted that these model parameters were selected based on calibrating the model to best match the experimental results while maintaining numerical stability and convergence.
Additionally, a special study, S0, utilizes the simplified single-phase flow model that was used in the verification of the numerical model [25]. This scenario was included to assess the difference in increasing model complexity from a single-phase model to a two-phase flow model. This model is identical to that of the base case, S1, but is simplified to be consistent with the verification study through the following assumptions:
  • immobile liquid phase
  • no dissolution of gas into and no diffusion gas through the porewater
  • constant gas permeability
  • constant gas density
  • constant degree of saturation of water
  • role of suction ignored
  • role of gravity ignored
  • isothermal process
  • constant volume boundary condition
For this process simulation study, the simplified single-phase flow model applies the same material properties used in the verification study [25] but now applies boundary conditions and initial conditions that were described above. As per the assumptions, the material properties for the parameters used for scenario S0 remain constant through the model run and are presented in Table 4. The van Genuchten equations for the SWCC and the AEV are provided in the authors’ original paper [11].

3.3. Implementation of Enhanced Mechanisms for Two-Phase Flow

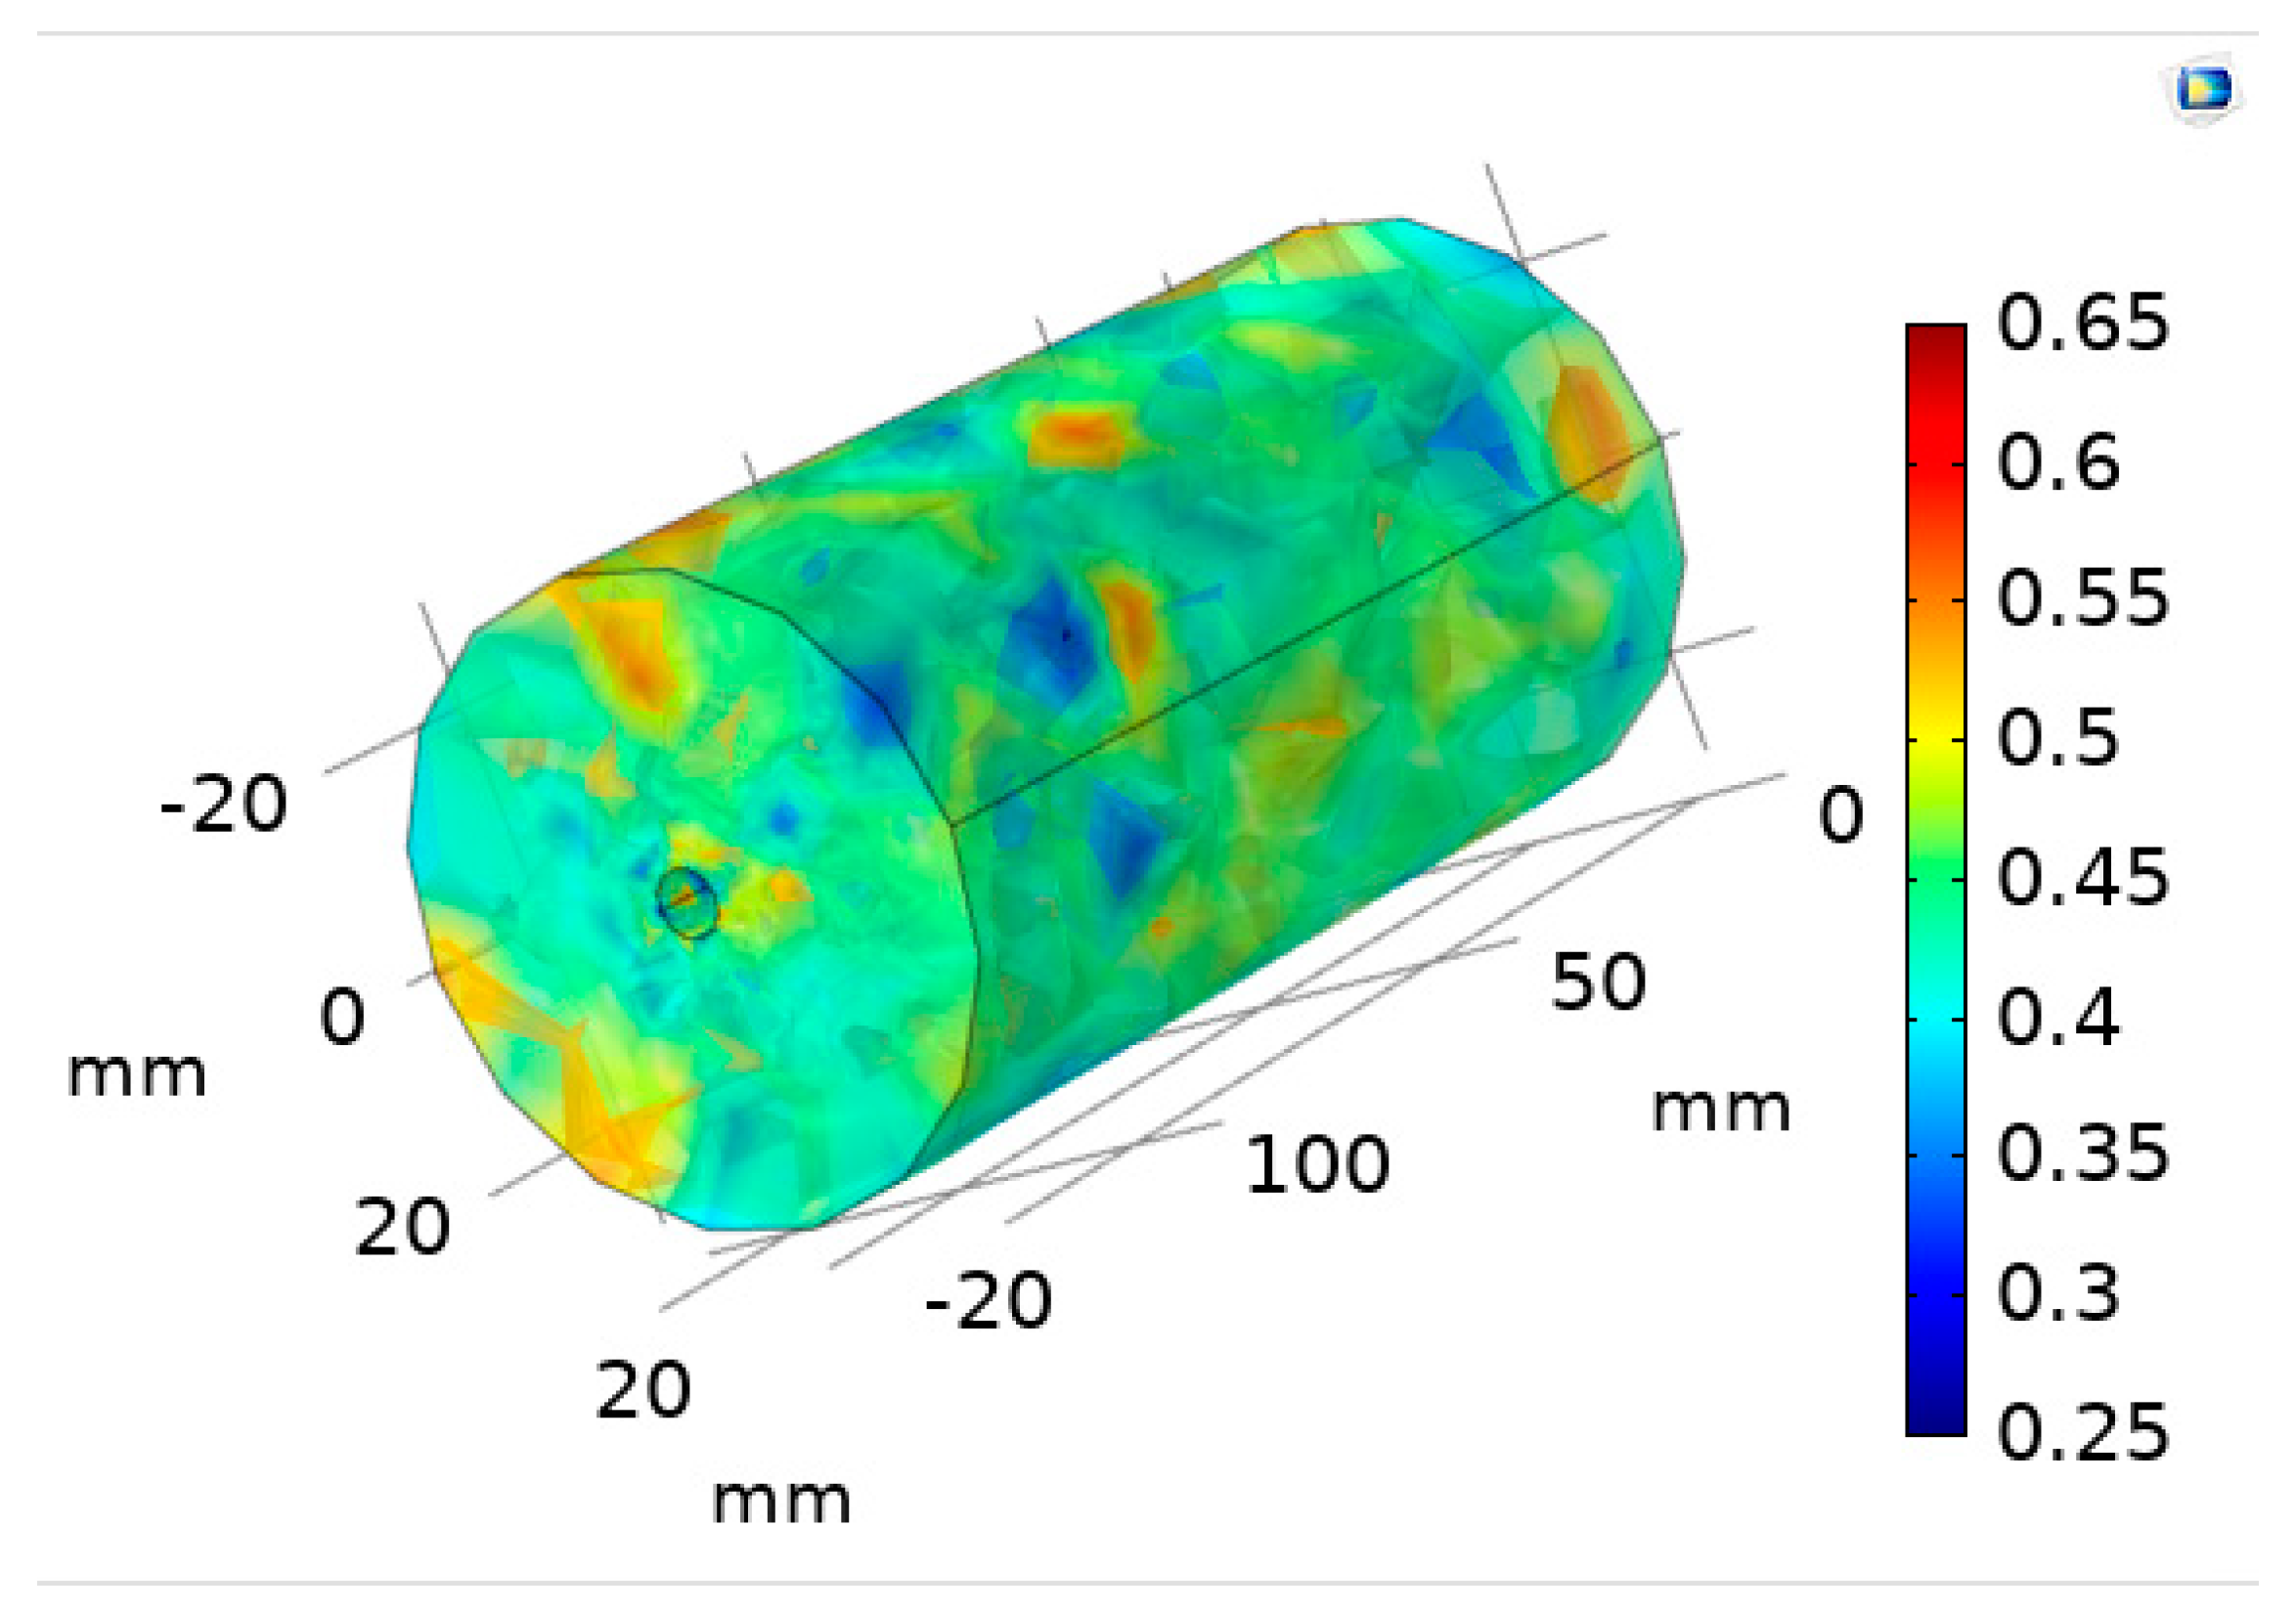
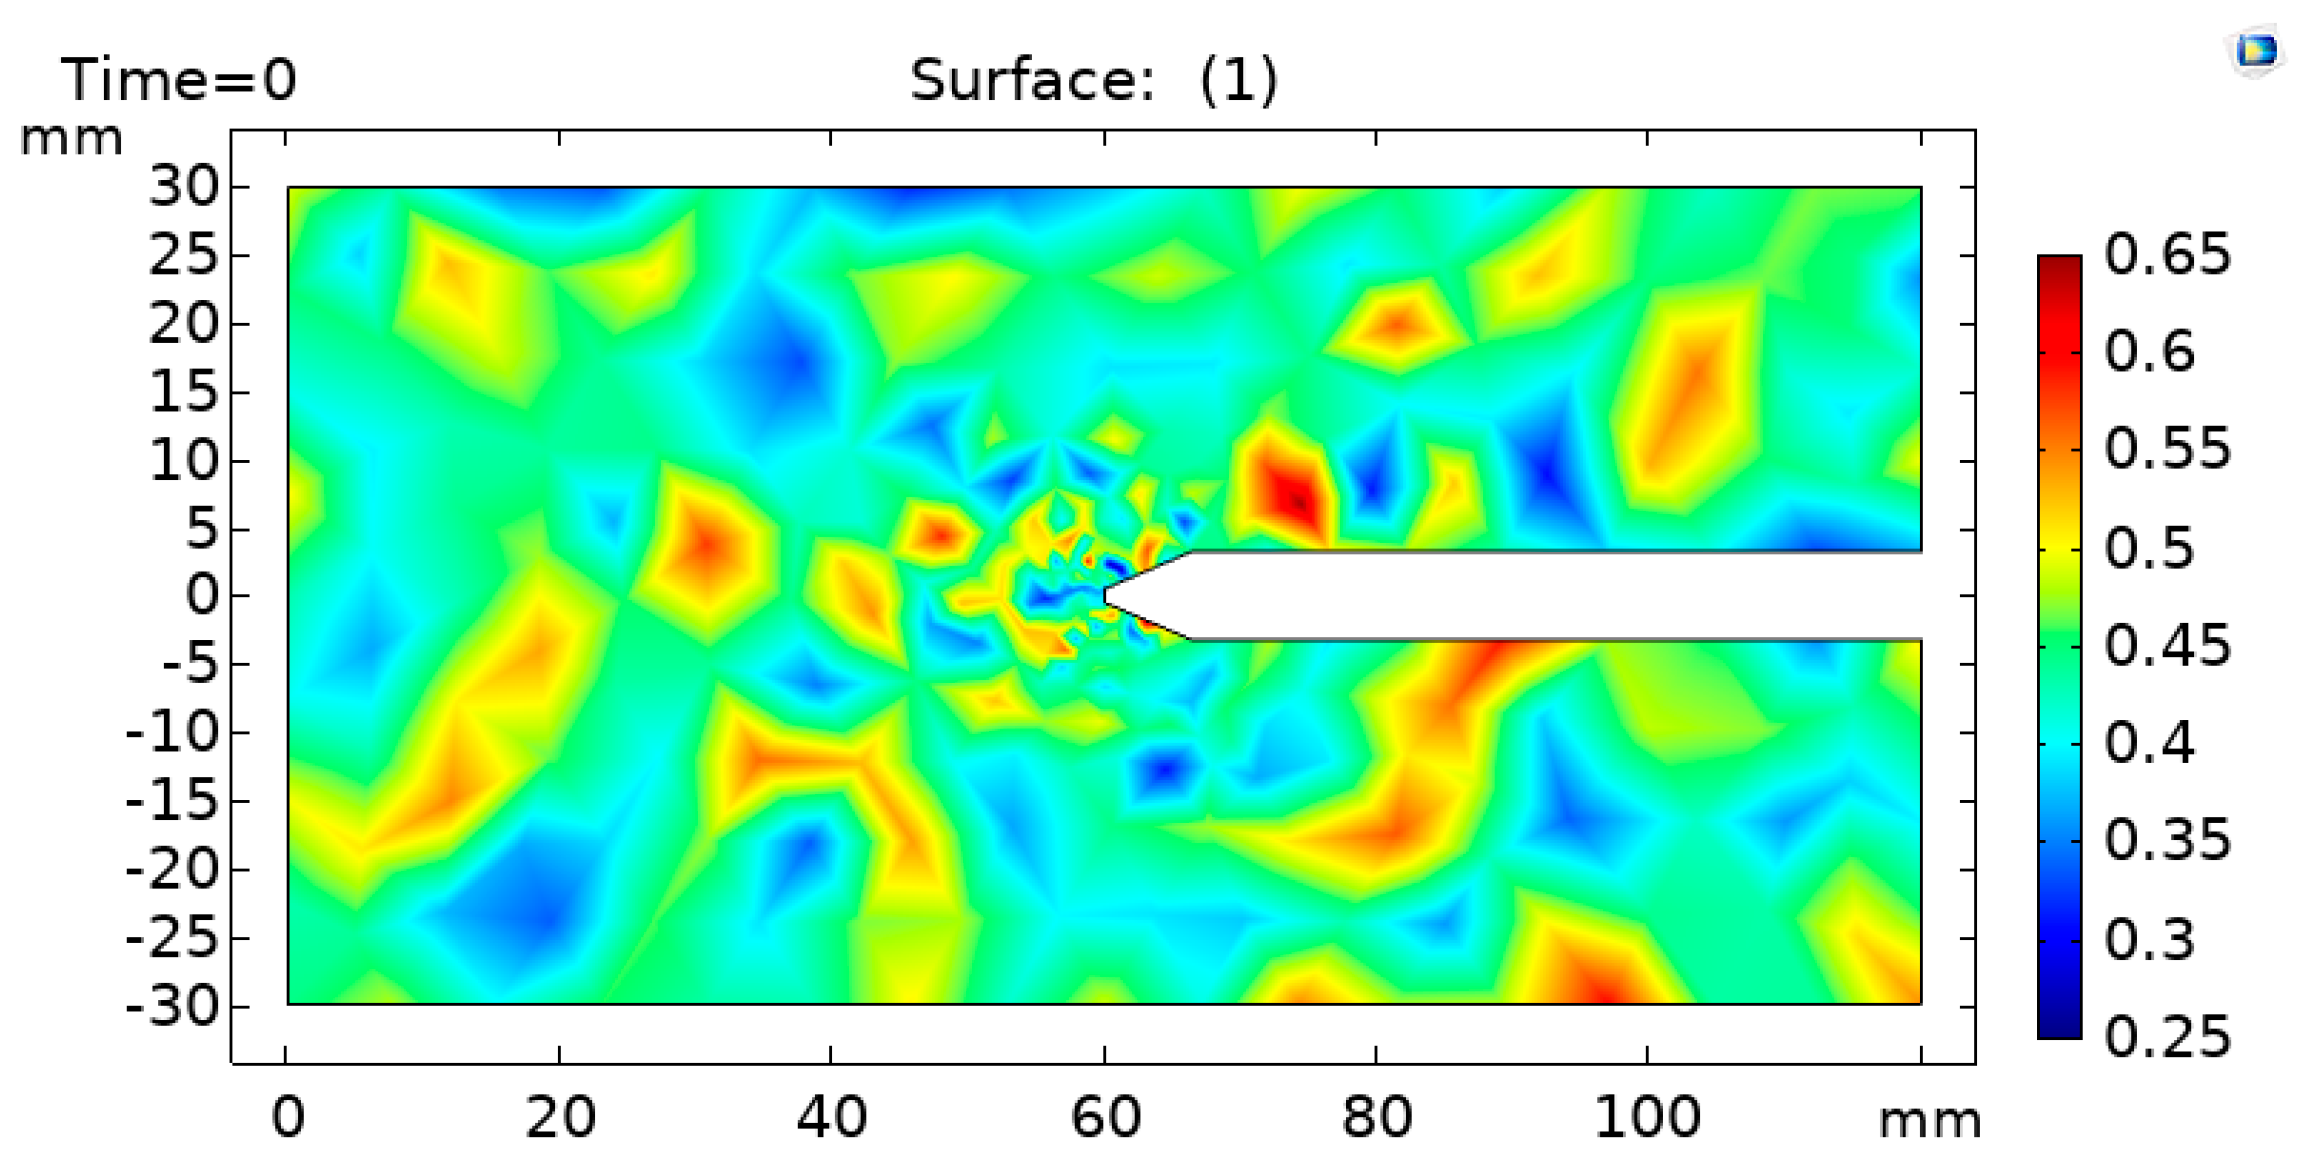
3.3.1. Introduction of Heterogeneity

Heterogeneity was introduced into the simulated sample by spatially applying a random normal distribution to the initial porosity material property with a mean porosity set at the experimentally determined value of 0.44 and applying a standard deviation of 0.06. There was no spatial correlation in heterogeneity intended with this approach. The application of this method to generate heterogeneity is not based on any experimental literature and was applied in this study in an attempt to trigger the generation of preferential flow pathways by the given models. A standard deviation of 0.06 was selected, as it provided the largest degree of heterogeneity while maintaining model stability. The initial porosity distribution within the bentonite sample is depicted in Figure 3, while Figure 4 provides the XZ-plane cross section of the initial porosity distribution.

3.3.2. Klinkenberg “Slip Flow” Effect–Intrinsic Permeability of Gas

A number of studies have attempted to empirically estimate the Klinkenberg slip factor [35,36] and have proposed the following empirical equation for the slip factor as a function of the intrinsic permeability of water,
b ke = 0.251 k w 0.36
Based on the experimental intrinsic permeability of water in this study, k w (3.4 × 10⁻²¹ m2), Figure 5 shows the relationship between poregas pressure and intrinsic permeability using a Klinkenberg slip factor based on Equations (7) and (8) with a constant of, c = 1.0 × 10⁸ and c = 1.0 × 10⁴, as well as using Equation (15) to empirically solve for the slip factor. As depicted by the figure, the intrinsic permeability of the gas increases significantly with a decrease in poregas pressure, and as poregas pressures increase, the intrinsic permeability of the gas approaches that of water. As there is little information in literature regarding the slip factor for helium in bentonite clays, in order to assess whether the Klinkenberg effect could provide a significant role in matching key features of the experimental results, a constant, c = 1.0 × 10⁸, was used for the Klinkenberg effect. A value of c = 1.0 × 10⁴, which matches that of the empirical equation, would not provide the significant change in permeability needed to obtain complete breakthrough into the sample.

3.3.3. Coefficient of Swelling Strain

This study applies a swelling coefficient β sw (1/Pa) of 1 × 10⁻⁹. This coefficient was initially informed by that obtained by Nasir et al. [32] and calibration to best match the experimental data while maintaining numerical stability and convergence.

3.4. Results and Discussion

In this section, the compression-positive sign convention is used for stress components and pressures.
The results of the 1D flow process simulation and enhanced two-phase flow analysis study are presented below. For each study scenario, the following results are discussed:
  • poregas pressure evolution through the specimen
  • gas inflow/outflow
  • gas storage in the system
  • total stress evolution
The experimental results provided for comparison were discussed in Daniels and Harrington [33] and in Dagher et al. [11] and are not discussed in detail in this paper. This paper focuses on the contribution of each enhanced flow mechanism to flow behavior.

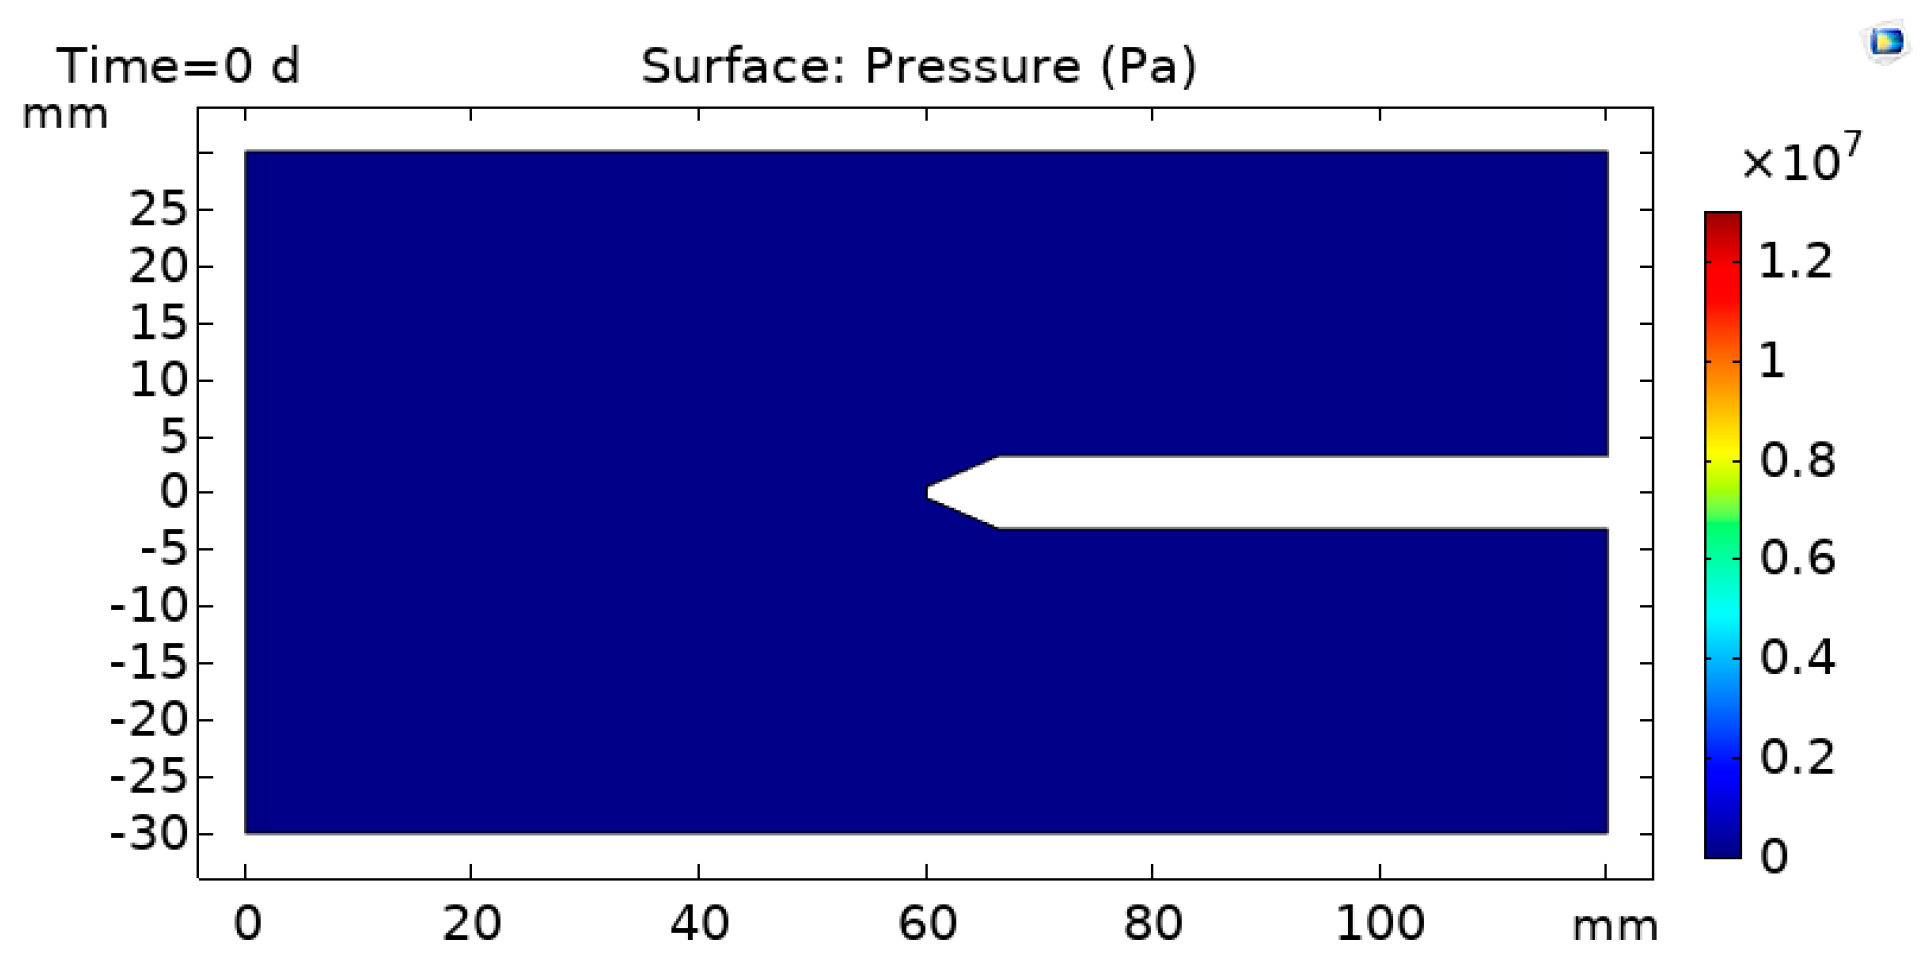
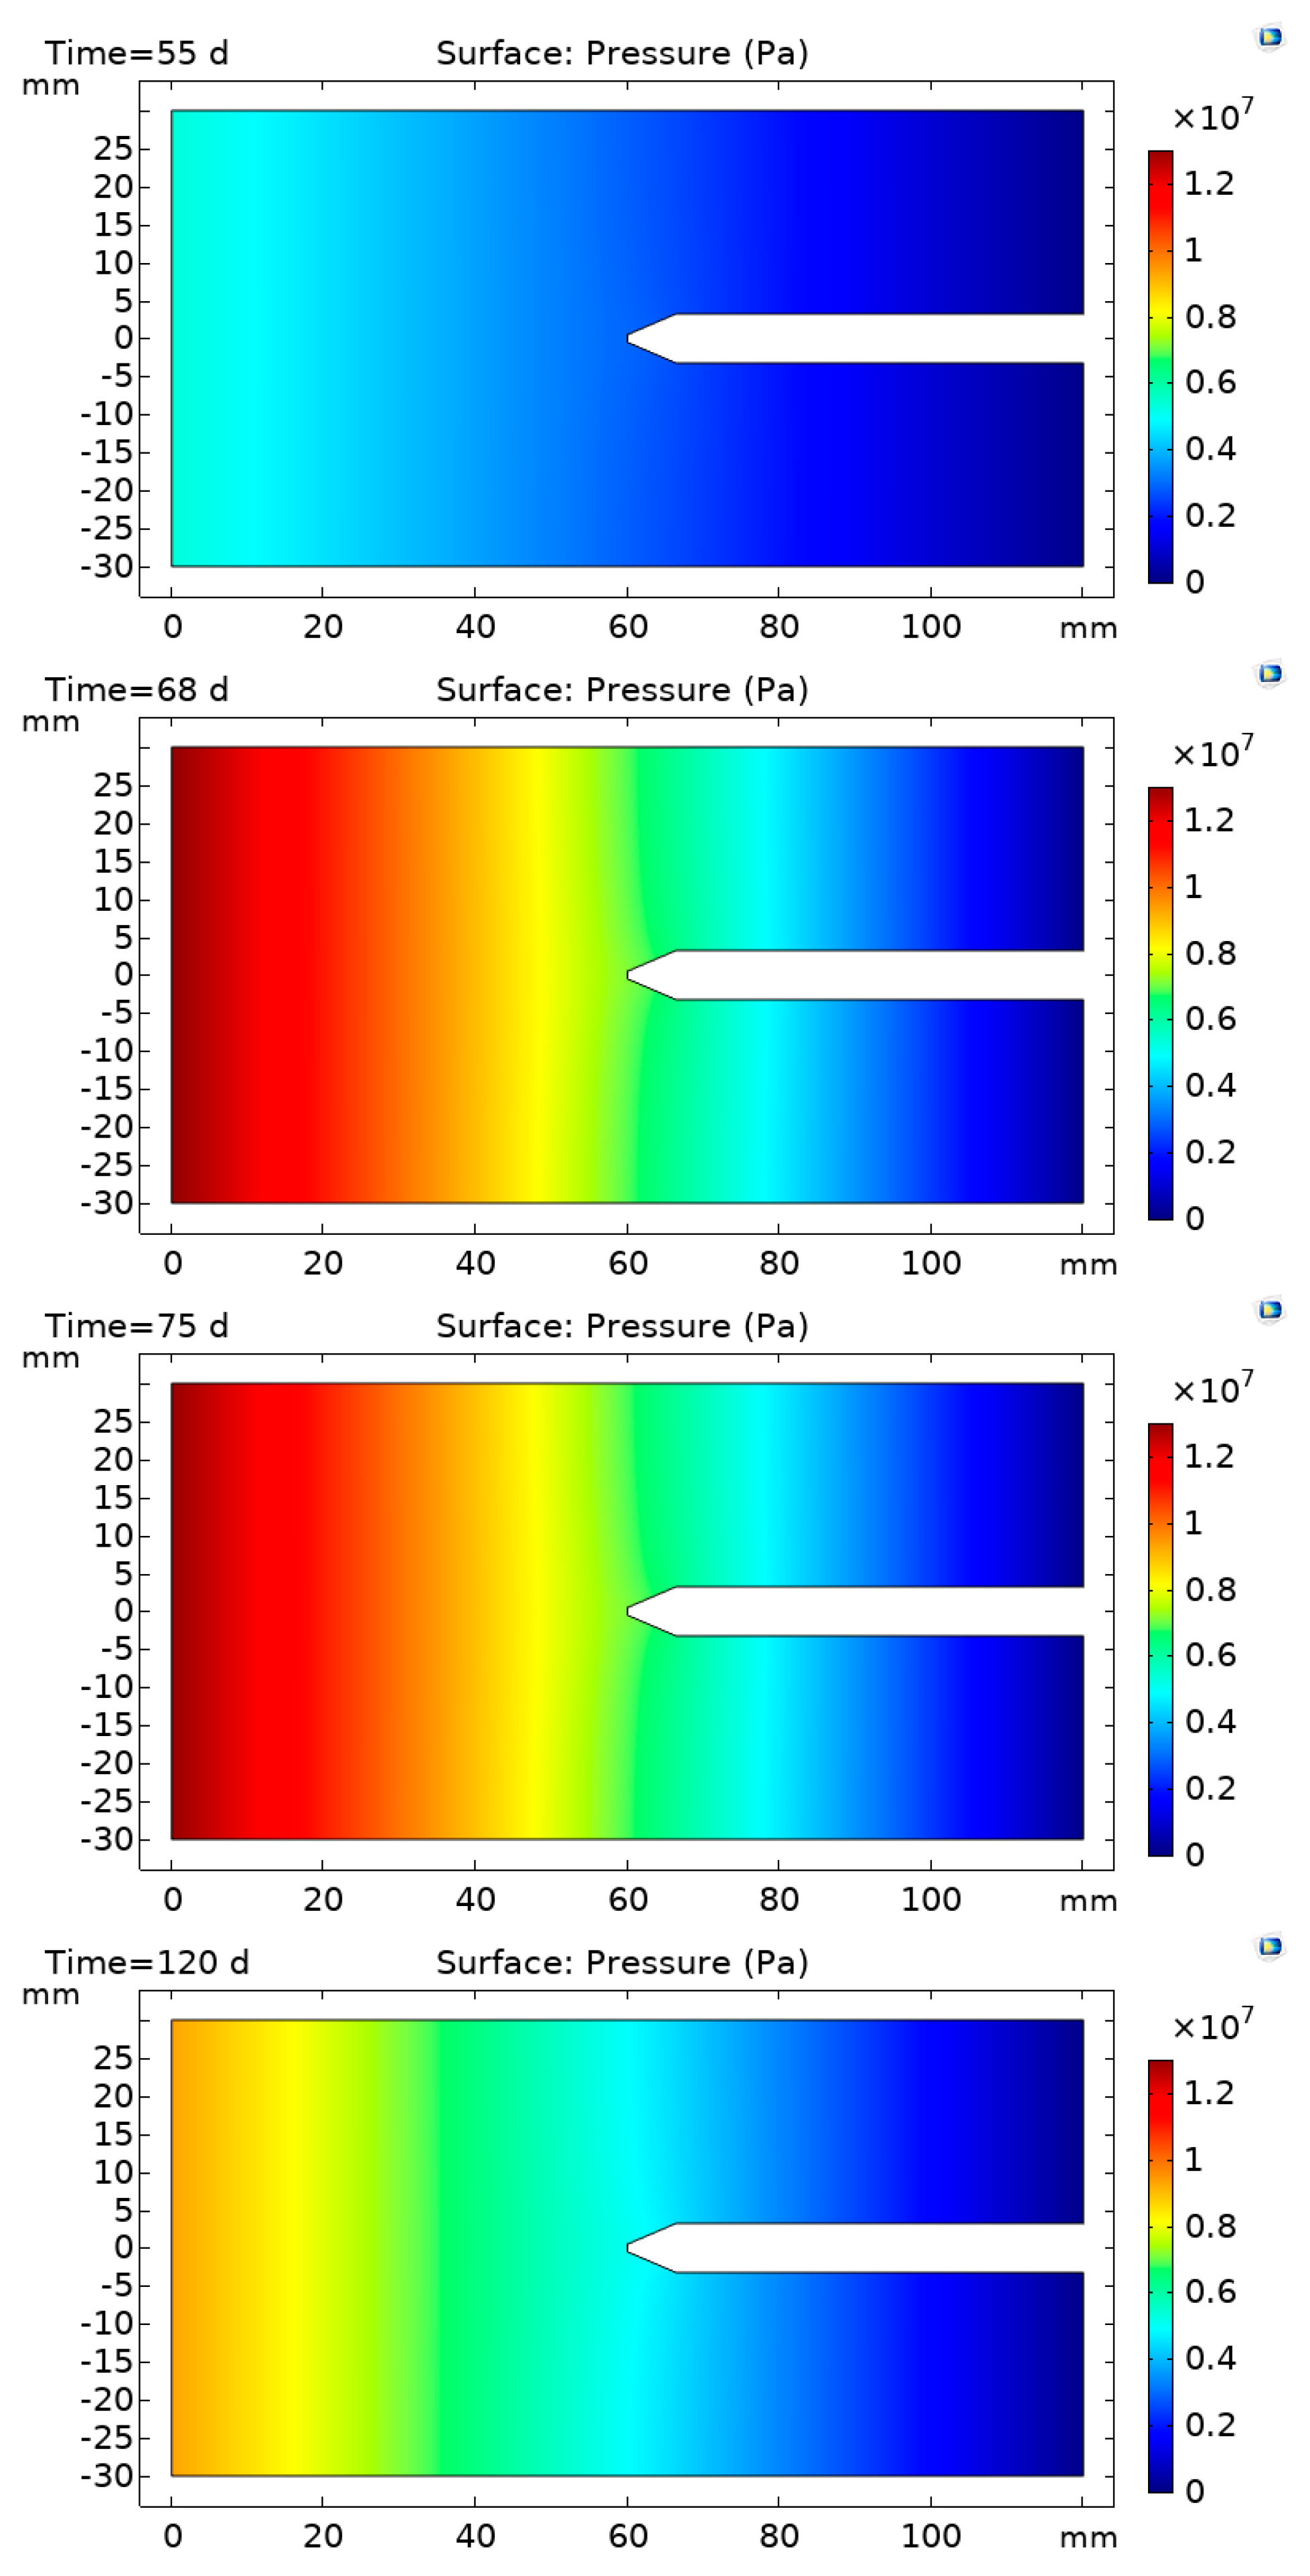
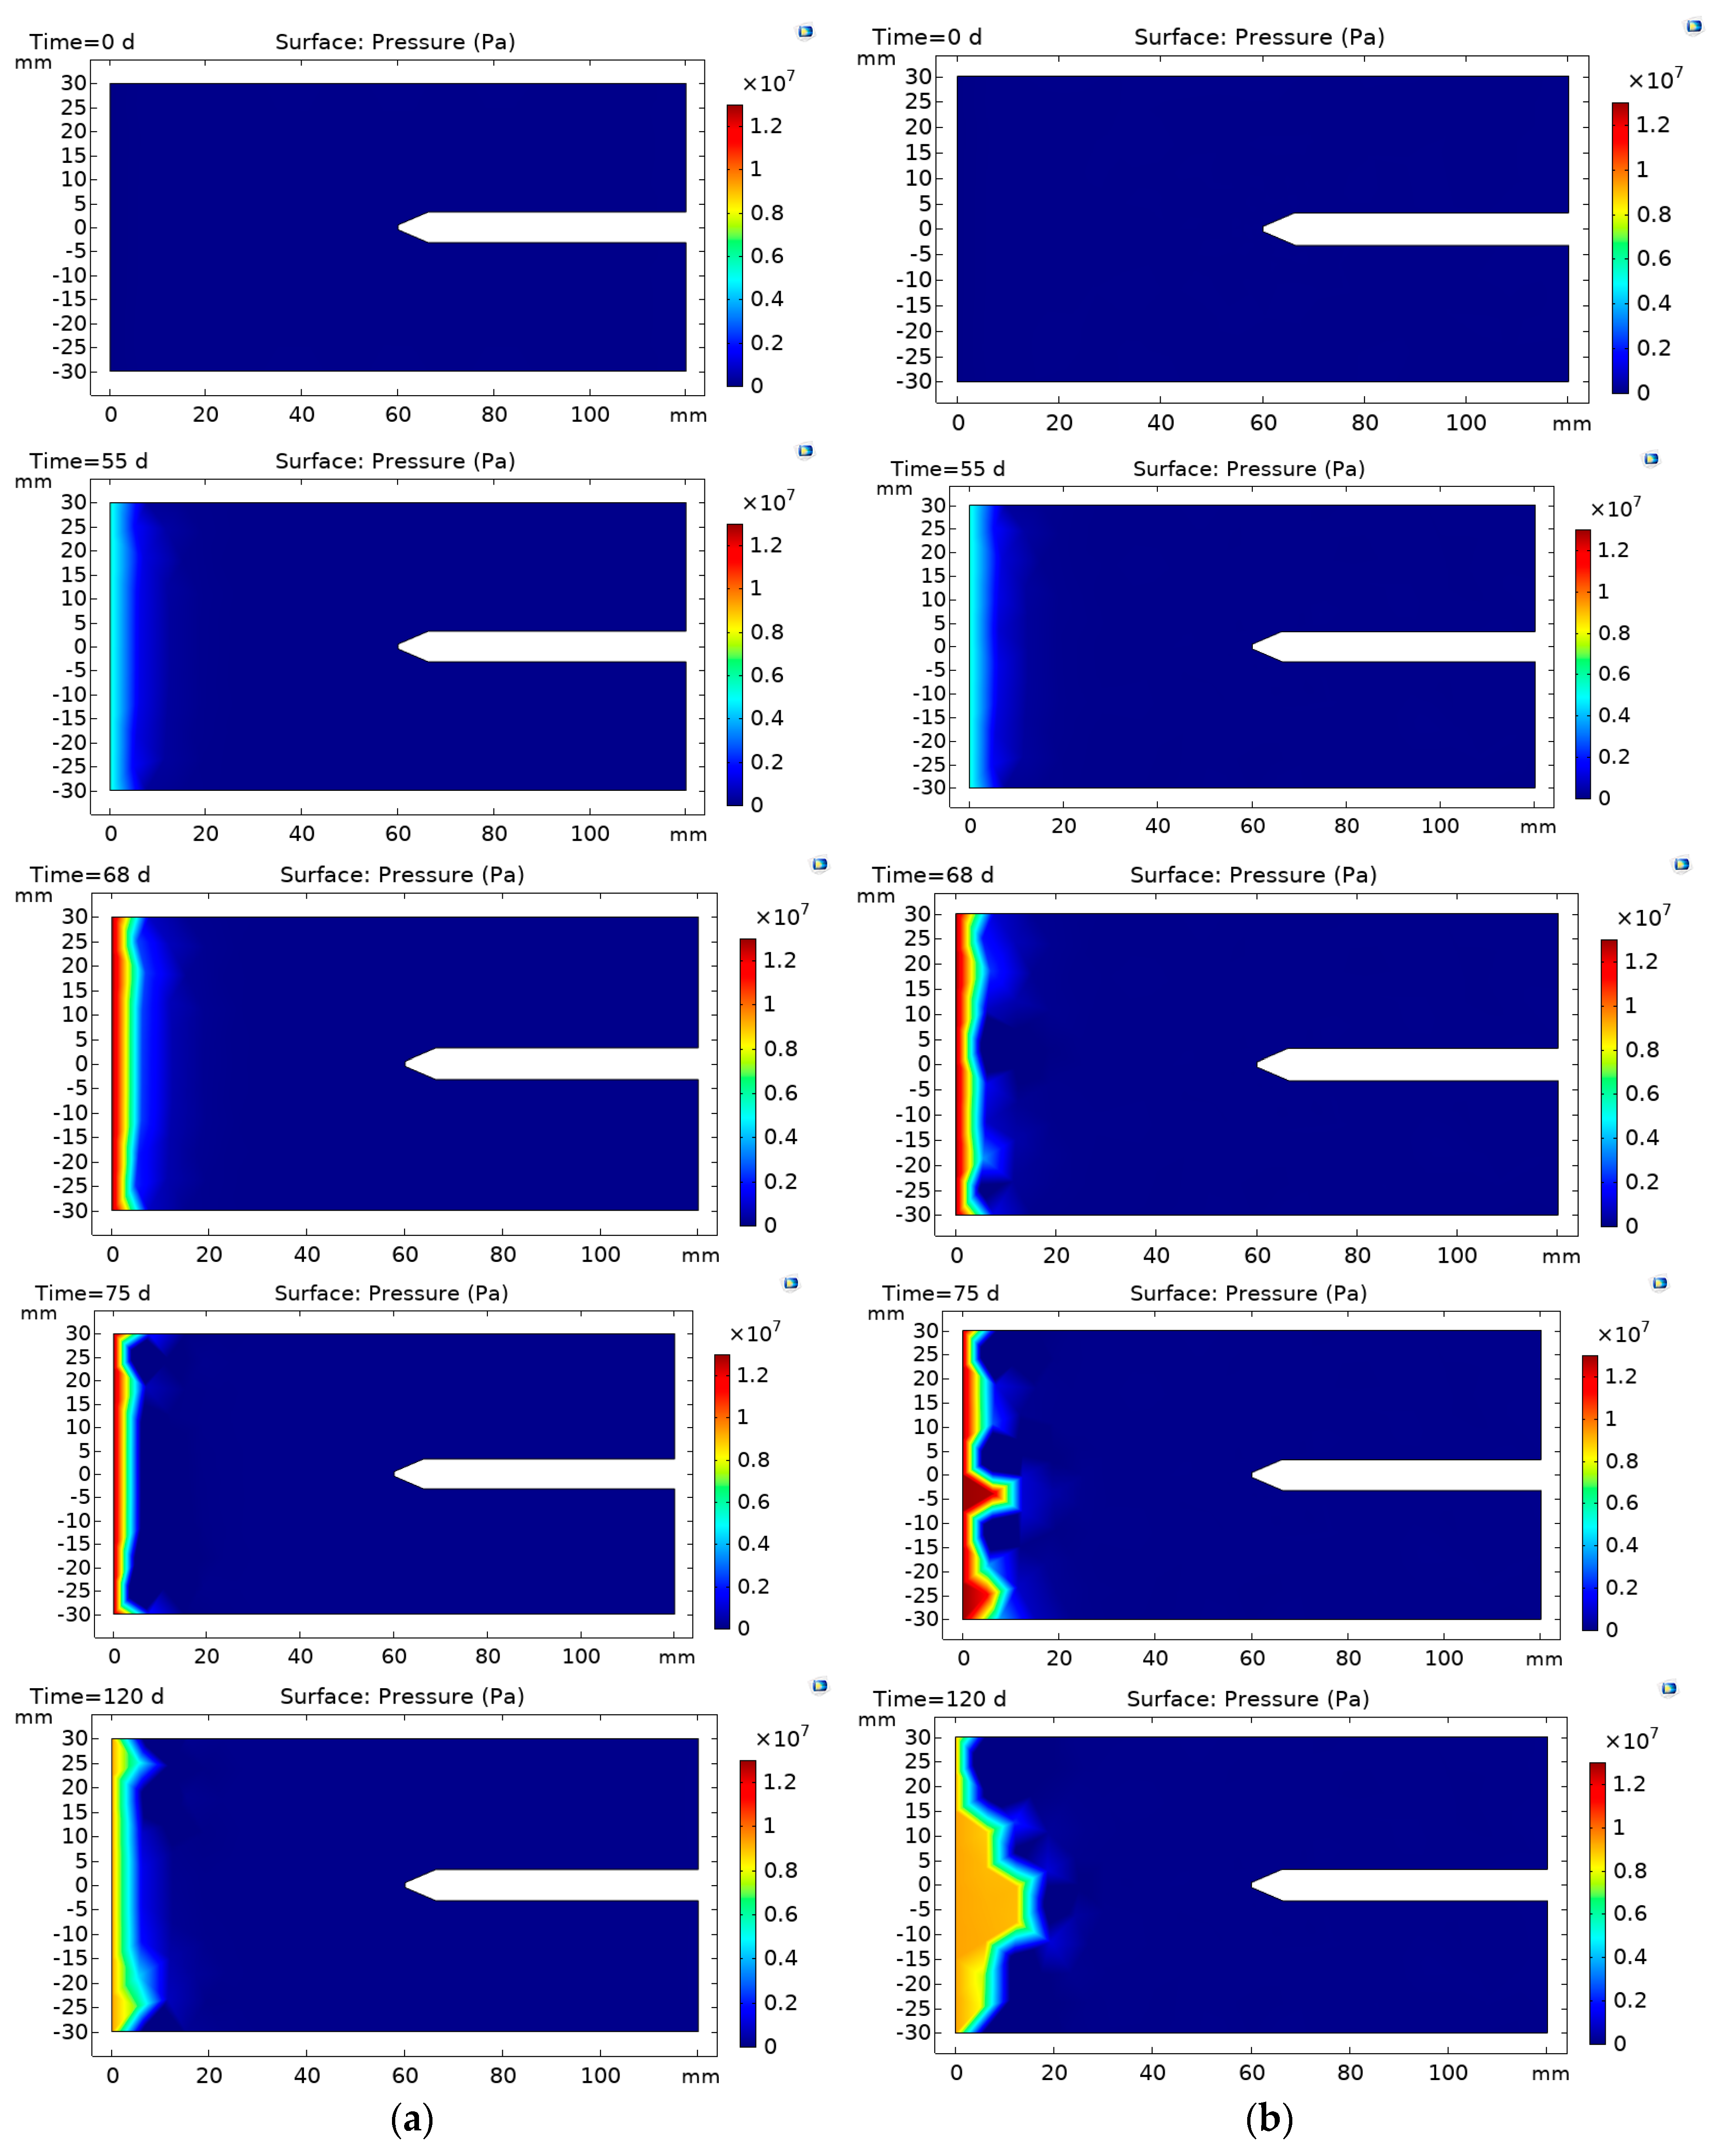
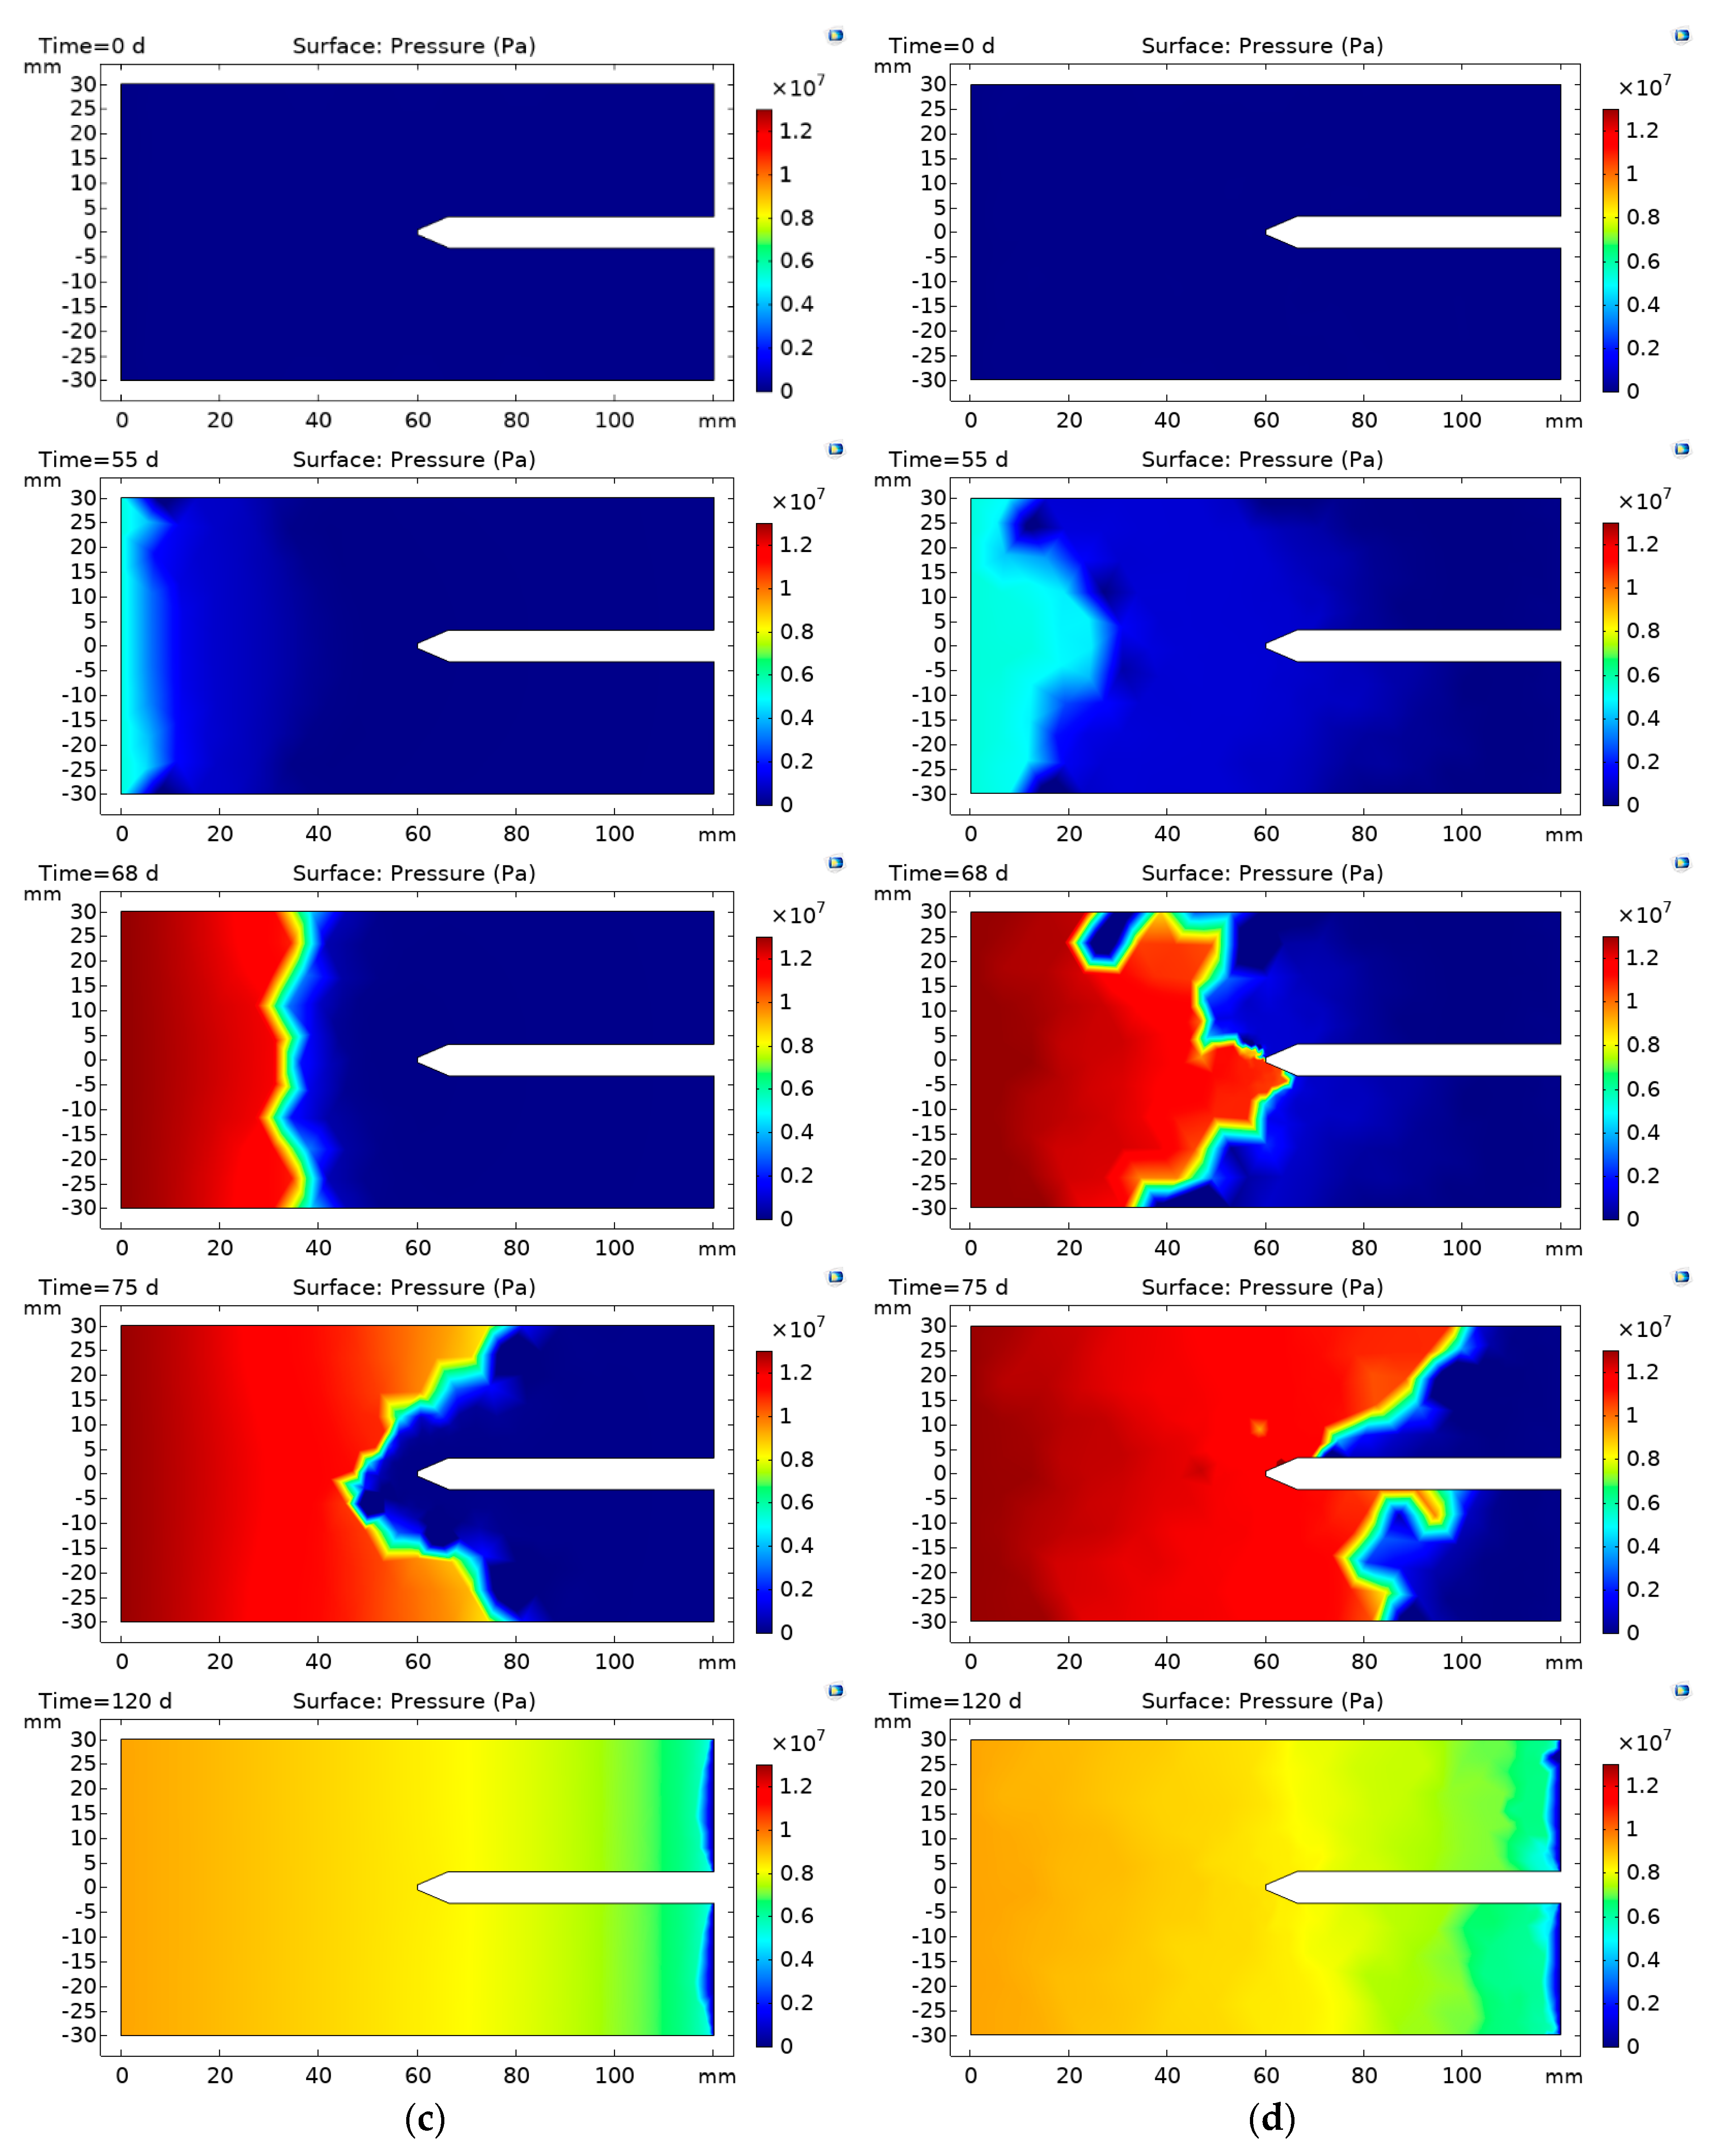
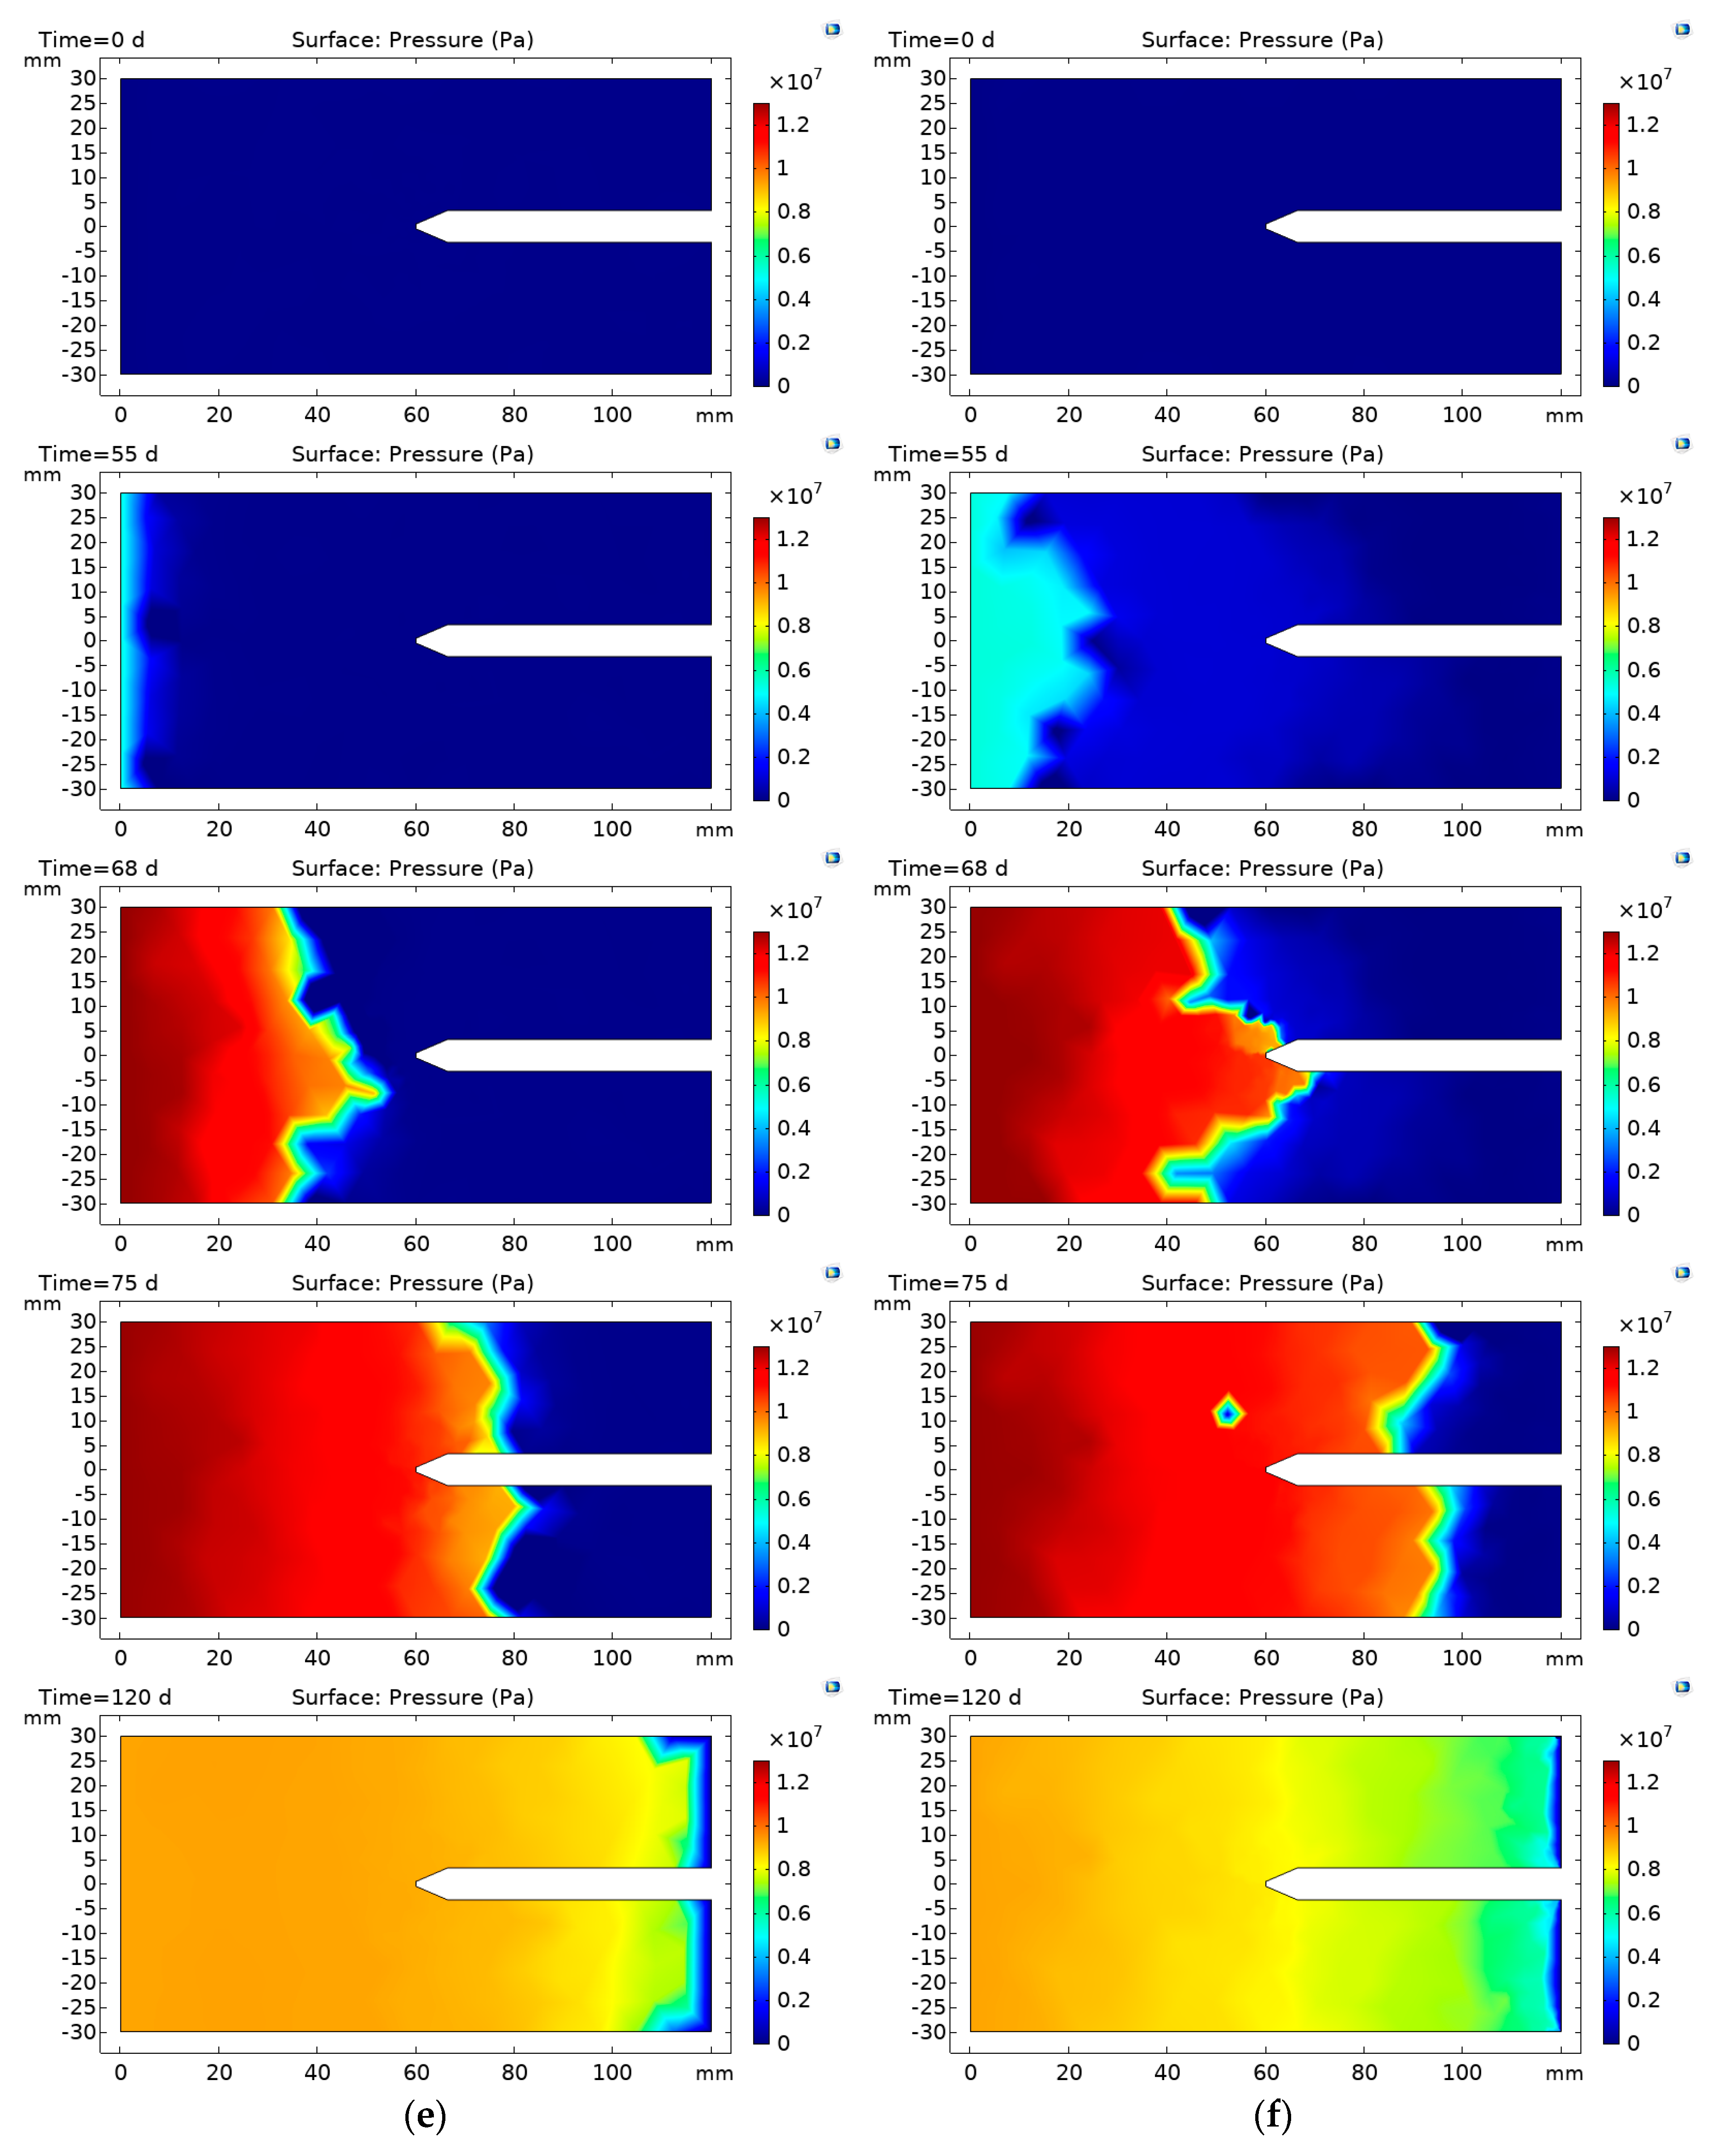
3.4.1. Poregas Pressure Evolution through the Specimen

Poregas pressure profiles over time for the central cross section (XZ-plane) are depicted in Figure 6 for S0 and Figure 7a–g for S1 to S6. For the single-phase flow case depicted by Figure 6, the poregas pressure migration results follow a uniform gradient. This differs from the transient pore-pressure results provided in the companion paper [25], which demonstrate a non-linear kinked shape following a sudden increase in injection pressure until steady-state is reached. However, in the companion paper, at these same poregas pressures (10 MPa), steady-state is reached in approximately 1.5 h. In this study, our timescale is in days. Therefore, it is expected that transient response is very fast, and equilibrium is reached quickly.
For the base case scenario S1 representing the linear elastic advective–diffusive visco-capillary two-phase flow model represented in Figure 7a, the results match those first published in Dagher et al. [11], whereby once the AEV is exceeded (at 69 days), there is gas breakthrough into the sample followed by a slow moving uniform gas flow through the specimen. The advective poregas front only travels roughly 5% through the sample.
Results of S2 are provided by Figure 7b and show that, once heterogeneity is introduced, the poregas front travels slightly further than the base case and is no longer uniform with the formation of small gas fingers.
Figure 7c shows the results of S3 once the Klinkenberg “slip flow” effect has been introduced. With a fairly large coefficient of the Klinkenberg effect of 1 × 10⁸, significantly increased gas migration into the sample and complete gas breakthrough are experienced. Up to 68 days, a relatively uniform gas front advances into the sample; however, as the front approaches the central rod, its shape becomes concave. As poregas moves forward, there is increased resistance to gas migration as a result of increased porewater pressure buildup around the central rod. This results in a lag in the poregas migration front, which is more pronounced closer to the center of the specimen. Once past the central rod, the poregas front returns to uniformity. It should be noted that, with the introduction of slip flow, there is some migration of poregas at low gas injection pressures; however, the predominant breakthrough of gas into the sample occurs once the AEV has been reached. One notable observation in the evolution of poregas migration is that the Klinkenberg effect tends to saturate the gas in the bentonite specimen and does not aid in the formation of distinct preferential flow pathways.
The results of S4, which introduce both the Klinkenberg effect and heterogeneity, are presented in Figure 7d. Characteristics of the results for both S2 and S3 can be seen, whereby the introduction of heterogeneity provides the formation of small fingers with the poregas now traveling quickly through the specimen. In fact, with the inclusion of heterogeneity, the poregas front migrates further relative to S3. One particular item to note is that, even with increased flow through the system relative to S2, the size of the fingers remains small and subtle, not large and distinct as the authors originally anticipated. Any fingers that do form eventually shrink and disappear. This may be due to a number of factors that could be physical, such as the presence of suction and diffusion, which aid in impeding the fingering capacity, or numerical and related to the method applied to introducing heterogeneity within the sample and to the mesh size.
In order to test whether Klinkenberg slip flow plays a role in mitigating the formation of gas fingers, the model is run using a much higher initial permeability of 5 × 10⁻¹⁹ m2 compared to that provided experimentally of 3.4 × 10⁻²¹ m2. These results are provided for S5 in Figure 7e. The results do not show an increase in the number or the extent of gas fingers in comparison to S4, thereby demonstrating that the Klinkenberg effect may not play a large role in stabilizing the formation of gas fingers.
Finally, the effect of introducing a linear swelling strain is provided by S6 as depicted in Figure 7f. In comparison to S4, the presence of swelling does not result in a noticeable difference in the time it takes for the poregas migration front to travel through the sample. However, once gas shut-off occurs (at day 71), the presence of swelling in S6 appears to stabilize or reduce the effect of fingering in comparison to S4. Additionally, at day 75, an odd point of low gas pressure is exhibited. This is not a numerical figment but a result of fingering that occurs around a spot of low permeability and corresponds to that same point of low permeability presented in Figure 4.

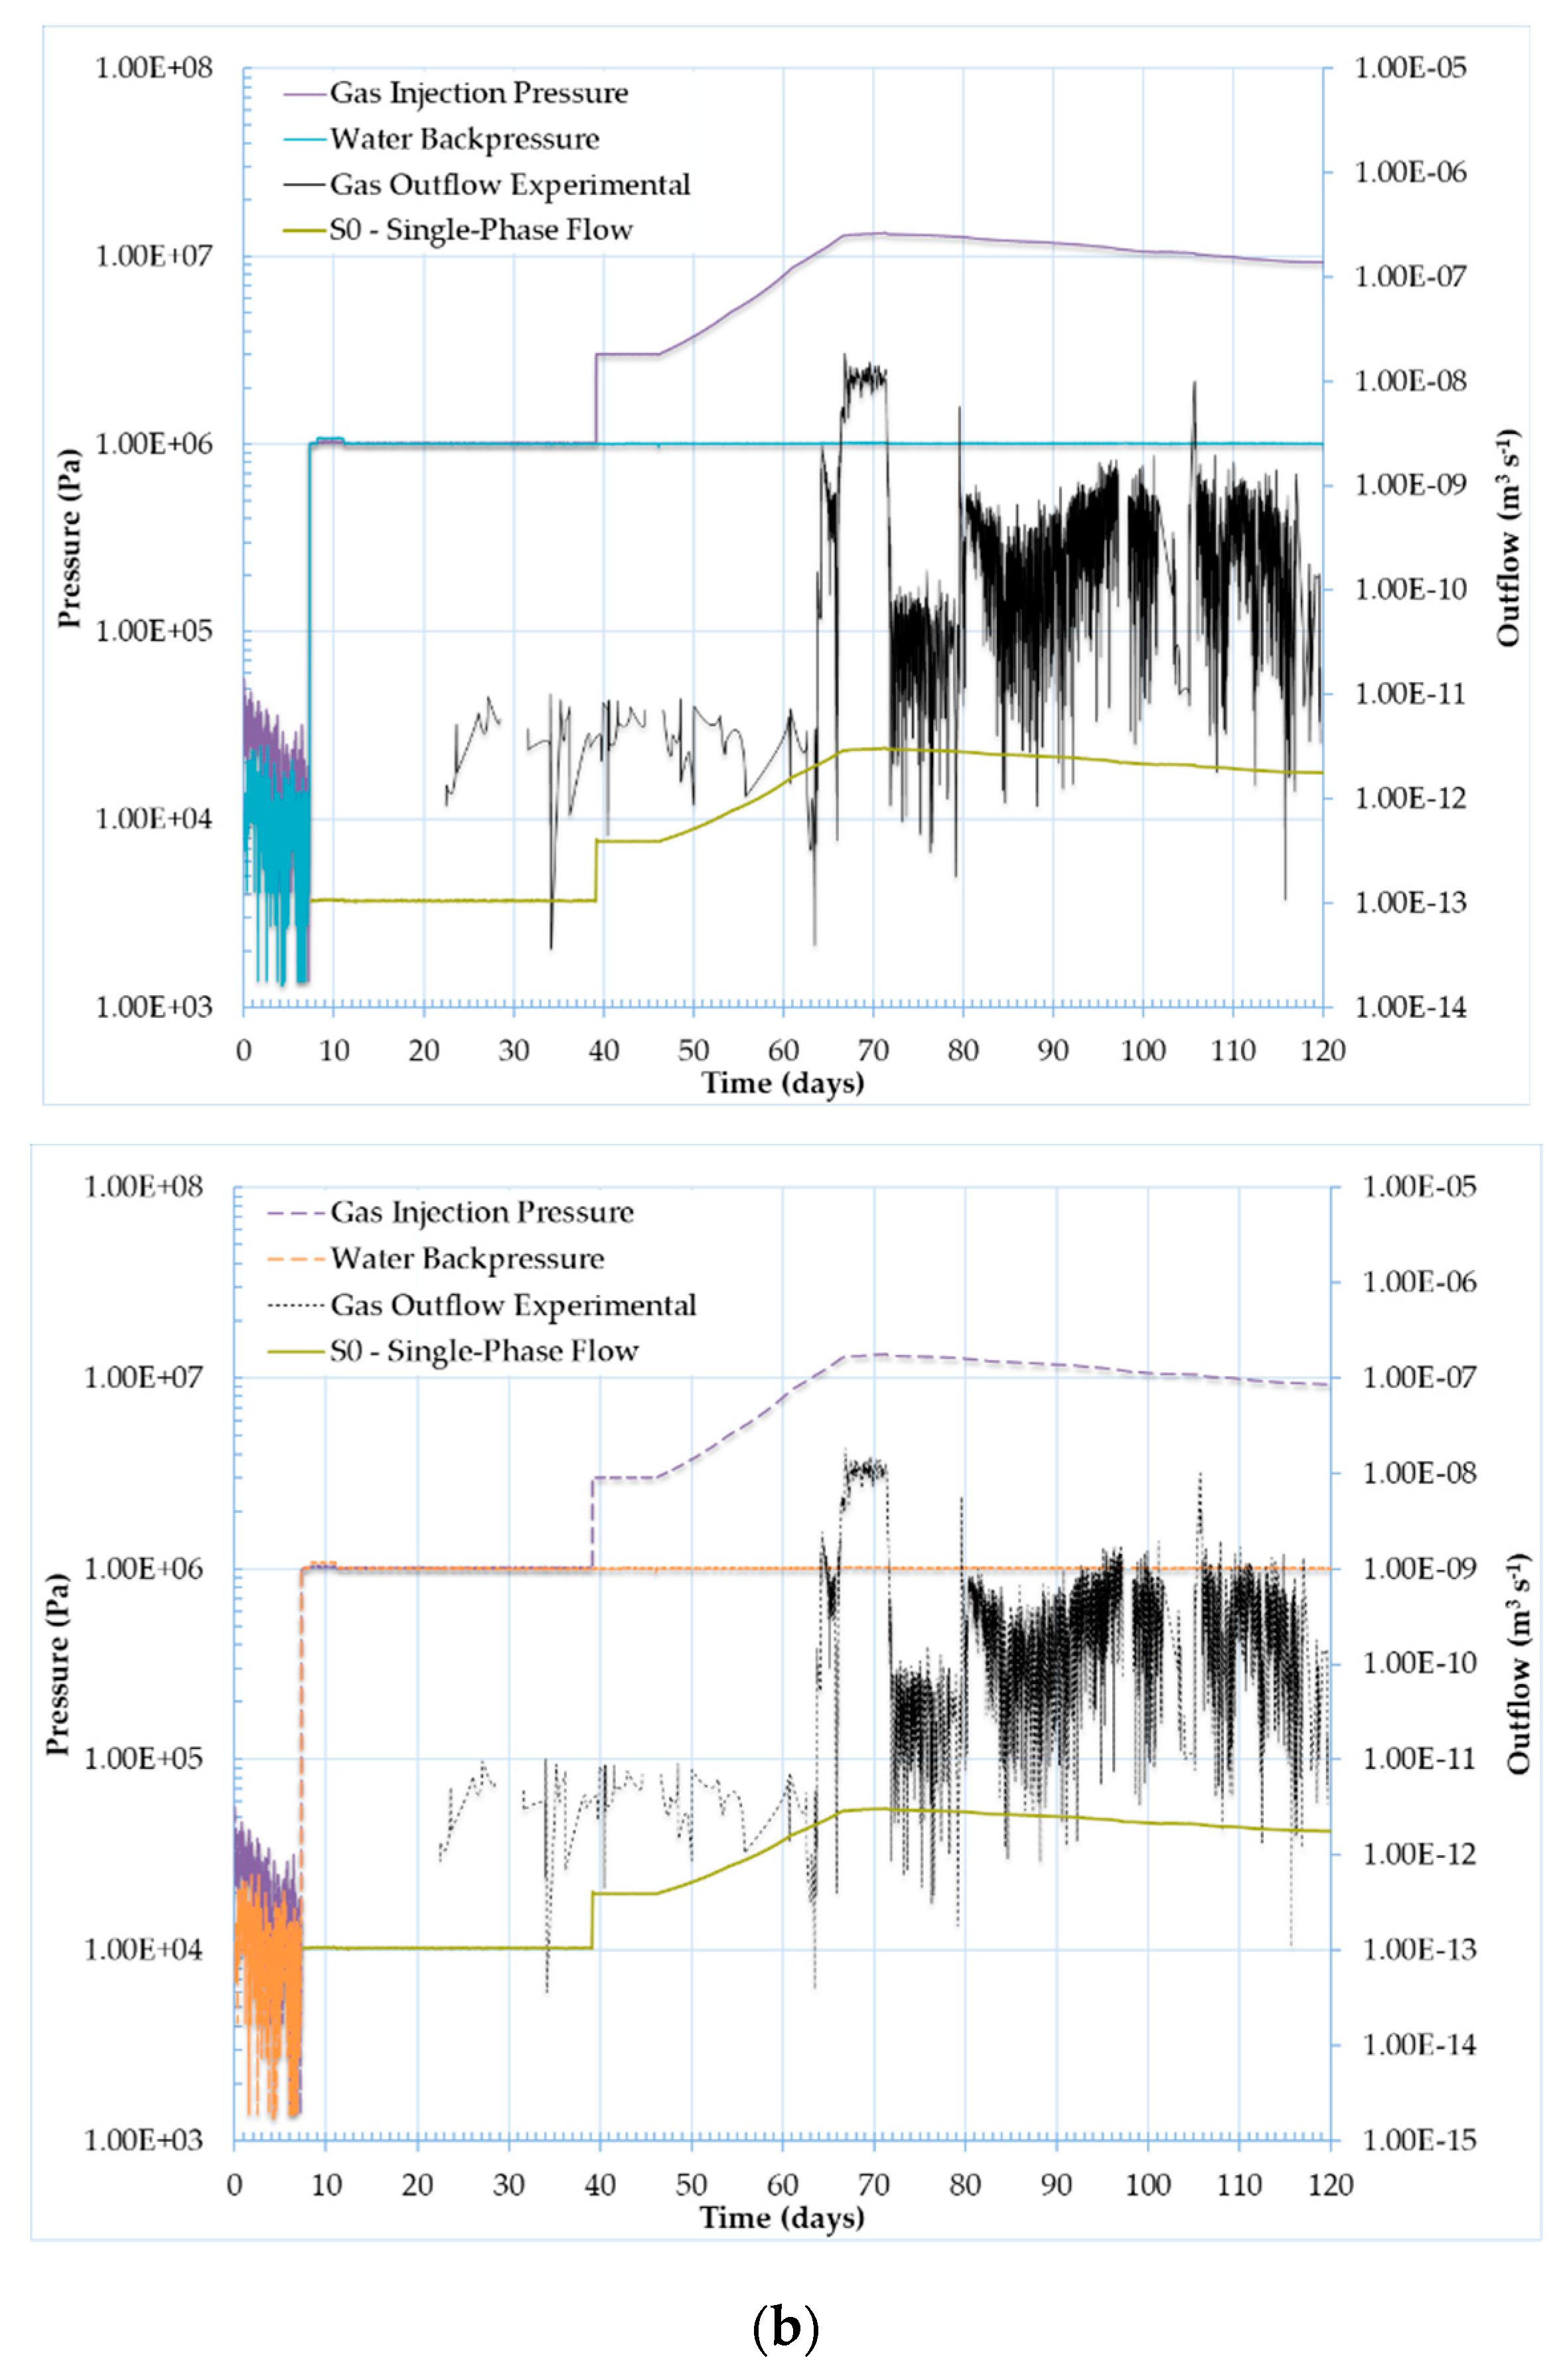
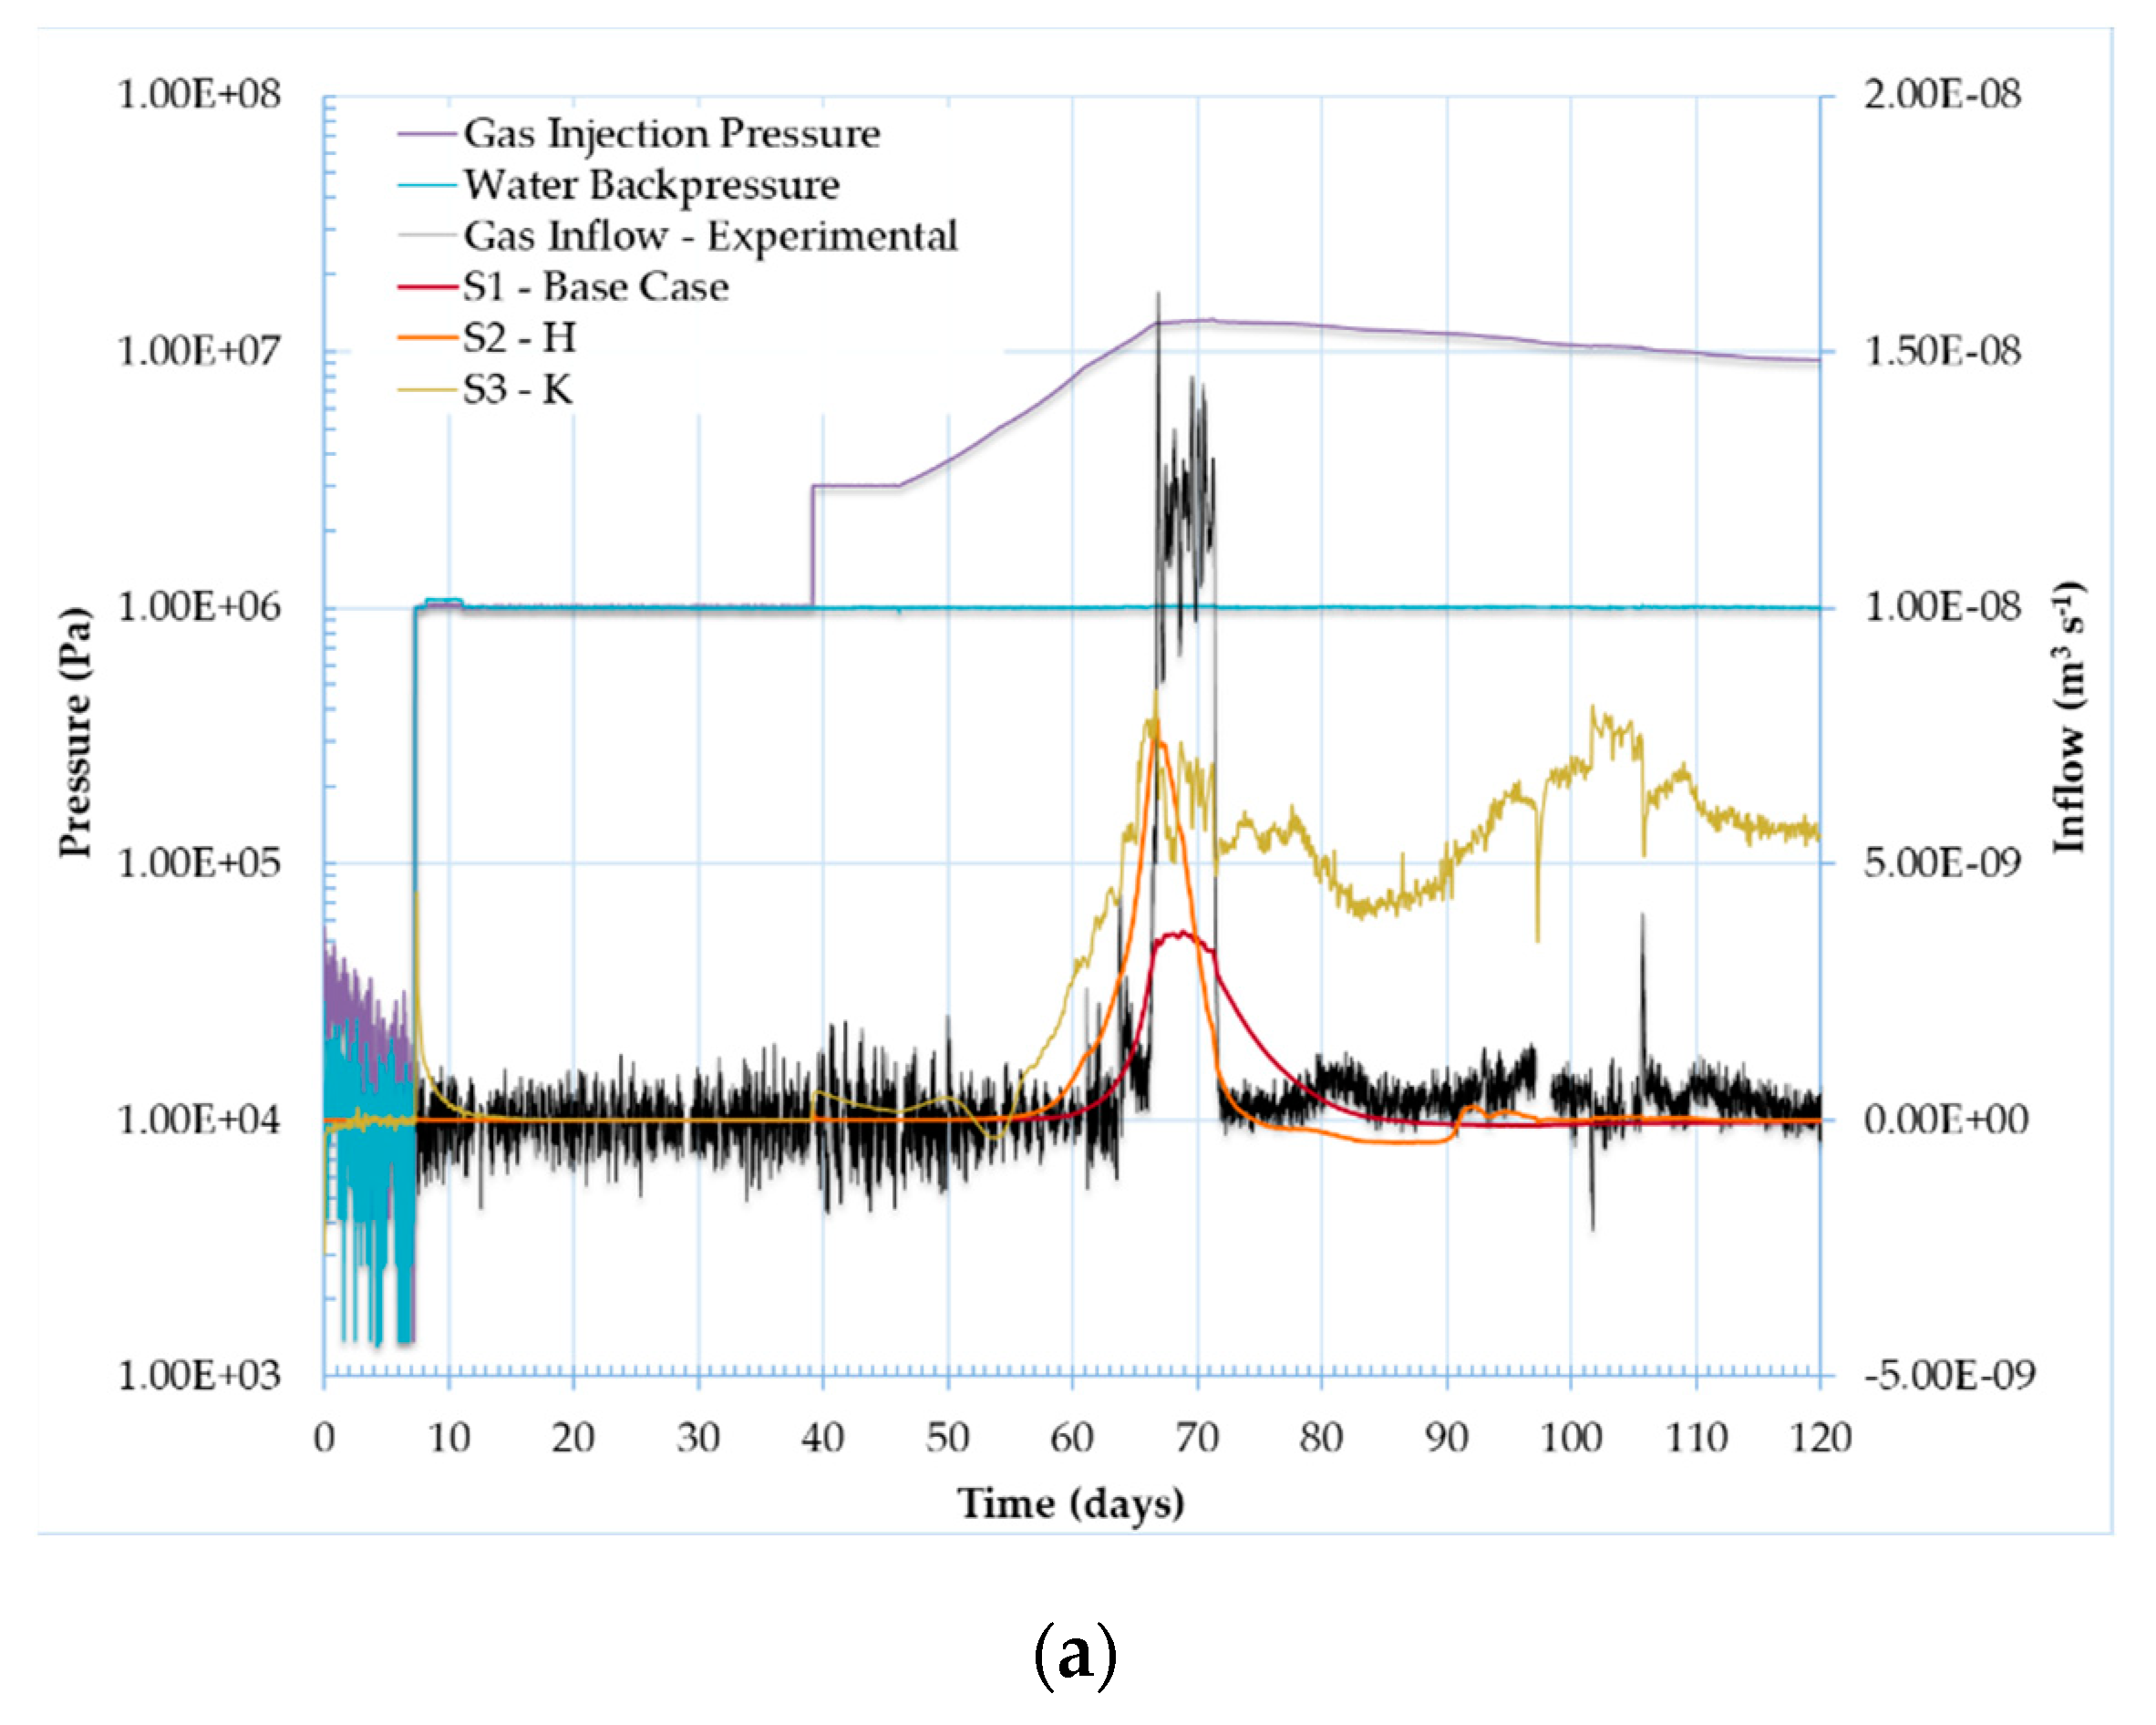
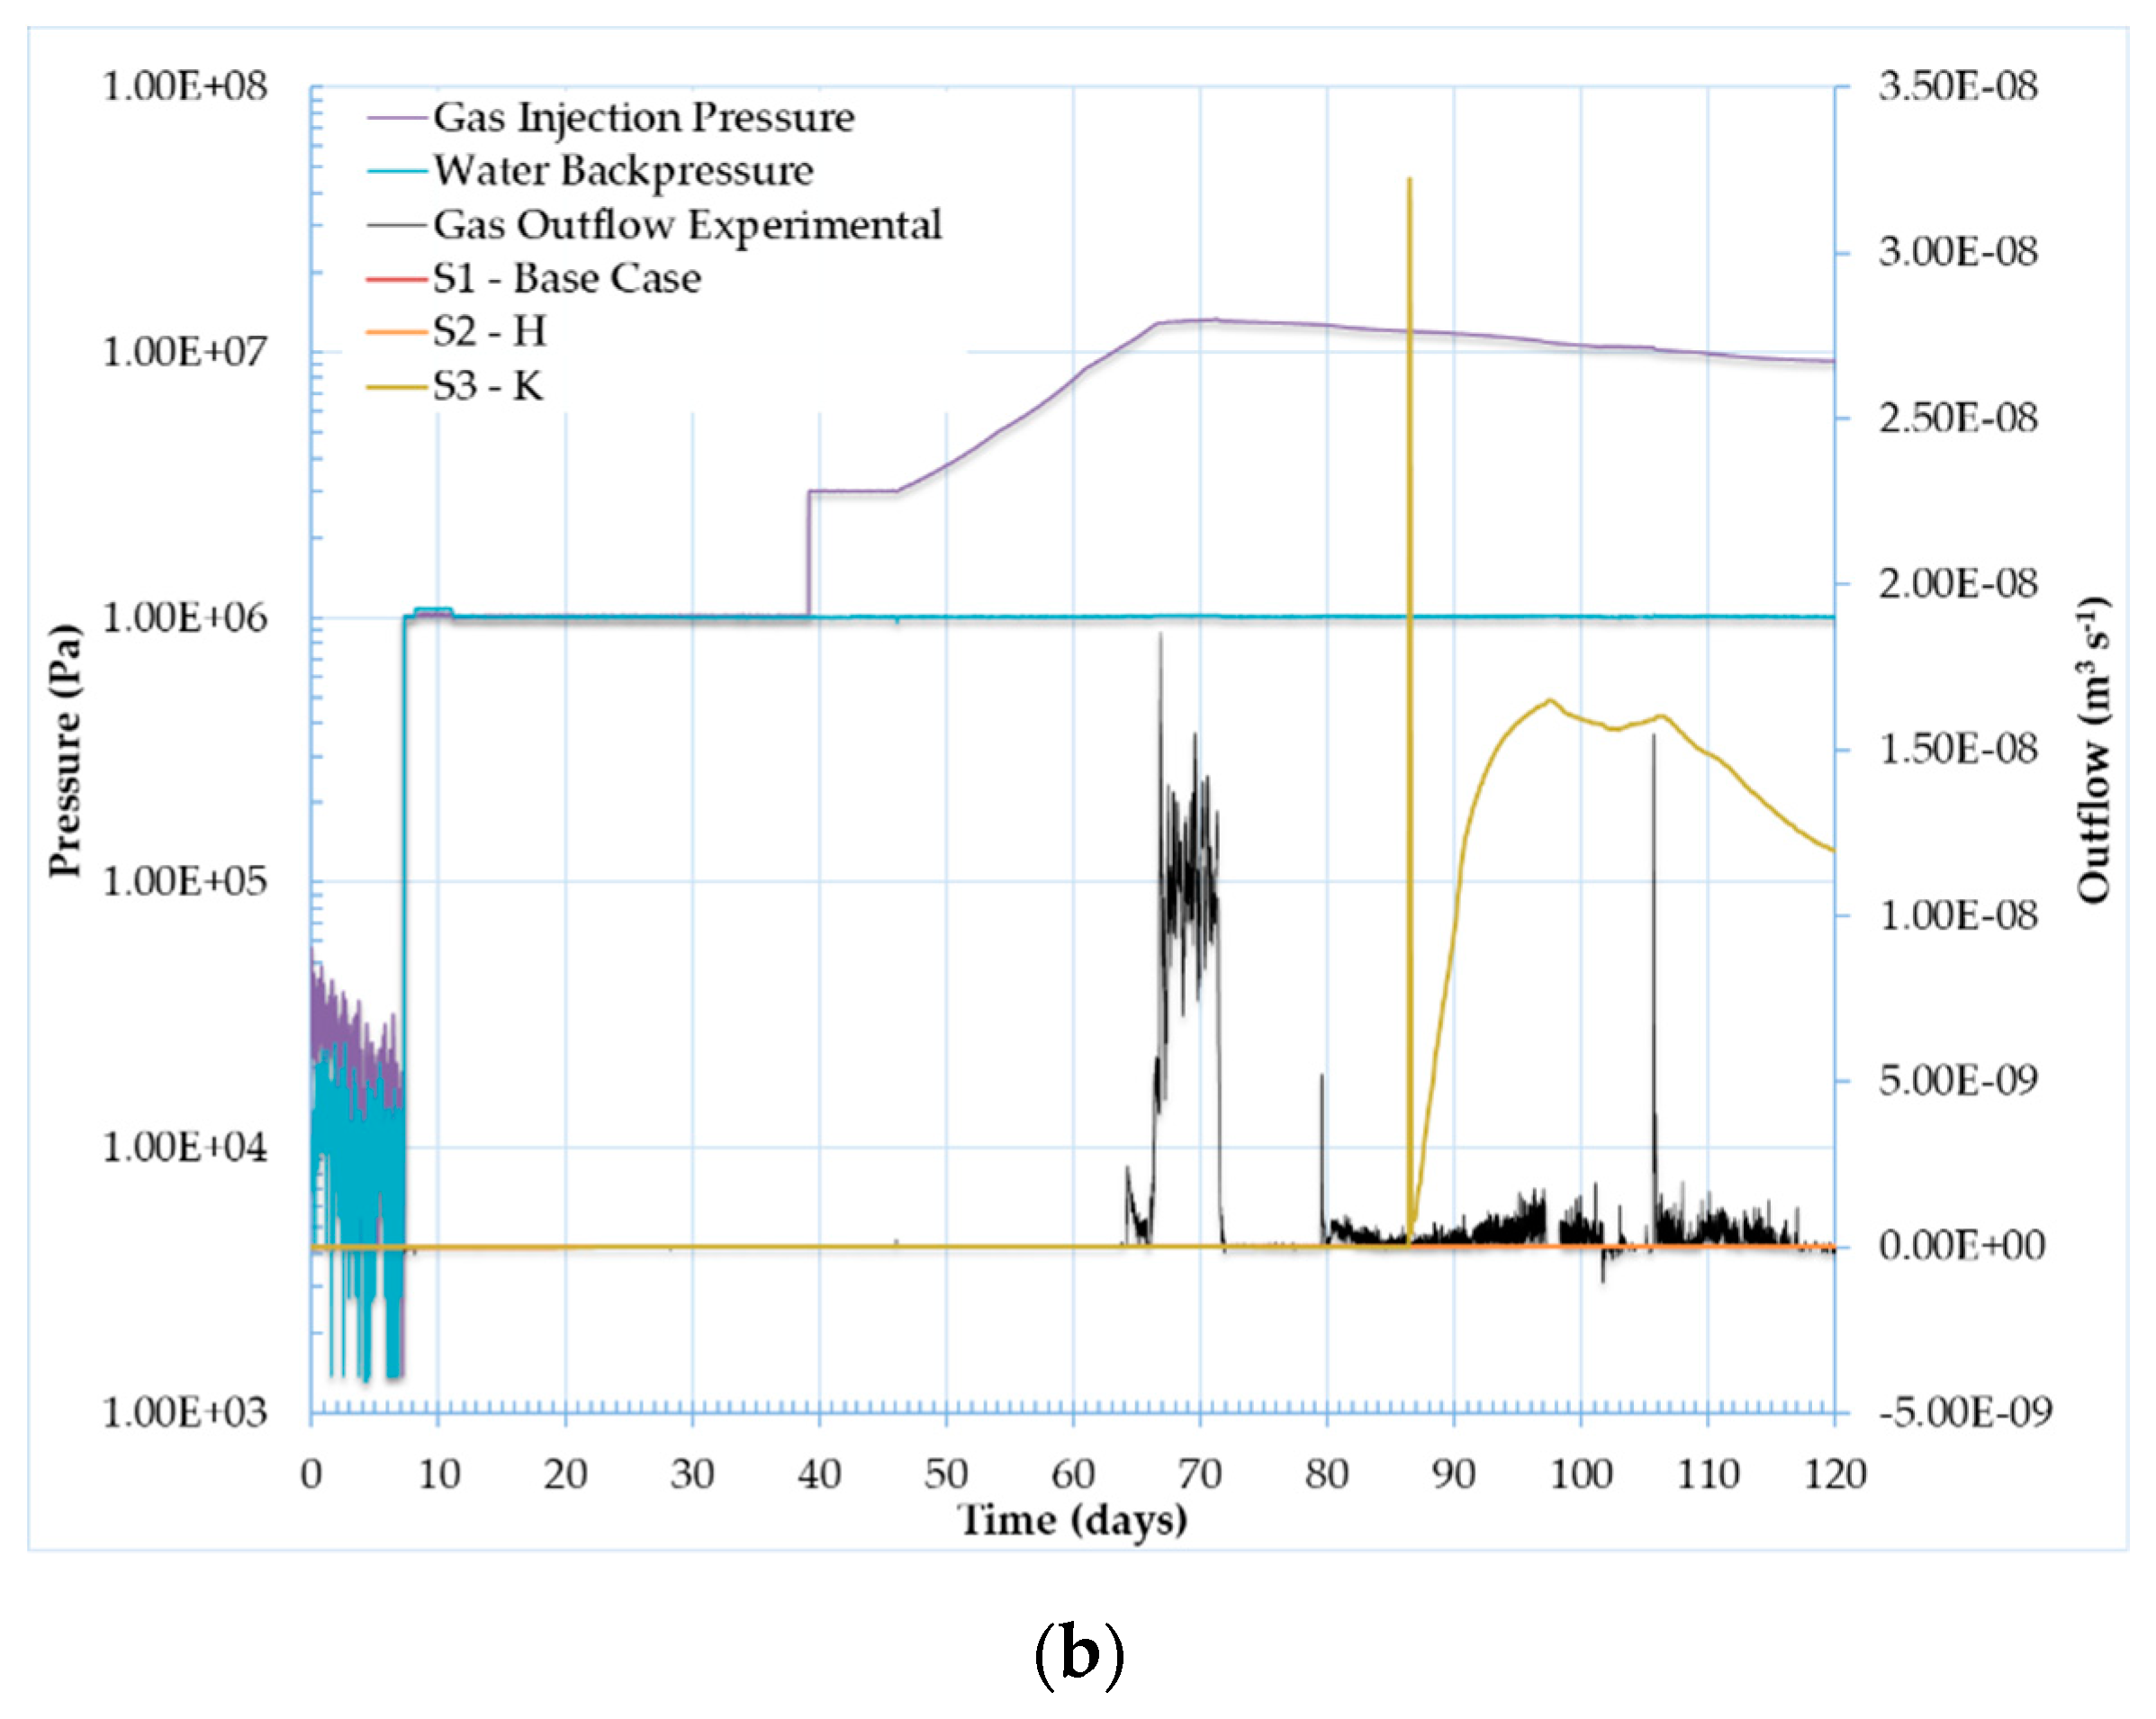
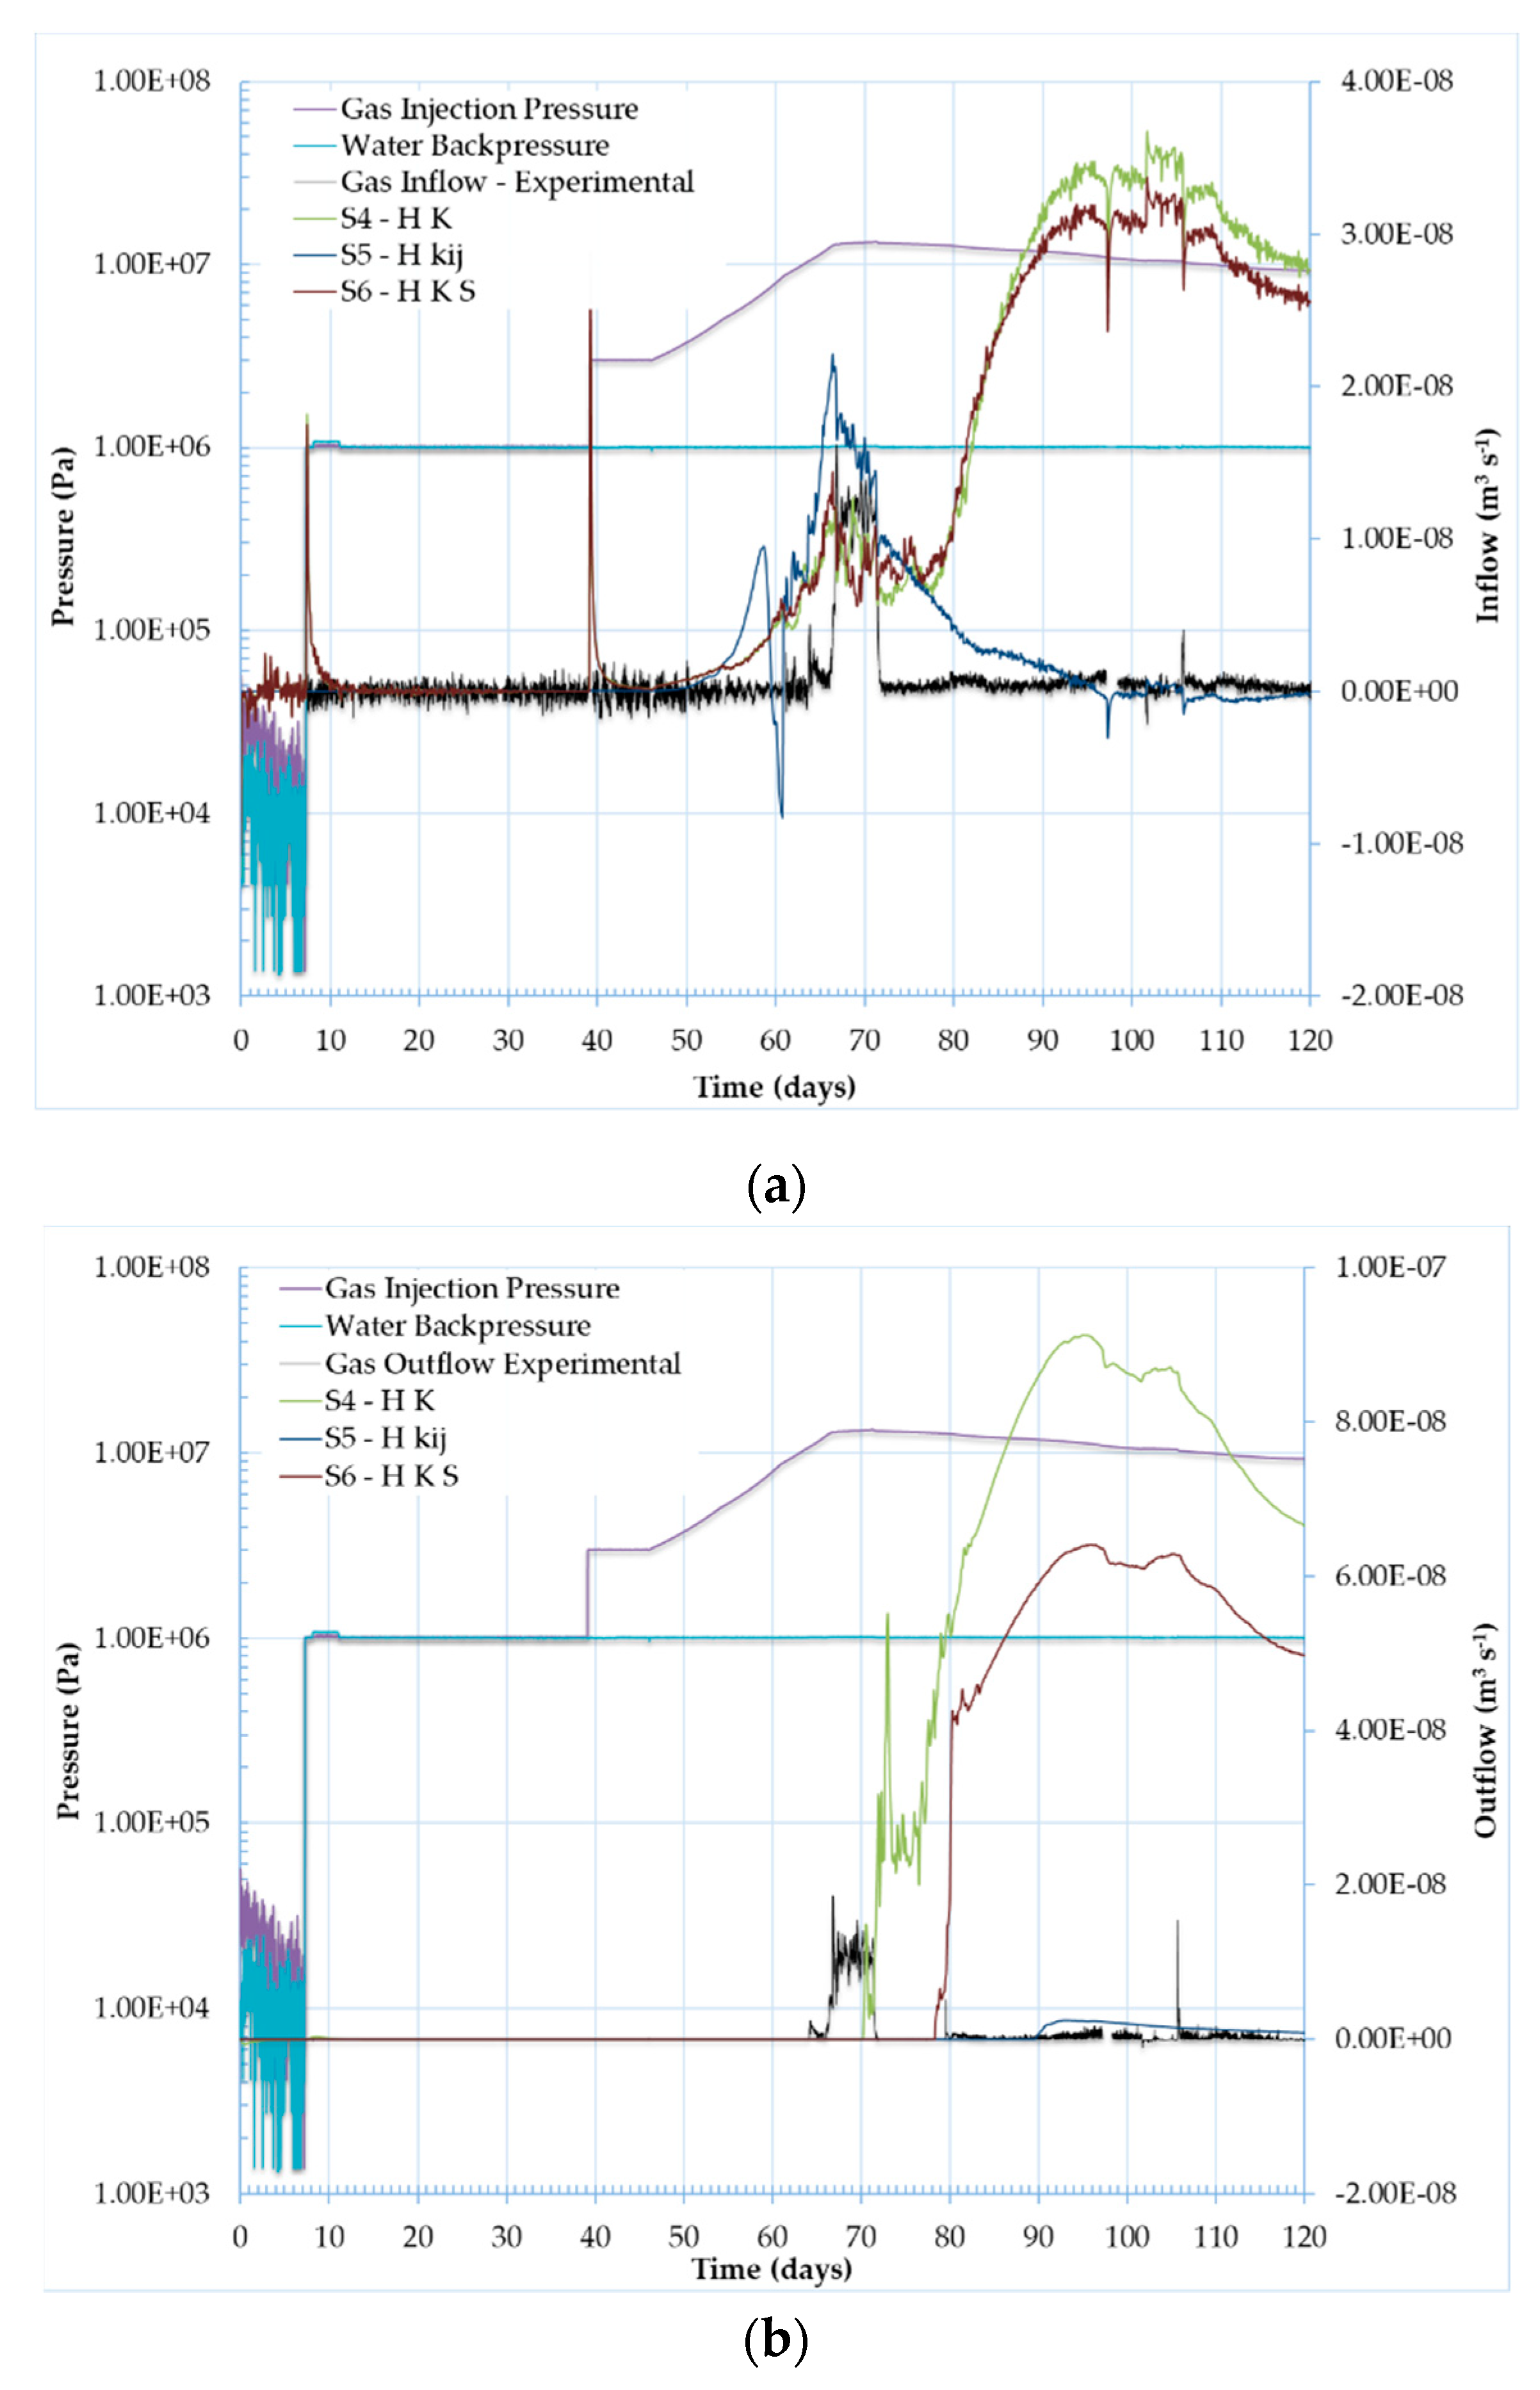
3.4.2. Gas Inflow and Outflow

Total gas inflow and outflow profiles over time for the experimental data as well as for each study scenario are depicted in Figure 8, Figure 9 and Figure 10. The experimental gas inflow shows a steep rise in gas into the sample when the injection pressure exceeds the AEV of 1 × 10⁷ Pa (at 63 days). This is followed by chaotic inflow behavior and then a sudden drop in inflow, which corresponds to shut-off of the experimental injection pump (at 71 days). A similar behavior is exhibited for the experimental gas outflow, whereby gas flow out of the sample occurs almost immediately following gas flow into the sample, followed by a period of chaotic flow behavior and the occurrence of several sudden bursts of outflow near the end of the experimental run. The authors interpreted this as the almost immediate formation of microfractures and the propagation of preferential flow pathways.
Figure 8 depicts the modeled inflow and outflow curves for the single-phase flow scenario, S0. Figure 8a shows that the modeled gas inflow is not able to match the shape, the timing, or the magnitude of the experimental inflow curve. However, the inflow curve responds almost immediately to the injection pressure boundary condition with no rebound curve at each large change in injection pressure. This similar behavior is observed at the outflow with a magnitude several orders lower compared to the inflow, corresponding to the poregas pressure at outflow. These results are expected and are due to the very low constant gas permeability applied to the model (of the order of 10−22 m2).
Figure 9a depicts the modeled inflow curves for scenarios S1, S2, and S3. The curve representing the base case is capable of capturing the general shape and timing of gas breakthrough into the bentonite specimen but is unable to capture the peak magnitude of the inflow or the sporadic inflow behavior during the period where gas is flowing into the sample. For S2, introducing heterogeneity results in slightly early breakthrough and slightly higher inflow compared to the base case. This is likely a result of the presence of areas within the injection face with larger pore sizes and consequently localized areas with lower AEVs, resulting in earlier breakthrough into the sample. For S3, when the Klinkenberg effect is introduced, there is a chaotic inflow behavior observed, which is similar to that of the experimental data. However, the model is unable to match the inflow magnitude and shows that inflow continues to occur even after the injection pump is stopped (i.e., day 71). The reason for this can be attributed to the Klinkenberg “slip flow” factors being applied. At approximately 63 days, once the AEV is reached and airflow into the sample begins, the gas permeability corresponding to a poregas pressure of 10 MPa is approximately 3.1 × 10⁻¹⁷ m2 (see Figure 5). Once gas injection is shut-off at day 71, the residual poregas pressure still remains above the AEV and increases exponentially as the poregas injection pressures decrease. Figure 9b depicts gas outflow curves. No outflow is observed for the base case or when applying heterogeneity to the sample. However, when the Klinkenberg effect is applied, a rapid increase in gas outflow is observed at approximately 88 days and continues with a steady declining outflow. This is due to the lag time it takes for the poregas migration front to completely flow through the sample (i.e., complete breakthrough). This modeled outflow behavior is not observed experimentally and is more representative of a plug flow behavior as opposed to dilation-controlled outflow as indicated by the experimental data.
Figure 10a depicts the modeled inflow curves for scenarios S4, S5, and S6. For S4, where both heterogeneity and the Klinkenberg effect are applied, the results show significantly higher gas inflow and a similar chaotic behavior when compared to the results of S3. A noticeable difference between the modeled results and the experimental results is that, following gas shut-off, there is an even larger increase in gas inflow between 78 and 95 days. As with S3, this is likely attributed to increasing gas permeability, as the residual injection gas pressures decrease while remaining above the AEV. The effect is even more pronounced as slip flow is now occurring along more localized pathways due to the presence of heterogeneity. When assessing the S4 outflow curve depicted in Figure 10b, outflow now occurs at around 69 days and matches the same shape and timing of the modeled inflow curve without the chaotic behavior. This may be due to flow stabilization occurring during migration through the sample as a result of suction and diffusion. Another unusual observation is that the magnitude of outflow under the presence of heterogeneity is roughly 2.5 times higher than that of the inflow curve. This could only be attributed to a rapid increase in gas permeability throughout the sample that occurs as a result of a decrease in poregas pressures during shut-off, leading to rapid outflow and desaturation of the sample.
For S5, when the Klinkenberg effect is restricted in the model and a much higher average initial intrinsic permeability of water is applied, the inflow profile more closely resembles that of the experimental data with some chaotic behavior, although not as sporadic as when Klinkenberg slip flow is present. However, following gas shut-off, the results of S5 do not result in a sharp decrease as observed experimentally, indicating that other mechanisms controlling the gas entry into the sample are occurring, such as damage or plasticity. For S5, complete gas breakthrough occurs at 90 days, but the outflow behavior is not representative of the experimental data.
For scenario S6, when a linear swelling strain is present, the inflow curves match the general shape and timing of those of S4 (without swelling) but reach a slightly higher peak inflow at 68 days when breakthrough into the sample first occurs. In comparison to S4, the peak inflow following gas shut-off achieved numerically at 104 days is reduced in the instance of linear swelling. This is expected by the model, as a decrease in suction at the injection interface due to the decrease in poregas injection pressure would result in a decrease in the volumetric strain and the corresponding porosity and gas permeability. This results in less flow into the sample. This effect is also observed in the outflow.
None of the modeled simulations are able to reproduce the experimental inflow and outflow well. This suggests that the role of AEV and the presence of heterogeneity, slip flow, and reduction in porosity with increasing suction as result of a swelling strain cannot fully describe breakthrough through the system. Although the presence of heterogeneity and slip flow contribute to some preferential flow and chaotic inflow behavior, in order to obtain a sharp and rapid increase in flow as observed experimentally, some other HM-coupled mechanism is needed to promote the rapid increase and decrease of flow into the system.

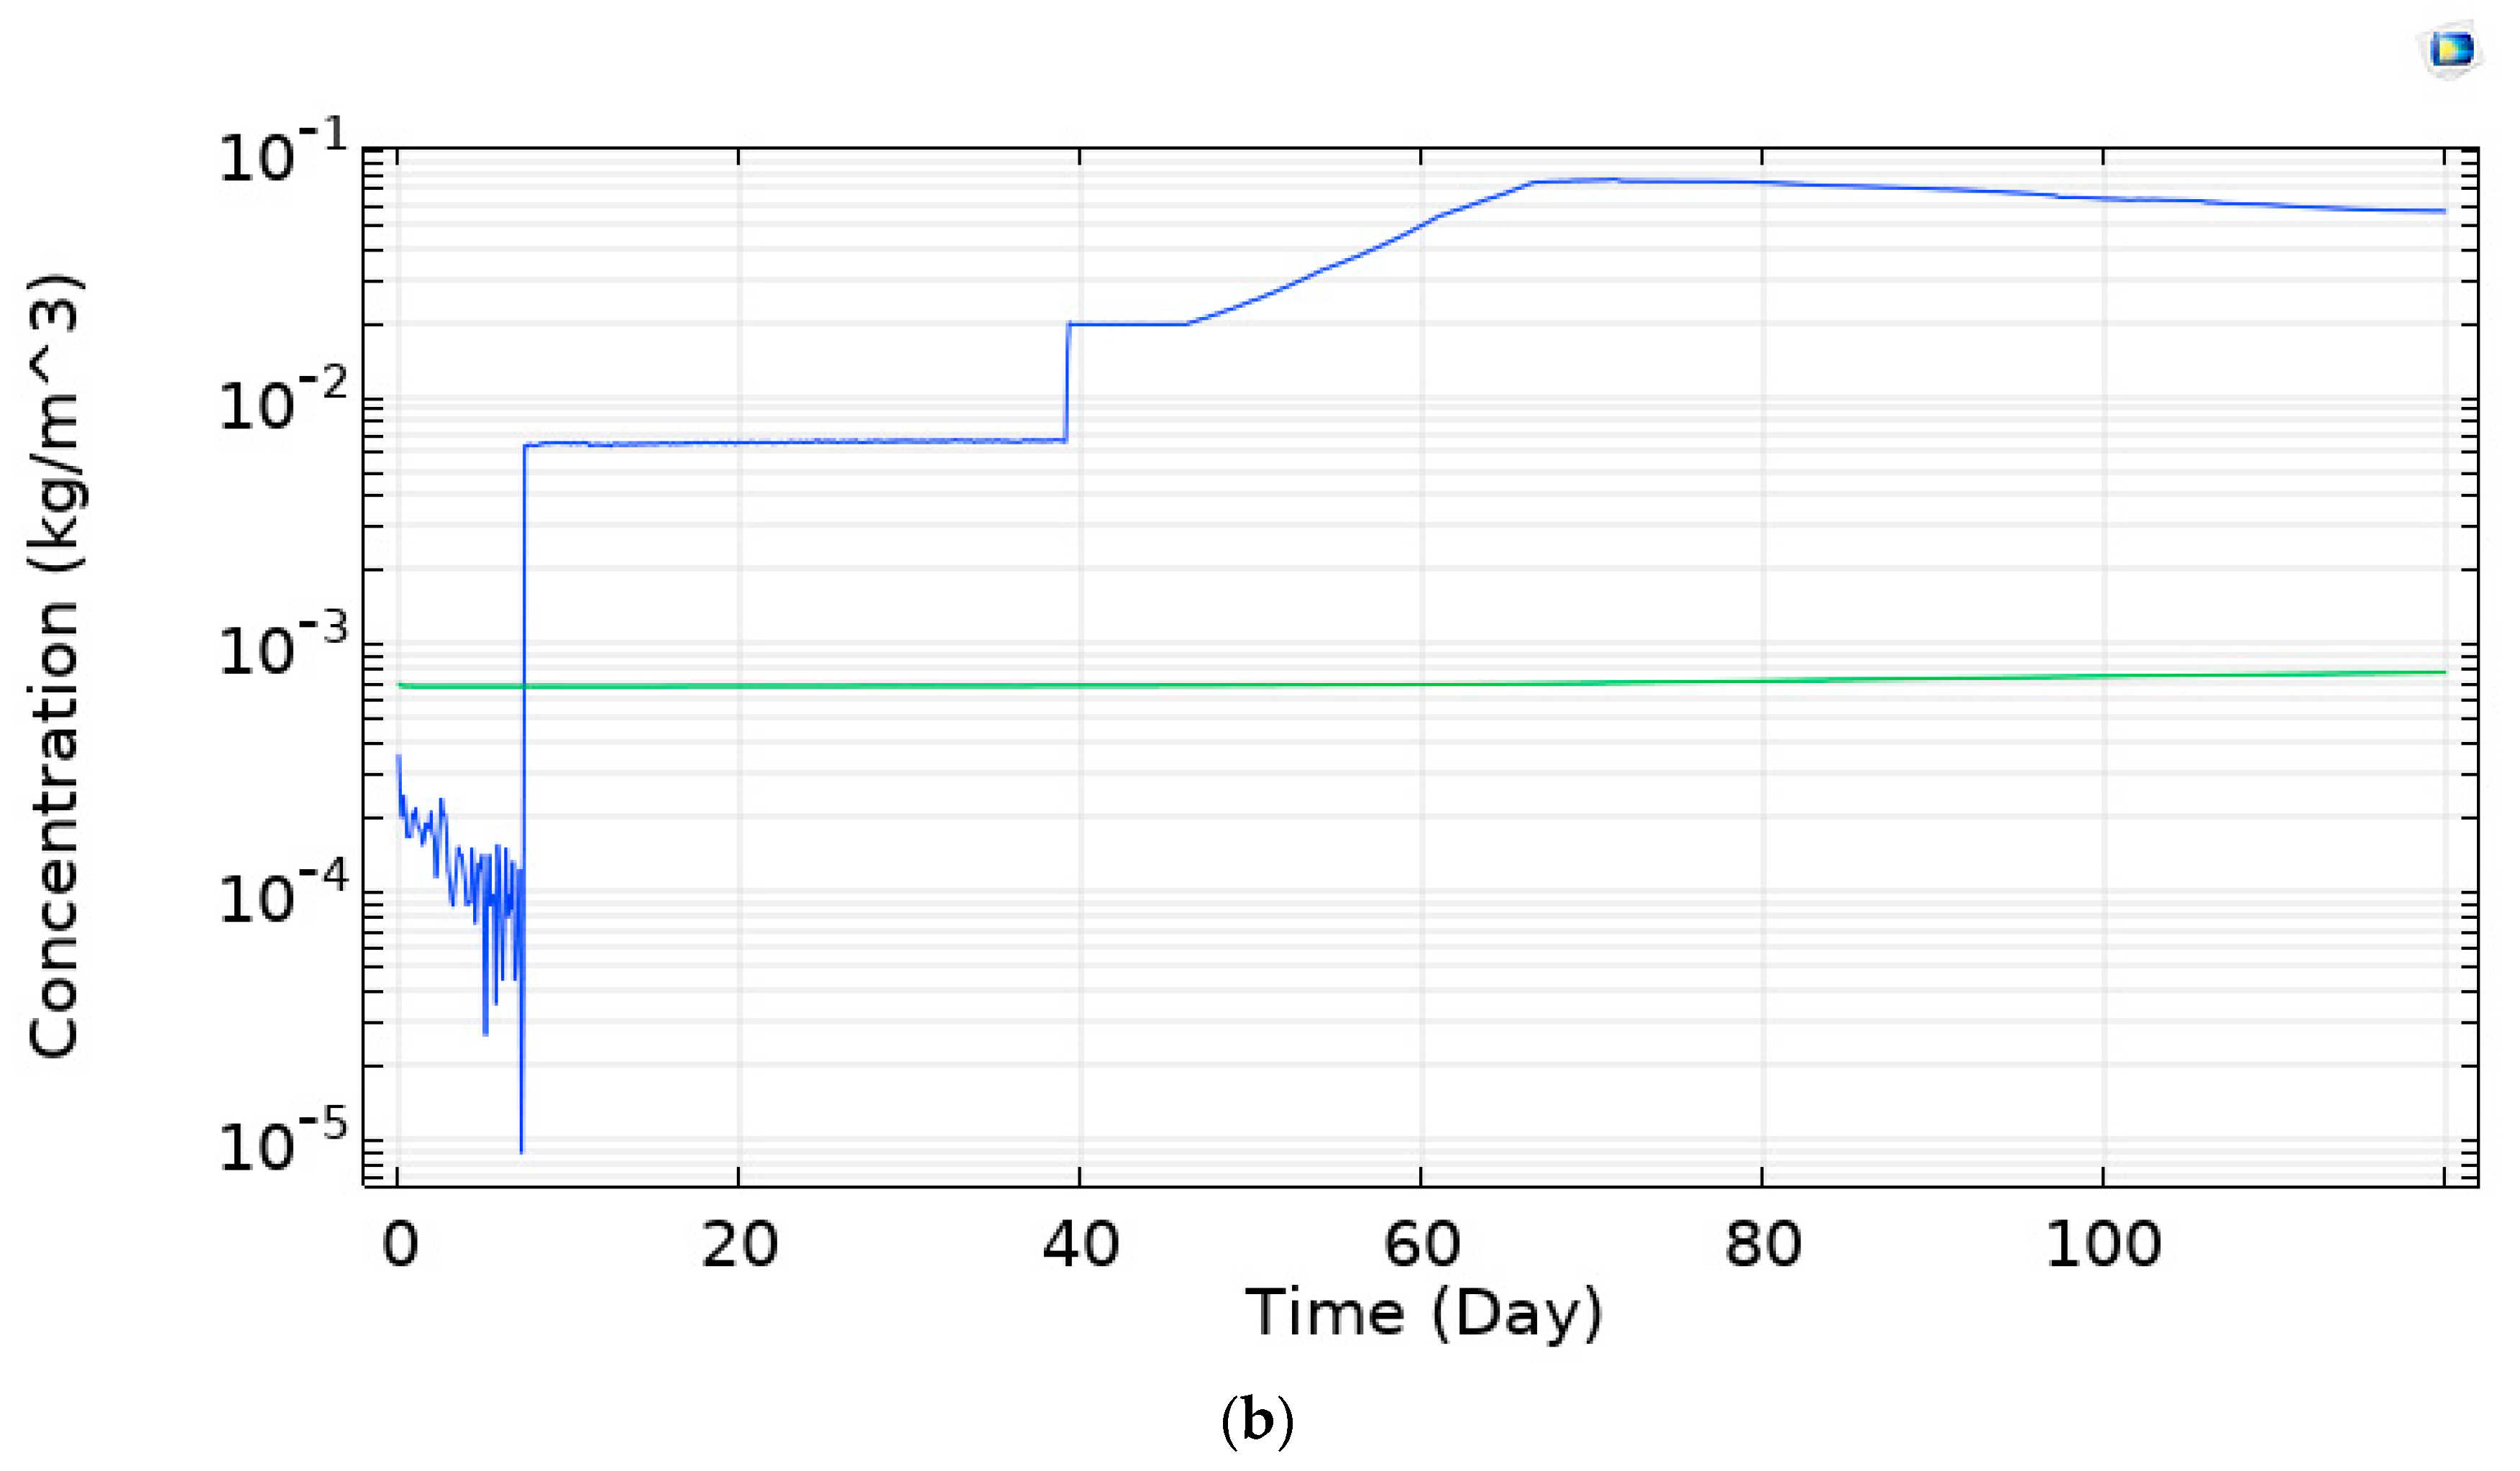
3.4.3. Gas Storage in the System

An important part of this process simulation study is a comparison of the modeled results to the experimental volume of gas stored in the system over time (i.e., inflow minus outflow). It is expected that dilation-controlled gas flow and the formation of preferential flow pathways would result in minimal gas storage within the system. This is observed by the experimental inflow and outflow results whereby the majority of gas entering the system almost immediately exits the system with several delayed bursts of outflow (at ~80 days and ~116 days) attributed to pathway sealing and the creation of new pathways. This is a key feature of the experimental inflow and outflow results originally noted by the experimenters [33]. This feature of the experimental results can be observed by a comparison of the experimental inflow and outflow (black lines) presented in Figure 9a,b, respectively.
Figure 11 displays the experimental volume of gas storage in the system and the volume of gas stored for each model scenario. The experimental results show little gas storage within the soil specimen with approximately 0.002 m3 of gas stored in the system at 120 days. The results of S0 show a large increase in volume of gas stored. Although flow into the sample is low due to the high-pressure gradient and the constant permeability, continuous gas migration occurs through the sample, resulting in a large volume of gas stored in comparison to the experimental data.
As for the two-phase flow models, the results of S1 and S2 match the experimental values quite well; however, this is likely only a coincidence, as in both cases (S1 and S2), gas flows into the sample with no advective gas outflow occurring.
For S3, the Klinkenberg effect results in a small volume of gas entering the system at lower gas pressures. Once the AEV is reached, the amount of gas stored in the system increases significantly. Once gas shut-off occurs, there is a desaturation of the gas as it flows out of the system. This behavior is in line with what is visually depicted in Figure 7c–h. When both heterogeneity and slip flow are present, there is an even earlier increase in gas stored within the system, followed by a longer period of gas desaturation. Introduction of a swelling strain in S6 and S7 does not significantly affect the volume of gas stored. The inclusion of the Klinkenberg effect provides a large deviation from the behavior observed experimentally, supporting the notion that inclusion of the Klinkenberg effect results in more plug flow-like behavior as opposed to the formation of more discrete preferential flow pathways. These results reinforce the conclusion that additional mechanisms of mechanical deformation are required to initiate dilation-controlled gas flow and the formation of discrete preferential flow pathways.

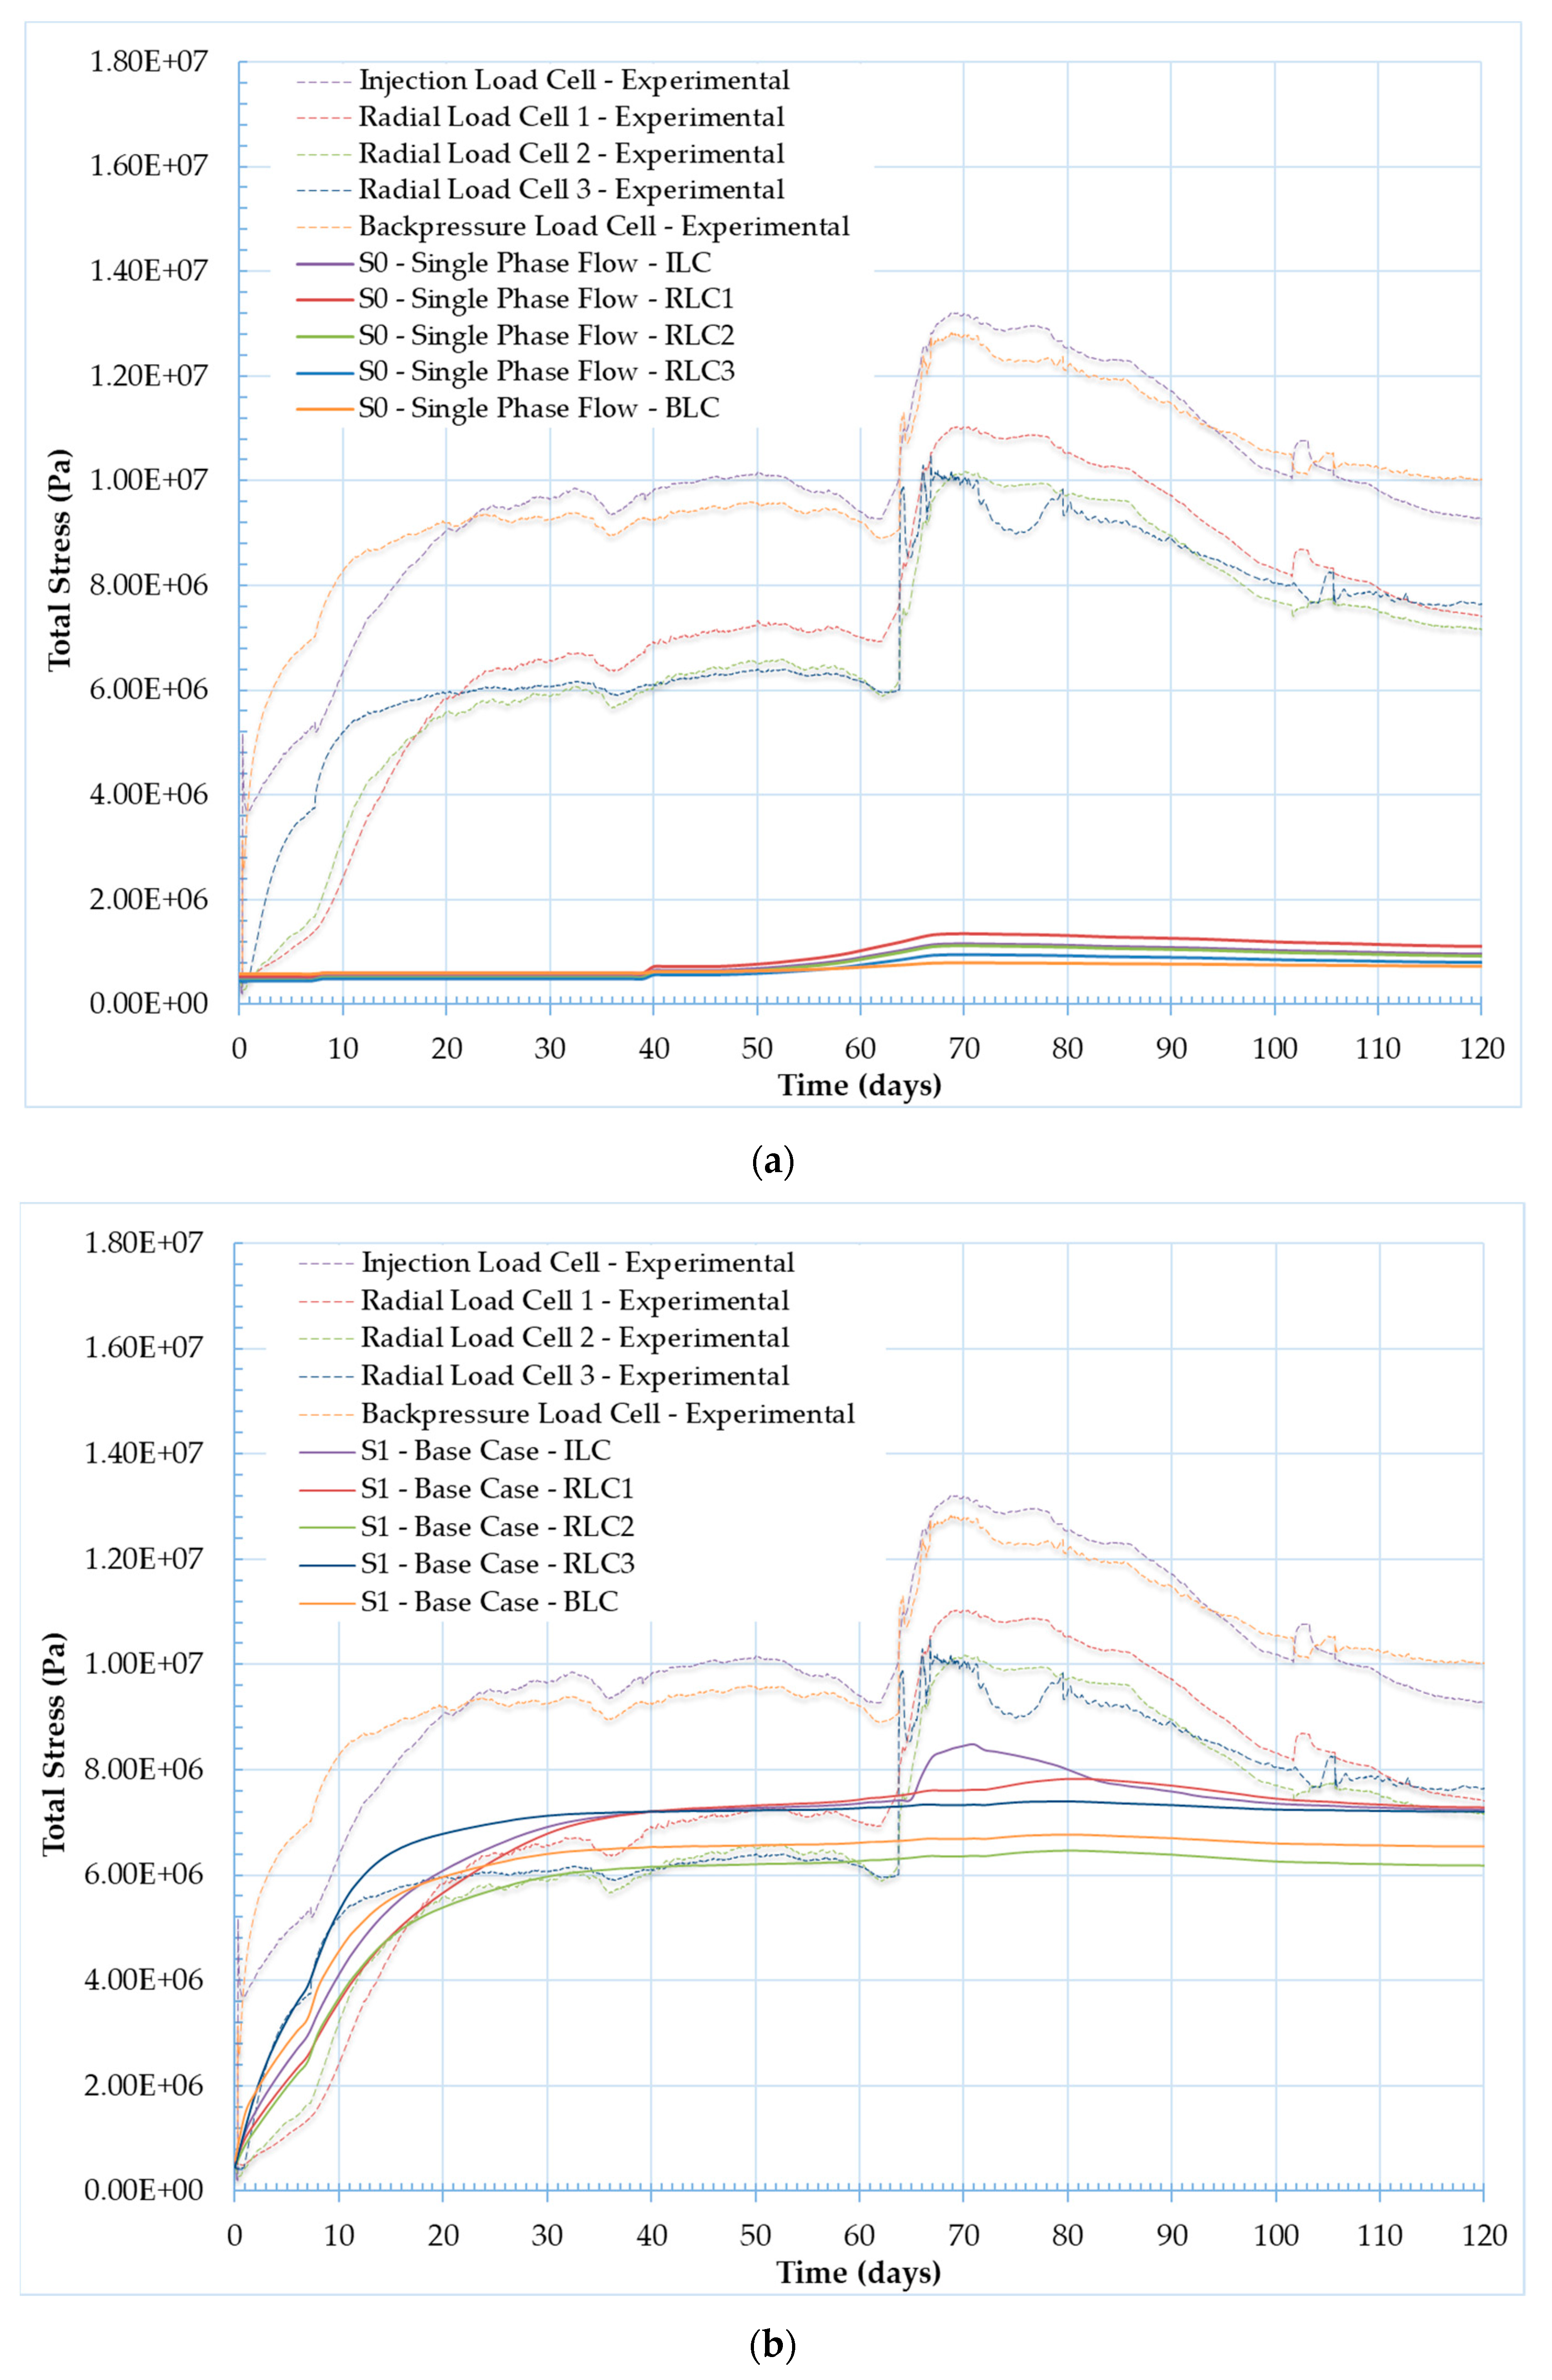
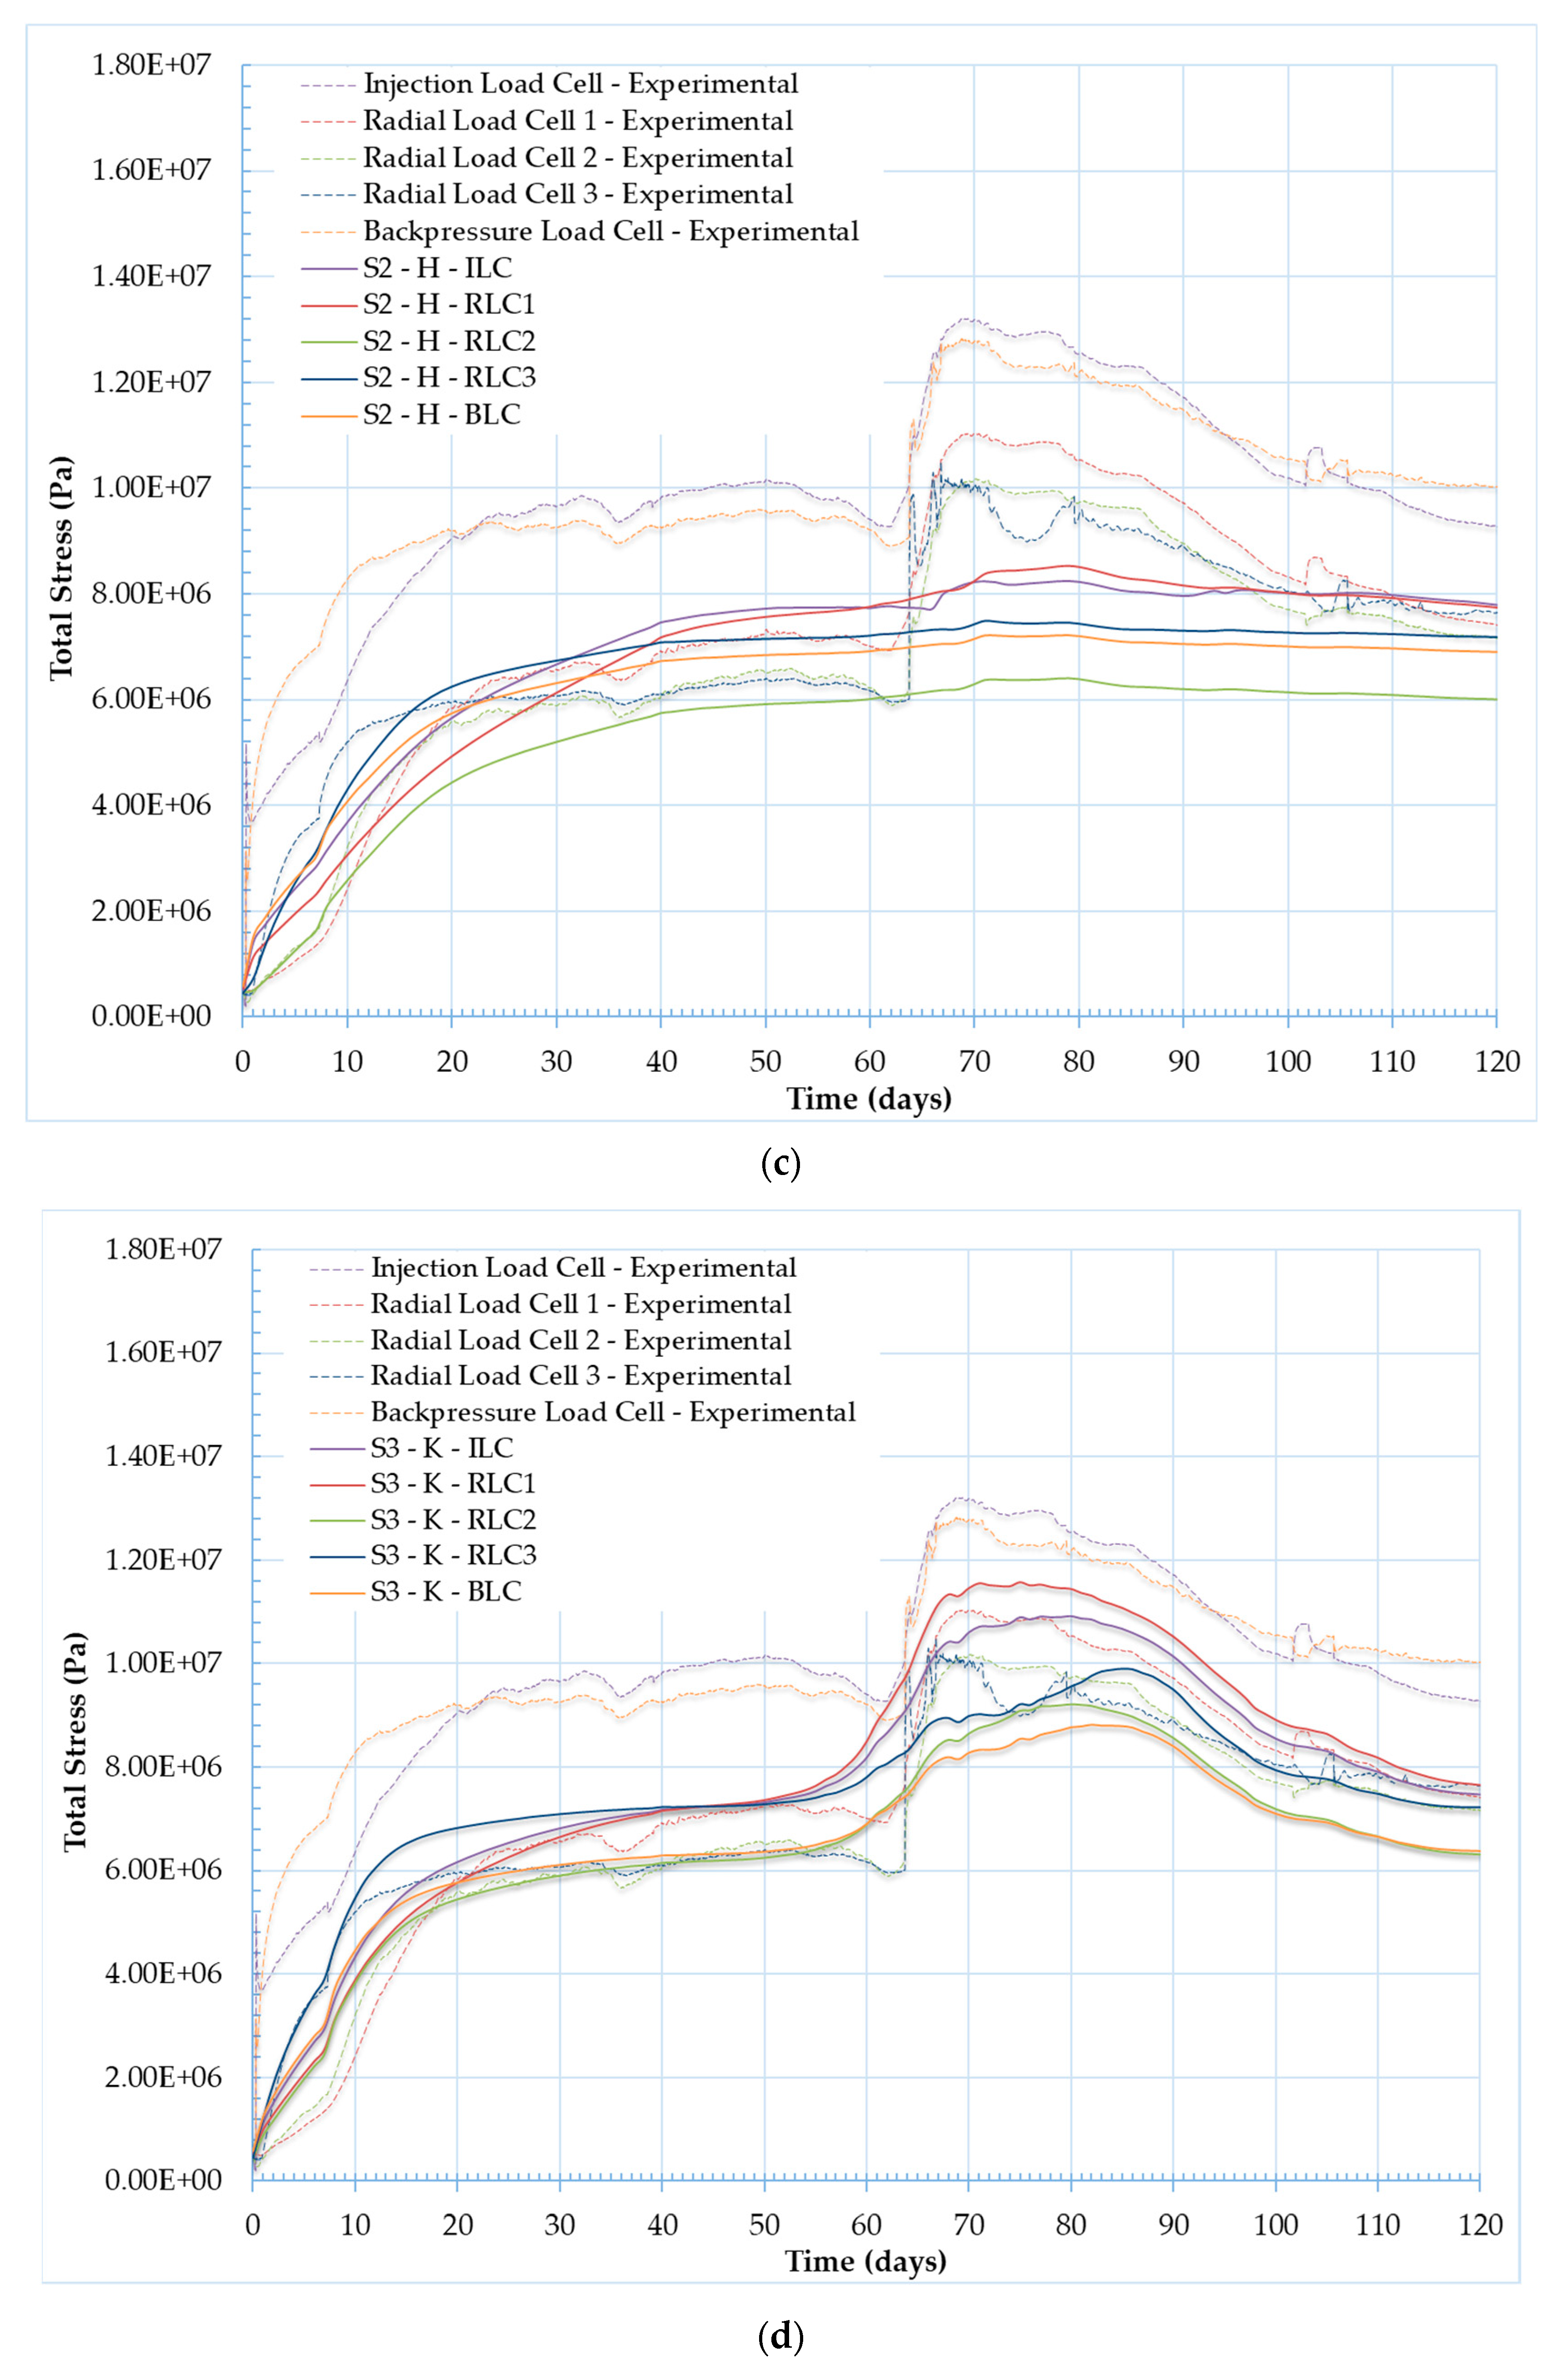
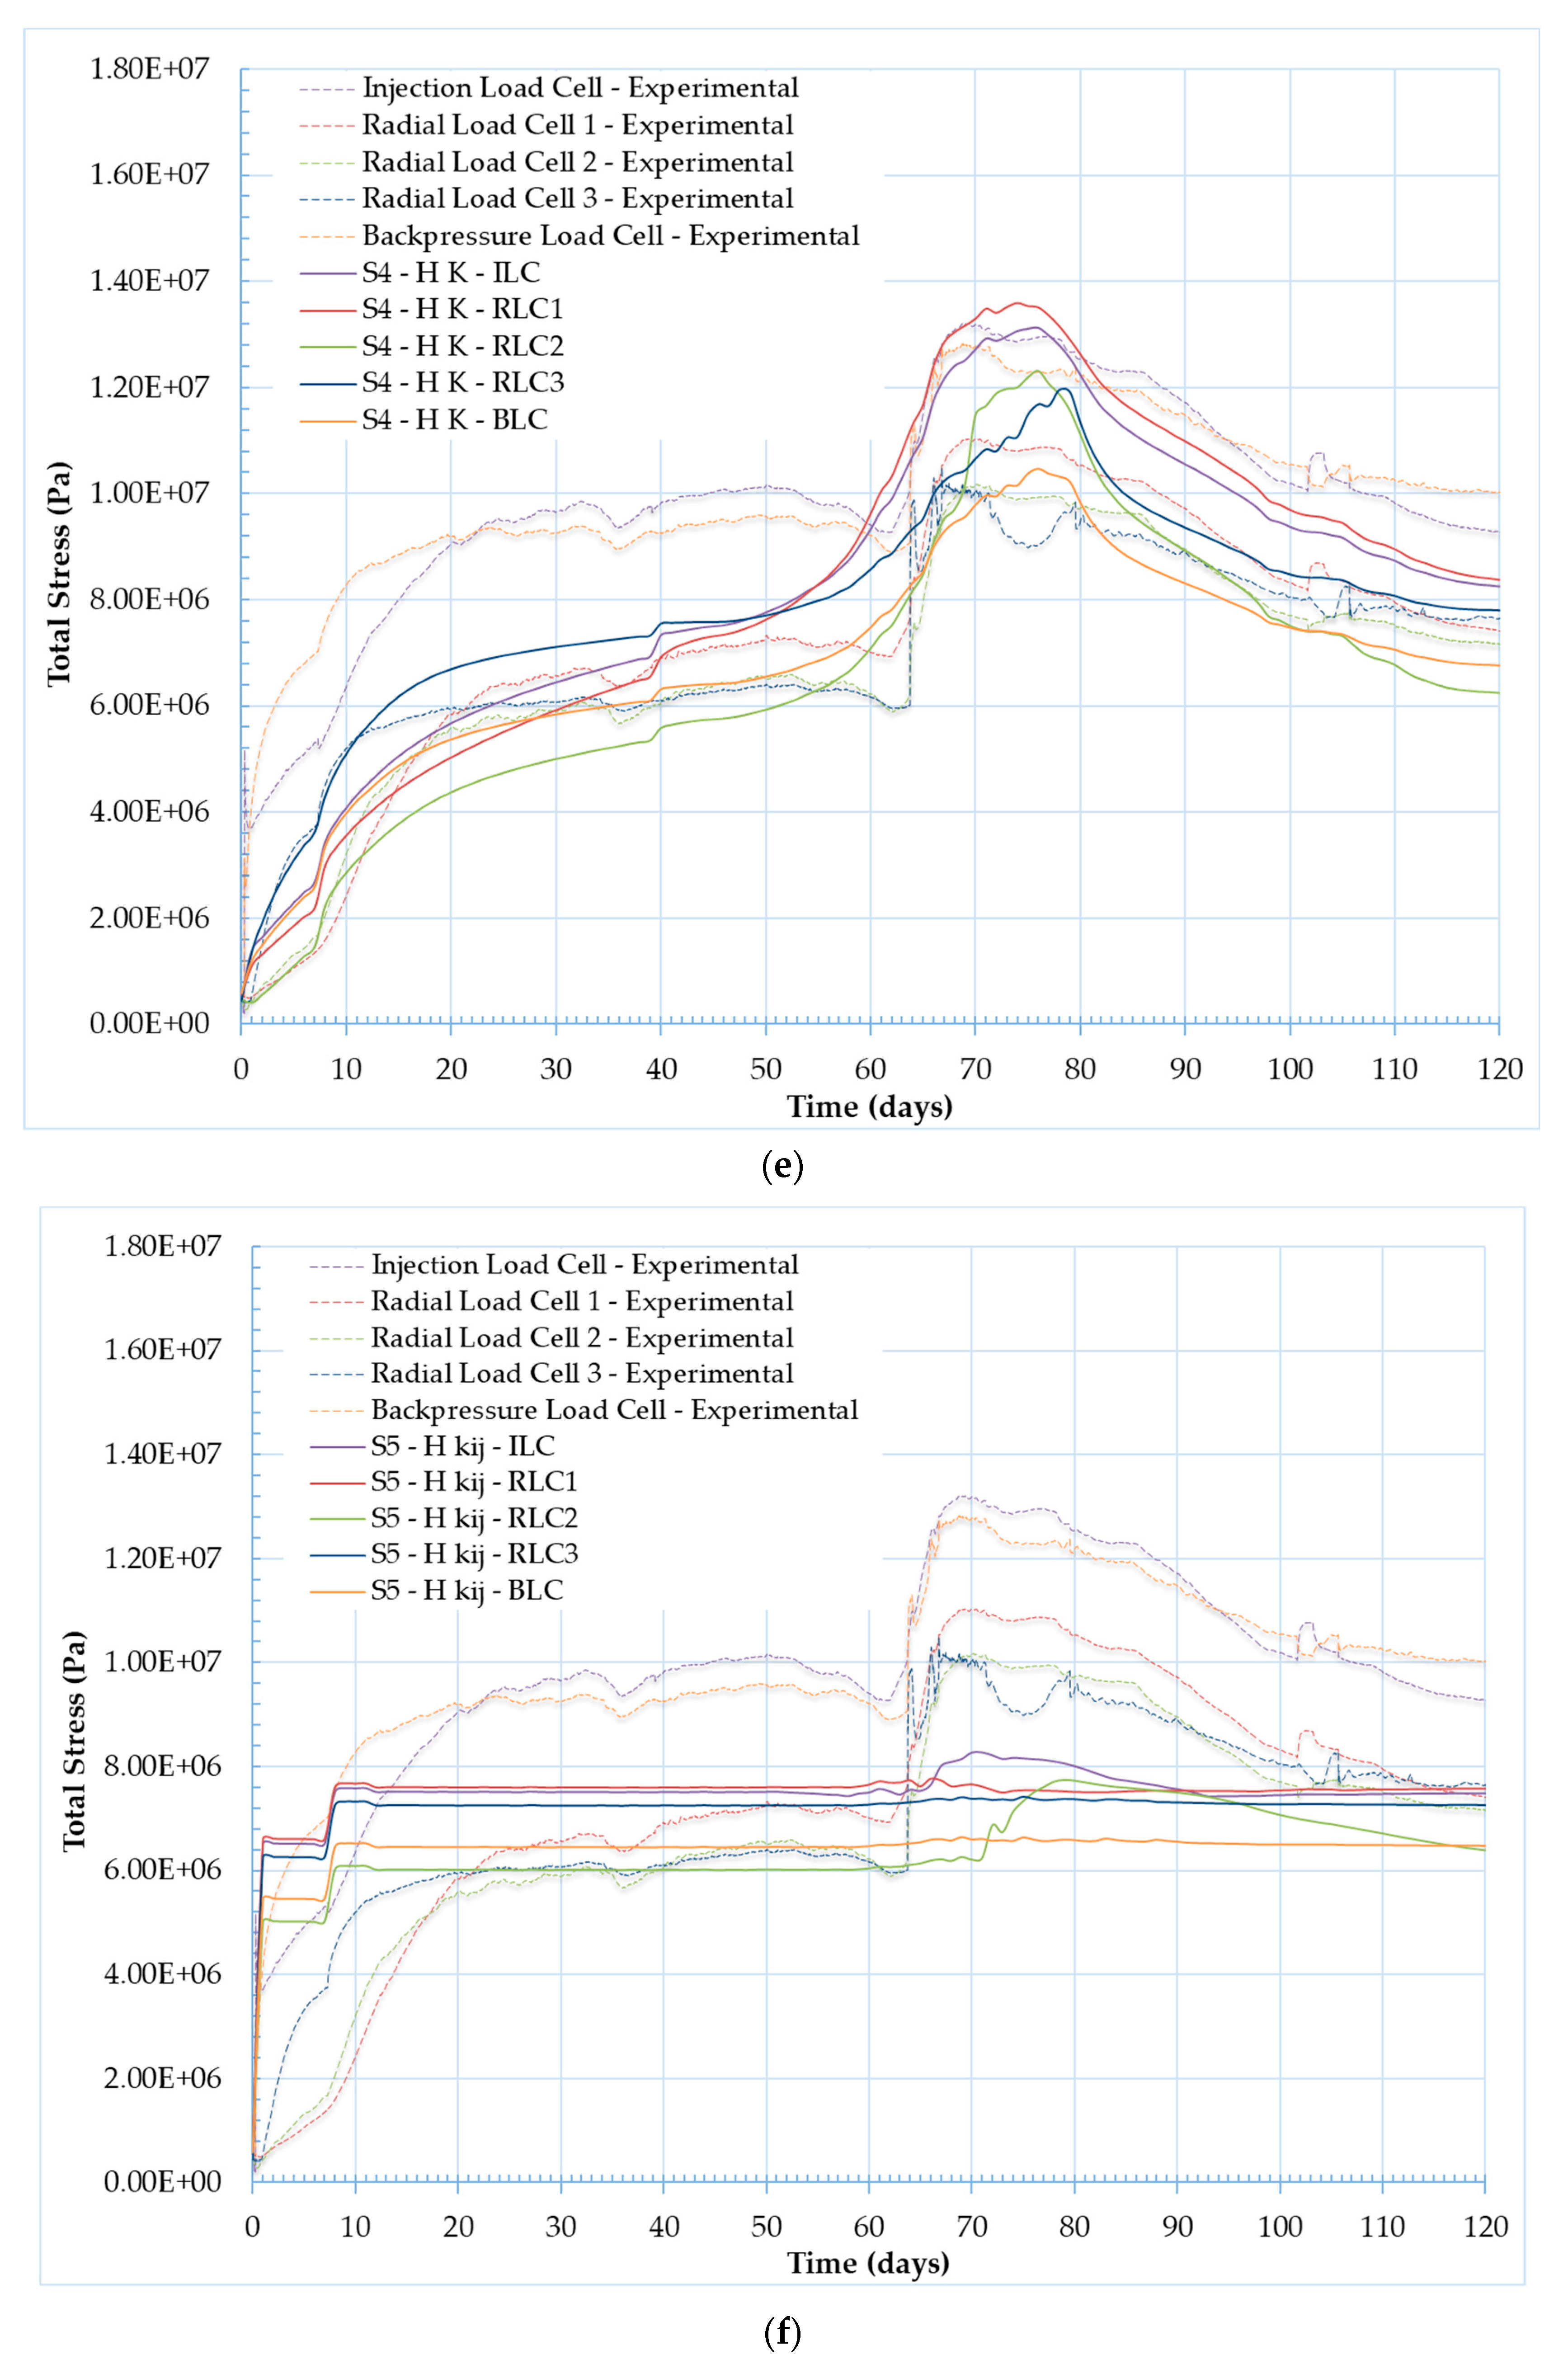
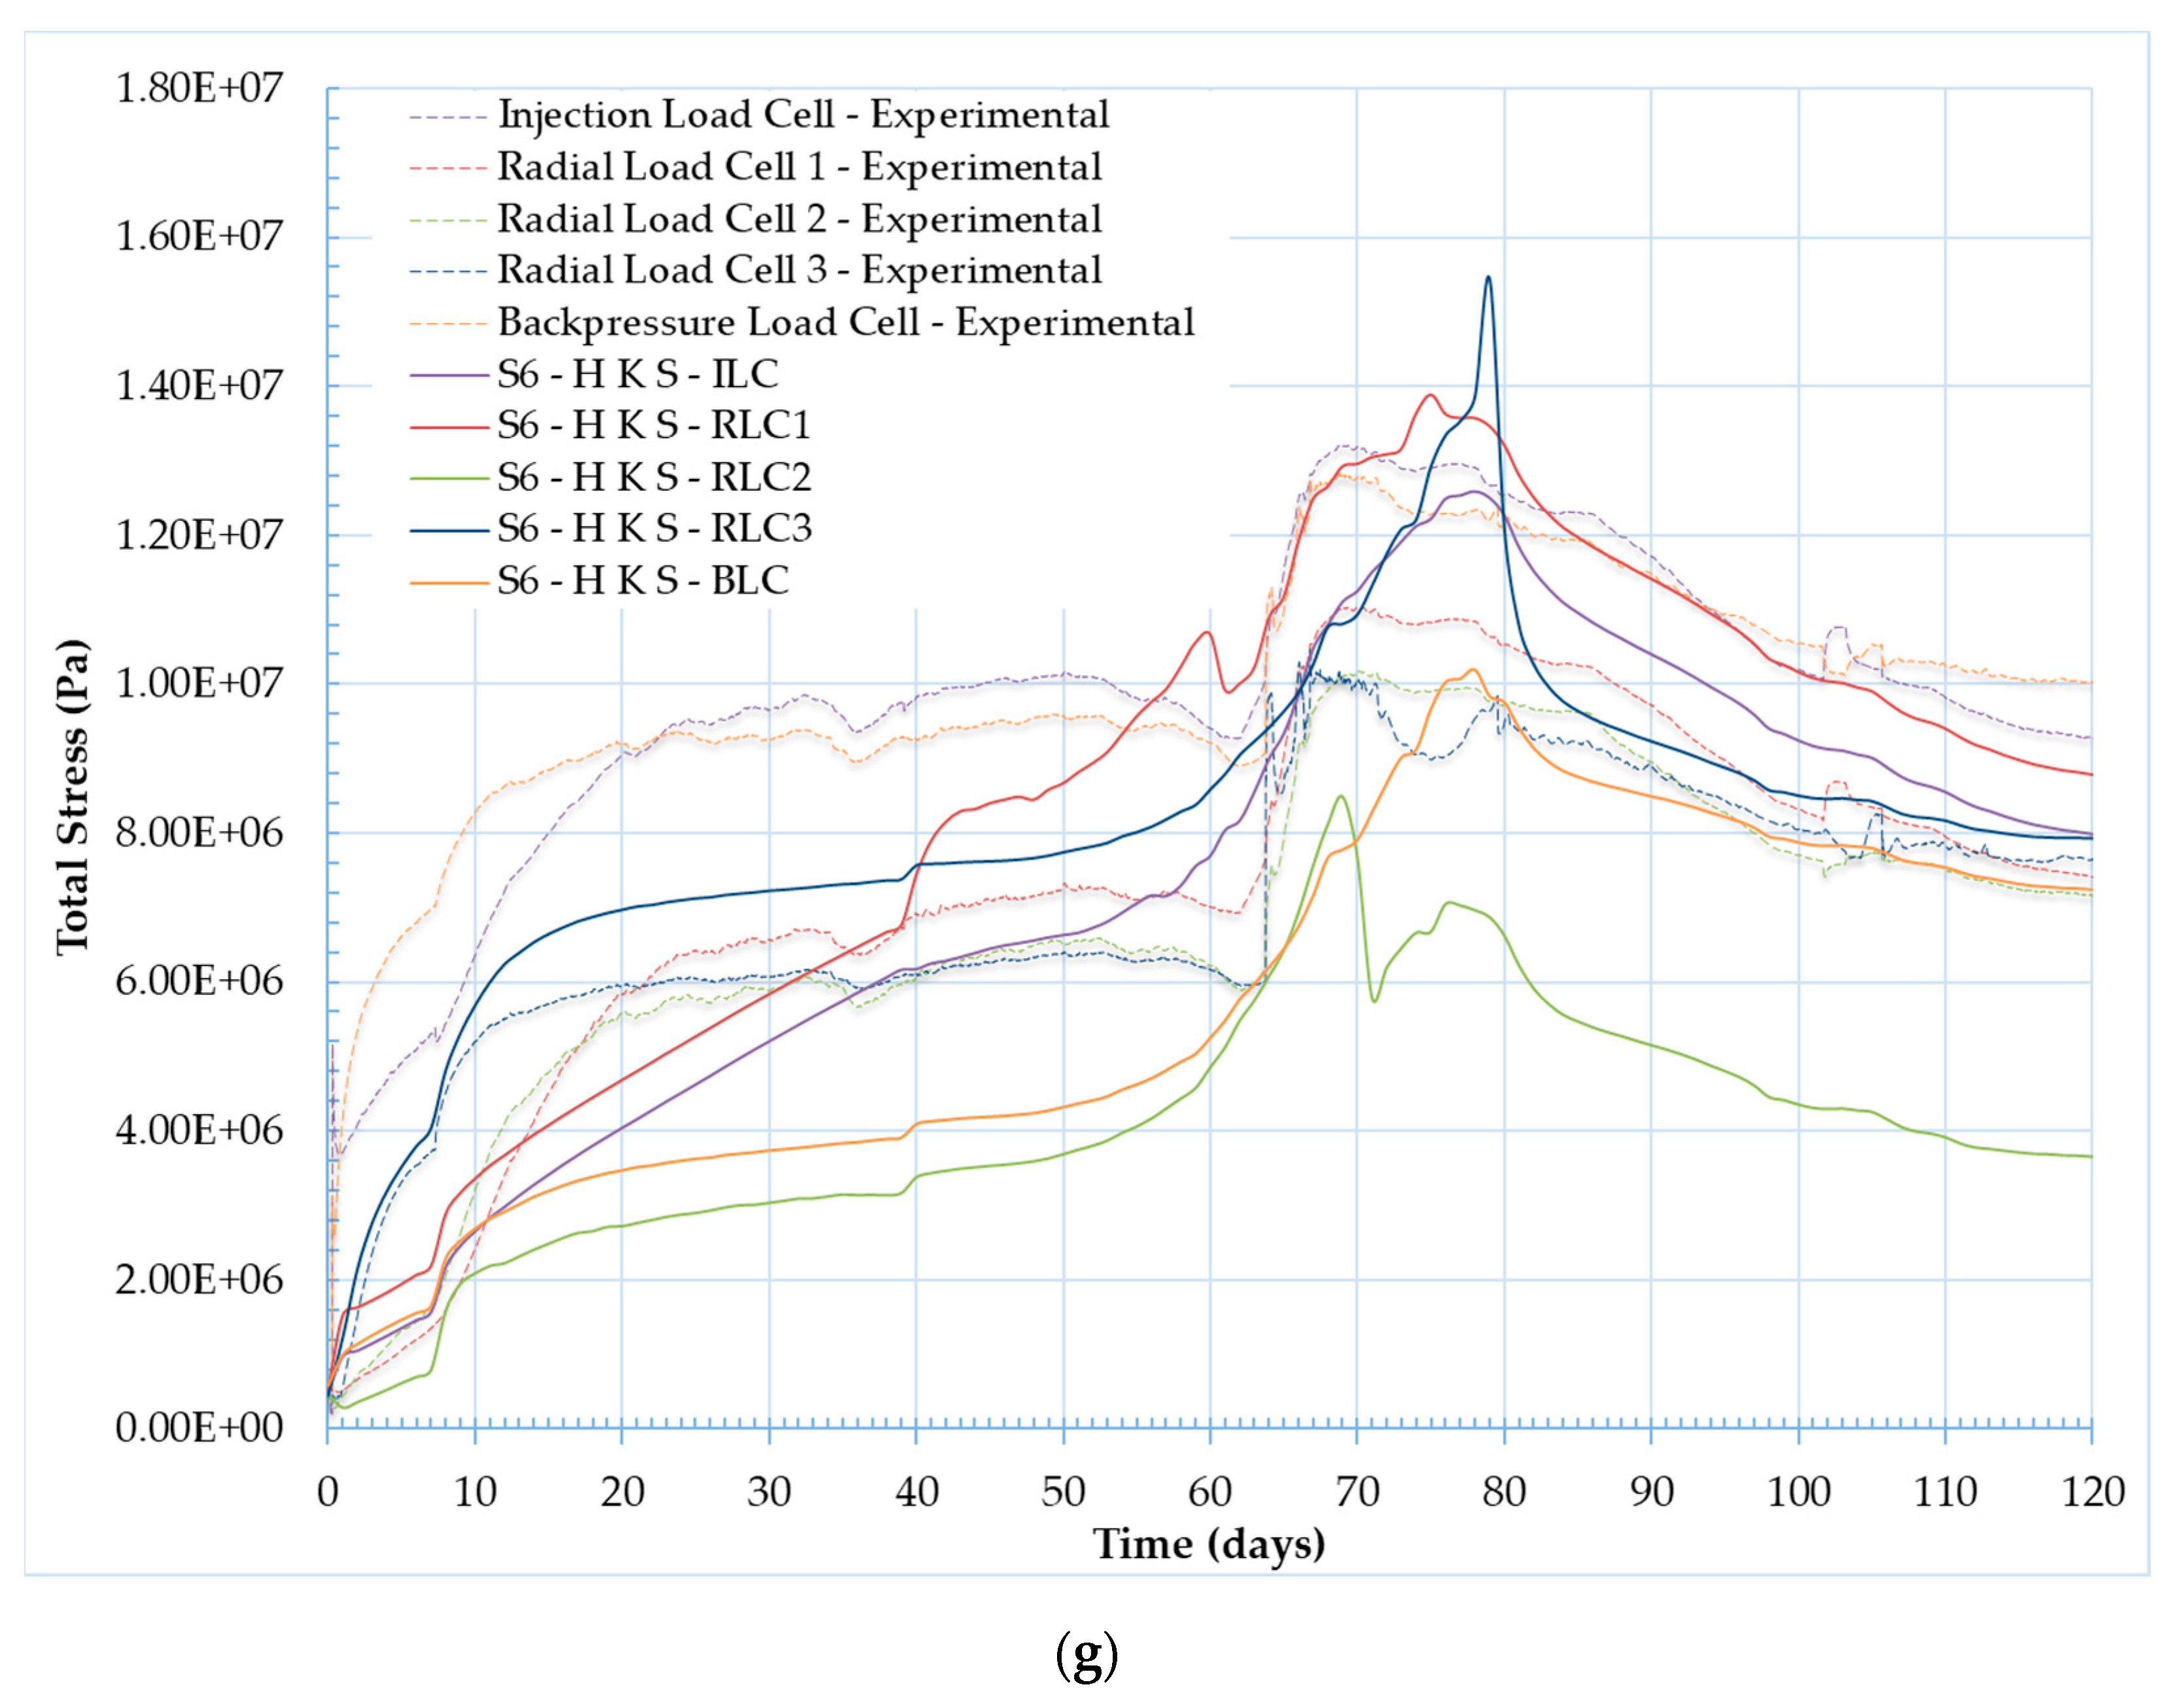
3.4.4. Evolution of Total Stresses

The total stress evolution as measured by injection load cell, radial load cells, and backpressure load cell is presented in Figure 12. The experimental results depict an initial large increase in total stress during the hydration phase (t = 7.3 days to 39 days) followed by stabilization of the stresses. Once the injection pressure exceeds the AEV (t = 63 days), there is another rapid increase in total stresses until gas injection ceases. In their previous work, the authors were not able to replicate the magnitude of the total stress evolution within the hydration phase and attributed this, in part, to neglecting the effect of swelling pressure in the mathematical model, a key behavior of expansive clays. Three key attributes are assessed within this study to attempt to replicate the total stress evolution observed experimentally: (i) modified BCs to allow for additional hydration of the sample from the radial porefluid arrays, (ii) Klinkenberg effect leading to increased gas flow through the system, and (iii) the application of a swelling strain to simulate swelling of the clay.
Figure 12a provides the total stress evolution for the single-phase flow case, S0. The results show a minor stress response with increasing injection gas pressures when compared to the experimental data. This is to be expected, as the single-phase flow model only considers changes in porefluid pressure associated with an increase in poregas pressure at a constant χ = 0.9 and ignores the porefluid pressure associated with the immobile water phase.
Figure 12b provides the total stress evolution for the base case, S1. The results show much better agreement of the total stress evolution during the hydration phase in comparison to the authors’ previous work [11], as it is able to capture the shape, the timing, and the magnitude of the stress evolution. This is evidently a direct result of the change in BCs applied in this study. However, S1 is not capable of simulating the total stress response observed following breakthrough into the sample.
Figure 12c provides the total stress evolution for S2. The results are similar to those of S1 but with a larger spread between the total stress curves due to the introduced heterogeneity. During the hydration phase, the total stress profiles at the axial load cells (i.e., injection load cell and backpressure load cell) do not increase to the same magnitude as the experimental data, although the total radial stresses are captured fairly well. This may be due to increased heterogeneity at the injection and backpressure fronts during installation of the specimen. Again, S2 is not capable of simulating the total stress response observed following breakthrough.
The results of introducing “slip flow” are provided in Figure 12d. For S3, when the Klinkenberg effect is introduced, the modeled results following breakthrough capture the experimental behavior very well, with a steep increase in total stress at both the axial and the radial load cells, followed by a subtle tail off once injection stops. This increase in total stress is due to achieving complete breakthrough through the sample. The model does have difficulties reaching the maximum total stresses recorded experimentally at the injection and the backpressure load cells; however, there is reasonably good agreement.
Figure 12e shows the stress evolution for S4. When heterogeneity and Klinkenberg effect are both introduced, the model is able to achieve a higher separation of stress curves and match the range of peak total stresses recorded experimentally, although it is still not quite able to match the total axial stresses exhibited during the initial hydration period. Furthermore, a deeper analysis of the stress evolution at each individual load cell array shows an overprediction of total stress at radial load cell 1 (RLC1) and an underprediction at the backpressure load cell (BLC). However, this may be due to the specific random distribution of heterogeneity applied in our model. If multiple iterations of the model are run using different randomly generated porosity distributions, the total stress evolution behavior exhibited experimentally by the individual load cell arrays may be realized by the model.
Figure 12f shows the stress evolution for S5, whereby the initial intrinsic permeability is set two orders of magnitude higher than that measured experimentally in order to observe the effect on flow behavior. For this scenario, the results show a much greater increase in total stresses from t = 0 days to t = 7.3 days, followed by fairly stable stress curves throughout the remainder of the simulation. Of particular note is that there is minimal stress response during breakthrough. These results, when compared to the experimental results, support the notion that the Klinkenberg effect may play an important role in the gradual stress response of the system.
The results of S6 are provided in Figure 12g. The introduction of a swelling strain provides a larger separation between the total stress curves. It also reduces the total stresses on the system in comparison to S4, with the exception of a peak total stress observed once gas breakthrough into the sample occurs, followed by a rapid decrease. This behavior in total stress under the presence of swelling is expected, as an increase in gas pressure results in an increase in suction and a decrease in volumetric strain. In our process simulation study, this is most evident at the peak at RLC1, whereby once the AEV is reached, there is a rapid increase in total stress in the system. Following gas shut-off, there is an even steeper decline. It should be noted that this behavior is not observed experimentally, although use of a non-linear swelling strain may lead to a better fit.
In light of these results, more work is needed to better fit the total stress evolution during the hydration period. This may be through re-evaluating the initial degree of saturation of the specimen, the initial hydration provided by the experiment, and additional calibration of the non-linear swelling stress parameters.

3.5. Additional Factors

3.5.1. Mesh Dependency, Time Stepping, and Relative Tolerance

Based on the results of this study, it was identified that a number of numerical factors play a significant role in the numerical modelling of two-phase flow. These factors include the output time step selected in COMSOL®, the mesh size, and the relative tolerance.
During the numerical analysis, an output time step of 0.1 day was set in COMSOL® in order to capture the chaotic peak behavior observed by the experimental results. During the model runs, when a higher output time step of 1 day was applied, the model results were not able to capture the full oscillations well. Output time steps of 0.01 day were also performed, and although the results provided even greater resolution of the chaos observed, in order to balance computational time and the resolution needed to capture main features of the experimental data, it was determined that an output time step of 0.1 day was adequate. It should be noted that COMSOL® applies an effective time step smaller than this but based on the user defined time step.
For each model run, a user defined optimum relative tolerance had to be set in order to reach convergence. The selected relative tolerance had to be set low enough to minimize the relative error that could be generated by the numerical model while simultaneously allowing for enough buffer to converge in areas with dynamic changes in poregas pressure.

3.5.2. Extent of Heterogeneity

It should be noted that the authors originally modeled small heterogeneities within the bentonite sample considering a mean porosity distribution of 0.44 with a standard deviation of 0.01. However, when small heterogeneities were applied, there were very little impacts to model results. Based on the proposed models, if heterogeneity is to play a large role in preferential flow, larger heterogeneities within the bentonite sample would be required. Further work investigating the extent of heterogeneity in swelling clays is required.

4. Discussion and Conclusions

An important component in the design and the long-term safety assessment of a DGR is the long-term performance of bentonite seals as barriers against gas migration. As gas generates from the degradation of organic waste and/or the corrosion of metals, at some critical gas pressure, dilation of the bentonite could occur, resulting in the creation of preferential flow pathways and a source of radionuclide exposure to people and the environment.
In an attempt to understand the physical mechanisms associated with dilation and two-phase flow in a swelling geomaterial, this study provides a number of improvements to the HM mathematical model originally proposed by Dagher et al. [11]. A process simulation and enhanced two-phase flow analysis study was conducted. Three enhanced mechanisms for two-phase flow were introduced into the model, specifically, heterogeneity, the Klinkenberg “slip flow” effect, and a linear swelling stress. An analysis of the contribution of each to flow behavior and the potential for the formation of gas fingers was conducted for a swelling geomaterial.
The analysis was performed by comparing results of a number of study scenarios against experimental data from a 1D flow test through a saturated bentonite sample under a constant volume boundary stress condition. The modeled results were compared to key features of the experimental data, including gas inflow and outflow, volume of gas stored in the system, and evolution of total axial and radial stresses. Although the models were not able to reproduce dilation-controlled gas flow, substantial insight into enhanced model features was obtained.
The results show that heterogeneity may play a role in supporting the development of localization and preferential flow; however, the introduction of heterogeneity alone to the linear elastic model is not enough to trigger preferential flow, and other advanced processes are required to generate preferential flow and exasperate dilation.
Introduction of the Klinkenberg “slip flow” effect significantly increased gas permeability and migration through the system. It also promoted the notable chaotic behavior in both gas inflow and outflow observed by the experimental results. However, key model features, including sharp changes in inflow rate, could not be achieved by the Klinkenberg effect. When coupled with heterogeneity, the model accurately simulated the total stresses evolution observed by the experimental results, a stark improvement from the authors’ previous work. However, the Klinkenberg “slip flow” effect may not provide as much of a contribution to gas migration through preferential flow pathways as the authors initially hypothesized. When looking at the volume of gas stored in the system, the experimental results showed expected behavior of preferential flow whereby gas flowing into the sample followed discrete pathways, resulting in nearly immediate gas outflow and little gas storage within the sample. The model results, on the other hand, demonstrated a plug flow behavior, whereby saturation of the bentonite sample was observed. This suggests that, although the Klinkenberg effect may play a role in two-phase flow, it cannot be used to explain the rapid increase in permeability and the formation of preferential flow pathways, as the effect tends to saturate the sample.
Introduction of a swelling strain played a minor role in the shape and the timing of gas inflow, gas outflow, and volume of gas stored within the system. Its presence did improve each of the results slightly. Investigation into the use of a non-linear swelling, however, may provide better agreement with the experimental data.
With respect to the investigation into the formation of gas fingers, as discussed above, a number of physical conditions are required in order to simulate viscous fingering. These include differences in viscosity of both fluids, heterogeneity in the porosity and the permeability of the geomaterial, and a very fine mesh. Our modeling results were able to produce gas fingers. This was a result of differences in viscosities of each fluid (helium and water) considered within their own transport equations (Darcy’s law), the inclusion of heterogeneity in pore size, and the selected mesh size. The results showed that the extent of gas fingering was more strongly related to changes in permeability within the soil specimen than size of the mesh. Additionally, when fingering was present, the size of the gas fingers was short and their formation was short lived, likely because the effects of gravity, diffusion, and suction did in fact hinder formation of long discrete fingers, as was identified by previous studies on gas fingering [23].
The results of this paper support the conclusion that other highly coupled HM mechanisms must be at play. In light of this, future studies will assess the contribution of several types of stress–strain relationships on flow behavior, including damage and poro-elastoplasticity.
The results of this study conclude that, in order to mimic dilation and dilatancy-controlled gas flow, additional considerations to the stress–strain behavior are required. Future studies will look at the effects of different stress–strain constitutive models on flow behavior. These will include a detailed assessment of the coupling between flow and stress state triggered by mechanical damage and plasticity. Future studies will also investigate the application of strain-localization and channeling in an attempt to simulate dilatancy-controlled gas flow and exasperate dilation and creation of preferential flow paths. Finally, multiple model iterations of randomly normally- distributed initial porosities will be assessed in an attempt to define, through a probabilistic assessment, the chaotic nature of dilation pathways.

Author Contributions

Conceptualization, E.E.D. and T.S.N.; methodology, E.E.D. and T.S.N.; software, E.E.D.; validation, E.E.D., T.S.N. and J.Á.I.S.; formal analysis, E.E.D.; investigation, E.E.D. and T.S.N.; resources, J.Á.I.S.; data curation, E.E.D., T.S.N. and J.Á.I.S.; writing—original draft preparation, E.E.D.; writing—review and editing, T.S.N. and J.Á.I.S.; visualization, E.E.D.; supervision, T.S.N. and J.Á.I.S.; project administration, J.Á.I.S.; funding acquisition, J.Á.I.S. All authors have read and agreed to the published version of the manuscript.

Funding

This work was supported by the Canadian Nuclear Safety Commission.

Acknowledgments

Decovalex (http://www.decovalex.org) is an international research project comprising participants from industry, government and academia focusing on development of understanding, models and codes in complex coupled problems in sub-surface geological and engineering applications. DECOVALEX-2019 is the current phase of the project. The authors appreciate and thank the DECOVALEX-2019 funding organizations, Andra, BGR/UFZ, CNSC, US DOE, ENSI, JAEA, IRSN, KAERI, NWMO, RWM, SÚRAO, SSM and Taipower, for their financial and technical support of the work described in this paper. The statements made in the paper are, however, solely those of the authors and do not necessarily reflect those of the funding organizations.

Conflicts of Interest

The authors declare no conflict of interest.

References

  1. Low-Level Radioactive Waste Management Office. Inventory of Radioactive Waste in Canada; Low-Level Radioactive Waste Management Office: Ottawa, ON, Canada, 2012. [Google Scholar]
  2. CNSC. Regulatory Guide G-320, Assessing the Long Term Safety of Radioactive Waste Management; CNSC: Ottawa, ON, Canada, 2006. [Google Scholar]
  3. Norris, S. EC FORGE Project: Updated Consideration of Gas Generation and Migration in the Safety Case. In Gas Generation and Migration in Deep Geological Radioactive Waste Repositories; Special Publications; Shaw, R.P., Ed.; Geological Society: London, UK, 2015; Volume 415, pp. 241–258. [Google Scholar]
  4. Shaw, R.P. The Fate of Repository Gases (FORGE) project. In Gas Generation and Migration in Deep Geological Radioactive Waste Repositories; Special Publications; Shaw, R.P., Ed.; Geological Society: London, UK, 2015; Volume 415, pp. 1–7. [Google Scholar]
  5. Cuss, R.; Harrington, J.; Giot, R.; Auvray, C. Experimental observations of mechanical dilation at the onset of gas flow in Callovo-Oxfordian claystone. In Clays in Natural and Engineered Barriers for Radioactive Waste Confinement; Norris, S., Bruno, J., Cathelineau, M., Delage, P., Fairhurst, C., Gaucher, E.C., Höhn, E.H., Klinichev, A., Lalieux, P., Sellin, P., Eds.; Geological Society: London, UK, 2014; Volume 400, pp. 507–519. [Google Scholar]
  6. Ahusborde, E.; Amaziane, B.; Jurak, M. Three-dimensional numerical simulation by upscaling of gas migration through engineered and geological barriers for a deep repository for radioactive waste. In Gas Generation and Migration in Deep Geological Radioactive Waste Repositories; Special Publications; Shaw, R.P., Ed.; Geological Society: London, UK, 2015; Volume 415, pp. 123–141. [Google Scholar]
  7. Horseman, S.T.; Harrington, J.F.; Sellin, P. Gas migration in clay barriers. Eng. Geol. 1999, 54, 139–149. [Google Scholar] [CrossRef]
  8. Sellin, P.; Leupin, O.X. The use of Clay as an Engineered Barrier in Radioactive-Waste Management—A Review. Clays Clay Miner. 2013, 61, 477–498. [Google Scholar] [CrossRef]
  9. Sellin, P. Experiments and Modelling on the behaviour of EBS. FORGE Rep. D 2014, 3, 38. [Google Scholar]
  10. Marschall, P.; Horseman, S.; Gimmi, T. Characterisation of Gas Transport Properties of the Opalinus Clay, a Potential Host Rock Formation for Radioactive Waste Disposal. Oil Gas Sci. Technol. Rev. IFP 2005, 60, 121–139. [Google Scholar] [CrossRef] [Green Version]
  11. Dagher, E.E.; Nguyen, T.S.; Infante Sedano, J.A. Development of a mathematical model for gas migration (two-phase flow) in natural and engineered barriers for radioactive waste disposal. In Multiple Roles of Clays in Radioactive Waste Confinement; Special Publications; Norris, S., Neeft, E., Van Geet, M., Eds.; Geological Society: London, UK, 2018. [Google Scholar]
  12. Nash, P.J.; Swift, B.T.; Goodfield, M.; Rodwell, W.R. Modelling Gas Migration in Compacted Bentonite: A Report Produced for the GAMBIT Club; POSIVA: Helsinki, Finland, 1998. [Google Scholar]
  13. Hoch, A.R.; Cliffe, K.A.; Swift, B.T.; Rodwell, W.R. Modelling Gas Migration in Compacted Bentonite: GAMBIT Club Phase 3 Final Report; POSIVA: Olkiluoto, Finland, 2004. [Google Scholar]
  14. Fall, M.; Nasir, O.; Nguyen, T. A coupled hydro-mechanical model for simulation of gas migration in host sedimentary rocks for nuclear waste repositories. Eng. Geol. 2014, 176, 24–44. [Google Scholar] [CrossRef] [Green Version]
  15. Harrington, J.F.; Horseman, S.T. Gas transport properties of clays and mudrocks. In Muds and Mudstones: Physical and Fluid Flow Properties; Aplin, A.C., Fleet, A.J., MacQuaker, J.H., Eds.; The Geological Society of London: London, UK, 1999; Volume 158, pp. 107–124. [Google Scholar]
  16. Horseman, S.T.; Harrington, J.F.; Sellin, P. Water and Gas Movement in Mx80 Bentonite Buffer Clay. Symposium on the Scientific Basis for Nuclear Waste Management XXVII (Kalmar). Mater. Res. Soc. 2003, 807, 715–720. [Google Scholar] [CrossRef]
  17. Harrington, J.F.; de la Vaissiére, R.; Noy, D.J.; Cuss, R.J.; Talandier, J. Gas flow in Callovo-Oxfordian claystone (COx): Results from laboratory and field-scale measurements. Mineral. Mag. 2012, 76, 3303–3318. [Google Scholar] [CrossRef] [Green Version]
  18. Graham, C.C.; Harrington, J.F.; Cuss, R.J.; Sellin, P. Gas migration experiments in bentonite: Implications for numerical modelling. Mineral. Mag. 2012, 76, 3279–3292. [Google Scholar] [CrossRef] [Green Version]
  19. Bennett, D.P.; Cuss, R.J.; Vardon, P.J.; Harrington, J.F.; Sedighi, M.; Thomas, H.R. Exploratory data analysis of the Large Scale Gas Injection Test (Lasgit) dataset, focusing on’second-order’ events around macro-scale gas flows. In Gas Generation and Migration in Deep Geological Radioactive Waste Repositories; Special Publications; Shaw, R.P., Ed.; Geological Society: London, UK, 2015; Volume 415, pp. 225–239. [Google Scholar]
  20. Davis, R.O.; Selvadurai, A.P. Plasticity and Geomechanics; Cambridge University Press: Cambridge, UK, 2002. [Google Scholar]
  21. Sahimi, M.; Rasaei, M.R.; Haghighi, M. Gas Injection and Fingering in Porous Media. In Theory and Applications of Transport in Porous Media Volume 20: Gas Transport in Porous Media; Ho, C.K., Webb, S.W., Eds.; Springer: Dorderecht, The Netherlands, 2006; pp. 133–168. [Google Scholar]
  22. Blunt, M.; Christie, M. How to Predict Viscous Fingering in Three Component Flow. Transp. Porous Media 1993, 12, 207–236. [Google Scholar] [CrossRef]
  23. Moortgat, J. Viscous and Gravitational Fingering in Multiphase Compositional and Compressible Flow. Adv. Water Resour. 2016, 89, 53–66. [Google Scholar] [CrossRef] [Green Version]
  24. Nguyen, T.; Le, A. Simultaneous gas and water flow in a damage-susceptible bedded argillaceous rock. Can. Geotech. J. 2015, 52, 18–32. [Google Scholar] [CrossRef]
  25. Dagher, E.E.; Infante Sedano, J.A.; Nguyen, T.S. A Mathematical Model of Gas and Water Flow in a Swelling Geomaterial—Part 1. Verification with Analytical Solution. Minerals 2019, in press. [Google Scholar]
  26. Khalili, N.; Khabbaz, M.H. A unique relatiship for χ for the determination of the shear strength of unsaturated soils. Géotechnique 1998, 48, 681–687. [Google Scholar] [CrossRef]
  27. Pall, R.; Moshenin, N.N. Permeability of Porous Media as a Function of Porosity and Particle Size Distribution. Trans. ASAE 1980, 23, 742–745. [Google Scholar] [CrossRef]
  28. Wibberley, C.A. Hydraulic diffusivity of fault gouge zones and implications for thermal pressurization during seismic slip. Earth Planets Space 2002, 54, 1153–1171. [Google Scholar] [CrossRef] [Green Version]
  29. Noda, H.; Shimamoto, T. Thermal pressurization and slip-weakening distance of a fault; an example of Hanoare Fault, southwest Japan. Bull. Seismol. Soc. Am. 2005, 95, 1224–1233. [Google Scholar] [CrossRef]
  30. Wibberley, C.A.; Shimamoto, T. Earthquake slip weakening and asperities explained by thermal pressurization. Nature 2005, 436, 689–692. [Google Scholar] [CrossRef]
  31. Klinkenberg, L.J. The permeability of Porous Media to Liquids and Gases; Drilling and Productions Practices; American Petroleum Institute: Washington, DC, USA, 1941; pp. 200–213. [Google Scholar]
  32. Nasir, O.; Nguyen, T.S.; Barnichon, J.D.; Millard, A. Simulation of hydromechanical behaviour of benotointe seals for containment of radioactive wastes. Can. Geotech. J. 2017, 54, 1055–1070. [Google Scholar] [CrossRef] [Green Version]
  33. Daniels, K.A.; Harrington, J.F. The response of compact bentonite during a 1D gas flow test, British Geological Survey Open Report, OR/17/067. Br. Geol. Surv. 2017. [Google Scholar]
  34. Ho, C.K.; Webb, S.W. Gas Transport in Porous Media; Springer: Dordrecht, The Netherlands, 2006. [Google Scholar]
  35. Jones, F.O.; Owens, W.W. A laboratory study of low permeaability gas sands. J. Pet. Technol. 1980, 32, 1631–1640. [Google Scholar] [CrossRef]
  36. Zhu, W.C.; Liu, J.; Sheng, J.C.; Elsworth, D. Analysis of coupled gas flow and deformation process with desorption and Klinkenberg effects in coal seams. Int. J. Rock Mech. Min. Sci. 2007, 44, 971–980. [Google Scholar] [CrossRef]
Figure 1. Process simulation study numerical model (a) geometry and (b) meshing.
Minerals 10 00032 g001
Figure 2. Dirichlet boundary conditions (BCs) for (a) lower gas injection pressure and upper water backpressure and (b) lower and upper gas concentrations in porewater.
Minerals 10 00032 g002aMinerals 10 00032 g002b
Figure 3. Heterogeneity introduced through random normal distribution of initial porosity.
Minerals 10 00032 g003
Figure 4. Cross-section of initial porosity distribution.
Minerals 10 00032 g004
Figure 5. Klinkenberg effect; intrinsic permeability of gas as a function poregas pressure, k g .
Minerals 10 00032 g005
Figure 6. 1D flow case results: poregas pressure at t = 0, 55, 68, 75, and 120 days for S0.
Minerals 10 00032 g006aMinerals 10 00032 g006b
Figure 7. 1D flow case results: poregas pressure at t = 0, 55, 68, 75, and 120 days for (a) S1; (b) S2; (c) S3; (d) S4; (e) S5; and (f) S6.
Minerals 10 00032 g007aMinerals 10 00032 g007bMinerals 10 00032 g007c
Figure 8. Results of (a) gas inflow and (b) gas outflow for S0.
Minerals 10 00032 g008aMinerals 10 00032 g008b
Figure 9. Results of (a) gas inflow and (b) gas outflow for S1, S2, and S3.
Minerals 10 00032 g009aMinerals 10 00032 g009b
Figure 10. Results of (a) gas inflow and (b) gas outflow for S4, S5, and S6.
Minerals 10 00032 g010
Figure 11. Volume of gas stored for S1–S6.
Minerals 10 00032 g011
Figure 12. Total stress evolution over time for (a) S0; (b) S1; (c) S2; (d) S3; (e) S4; (f) S5; and (g) S6.
Minerals 10 00032 g012aMinerals 10 00032 g012bMinerals 10 00032 g012cMinerals 10 00032 g012d
Table 1. Material properties of the solid soil matrix and gas and liquid phases.
MaterialParameter NameSymbol (Units)Value
Solid Soil Matrix
(MX-80 Bentonite)
Young’s modulus E b (MPa)307
Poisson’s ratio ν (-)0.4
Initial porosity n (-)0.44
Intrinsic permeability of water k i w (m2)3.4   ×   10 21
Dry density ρ d (kg m−3)1560
Saturated degree of saturation S w sat (-)1
Residual degree of saturation S w r (-)0.05
Bulk modulus of bentonite K b (Pa)5.0 × 10⁸
Volume–surface mean diameter D vs (m)1.50 × 10⁻⁹
Pore radius r (m)1.50 × 10⁻⁸
Tortuosity [11,34] τ   (-) n 1 3 S w 7 3
Gas
(Helium)
Density of helium ρ g (kg m−3) p g M RT (1)
Dynamic viscosity of helium @ 293.15 K μ g (Pa s)2.0 × 10⁻⁵
Bulk modulus of helium K g (Pa) p g (1)
Henry’s coefficient for dissolution of helium in water H 0.0091
Diffusivity of helium in water D f (m2 s−1)6.29 × 10⁻⁹
Diameter of helium gas particle d he (m)1.0 × 10⁻¹⁰
Liquid
(Water)
Density of water ρ w (kg m−3)1 × 10³
Dynamic viscosity @ 293.15 K μ w (Pa s)0.001
Bulk modulus of water K w (Pa)2.2 × 10⁹
(1) As a simplification to the model, the density of gas and bulk modulus are derived from the ideal gas law, as described in Dagher et al. [11].
Table 2. 1D flow case: initial value conditions.
Parameter NameParameterInitial Value Condition
Initial poregas pressure p g initial 1.01 × 10⁵ Pa
Initial degree of saturation S w initial 0.96
Initial suction (from SWCC) s initial 5.95 × 10⁶ Pa
Initial porewater pressure p w initial −5.85 × 10⁶ Pa
Initial displacement field u i 0 m
Initial stress σ 0 xx = σ 0 yy = σ 0 zz 0.45 × 10⁶ Pa
Initial gas concentration in porewater @STP C g ,   H 2 O 0.073 mol m−3
Initial AEVAEV1 × 107 Pa
AEV: air-entry value; SWCC: soil water characteristic curves; STP: standard temperature and pressure.
Table 3. Process simulation and enhanced two-phase flow analysis study scenarios.
Scenario NumberPurposeDescription 1Initial Porosity Distribution (mean ± sd)Coefficient of Klinkenberg Effect, c k e (-)Initial Average Intrinsic Permeability of Water, k w (m2)
S0Single-phase flow caseSingle Phase0.4403.4 × 10−21
S1Base case scenarioBase Case0.4403.4 × 10−21
S2Test if heterogeneity alone could influence preferential flow pathways or the formation of gas fingersIntroduce H0.44 ± 0.0603.4 × 10−21
S3Test if Klinkenberg effect could influence preferential flow pathways and contribute to gas fingeringIntroduce K0.441 × 1083.4 × 10−21
S4Test effect of both heterogeneity and Klinkenberg effect to development of preferential flow pathwaysH, K 0.44 ± 0.061 × 1083.4 × 10−21
S5Test if Klinkenberg effect contributes to reducing number and size of gas fingersH and k w 0.44 ± 0.0605.0 × 10−19
S6Test effect of linear swelling on total stress evolutionH, K, Slinear0.44 ± 0.061 × 1083.4 × 10−21
1 H—heterogeneity, K—Klinkenberg effect, S—swelling.
Table 4. Process S0-parameters.
Parameter NameSymbolValueUnits
Length L 0.12m
Density of bentonite ρ b 1526kg m−3
Young’s modulus E 3.07 × 10⁸Pa
Poisson’s ratio (nu) ν 0.4-
Porosity n 0.44-
Intrinsic permeability k w 3.40 × 10⁻²¹m2
Dynamic viscosity μ g 2.00 × 10⁻⁵Pa s
Degree of saturation S w 0.9-
Air-entry-value AEV 1 × 10⁷Pa
Constant porewater pressure 1 p w 1.0 × 10⁶Pa
Relative gas permeability 1 k rg 0.03-
Chi factor 1 χ 0.9-
1 Calculated based on a degree of saturation of 0.9 and gas pressure of 1.3 × 10⁷ Pa corresponding peak experimental injection pressure by Daniels and Harrington [32].

